
Separating Narrative from Structure: The 2020 USD Bear Market
As consensus expectations shifted toward a secular US dollar decline in 2020, our structural analysis suggested the DXY was forming a larger corrective pattern - setting the conditions for a bullish reversal once complete. Explore More Market InsightsSeeing Beyond the Consensus Bear Narrative
Following the significant fiscal and monetary stimulus at the onset of the pandemic in 2020, there was a growing consensus for the end of US exceptionalism and the beginning of a multi-year decline in the USD.
We viewed the DXY decline differently – as the final leg of a larger corrective structure that would ultimately set the conditions for a bullish reversal.
The Structural Set-Up and Implications
The foundation for our DXY view goes back to our Update on 23 March 2020.
Our long-term framework suggested the DXY could be developing within a larger corrective structure leading into the pandemic. However, as of March 2020, that structure remained incomplete.
The near-term outlook implied two possible resolutions, pivoting around a clear inflection point at 104 (pink resistance line below):
Resistance is resistance until broken and the wave count is binary here. Bullish green count on a strong close above 104 likely sees a wave 3 extension higher. The red bear count sees an impulsive rejection of major swing highs. (Source: Mars Market Update – Preservation of Capital, 23 March 2020)
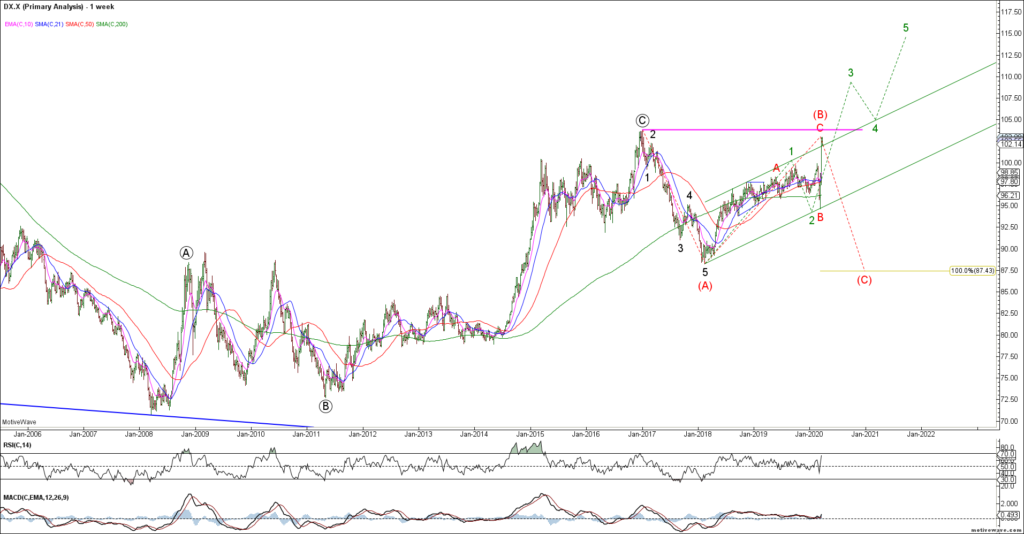
Technical analysis overlay for the DXY showing the 104 inflection zone and potential impulsive (green) and corrective (red) scenarios, 23 March 2020.
The rejection from the 104 resistance zone in March 2020 shifted the balance of probabilities toward a final downside leg (red wave marked (C)) to complete the broader corrective structure.
If this “corrective path” was accurate, we’d need to see this wave (C) price action confirm with an impulsive decline to complete the bigger picture correction around the 87.70 area target.
Interpreting the decline as part of an ending, corrective structure had important implications for our broader Dollar outlook. It allowed us to adopt a near-term bearish stance in 2020 while maintaining the expectation that completion of the final wave would set up the conditions for a bullish reversal.
Structural Confirmation and Narrative Extremes
Following the rejection from the 104 resistance zone, the DXY began the final downside leg, setting up our near-term bearish outlook.
As the DXY declined through 2020, the gap between the prevailing bearish narrative and our market structure analysis widened.
The consensus view treated the decline as validation of a structural bear market and the narrative around the Dollar outlook became increasingly bearish. By the end of 2020, bearish positioning in the DXY reached extremes, with the CFTC non-commercial net short position as a share of open interest at a post-GFC low as of 21 Dec 2020.
Preparing for a Bullish Reversal
At the start of 2021, the corrective “(A)-(B)-(C)” structure appeared to be nearing completion. The final red (C) wave lower had developed impulsively through 2020 and was approaching minimum downside targets.
The DXY has declined impulsively from its March 2020 wave (B) highs. Our base case is that this decline is in the final waves of an a-b-c correction with the DXY turning bullish early in the new year.
While minimum targets have been met for an impulsive 5 wave decline, our measured targets for wave (C) remain lower towards 87.50 where (A)=(C) and a 50% retracement from the January 2017 highs. We are now looking for evidence of a bullish reversal in the DXY to establish longs as we approach this inflection point. (Source: Mars Market Update – Year Ahead: Super-cycle High, 4 January 2021)
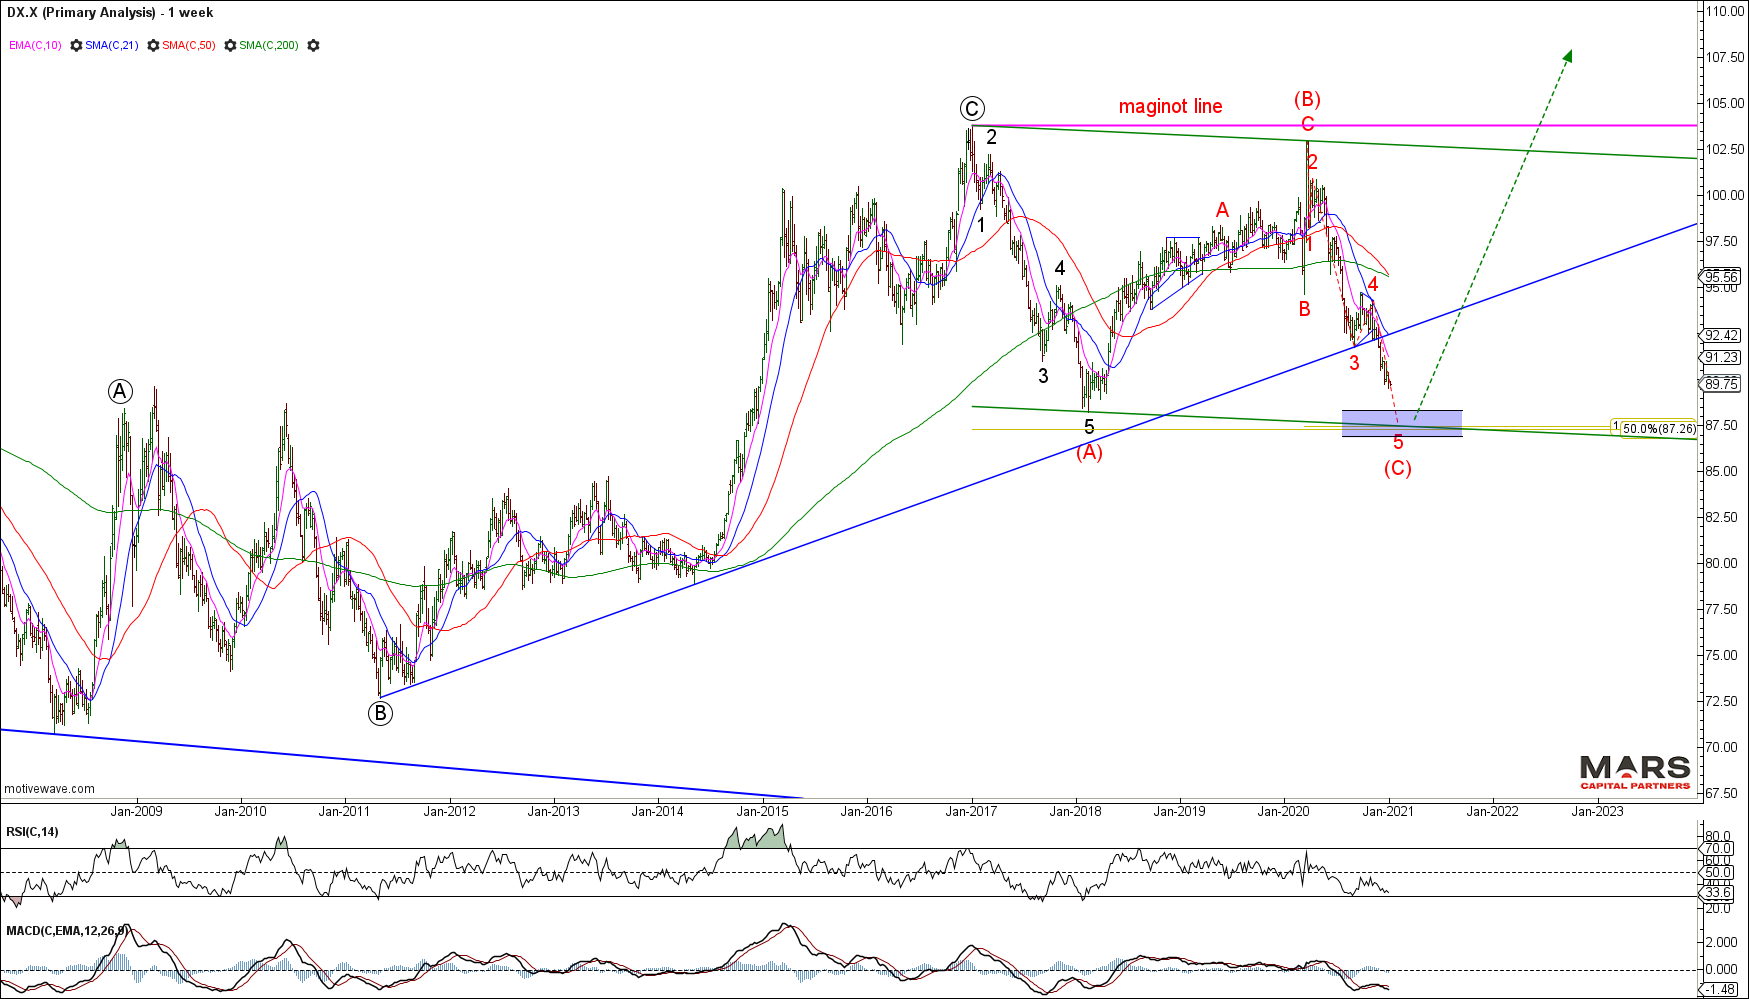
Technical analysis overlay showing the DXY completing the broader corrective structure and approaching the bullish inflection zone, 4 January 2021
Why This Analysis Mattered
By interpreting the 2020 decline as part of a larger corrective structure rather than the beginning of a secular bear market, our framework provided the structural signals needed to prepare for a bullish reversal as the decline matured.
The DXY subsequently established its cyclical low at 89.209 before rallying through to a high of 114.78 on the 28 September 2022.
Importantly, the framework helped prevent us from becoming anchored to the prevailing secular bear-market narrative as bearish sentiment reached extremes.
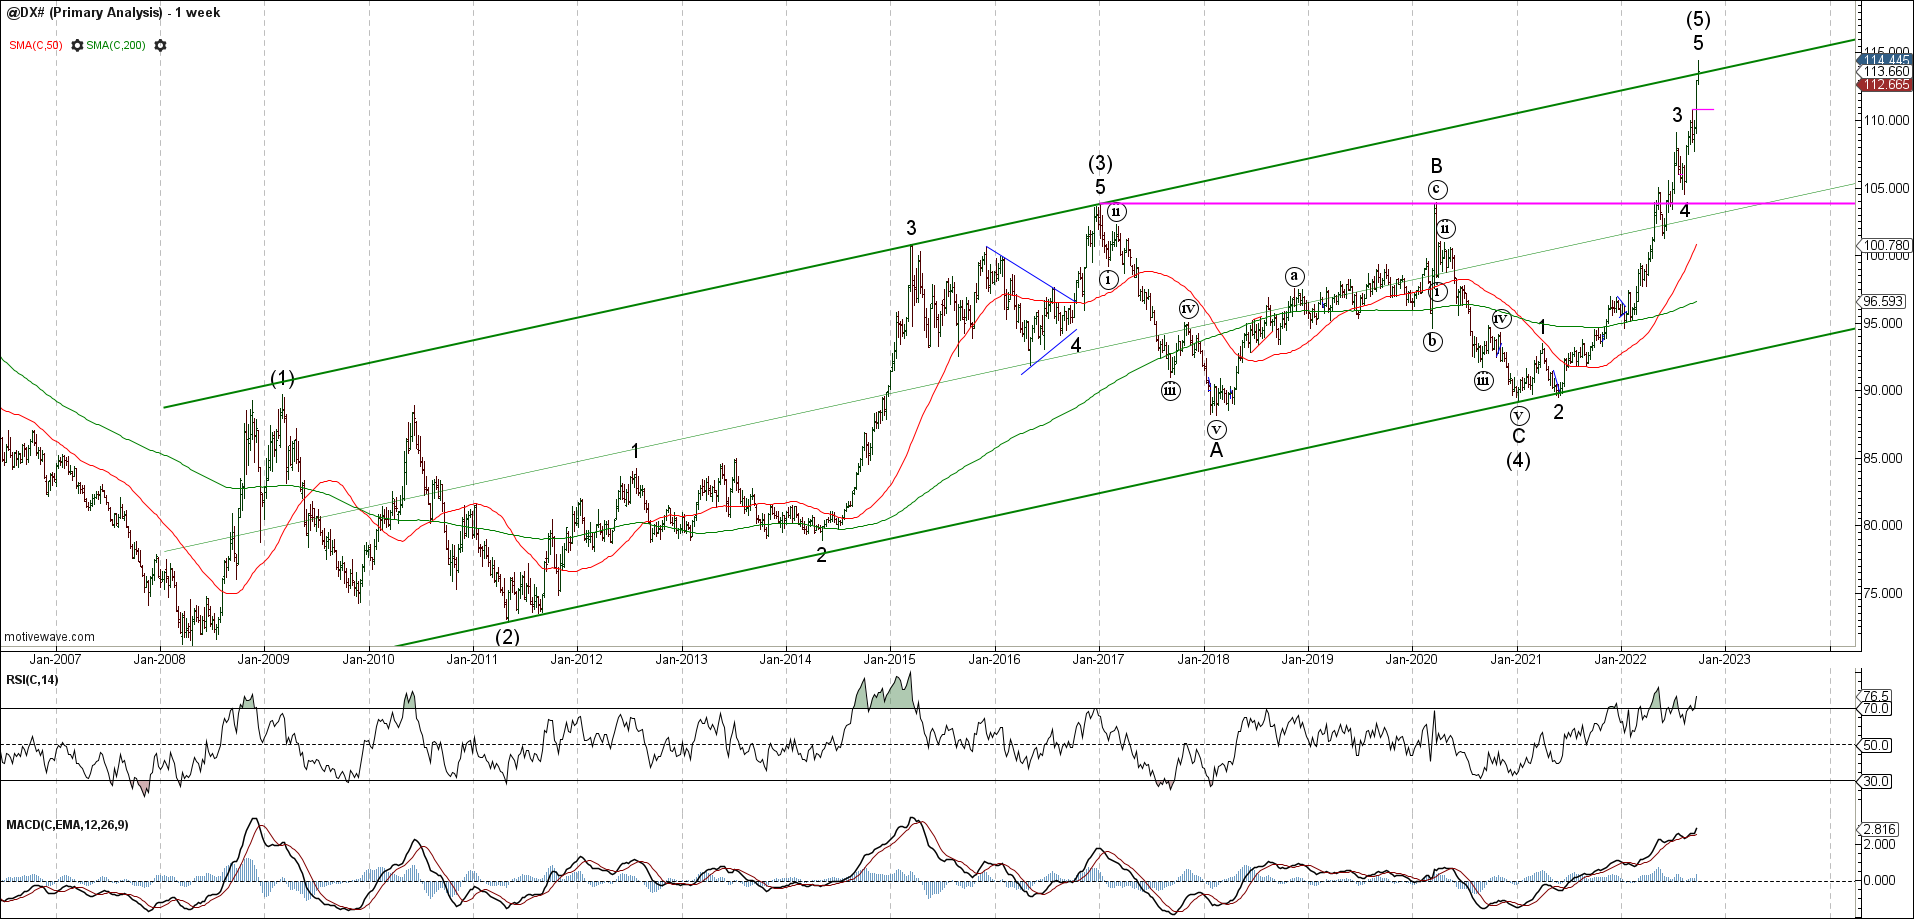
Technical analysis overlay showing the DXY approaching upside targets during the rally into September 2022, 26 September 2022.
Related Analysis
Original Research Notes
- Mars Market Update – Preservation of Capital, 23 March 2020
- Mars Market Update – The Year Ahead: Super-cycle High, 4 January 2021
- Mars Market Update – Make or Break, 26 September 2022
Explore more technical analysis insights or learn more about how we analyse global macro markets.
Continue Following Our Work
Continue following our analysis across our weekly research, market commentary, and technical analysis updates.
X
Follow us on X for real-time commentary and charts.
Subscribe to the Mars Capital Partners email list for a free weekly summary of our analysis.