
As we head into 2021 with the tailwinds of historic fiscal and monetary stimulus coupled with a speculative “Tulip” mania (see Bitcoin, SPAC, Robinhood, etc) it is important to take note of WHERE we are in the cycle. We are nearing the very end of a super-cycle degree equity market rally.
What if we see global stagflation? Then we should expect to see a continued strong rally in commodities that will likely lead to a sharp reversal in rates, pressuring the CB’s to reverse the QE course, cost push pressures negatively impacting corporate earnings at a time when balance sheets are impaired with historically high debt levels. The result – rallying commodities, strong commodity currencies, sharply rising rates and bearish equities.
In this update, we will focus on the big picture macro charts defining the key trends.

Equities completing a super-cycle top
Our long term equity charts are warning of a super-cycle top at multiple degrees of trend. Our fundamentals analysis warns that this post-2009 rally is based on “hope”. Our sentiment analysis warns that in 2020, the retail investor finally joined the party – often the bag holders at the END of a speculative mania.
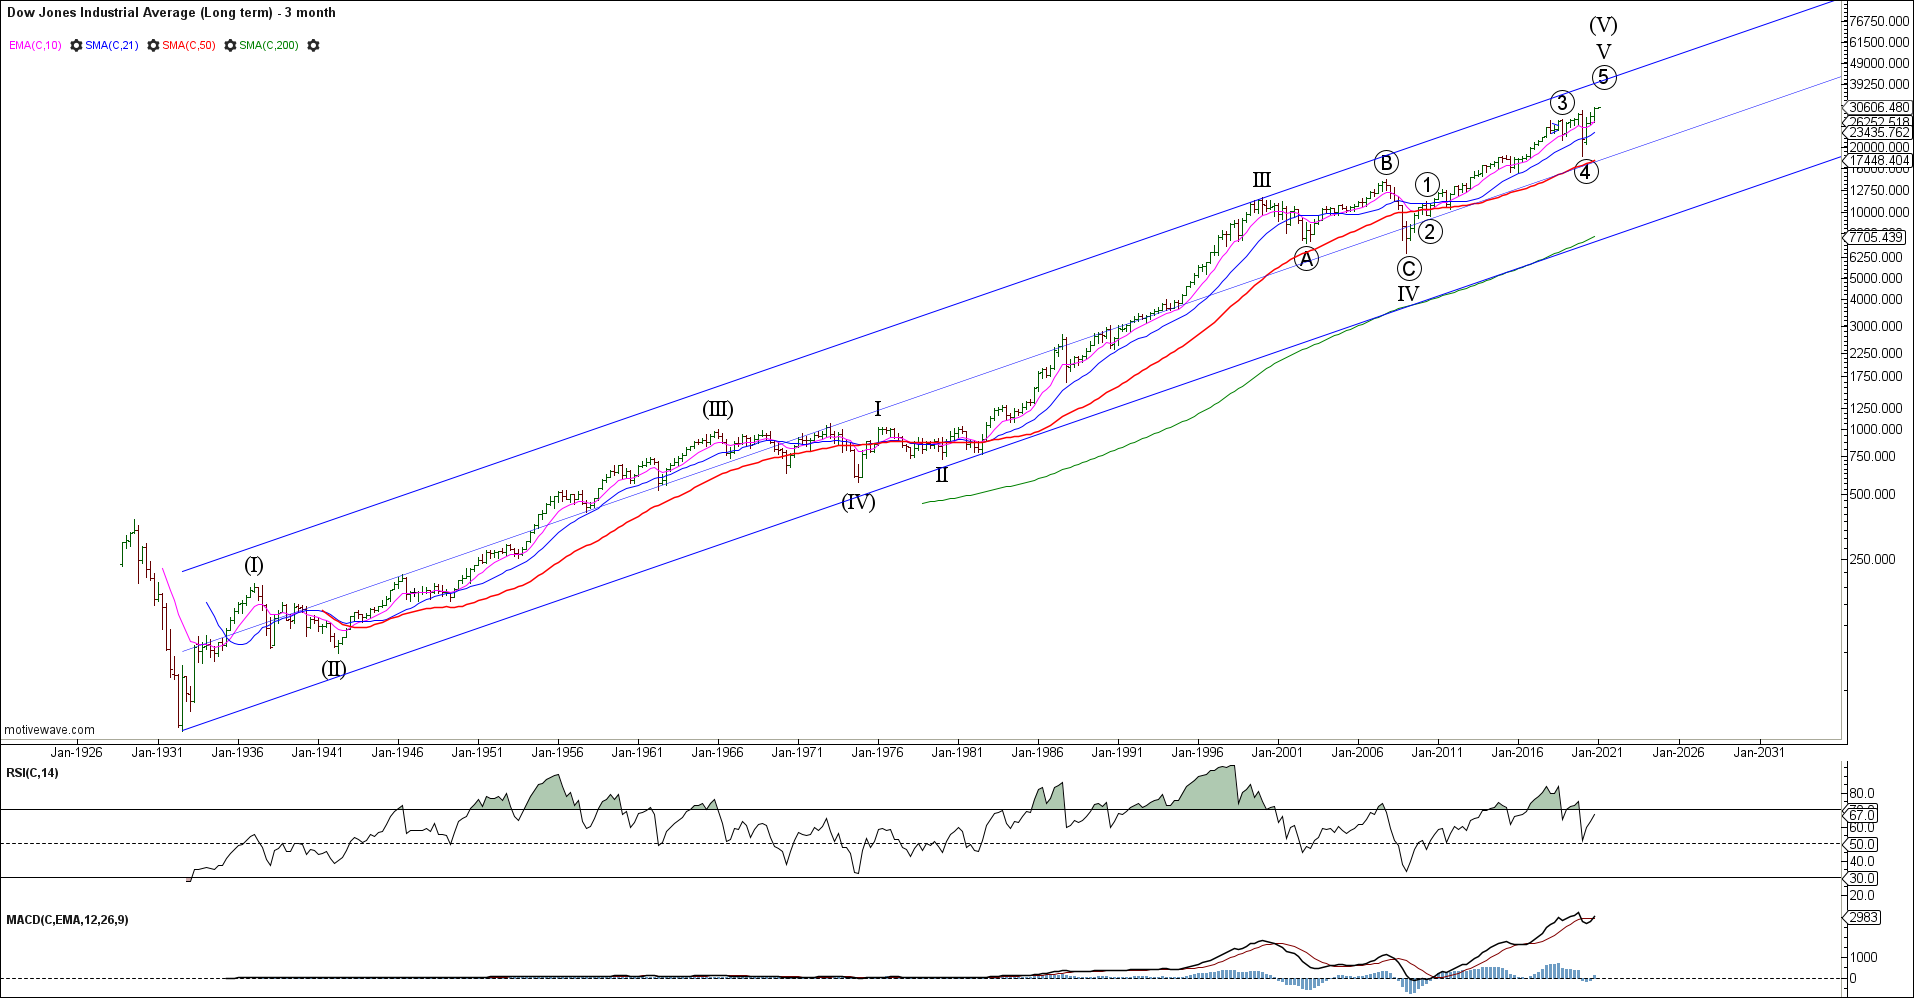
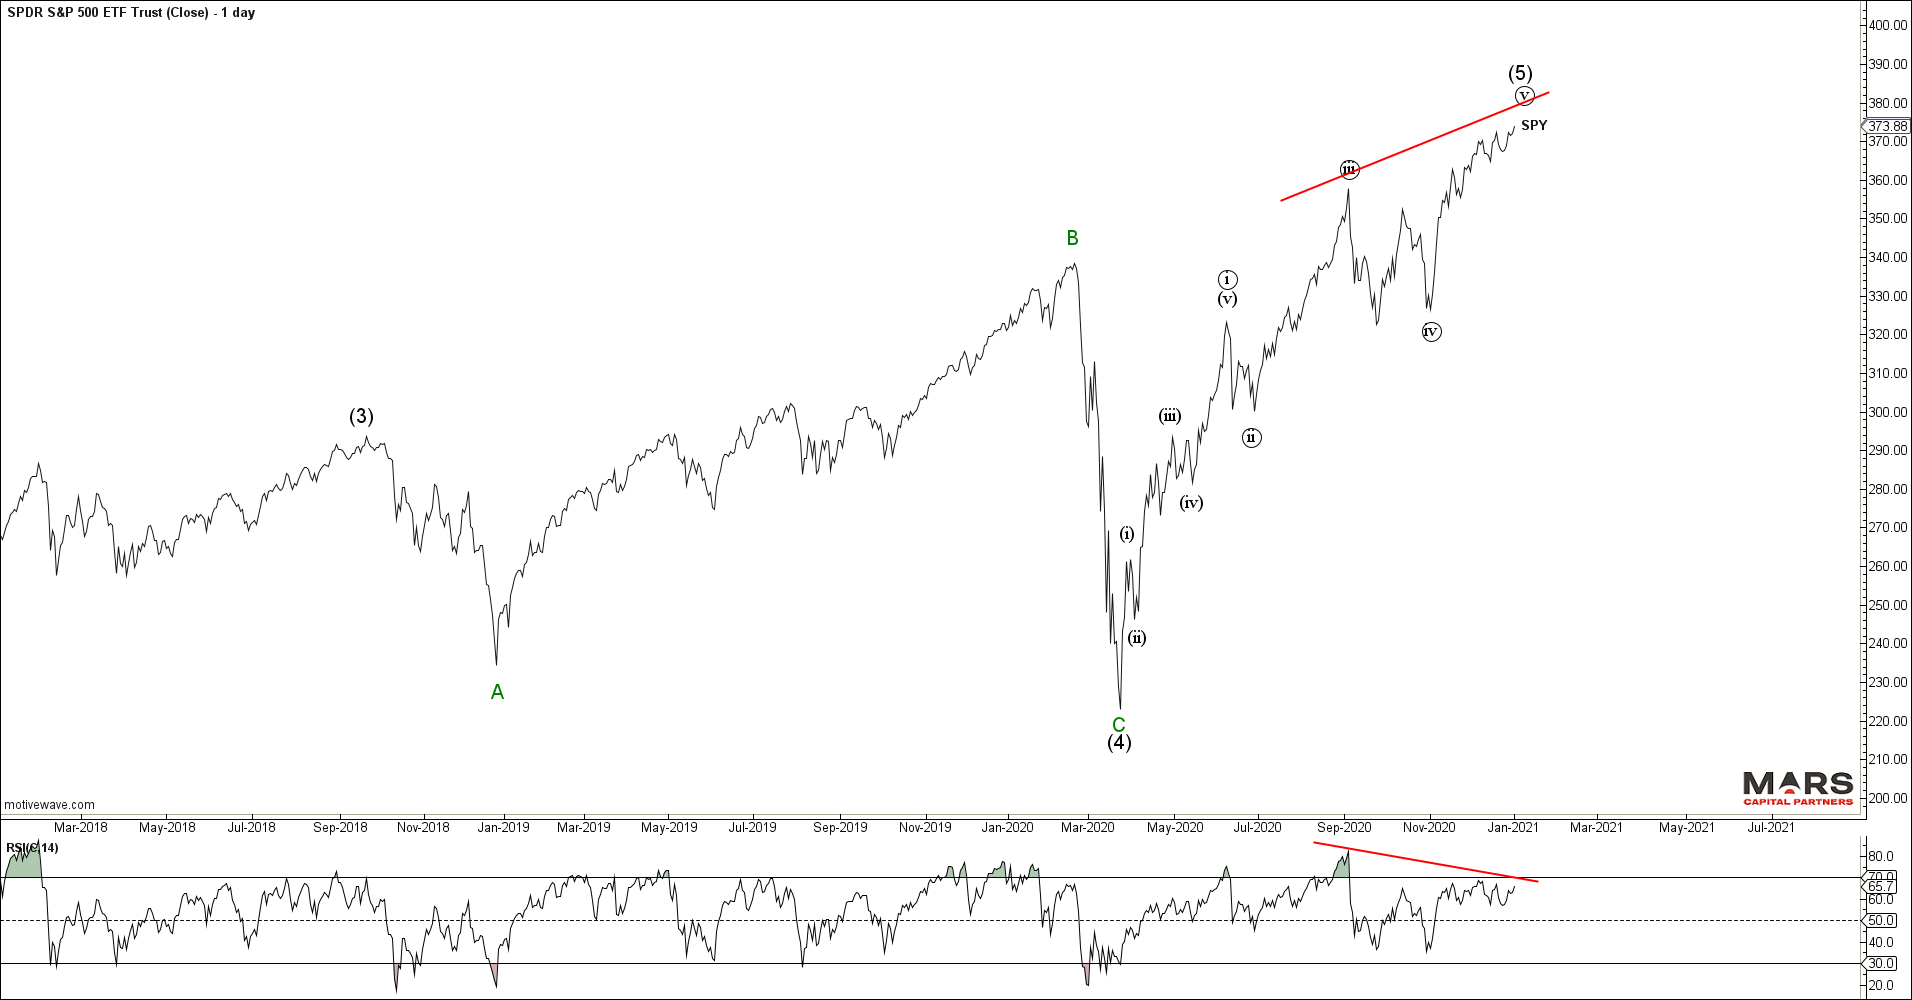
The SPX shows a clearly impulsive rally from the 2009 lows – last year’s (B) wave top and (C) wave low in March provided the platform for a wave 5 of V to new ATH’s to end the multi-year super-cycle rally. We are looking for evidence of an end to this post-2009 rally which is expected to be “fully retraced” in a sustained bear market. Near term, the question is whether we blow-off higher in an accelerated speculative mania to complete wave 5 or just fade out into the highs as the bubble bursts.
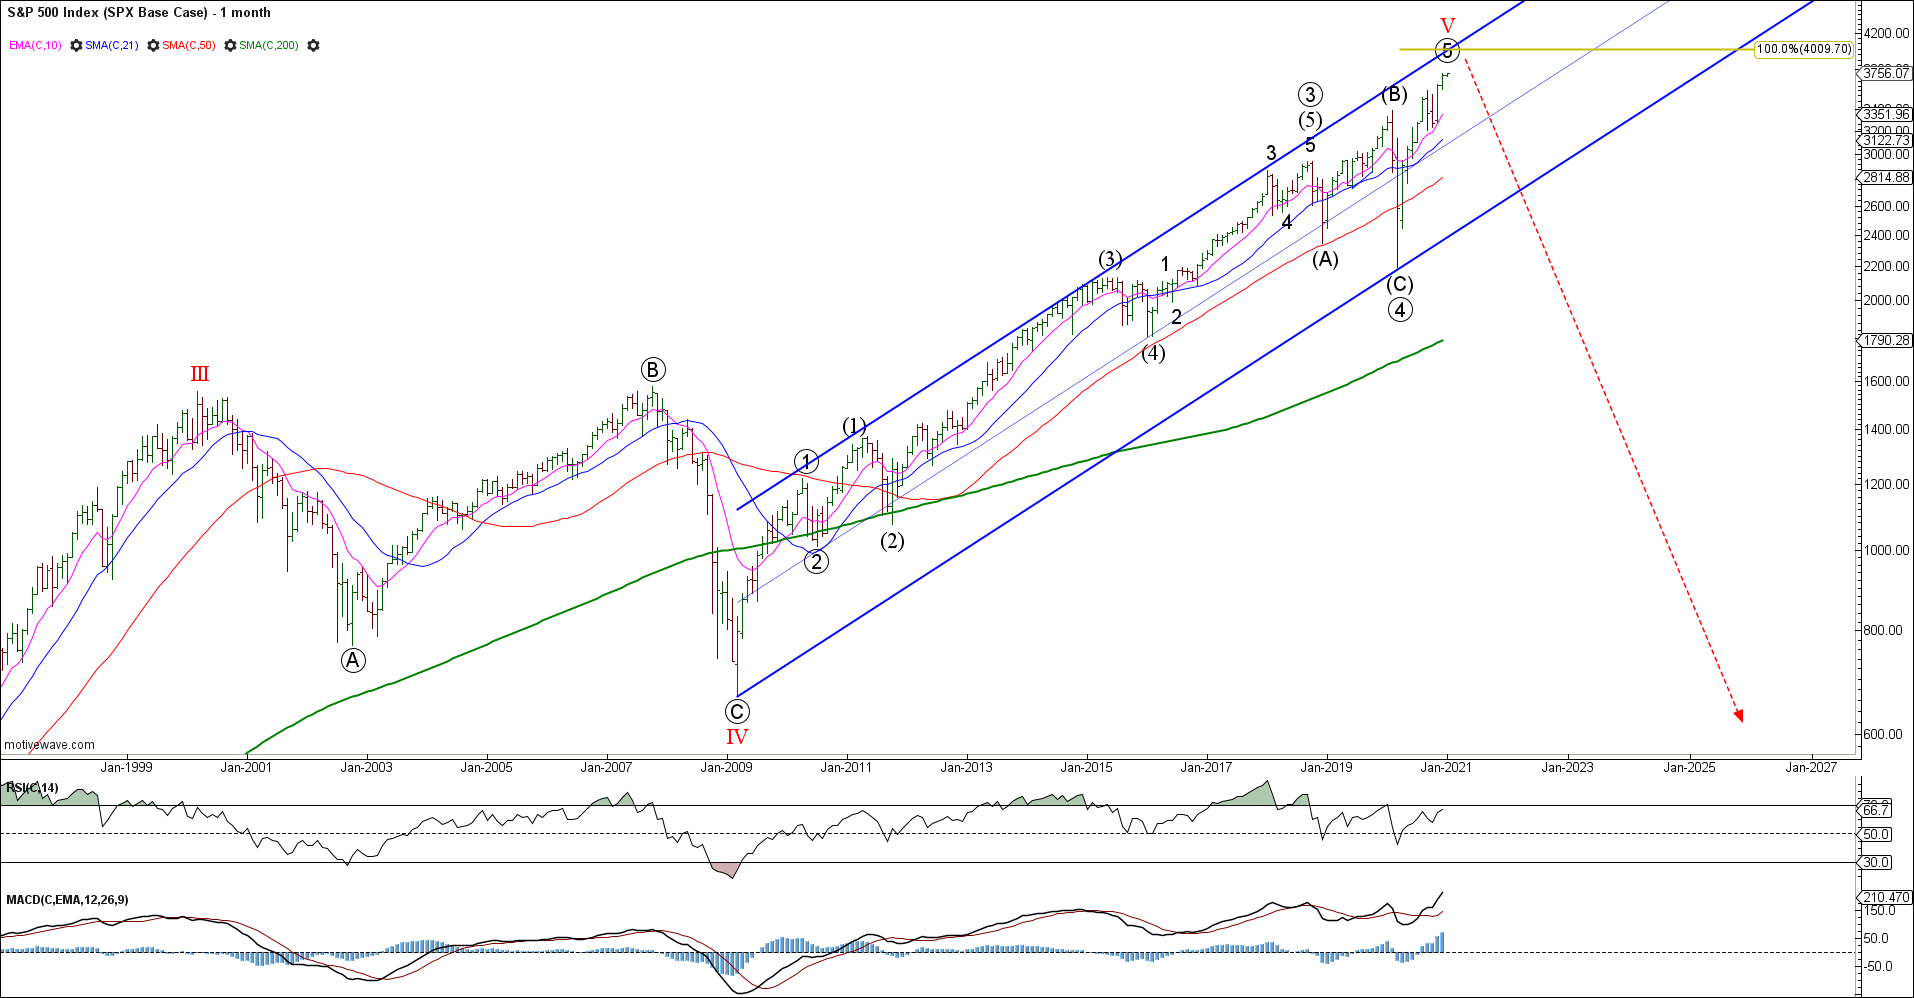
While our base case has us looking for an end to the big picture rally, there is NO evidence that the speculative rally has ended. While we continue to see higher highs and higher lows, the trend is your friend until it bends – note the 5th wave momentum divergence. Given we have achieved the minimum conditions for a final 5th wave rally (new ATH’s) we are now alert to the potential for a bearish reversal and market top. Our job is to try to identify the end when it occurs and NOT pre-empt a turn without price confirmation. We need to see a completed 5th wave rally followed by an impulsive change in trend – this is our goal for 2021.
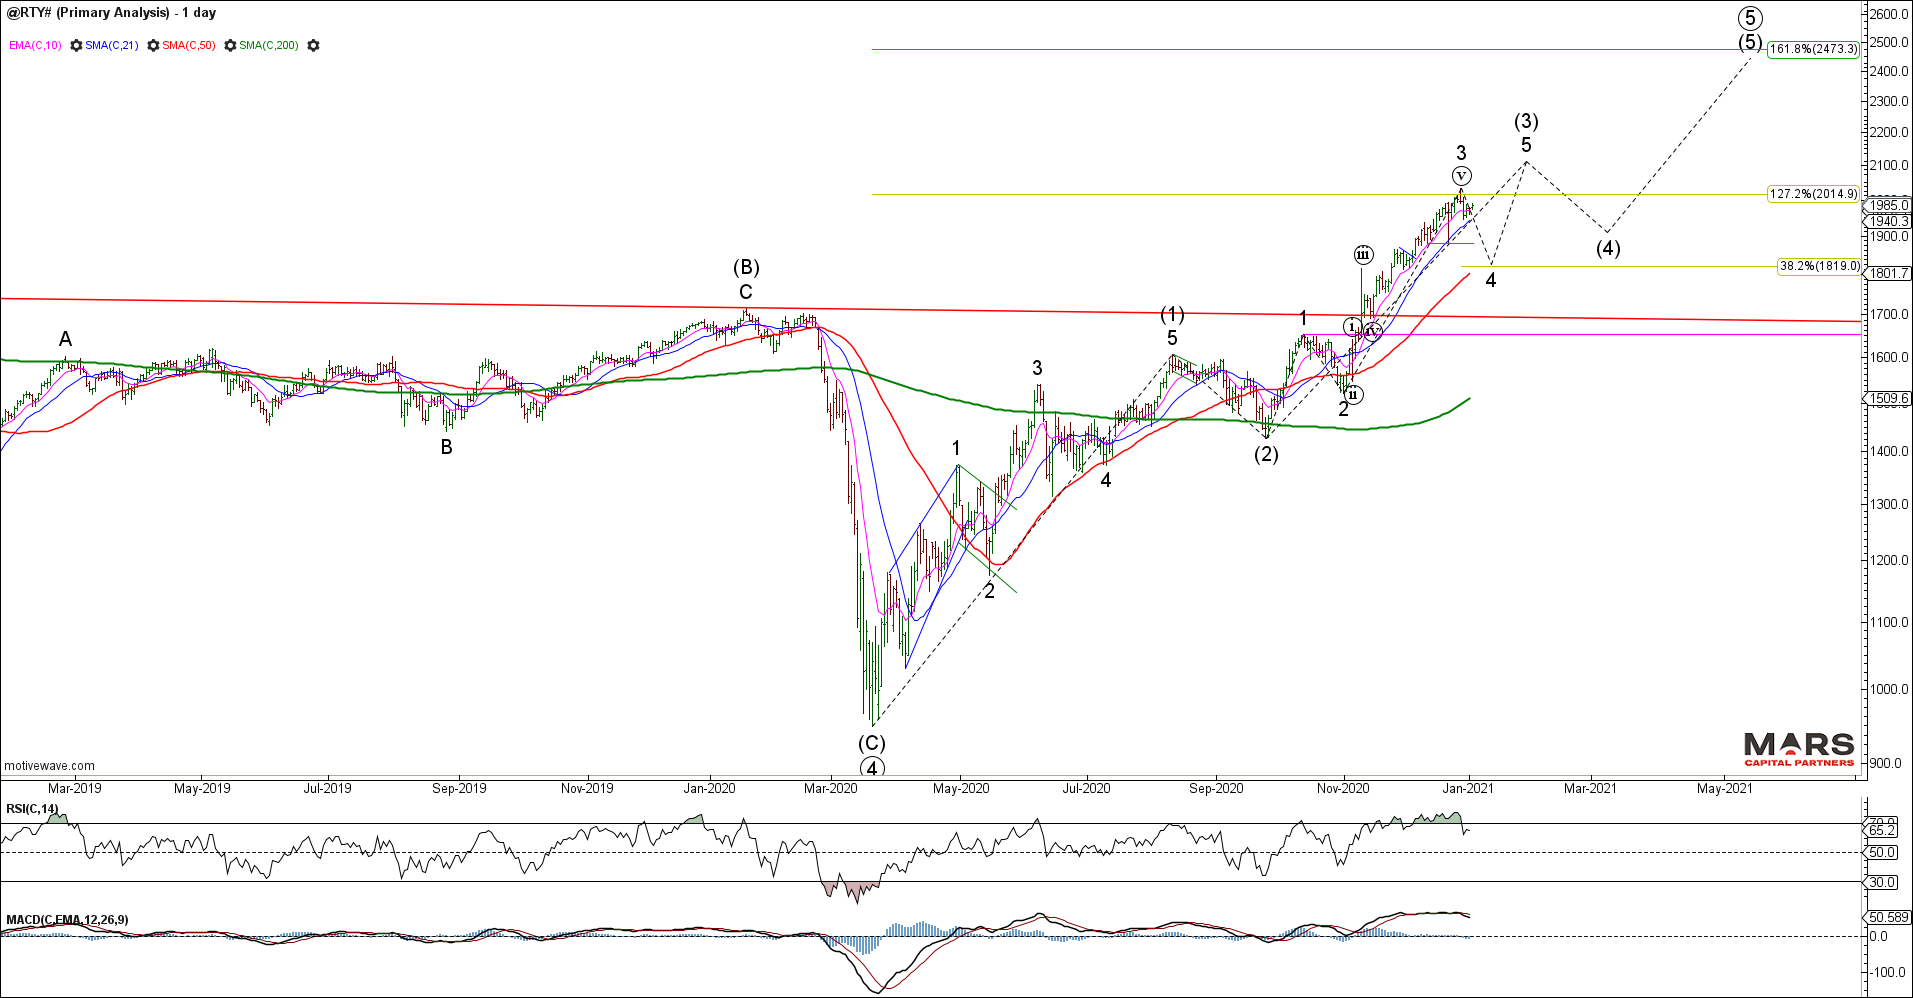
The Russell 2000 / RTY probably provides the clearest wave structure since breaking out to new ATH’s in what appears to be a 3rd wave. This bullish chart argues for a continued bigger picture equities rally through H1 2021. This impulsive wave structure remains bullish while above our key 1650 overlap and would look best with a continued big picture rally. Trade back below 1650 invalidates this bullish wave count. While there are enough waves in place to complete wave 3 near term, we do NOT have confirmation of a near term top as the sequence of higher highs and higher lows continues within this breakout.
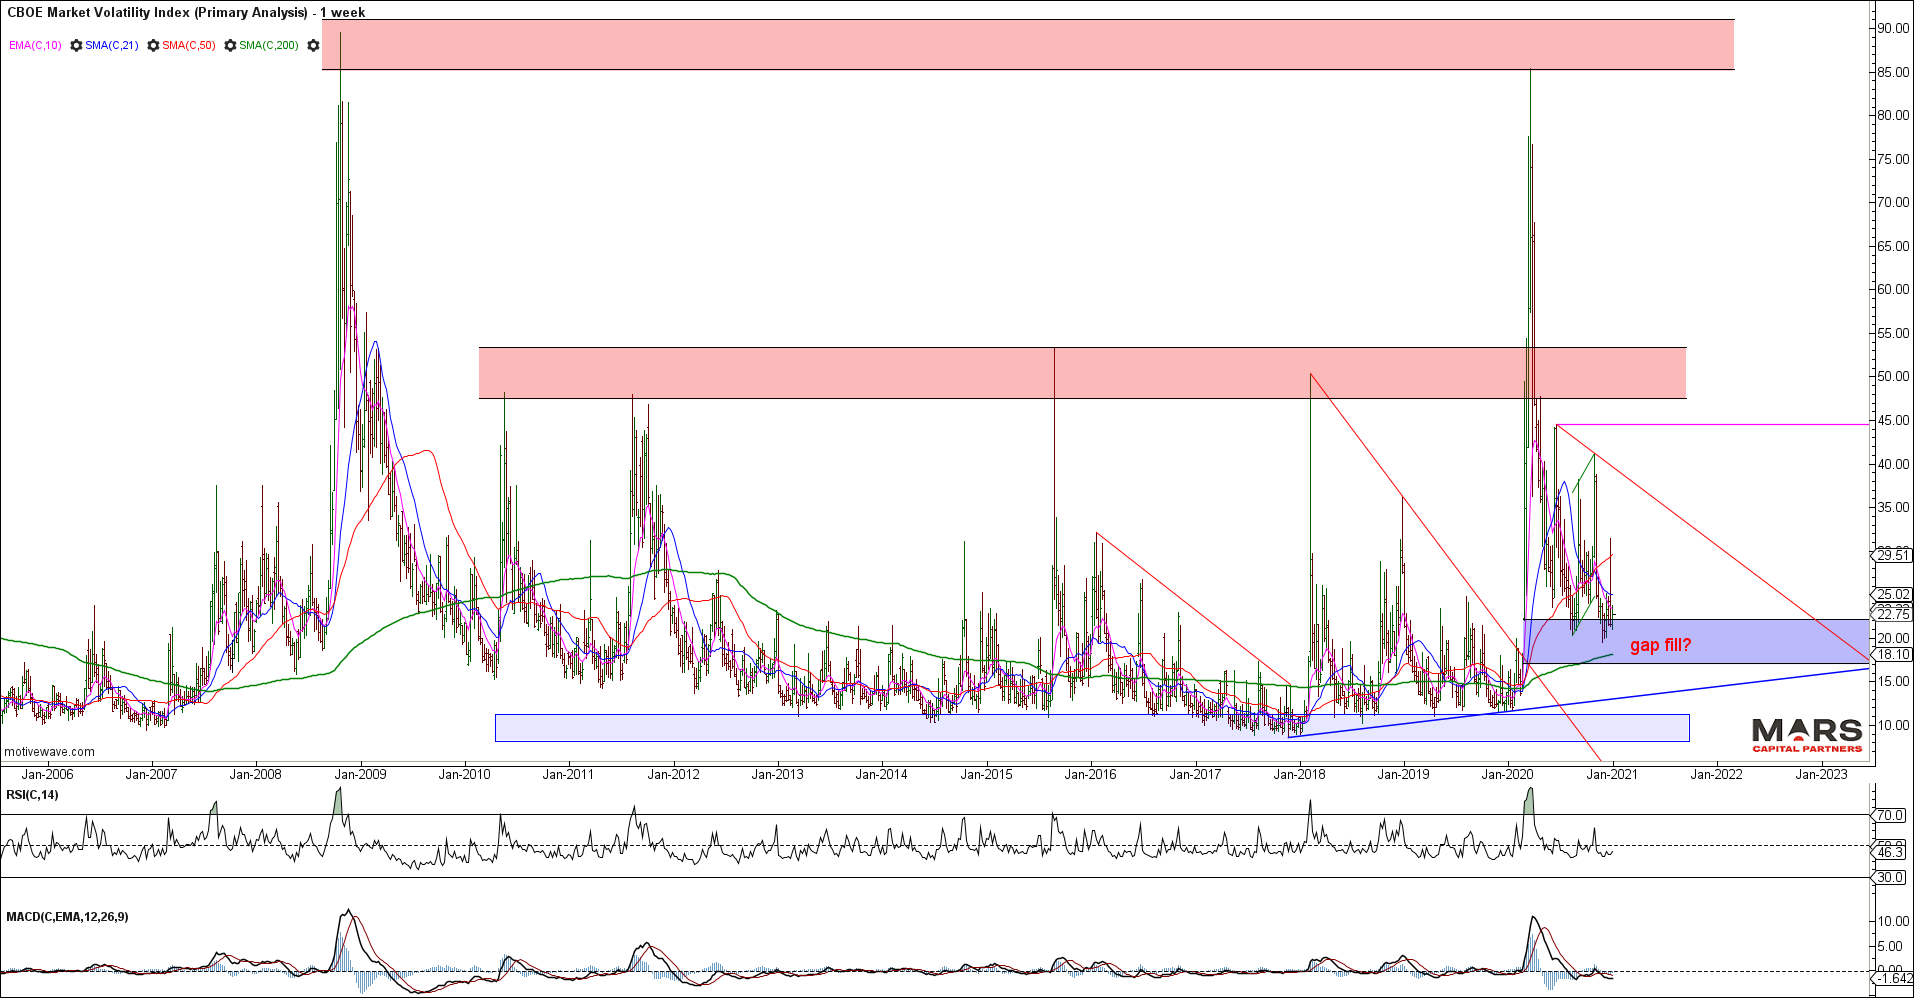
While equities have pushed to new ATH’s, the VIX remains elevated supported mostly by speculative call buying. While the VIX continues to compress in another declining wedge, we know that volatility compression leads to volatility expansion. We are looking for a bullish turn in VIX that will coincide with a bearish trend exhaustion in equities.
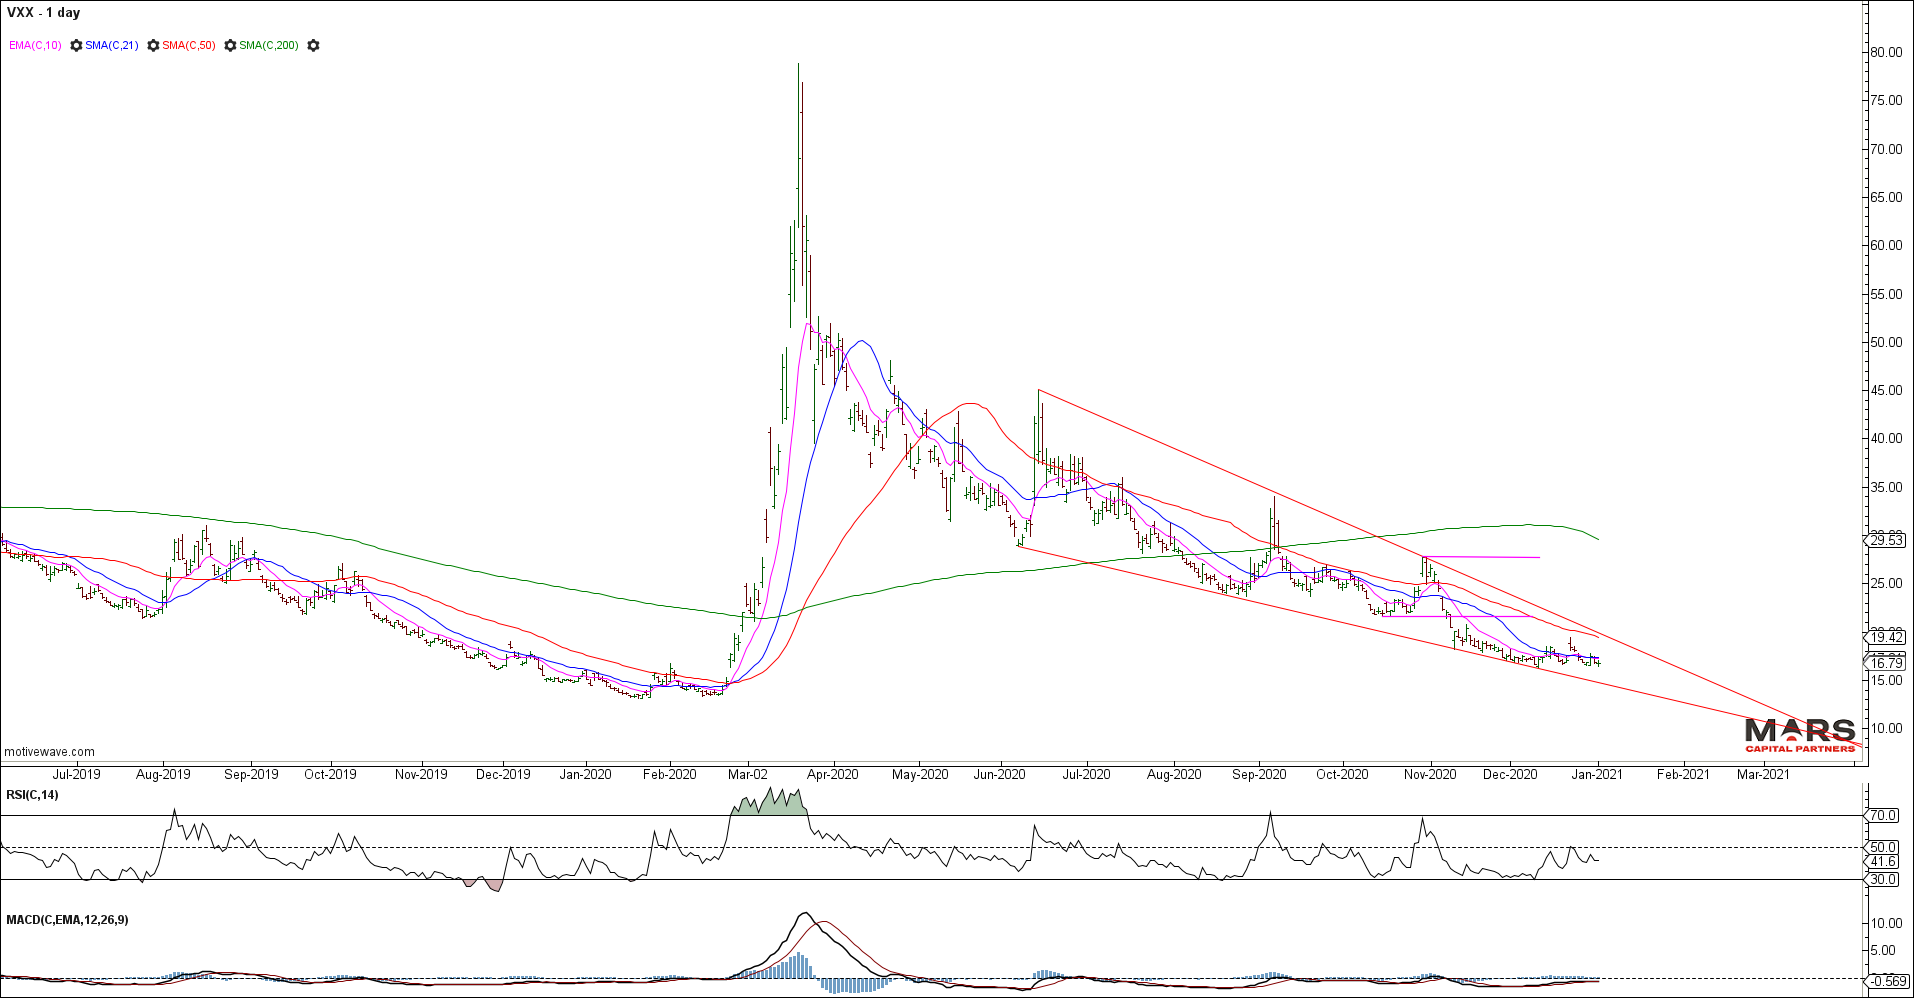
VXX wedging into the lows… note the bullish momentum divergence at recent lows.
Bond markets and Rates
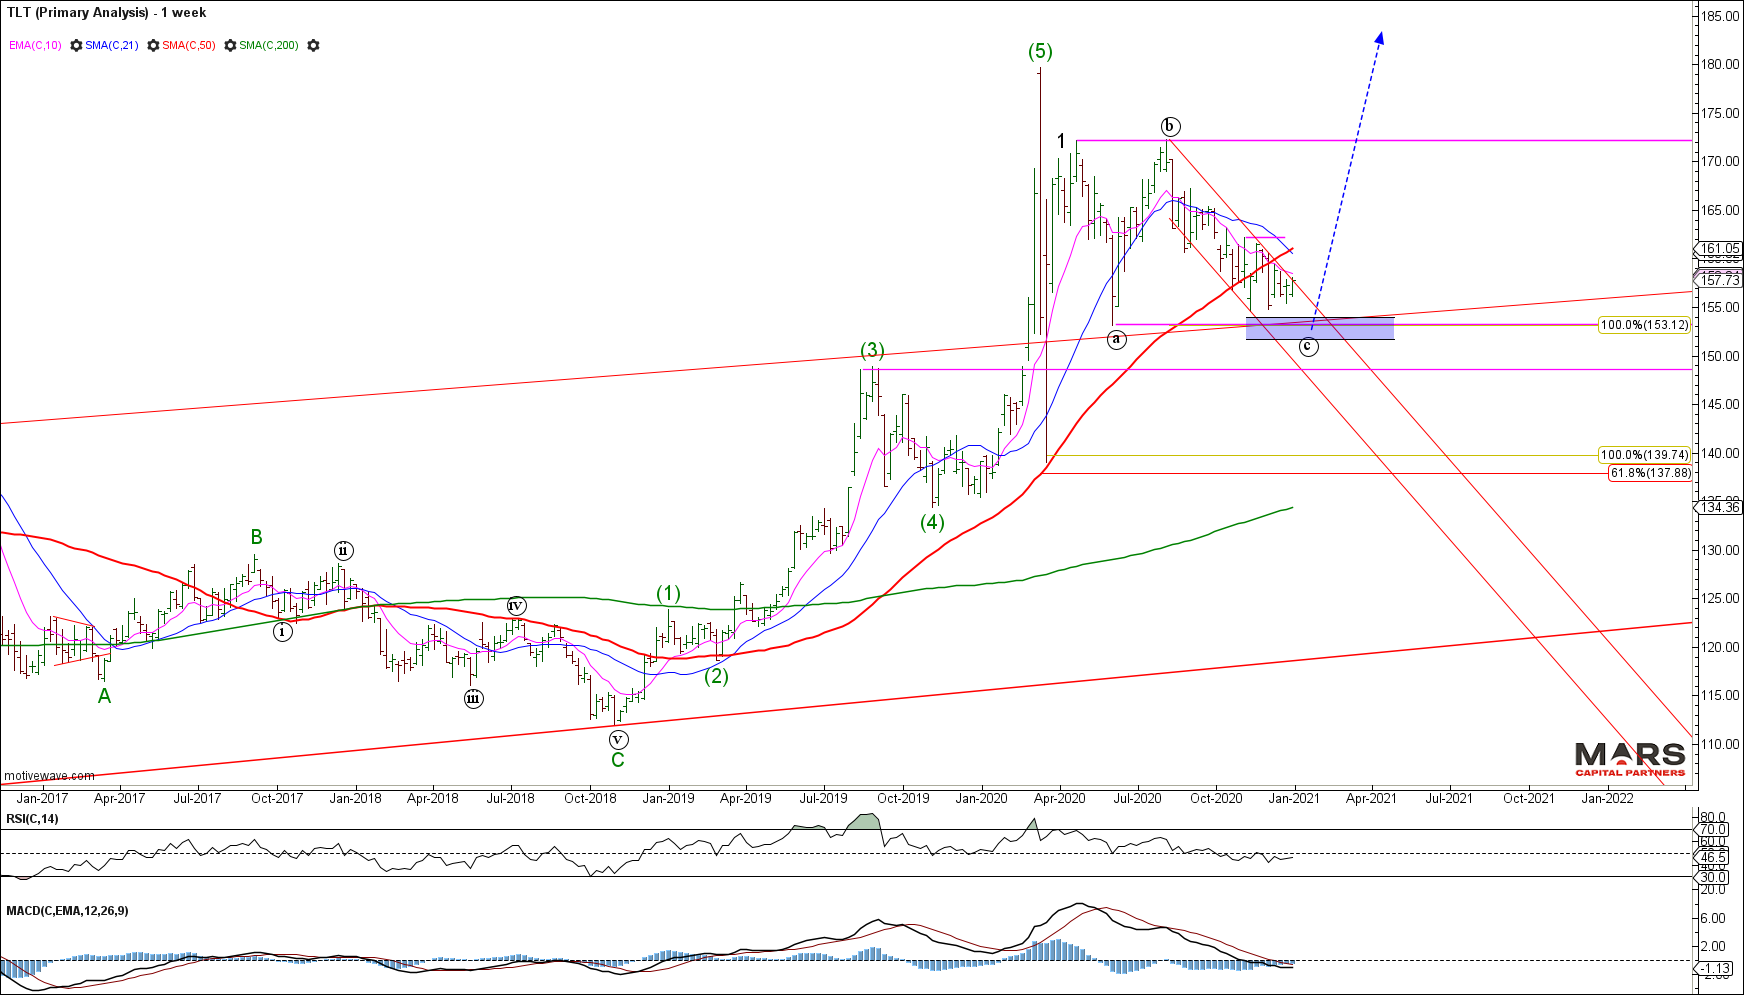
Last year, the TLT spiked to new 5th wave highs as expected but the ensuing decline appears corrective. This structure keeps the door open to new ATH’s in bonds and new cycle lows for rates. Near term the TLT remains bearish as we look for a hard test of the 153 area support for a potentially completed correction. While we do have a completed 5 wave rally into the March highs, we cannot confirm a long term top in TLT. Near term inflection point for bonds.
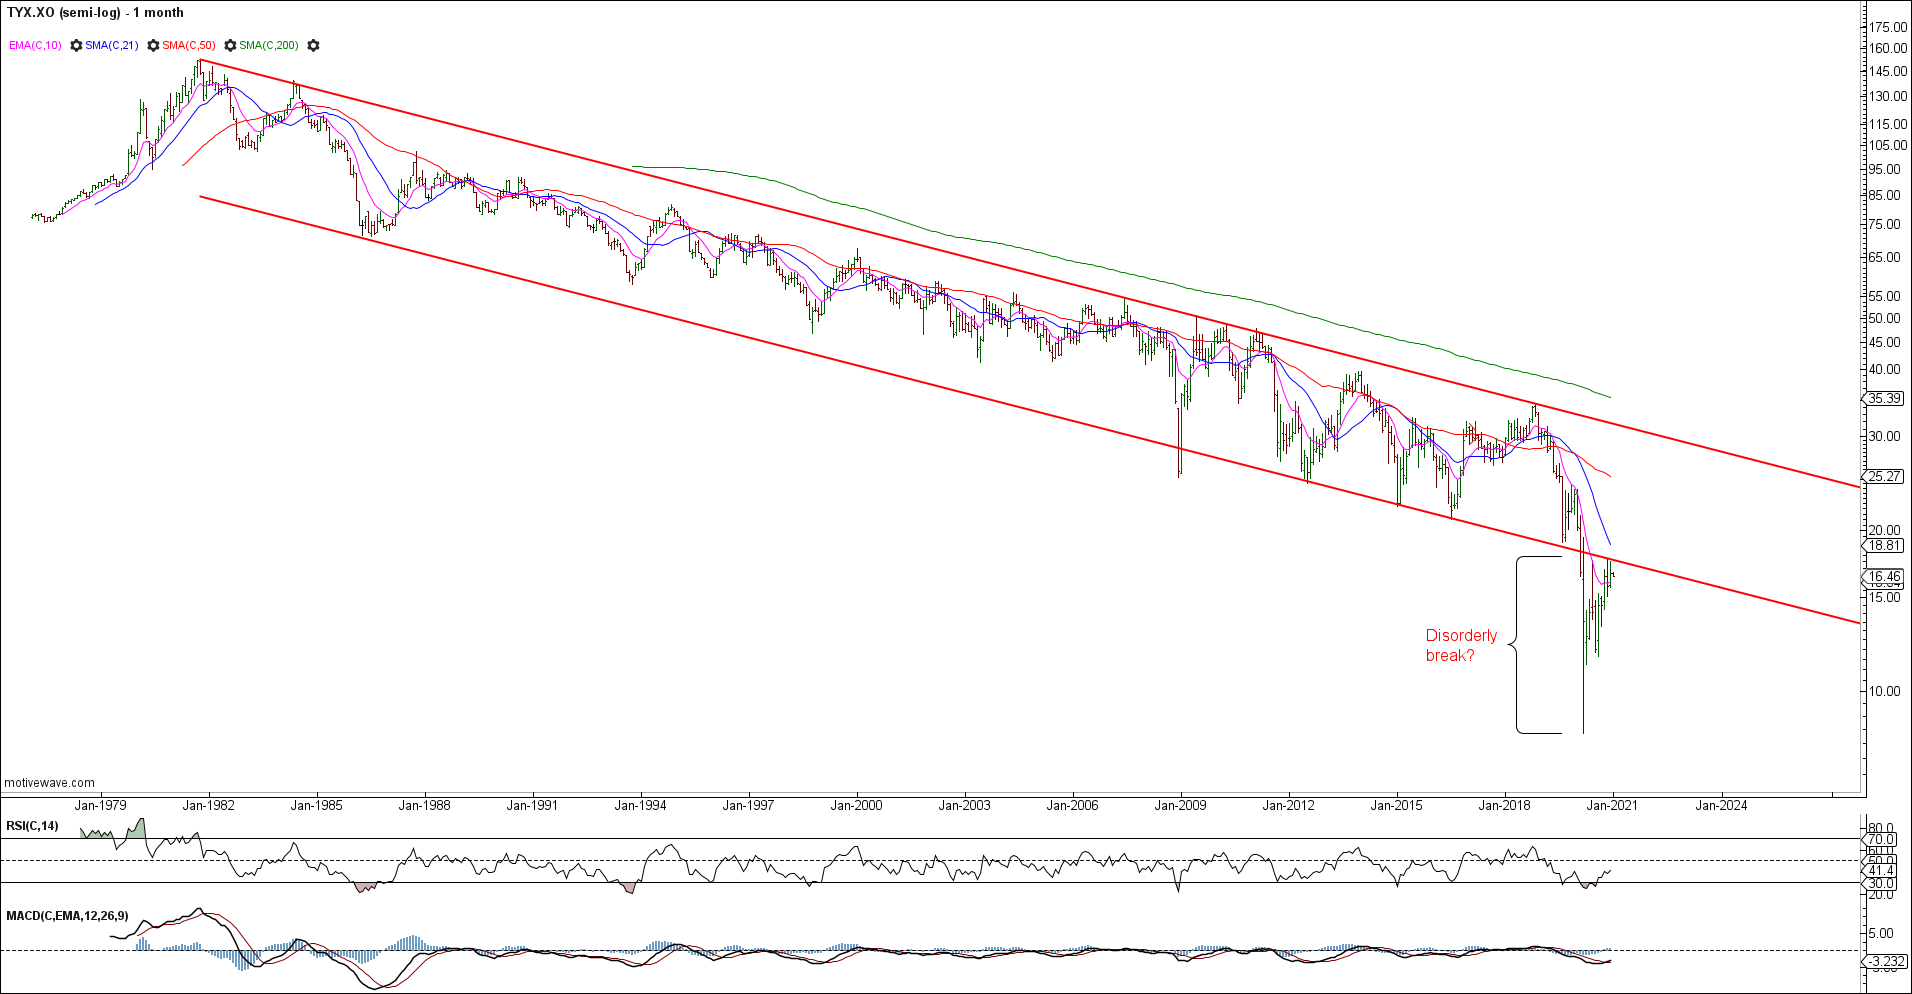
Long term rates made new cycle lows as expected in March 2020 after a disorderly break of its long term declining trend channel. Rates have recovered “correctively” to retest the long term channel break. The structure of the rally in rates appears corrective and therefore it is likely we see new lows in rates before a sustainable low can be established.
FX markets and the US$
The DXY has declined impulsively from its March 2020 wave (B) highs. Our base case is that this decline is in the final waves of an a-b-c correction with the DXY turning bullish early in the new year. While minimum targets have been met for an impulsive 5 wave decline, our measured targets for wave (C) remain lower towards 87.50 where (A)=(C) and a 50% retracement from the January 2017 highs. We are now looking for evidence of a bullish reversal in the DXY to establish longs as we approach this inflection point.
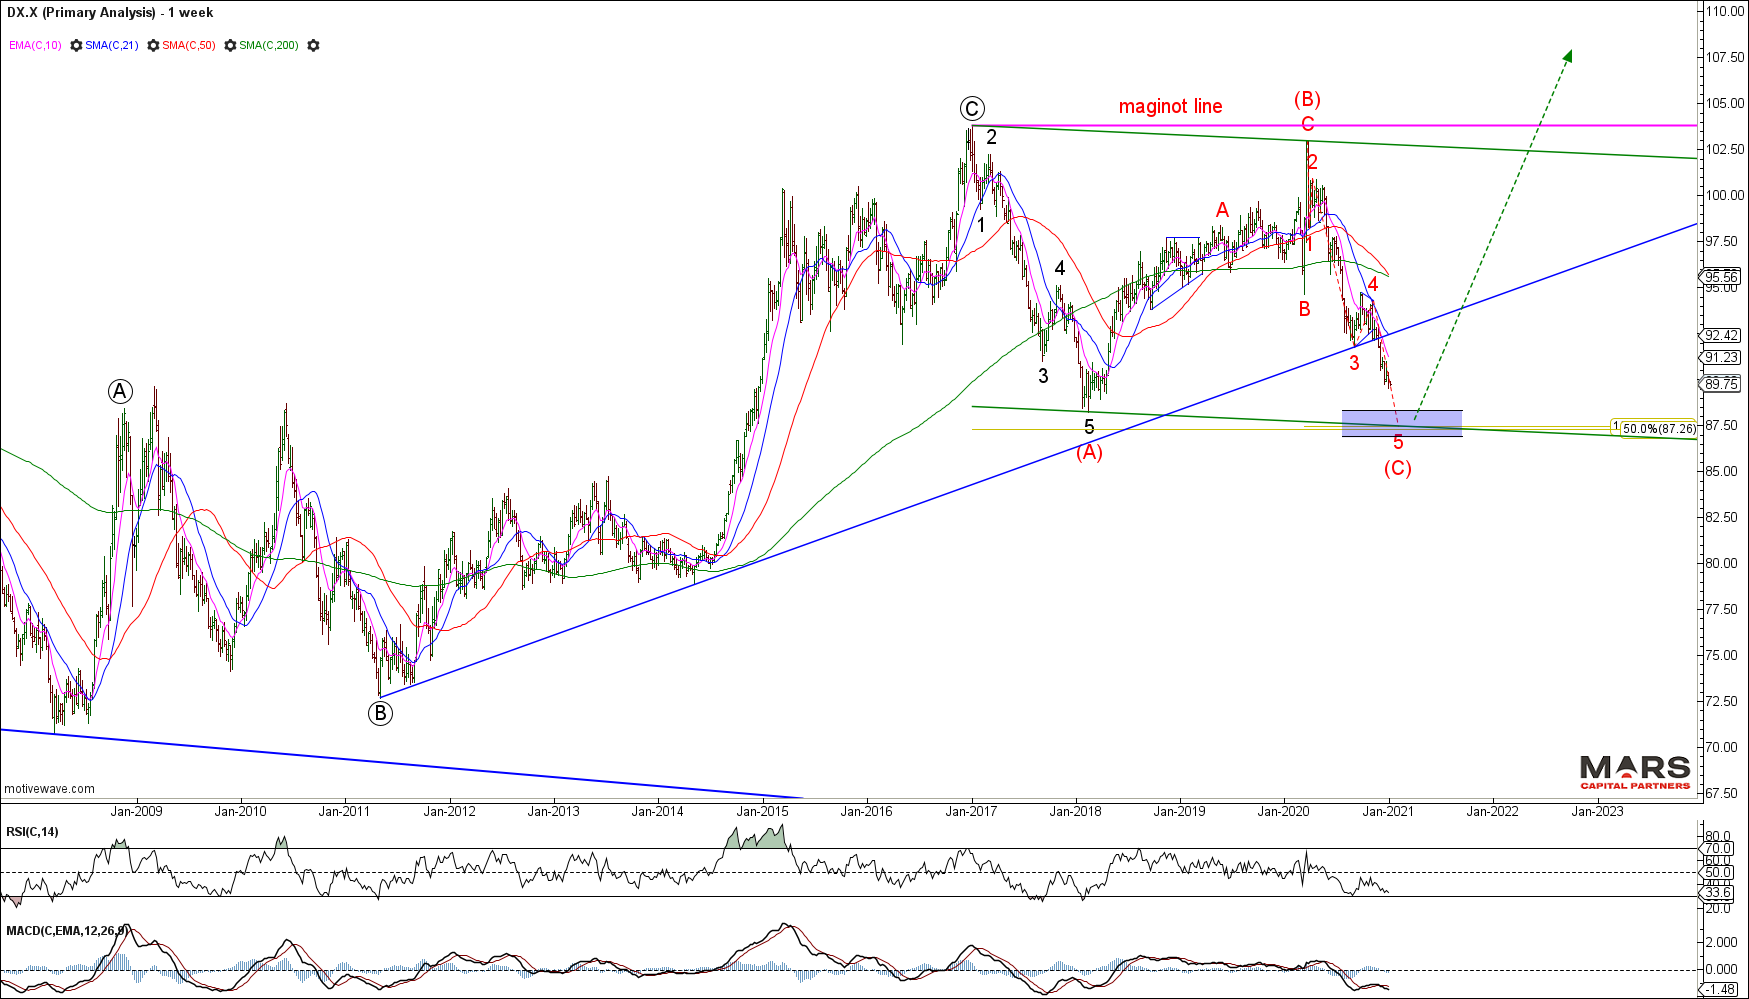
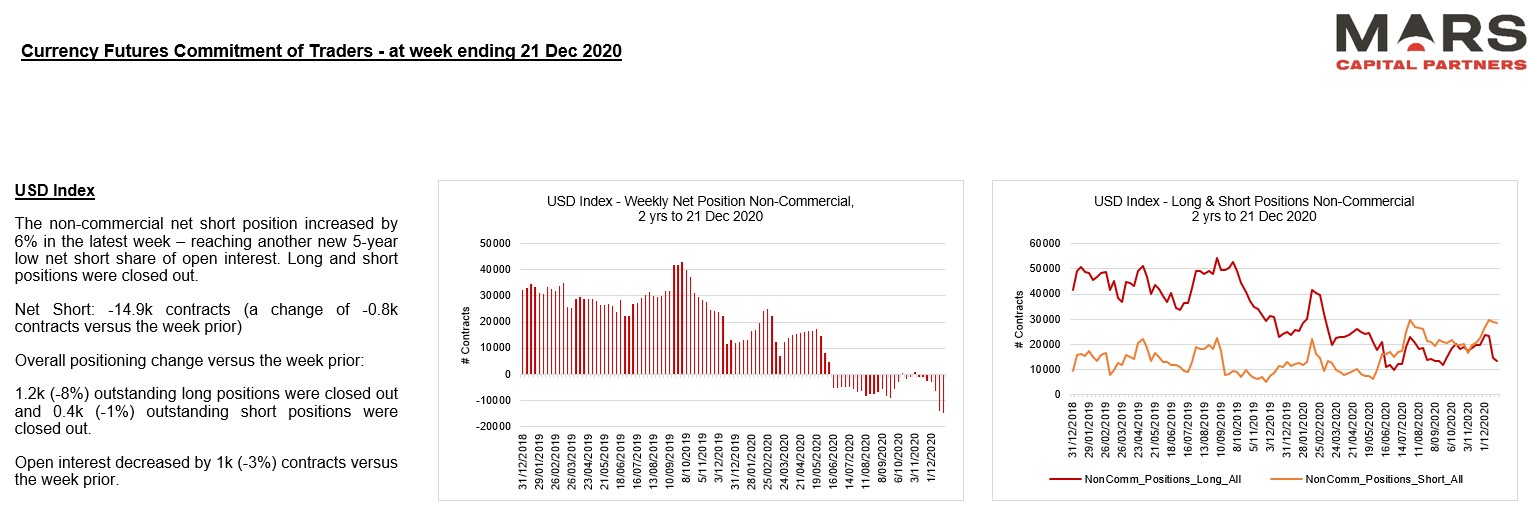
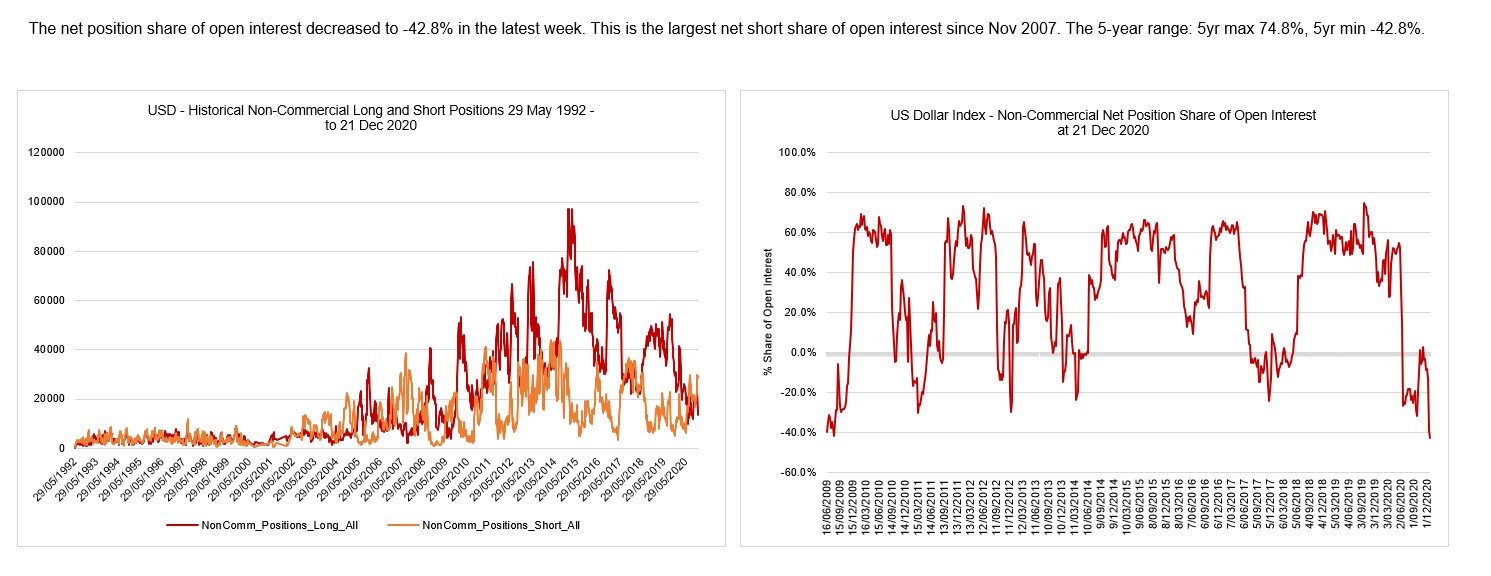
DXY shorts pressing into new cycle lows…
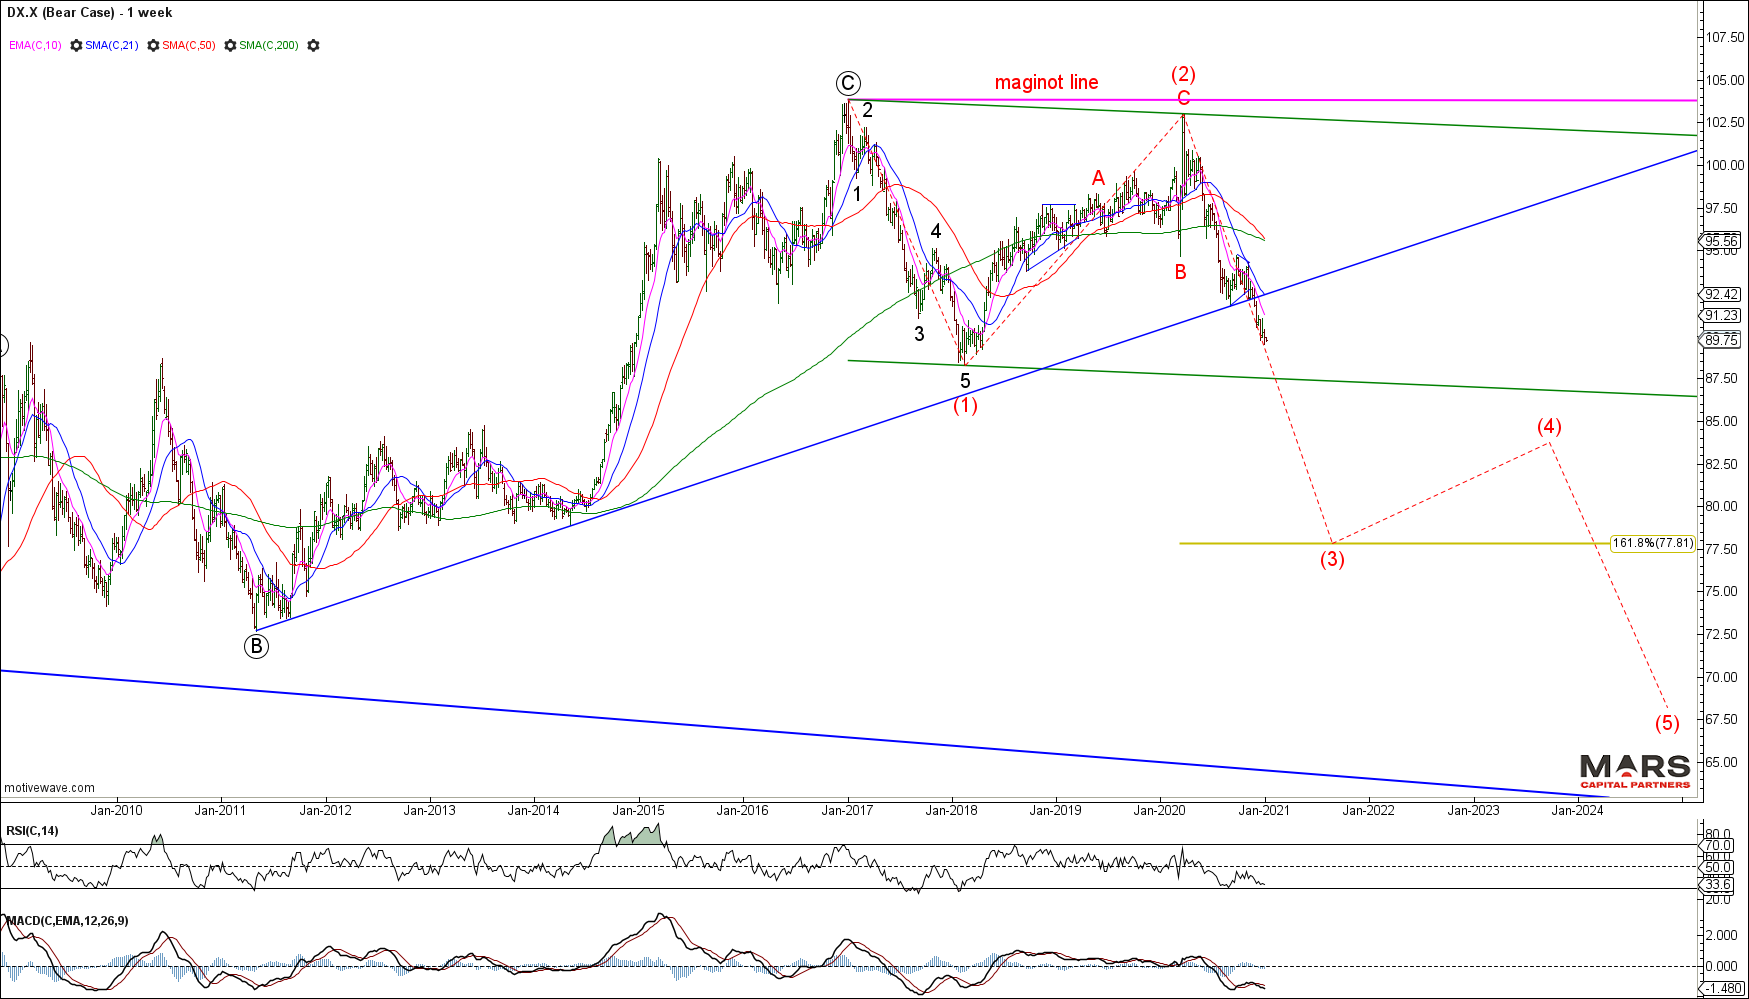
What if we are wrong about the DXY? The Bear Case will likely see a continued impulsive decline for wave (3) towards 77.80 measured targets, changing the big picture structure to long term bearish US$. We have little evidence yet to support this outlook, but we should be mindful of the possibility if the DXY fails to hold measured support.
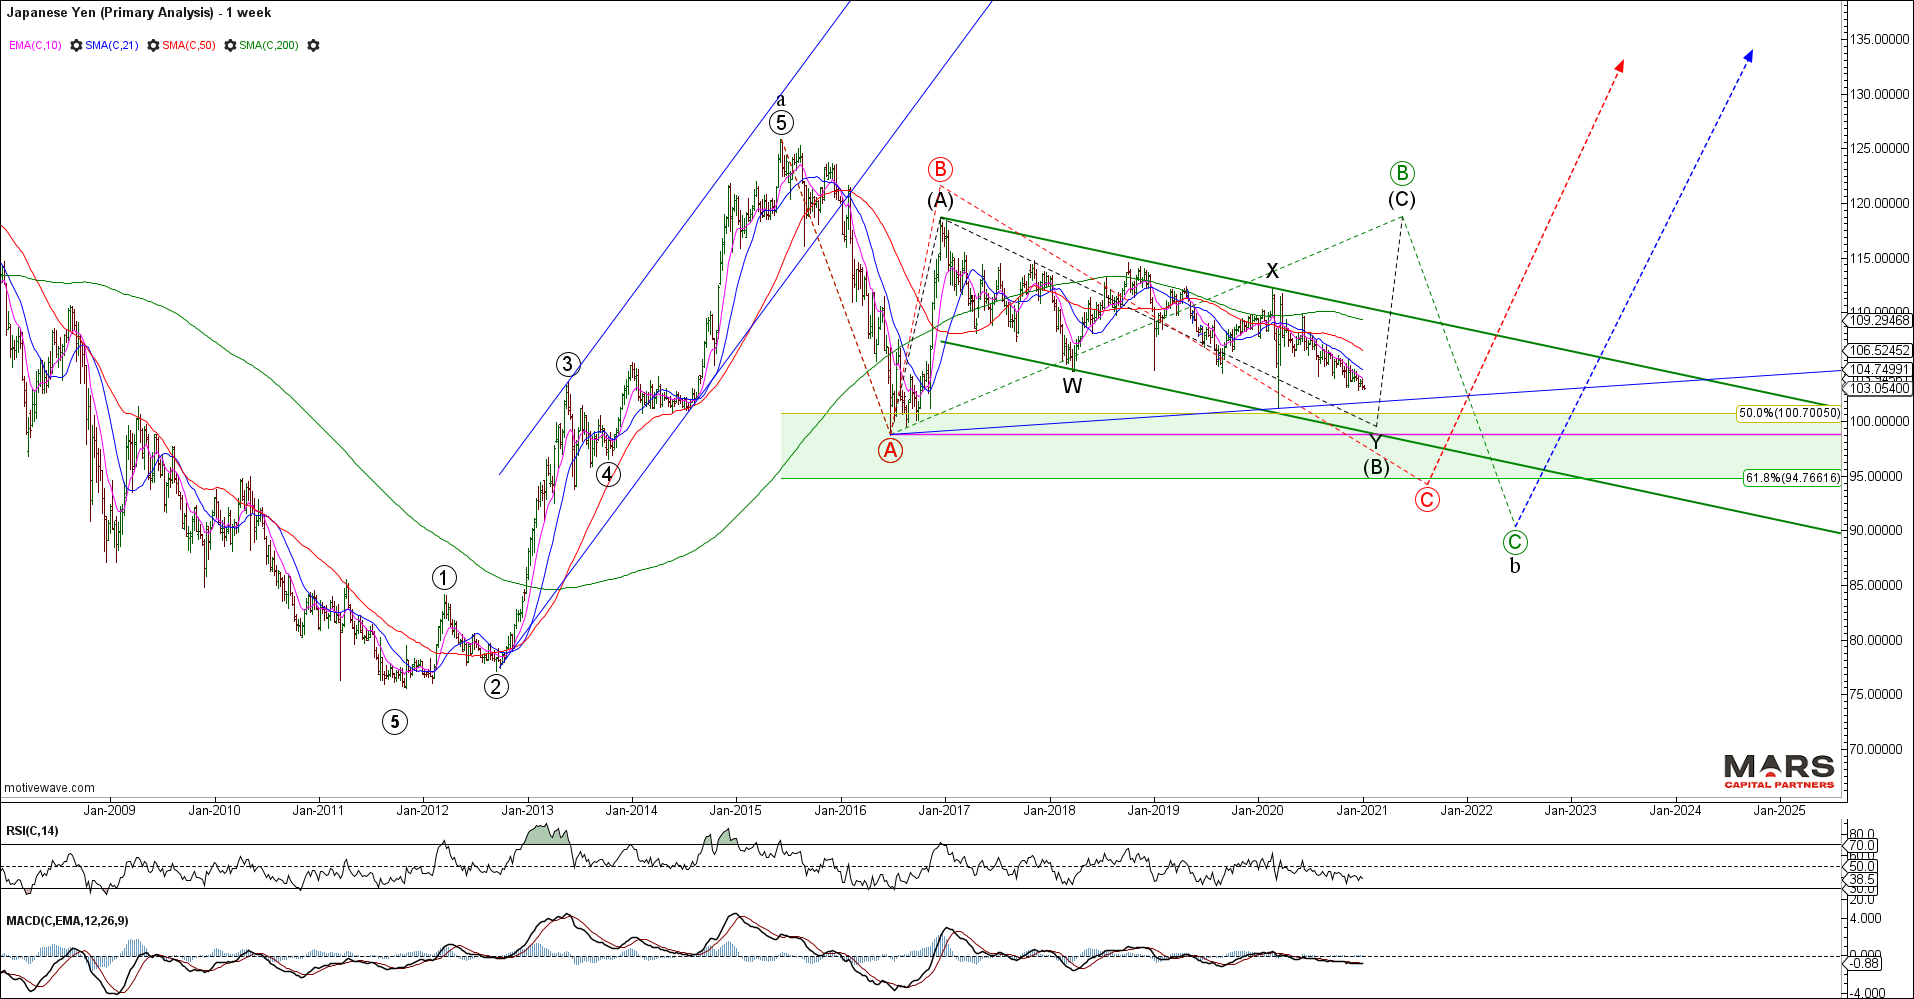
The USDJPY structure is defined by the impulsive rally from 2011-2015 from where we have seen a corrective (managed) decline. We are looking for an opportunity to go long USDJPY once the corrective decline is complete as we are bullish this pair from a structural perspective. Near term, we have no evidence of a tradable low. Patience.
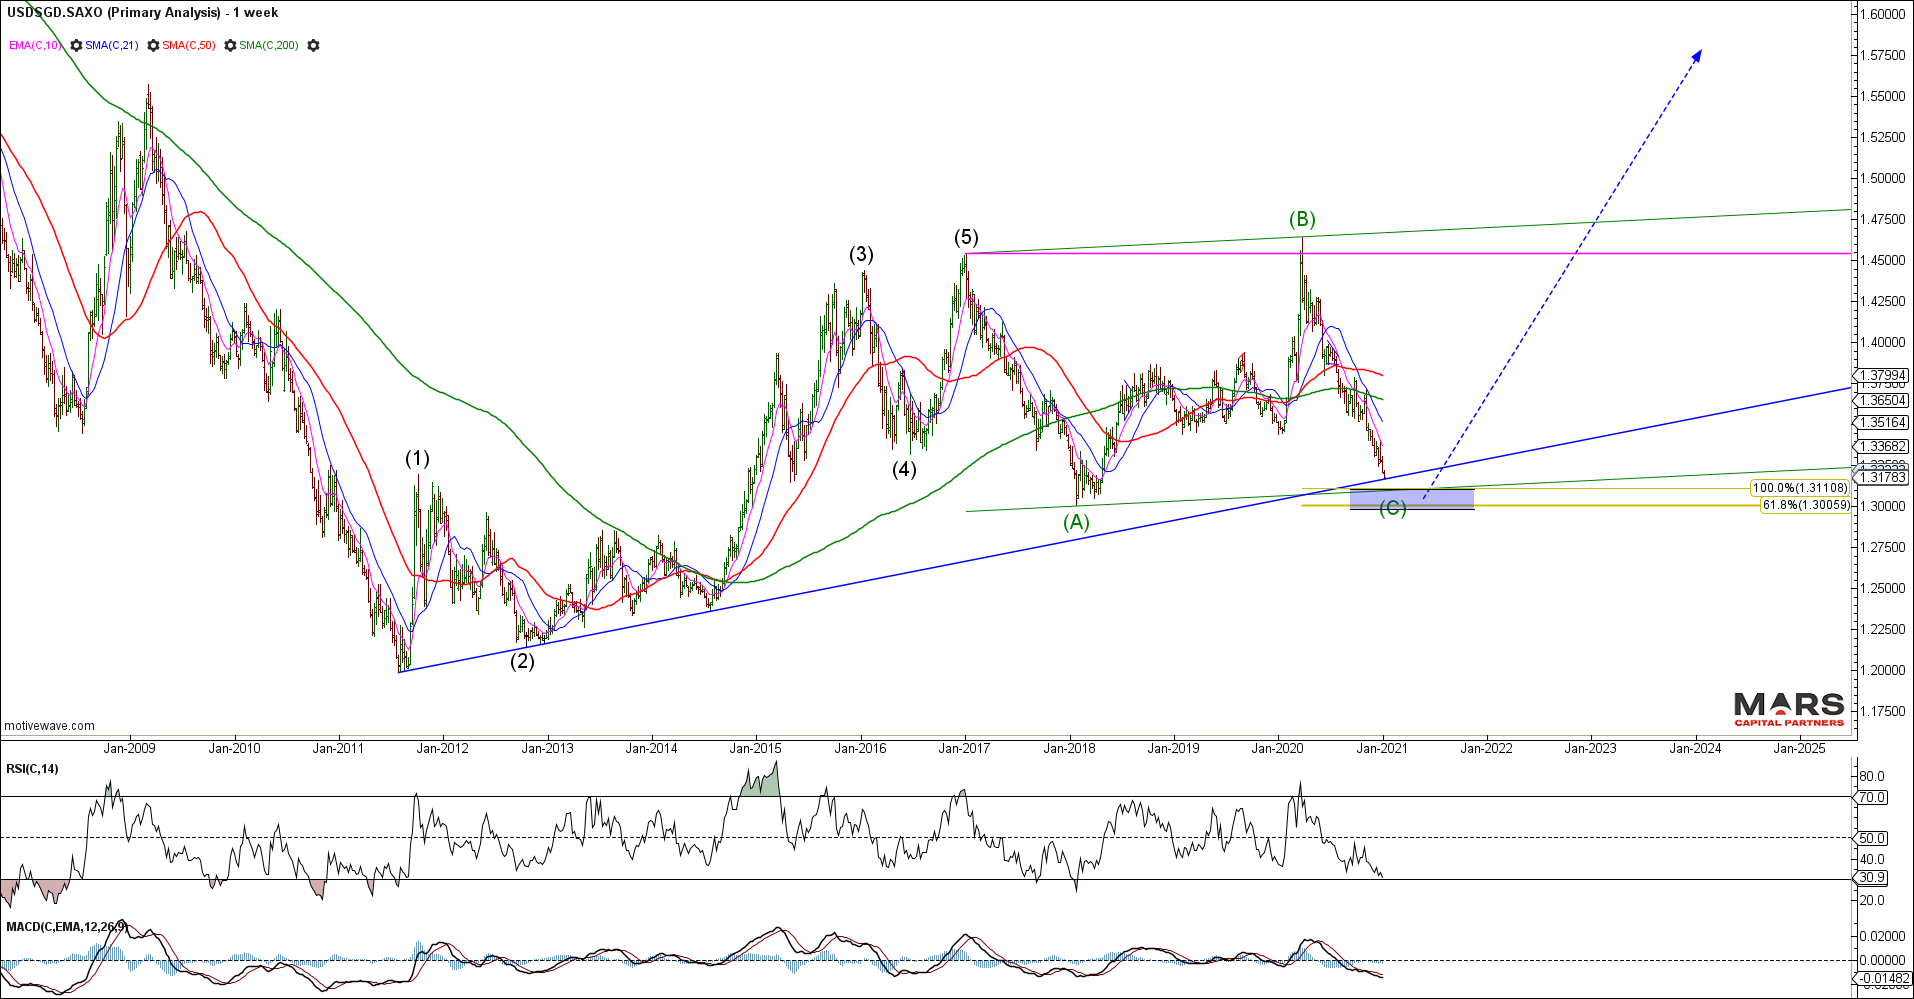
The USDSGD supports our bigger picture bullish outlook for the US$ and is now approaching measured targets for a corrective a-b-c decline. We have layered support in the 1.30-1.31 area from where we are looking for a bullish turn. We have no evidence yet of a tradable low but we are alert to a big picture bullish turn.
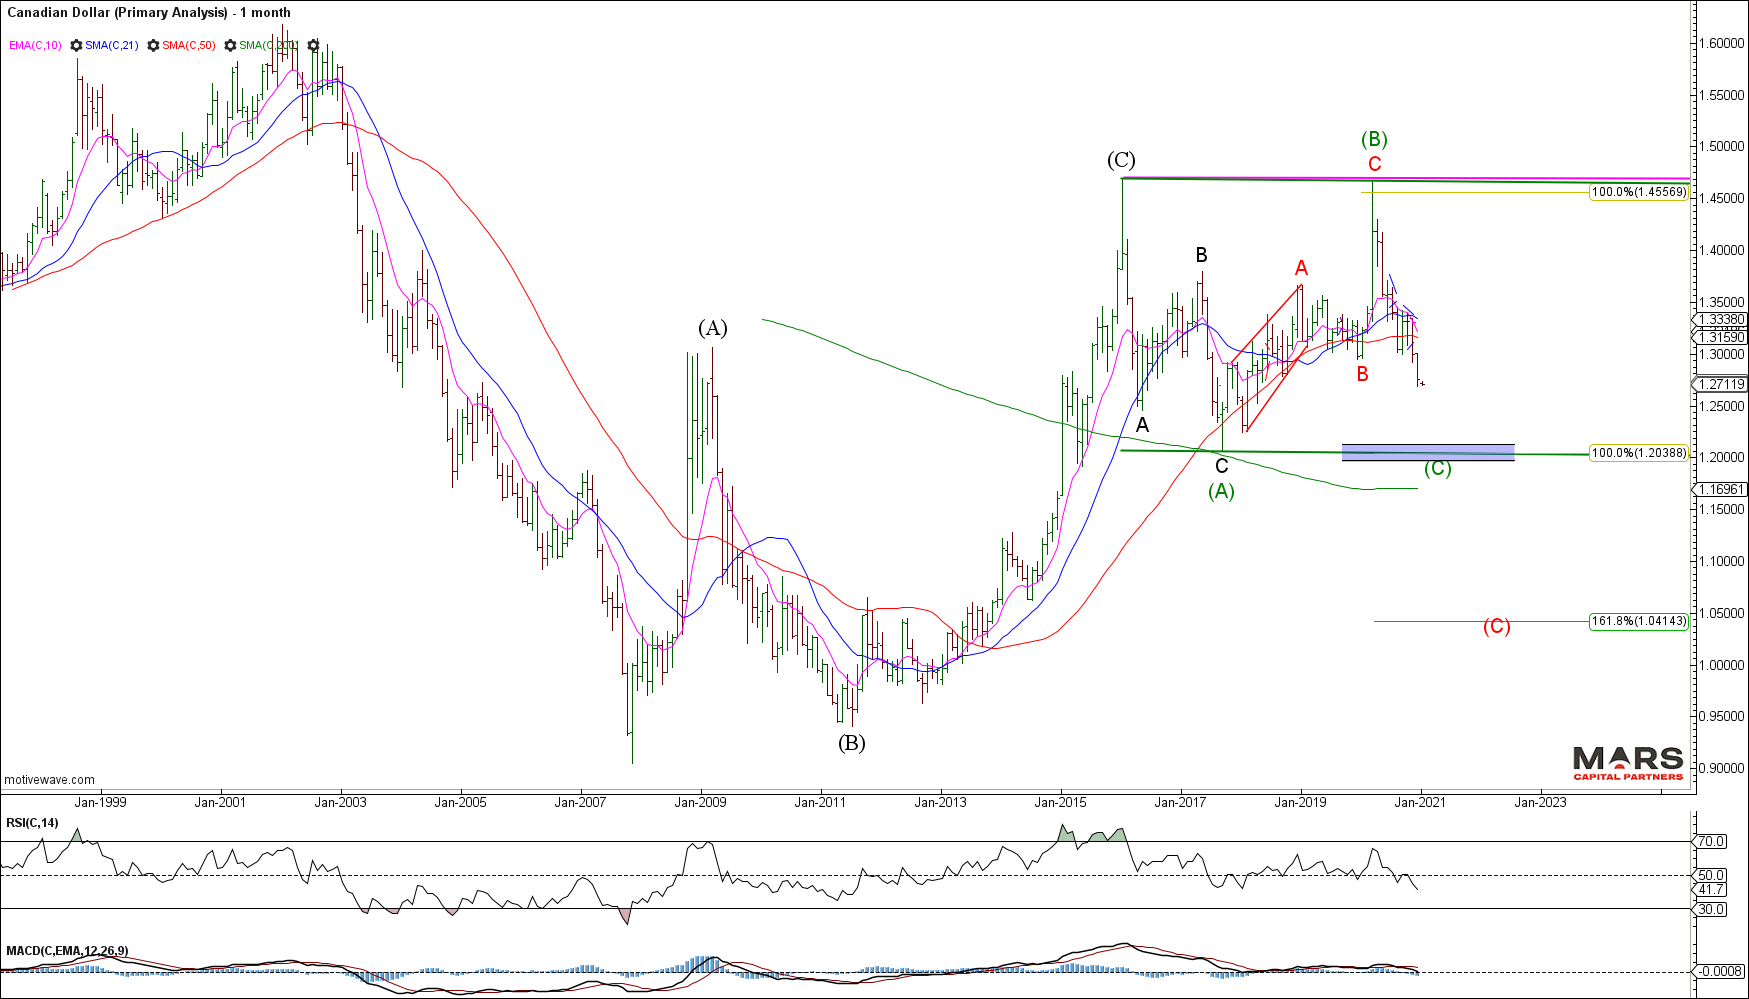
The commodity currencies remain bullish with targets for USDCAD lower towards the 1.20-1.21 measured equality for an a-b-c decline with the potential for much lower. This wave structure supports our near term bullish outlook for Crude Oil.
Bullish Commodities
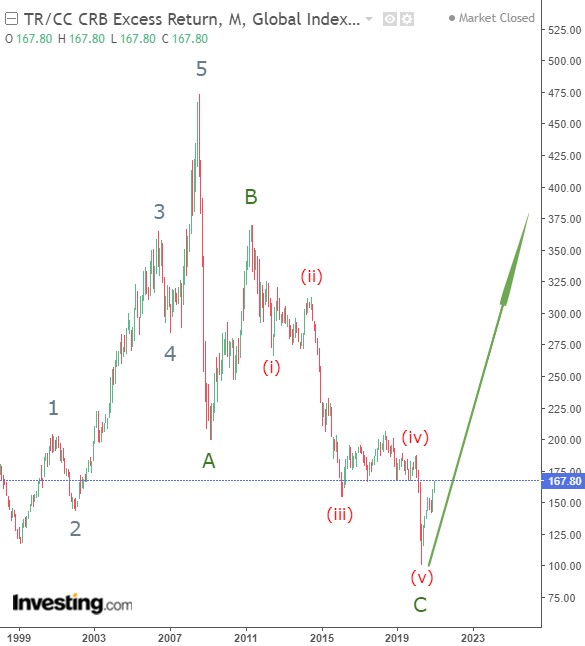
Are industrial commodities the next great trade? The CRB Index peaked in July 2008 at 474 before declining a fibonacci 78.6% to its major cycle low at 101 in April 2020. We now have what appears to be a completed zigzag A-B-C decline from the 2008 highs – this year’s impulsive rally opens the door for a resumption of the bull trend in commodities.
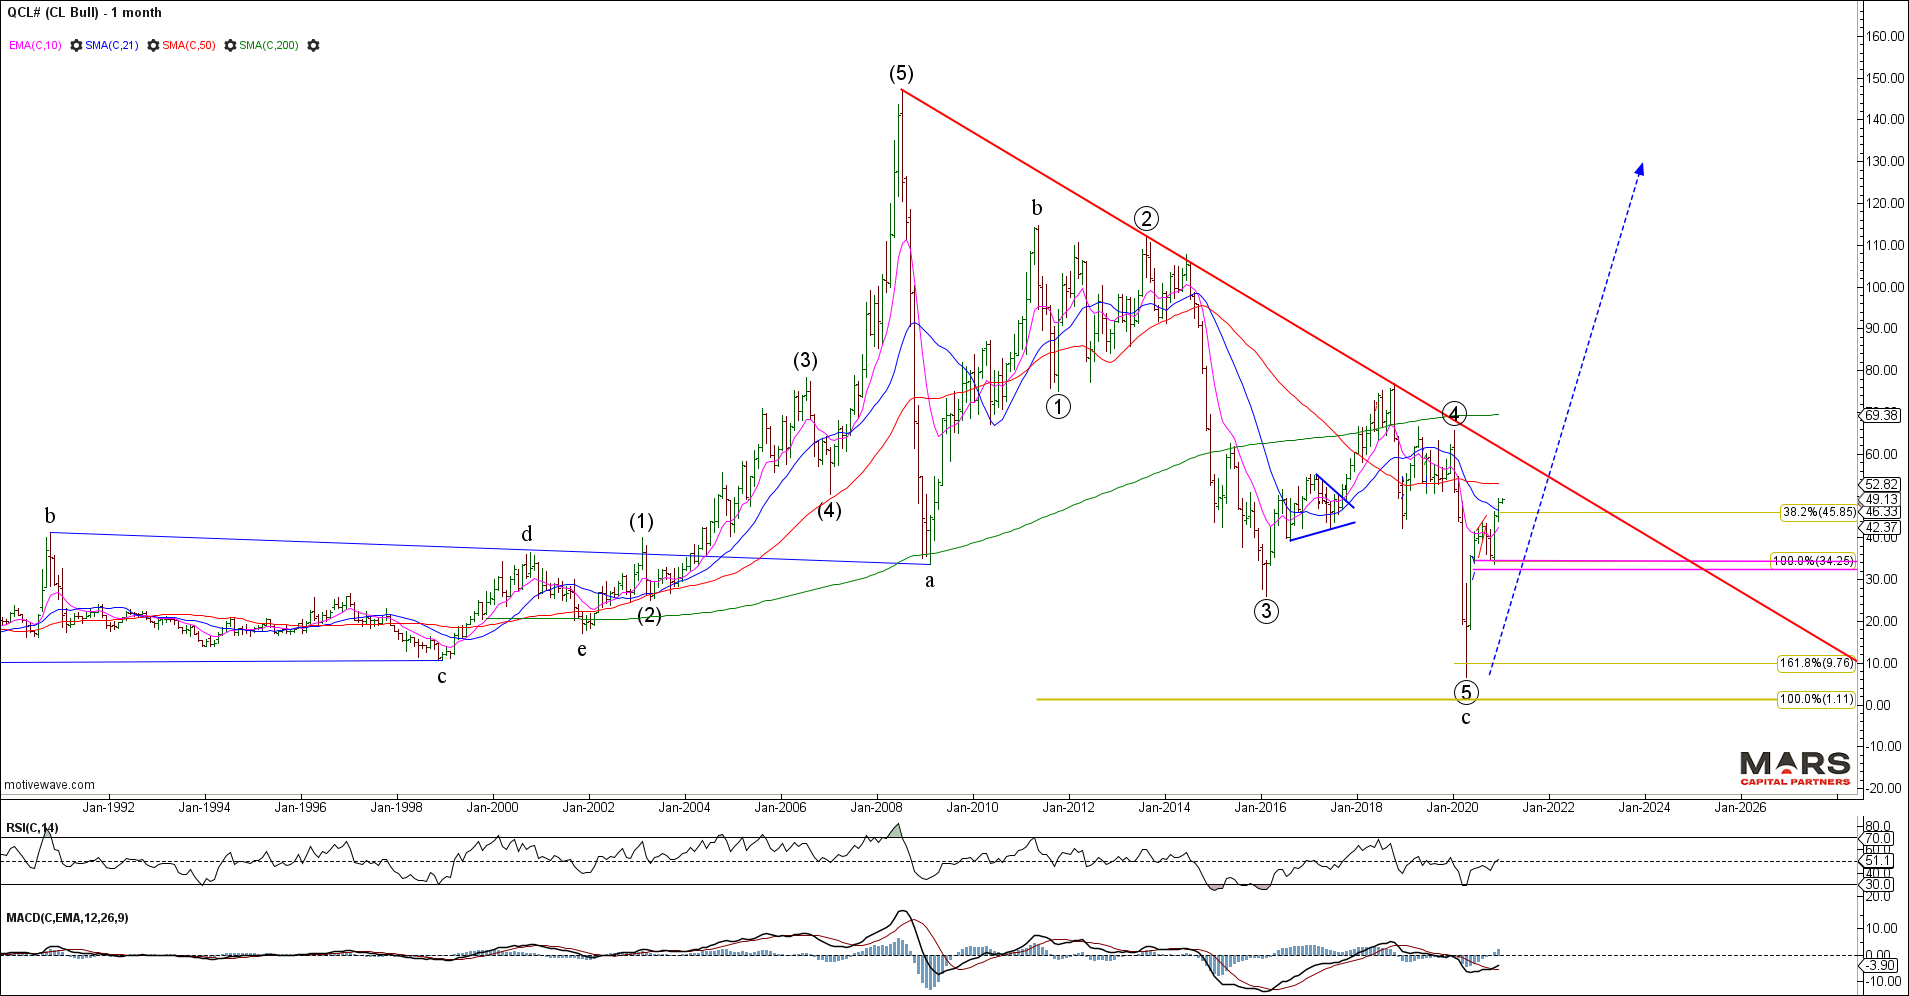
Crude Oil is representative of the bullish commodity story. We have a corrective 3 waves down of equality from the 2008 highs and small degree impulse higher from the April 2020 lows. We remain bullish commodities until proven otherwise.
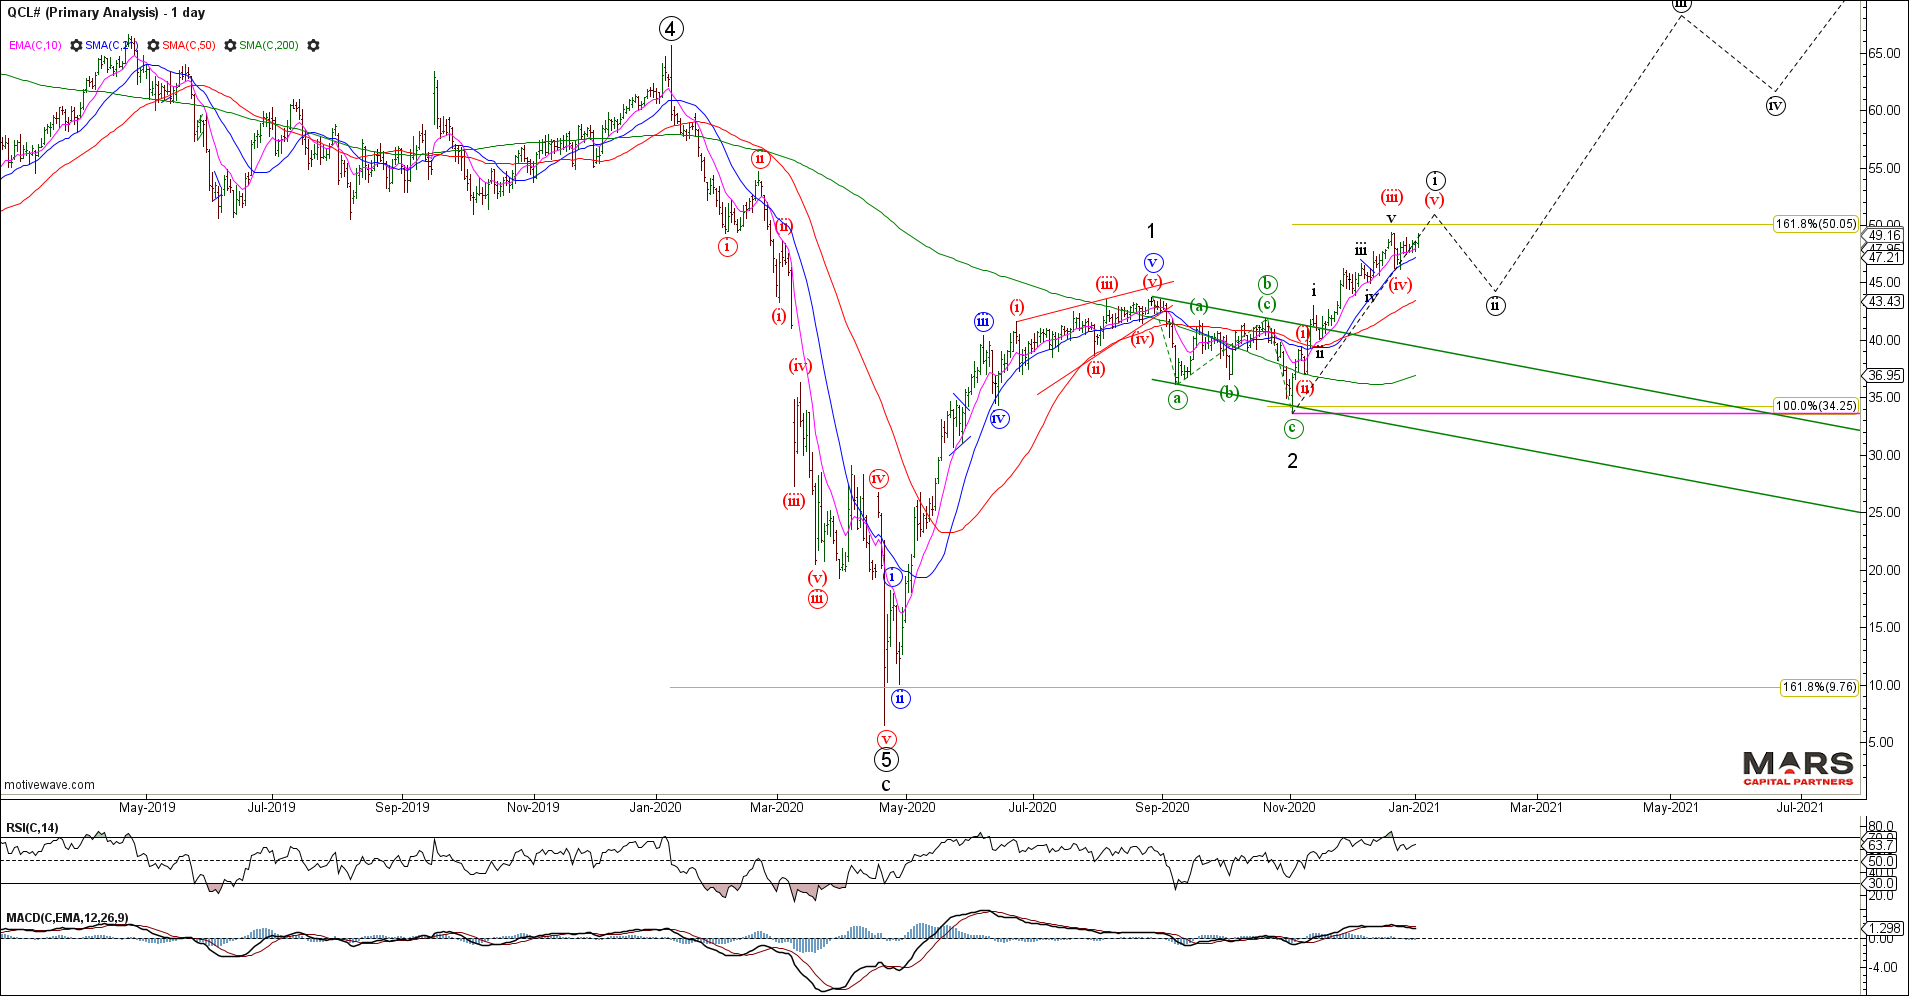
CL could be in the early stages of a strong 3rd wave rally. Only trade back below November’s 33.64 low would invalidate the strong impulsive uptrend. We are buyers on any near term corrective pullback with a long term bullish outlook.
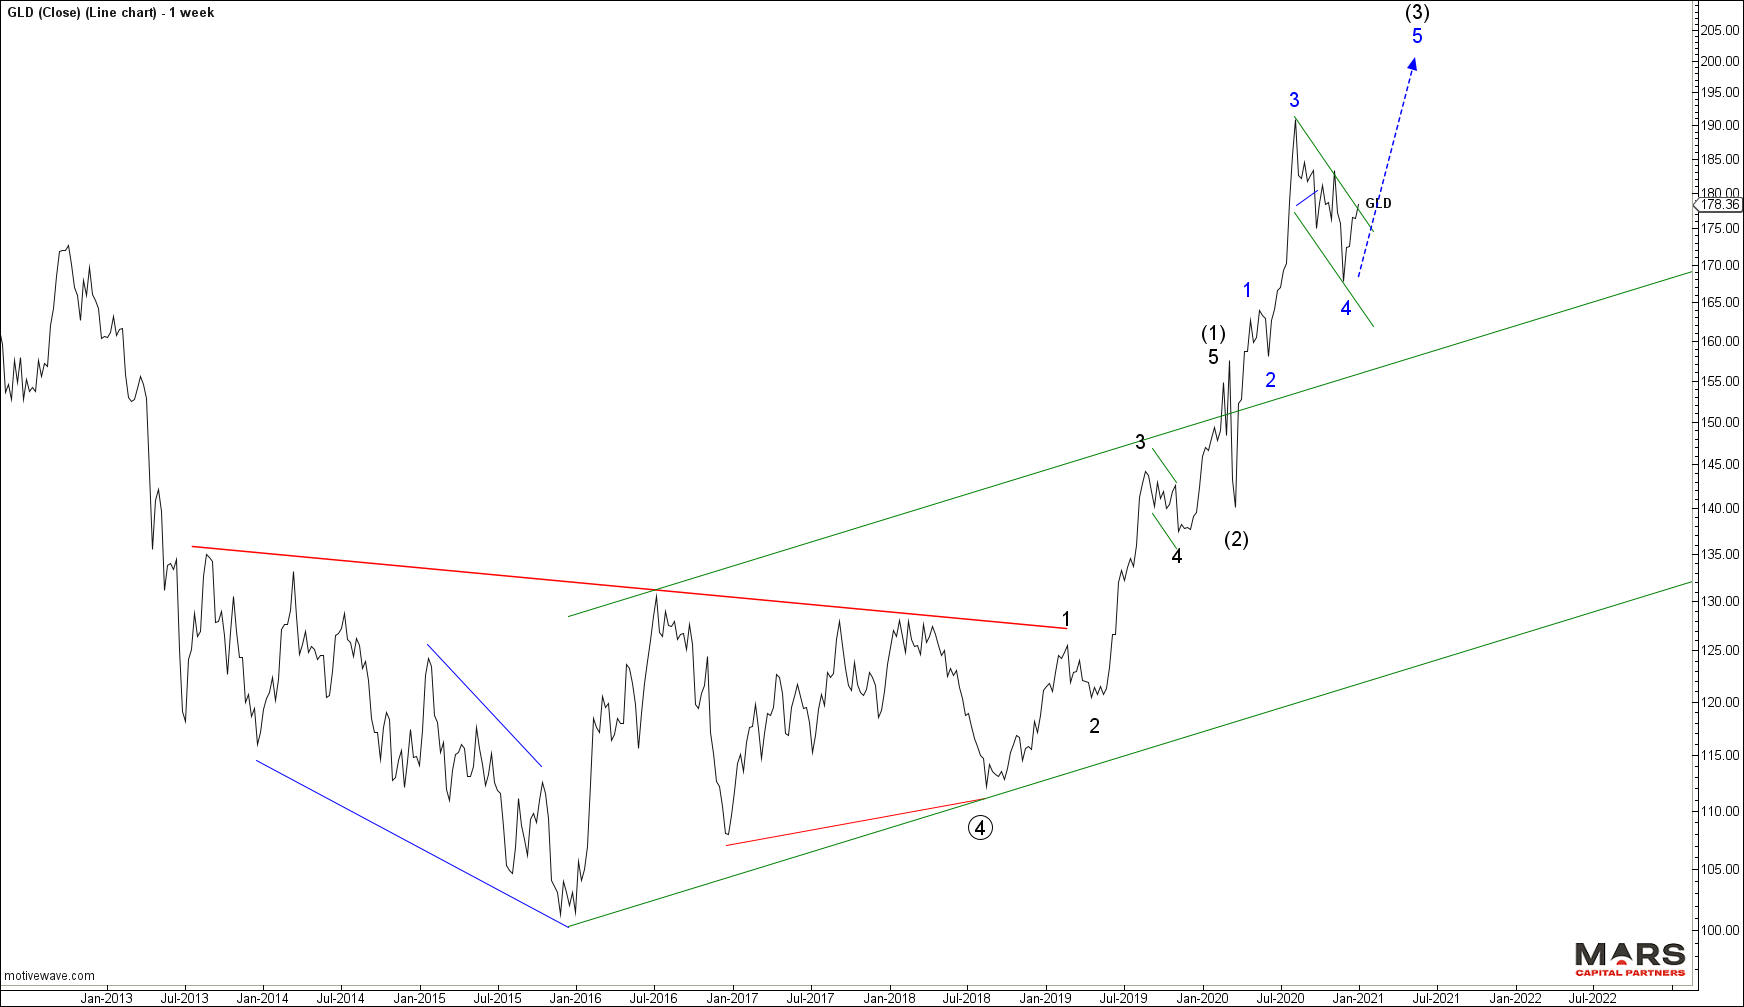
Gold / GLD is also threatening to break higher from its wave 4 bull flag. We had identified the recent decline as clearly corrective so we expect the rally to continue in wave 5 of (3) to new cycle highs.
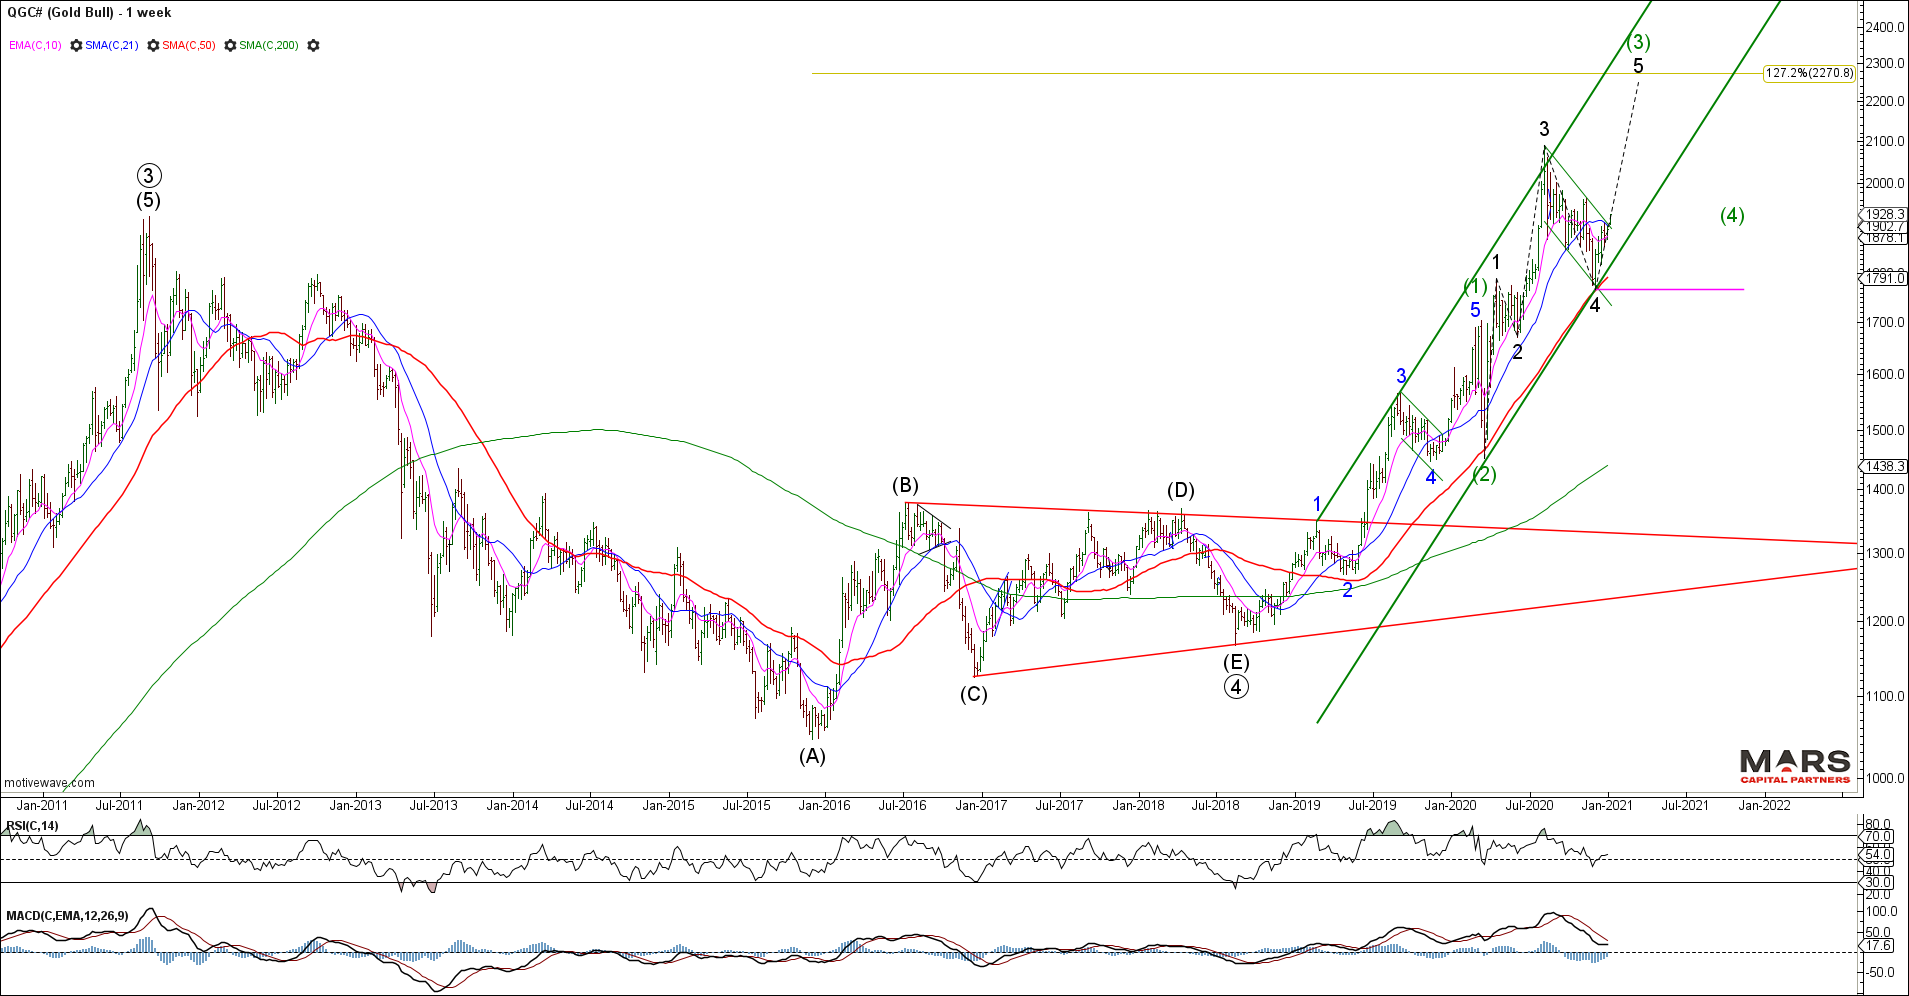
While not the ideal wave structure, Gold has rallied strongly from our 50 week sma and trend channel support opening the door to a push to new highs. The recent decline was clearly corrective (bull flag) so while the count may be wrong, the bullish outlook remains in tact for Gold.
Bullish Crypto
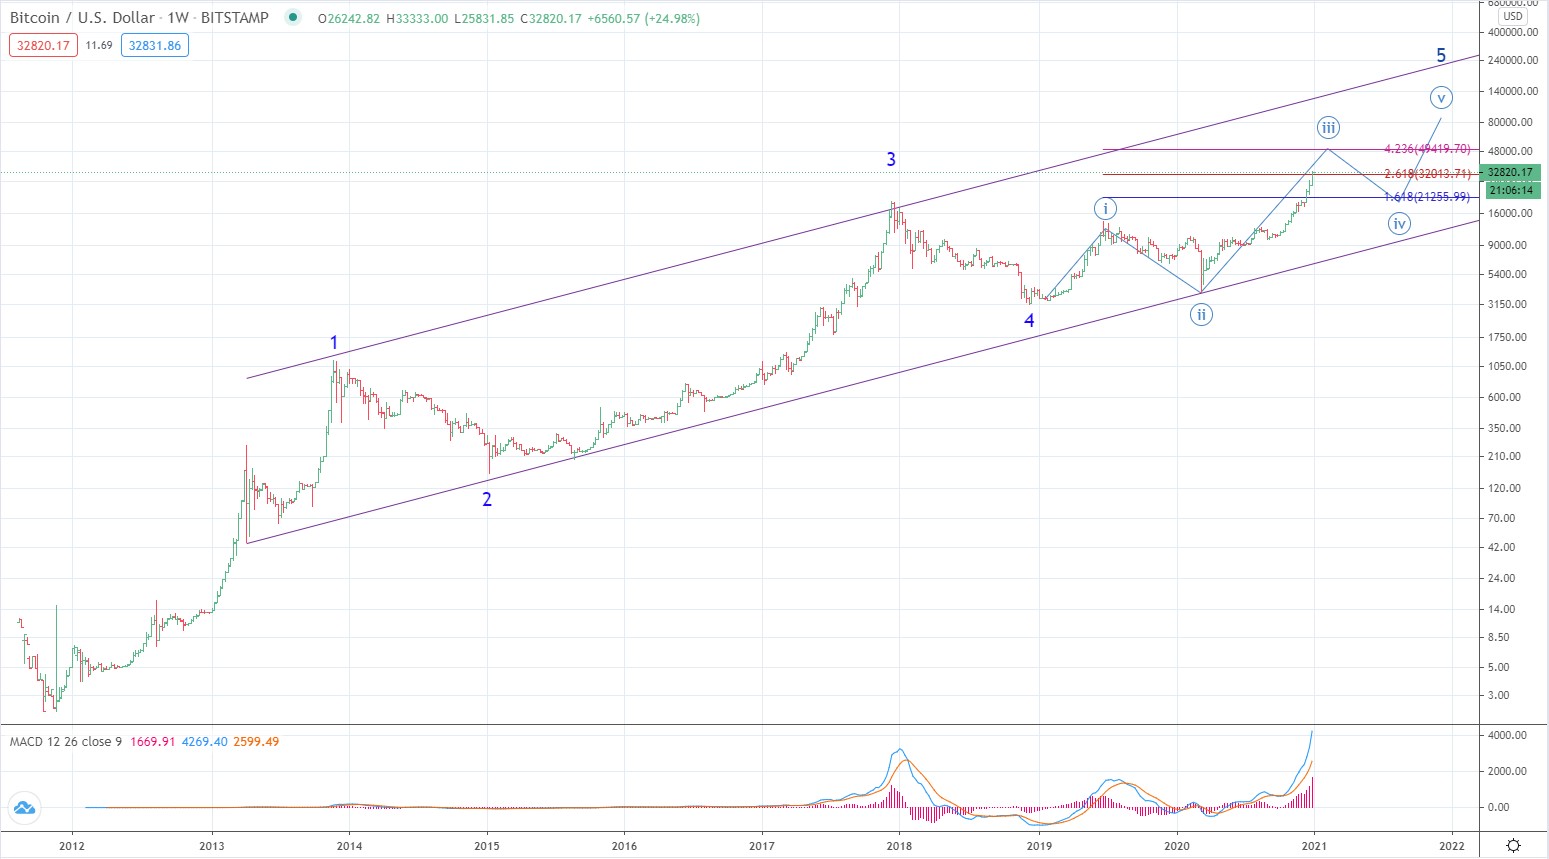
Bitcoin, the very essence of a speculative mania is in the latter stages of a wave (iii) of 5 blow-off. This chart suggests the speculative mood and herd is not done yet and may be the last asset to top. Once this impulsive 5 wave rally is complete we should expect at least a 50% retracement of the entire rally. Our experience with Tulips warns that when the bubble pops, Bitcoin could decline 90%.
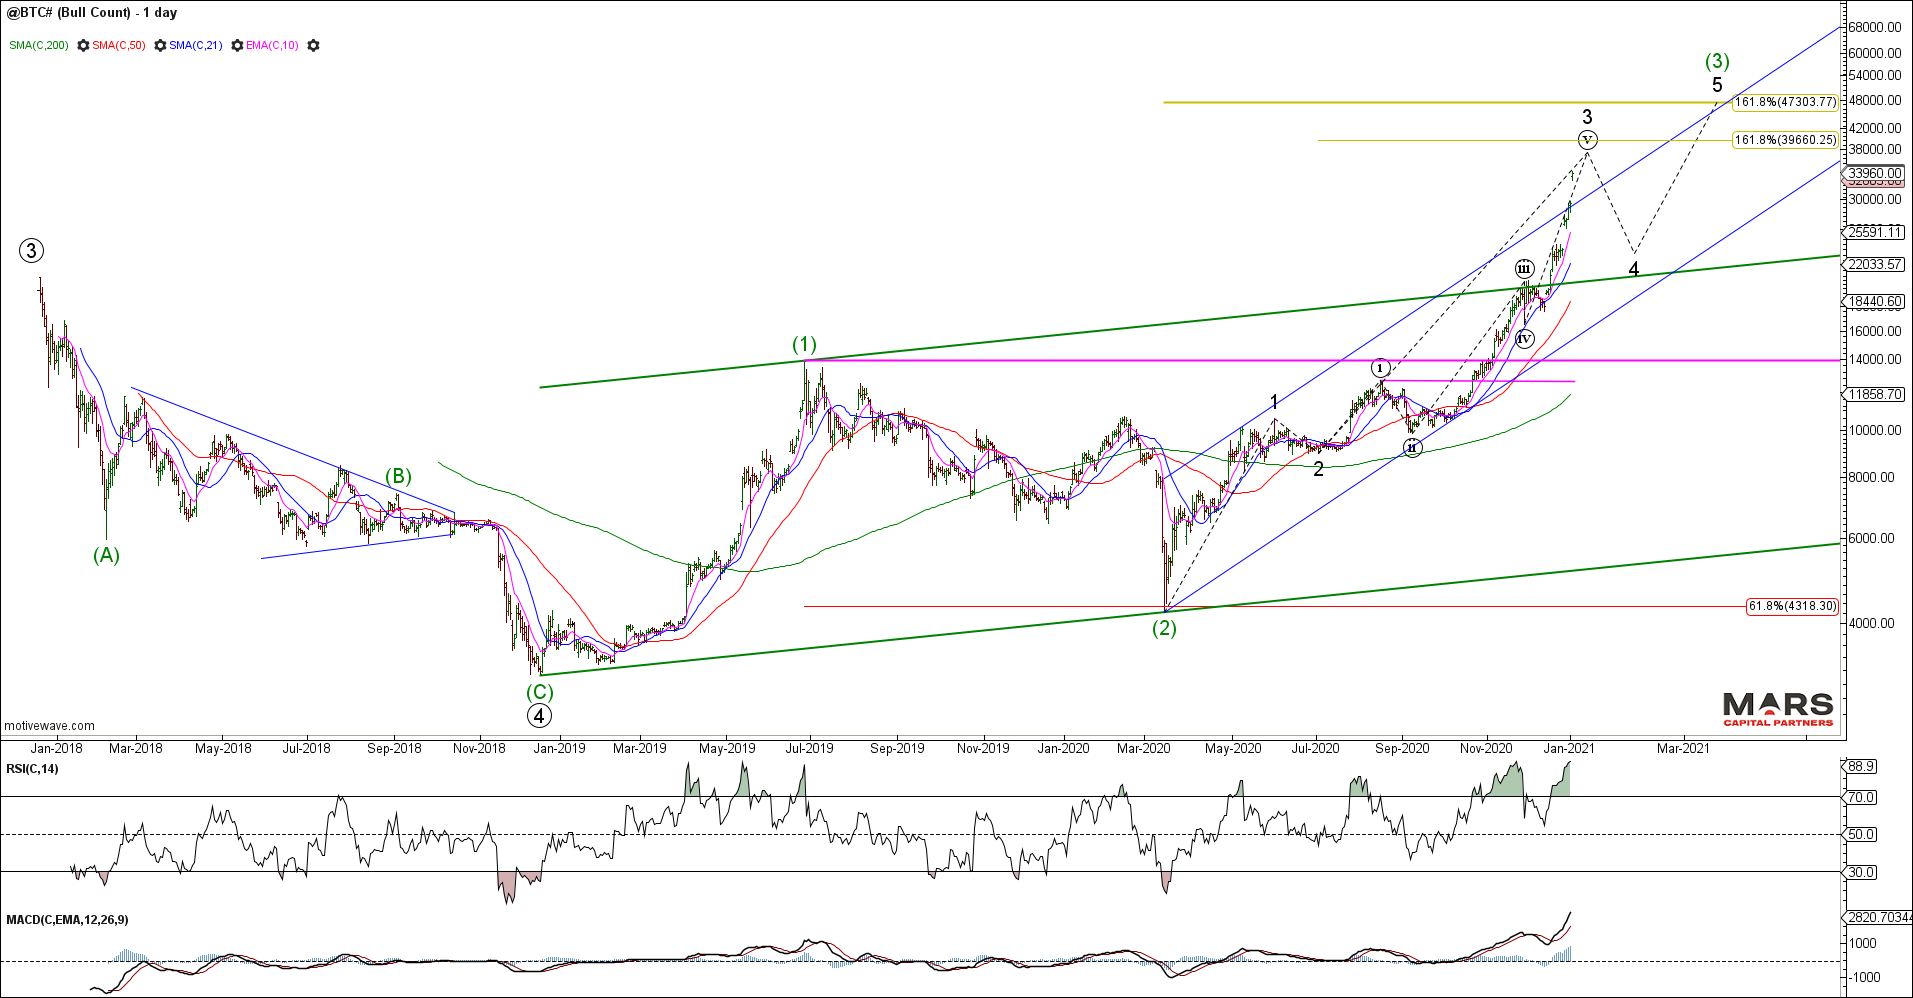
Our near term bullish outlook for Bitcoin remains in tact as we see an acceleration higher in wave 3 of (3). While fib targets remain higher, this parabolic move is not without risk of a sharp pullback for wave 4. Buyer beware that this is a speculative mania.
Wishing everyone a safe, happy and prosperous 2021. Trade safe 🙂
