
Last week saw a continued liquidation of global risk. Our expectation was that the decline had not ended and we were looking for wave (v) of the decline. Last week’s 2-way price volatility warned of a likely 4th wave as the markets continued to stair step lower. We are now seeing bullish momentum divergence across the board as we look for a bottom in wave (v). This is NOT a given as liquidations could continue. The global policy response has been unprecedented as the enormity of this economic decline becomes clearer. We have been on the right side of this decline and capital preservation / risk management remains our primary objective. This is not a time for complacency and we are essentially flat across the board.
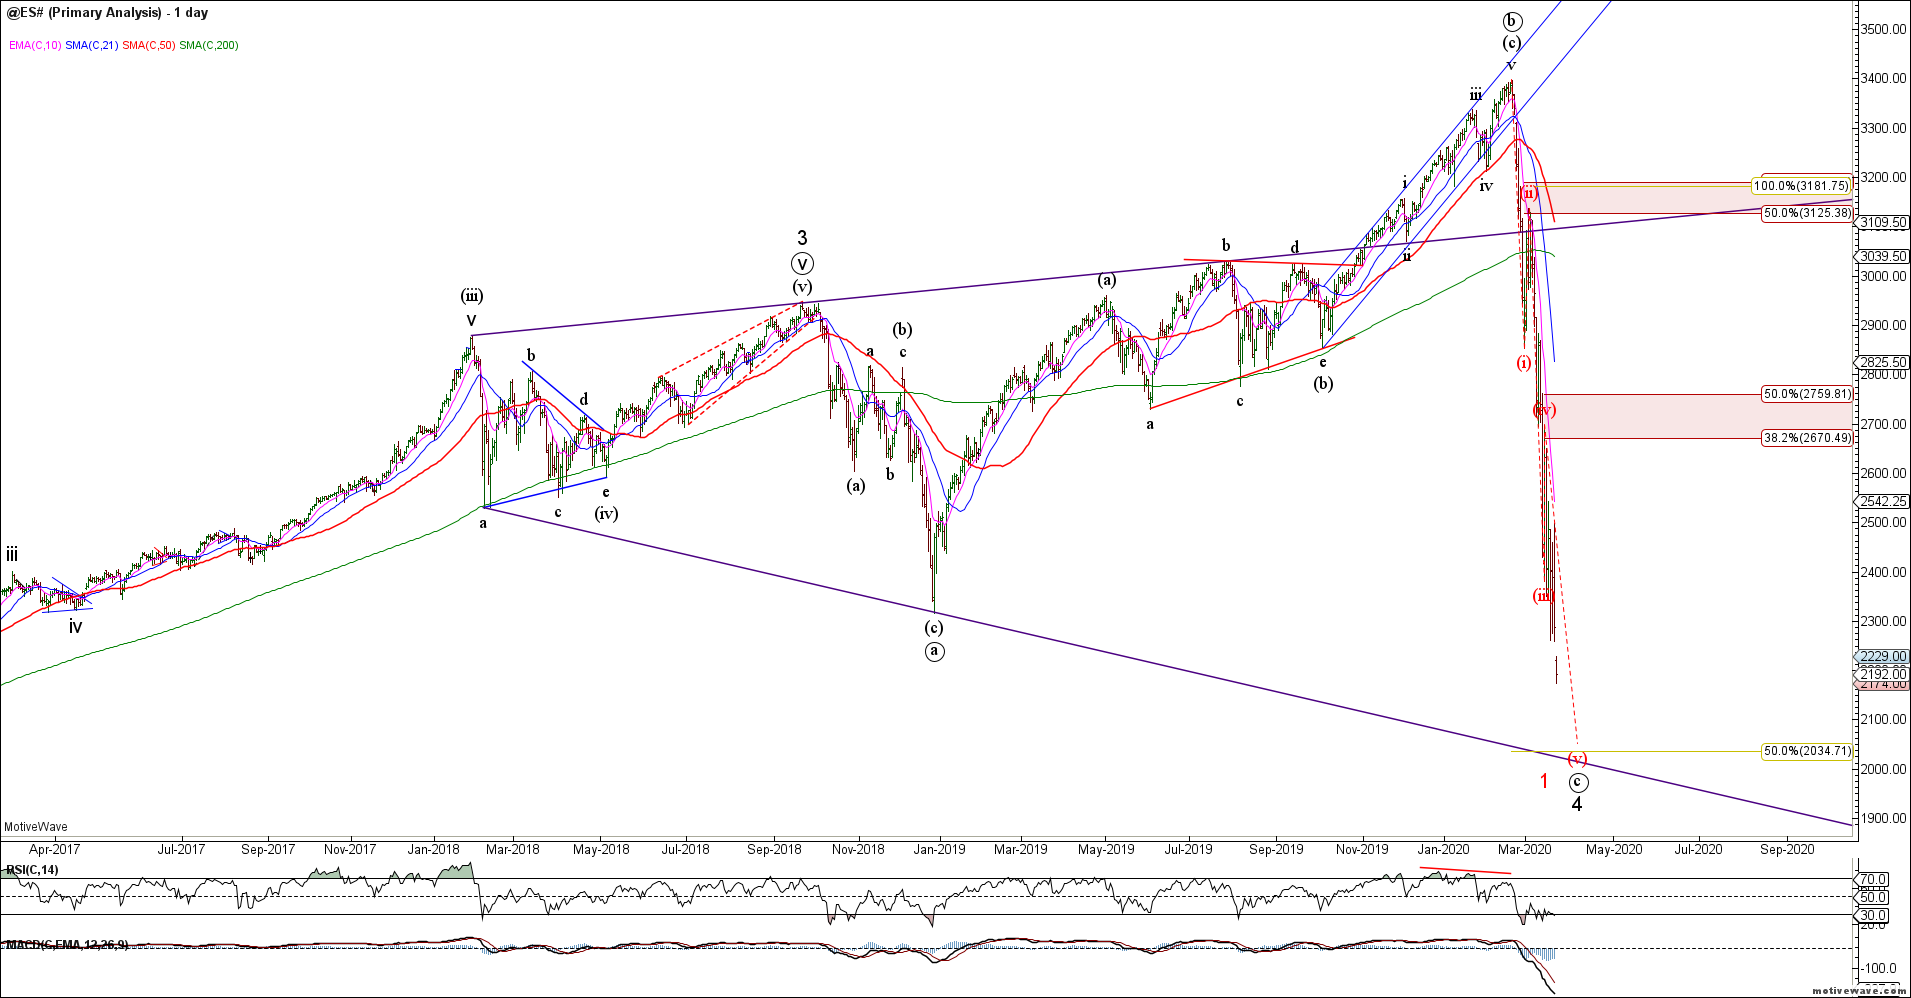
Last week’s continued decline in the SPX / ES invalidated the running triangle case and leaves two likely structures. Either way, we are looking for evidence of near term trend exhaustion and the potential for a counter-trend rally.
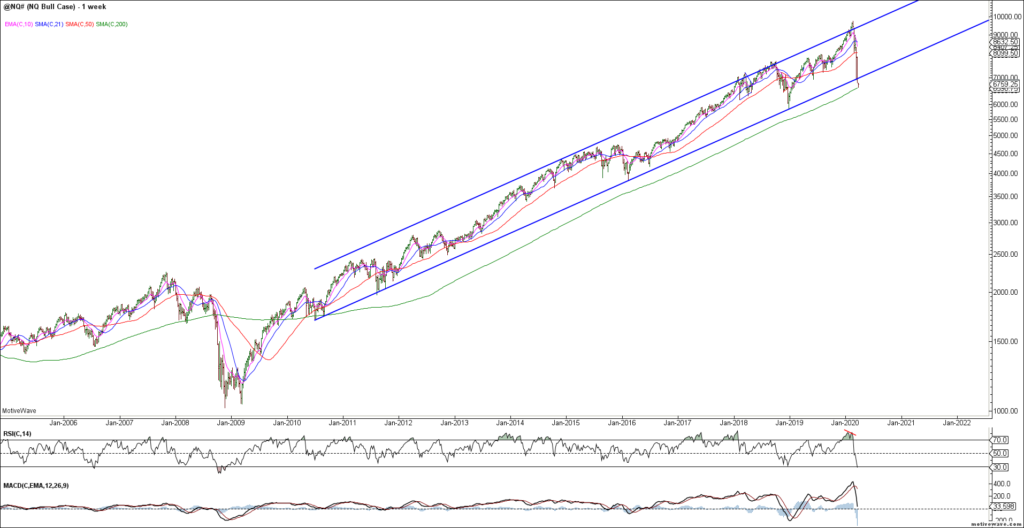
1. Bull Case – wave C decline to complete wave (4) of an expanded flat in the 2000-2100 area before a final push to new ATH’s (hard to see until Covid-19 is mitigated)
2. Bear Case – completing wave (v) of 1 down of a larger bear market that retraces the entire post-2009 rally.
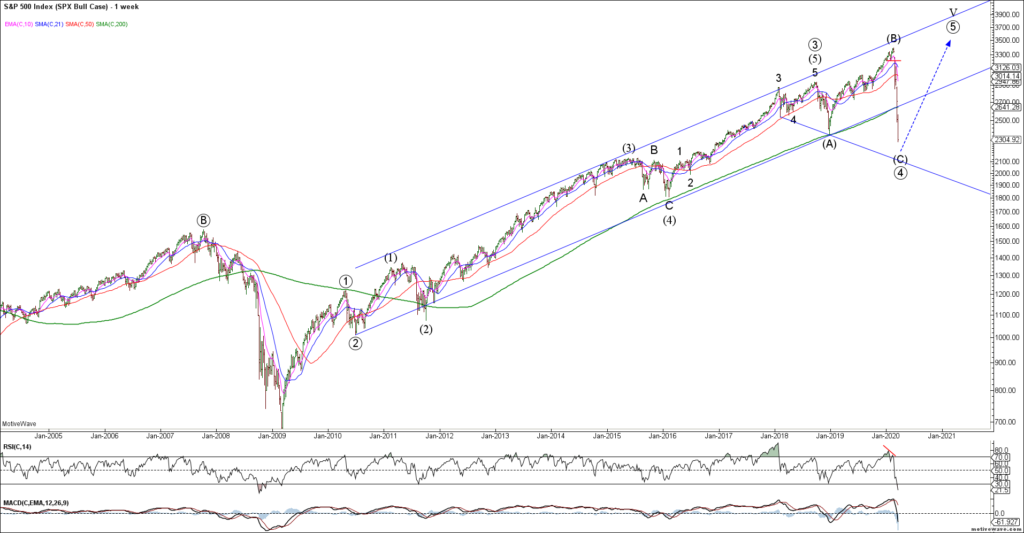
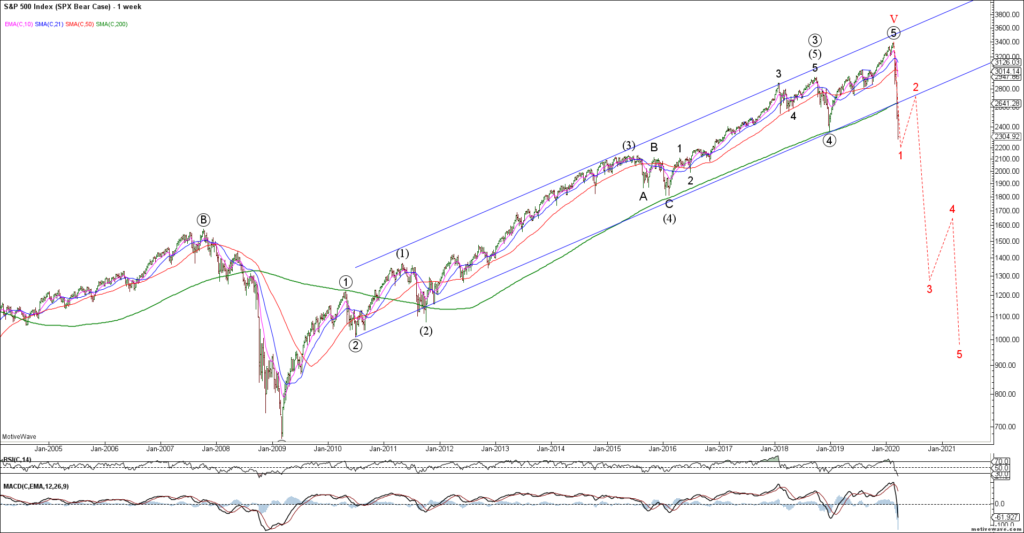
While the minimum requirements for a 5 wave decline for SPX / ES have been met, there is no strong evidence of a tradable low. While bigger picture support resides in the 2000-2100 area, the next major support is at 1800 (prior 4th wave). We are flat here looking for evidence of a tradable low and bullish reversal.
The DJIA / YM also made new 5th wave lows but there is no evidence of a tradable low. This latest decline should be an ending wave (v) so we alert to the potential for a bullish near term reversal.
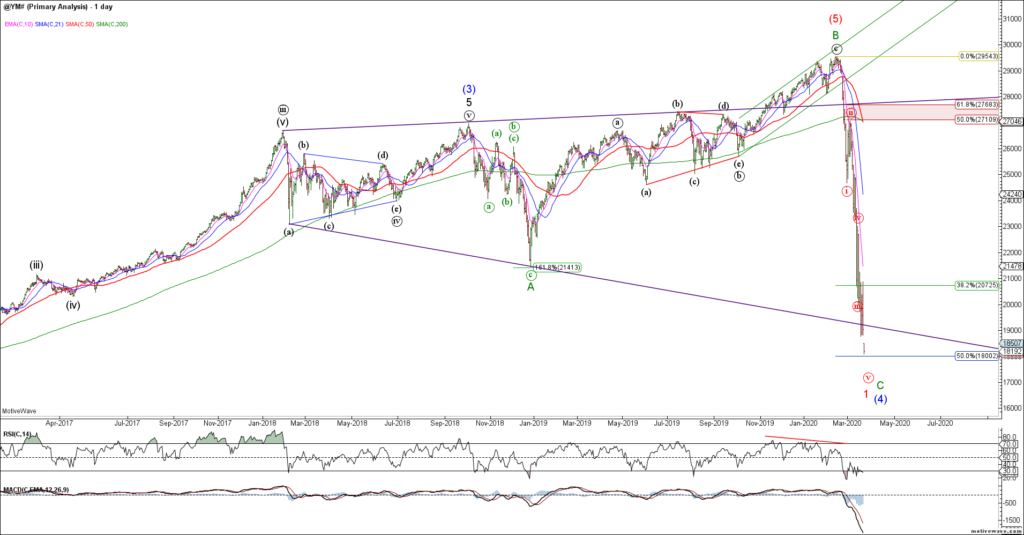
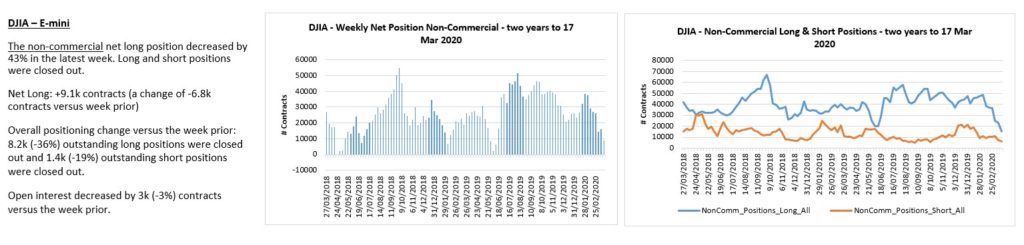
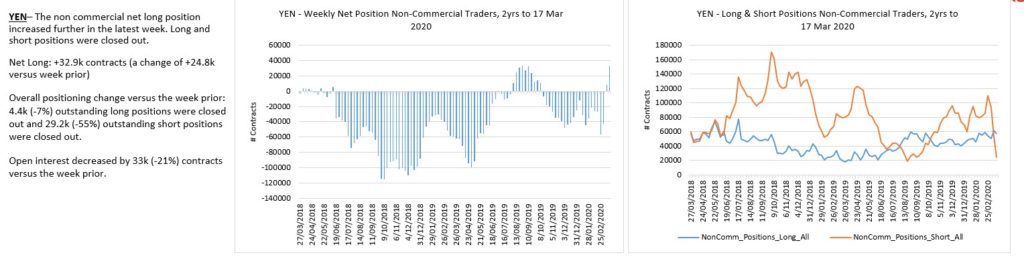
YM longs have left the building.
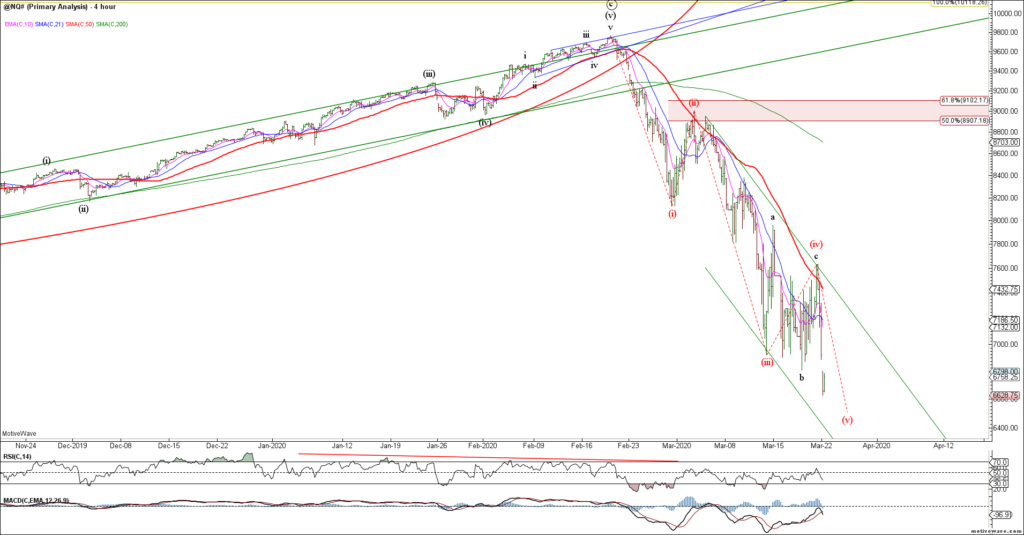
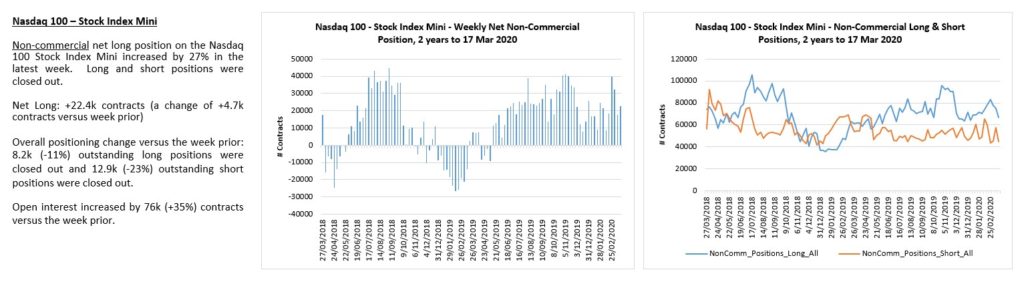
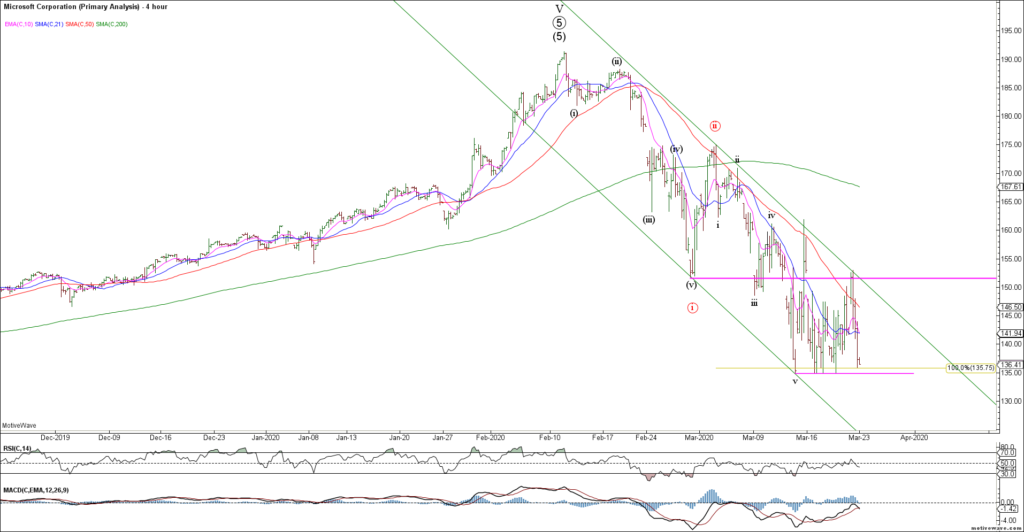
Similarly, the Nasdaq / NQ extended to 5 waves down but the near term structure is choppy and likely incomplete after tagging the 200 week sma. Looking for evidence of a tradable low but keeping an eye on MSFT which looks vulnerable if it breaks near term support.
MSFT is our canary in a coalmine and is threatening to break below shelf support. The question is do we hold support, gap and drive lower or see a false break and bullish reversal? Not pre-empting but watching closely for clues on the broader market. Today’s close will be very important.
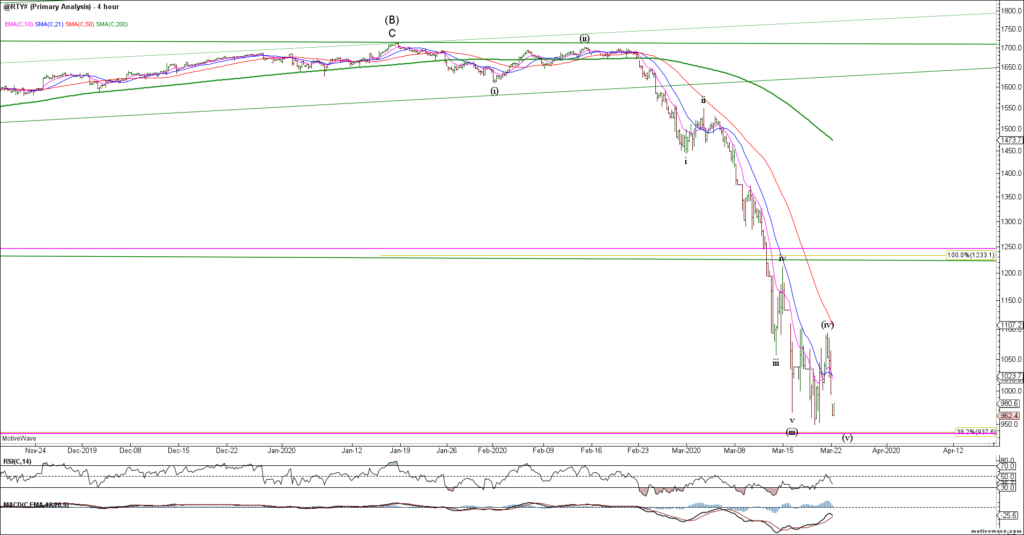
The Russell 2000 / RTY is approaching strong fib and prior 4th wave support. Looking for potential trend exhaustion and evidence of a bullish reversal.
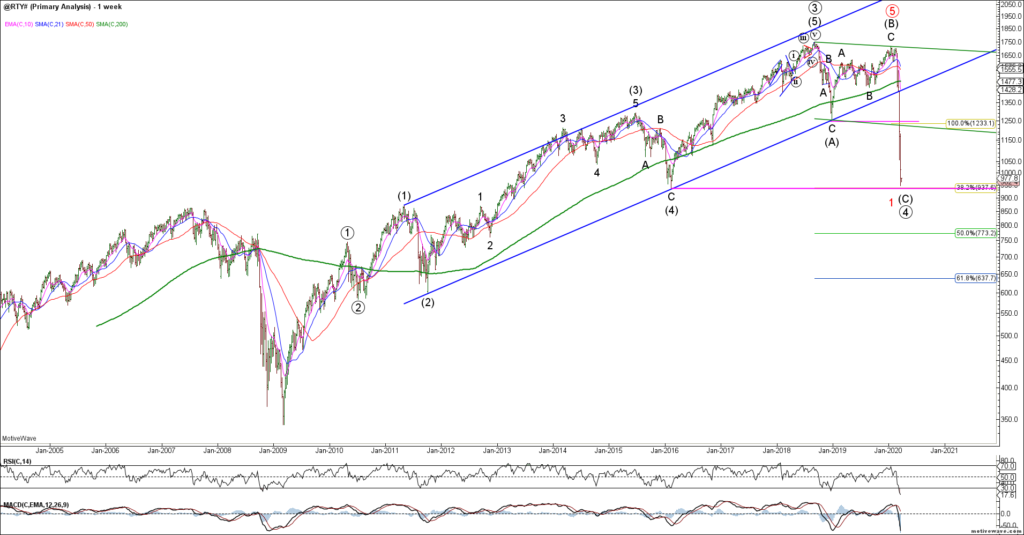

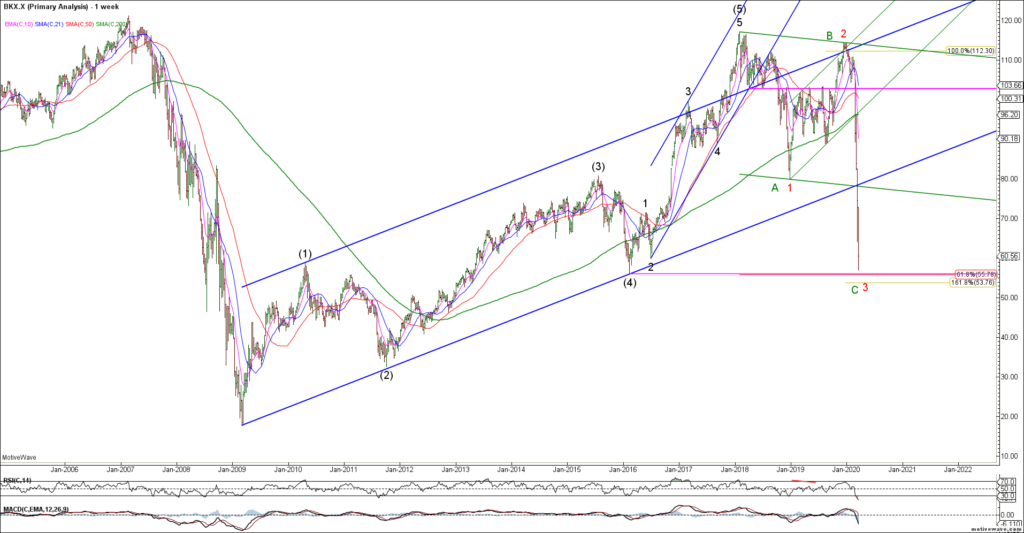
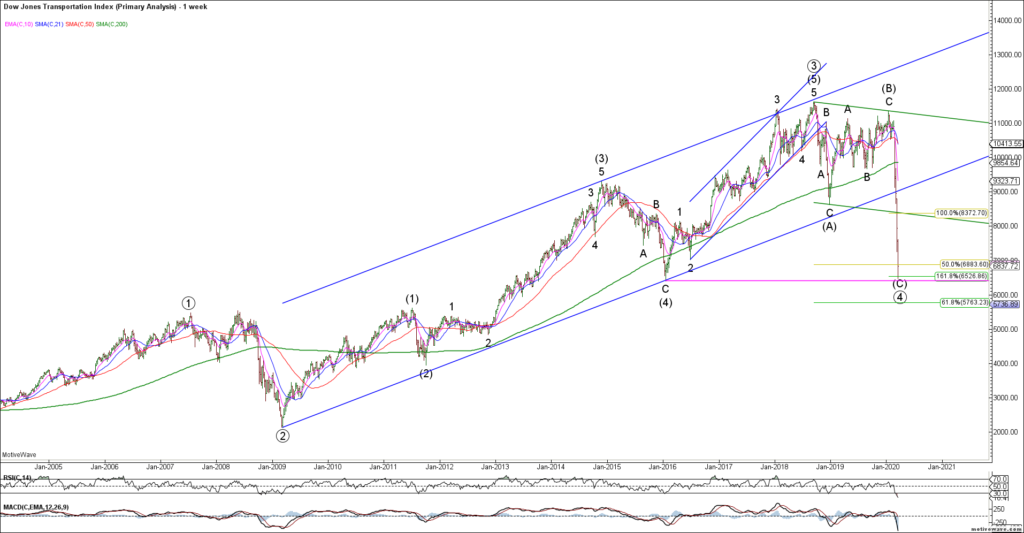
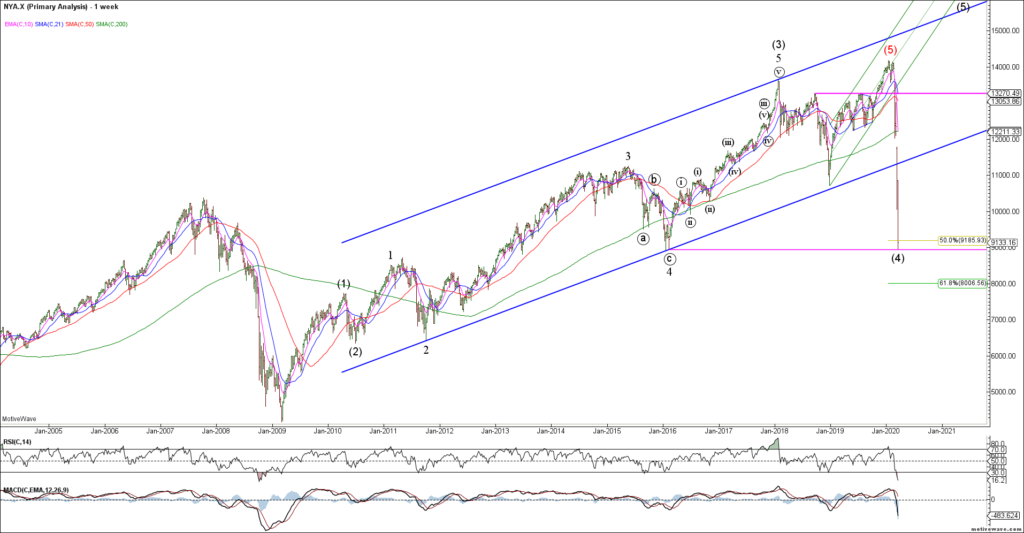
Like the Russell, the BKX, DJT and NYA (Composite) are all testing major fib and prior 4th wave support…. an area you would expect the bulls to try and make a stand.
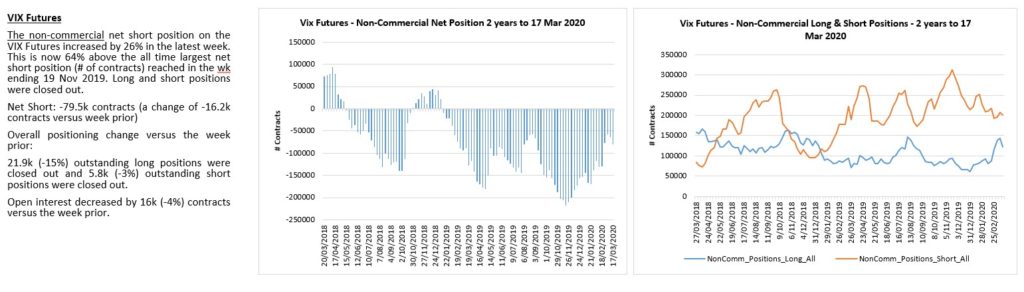
The VIX remains elevated but we are seeing bearish momentum divergences as the markets try to hammer out a near term low. Ideally, a new 5th wave low in equities is NOT confirmed by a new high in VIX which would provide more inter-market divergence and bullish potential for equities.
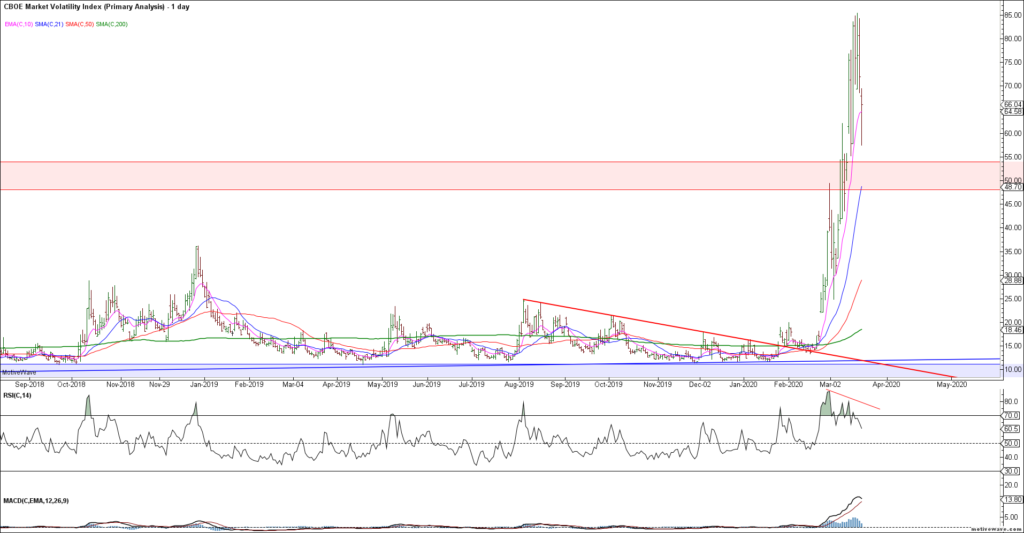
VIX traders remain marginally short.
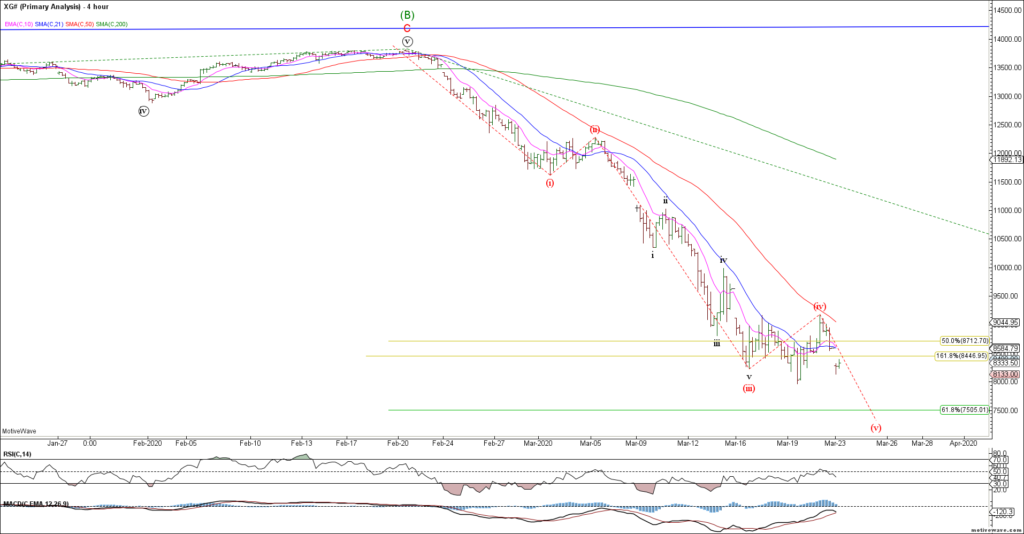
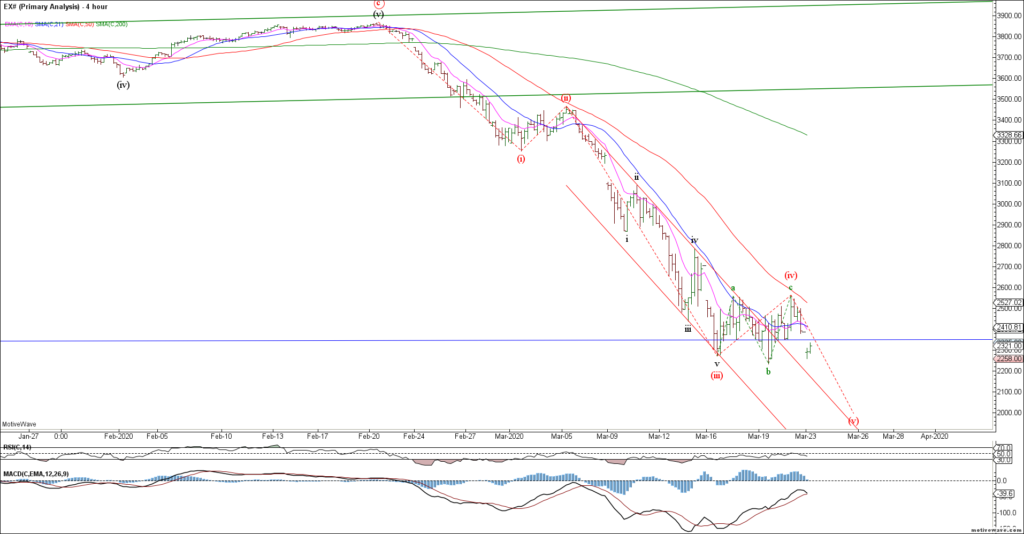
To the global equity markets and like the US, we see evidence of 4th wave consolidation prior to a 5th and final wave down. A 5th wave thrust to new lows in ESTX and DAX could potentially complete the impulsive decline as we look for evidence of a tradable low.
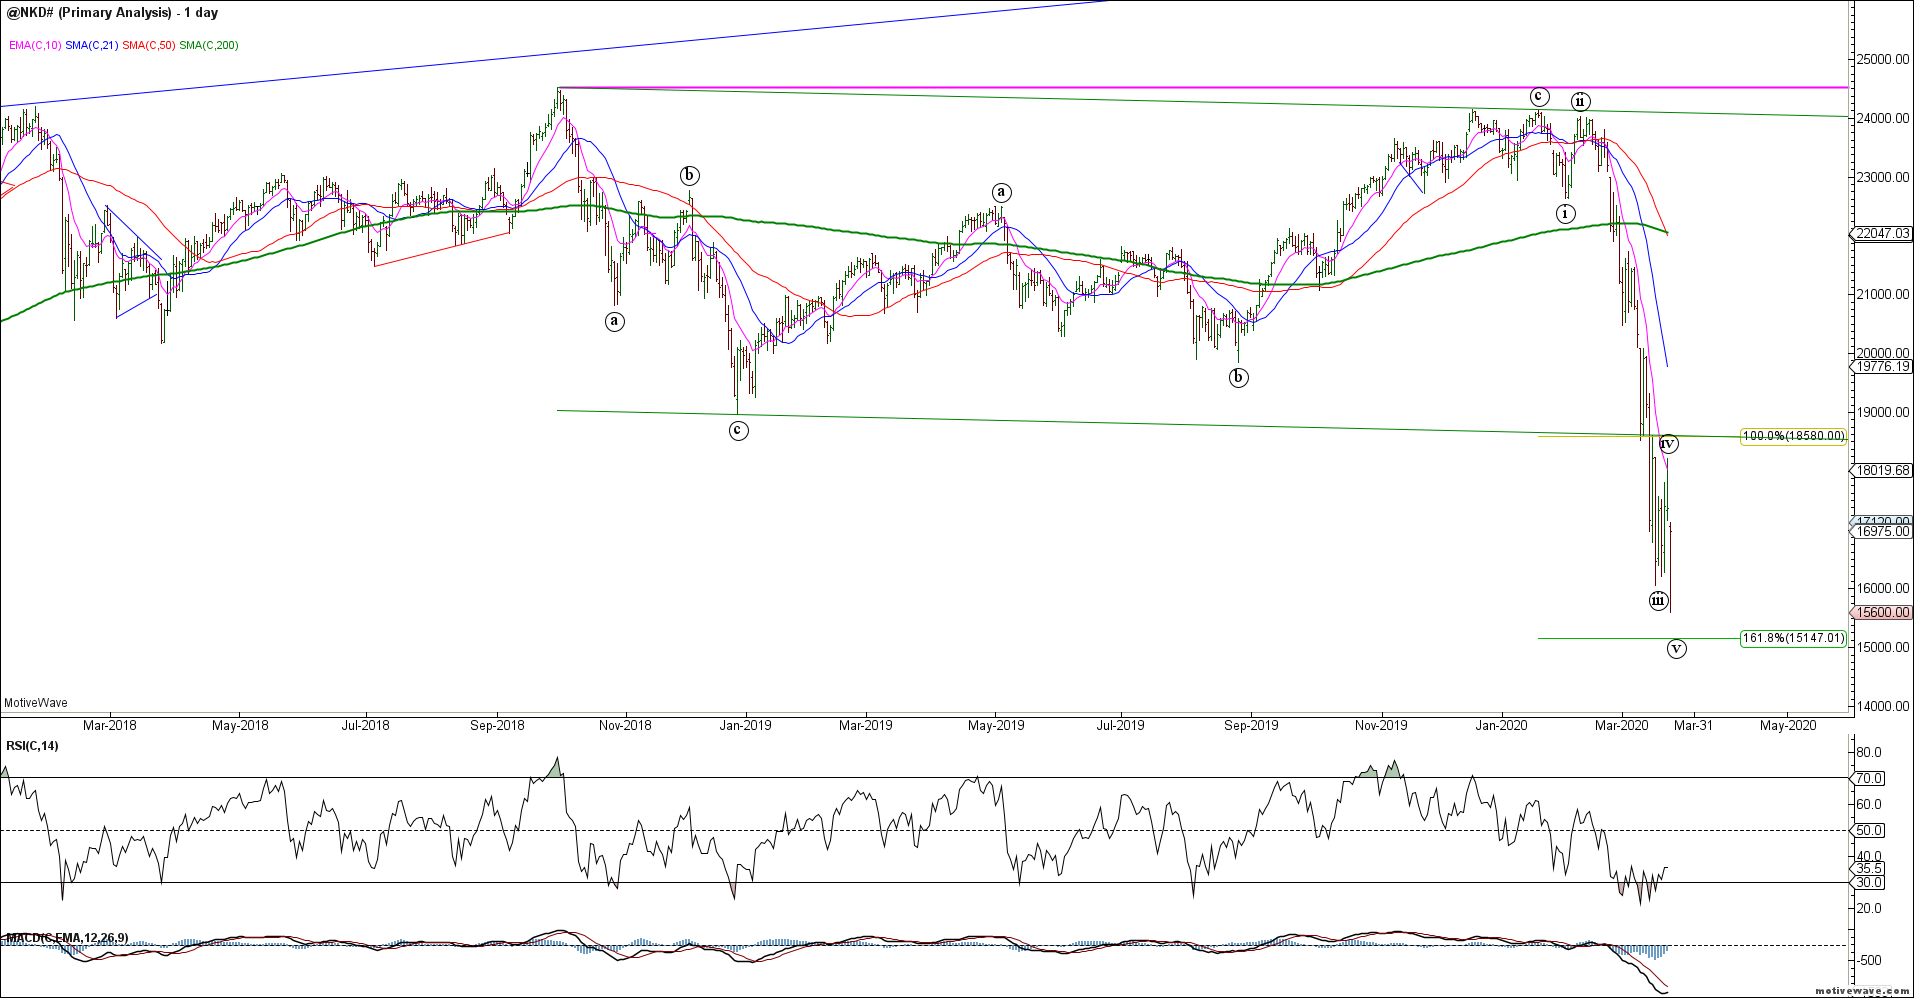
The NKD thrust to new 5th wave lows this morning and may have completed its most recent decline. Looking for evidence of a tradable / hammer low with upside follow through.
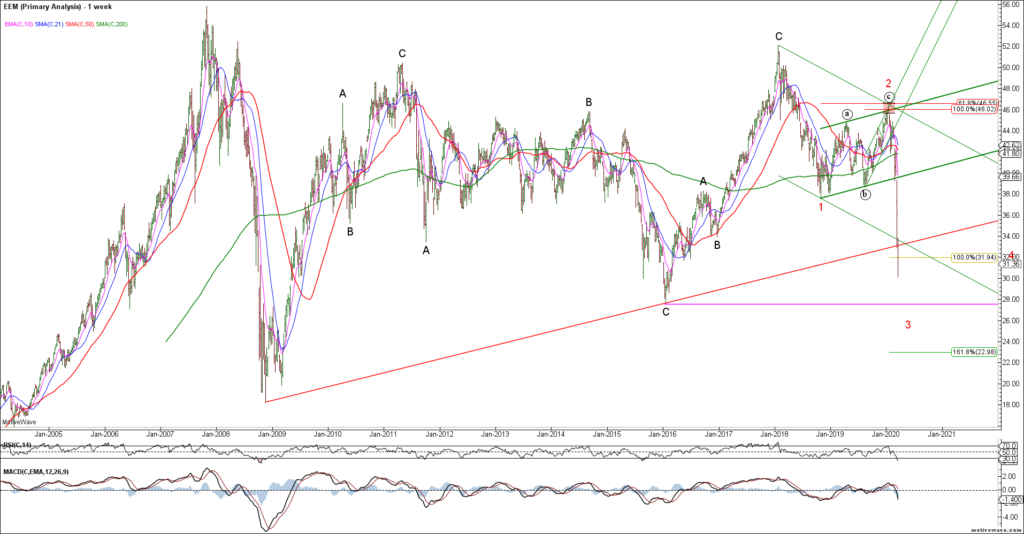
The EEM broke trend support and continues to be pressured by a strong US$. Despite minimum targets being met, this chart remains bearish until proven otherwise.
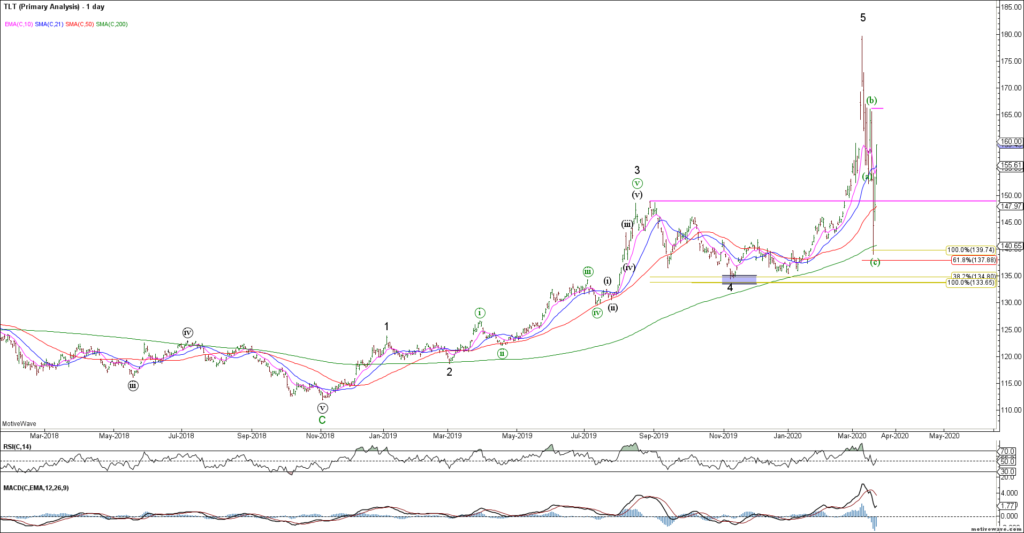
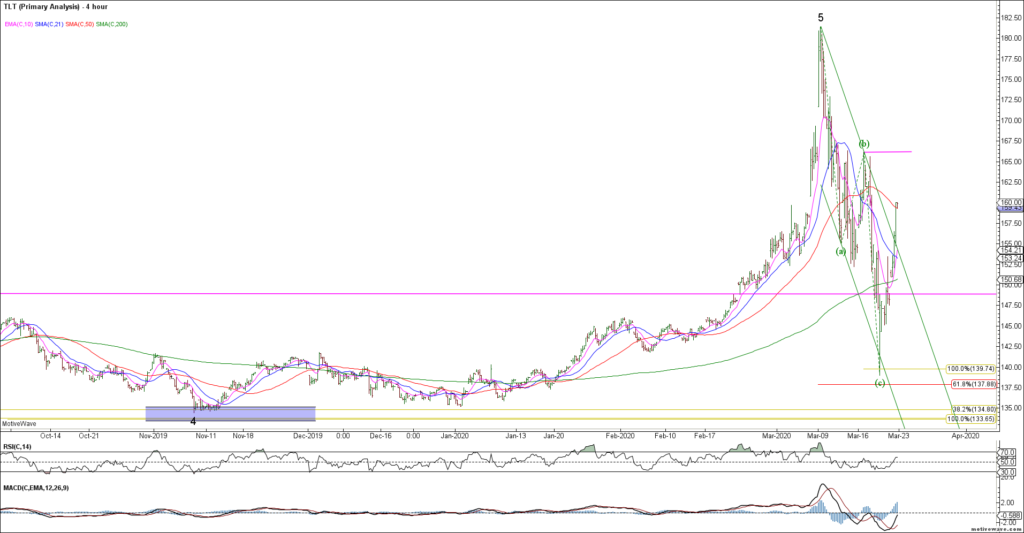
To the bond markets and last week saw a sharp decline as RV funds liquidated. The TLT appears to have declined in 3 waves of equality so far into the 61.8% fib support. This tells us that so far, the decline is corrective from a bigger picture perspective and the trend likely remains higher while last week’s lows hold. Obvious 2-way risk here given market volatility but prima-facie we should probably expect new lows in rates going forward.
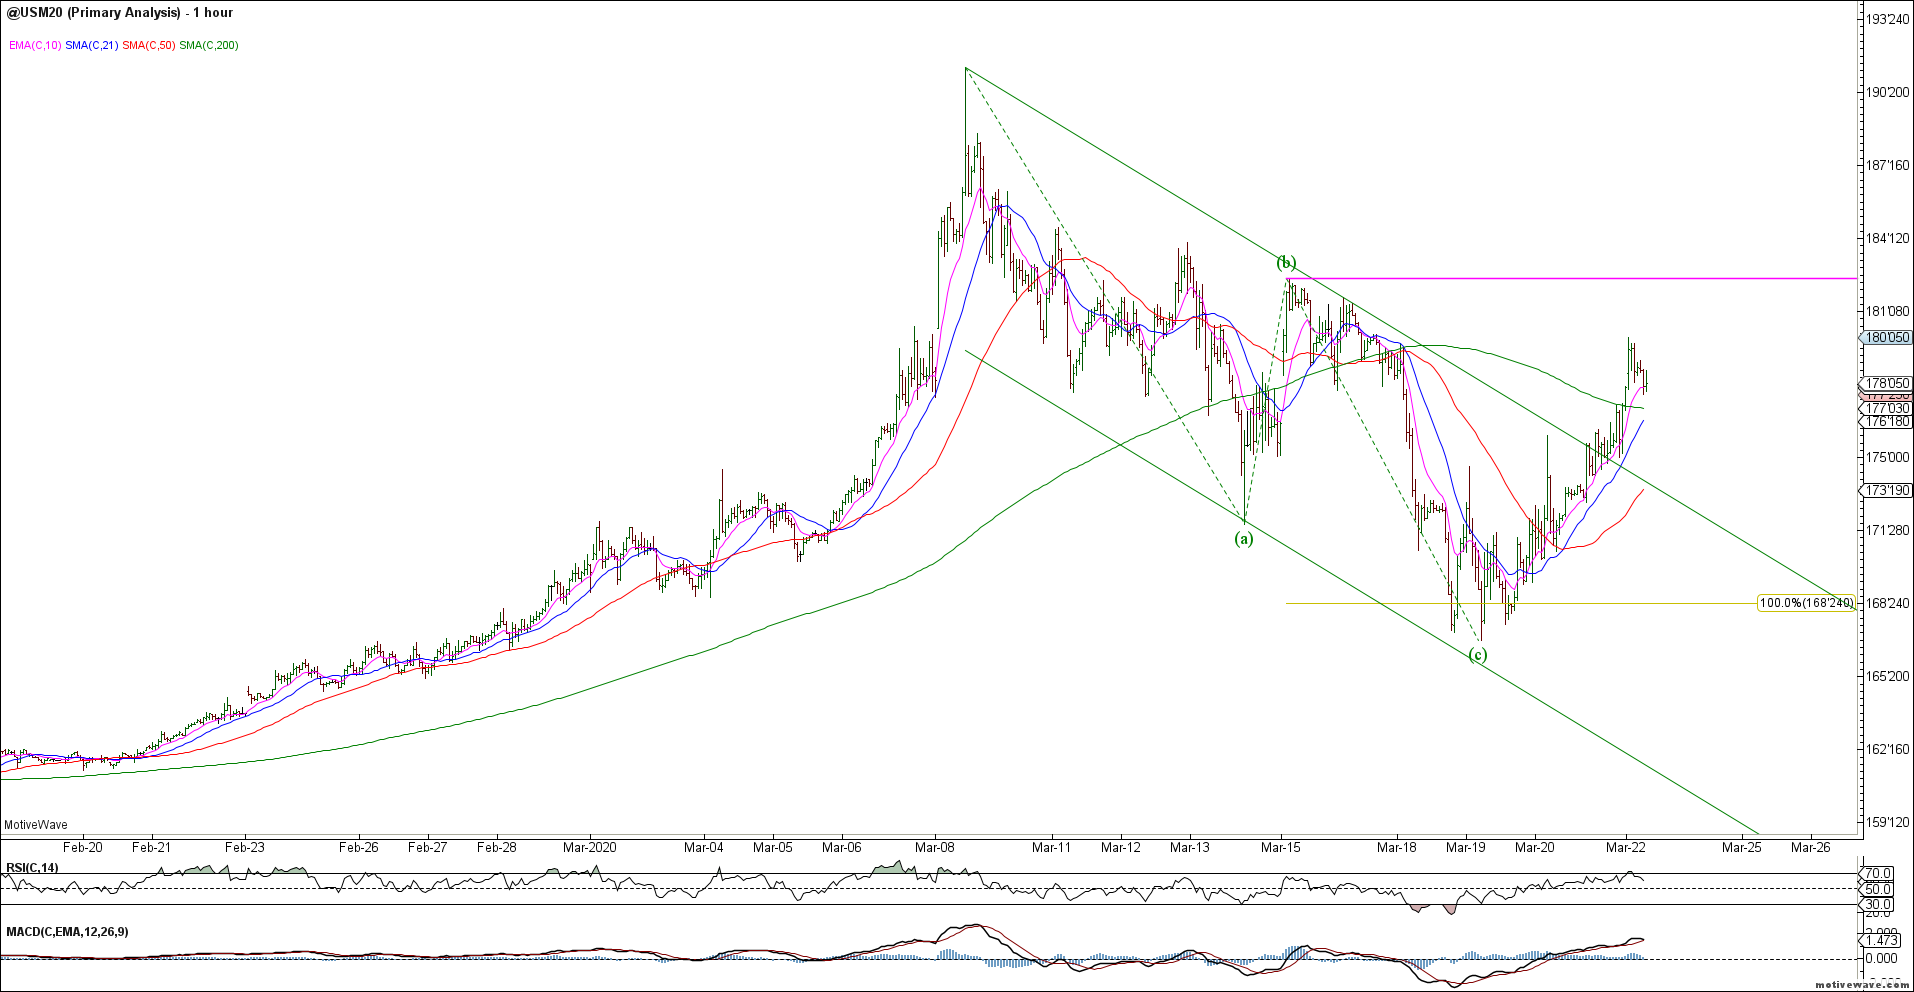
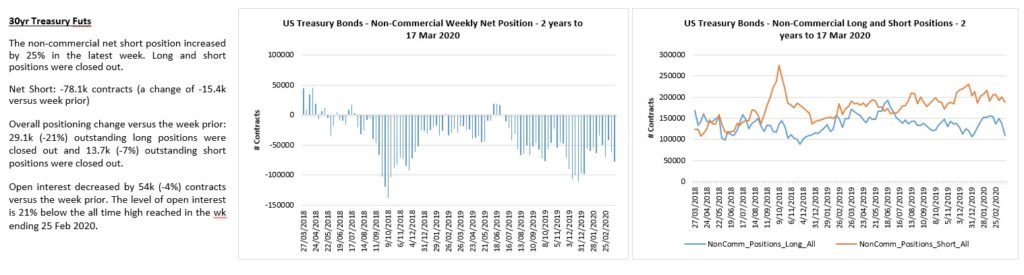
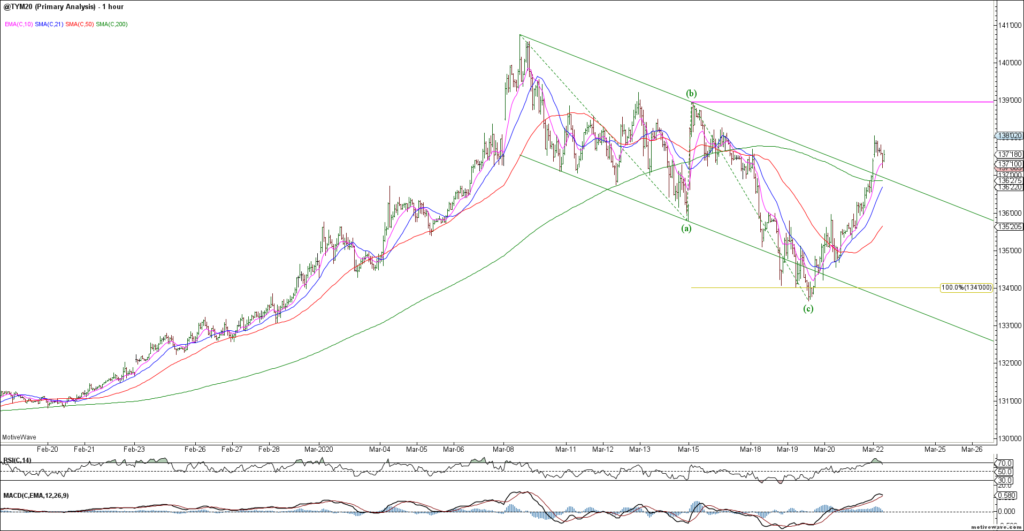
The US 30yr / ZB decline appears corrective as it stair stepped lower last week. This is a difficult environment for bonds given the cross-currents of deflation and massive stimulus and forced liquidations. So far, it’s an a-b-c decline but bulls need to clear wave (b) resistance to confirm a corrective decline.
Last week saw a sharp decline in ZB longs.
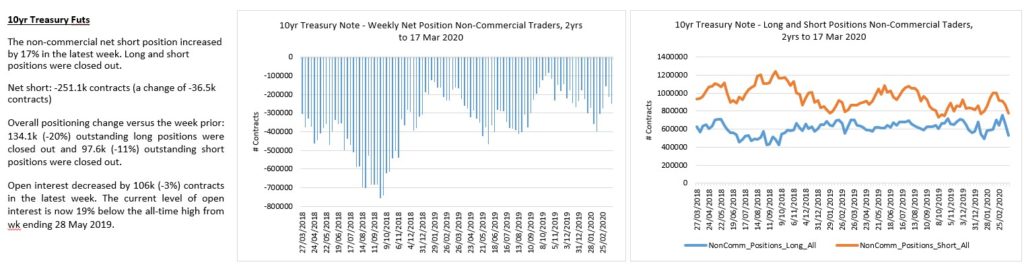
The TY shows the same corrective decline of equality but needs to clear wave (b) resistance to help confirm. It could also be part of a larger correction so 2-way risks remain in these volatile times. Tread lightly.
TY longs and shorts have been liquidated.
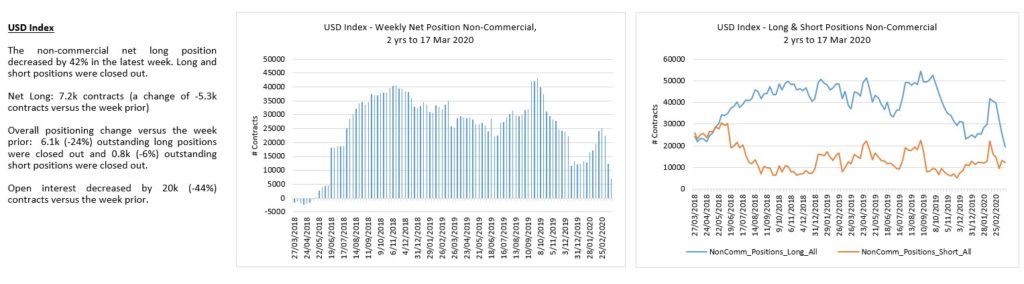
To the FX markets and the US dollar is at a key inflection point across many crosses. The DXY broke higher above 100 as warned and is now testing major cycle highs. The US government will try to weaken the dollar so we should expect extraordinary measures to do so. Resistance is resistance until broken and the wave count is binary here. Bullish green count on a strong close above 104 likely sees a wave 3 extension higher. The red bear count sees an impulsive rejection of major swing highs.
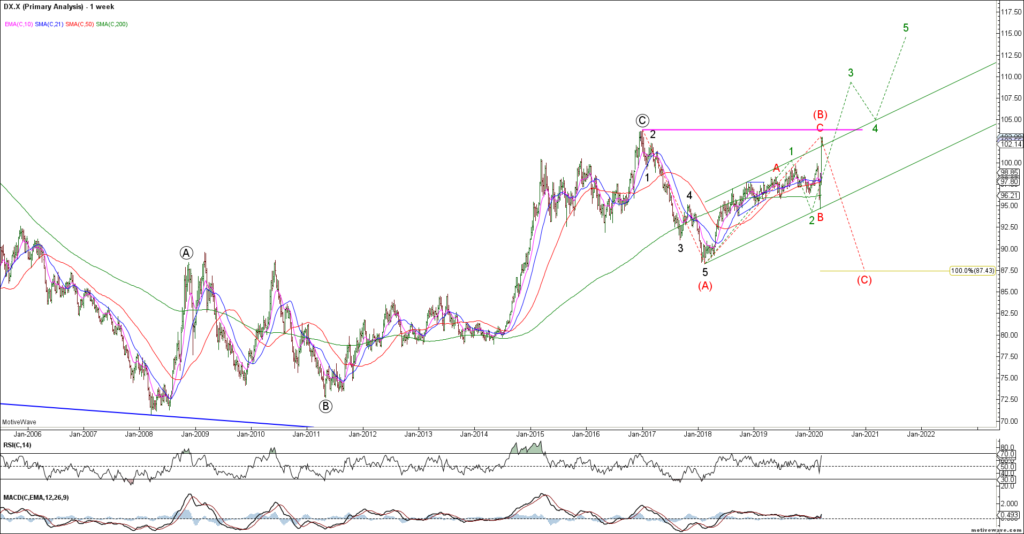
DXY traders cut longs and shorts amid the volatility.
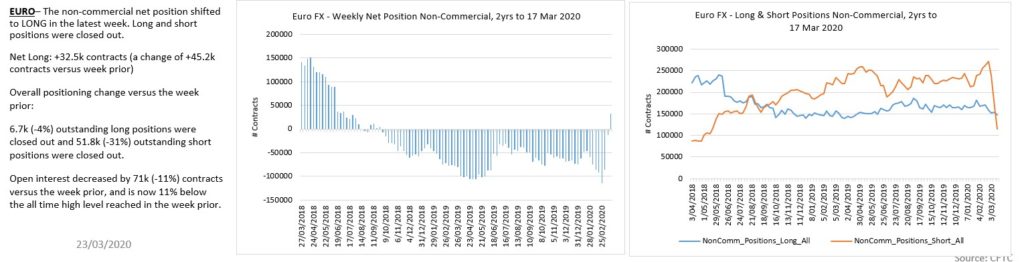
The Euro also broke near term support and is now testing major support (key inflection point). If support breaks it likely trades through 1.00 towards 0.95 but support is support until broken. Too much 2-way risk for me as we could break either way. If in doubt, stay out and let the market confirm.
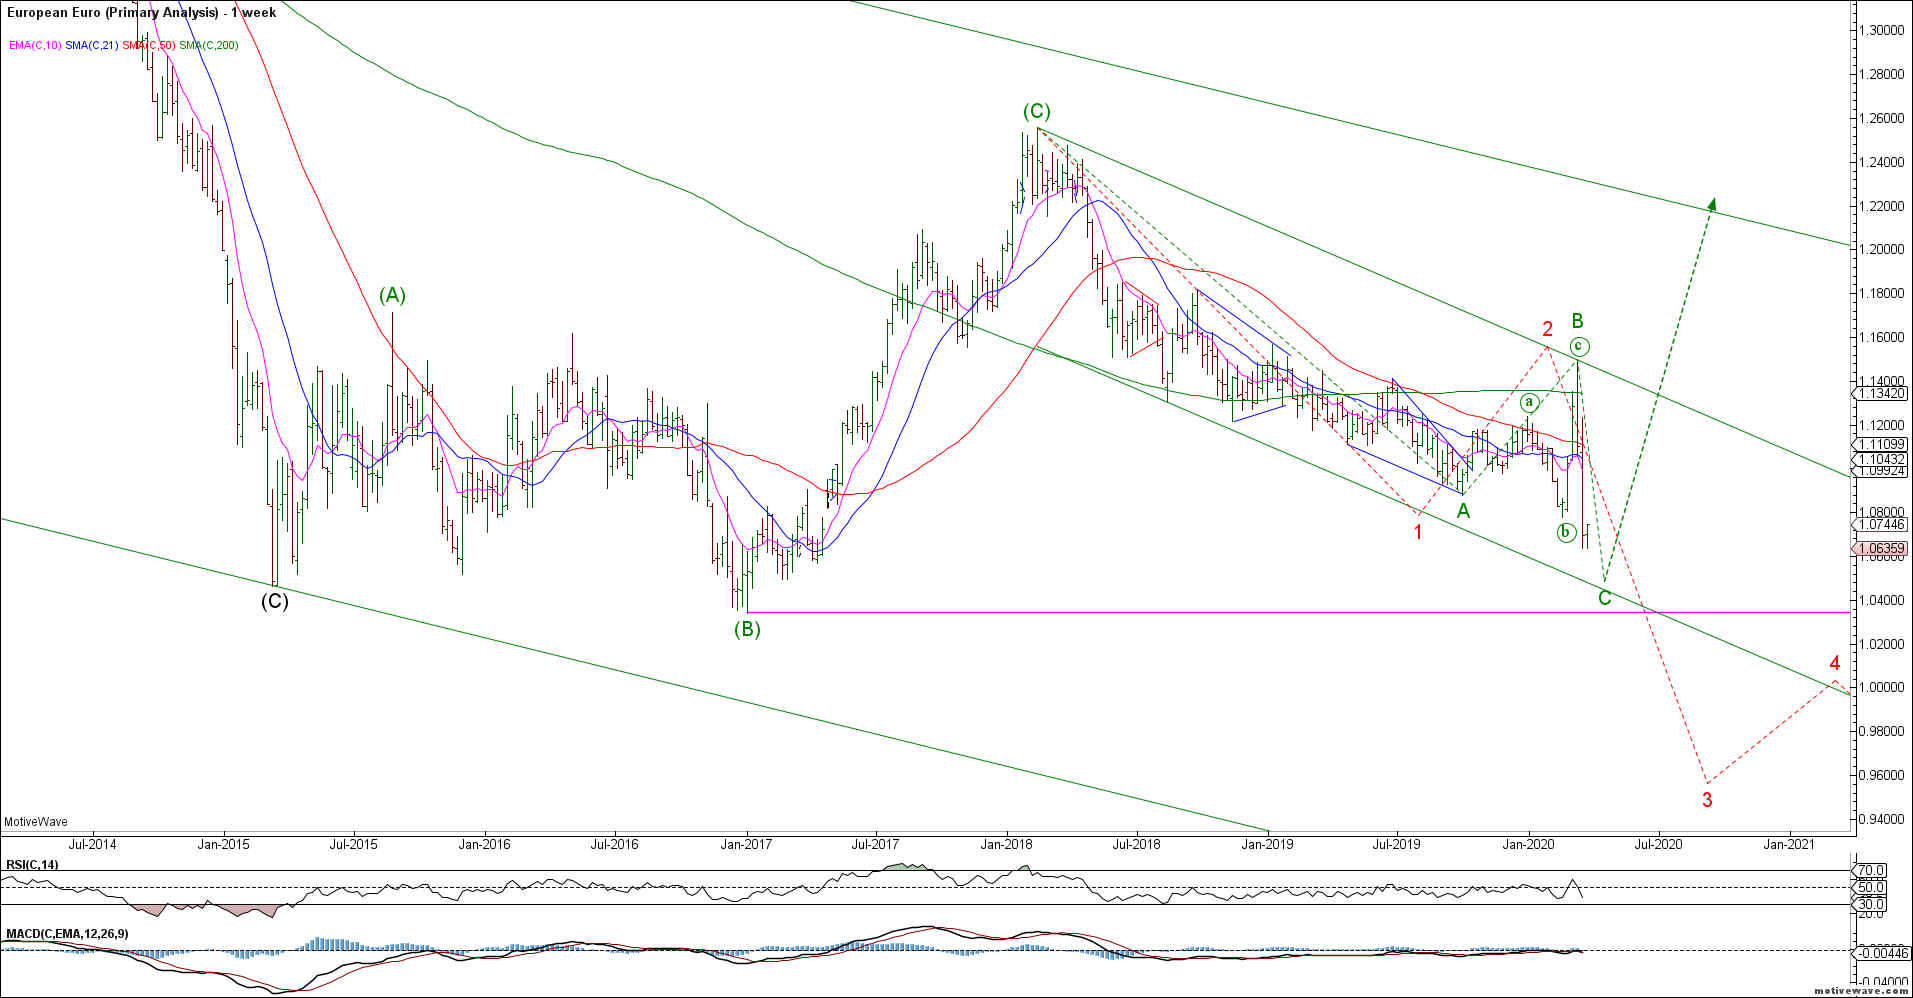
Euro traders have been whipsawed over the last week.
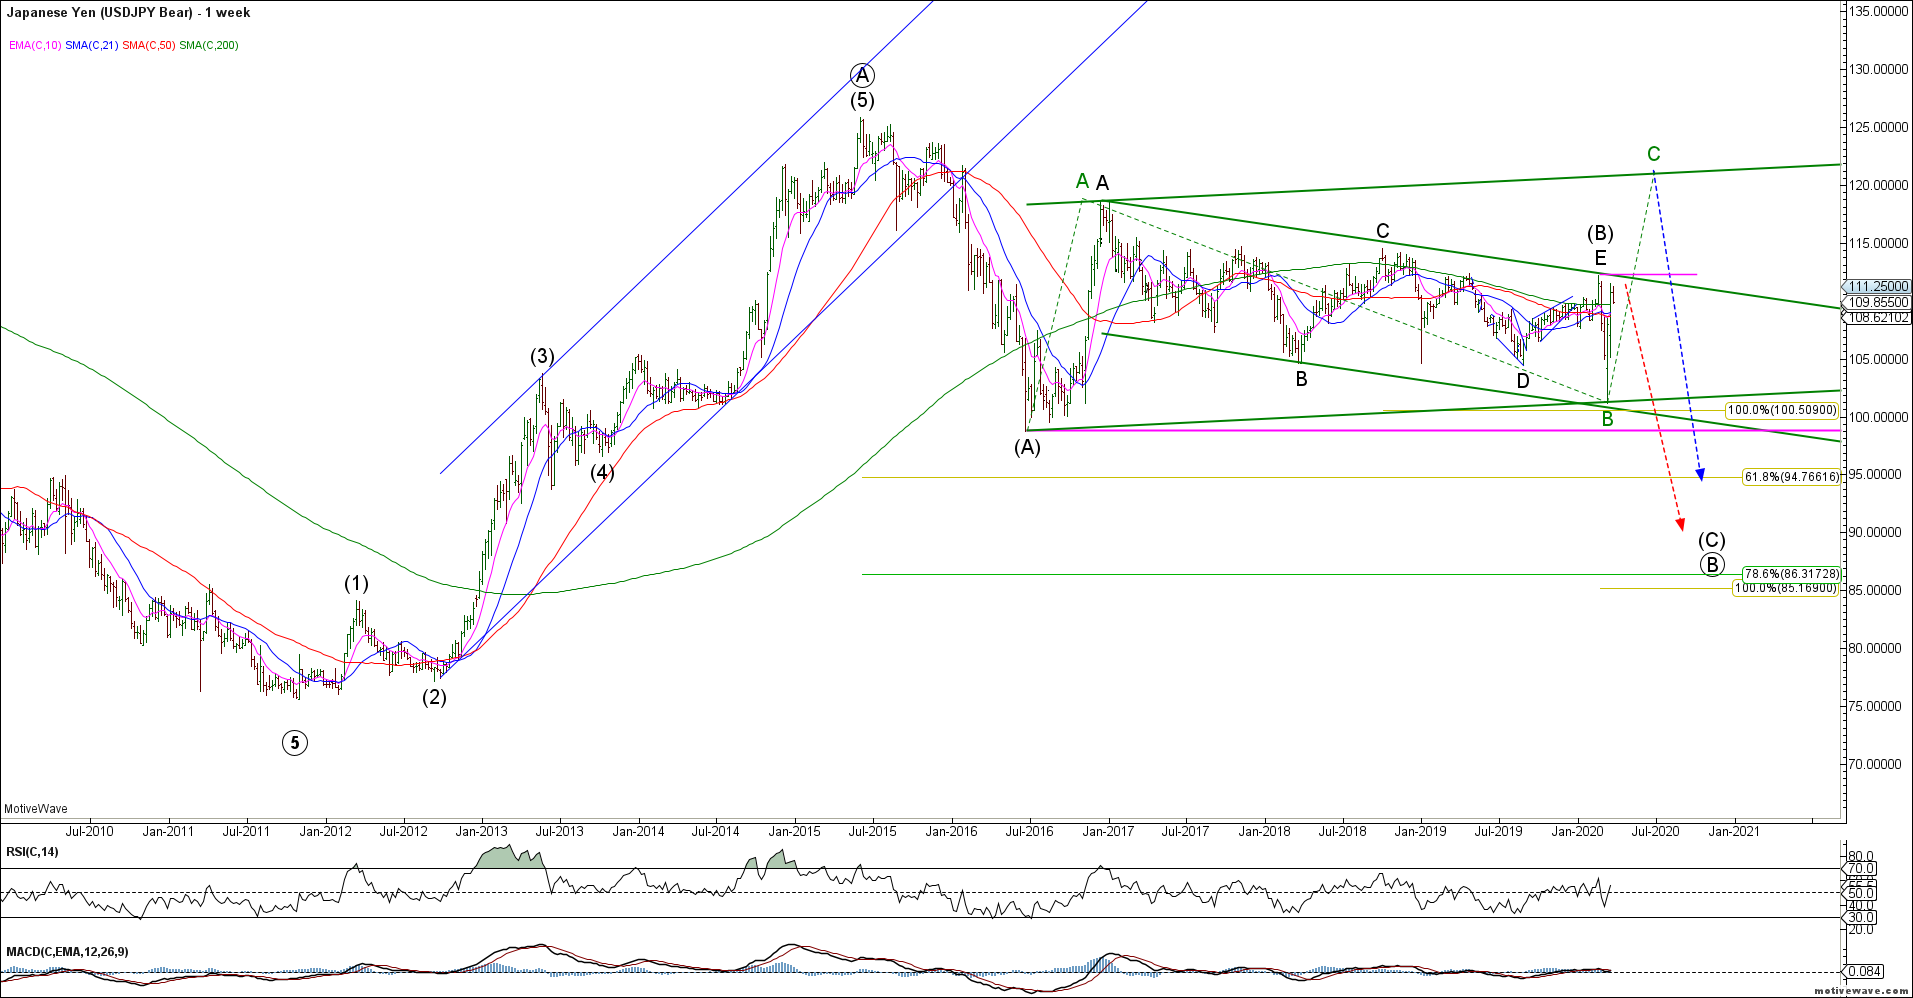
The USDJPY continued to push higher above near term resistance and is retesting key swing highs for the triangle bear count. Trade above 112.30 opens the door towards 120 on a continued US$ rally. Key inflection for the dollar here against the Yen and it is unclear which way it breaks. Not trading this until I get confirmation either way.
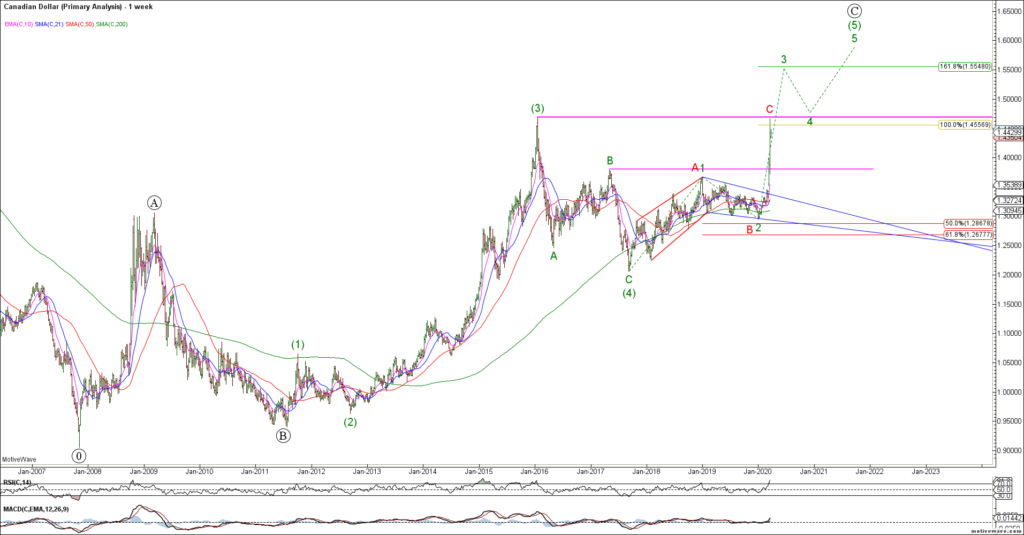
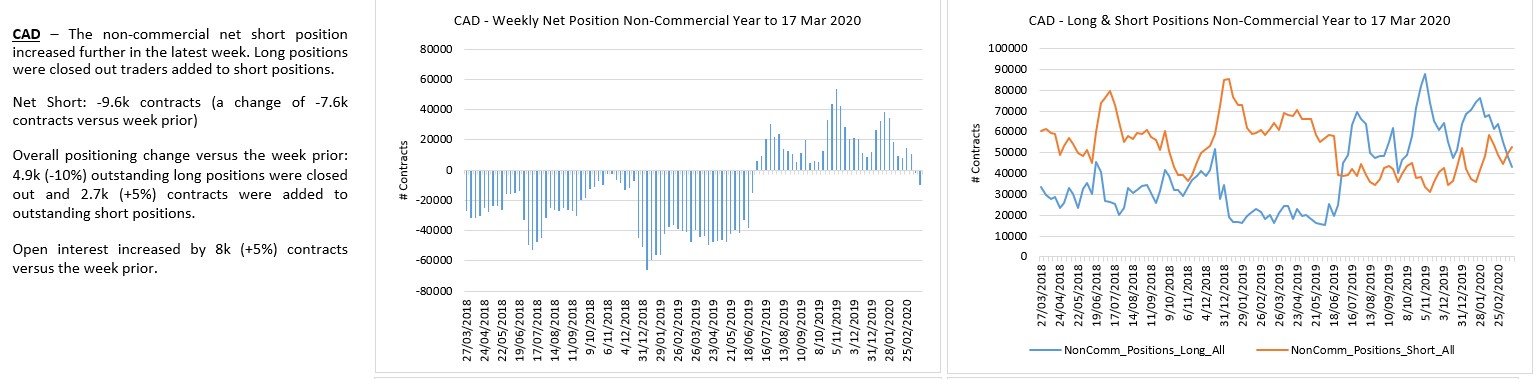
The USDCAD also tagged major resistance last week, a key inflection point for the dollar.
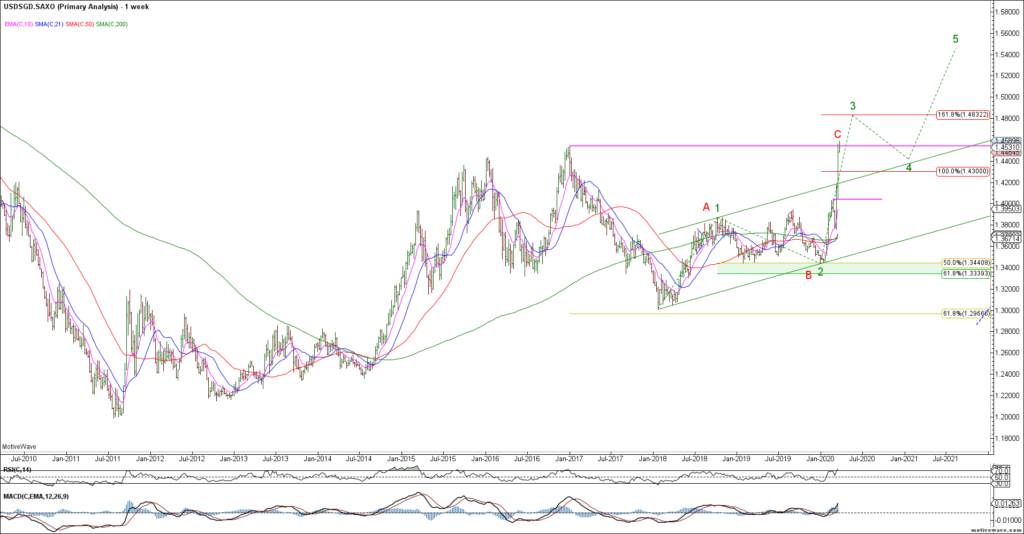
The USDSGD met our measured targets and is trying to break through major swing highs. Reverse or continuation? We can make a case for both scenarios but risky either way.
To the commodity markets and CL is retesting swing lows after bouncing last week for what was likely a wave (iv). Ideally, we’d like to see a push to new cycle lows to complete wave (v) followed by a bullish reversal. We are approaching near term trend exhaustion in Crude as we look for a final flush and bullish reversal.
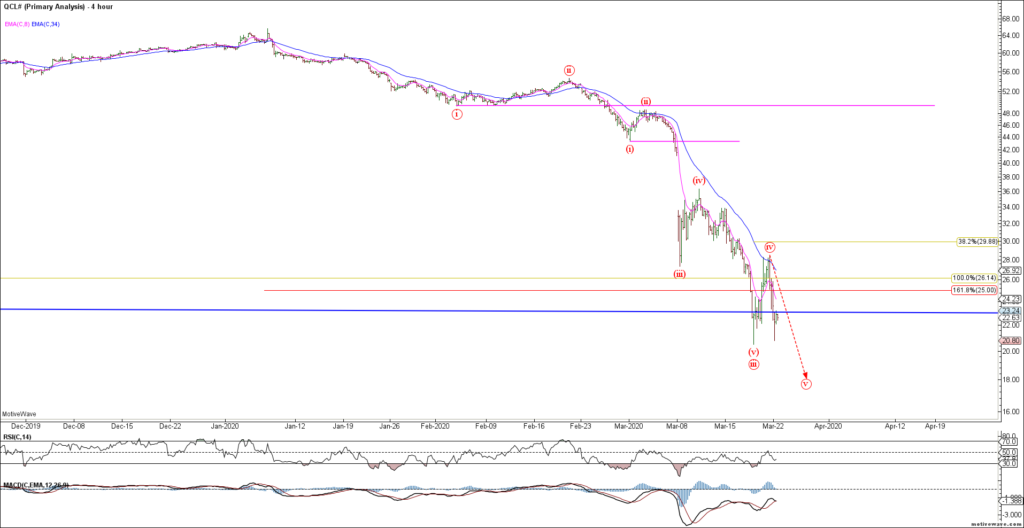
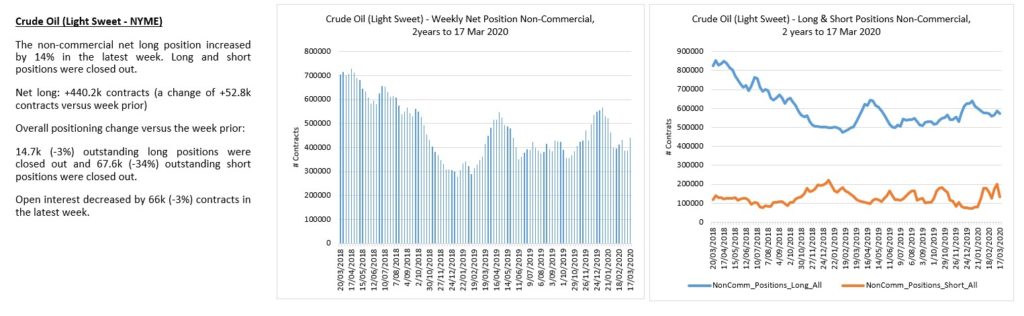
Crude traders remain too long despite the recent severe decline.
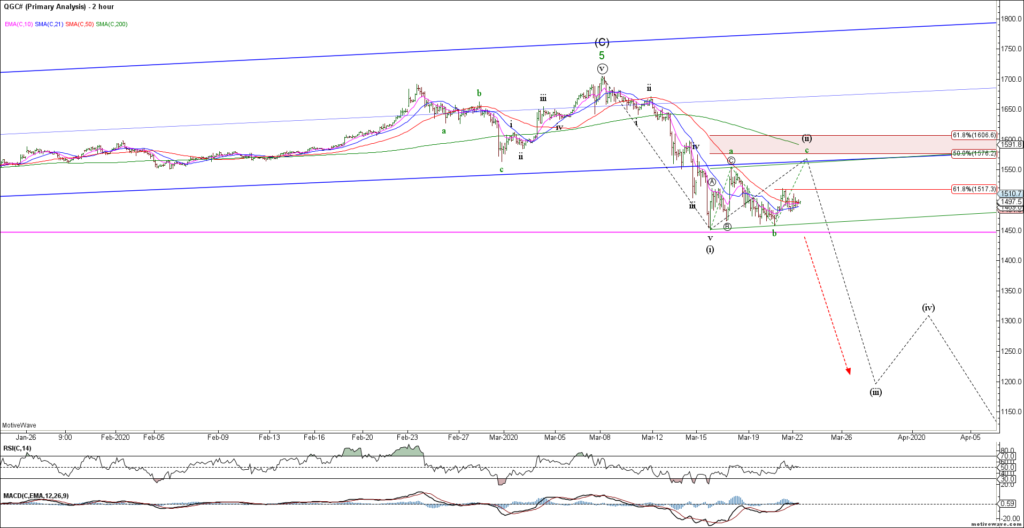
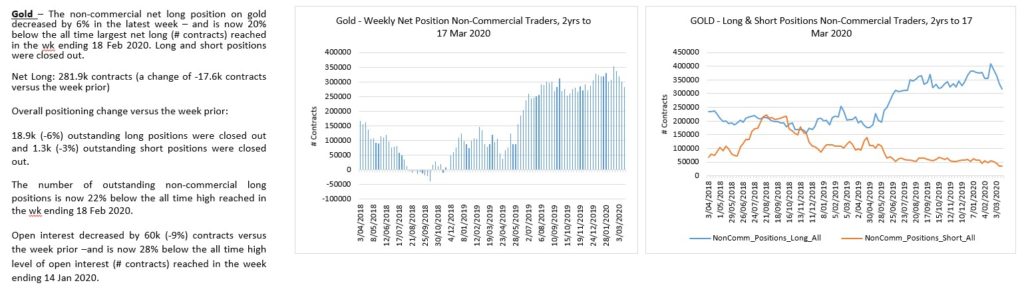
Gold consolidated above support last week after declining impulsively from recent swing highs. The bigger picture structure remains bearish but needs to break 1440 to help confirm the break lower.
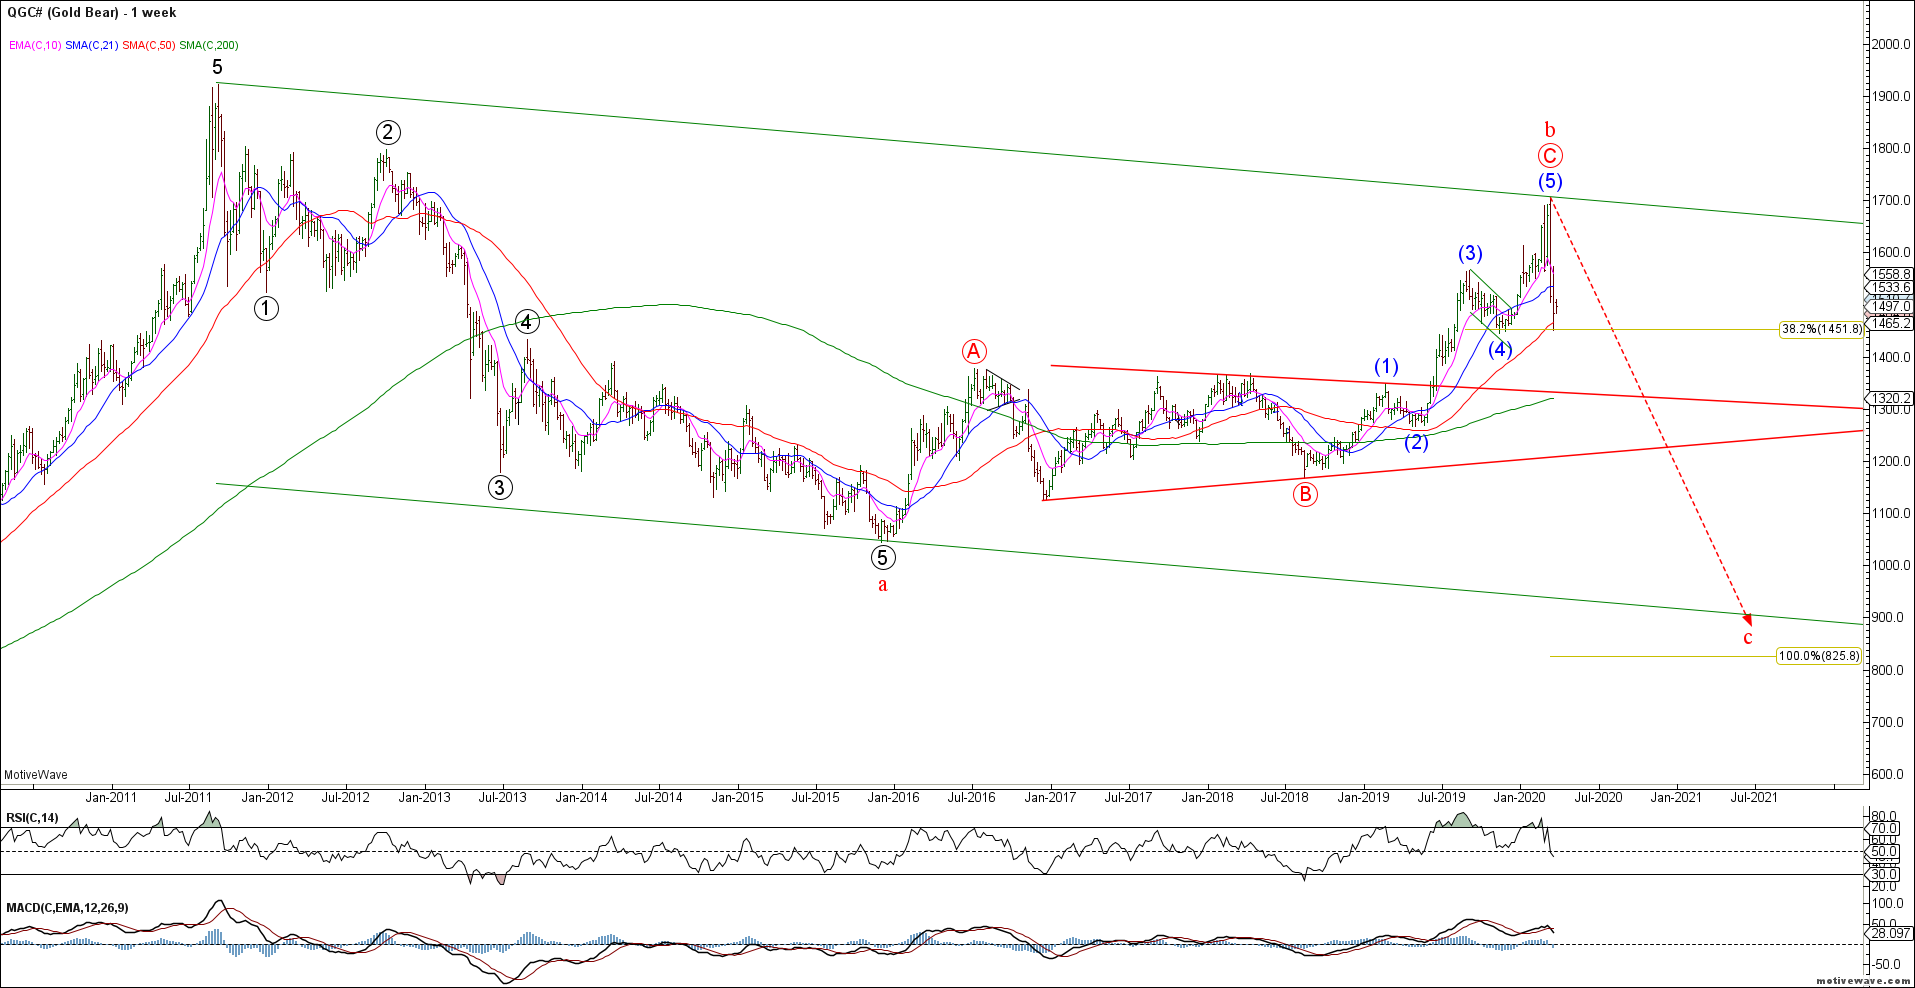
Near term, Gold declined impulsively into shelf support from where we have seem a corrective rally. A close below 1440 likely triggers the next wave lower, either directly or after another rally towards 1575-1600 resistance.
Gold traders are starting to pare back longs.
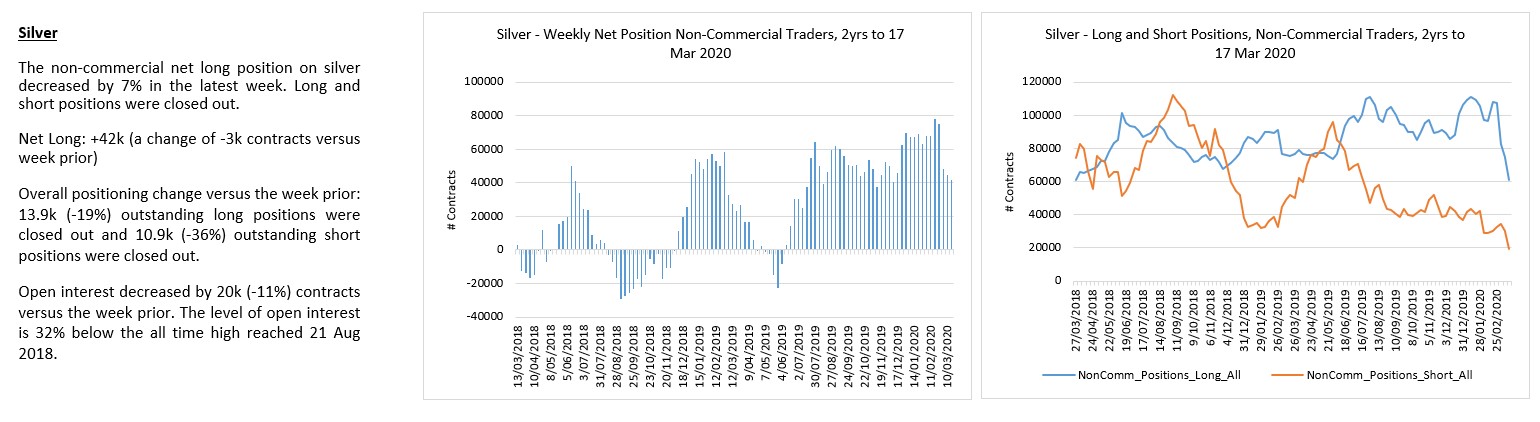
Silver remains bearish and would look best with a wave (v) decline to new cycle lows.
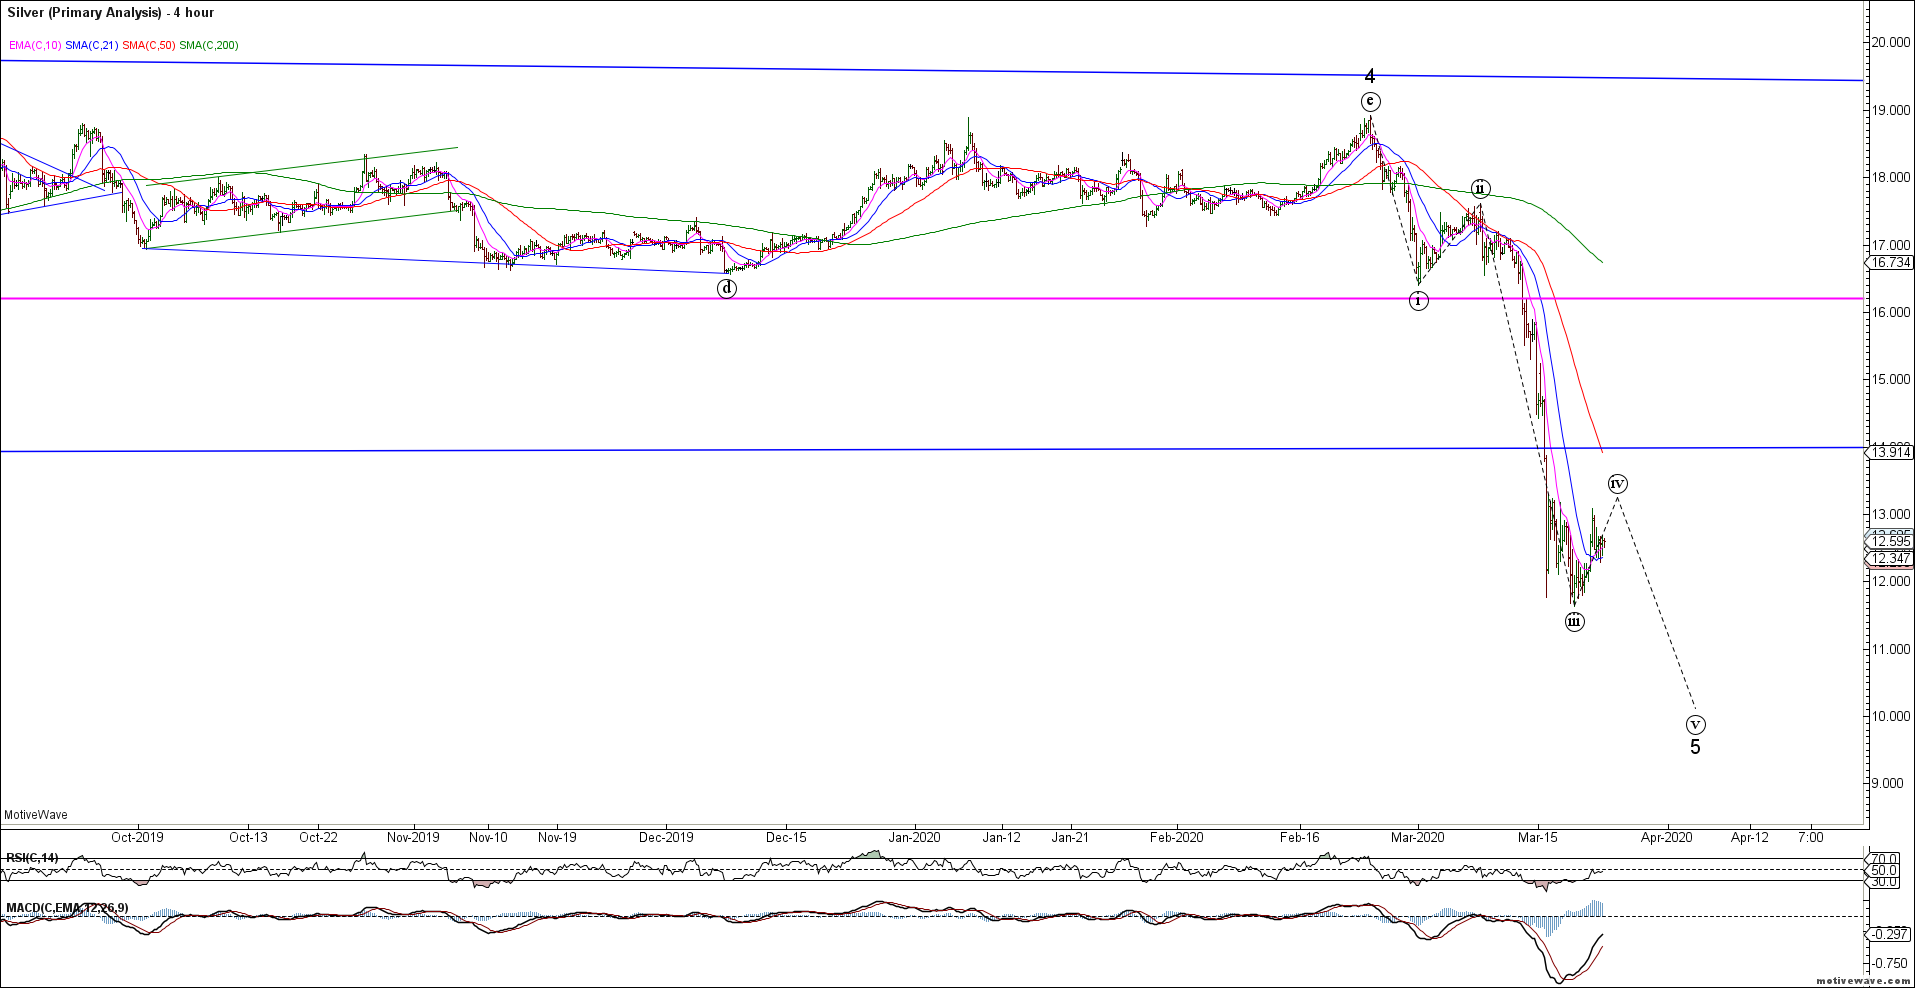
Silver longs and shorts have liquidated.
That’s all for now folks. Trade safe 🙂
