Market Update: July 25th, 2016 – Bearish Bonds
There’s not much to add since my last update as equity markets have continued to rally to new ATH’s as expected while the US$ remains strong and commodities take a much deserved breather. The most important chart to me at the moment is the US bond market. The reversal lower from ATH’s in price appears impulsive, setting the stage for a potential major BEARISH reversal in bond markets.
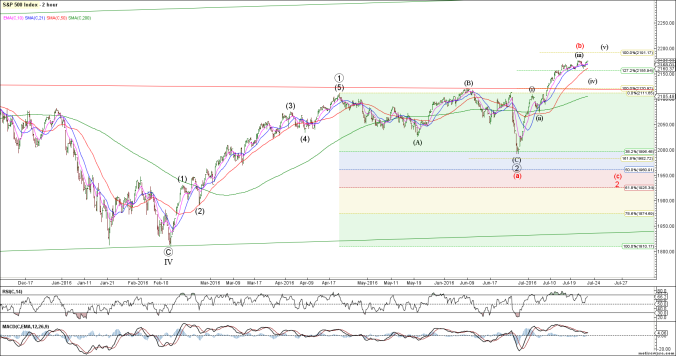
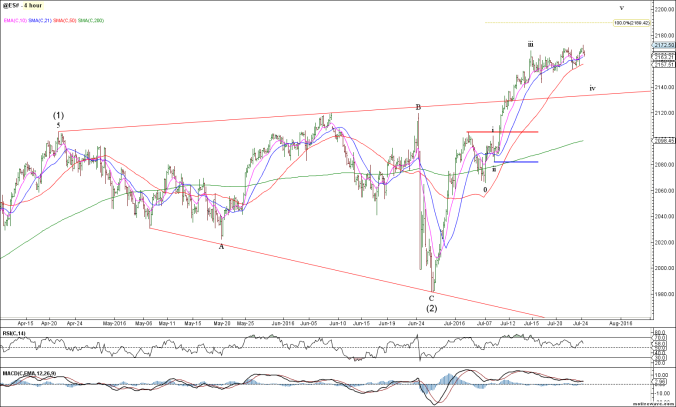
To the SPX and so far, the rally from the late June lows is in 3 waves and needs a small degree 4th and 5th wave higher to complete an initial impulsive rally. Therefore prices must maintain this breakout above 2120 to keep bullish momentum. The theme from my last update was higher now or higher later and this has not changed. The red expanded flat count is only relevant if we were to reverse down hard from these levels which is not my base case. Higher highs and higher lows is the very definition of a bull market trend.
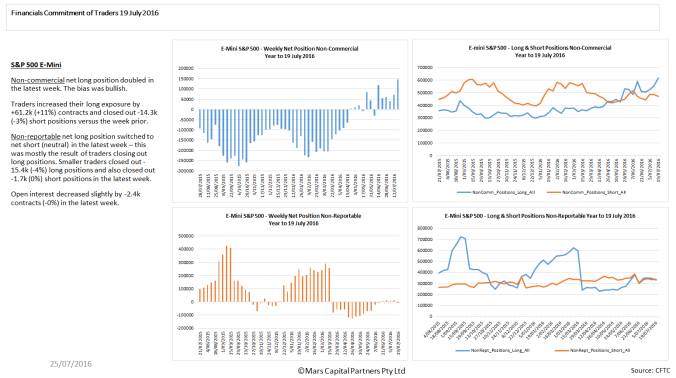
It appears that investors / hedge funds are finally getting bullish on this rally for the first time in a long time…
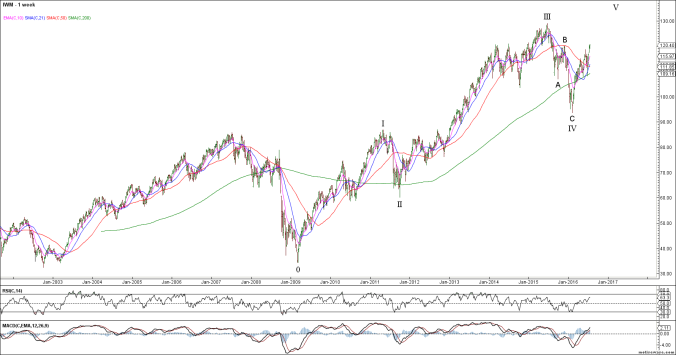
Bigger picture, we remain in a bull market until proven otherwise – the rally in IWM above the wave B high “locks-in” 3 waves down (corrective) and confirms the bullish case looking for new ATH’s.
The European equity markets continue to hold key support and have begun to rally impulsively. I see no reason to be bearish any equity markets while the February lows continue to hold. There is significant upside potential for the European equity indices as the entire decline from the 2015 highs is in 3 waves (corrective).
While the Dax is approaching near term trend resistance, I expect it to break to the upside in line with global equity markets
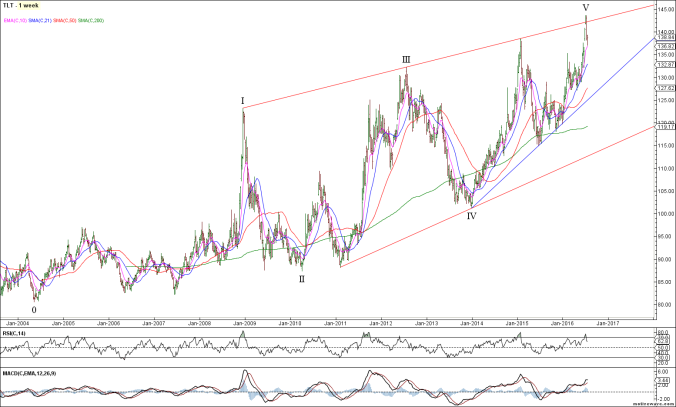
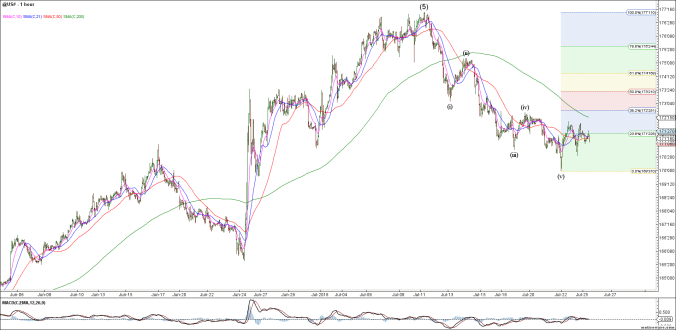
The most important charts right now may be the US bond markets. The TLT broke above the long term Ending Diagonal trendline and reversed lower (throwover). This is a classic EW topping pattern.
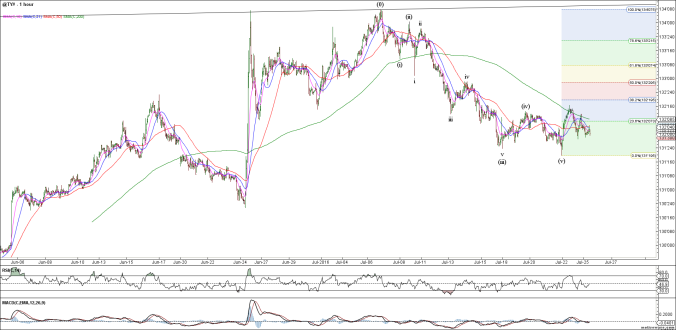
Importantly, the decline from the recent ATH’s in bond prices appears impulsive and could signify a major trend change in the US bond market. I will be looking for a 3 wave counter-trend rally towards the 0.382-0.618 retracement area to aggressively short US bonds. I am looking for a MAJOR trend change. The impulsive decline can be clearly seen on the TY and US bond futures…
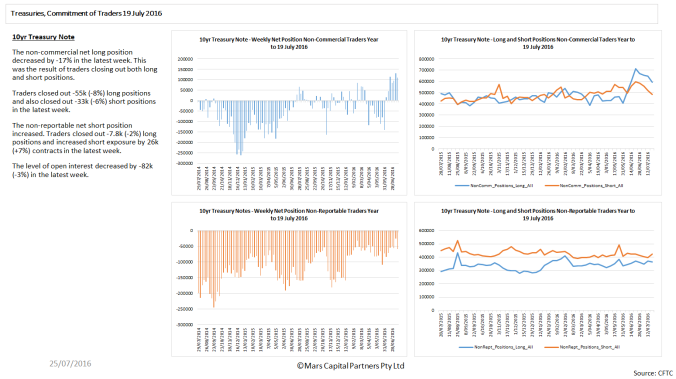
It also appears that investors remain long Treasuries in their search for yield
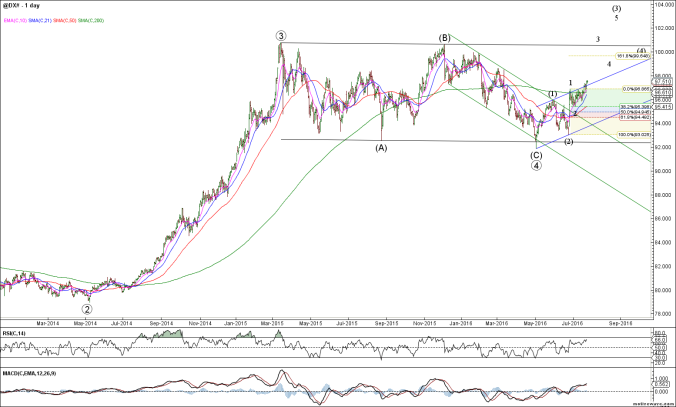
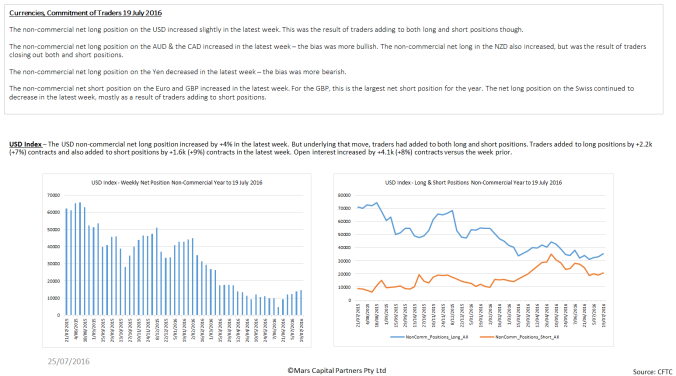
To the FX markets and I remain bullish the US$. Near term, the 200 sma is likely key support for an acceleration higher in a 3rd wave. Close below the 200 sma will likely mean we back and fill before the bull trend can reassert itself. That is my near term line in the sand. Either way, I am still looking for 102+
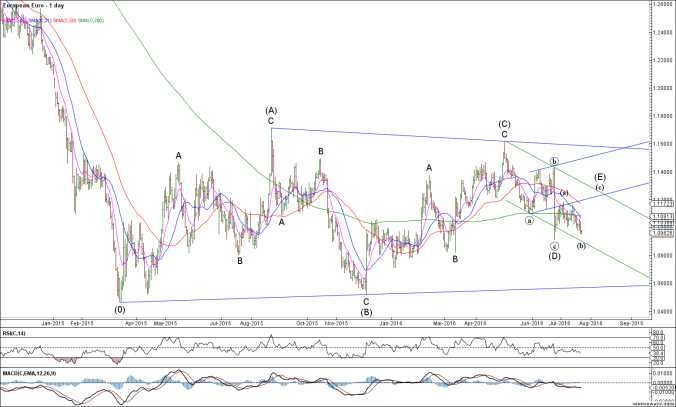
The structure of the Euro allows for 1 more push higher towards 1.12 before the bottom falls out. The alternative is that we just accelerate lower from here on a break below 1.09 – My bigger picture targets for the Euro are way lower… my concern is that investors are starting to pile into the short Euro trade
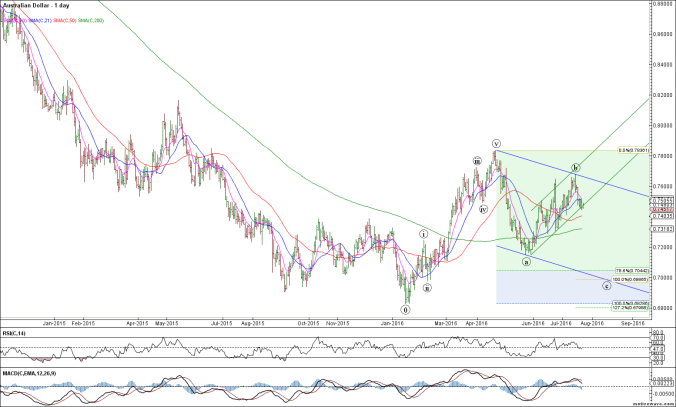
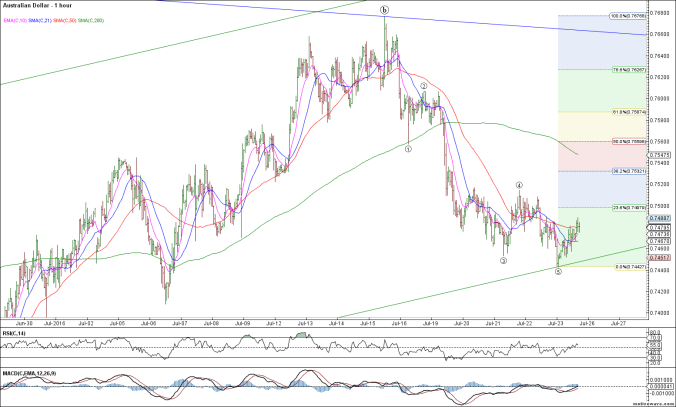
The Aussie$ has remained difficult to trade but remains destined for lower prices towards 0.70 – the recent decline from last week’s 0.7676 highs appears impulsive so I will be happy shorting against this level on any near term counter-trend rally. I remain bearish the Aussie$.
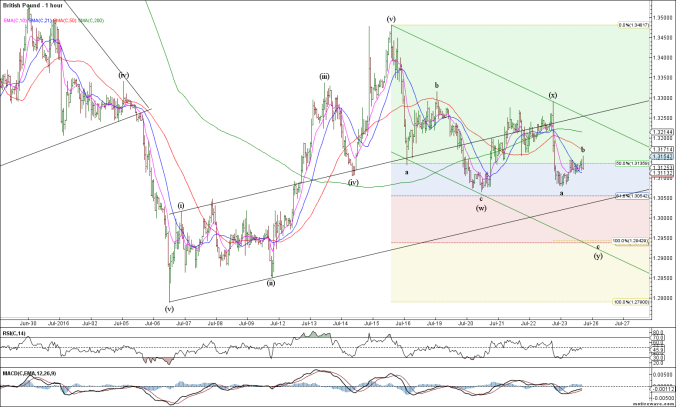
The near term chart of the GBP is interesting as we look for lower prices to get long. The rally off the 1.2790 Brexit lows appears impulsive and the decline corrective. I will be looking to go long the GBP around the 1.2950 target area and measured support against the Brexit lows targeting back above 1.35.
Max GBP bearishness also appeals to me…
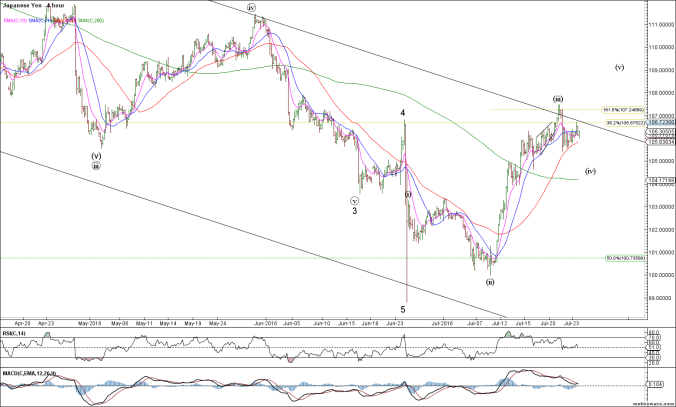
Interestingly, like the ES and SPX, the USDJPY has only rallied in 3 waves so far from the post panic Brexit lows. We require a new high above 107.50 to “lock-in” 5 waves up and a potentially significant change in trend. So far, wave (iii) is 1.618x wave (i) as I look for wave (iv) support in the 105 area. This is a very important juncture for this pair and the Nikkei 225.
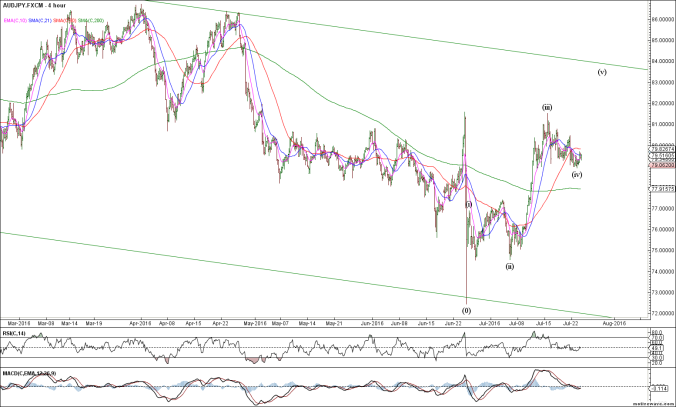
The AUDJPY shows the same structure…
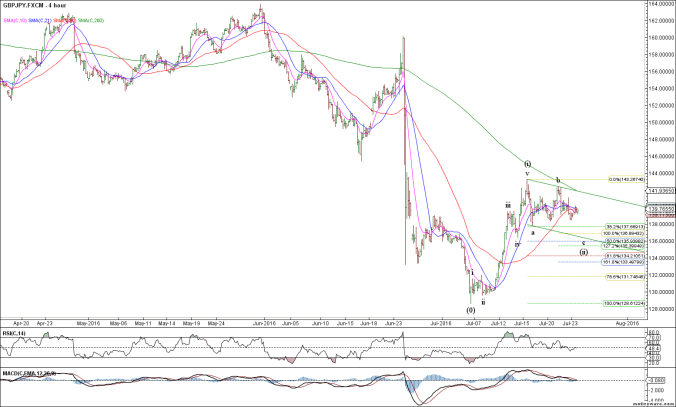
While the 5 wave rally in GBPJPY appears complete and I’m looking at 136 as a good area to get long for wave (iii)…
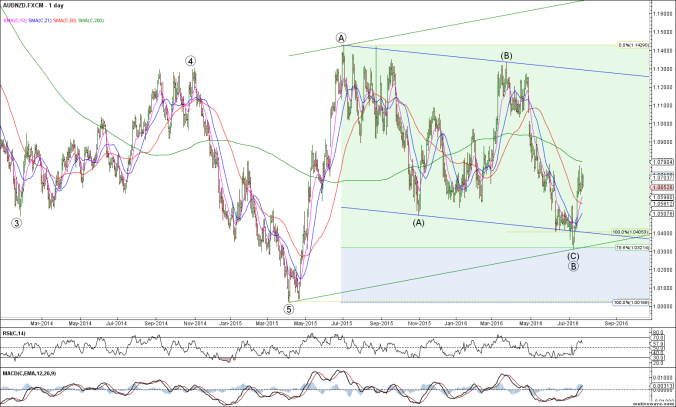
The long AUDNZD trade I highlighted previously also looks interesting given the strong impulsive rally from the 0.786 measured support.
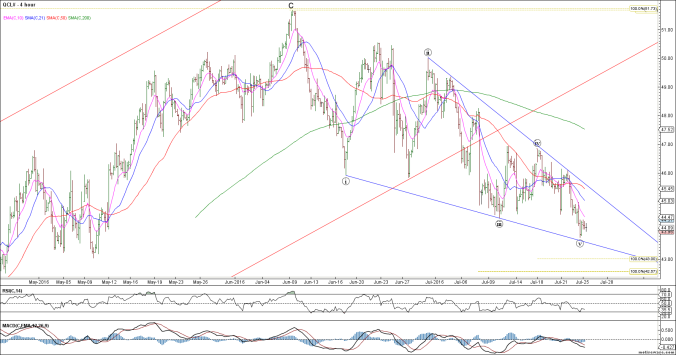
To the commodity markets and it appears that Crude Oil is/has formed a Leading Diagonal from recent highs. Near term, I am looking to get long a bullish intraday reversal targeting $48-50 which may also set up a nice longer term short IF I’m right. I’ll just trade it 1 wave at a time…
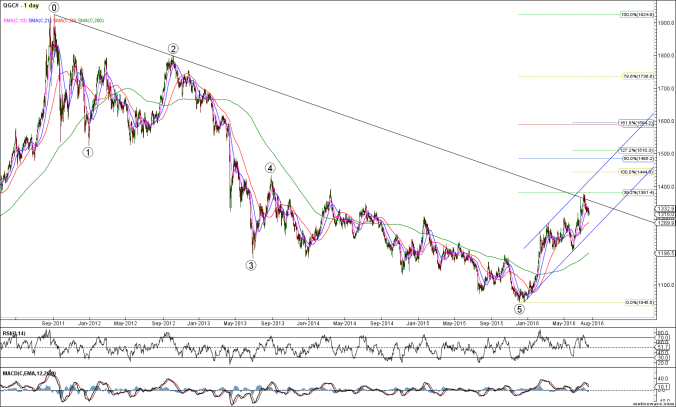
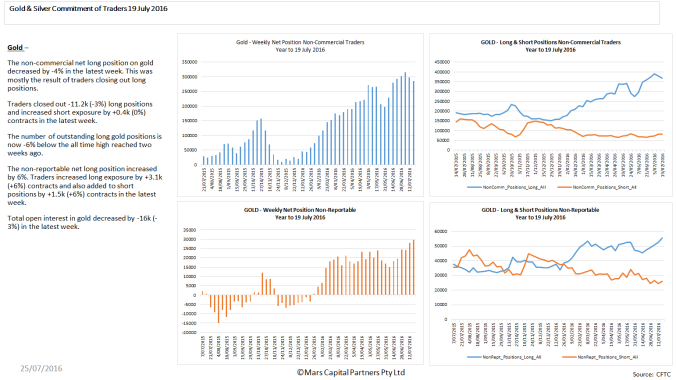
The precious metals have pulled back from recent highs but I don’t have a good tradable setup right now. They appear to be in no-man’s-land. I have no strong views on Gold or Silver here??? Given the continued extreme bullish sentiment, I would be cautious initiating longs until we see a decent pullback despite the fact I remain very bullish long term.
All I know is that PM’s are extended and Gold has been rejected at the 0.382 retracement of the entire decline (natural resistance) – Gold will be very bullish back above 1380
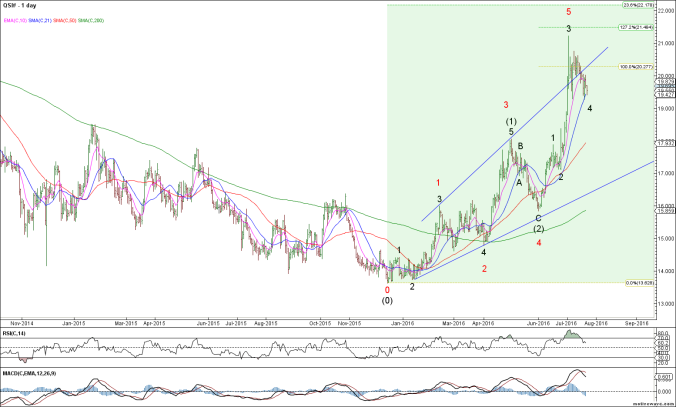
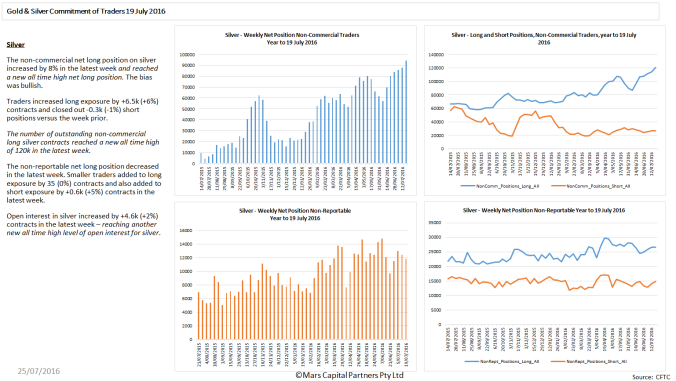
Silver appears more constructive for the bulls but it is unclear whether the rally was a completed Expanding Leading Diagonal (Very Rare – red count) OR if we need another push higher towards 22 to complete wave 5 of (3)? No new trades for me here as the COT data shows extreme bullishness and there are too many folks on this trade for my liking.
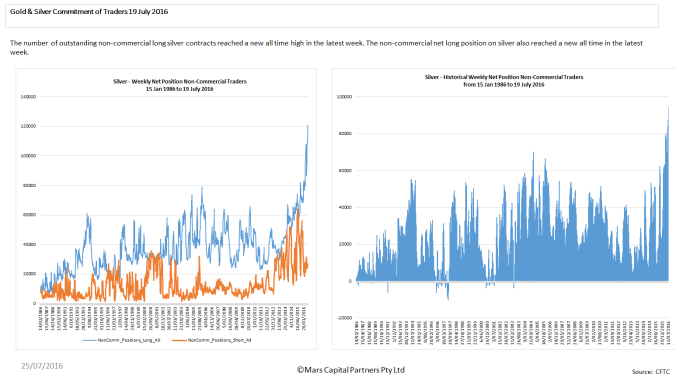
The Silver bullishness is EXTREME by historical standards…
That’s all for now folks. Have a great week 🙂

