The macro review for w/c 21 January 2019 – The slow-down in global trade (and growth) continued to be a key theme from the data last week.
The US data was somewhat stronger, but there were some mixed
results. The two regional surveys showed some improvement in headline
manufacturing activity in Jan after the weaker readings from Dec. But an
underlying theme was that new order growth remained weak and headline output
grew as firms worked through backlogs. That said, the broader prelim manufacturing
PMI for Jan was stronger with domestic demand offsetting weaker new export
orders. The services PMI was mostly unchanged.
US existing home sales came in weaker with falls across all
regions and led by larger falls in the Midwest.
The ECB kept rates on hold. While the minutes of the last
meeting in Dec and the Jan press conference have introduced more caution on the
broader environment, the ECB still appears to be fundamentally optimistic about
the economy and the outlook. The data continues to indicate a weaker growth
environment and the Jan PMI’s did little allay concerns about the slow-down.
The broader Eurozone composite PMI showed subdued growth and weaker internal
results such as declining new orders – led by both manufacturing and services.
The BoJ kept rates on hold and reduced the inflation forecast for fiscal year 2019. Data on merchandise trade was weaker with exports declining in Dec. This weakness was mostly driven by Asia with exports to Asia -7% in Dec. Exports to China were -6.9%. The prelim Jan Manufacturing PMI fell to a neutral 50 reading as key indicators of demand (new orders and production) fell into contraction.
Trade data from the Asia region was also released during the
week, further highlighting the weaker trade environment.
Ending on a good note. UK labour force data remained strong.
The Australian labour force data was also strong, although employment growth
has moderated somewhat.
The US Senate and House voted unanimously on Friday to fund the Government until 15 Feb as negotiations on funding for the border wall continue. It will likely take some time to restore the data flow by key agencies.
There are more data releases covered in last weeks review. Use the links on the contents page to navigate to different country sections. Download the review here;
The outlook for w/c 28 January 2019 – While the ‘hard data’ will be important this week, there are several events lining up that could be important to sentiment.
High level US-China trade talks will take place in
Washington 30-31 Jan. President Trump’s key economic advisor, Larry Kudlow has
called this meeting “determinative” (Source:http://www.atimes.com/article/chinese-vice-ministers-heading-to-washington-ahead-of-trade-talks/),
underlining the importance of these particular talks. The 30 Jan is also the
final date for the US to file an extradition order for Huawei CFO Meng. US
authorities have previously confirmed that they will request the extradition
from Canada. China’s Foreign Ministry hit back last week ‘strongly urging’ that
the US ‘correct its mistake’ and cancel the arrest order. The US has continued
to take a hard-line on China outside of these talks and it’s possible that this
highly visible case could impact the sentiment of the talks this week.
The FOMC also meets this week and rates are expected to
remain on hold. Details that the Fed is considering rolling back its balance
sheet run off were reported by the WSJ late last week. As we are in the Fed
blackout period leading up to the FOMC meeting, there has been no confirmation
or denial by the Fed – yet the markets responded positively to the report. The
messaging by the Fed will be important to watch this week.
Finally, there is Brexit. There will be another vote in the
UK Parliament this coming week on a plan that the EU has already (previously)
ruled out. Other amendments will be tabled within the Parliament to request an
extension to 29 Mar deadline. If any of the amendments are successful, this
could lead the way to a second referendum possibly breaking the current
deadlock.
There will also be heavy US treasury supply this week with
the US Treasury settling $333bn in bills, notes and TIPS this week, raising
approx. $31bn in new money. Its also month end, and approx. $14.2bn in Fed
holdings of treasury securities will roll off the Fed balance sheet.
There are several important data releases this week;
US Non-farm payrolls, the first estimate of US Q4 GDP
(possibly delayed), the ISM Manufacturing PMI for Jan and the final Markit
Manufacturing PMI for Jan.
Final Manufacturing PMI’s for Jan will also be released; UK,
Japan and Eurozone.
Australian Q4 CPI
US earnings announcements will continue this week.
Further detail and a calendar of key releases are provided in the briefing document – download it here;
"In the Fed we Trust" - global risk markets continue to be dominated by the whims of the Fed - this is a market where "hope" and "faith" (assurance of things hoped for, evidence of things not seen) are preferred over economic reality and free markets. Our goal as market participants is to understand key market […]
In 2018, we were looking for a topping equity market, rising rates and strengthening US dollar as central banks reduced liquidity. Global fundamentals of debt, deflation and slowing growth will continue to provide headwinds throughout 2019.
The question is how long can the CB’s kick the can down the road? At what point do global markets call their bluff as market maker in chief? One thing is clear, central banks are manufacturing a world of increased societal acrimony through financial repression – how long can they continue to support the banking hegemony with disregard for societal inequality?
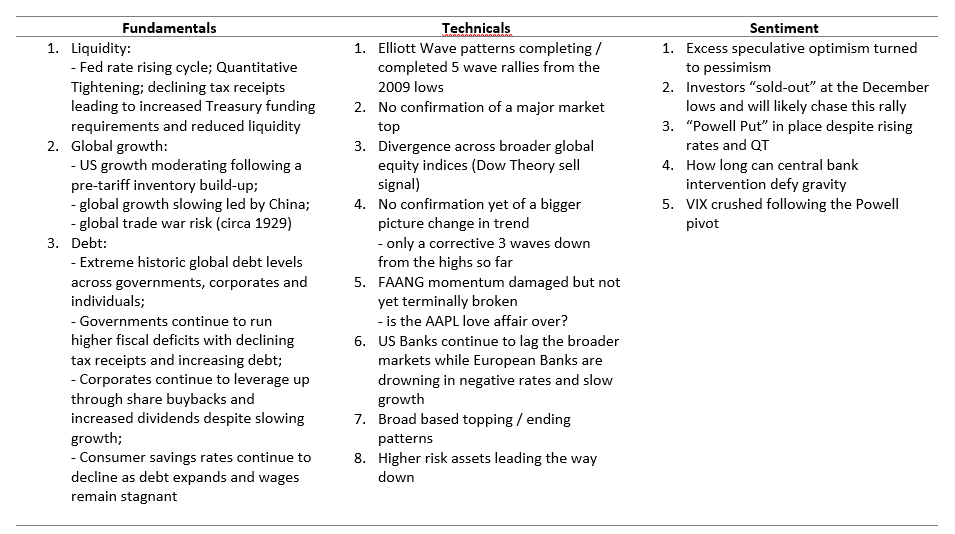
Key Macro Themes for 2019:
Global equity markets either topped in 2018 or are in the process of topping. We have a potentially complete 5 wave impulsive rally from the 2009 lows that terminated in September 2018. However, due to the corrective looking 3 wave pullback into major support, we cannot confirm with confidence that the bigger picture rally is over. We expect a year of increased volatility as investor hope and faith in central banks is tested by the headwinds of debt, deflation and slowing economic growth in a distorted market.
In summary, 2019 is likely to be a trader’s market with high volatility across macro asset classes. – we remain defensive equities and swing trading tactically; – bullish bonds in a deflationary environment; – bullish the US dollar (except against the Yen); – bearish the Swiss Franc; – bearish commodities; and – longer term bearish gold and silver
I’ll start with equities – namely the S&P. I’ll spend some detailing what I see as the key scenarios to watch. The Dow, Nasdaq and Russell are likely to follow similar patterns, so these scenarios will apply more broadly to equity markets.
Our long term outlook is that the entire post 2009 rally in equities will be fully retraced. While I am bearish the longer-term, at this time, a bull and a bear case both remain possible. Both cases and potential roadmaps are outlined below.
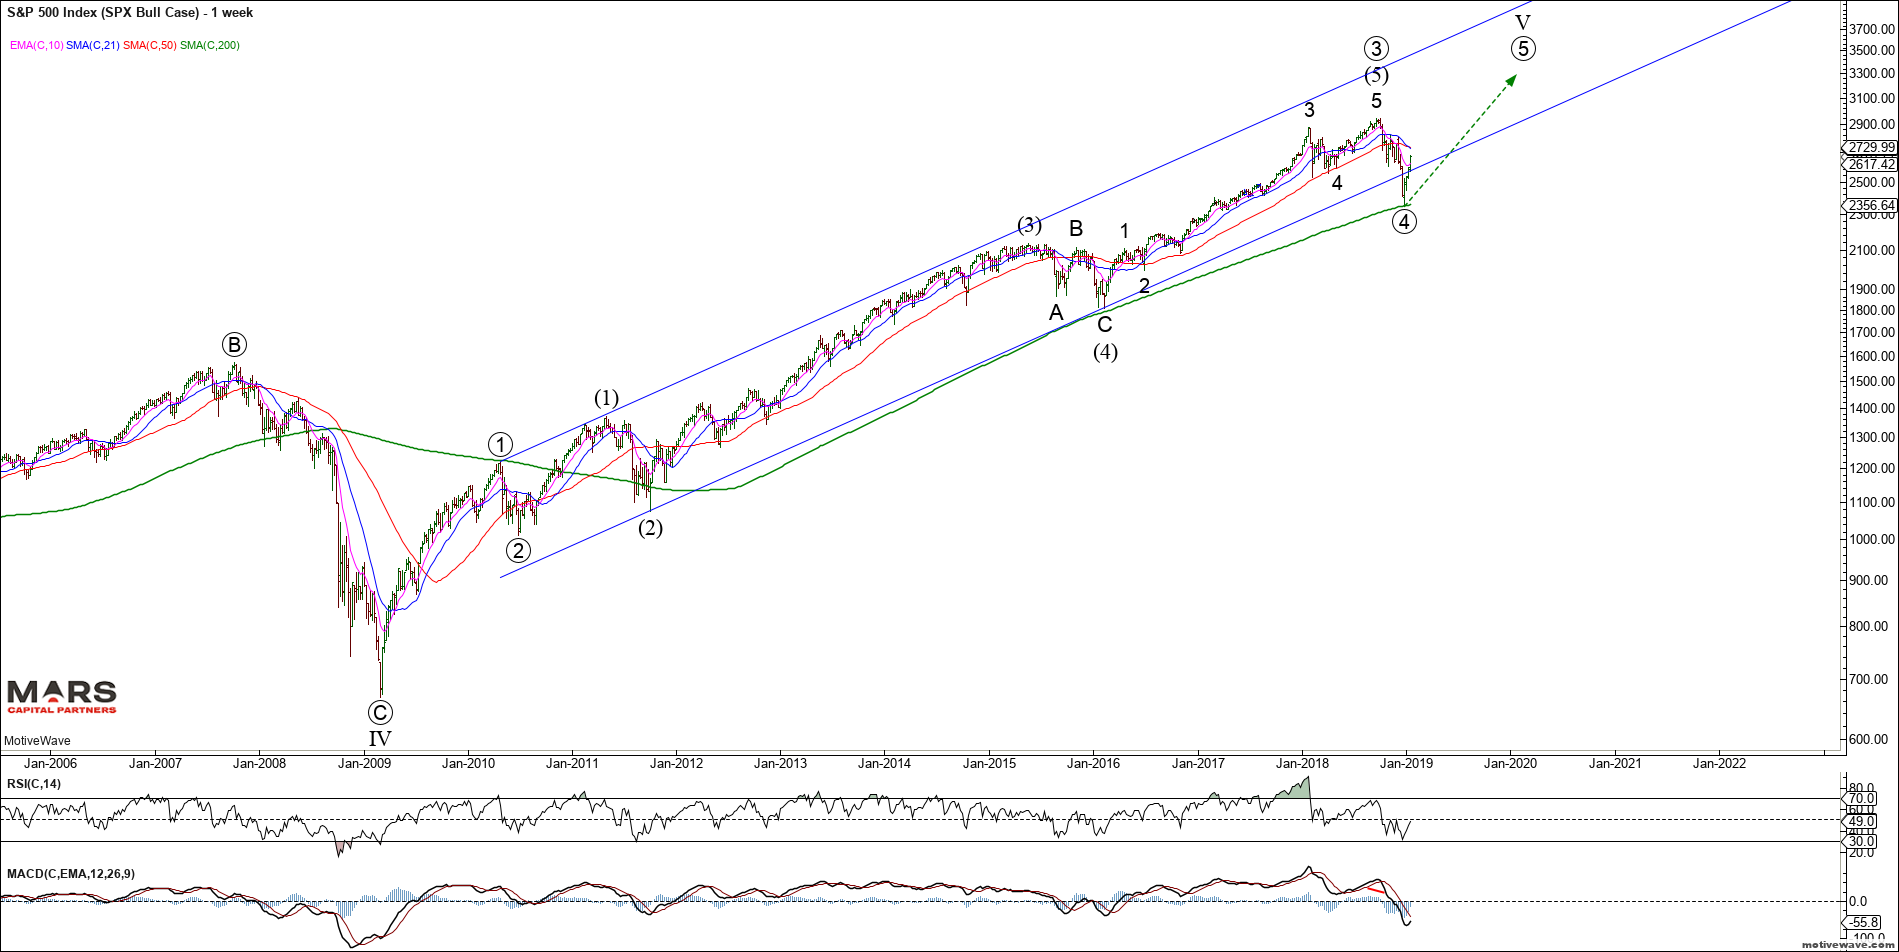
Firstly, the bull-case. This will likely be more of a traders’ market than an investors’ market with increasing volatility. Our benchmark SPX has a potentially completed 5 waves up from the 2009 lows. What we do NOT have is confirmation of a change in trend so the potential remains for new ATH’s as shown below. As previously stated, we need to see 5 waves down from the highs to confirm a change in trend to DOWN.
SPX Bull Case Weekly
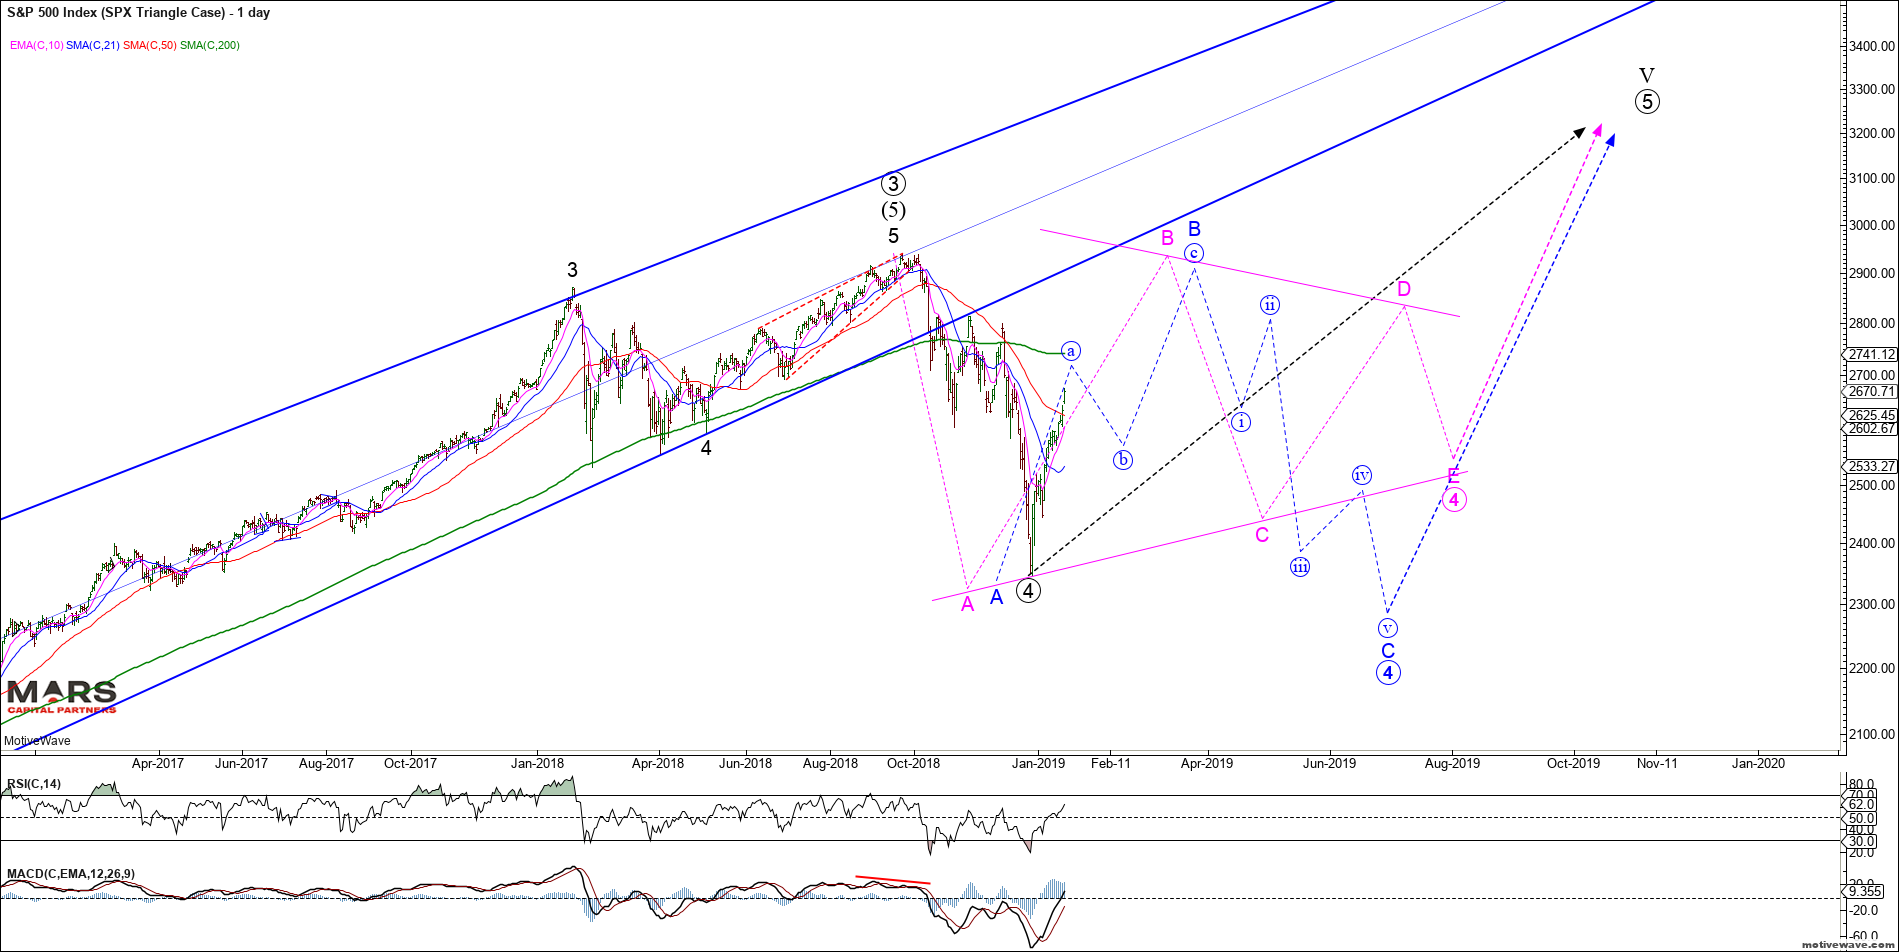
So far the SPX bull case has 3 waves down of equality into structural support and what appears to be an impulsive rally off the lows. This implies either a completed 3 wave corrective decline for ALL of wave 4 or “part” of a larger corrective decline in a bull market. So in the bull-case, there are three possible paths to new ATH’s. In Elliott Wave terms, a correction in 3 waves is either: – Black count: a completed zigzag correction for all of wave 4 and we push directly to new ATH’s in wave 5; or – Blue count: completed wave A of a 3-3-5 (A-B-C) corrective Flat where we are now in wave B to test the ATH’s; or – Pink count: completed wave A of a multi week / month 3-3-3-3-3 (a-B-C-D-E) triangle before a final thrust to new ATH’s in wave 5
SPX Bullish Options Daily
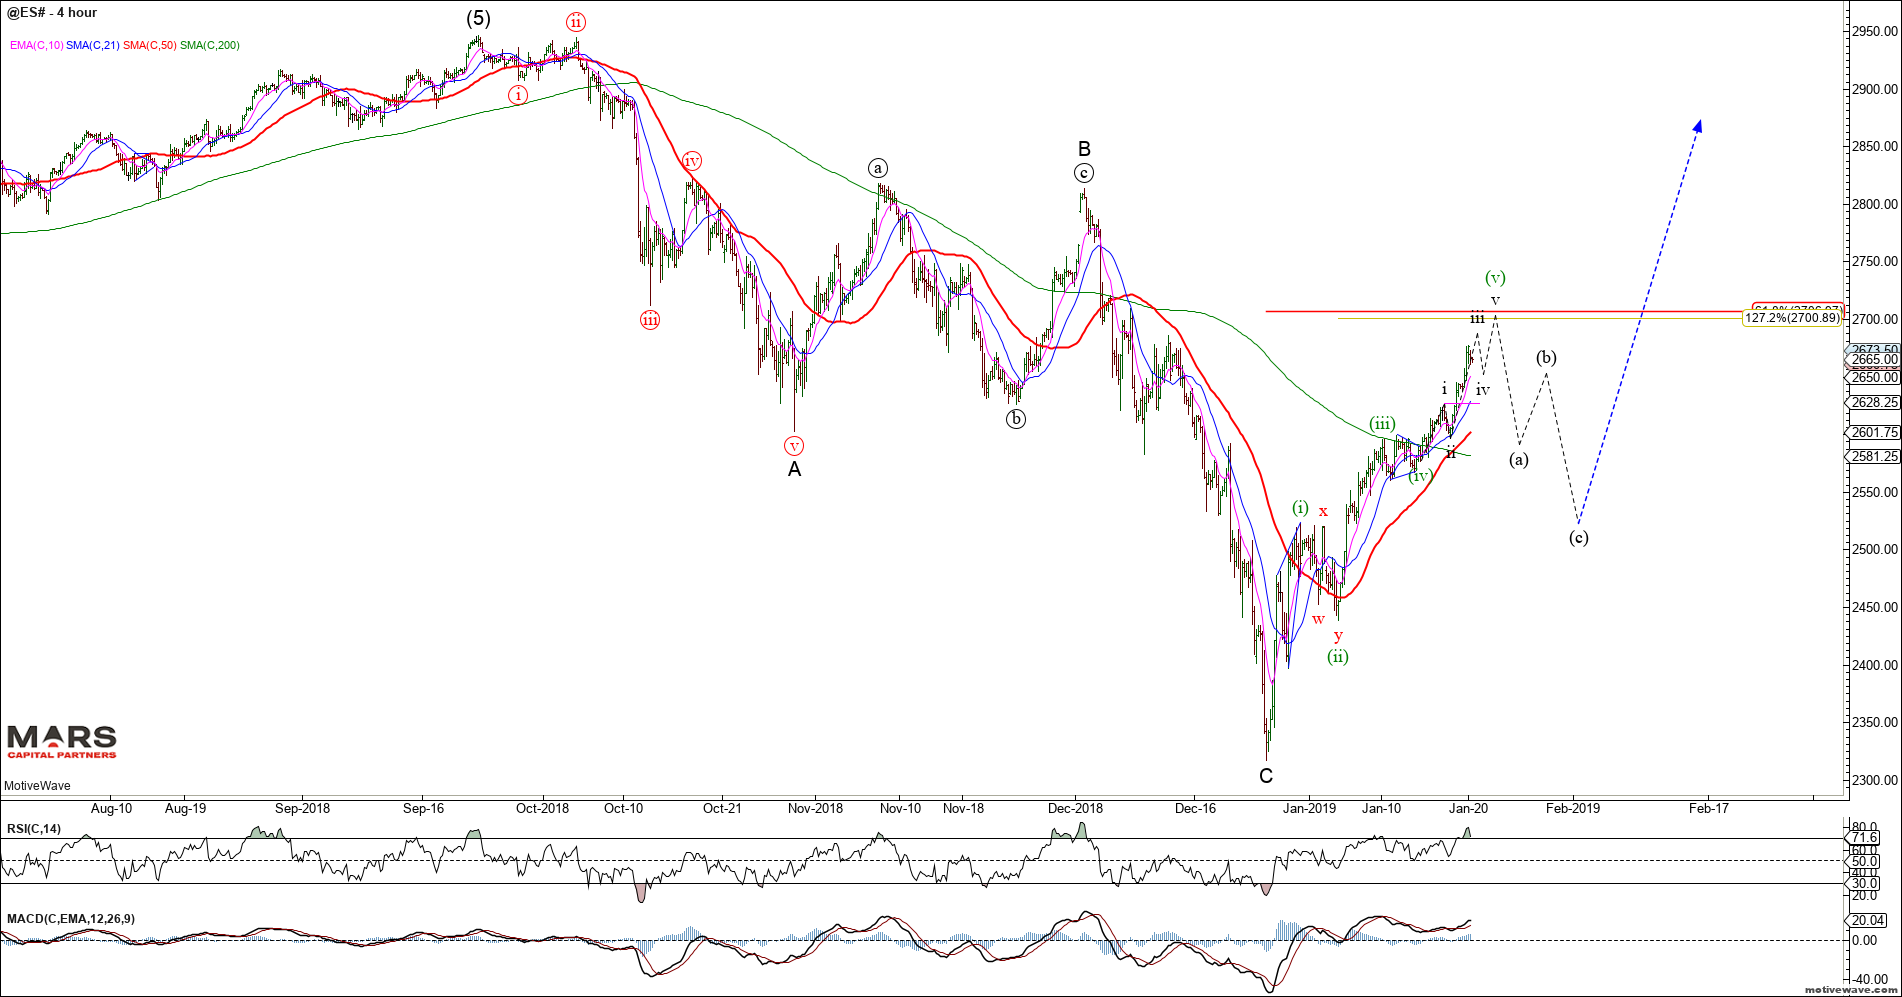
From a near term perspective, the ES appears to be in an extended 5th wave after breaking above our 2645 resistance last week with targets in the 2700-10 area. Once this impulse wave completes for wave 1 / A, we should expect a corrective 3 wave decline prior to the next move higher to retest ATH’s. We are not chasing this rally but rather looking for a turn, the nature of which (impulsive or corrective) will setup our next swing.
ES H4
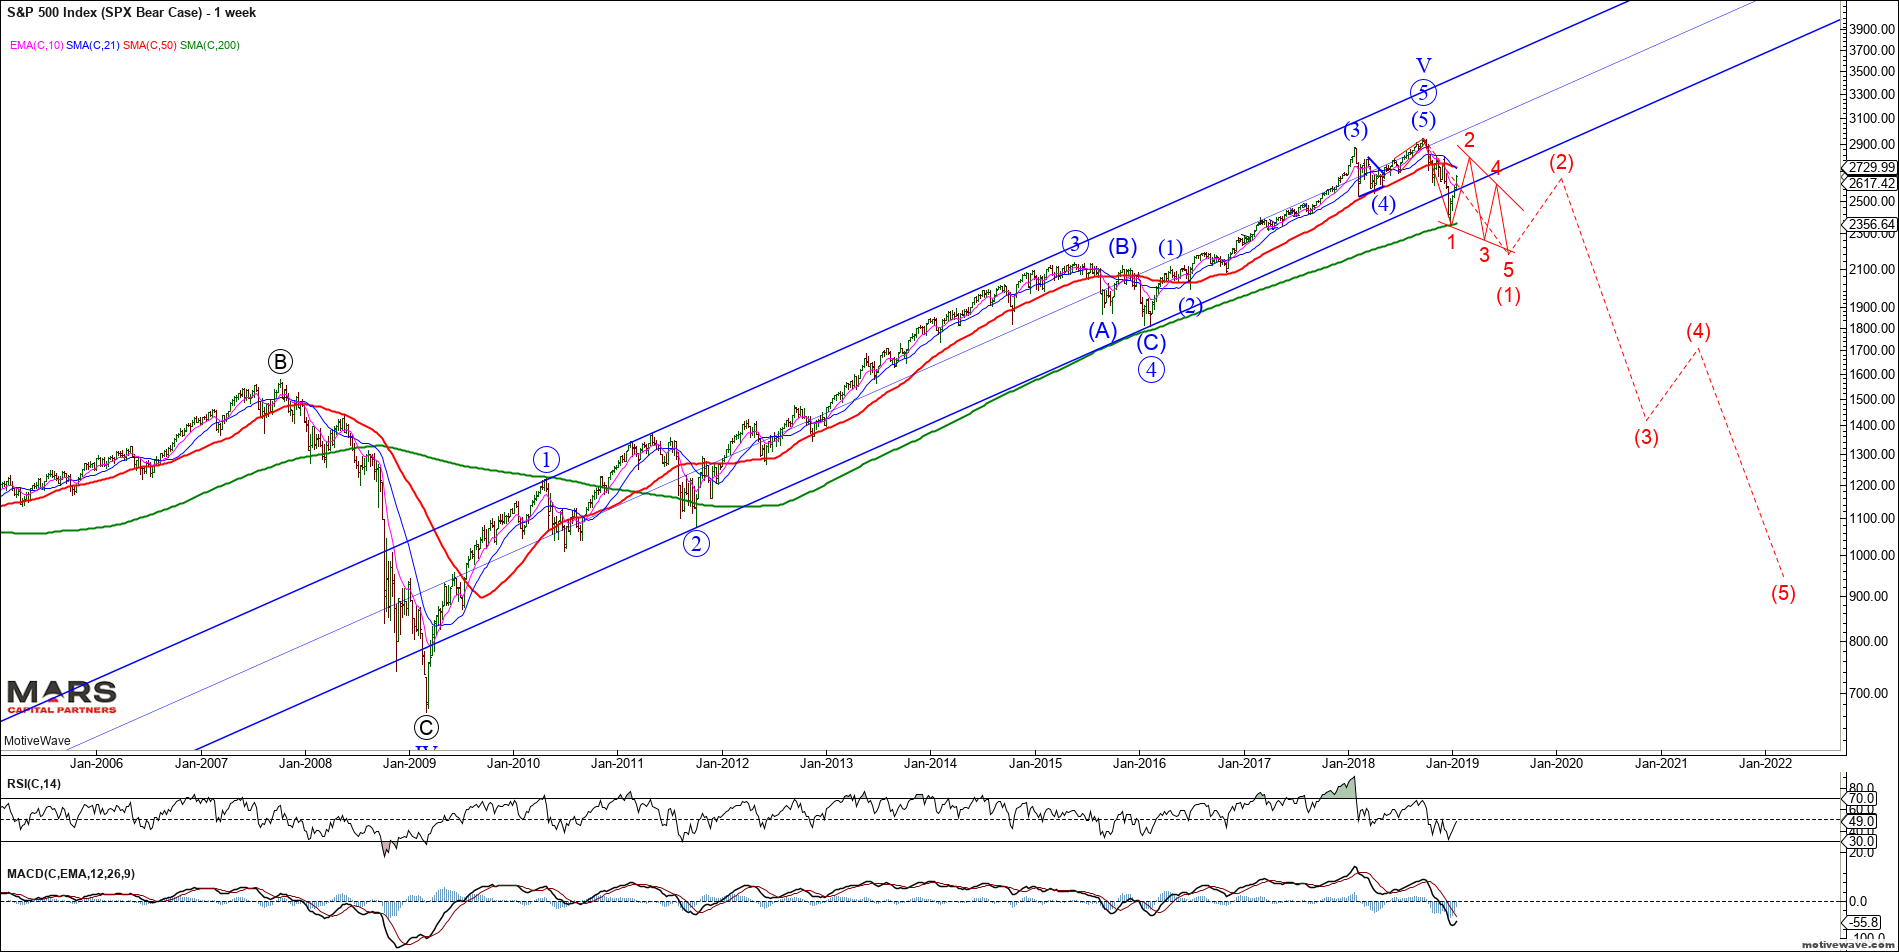
The SPX Bear Case assumes that the 5 wave rally from the 2009 lows is complete and we have begun a bear market. There is little evidence to support this structure unless markets trade back below the December lows.
SPX Bear Case Weekly
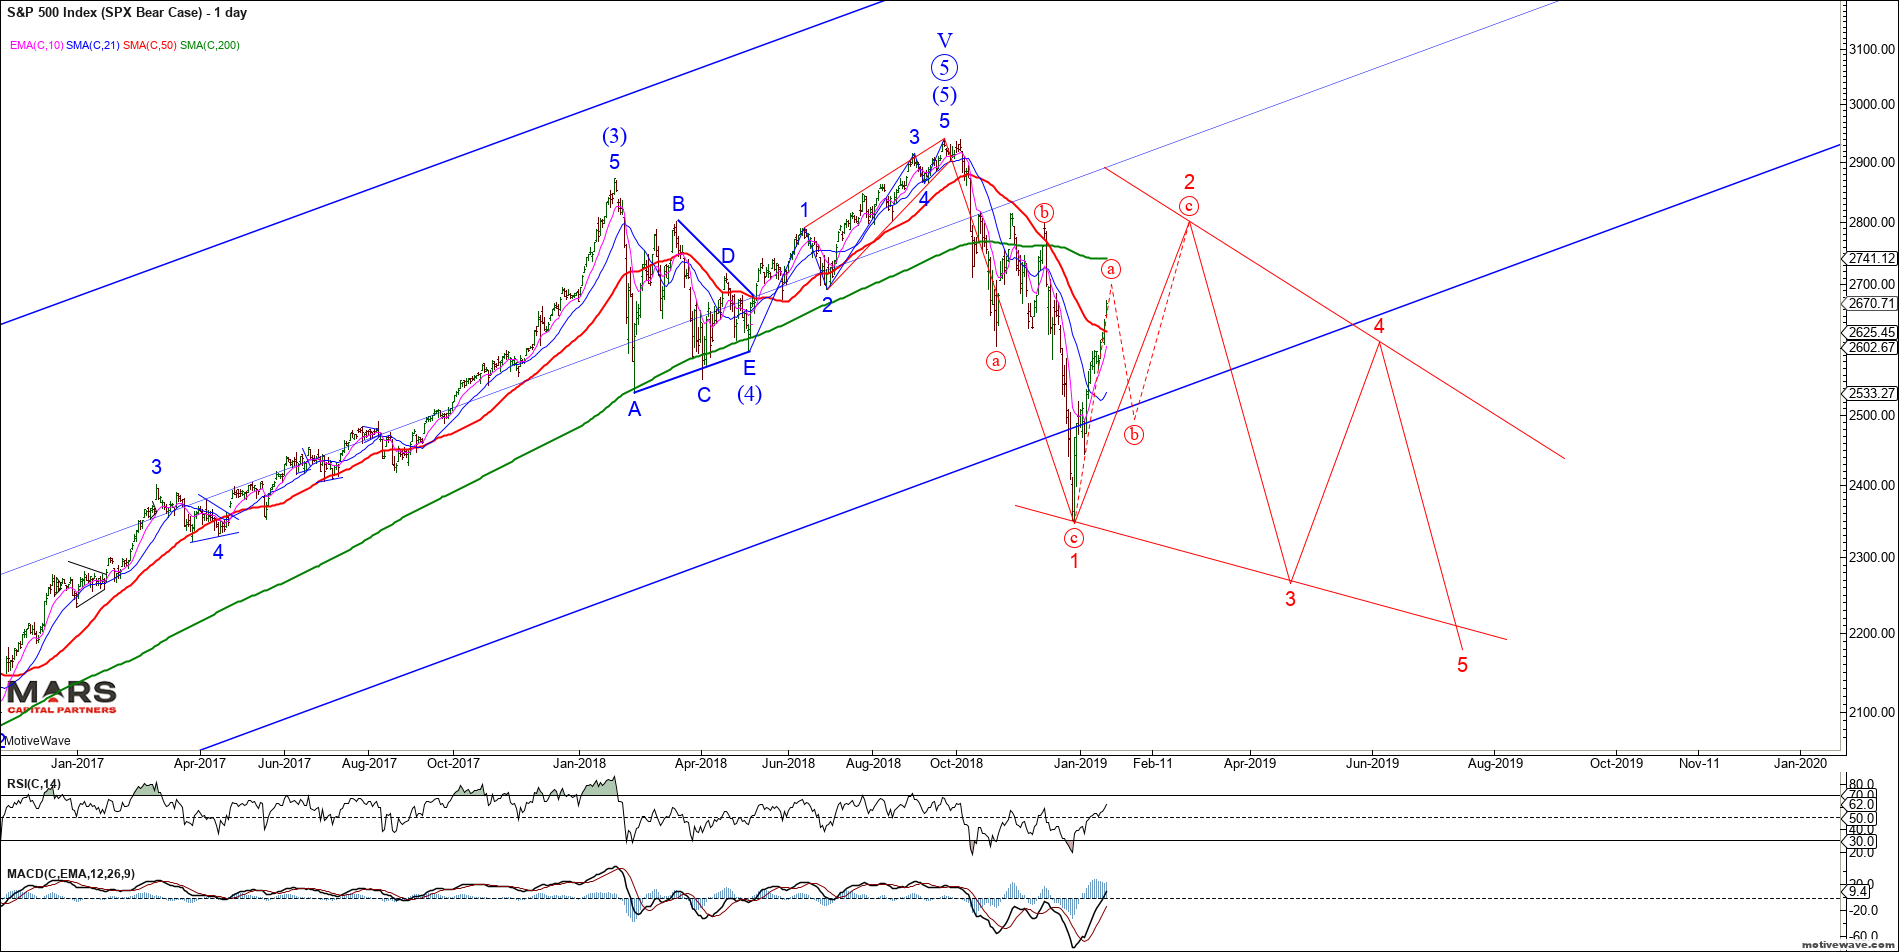
Given the initial 3 wave decline, the most likely bearish structure is a “leading diagonal – falling wedge” as shown below. The lack of 3rd wave price action suggests even this decline would be highly volatile (read choppy whipsawing) and take months to play out – this potential structure is invalidated at new ATH’s.
SPX Bear Case Daily
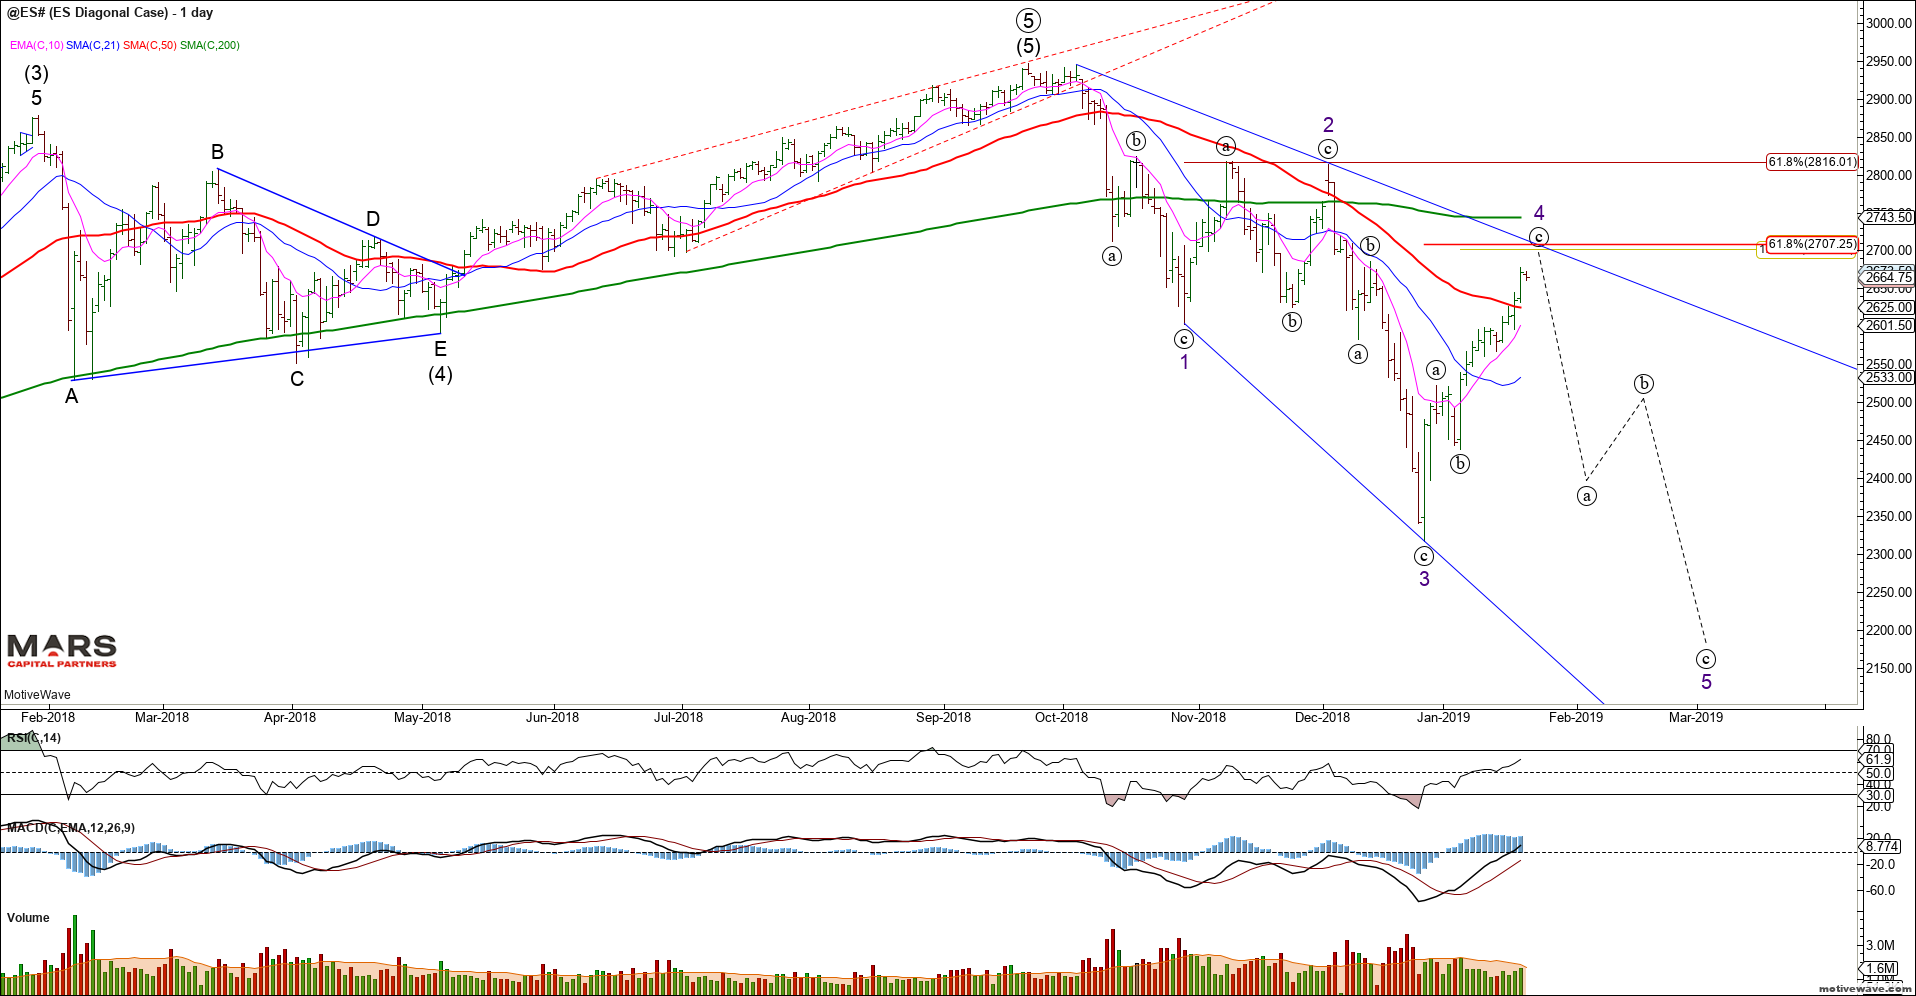
Another potential bearish SPX / ES structure (lower probability) is a rare expanding leading diagonal which requires an immediate bearish turn from the 2700 resistance area.
ES Diagonal Daily
Given the number of price paths that are still valid/possible at this point in time, we expect volatility and traders should remain nimble and trade tactically.
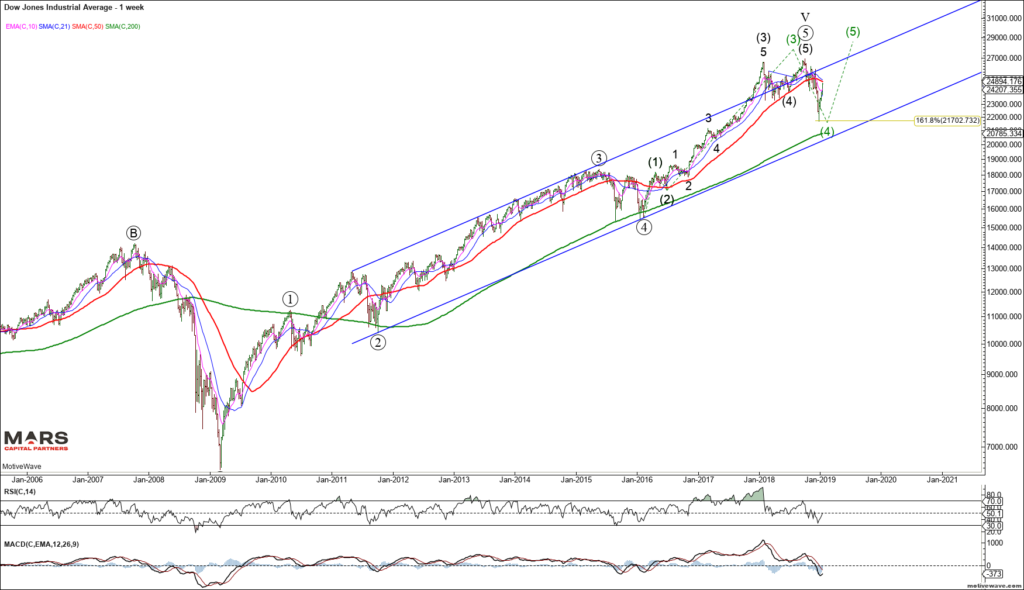
The Dow shows the same structure from a big picture perspective. With only 3 waves down from the highs, we must allow for a potential push to new ATH’s while December’s lows remain in place.
DJIA Weekly
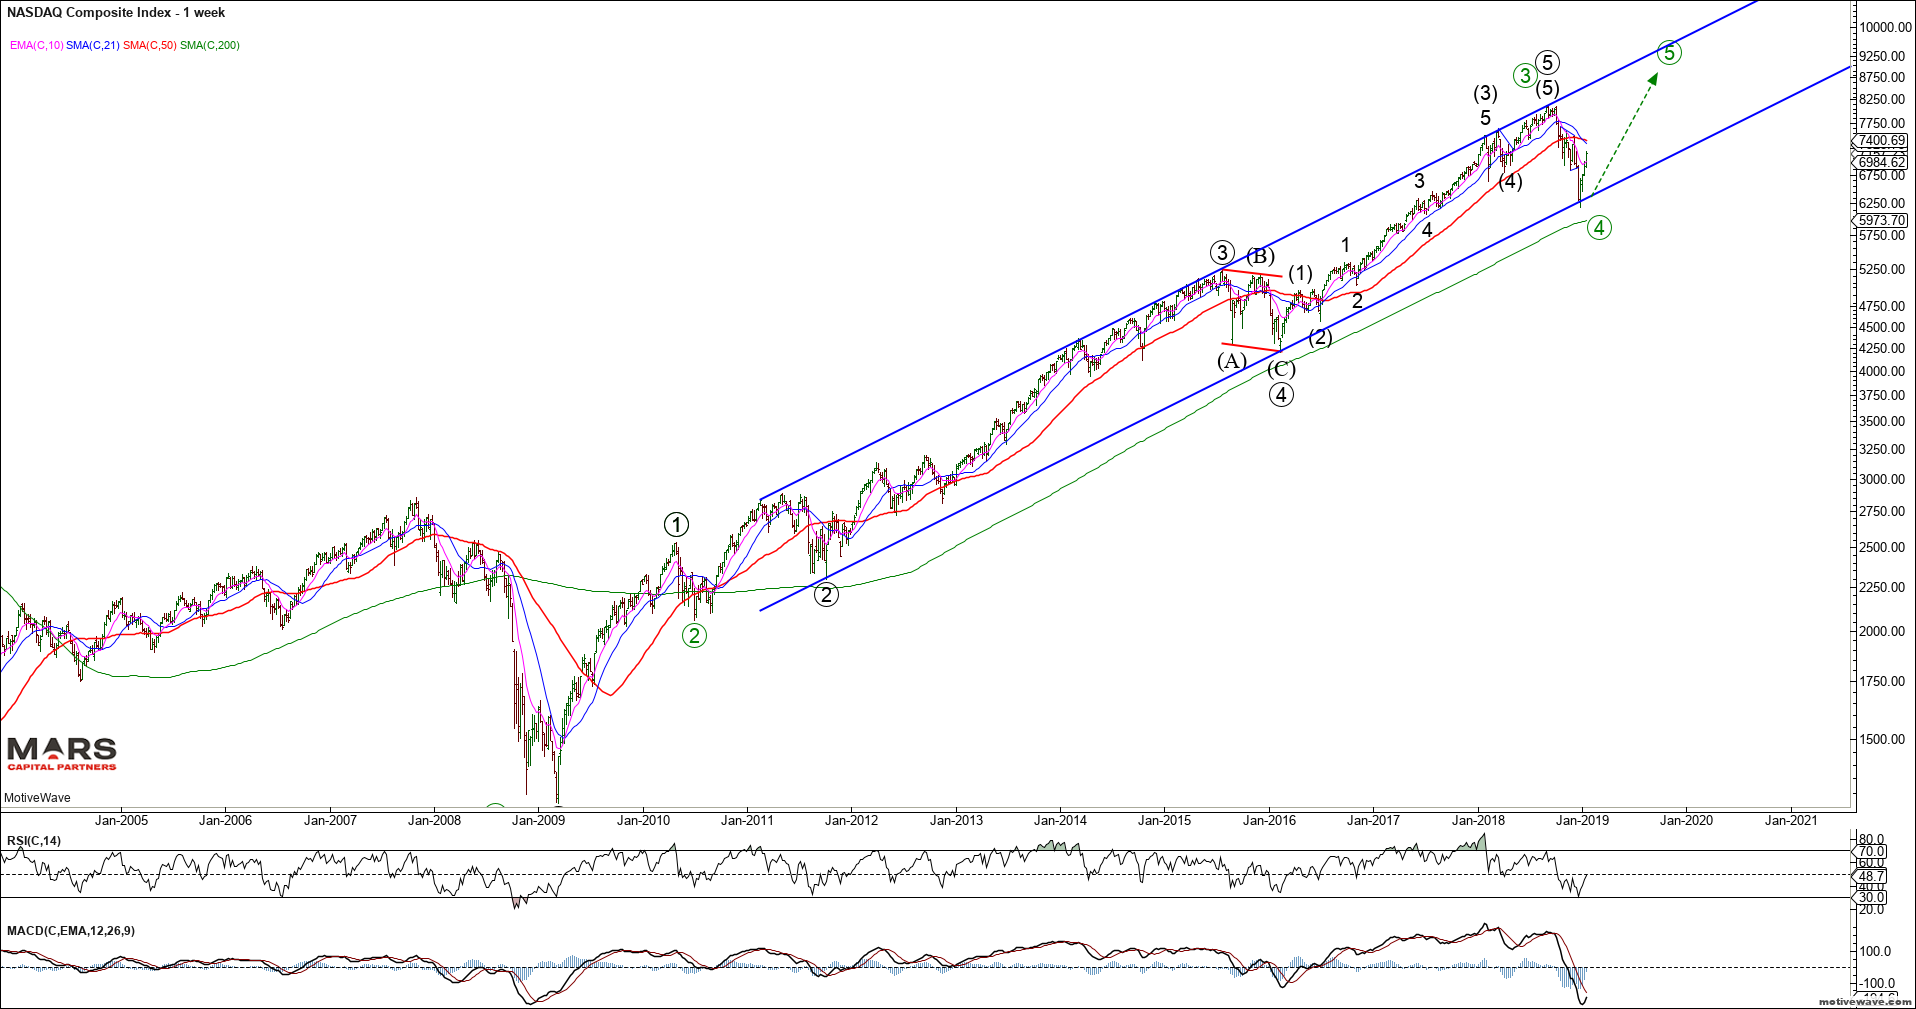
Similarly, the Nasdaq indices only declined in 3 waves of equality into structural support opening the door for an eventual push to new ATH’s. The rally from recent swing lows appears impulsive for a direct push to new ATH’s or part of a more complex correction for wave 4 as per the SPX.
Nasdaq Weekly
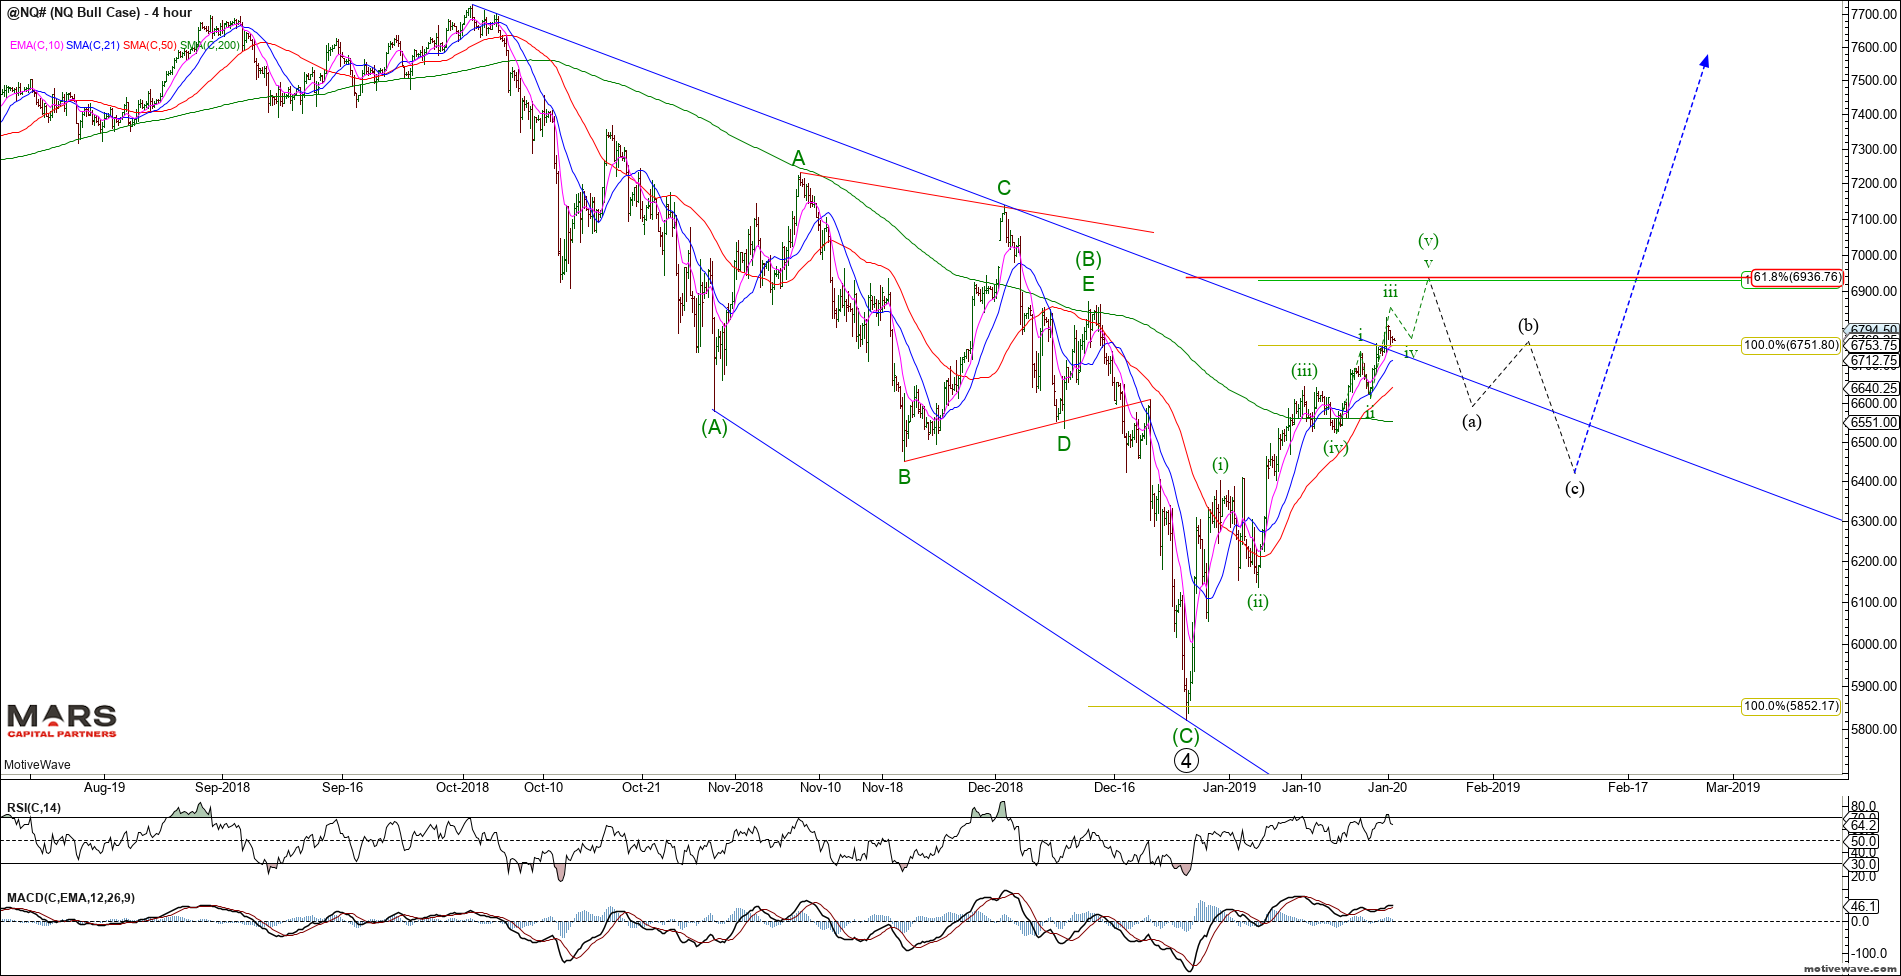
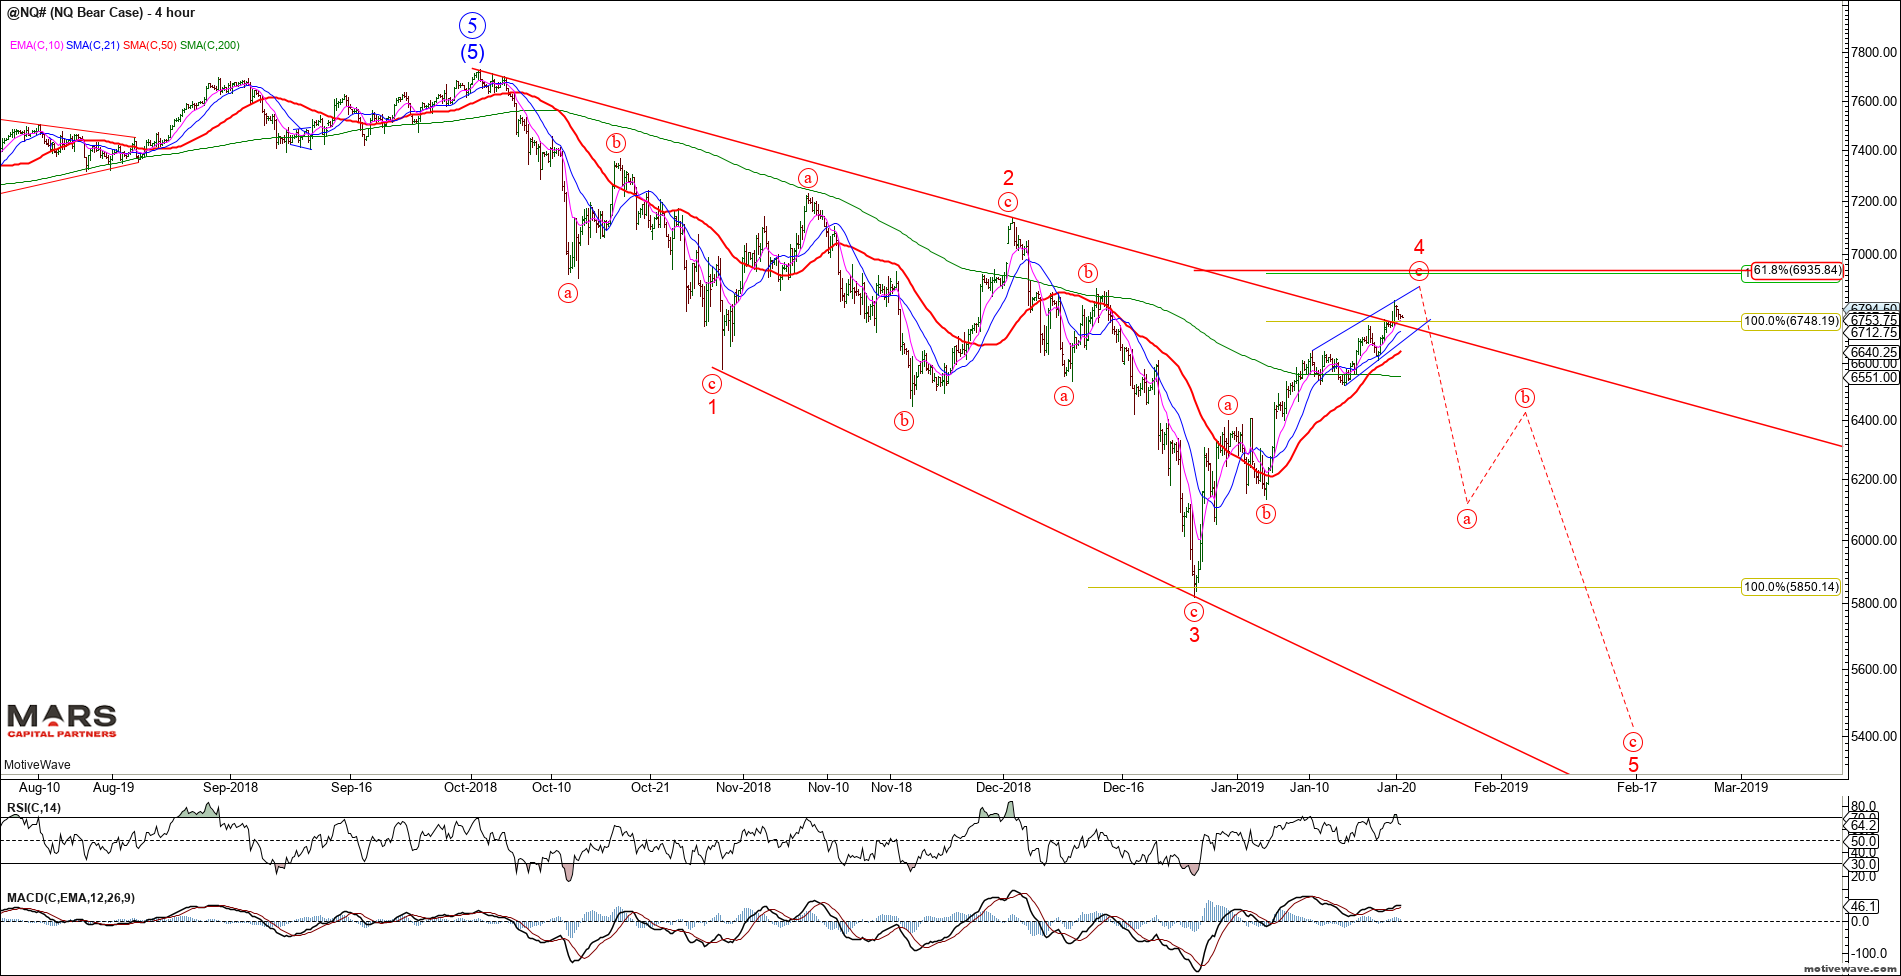
From a near term perspective, the NQ is tracing out what appears to be an extended 5th wave approaching resistance in the 6936 area (61.8% Fib retracement). The near term structure counts best as an impulse up from the lows as shown in the bull count. There is the potential for an extended wave (c) as shown in the red bear count but this appears lower probability. Either way, we should be fast approaching a near term correction so buyers beware.
NQ Bull Case H4NQ Bear Case H4
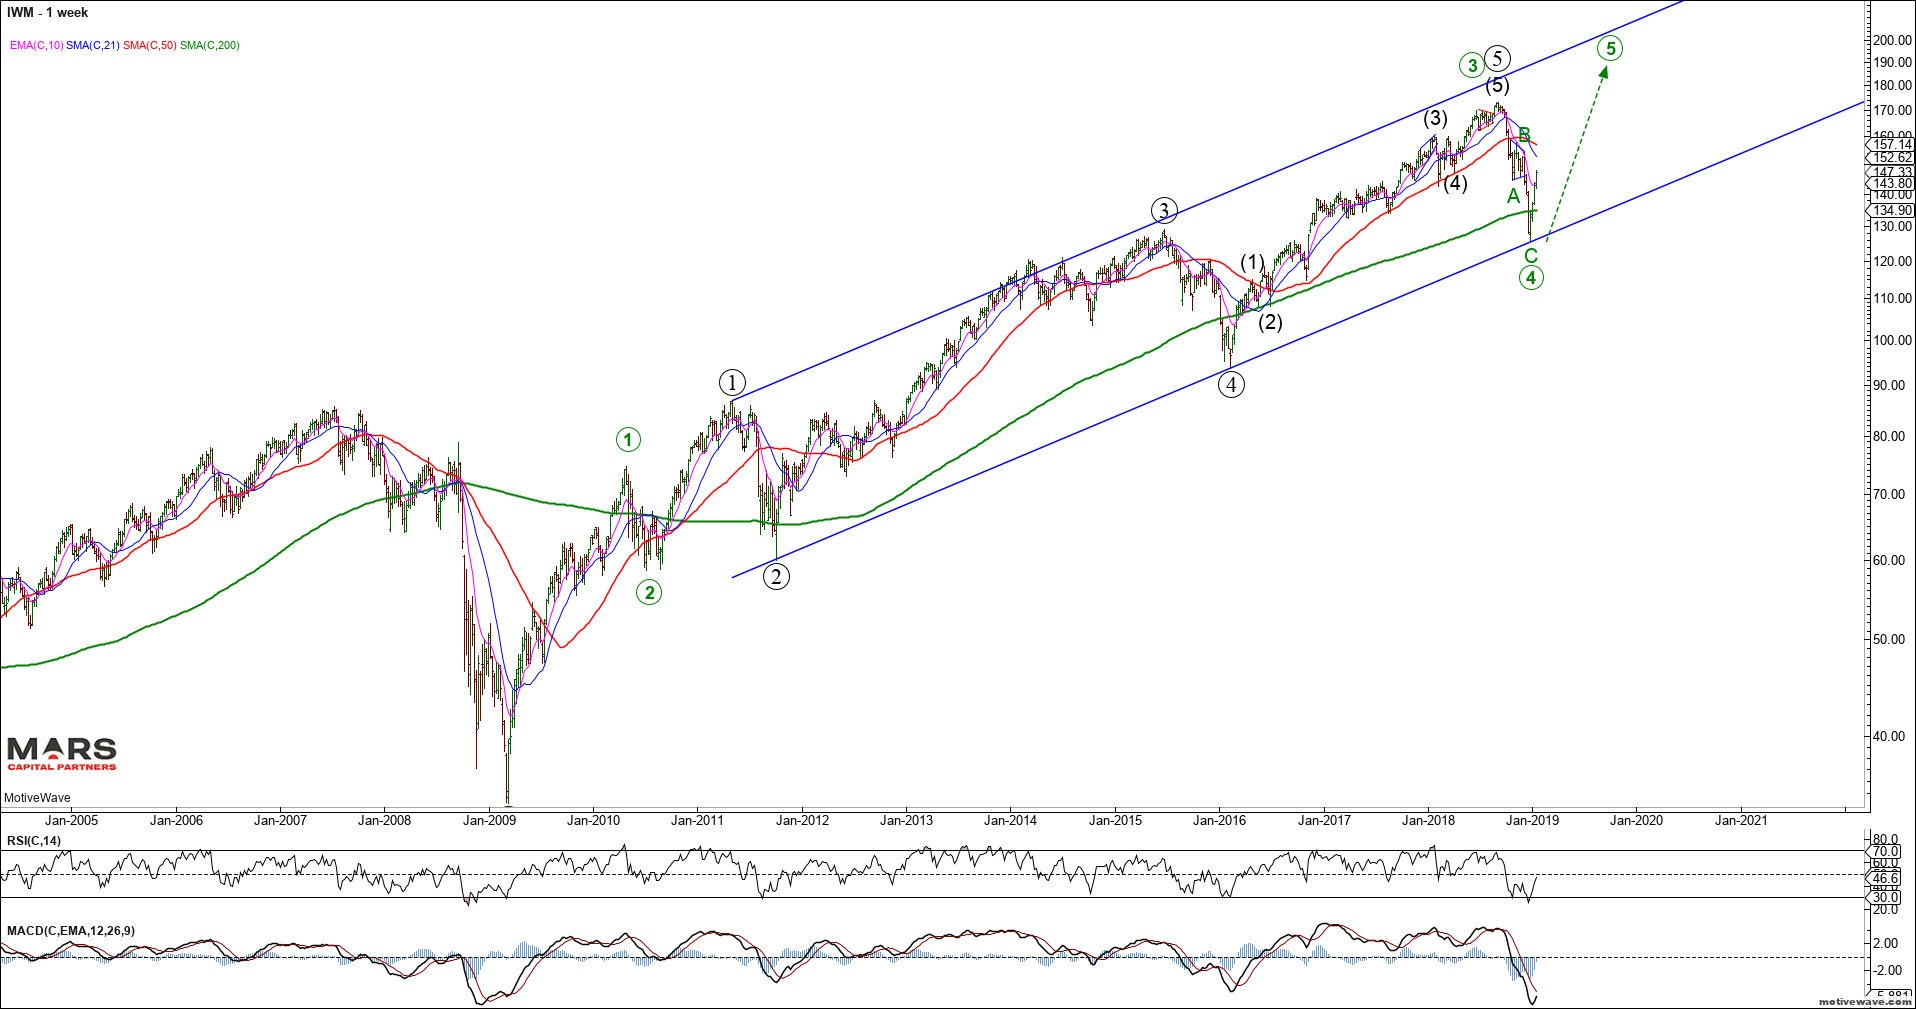
The Russell 2000 also declined in 3 waves of equality into structural support. While there are enough waves to complete the post 2009 impulsive rally, we must allow for the potential of another push towards new ATH’s (green count).
IWM Weekly
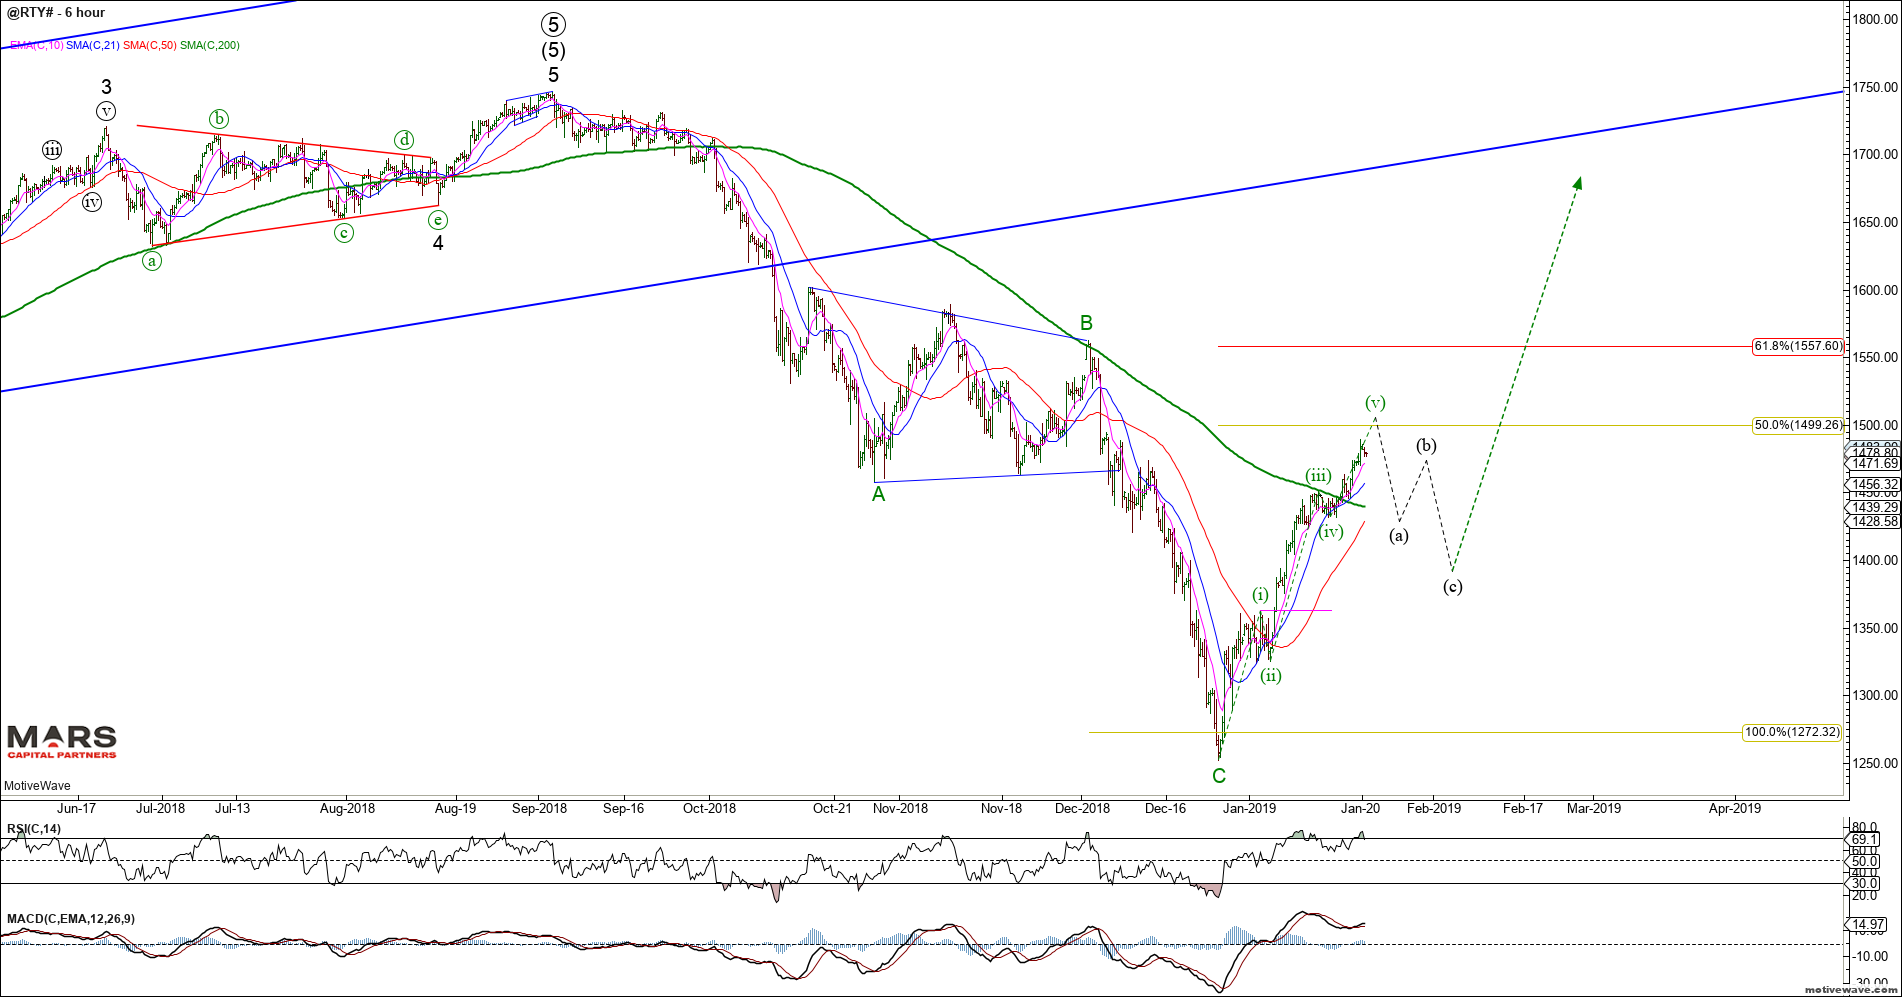
Near term, the RTY appears to be tracing out the final waves of an impulsive rally from the cycle lows. Near term resistance resides in the 1500 area. The impulsive nature of this rally suggests it is either wave 1 or A of a larger rally to retest the ATH’s once its corrective decline is complete.
RTY H6
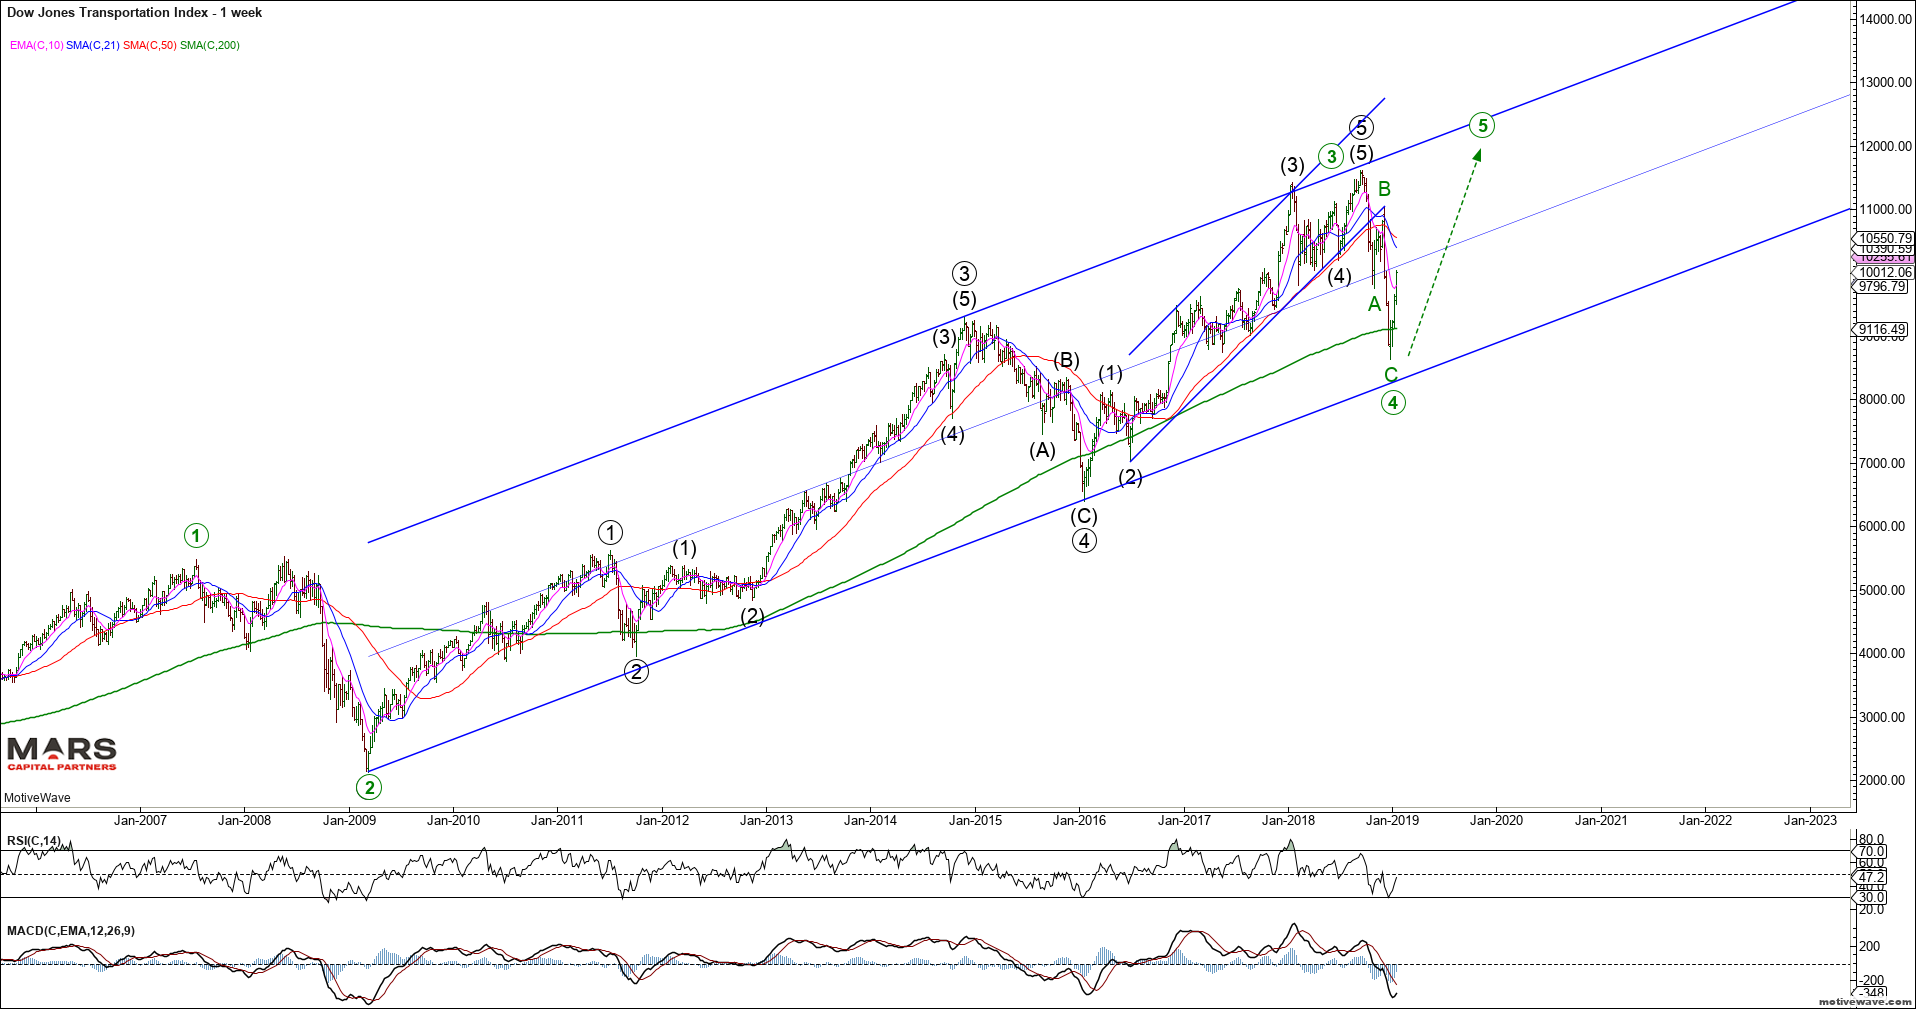
Another index we track closely is the Transports. It suffered a sharp 3 wave decline into structural support before rebounding strongly. Once again, given the corrective nature of the decline, we cannot discount the potential for new ATH’s as shown by the green count. This bullish count is likely invalidated below the December lows.
DJT Weekly
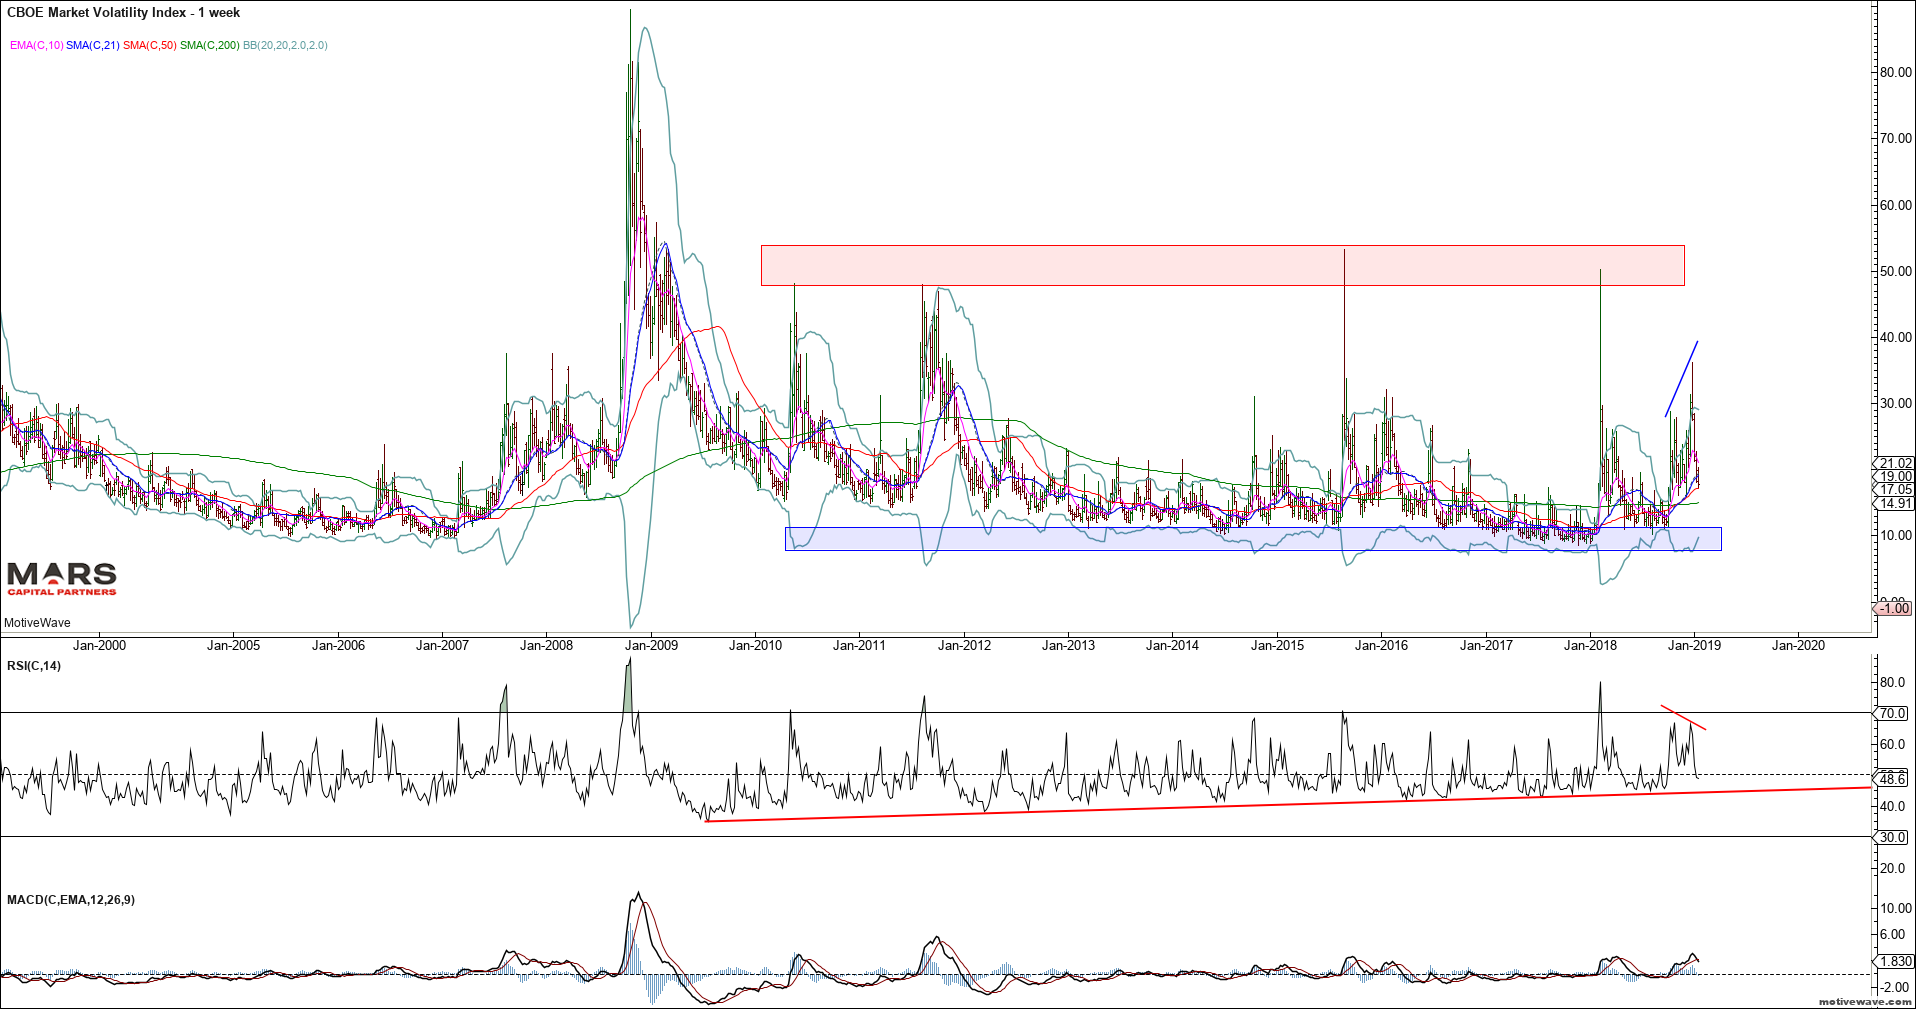
The VIX has been crushed since the Powell Pivot. Given the 3 wave nature of the most recent rally, it is likely that volatility continues to decline towards cycle lows.
VIX Weekly
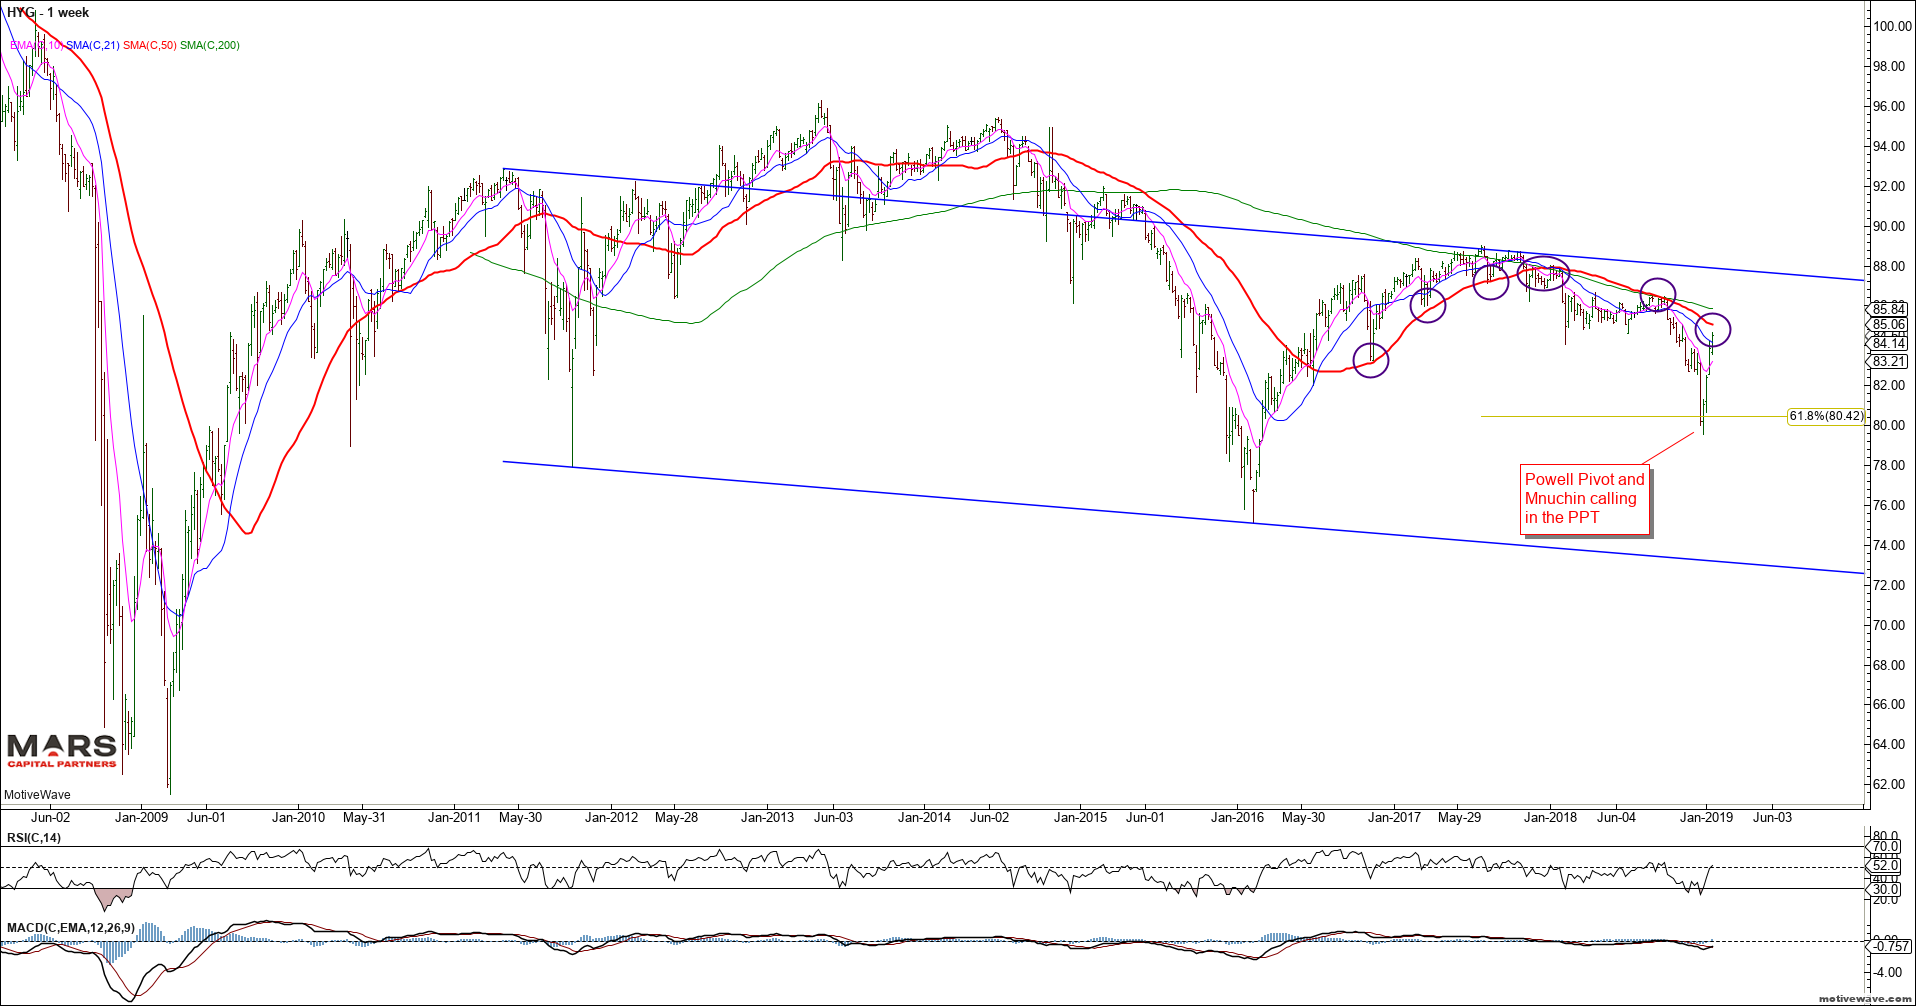
We have been tracking the HYG and JNK indices for risk sentiment. Note the sharp rally since the Powell Pivot – this warns us that investor’s “faith” in central banks remains undiminished. We are fast approaching the weekly 50 sma which has held all rally attempts – key near term inflection point but the rally off the lows appears impulsive (bullish).
HYG Weekly
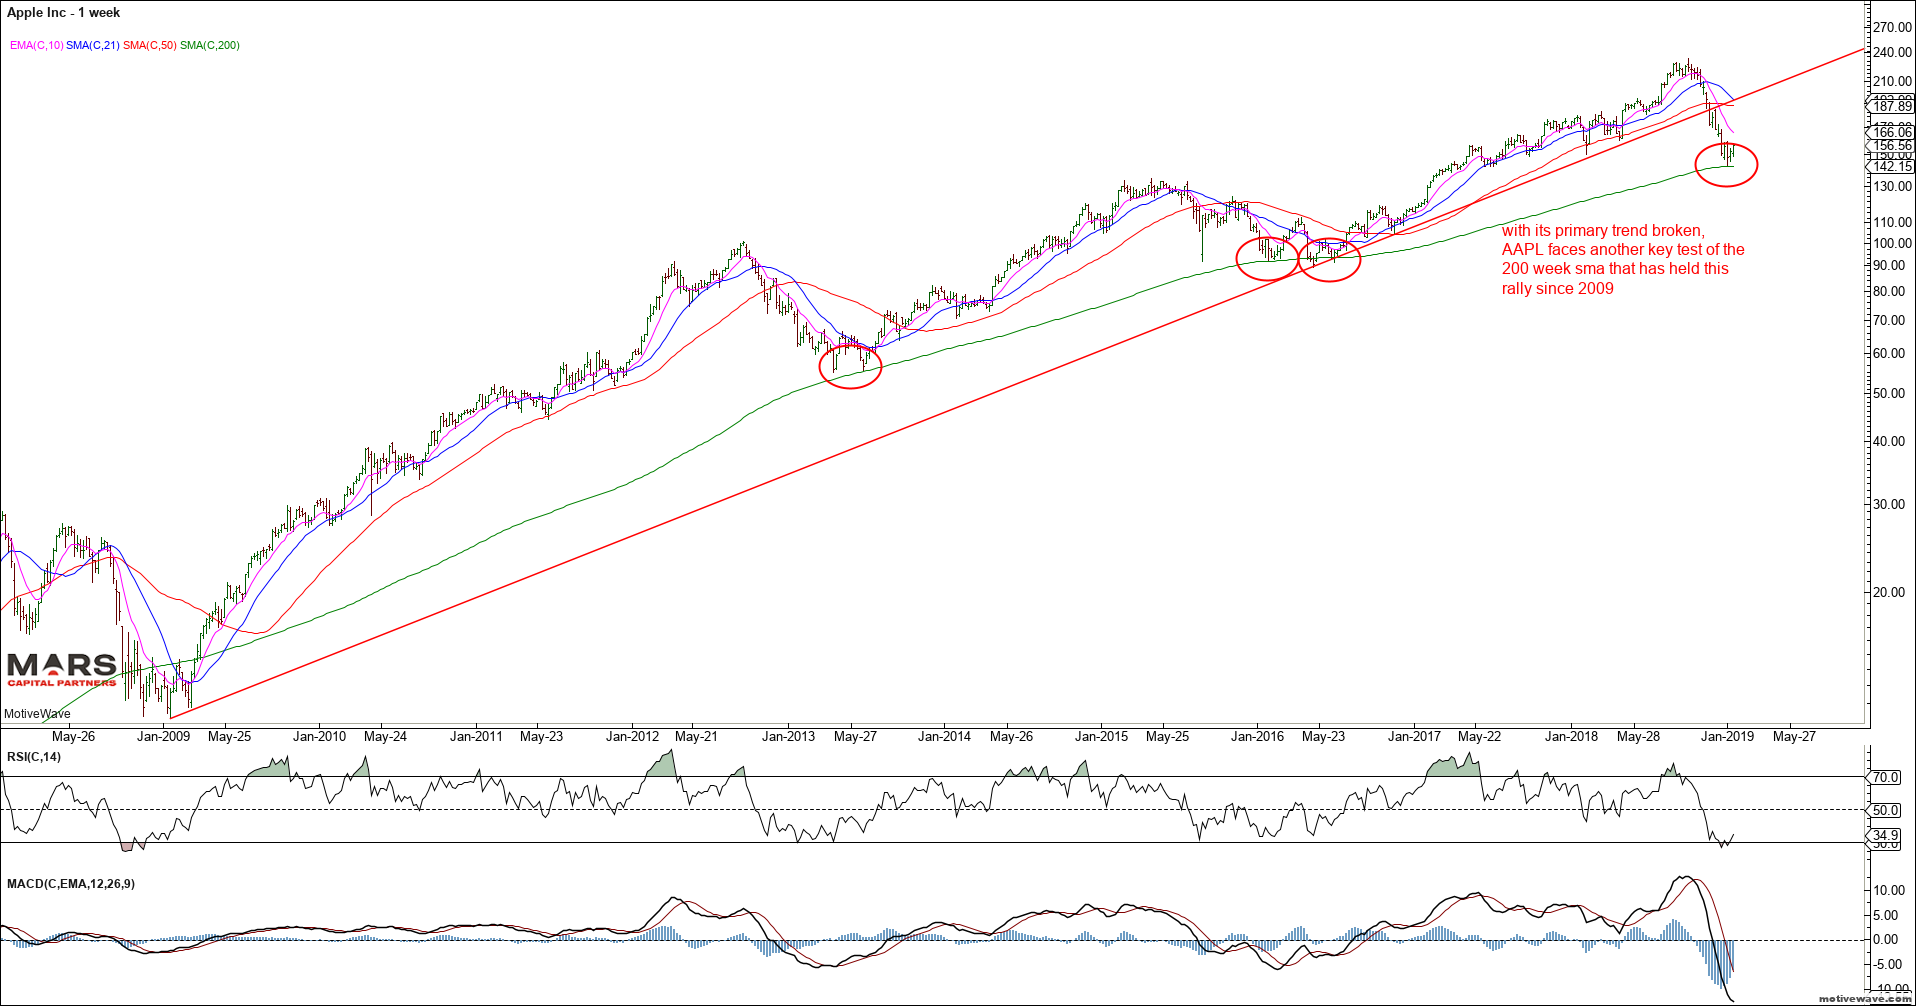
AAPL may provide an important tell for global growth – we have an impulsive (bearish) decline from the September highs that broke trend support but held its 200 week sma from where it is attempting to rotate higher. We should expect at least a counter-trend rally in AAPL here. A break below the December lows would be very bearish.
AAPL Weekly semi-log
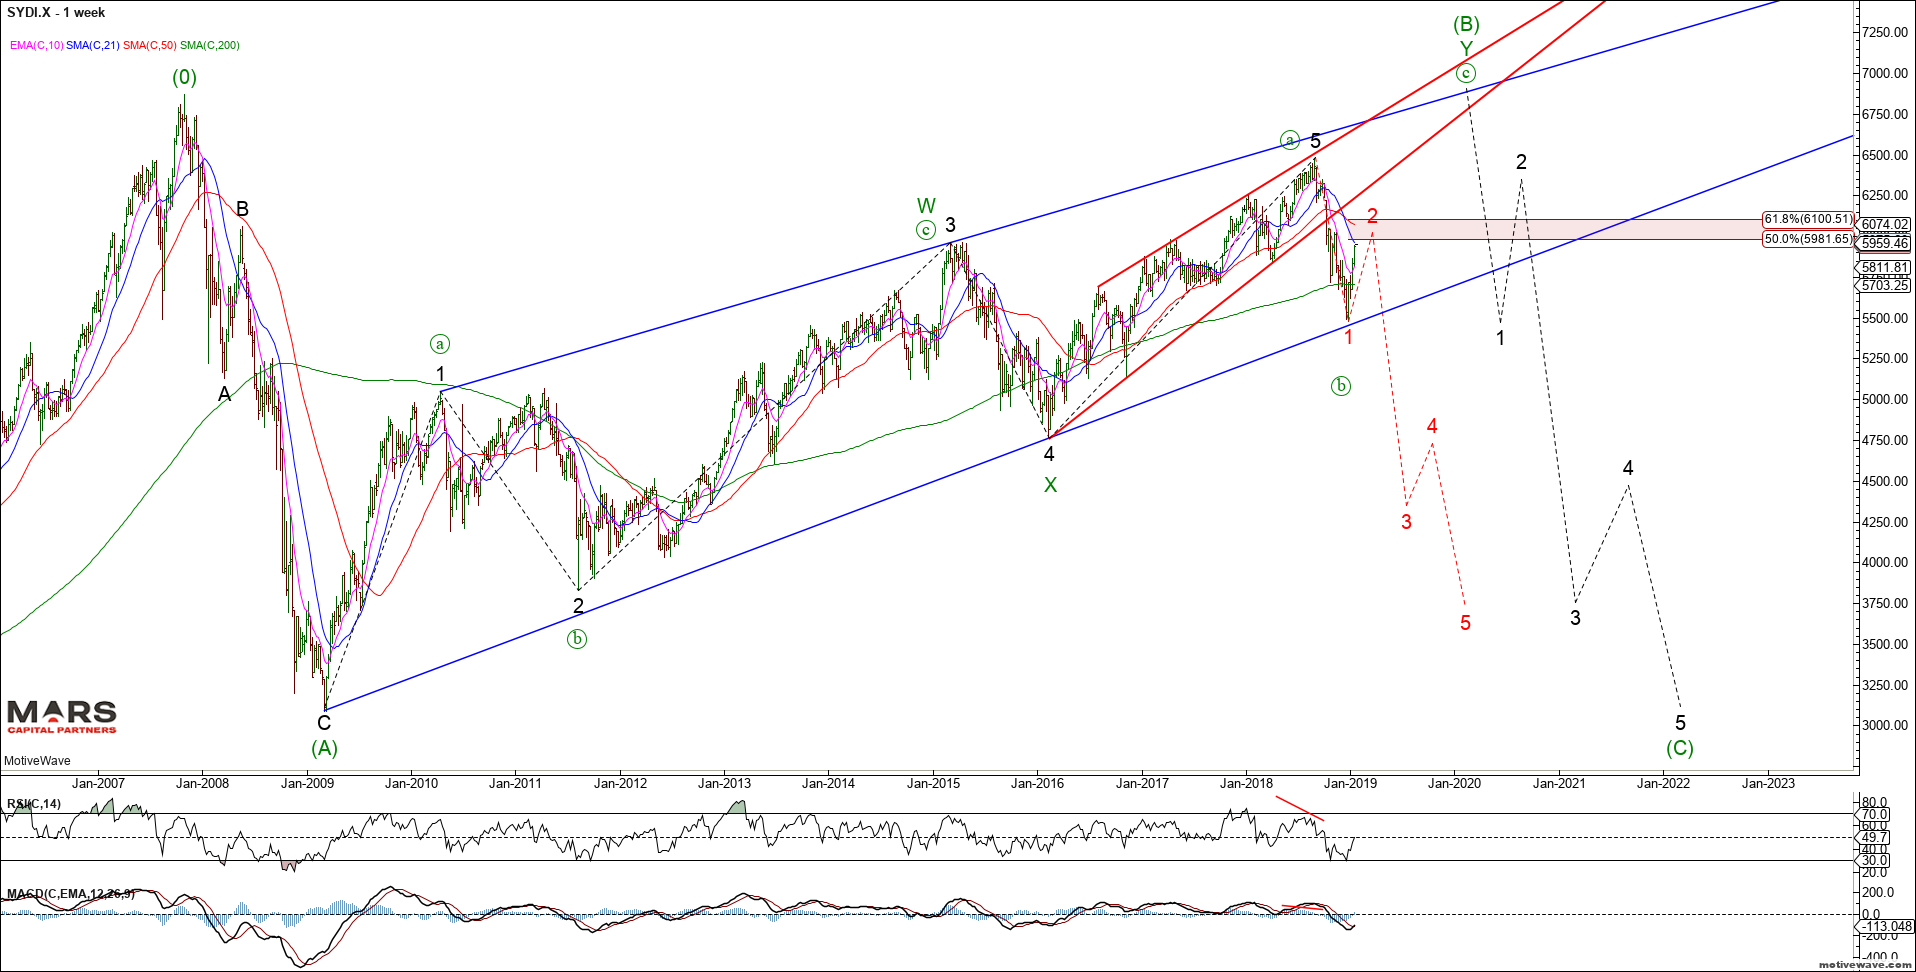
To the global equity markets and the ASX200 has two primary counts. Like the SPX, we have enough waves in place to complete 5 up from the 2009 lows and the decline appears impulsive into structural support. We are now entering the Fib retracement range from where the bears will need to make a stand. The bullish count is more complex and allows for a retest of the ATH’s before reversing sharply lower. This is not a time for complacency – the big picture risks far outweigh the upside potential for the Aussie stock market.
ASX200 Weekly
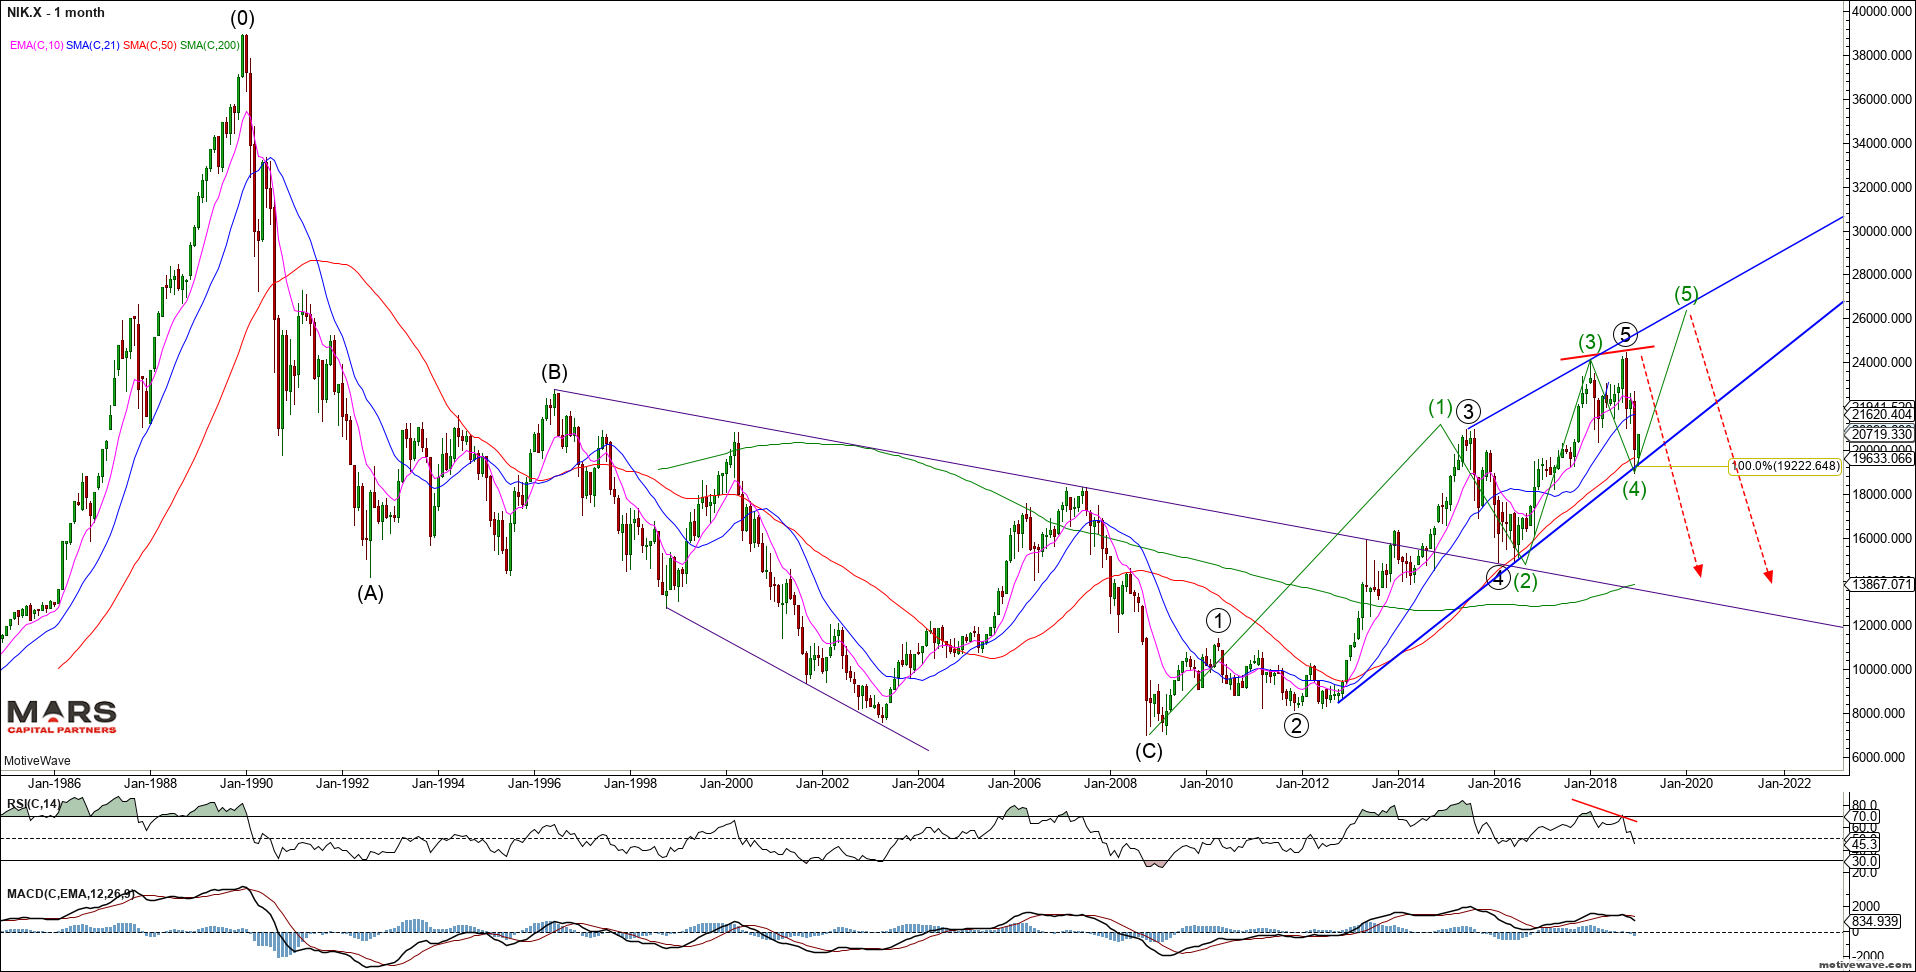
The Nikkei 225 appears to have completed 5 waves up from the 2009 lows. The decline from the highs is only in 3 waves of equality so far. While there is a small possibility of a push to marginal new highs, risks remain to the downside for the Japanese stock market.
Nikkei 225 Monthly
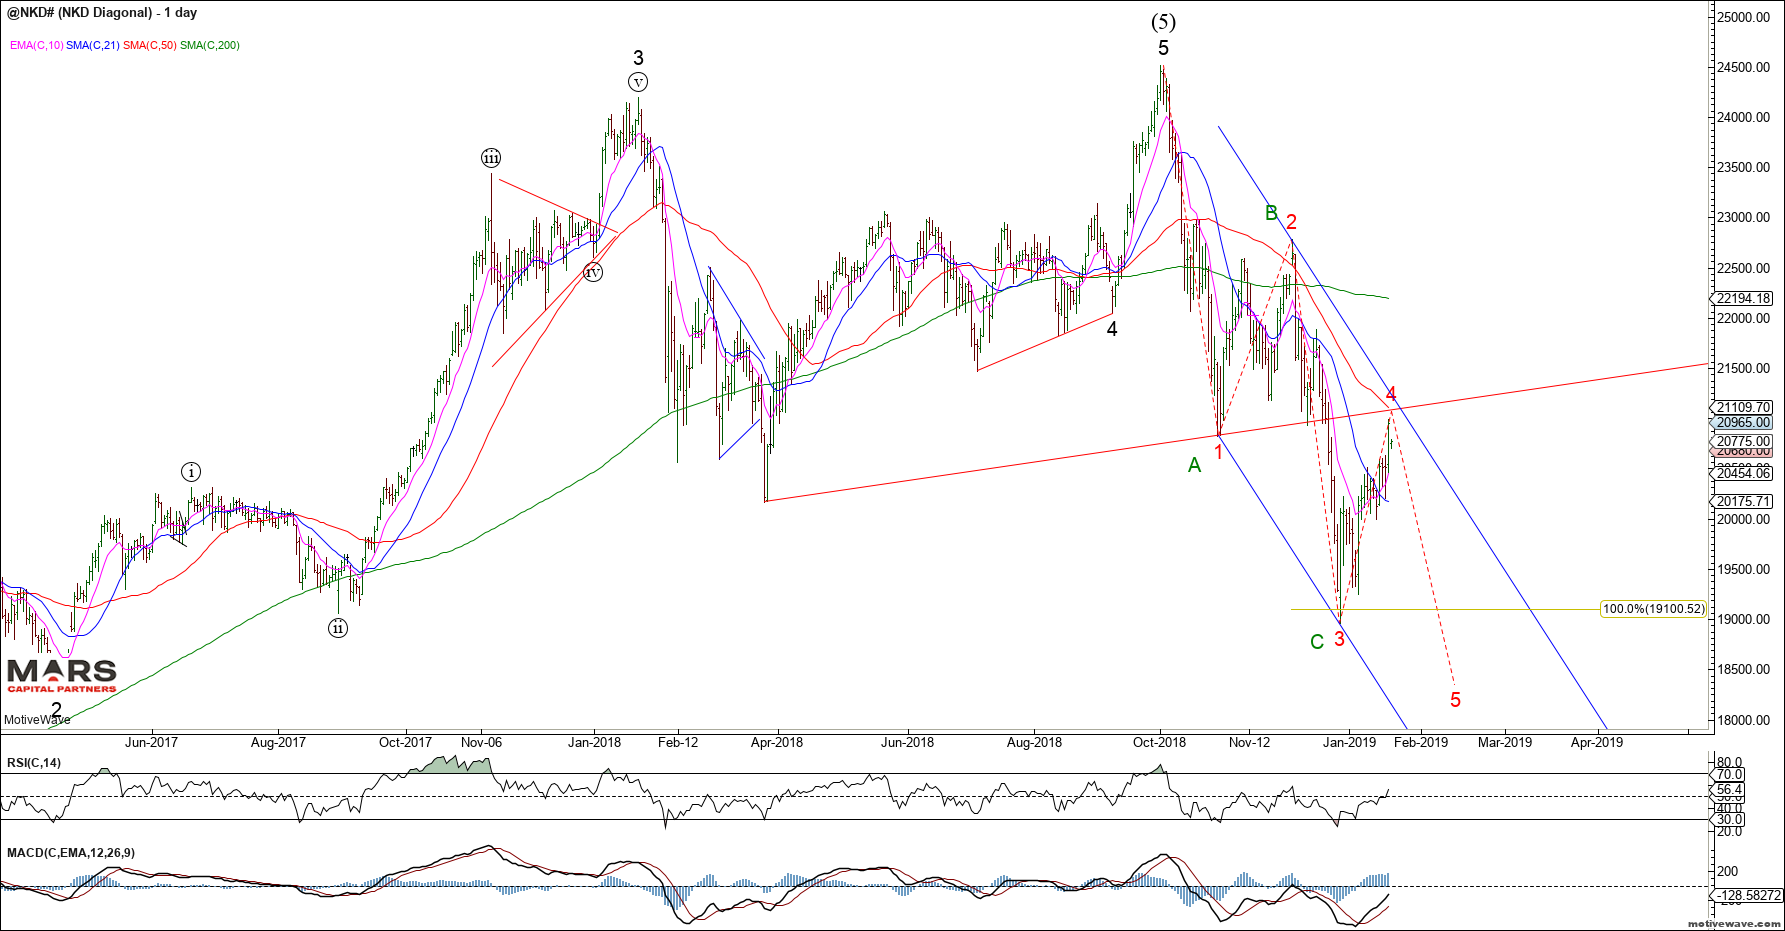
The NKD is currently backtesting its break of support and 50 day sma. So far the decline from the highs is a corrective 3 waves of equality and bears need to extend this down into 5 waves to avoid new highs. The price action is too choppy for clear near term direction.
NKD Daily
The European markets also bounced off structural support. So far we only have 3 waves down from the highs and this needs to extend to 5 waves down for a bigger picture change in trend. The DAX has strong resistance in the 11400-500 area from where the bears will need to make a stand. Immediate trade back above 12000 would invalidate the impulsive bear count.
DAX Weekly
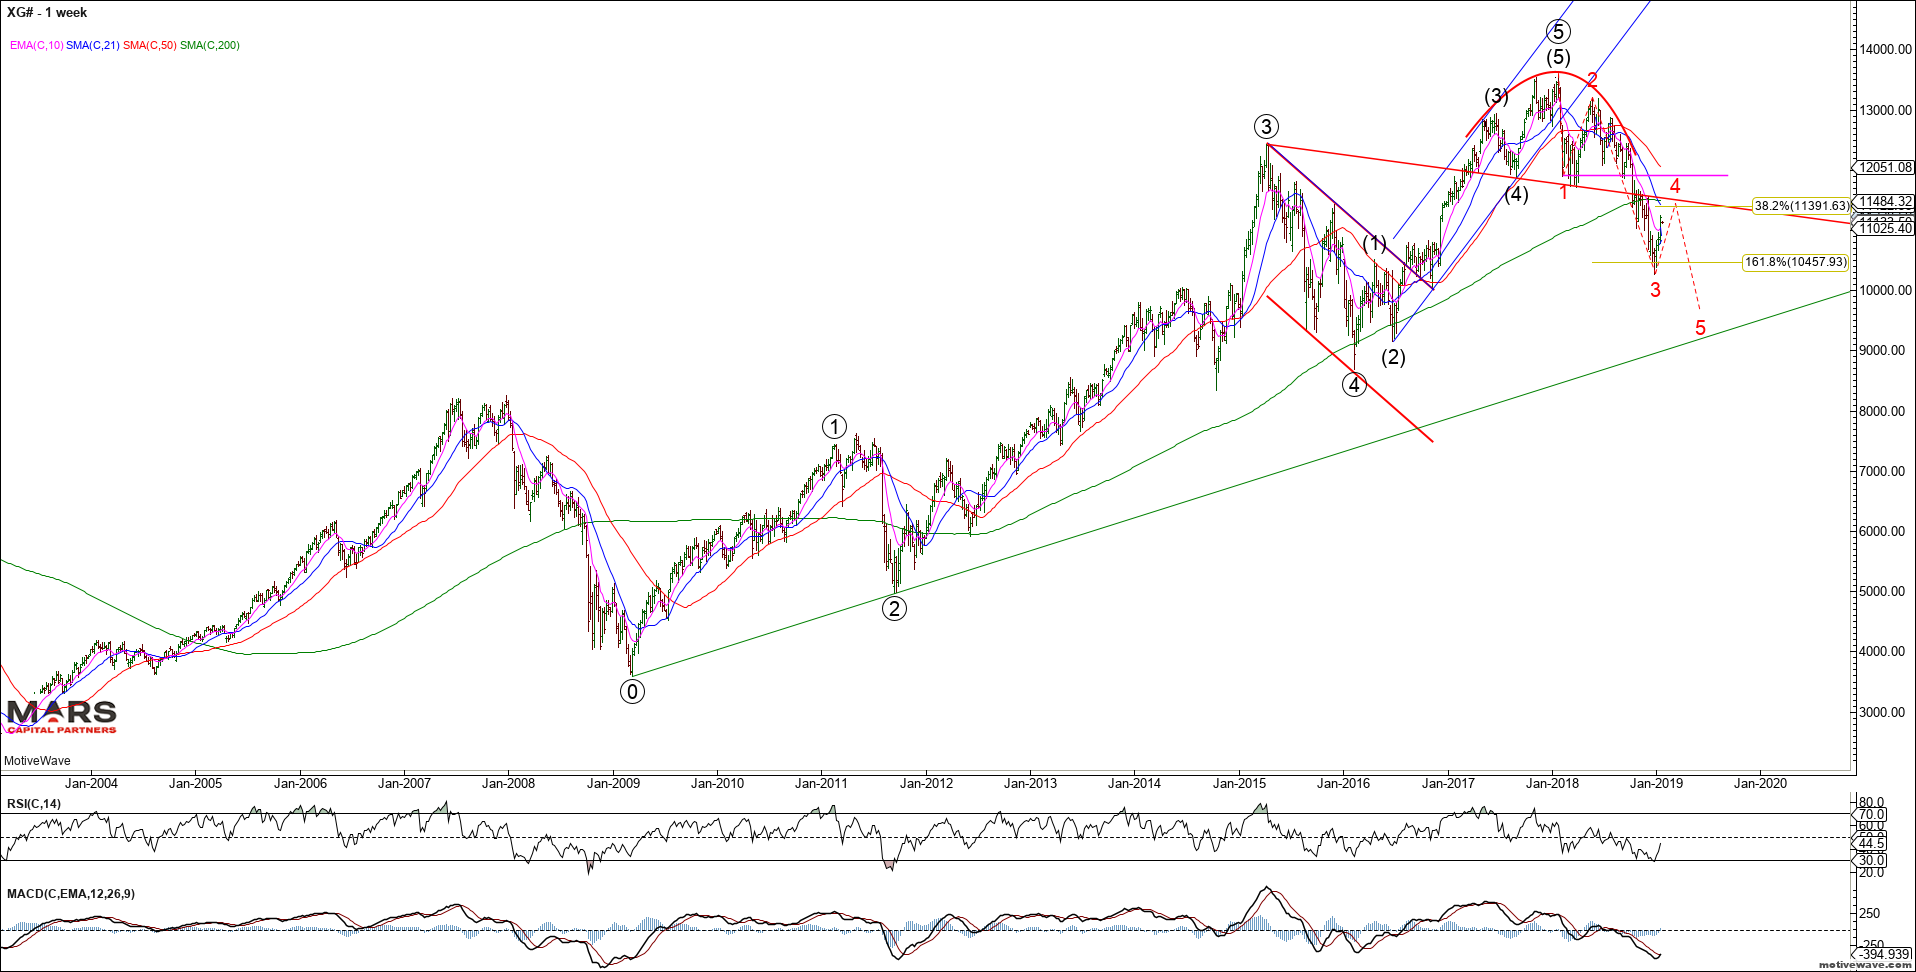
To the Bond markets and we are a very important inflection point. So far we have a corrective 3 wave rally in rates from the July 2016 lows across 10’s and 30’s. Rates need to extend higher immediately into 5 waves up above the November highs to invalidate the bearish potential. I have highlighted both bull and bear cases for reference. Due to the impulsive nature of the recent decline from the highs, the probability is that rates are likely going to new lows consistent with the deflationary outlook. We are bearish rates (bullish bonds) until proven otherwise by a rally above the November highs.
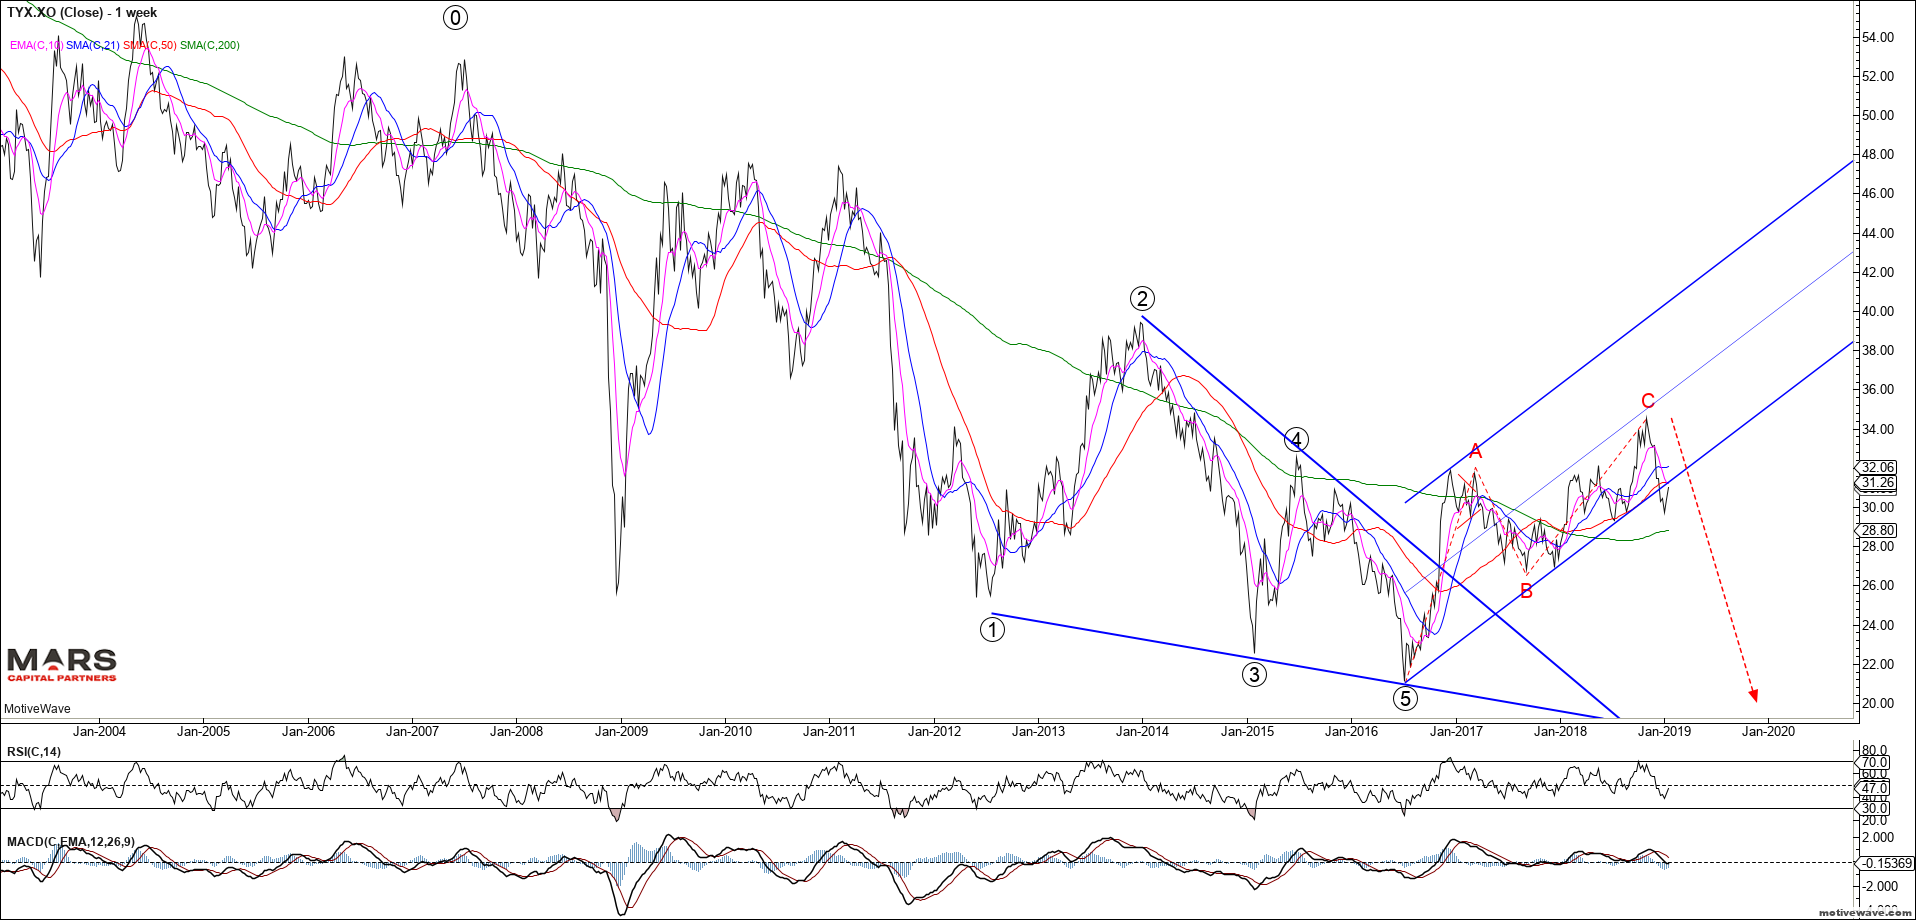
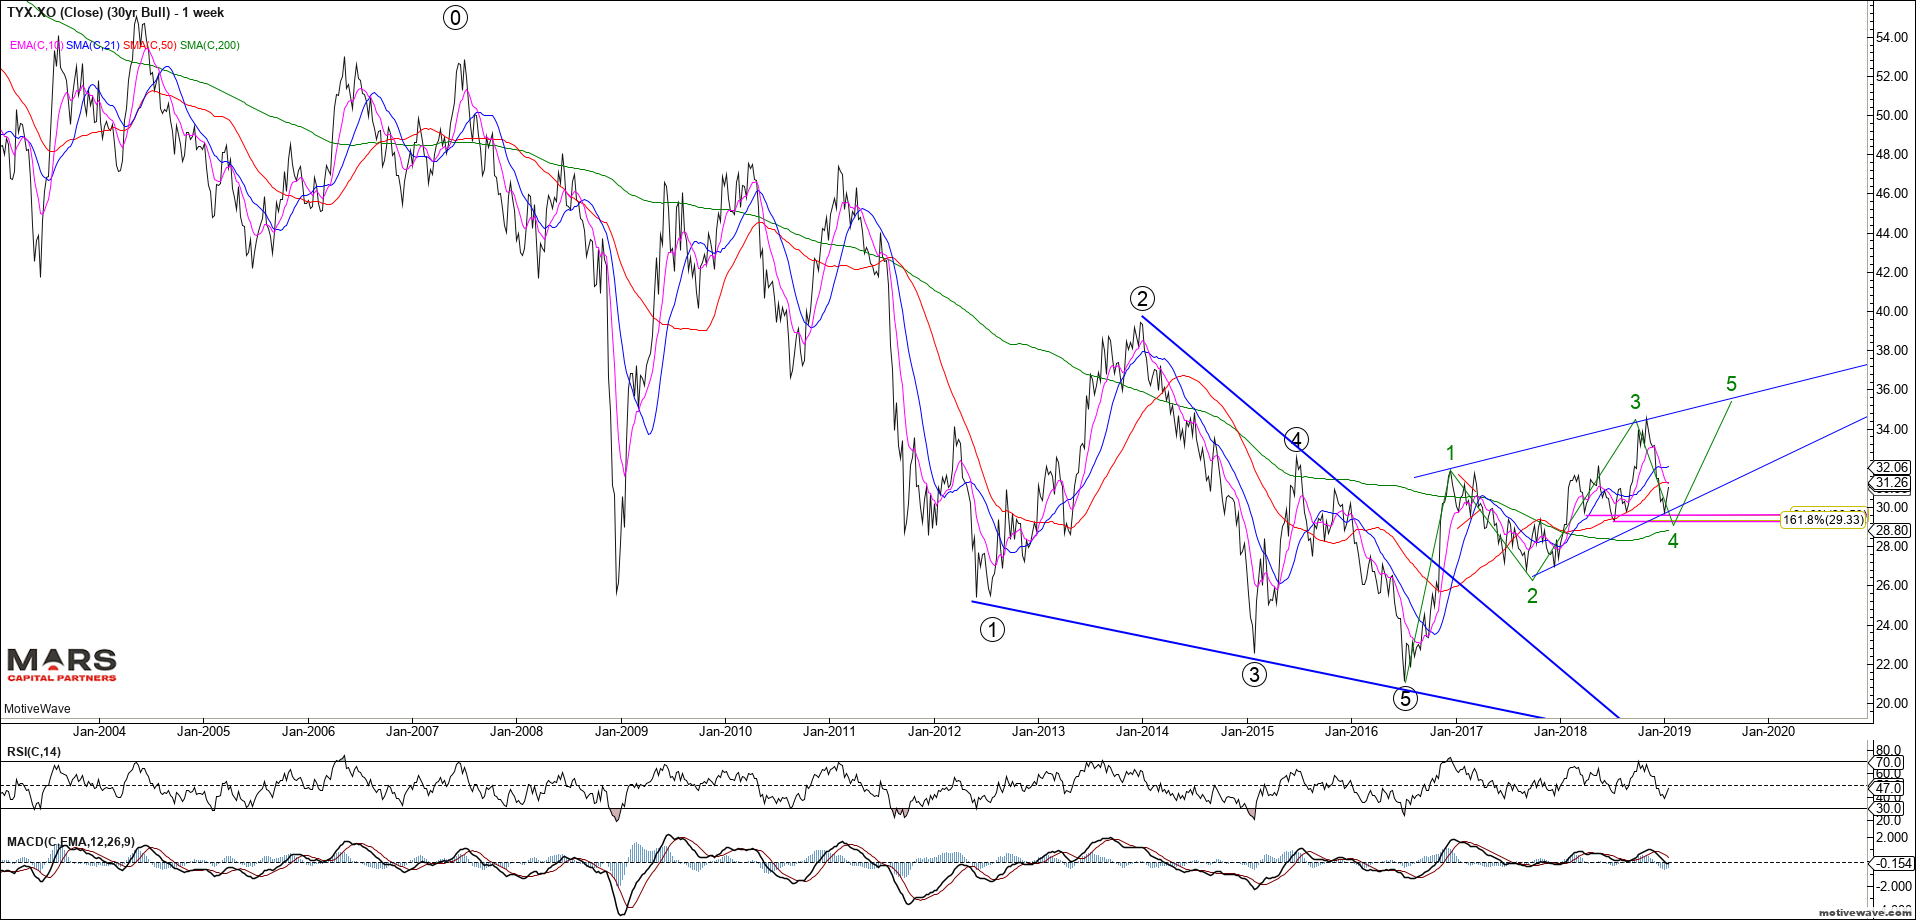
The 30yr highlights the muted rally from the September 2017 lows and impulsive decline from the wave C highs consistent with a more bearish outlook.
TYX Bear Case WeeklyTYX Bull Case Weekly
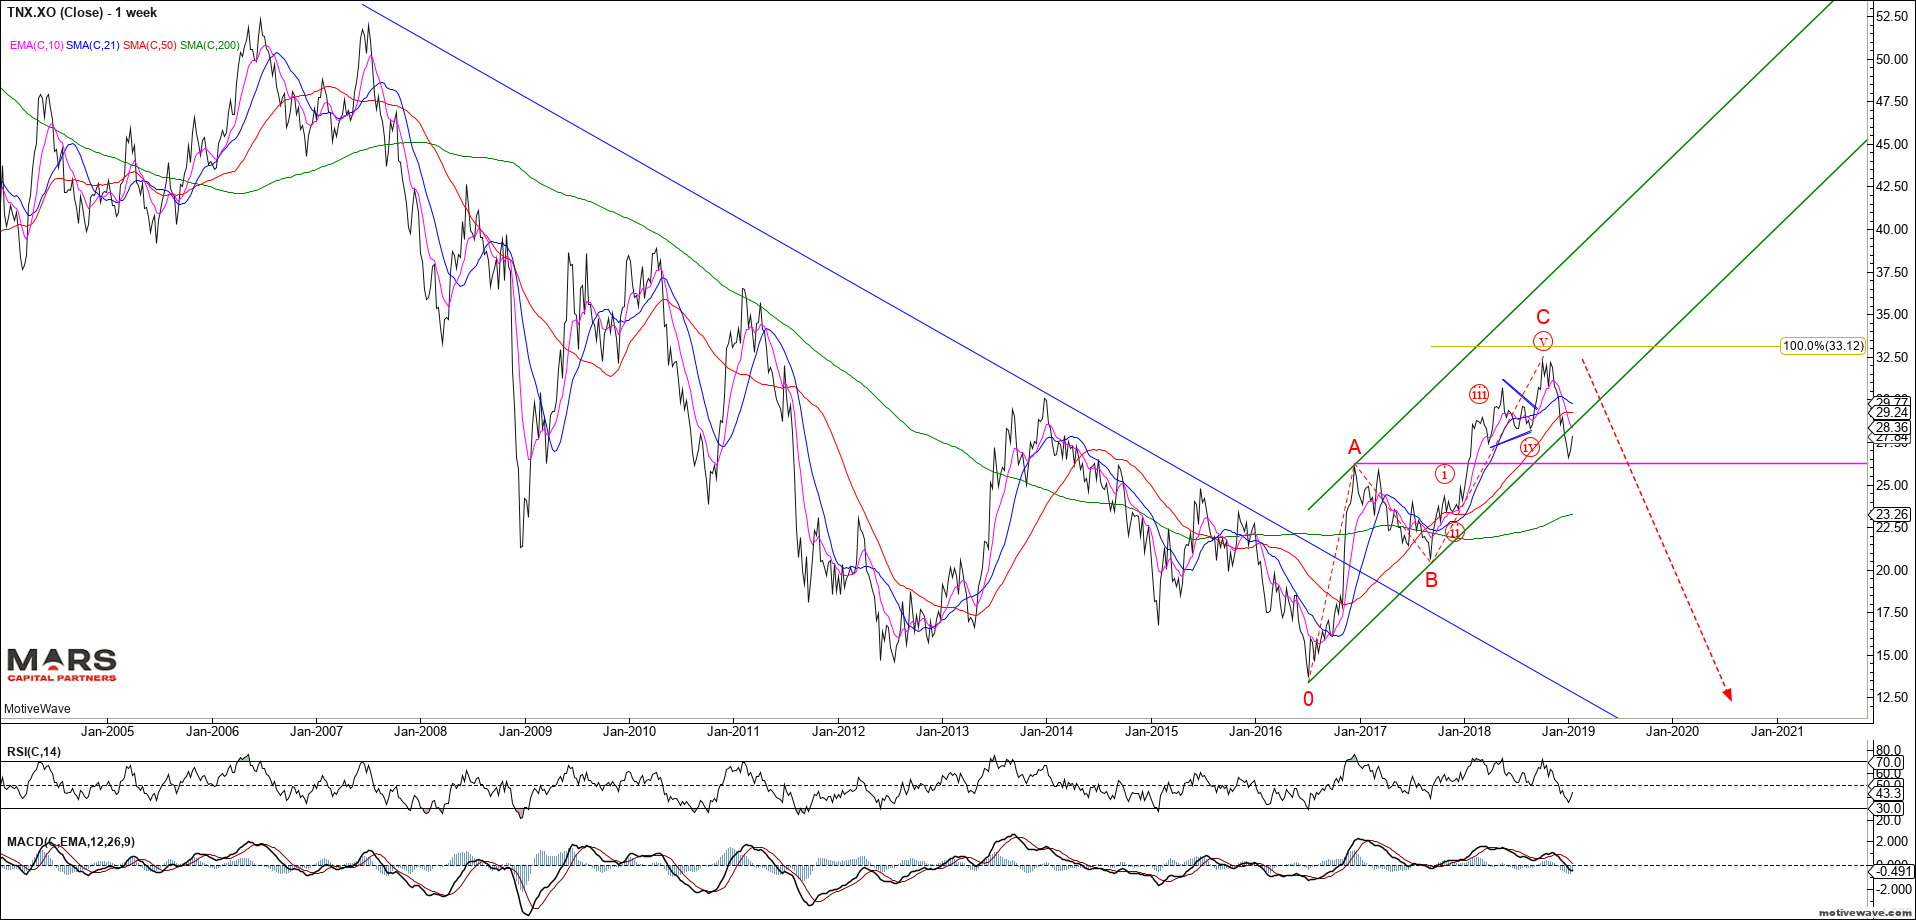
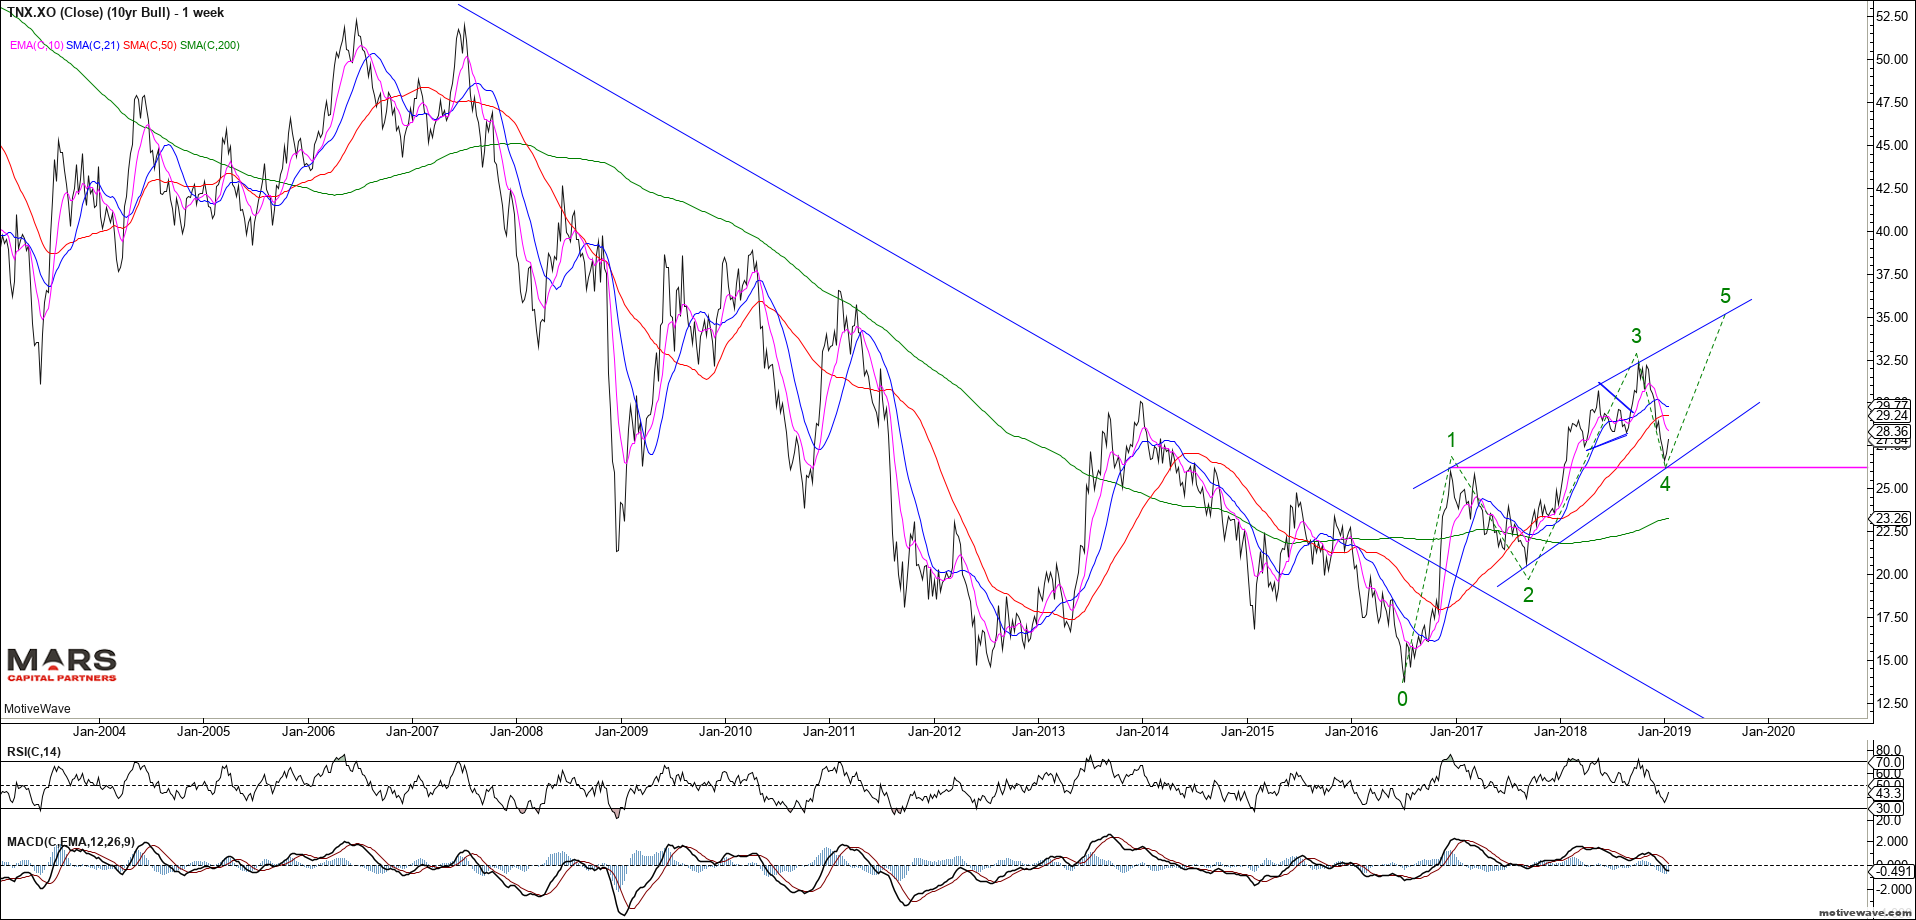
The 10yr shows the same potential wave counts with 3 waves up of equality from the July 2016 lows. A strong close below 2.60 would be consistent with the more bearish rates outlook. The bearish count is wrong at new cycle highs which would indicate the bigger picture trend had turned UP for the long term.
TNX Bear Case WeeklyTNX Bull Case Weekly
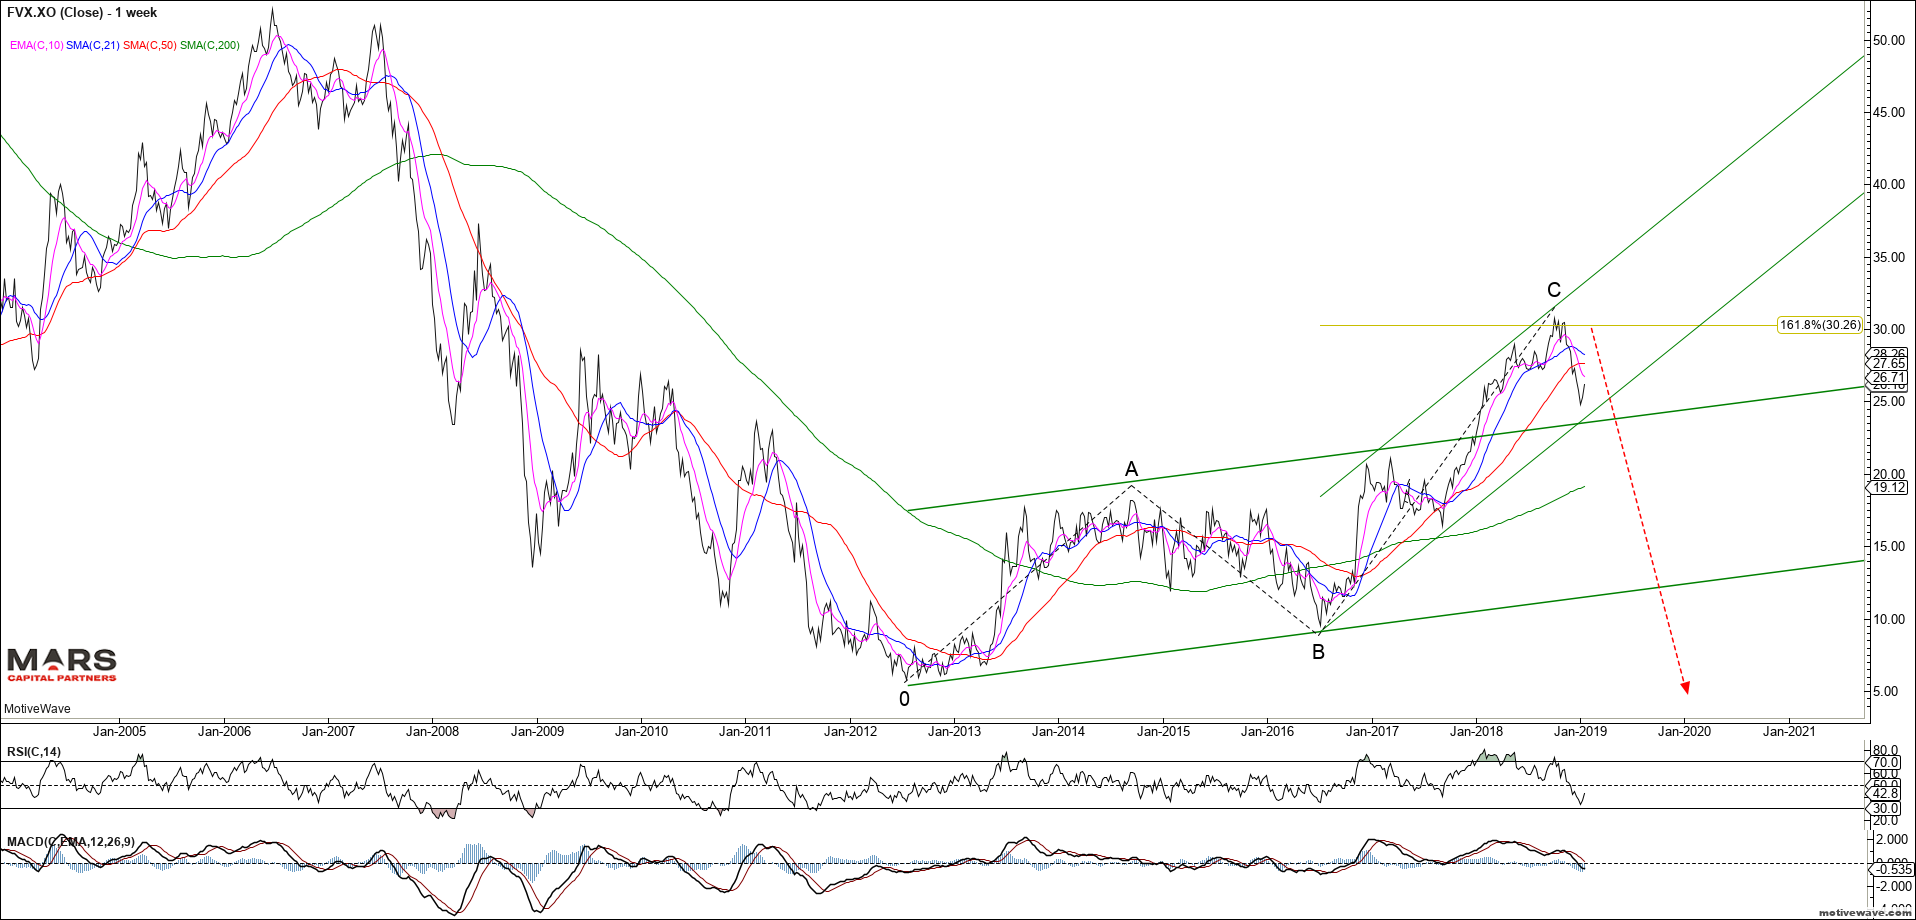
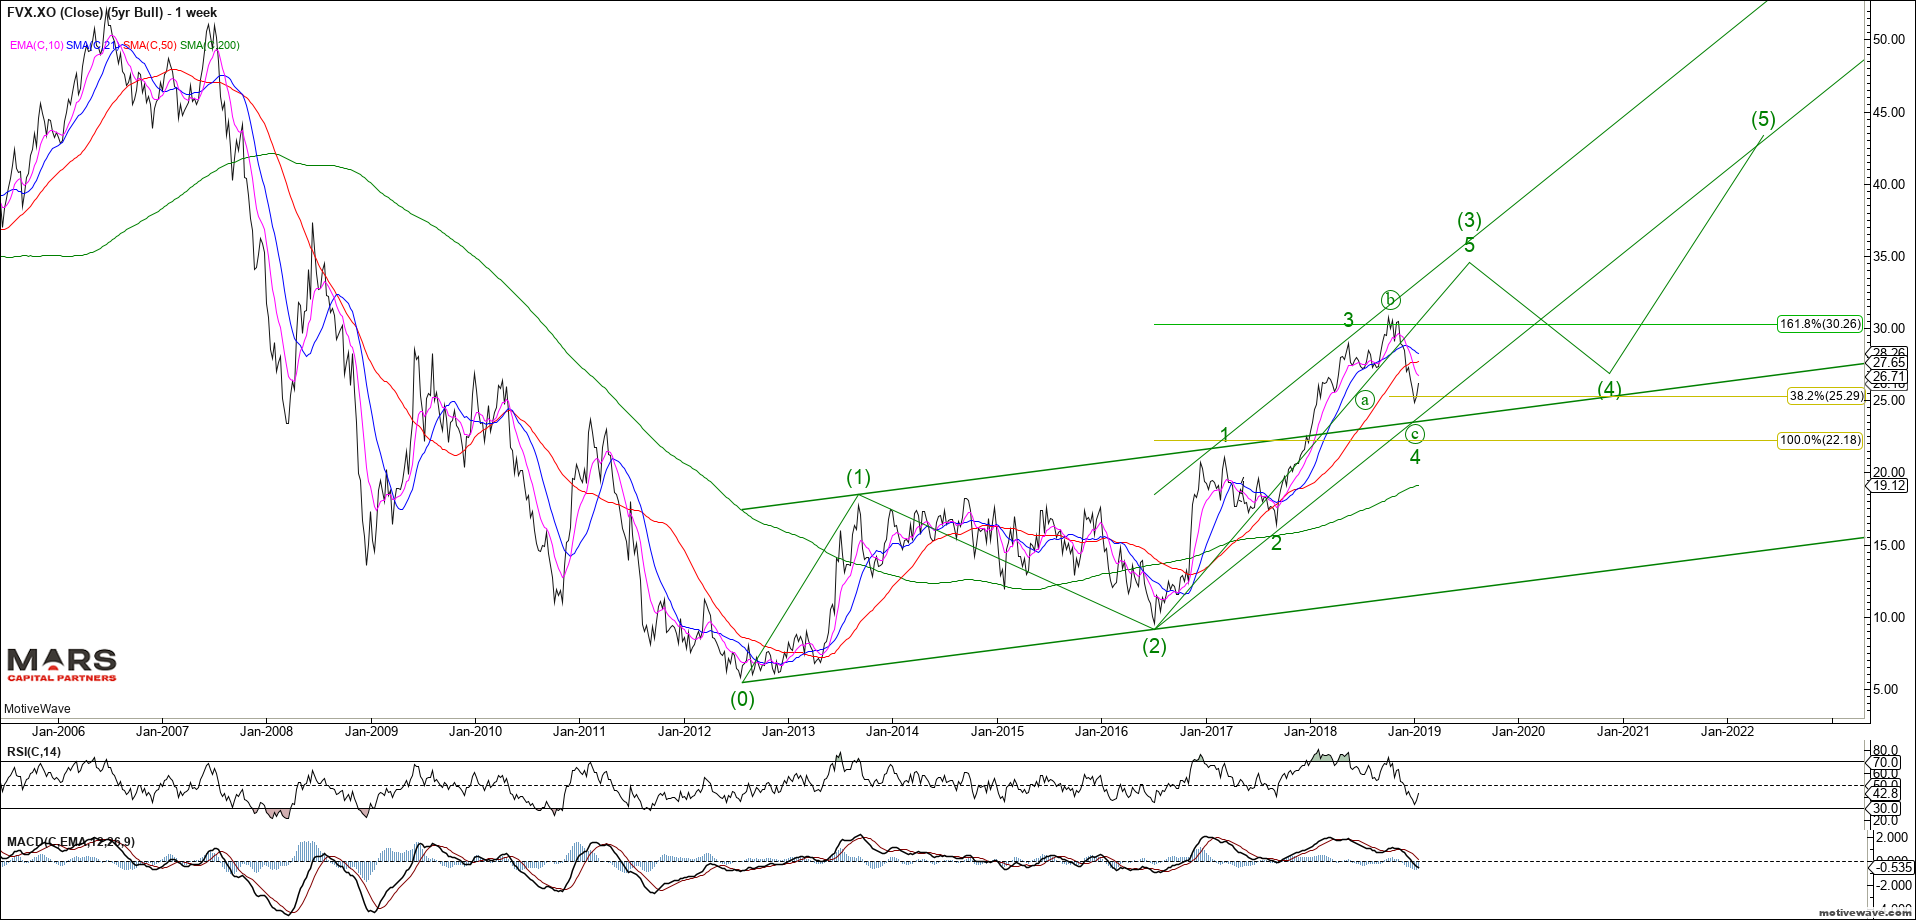
The 5yr is more complicated as the rally in rates failed at our 161.8% Fib extension followed by an impulsive decline. Rate Bears have control while we remain below the September highs.
FVX Bear Case WeeklyFVX Bull Case Weekly
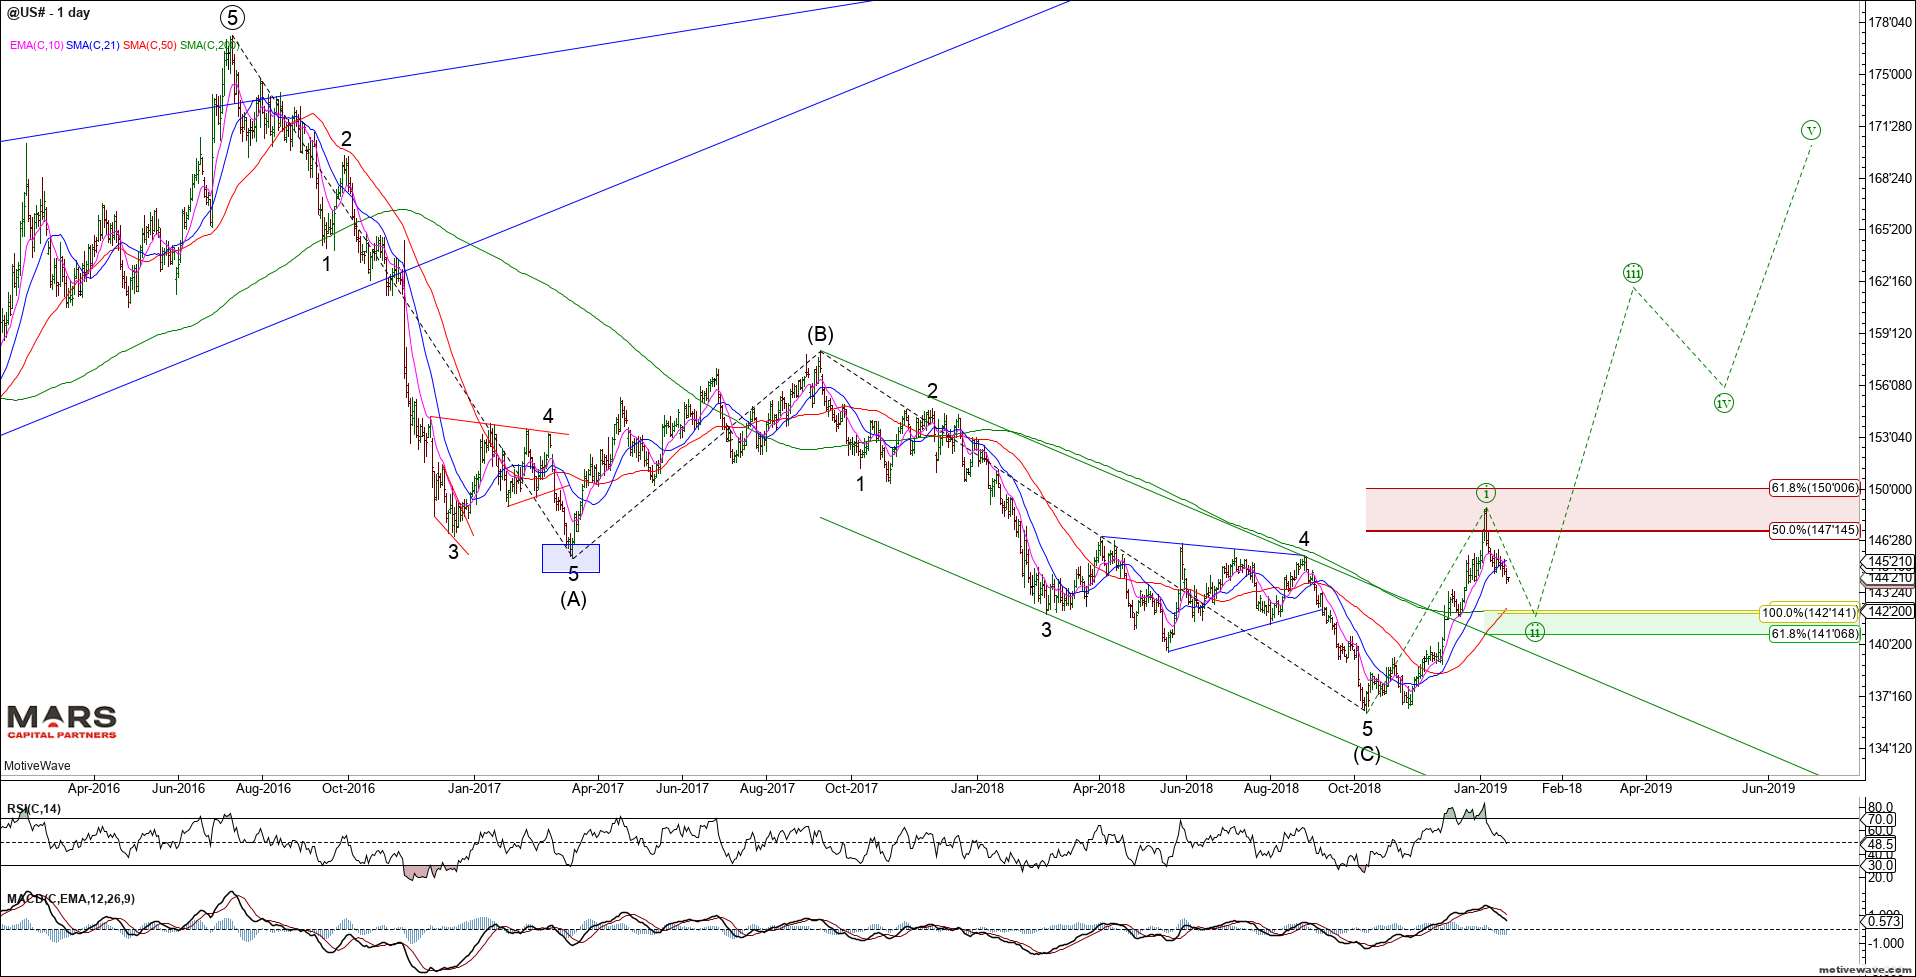
The bond futures tell the same story. The ZB shows a corrective 3 waves down from the ATH’s. This structure remains very bullish bonds while the October cycle lows hold. Ideal buying levels are closer towards 141-142’20 against cycle lows.
ZB Daily
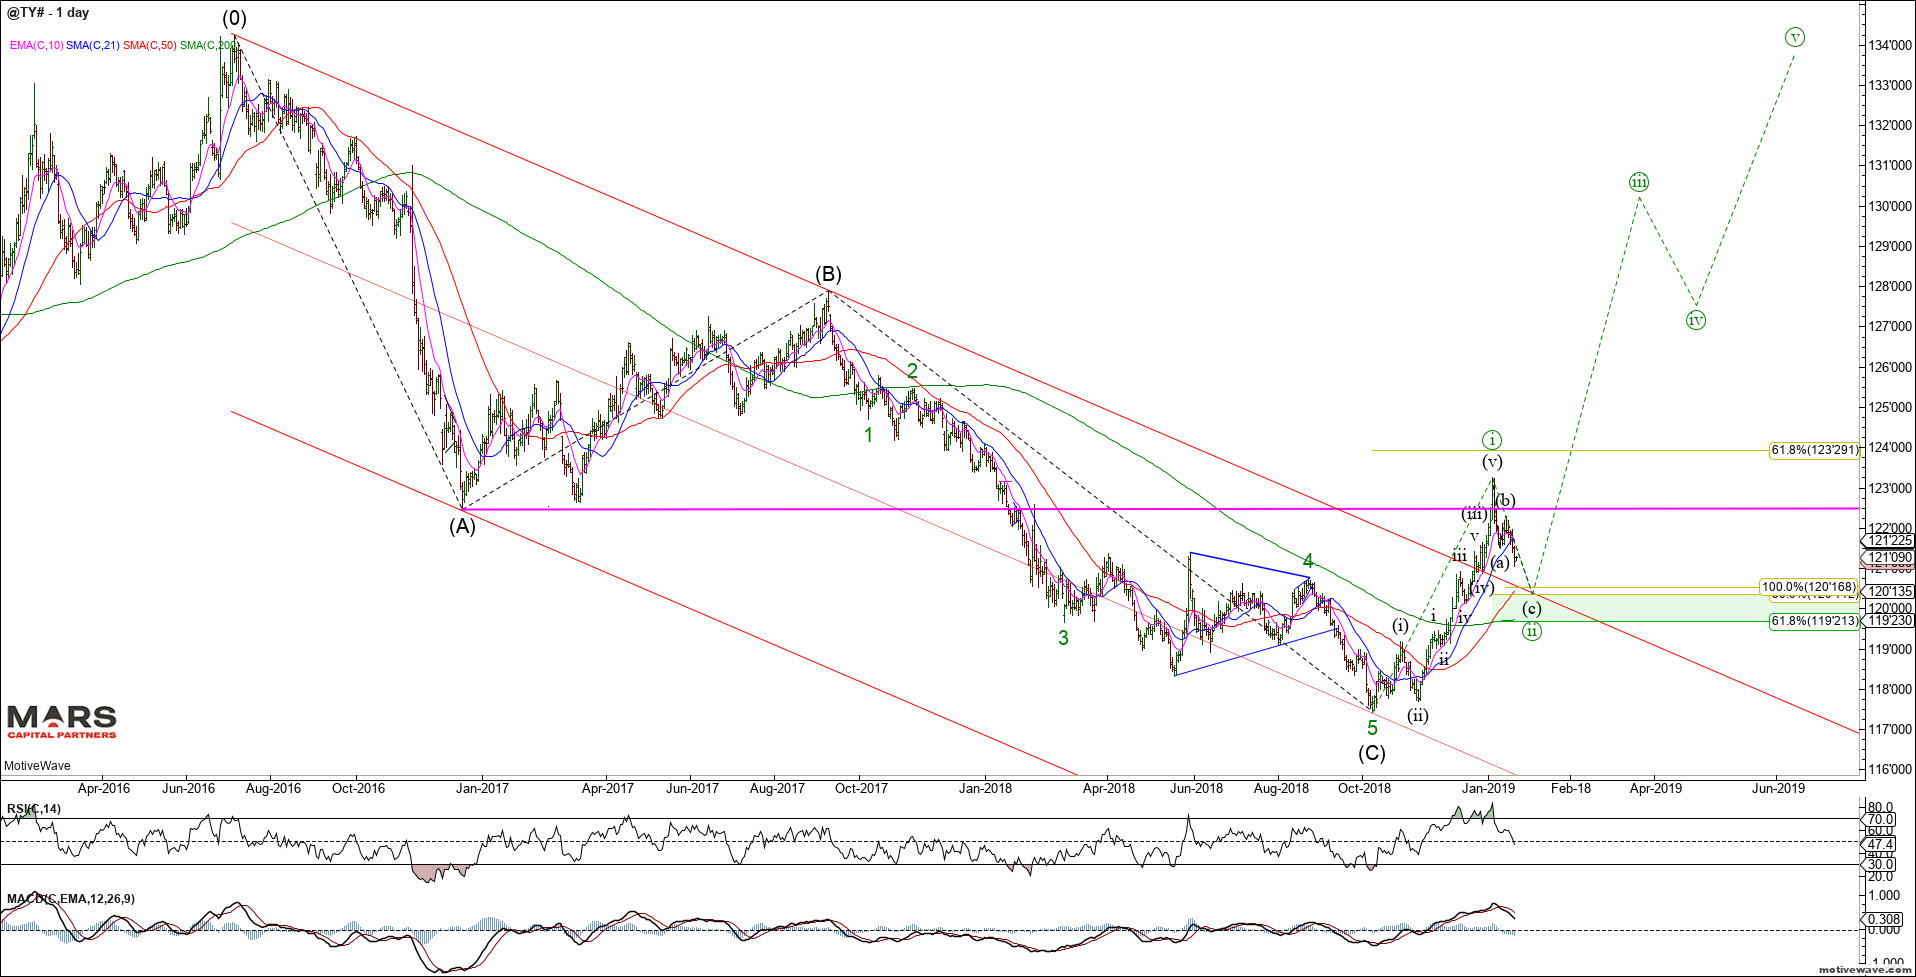
The ZN (TY) shows the same structure with 3 waves down from ATH’s and an impulsive rally from the lows. This implies that the bigger picture trend is up for bonds with support in the 119’23-120’15 area. Trade below the October lows would invalidate the bearish count.
ZN (TY) Daily
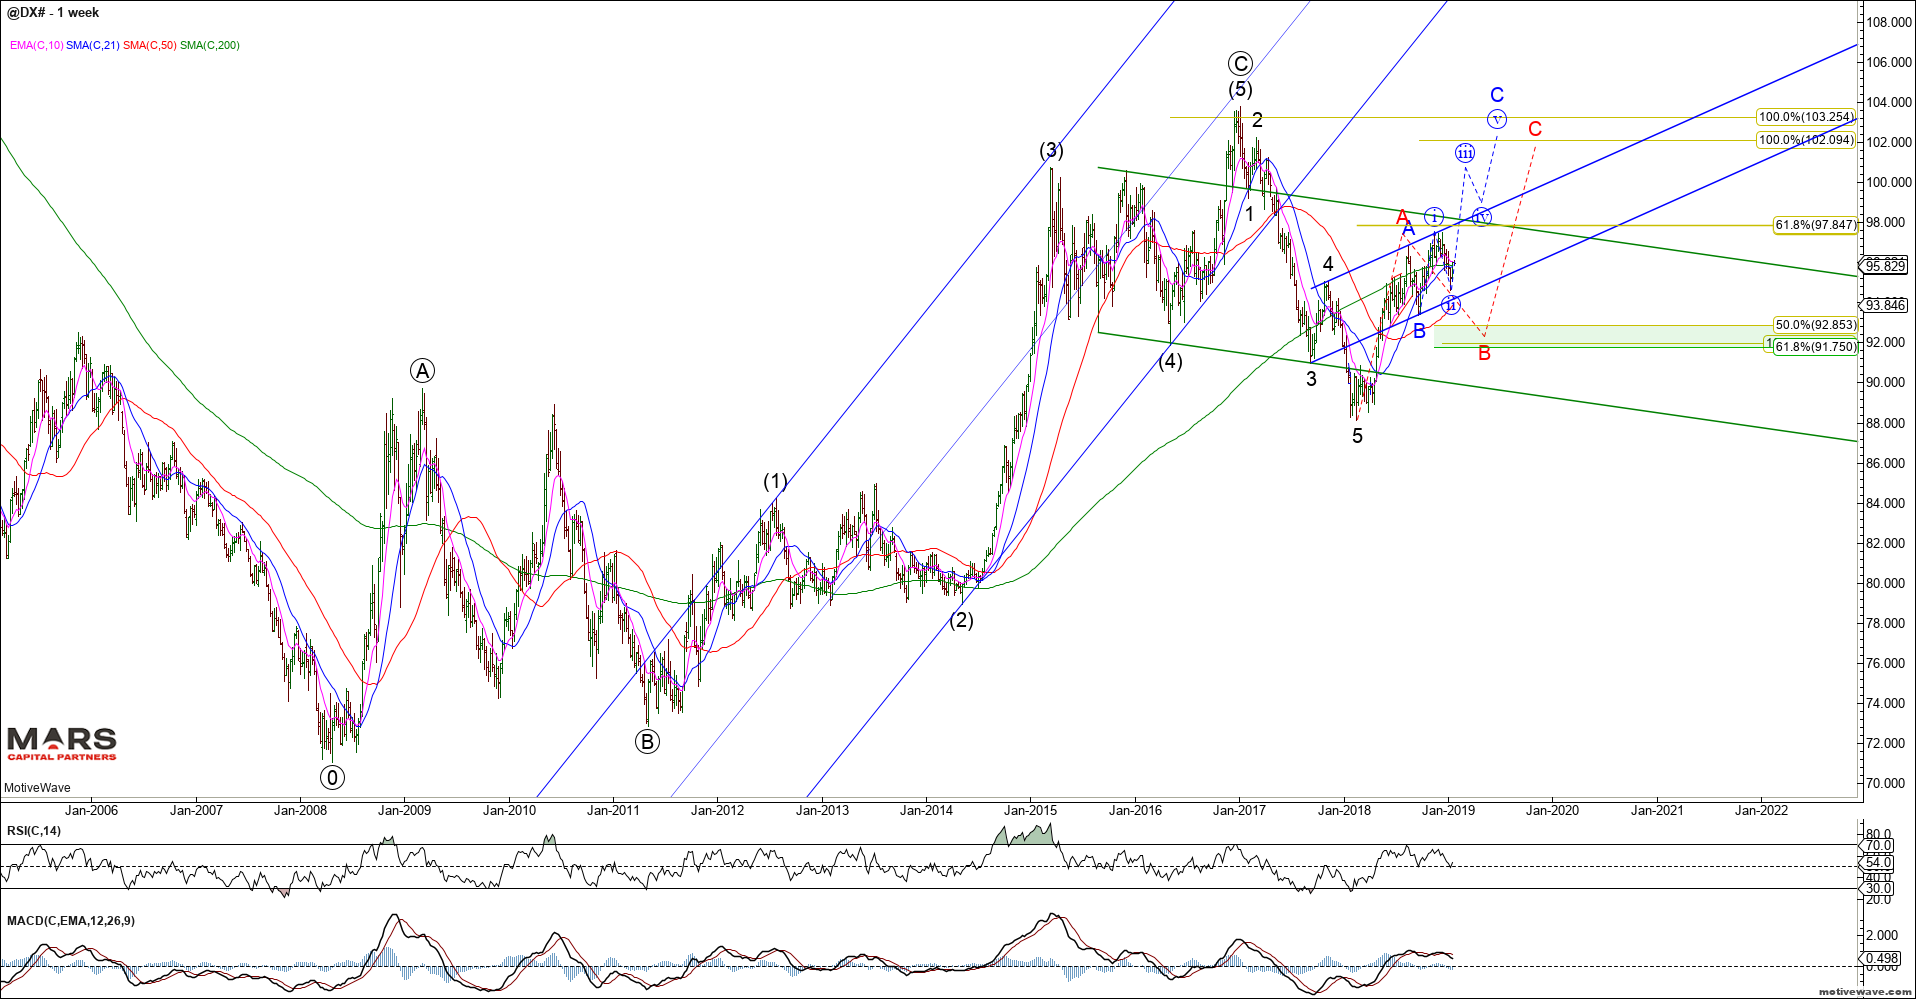
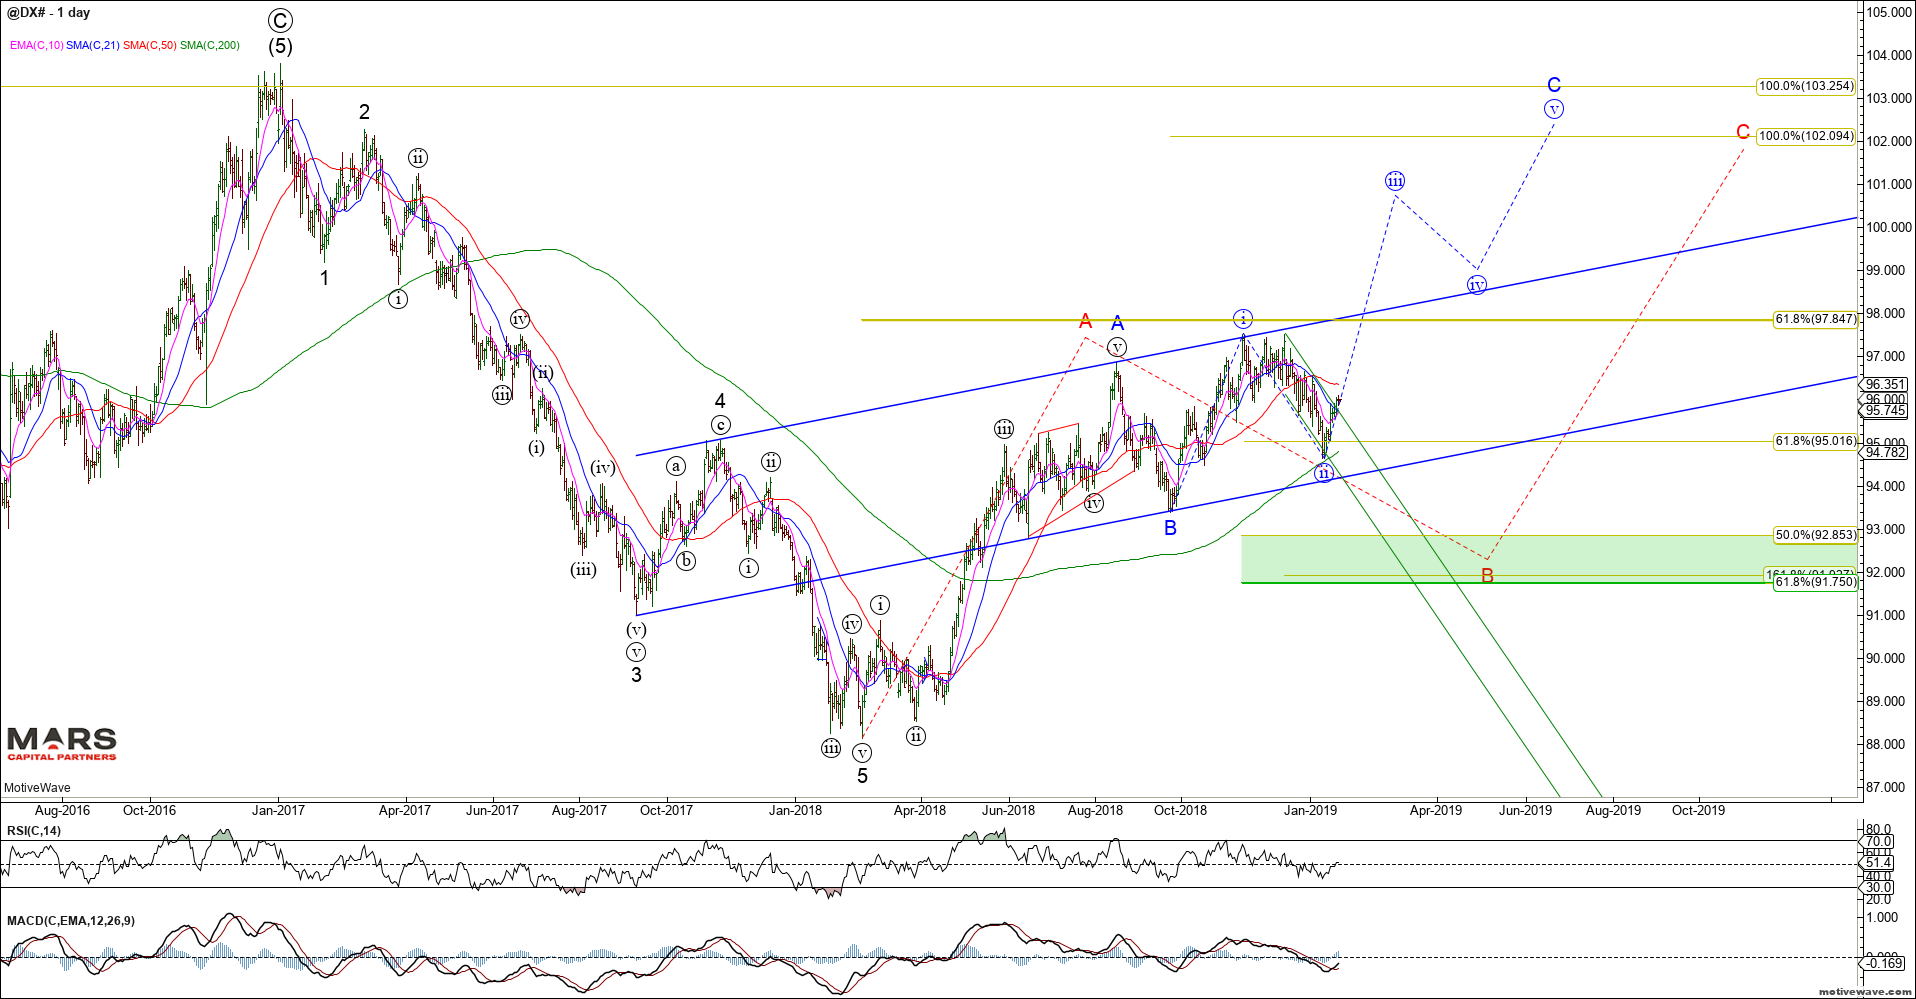
To the FX markets and the US dollar strength continues. We remain bullish the DXY looking for a retest of the 2017 highs. The question is whether we rally immediately while holding recent wave (ii) lows (blue count) or we need a deeper correction towards the 92-93 area (red count) before the wave C higher can reassert itself.
DXY WeeklyDXY Daily
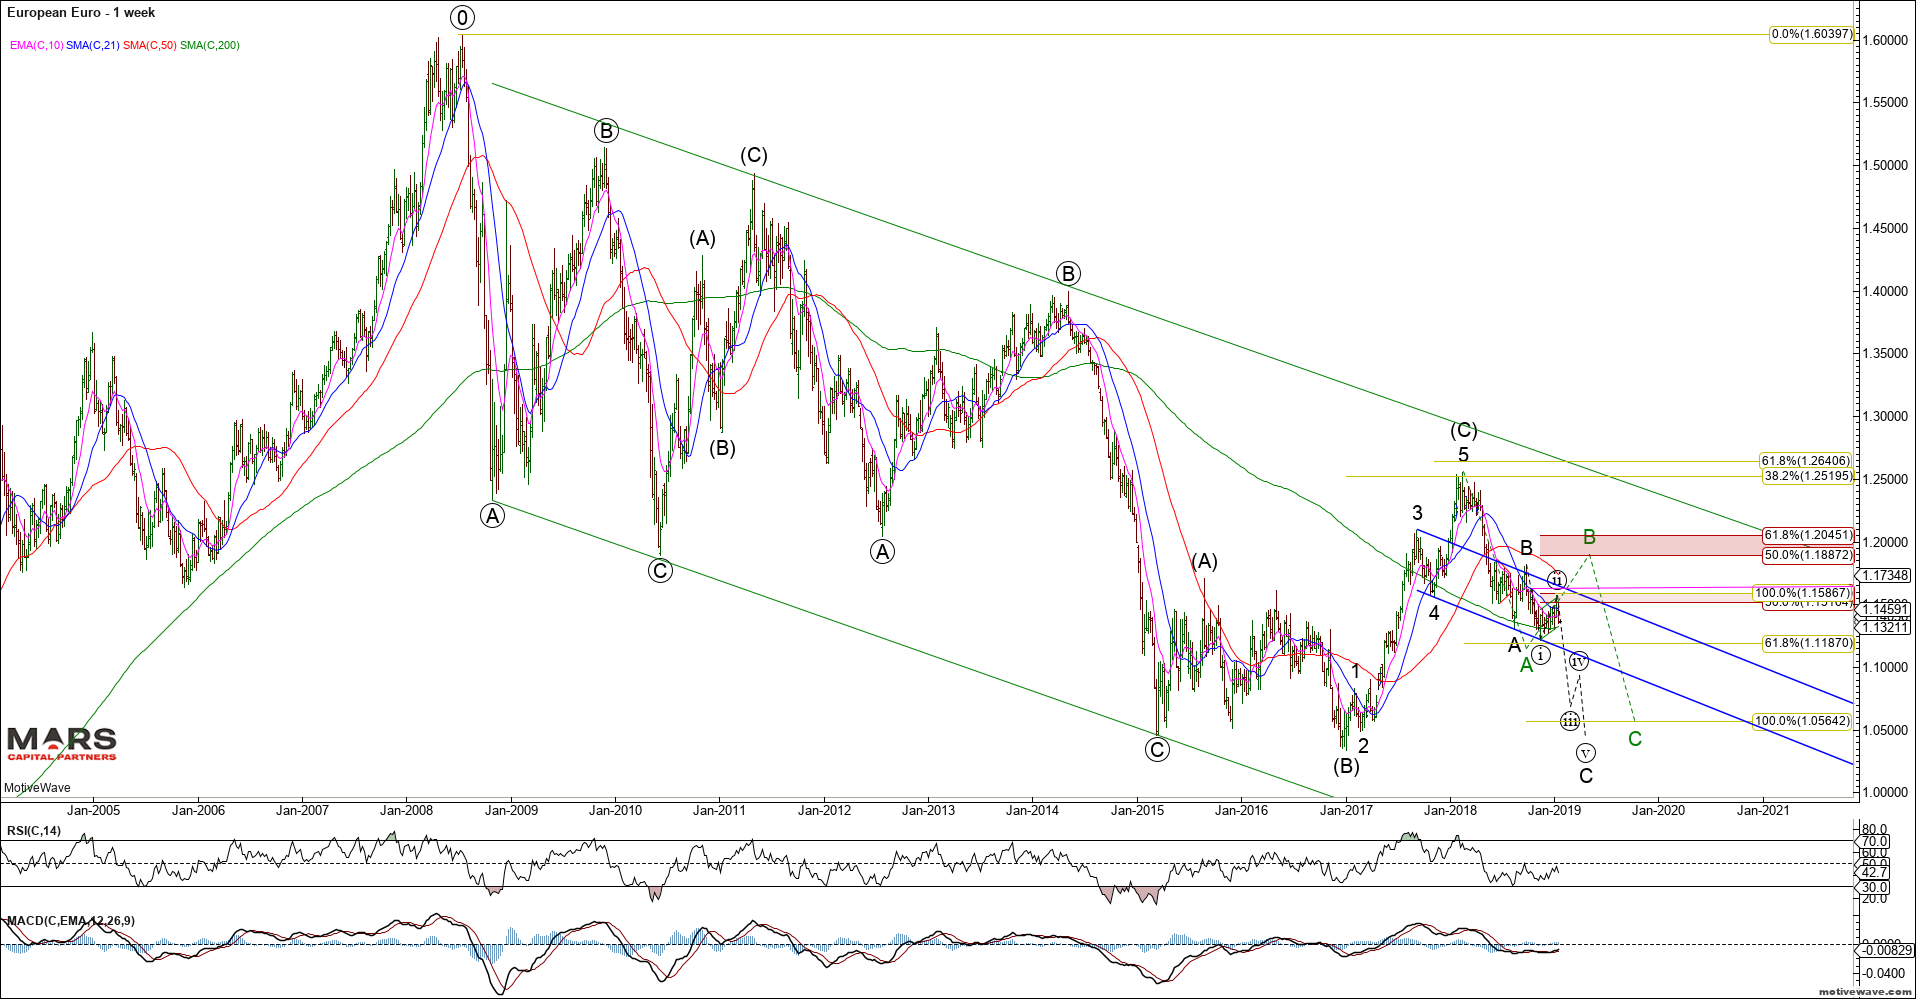
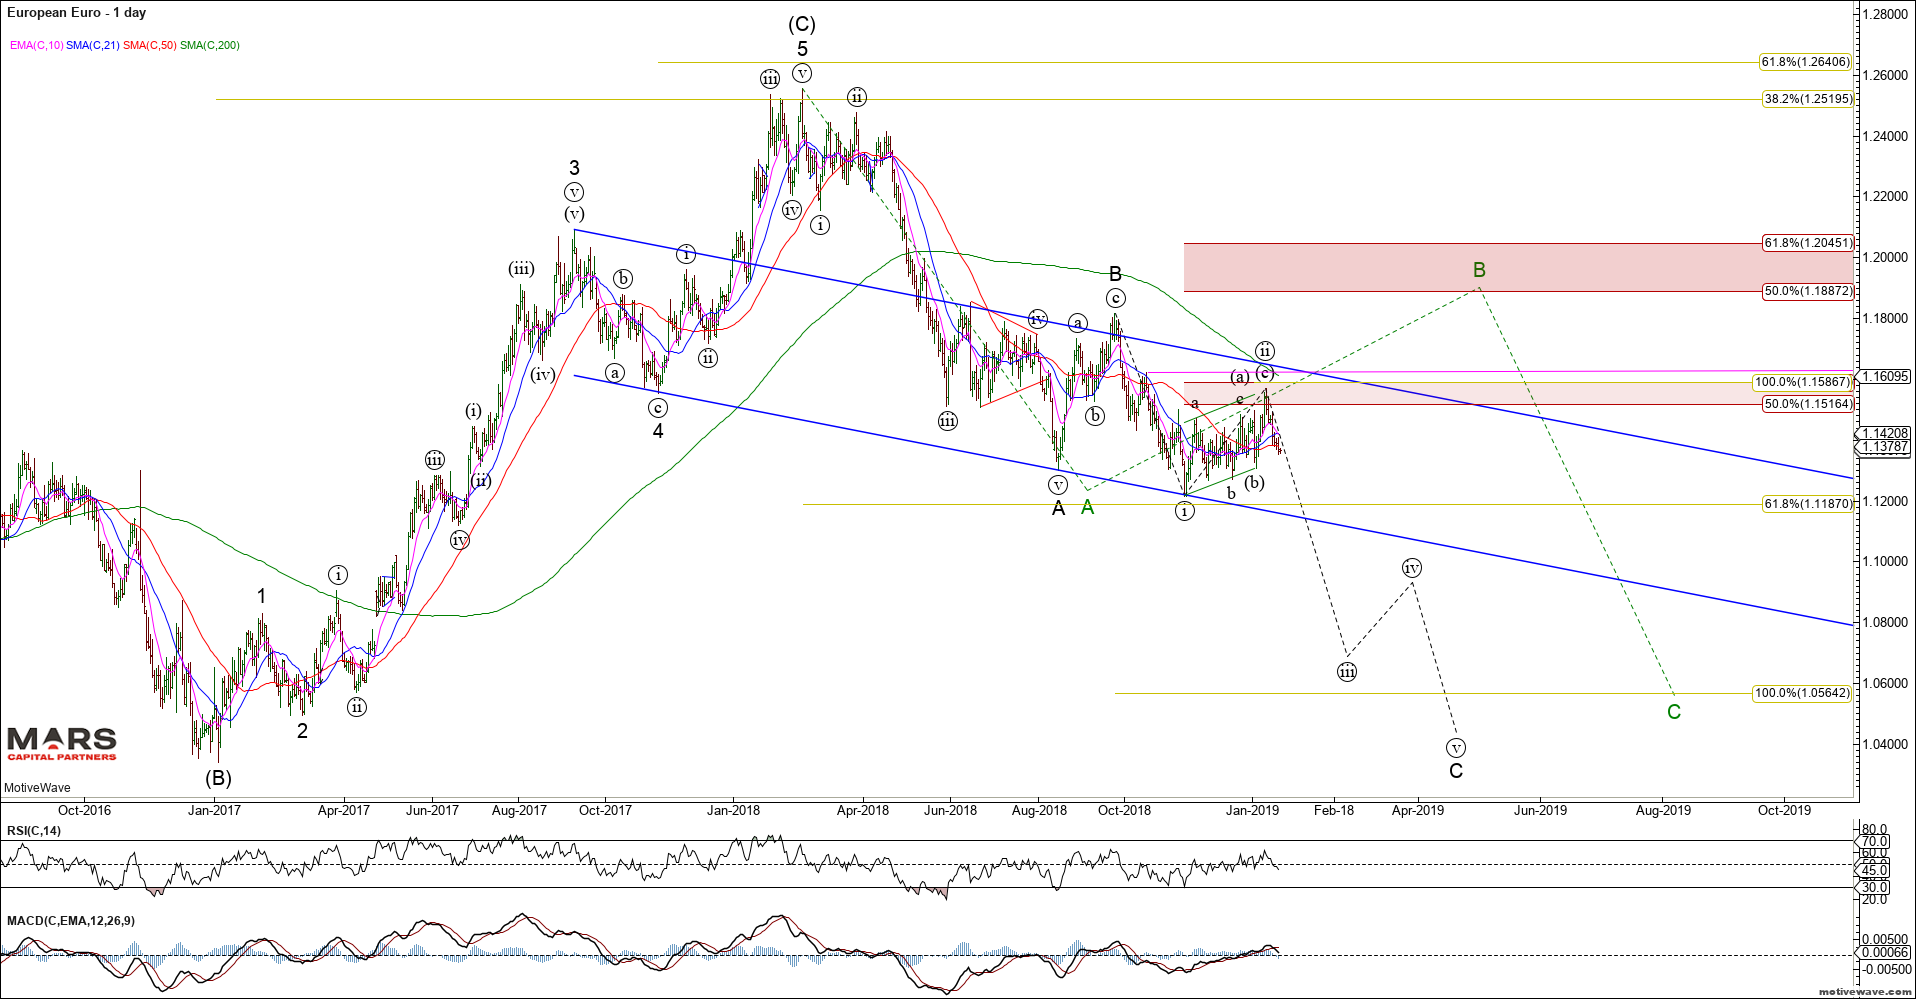
The Euro shows the same structure having turned down from our initial 1.16 resistance as we target a break of 1.12 that should lead to a retest of the 2017 lows. The alternate green count requires a push higher towards 1.19-1.20 before the bear trend can reassert itself. We remain bearish the Euro.
EURUSD WeeklyEURUSD Daily
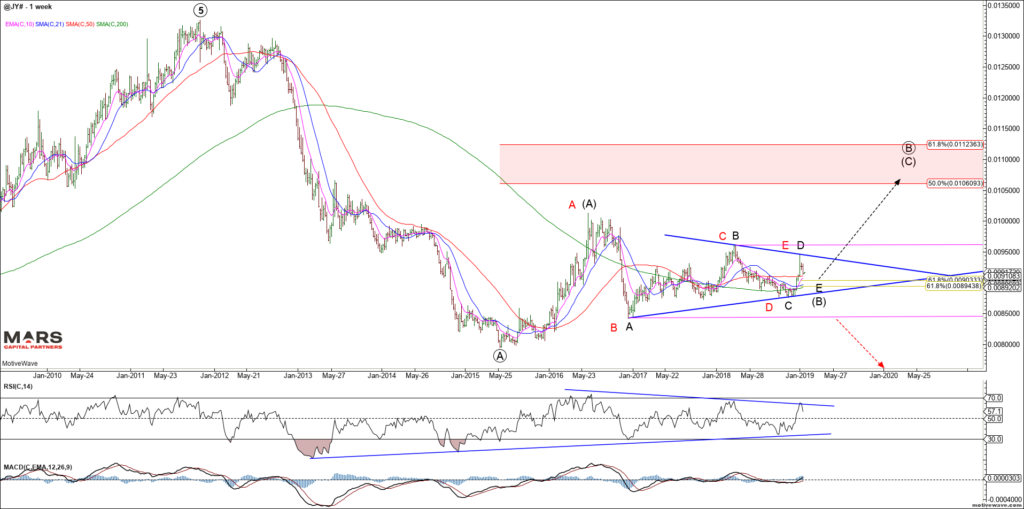
The Yen remains trapped within its triangle consolidation since its 2015 lows. Note the compression in the weekly RSI below. Despite historic levels of QE and asset purchases, the BOJ hasn’t been able to move the needle on the Yen. As we’ve seen many times in the past, volatility compression ultimately leads to volatility expansion. Ideal targets for black wave E of (B) are in the 89.50-90.50 area for the Yen. We expect this triangle to break (likely higher) in early 2019.
Yen Weekly
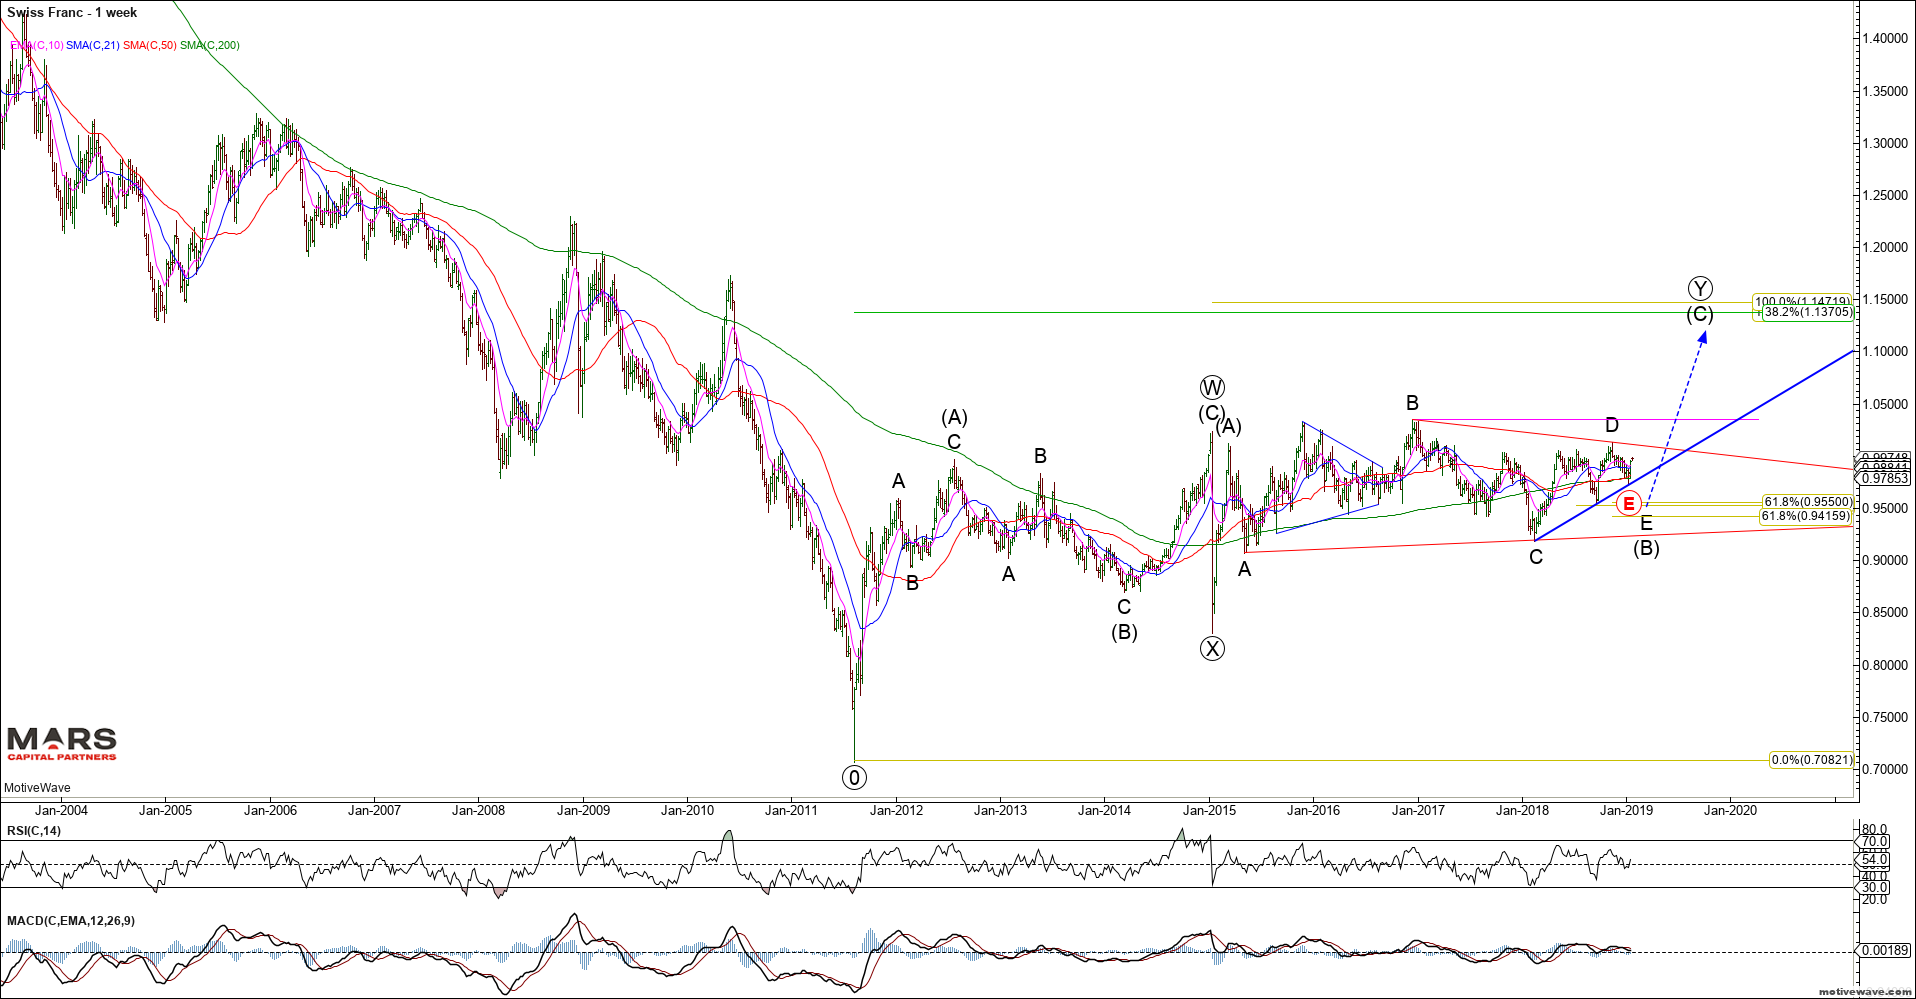
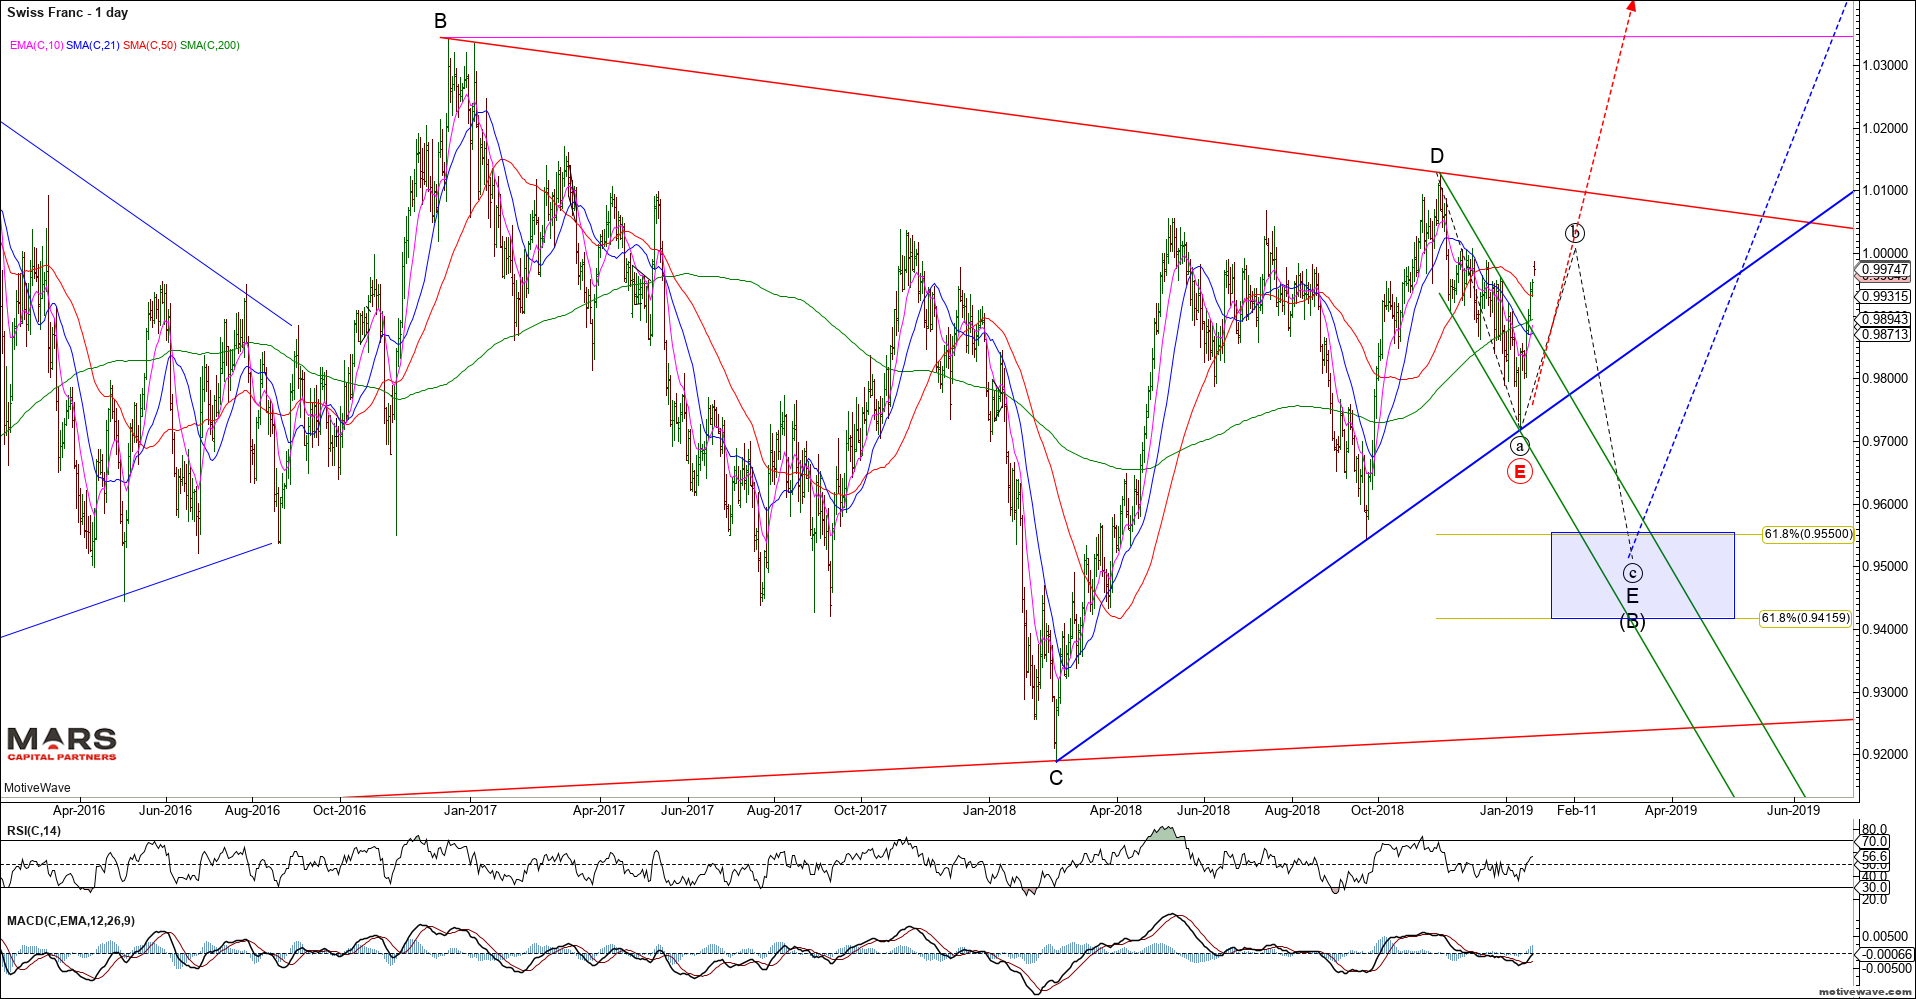
Similarly, we are very bearish the Swiss Franc as we look for a break out of its 8 year consolidation. We are bullish the USDCHF near term against recent swing lows (red E). A break of recent lows targets the 0.94-0.955 secondary support zone from where we would look to get bullish once again.
USDCHF WeeklyUSDCHF Daily
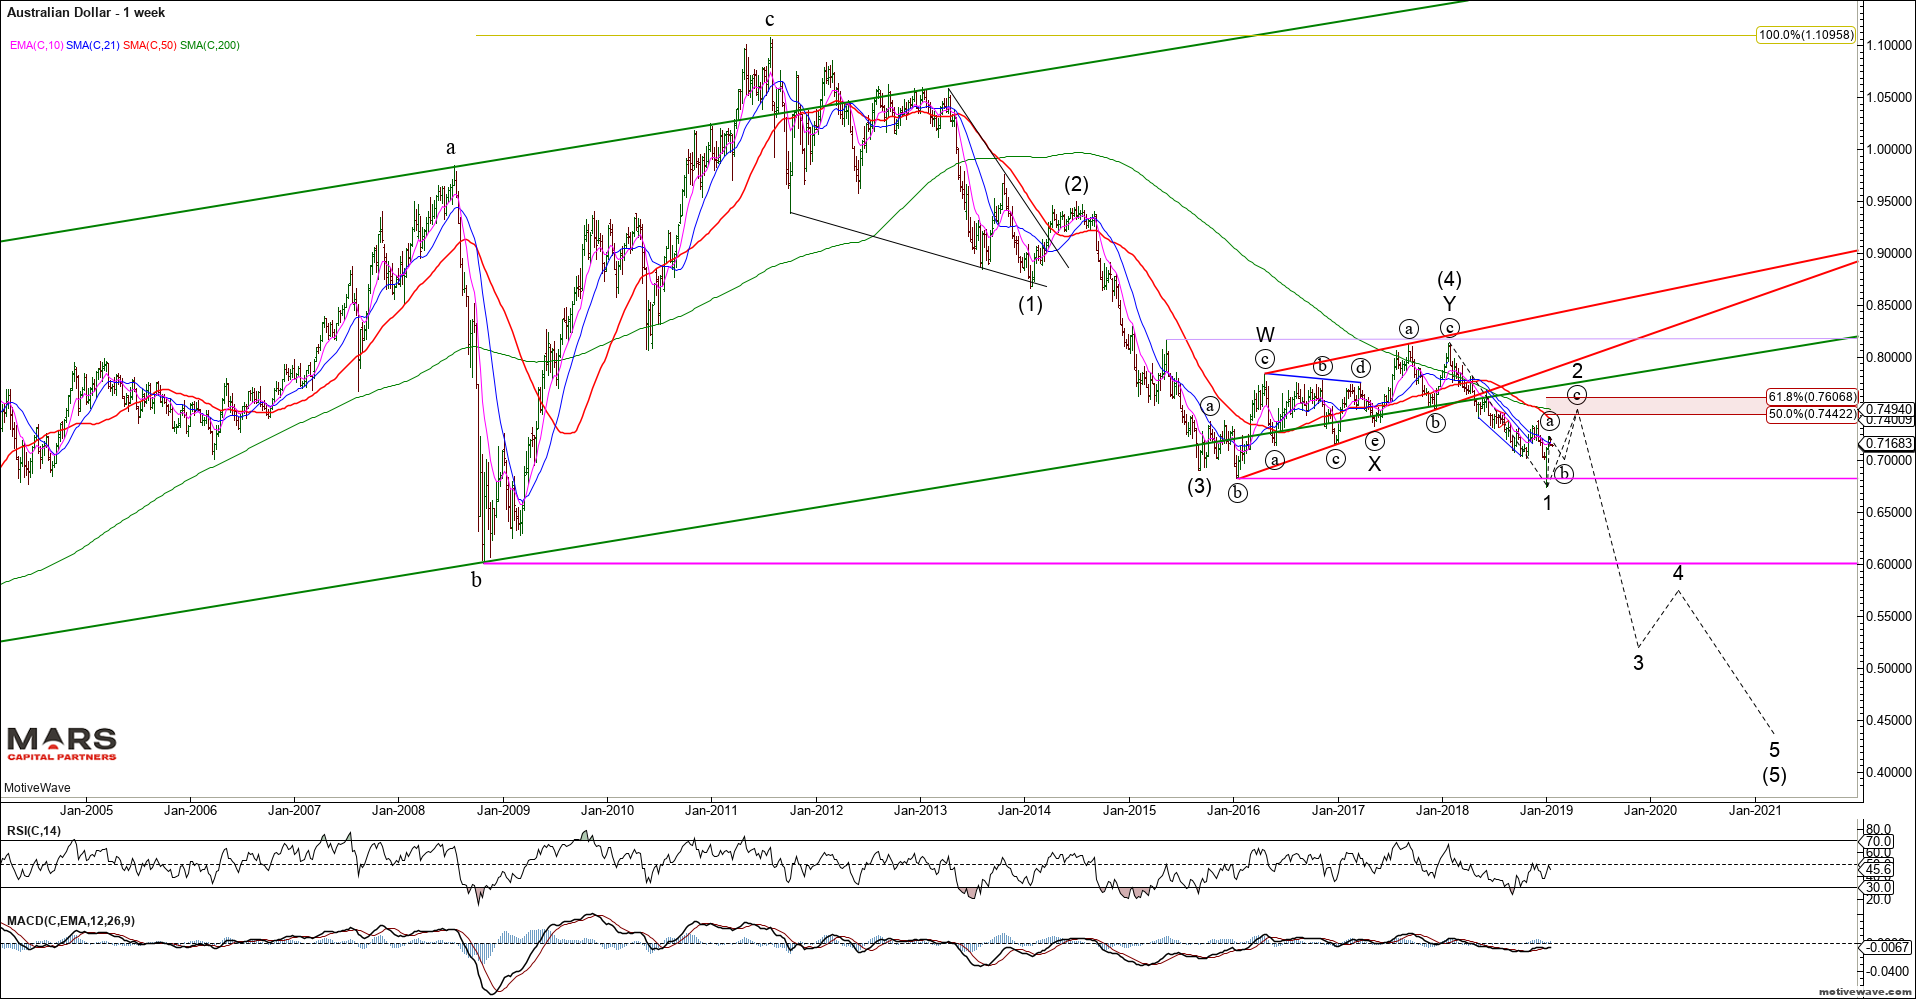
The Aussie dollar has rallied nicely since its flash crash lows. Our upside targets for this counter-trend rally remain higher towards 0.744-0.760 as we look for the bear market to reassert itself. The only thing that is likely to reverse this decline is China Stimulus and trade war resolution. Until these themes change the Aussie$ remains bearish from a big picture perspective.
AUDUSD Weekly
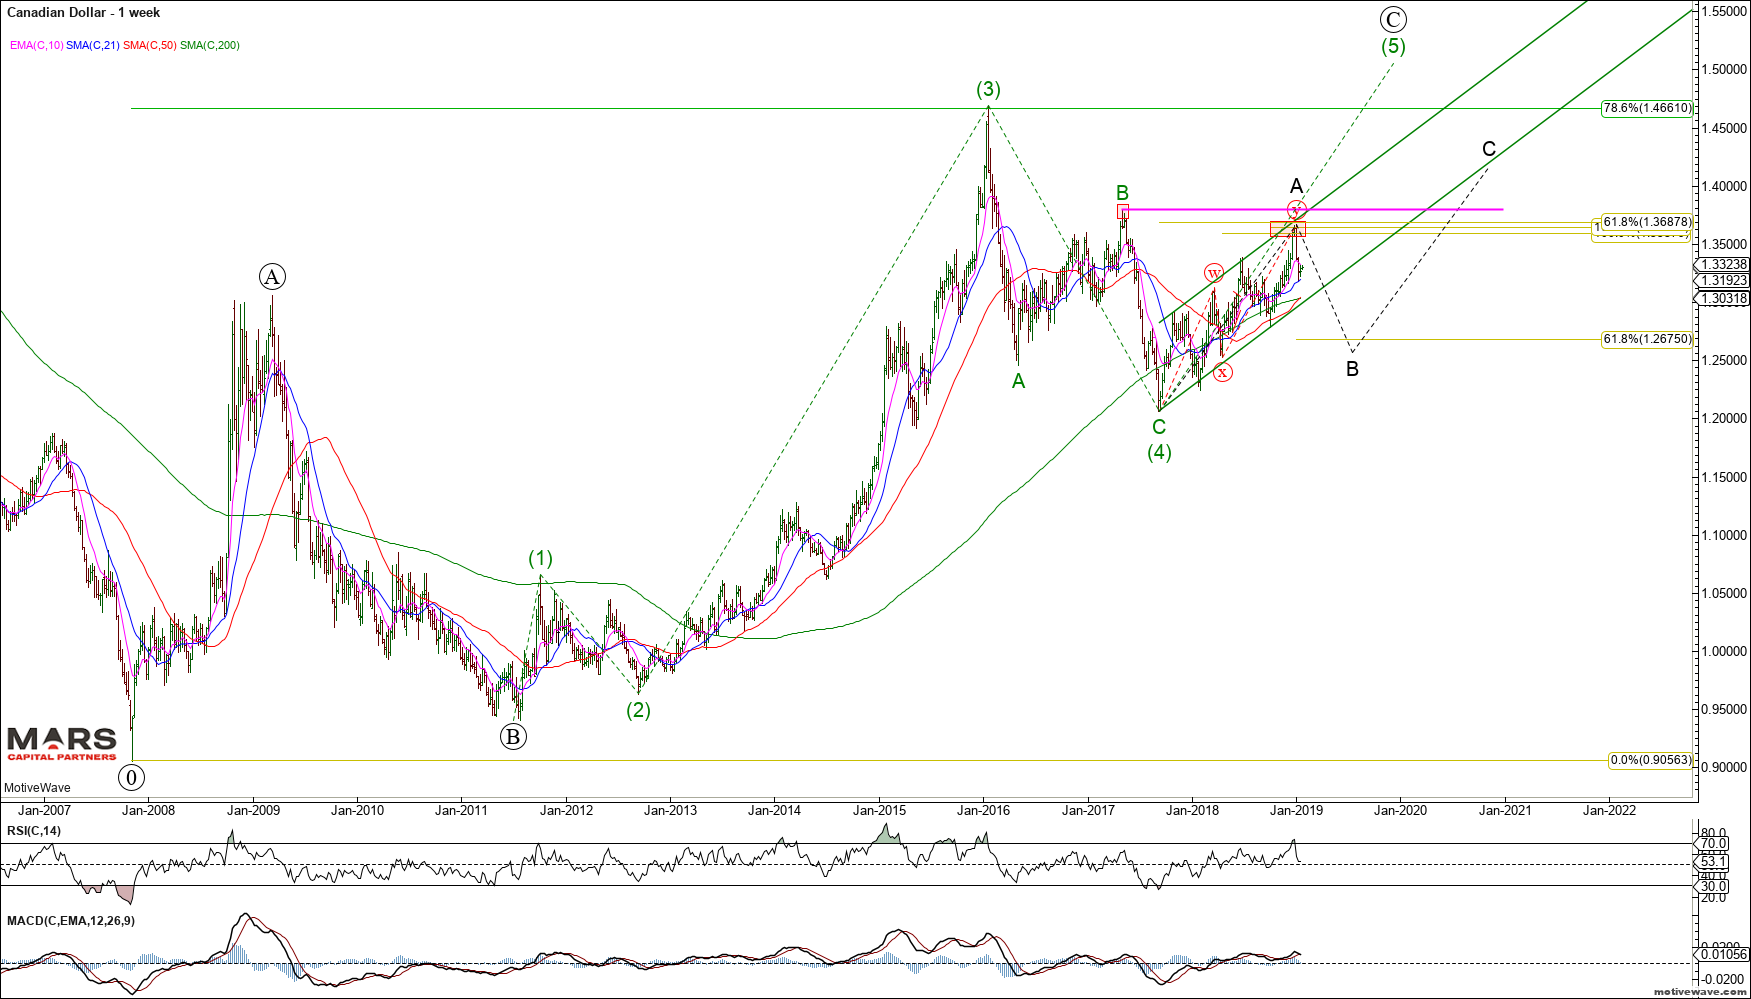
The USDCAD has rallied correctively from the wave C lows in what we expect to be wave A of an A-B-C advance. We are near term bearish against recent swing highs but not with a great deal of confidence. This pair has been range bound since the 2016 highs. With only 3 waves down from the 2016 highs we must assume the decline was corrective and new highs is likely (green count). Trade back above 1.38 will “lock-in” a corrective 3 wave decline implying a push to new multi-year highs.
USDCAD Weekly
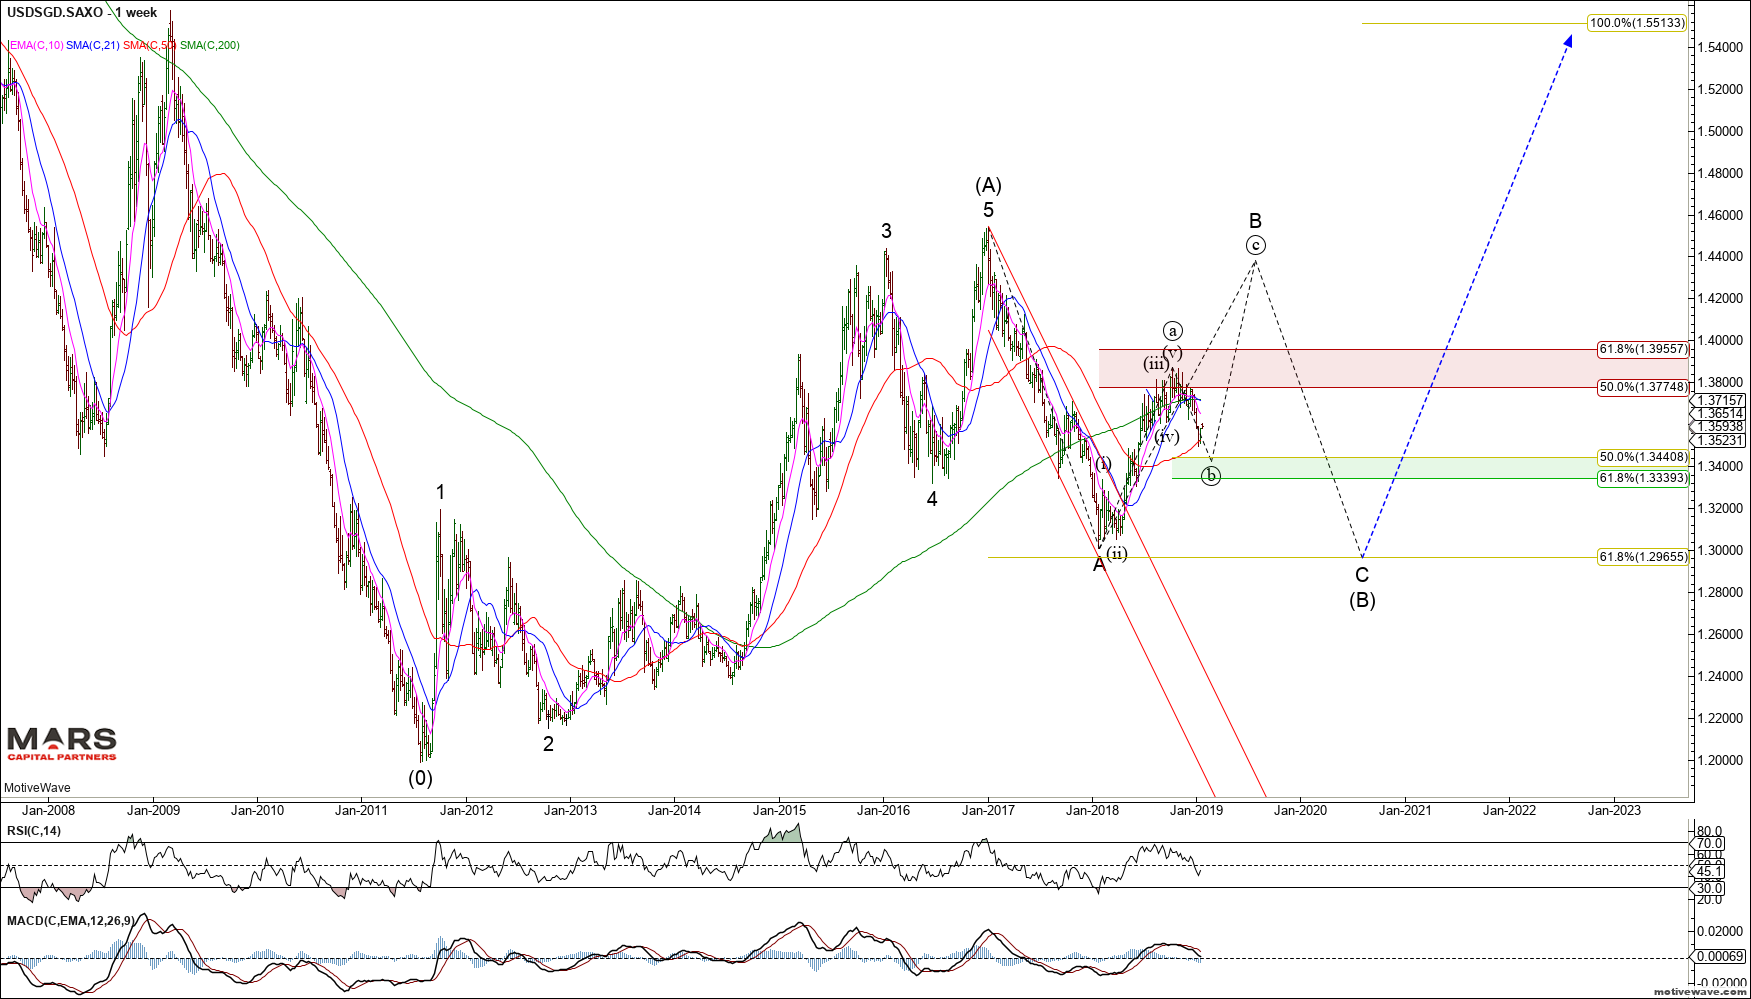
The Singapore Dollar provides the clearest Elliott Wave structure with 5 waves up from the 2011 lows terminating into the 2016 highs. We are looking for evidence of a bullish turn for the USDSGD for wave (c) of B up to retest the 2016 highs. Strong support resides in the 1.334-1.344 area for a turn.
USDSGD Weekly
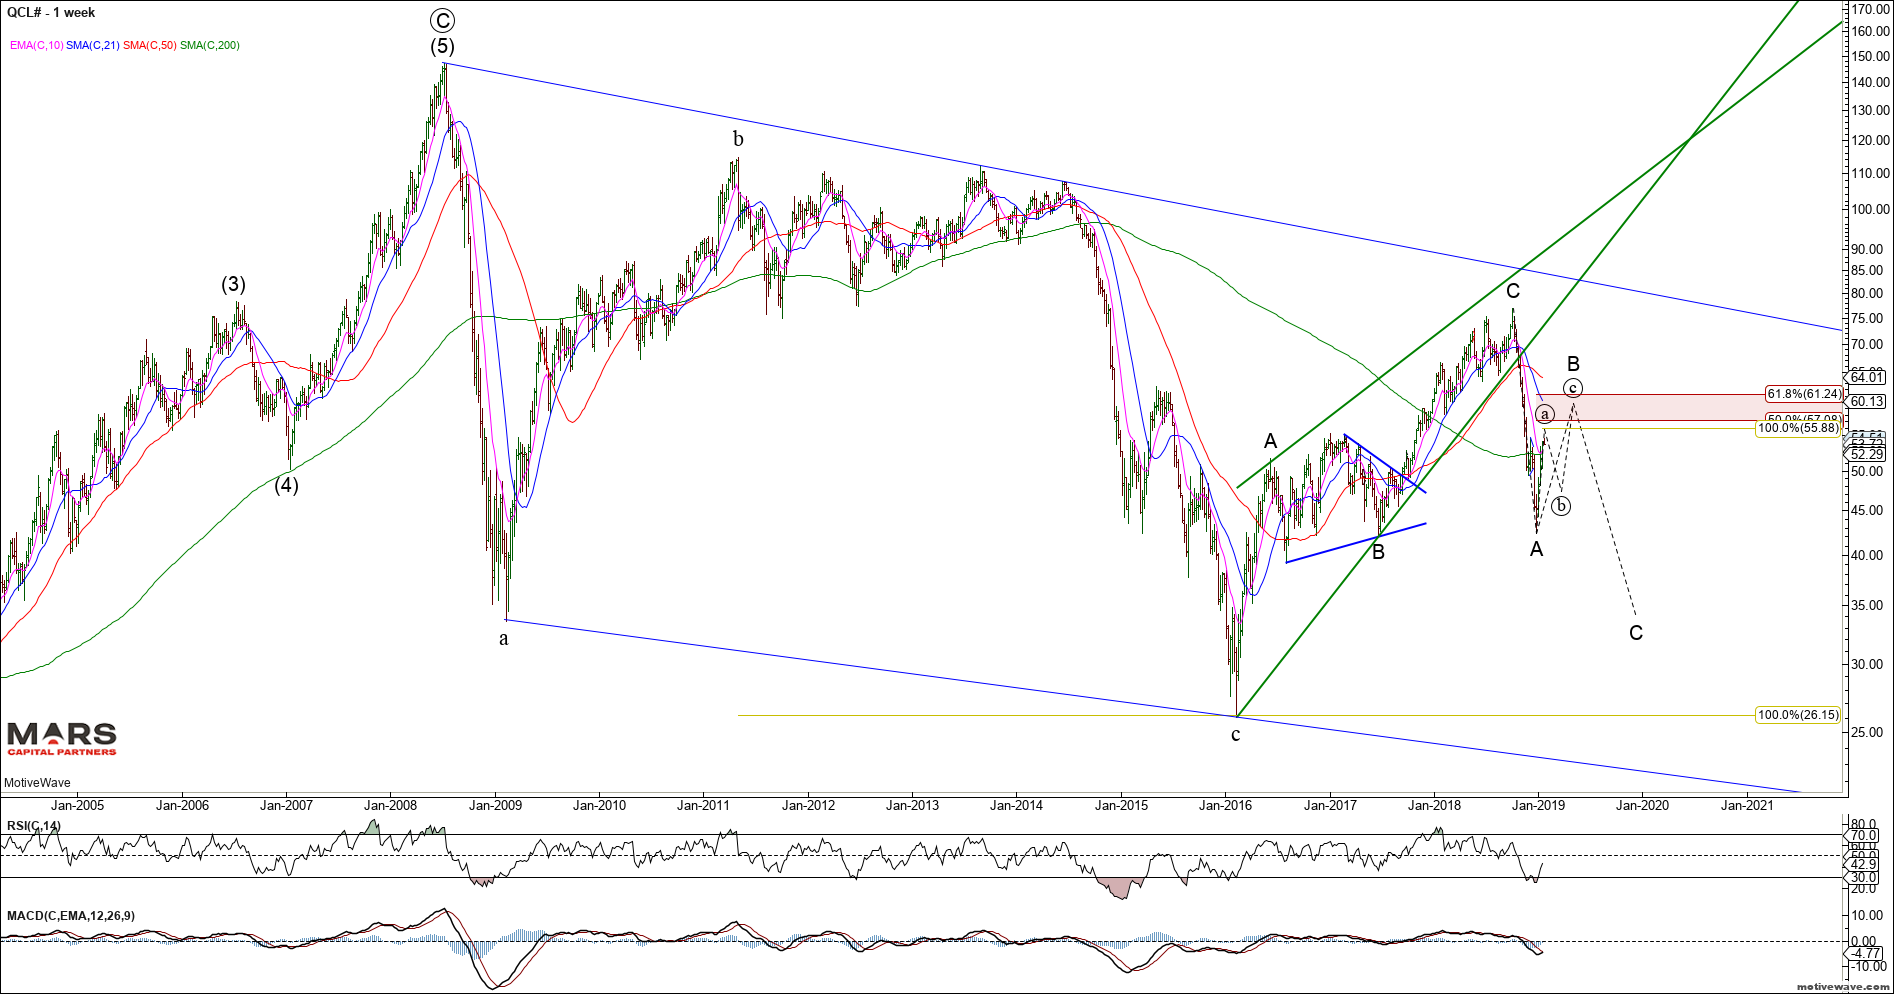
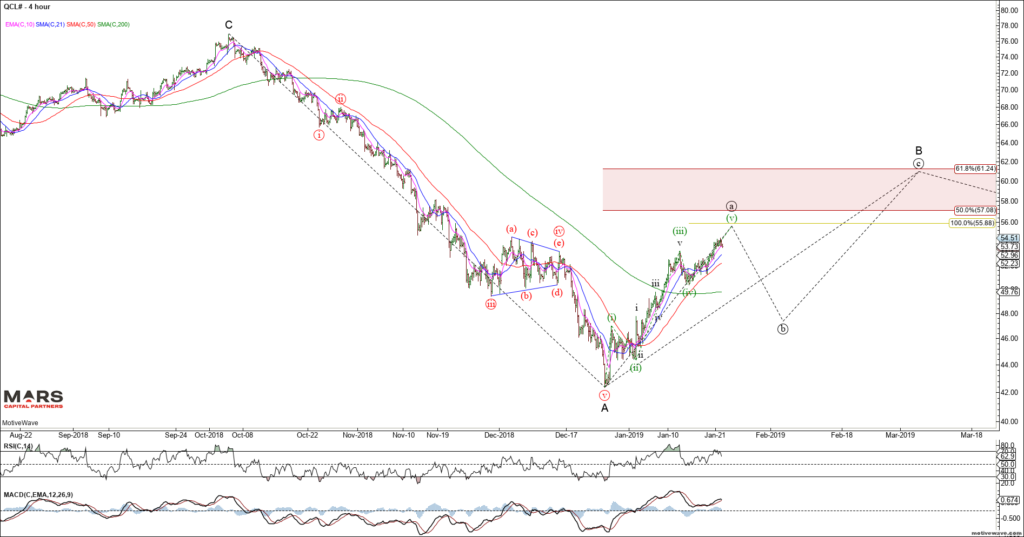
To the commodity markets and Crude Oil has pushed higher in wave (a) in what we expect to be part of a counter-trend rally. We expect this rally to be part of a larger wave B correction before wave C down. Ideal wave (c) of B targets remain in the $61 area. The rally off the 2016 lows is clearly corrective in 3 waves. The decline for the September 2018 highs is clearly impulsive so we would expect another wave lower of similar magnitude. We remain bearish CL from a bigger picture perspective.
CL Weekly
Near term, the recent CL rally from the low is clearly impulsive and likely only wave (a) of an a-b-c correction higher. Ideal upside targets for wave (a) are 56-57.
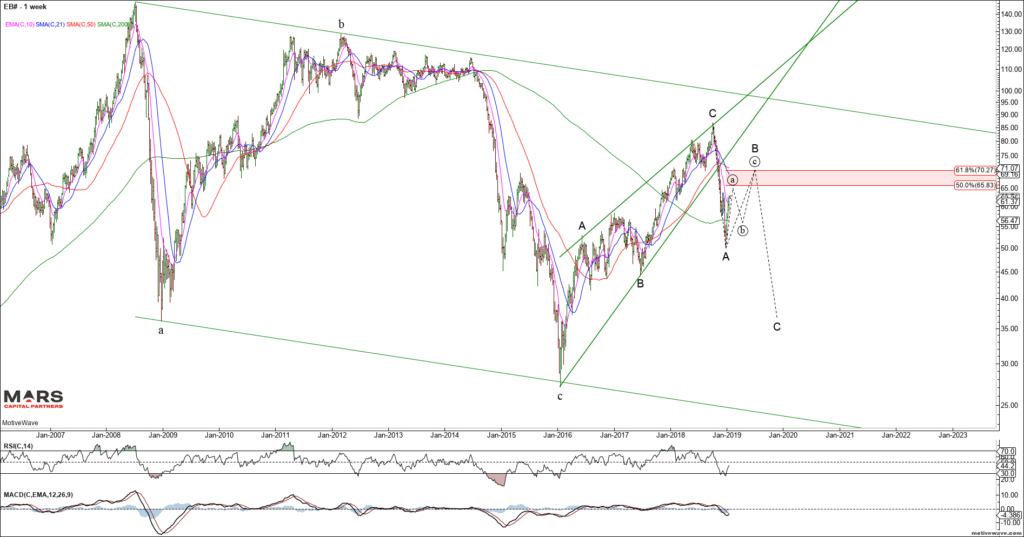
Brent Crude shows the same overall structure as we appear to be completing wave (a) of an a-b-c rally for B in the $70 area before wave C down commences.
Brent Crude Weekly
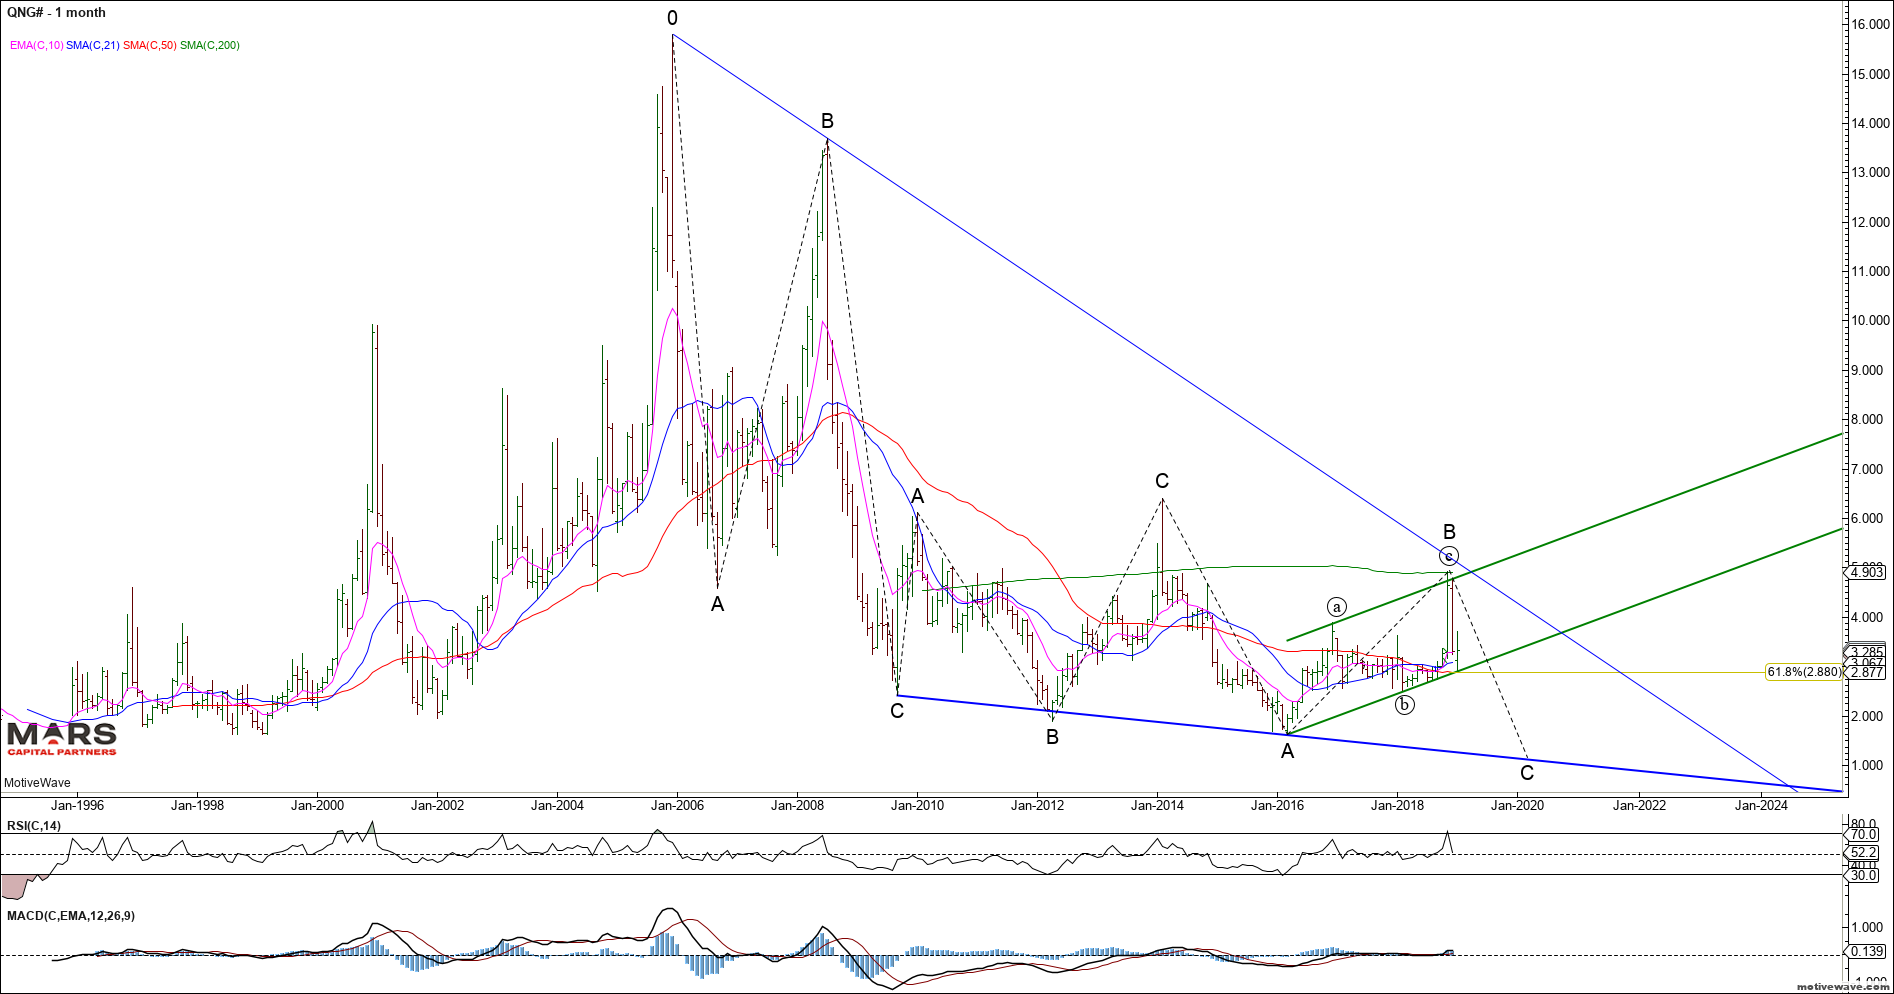
Natty Gas continues to trade within a larger decline with a corrective 3 waves up since the 2016 lows. We remain bearish from a bigger picture perspective and continue to look for new cycle lows in NG as long as the wave C highs hold to the upside. A break below 2.50 support would likely confirm our bearish view.
NG Weekly
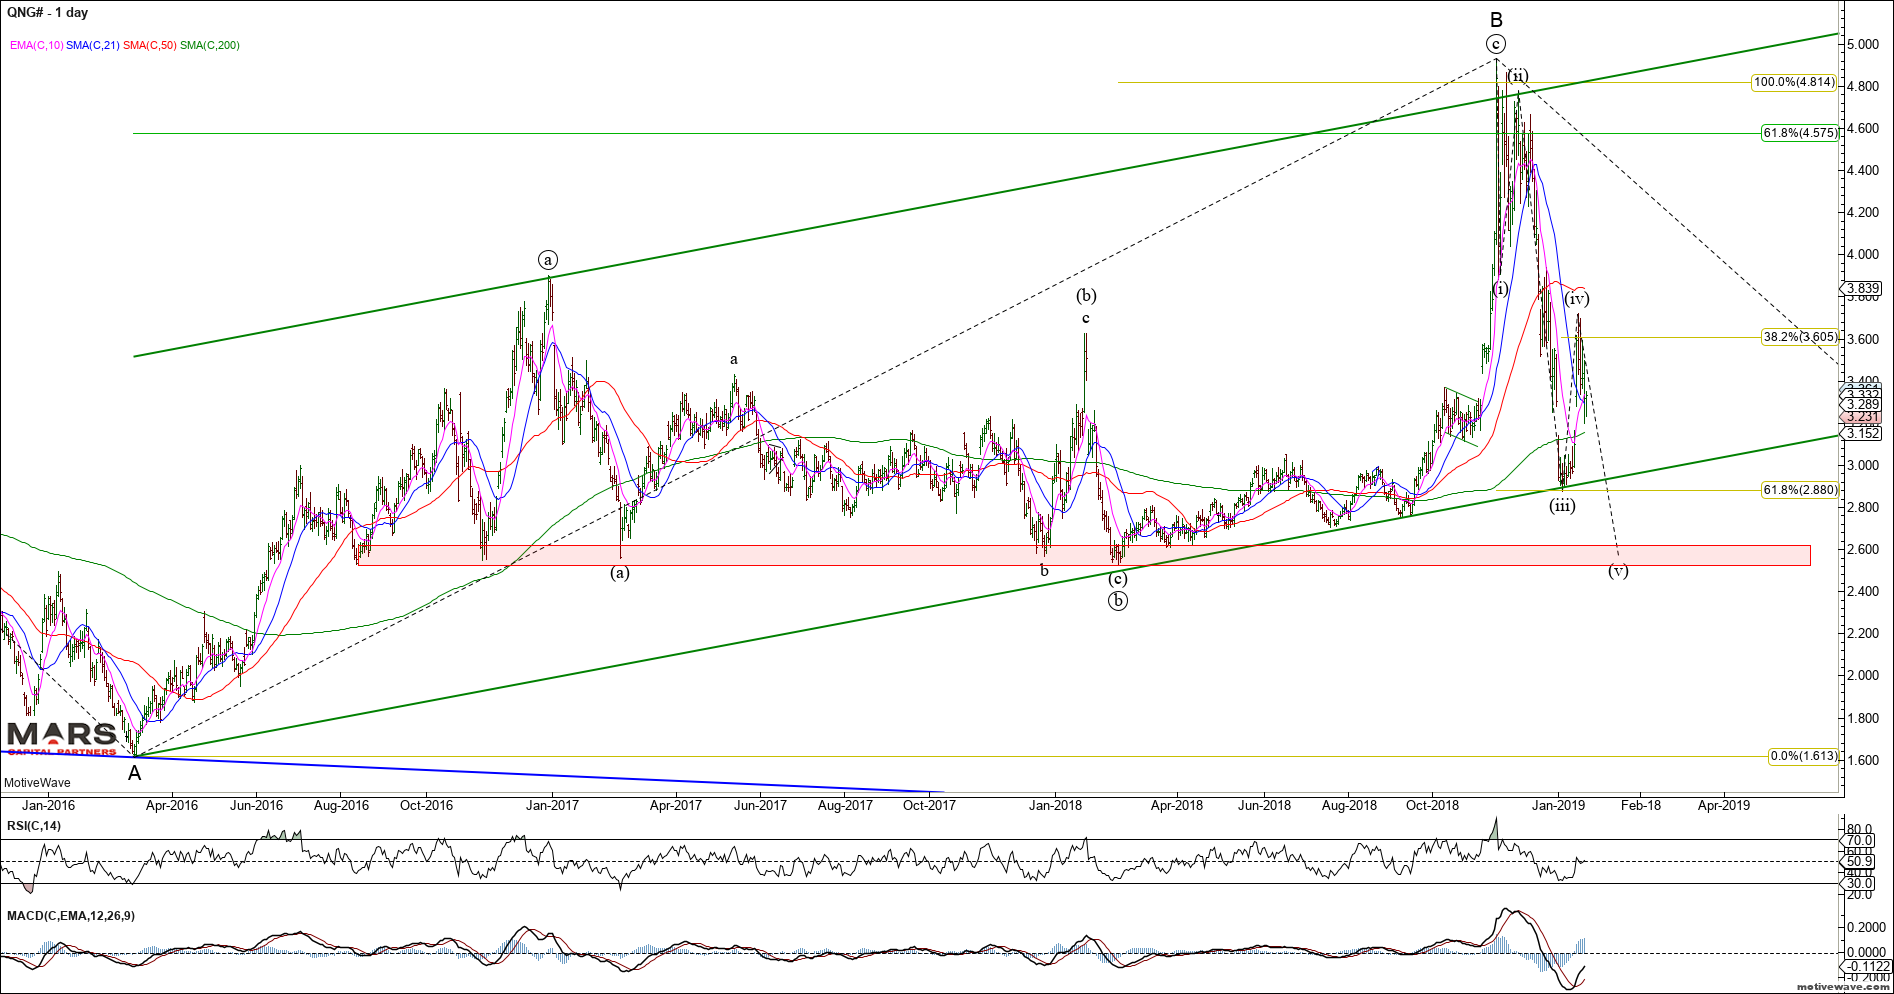
Near term, the NG bears need to break below the trend channel and ideally trade below 2.50 to confirm a change in trend to down.
NG Daily
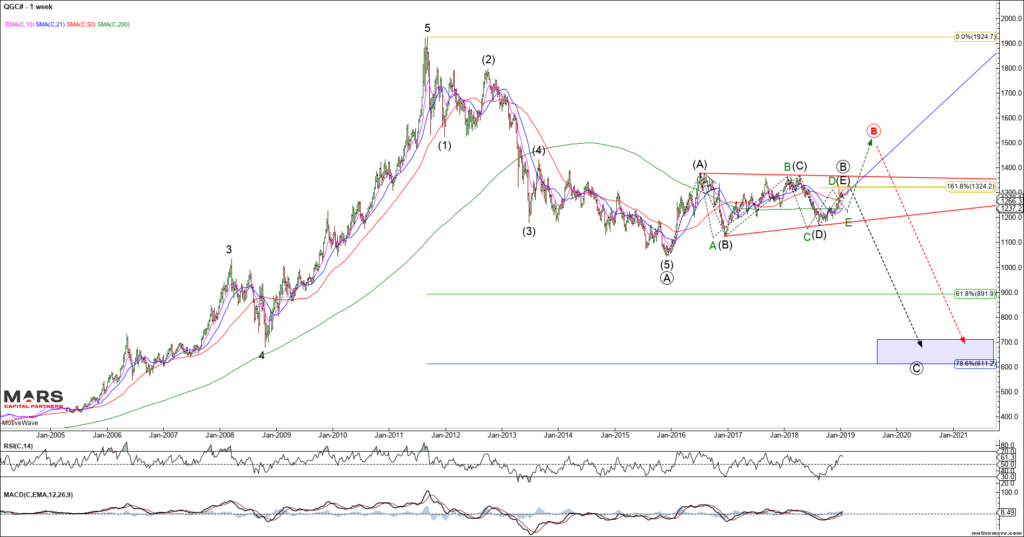
To the PM’s and Gold remains trapped in its multi-year triangle. Our long term price objective remains in the $600-700 area for Gold. The question is only whether we go directly down from our $1380 resistance (black count) or push higher first towards $1500 for red wave B.
Gold Weekly
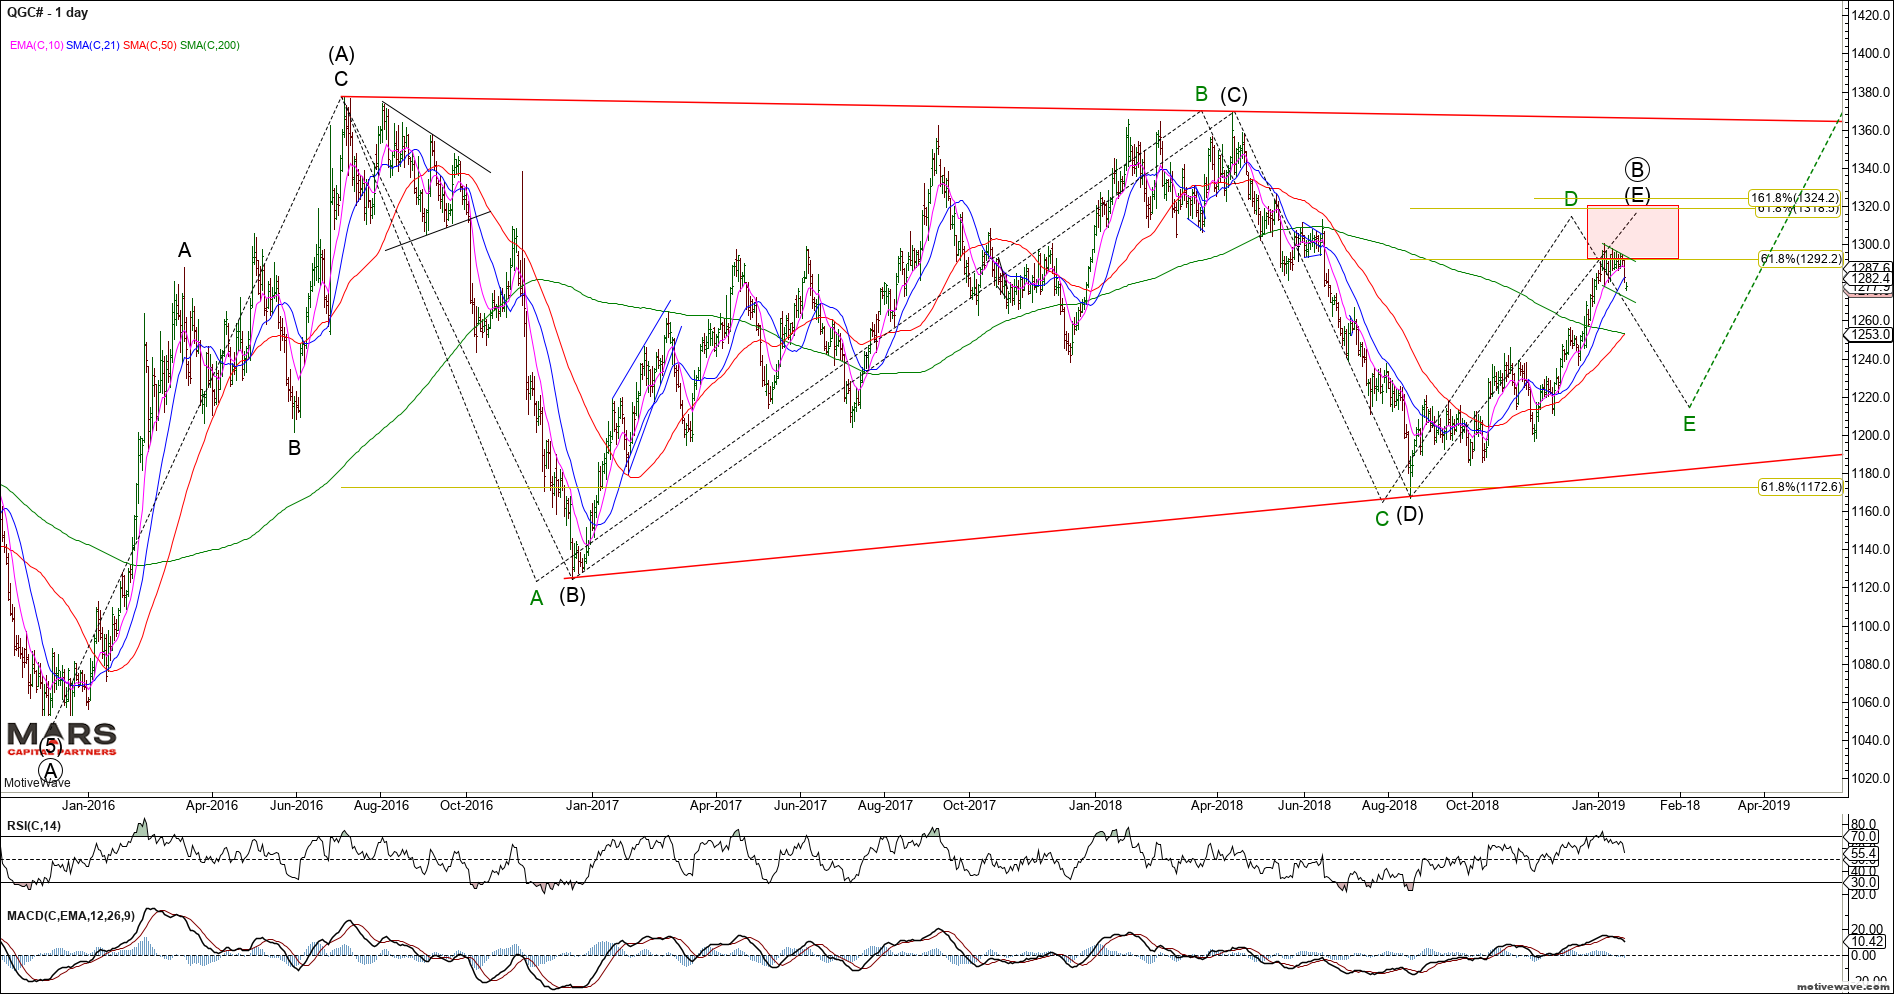
Near term, Gold turned down from the low end of our sell zone as it broke down from its triangle. It could still be a bull flag with ideal upside targets in the 1320-25 area. We do not yet have confirmation of a change in trend.
Gold Daily
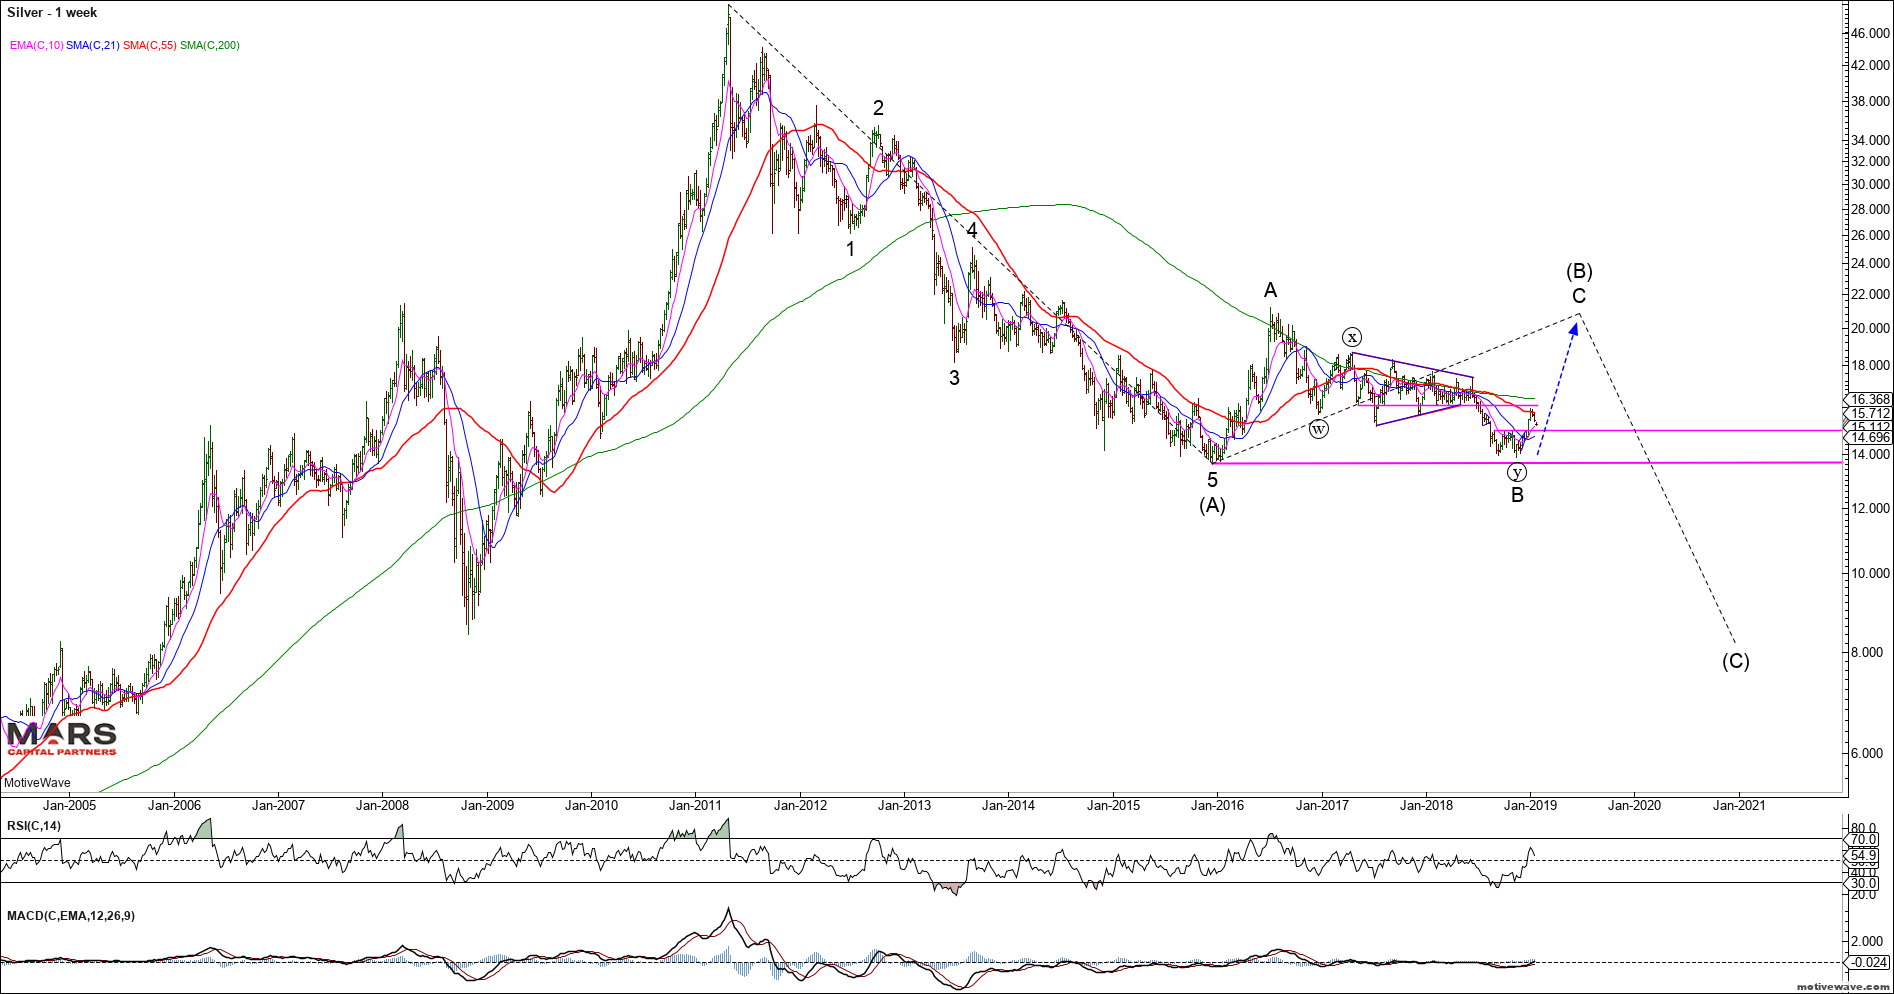
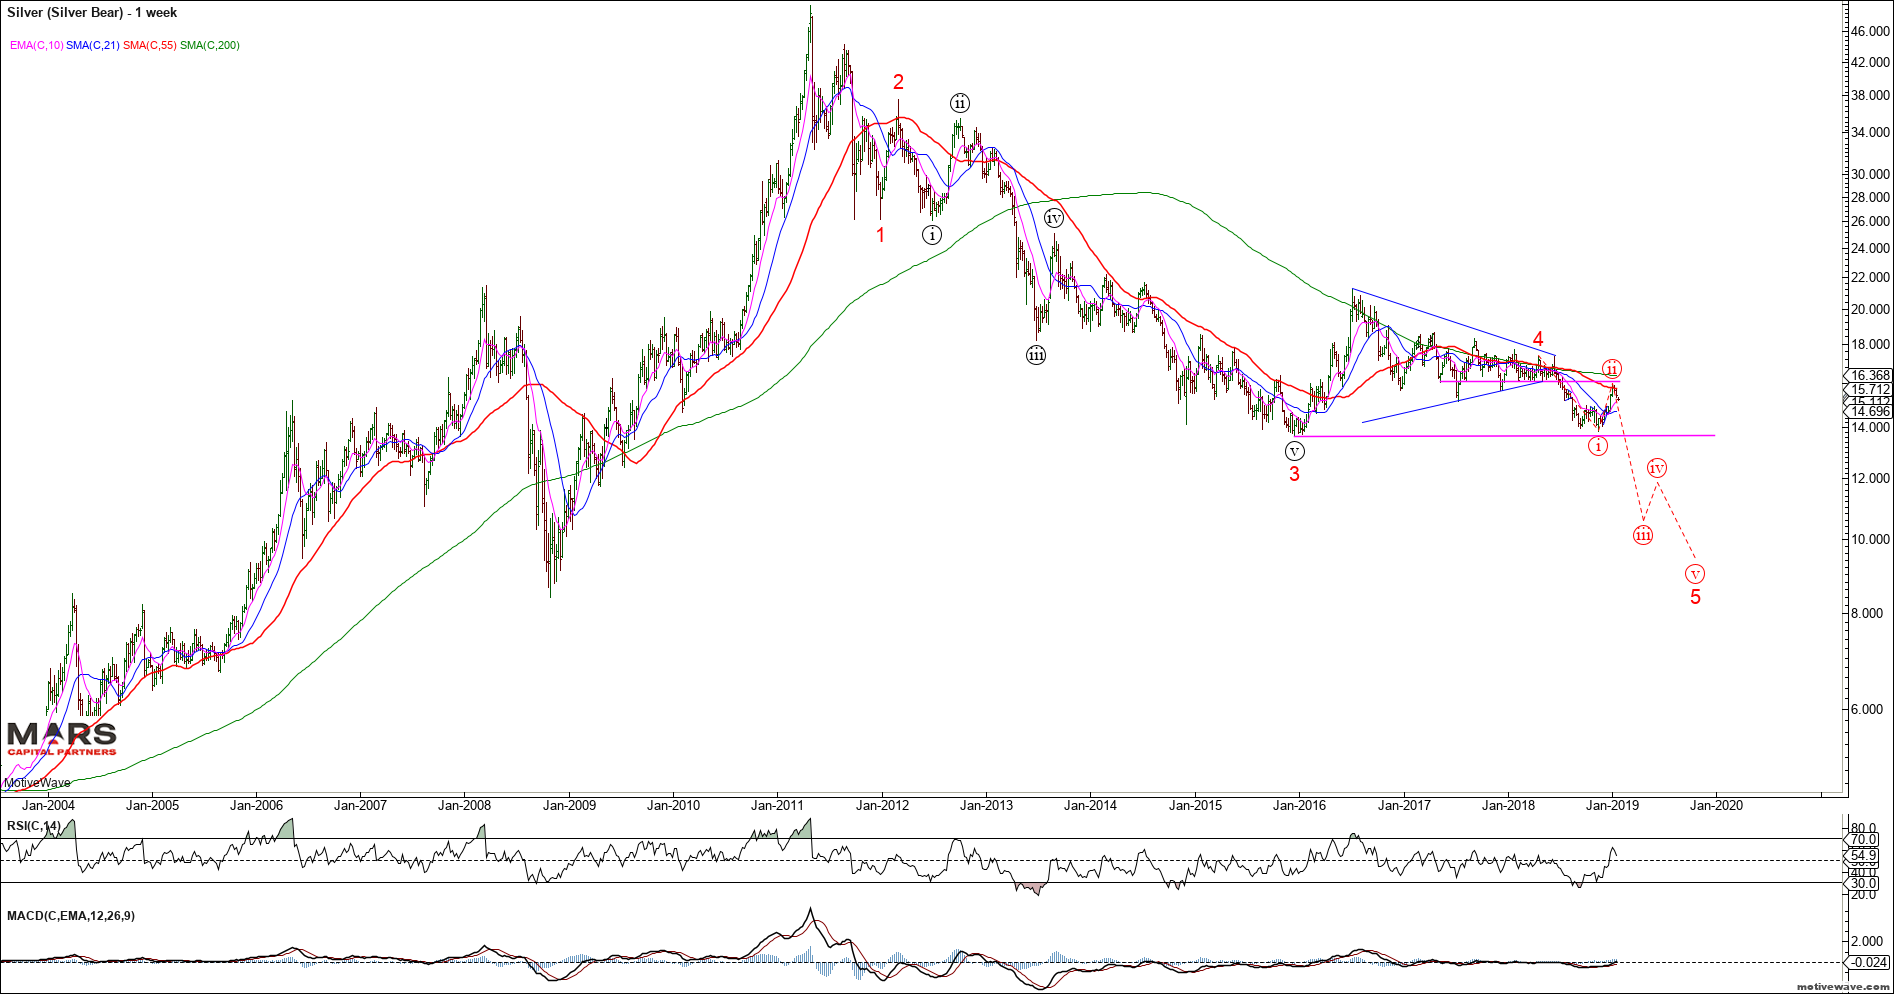
Silver also broke down from our 16.00 near term resistance and the rally is only in 3 waves so far. Trade back below 15.00 would imply the trend remains down with new lows on deck. Bulls need to hold the 13.60 support area or risk a breakdown towards the $8-10 area in an impulsive 5th wave decline. The bullish case is looking for a wave C higher towards the $20-22 area. Near term bulls need to reclaim $16 first.
Our bigger picture Silver buy zone targets remain in the $8-10 area.
Silver WeeklySilver Bear Weekly
In summary, 2019 is likely to be a trader’s market with high volatility across macro asset classes. – we remain defensive equities and trade tactically; – bullish bonds in a deflationary environment; – bullish the US dollar (except against the Yen) – bearish the Swiss Franc – Longer term bearish gold and silver
The macro review for w/c 14 January 2019; A much quieter week on the central bank front. Both key speeches this week by ECB President Mario Draghi and NY Fed President John Williams reiterated the central banks’ commitment to deploy their policy tools “if and when” it is needed. In other words, confirming that the central banks will be there to step in if needed.
For the most part, US data was good this week. Several key
reports are missing due to the ongoing government shutdown. While the NY Empire
State Manufacturing Survey weakened, the Philadelphia Fed Business Outlook Survey
showed a stronger result on the back of growth in new orders. US Industrial
production growth grew at a constant pace in the month as utilities output
declined due to warmer than expected weather. The manufacturing component of
industrial production was much stronger than recent US manufacturing data had
suggested – an upside surprise for the month.
US housing had some good news as mortgage applications
increased at a faster rate last week, to be +11% on the same week a year ago.
At the same time, the prelim reading on consumer sentiment in Jan recorded a
large fall in current sentiment and expected conditions.
Eurozone growth was dealt another blow with industrial
production declining in Nov. Declines in production were recorded across many
Eurozone countries and across the major production categories of intermediate
goods, capital goods and consumer goods. The EU trade balance also deteriorated
in Nov and in the YTD as key export growth continued to underperform and import
growth increased at a faster rate, led by categories such as energy.
Earlier in the week, Chinese trade data for Dec confirmed
that both exports and imports had declined in Dec versus a year ago – an important
development underpinning some of the global production and trade weakness.
CPI’s were released across several key economies. Generally, slower growth in energy prices resulted in lower headline growth of the CPI – except in Canada where headline CPI growth accelerated higher in Dec despite slower growth in energy prices (likely to be an issue for the BoC if that trend continues). Measures of core inflation across Germany, the EU, the UK, and Canada all remain stable. The BoJ’s preferred measure of core CPI in Japan (CPI ex-fresh food) slowed even further in Dec. The lower inflationary pressure will give central bankers room to keep policy accommodative as this ‘slower growth’ environment develops.
There are more data releases covered in last weeks review. Use the links on the contents page to navigate to different country sections. Download the review here;
The outlook for w/c 21 January 2019; Of most interest this week will be the Jan prelim PMI’s for the major economies. This should provide some insight into whether production and export weakness has extended into 2019.
The
ECB and BoJ hand down interest rate decisions this week – no change is
expected. It’s possible the BoJ will revise inflation forecasts lower. As the
US Fed will be on board next week, the blackout period for communications is in
effect.
US
data flow will likely continue to be interrupted by the Government shutdown and
this week we will miss the US Durable Goods and New Home Sales reports for Dec.
We will get further reads on regional
manufacturing activity in Jan from the Richmond Fed and Kansas City Fed.
Very
light treasury supply this week. The US Treasury will settle $151b in ST bills,
paying down $9bn.
Labour market surveys for Dec will be out for Australia and
the UK this week. This will be an important indicator for the Australian
economy as the housing market continues to decline and Chinese growth continues
to slow.
After the large defeat of the Brexit Article 50 vote last
week, PM May outlined her plan B for Brexit to the UK Parliament on Monday. This
mostly consists of the UK seeking further concessions from the EU – something that
has already been rejected by the EU.
The
next stage of US-China trade negotiations will continue next week. Expecting
headline risk to remain elevated.
US earnings announcements will continue this week.
Further detail and a calendar of key releases are provided in the briefing document – download it here;
The macro review for w/c 7 January 2019 – The stance of several key central banks has now shifted from removing policy accommodations to a ‘wait and see’ approach as growth concerns increase.
Fed speeches throughout the week and the FOMC minutes,
continued to reinforce the key position of the Fed now; low inflation is
providing room to ‘wait and see’, no set path for rates, won’t hesitate to
change course if policy or normalisation hinders achievement of dual mandate
goals. The FOMC is
likely to see how the data and risks to growth play out on the domestic front
before hiking rates again.
The ECB minutes reflected 1)
a shift in growth sentiment with the balance of risks now moving to the
downside, although still assessed as ‘broadly balanced’, 2) rates “lift-off”
likely pushed out to late 2019 and 3) the introduction of “chained guidance”.
This roughly translates into “removal of accommodation is on hold for now”.
After raising the benchmark
rate several times in 2018, the BoC kept rates on hold in Jan highlighting
further growth concerns for the Canadian economy. Growth is expected to slow in
Q4 and Q1 2019 as a result of lower oil prices. Rates likely to remain on hold until the
impact of lower oil prices and global trade developments becomes apparent on
inflation, spending and the housing market.
One
central bank has been steadily increasing policy accommodations over the last
year; the PBoC.
On
the trade front; little news on the outcomes of the US-China trade talks during
the week, but the meeting has likely set the foundations for higher-level
negotiations in late Jan. Trade talks with Japan and the EU are likely to start
within the next month as negotiating objectives have now been released by the
USTR.
US data was limited due to the ongoing government shut down and we, unfortunately, missed a key indicator of manufacturing activity in Factory Orders. Headline CPI growth slowed to +1.9% on the back of lower energy prices, while growth in core CPI ex-food and energy remained unchanged at +2.2% – led by growth in services. Growth in the non-manufacturing PMI slowed but remains elevated. JOLTS data show openings and hires remain at high levels, but it appears that the strong upward momentum during 2018 has paused.
European industrial data was disappointing while consumer retail sales growth improved. The low-light of the week was the poor German manufacturing orders and industrial production data for Nov – confirming the recent weaker PMI reads and indicating further declines are likely. Of concern is that the decline in new orders and production was no longer limited to foreign markets and durable goods. German trade data showed both exports and imports declined in the month and the overall trade surplus is well below last year.
There are more data releases covered in last weeks review. Use the links on the contents page to navigate to different country sections. Download the review here;
The outlook for w/c 14 January 2019 – US Q4 earnings announcements are likely to be a focus over the next few weeks given concerns over growth.
It
will be a much quieter week on the central bank front. The highlights; ECB’s
Draghi and NY Fed President Williams will give speeches this week.
Treasury
supply will be more moderate this week as the US Treasury settles approx.
$223bn in bills, notes and bonds this week, raising approx. $24bn in new money.
It’s also mid-month and approx. $2.1bn in securities will mature and roll off
the Fed balance sheet.
US
data flow will likely be interrupted by the continued Government shutdown and
this week we will miss the US retail sales data for Dec, housing starts and
business inventories. The housing market index will provide some insight on the
performance of the housing market leading into the end of the year.
CPI’s
will be in focus this week, with key reports for UK, Germany, Eurozone, Japan
and Canada. The reversal of higher energy prices will likely be a key driver of
CPI changes.
Global
manufacturing and industrial growth will be in focus this week with US,
Eurozone and Japan (revised) industrial production data.
The UK vote on Brexit will likely be held this week on 15 Jan. UK retail sales data for Dec should provide a good read on consumer spending/sentiment.
Further detail and a calendar of key releases are provided in the full briefing document – download it here;