
The Weekly Macro Review and Outlook for w/c 13 January 2020
The weekly macro review for w/c 6 January 2020 – Our w/c 6 Jan 2020 macro review includes several of the larger releases from the last two weeks, focusing mainly on private sector manufacturing and services output.
US manufacturing weakness was evident in the data out over the last few weeks. Factory orders data continues to show that declines in non-defense aircraft production, shipments and (rising) inventory is one of the larger issues affecting the data. Excluding transport equipment, the value of US factory orders and shipments is just slightly below a year ago. This is also reflected in the mixed results across regional manufacturing reports. The ISM manufacturing PMI for Dec reported a further contraction in activity, while the Markit manufacturing PMI was positive, albeit reflecting low growth.
The labour market report for Dec highlighted that overtime hours of US durable goods manufacturing continued to contract at around 9% in Dec. This is broadly in line with the weaker growth/conditions. Overall average weekly hours growth was also still below that of a year ago.
US employment growth (non-farm payrolls) slowed in Dec – and was lower than the 12-month average which has now slowed back down to 184k. The unemployment rate remained broadly unchanged. The labour market performance remains good – from the household survey, the acceleration in employment growth together with lower/no growth in what participation added to the labour force, resulted in a larger decline in total unemployed persons (in the month and on an annual basis).
Global PMI’s – manufacturing remained in contraction across Europe incl Germany, Japan, UK and Australia at the end of 2019. Despite these weaker readings, firms expressed optimism for 12-months ahead, likely due to greater Brexit certainty and the phase one trade deal between US-China in early Dec (reflecting at least no further worsening in trade relations).
Germany recorded one of the weaker manufacturing PMI results in the Eurozone for Dec. Factory orders declined for Nov. The data indicates that the declines since late 2017 appear to have at least stabilized at a lower level but are yet to recover the respective peaks. Similarly, industrial production was stronger in Nov, but at best, declines in output (for manufacturing especially) may have stabilized – too early to tell.
Services PMI’s were generally stronger, except for Australia and Japan, which remained in contraction. The UK services PMI recovered to the 50/neutral level.
CPI’s for Dec are worth noting. China CPI growth remained elevated at 4.5%, likely adding further pressure in a lower growth environment for consumers. Also, some signs of higher CPI growth across the Eurozone too in the Dec prelim CPI.
There was little rebound in data out of Japan for Nov. Retail sales increased in the month but remained below a year ago across most categories (likely due to stockpiling prior to the Oct sales tax increase). There was no rebound (overall) in industrial production and shipments for Nov. The Dec PMI’s indicate that there is likely more weakness in activity to come as both manufacturing and services PMI’s for Dec contracted at a faster pace.
There are more data releases covered in the review document. Use the links on the contents page to navigate to different country sections. Download the review here;
The outlook for w/c 13 January 2020 – The signing of the phase one trade deal between the US and China will be a key focus this week. The signing is planned to take place on 15 Jan and text of the deal will be released after. It was reported late last week by Reuters that Chinese officials were yet to confirm purchase commitments of agriculture of $40-$50bn.
Brexit legislation will also continue to make its way through the House of Lords in the UK Parliament this week.
Senate committees are currently reviewing the USMCA legislation and it’s not likely that there will be a Senate vote this week.
House Speaker Pelosi said her caucus will decide this week when to send impeachment articles to the Senate for trial.
There are several data highlights this week;
In the US, retail sales for Dec, CPI and PPI, prelim consumer sentiment for Jan will be released.
China Q4 GDP will be released this week with the second half of the Dec data – trade, industrial production, retail sales and new loans.
In Aus – housing finance for Nov and consumer sentiment for Jan will be released.
It will be a somewhat heavier week for US Treasury settlements. The US Treasury will settle approx. $226bn in ST Bills. Notes and Bonds this week, raising approx. $25.1bn in new money. Approx. $12.5bn of securities on the Fed balance sheet will mature this week. There will also be approx. $5bn in reinvestment purchases made this week.
More detail (including a calendar of key data releases) is provided in the briefing document – download the file here;
Comments and feedback are welcome. Please email me at kim.mofardin@marscapitalpartners.net
MCP Market Update: January 12th 2020 – The Year Ahead: In the Fed we trust???
Note: Due to the continuing bush-fire threat in our region, Kim and I have decided to take a well earned vacation in the USA. We will be skiing for a few weeks in the hope that the fire threat will have subsided on our return.
One day this low volatility across asset classes will end – be prepared!
In early 2019, we correctly identified the prior corrective decline for the equity markets and new ATH’s have resulted. This is a liquidity driven market following the “Powell Pivot” and global central banks continue to pump prime asset markets.
As highlighted in last year’s review –
“The question is how long can the CB’s kick the can down the road? At what point do global markets call their bluff as market maker in chief? One thing is clear, central banks are manufacturing a world of increased societal acrimony through financial repression – how long can they continue to support the banking hegemony with disregard for societal inequality?”
Key Macro Themes for 2020:
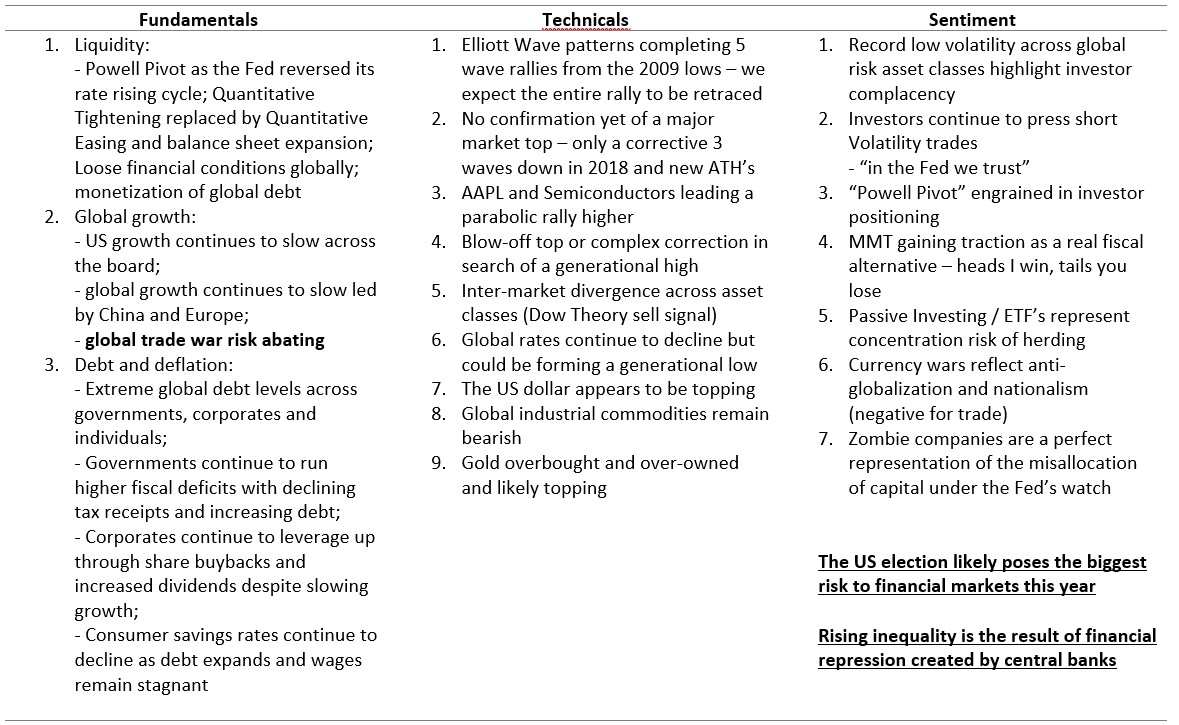
- US equities are either completing a wave (B) high near term or extend higher into 5 waves completing wave 5 of (5) to end the post-2009 rally. Our preferred strategy is long term put insurance
- We remain bullish bonds as we look for new lows in rates
- Bearish Gold, Silver and Crude Oil against last week’s bearish reversals
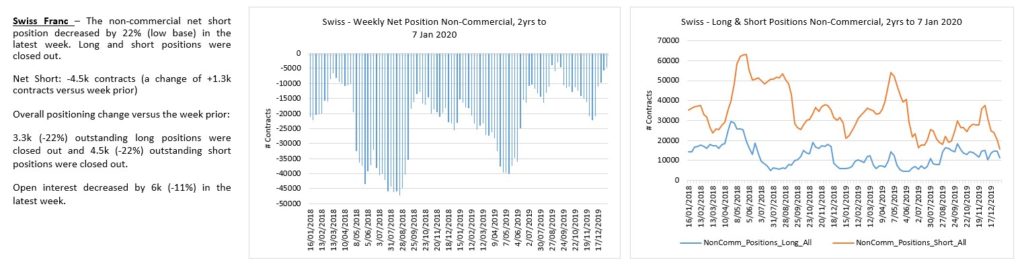
- Yen and Swiss Franc setting up for a range break after a multi-year contraction (long dated puts and calls preferred)
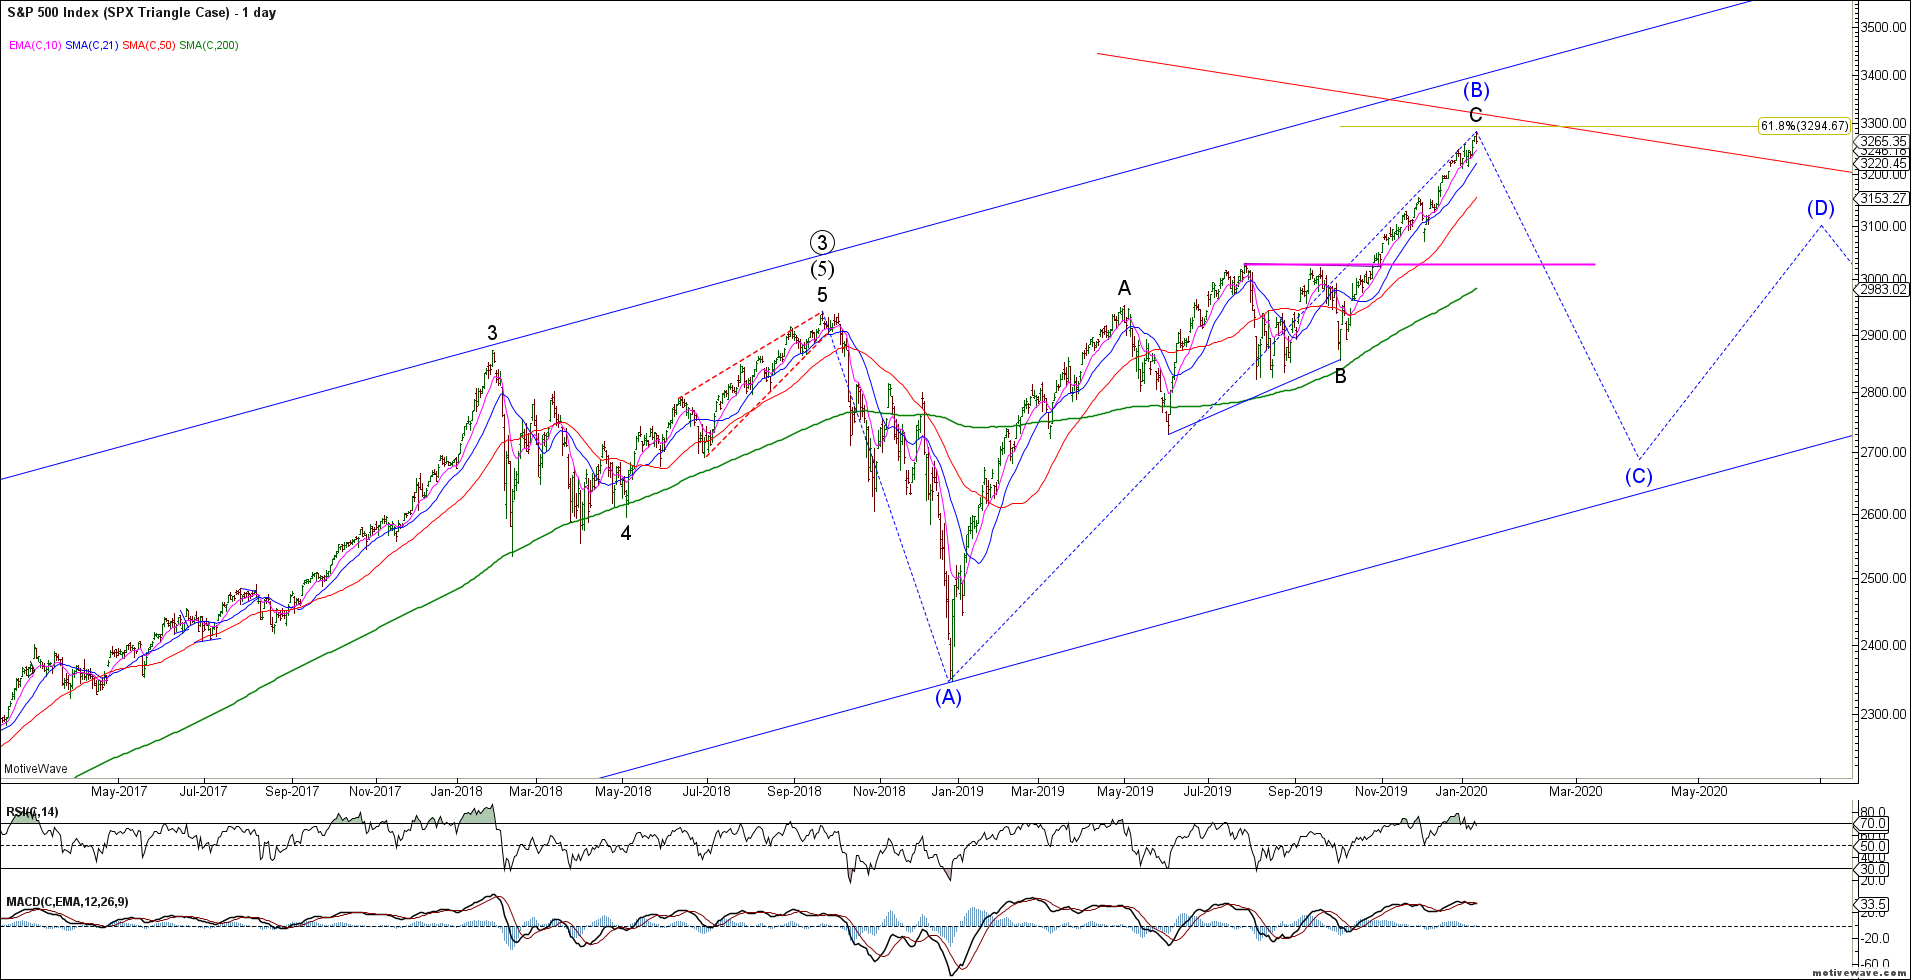
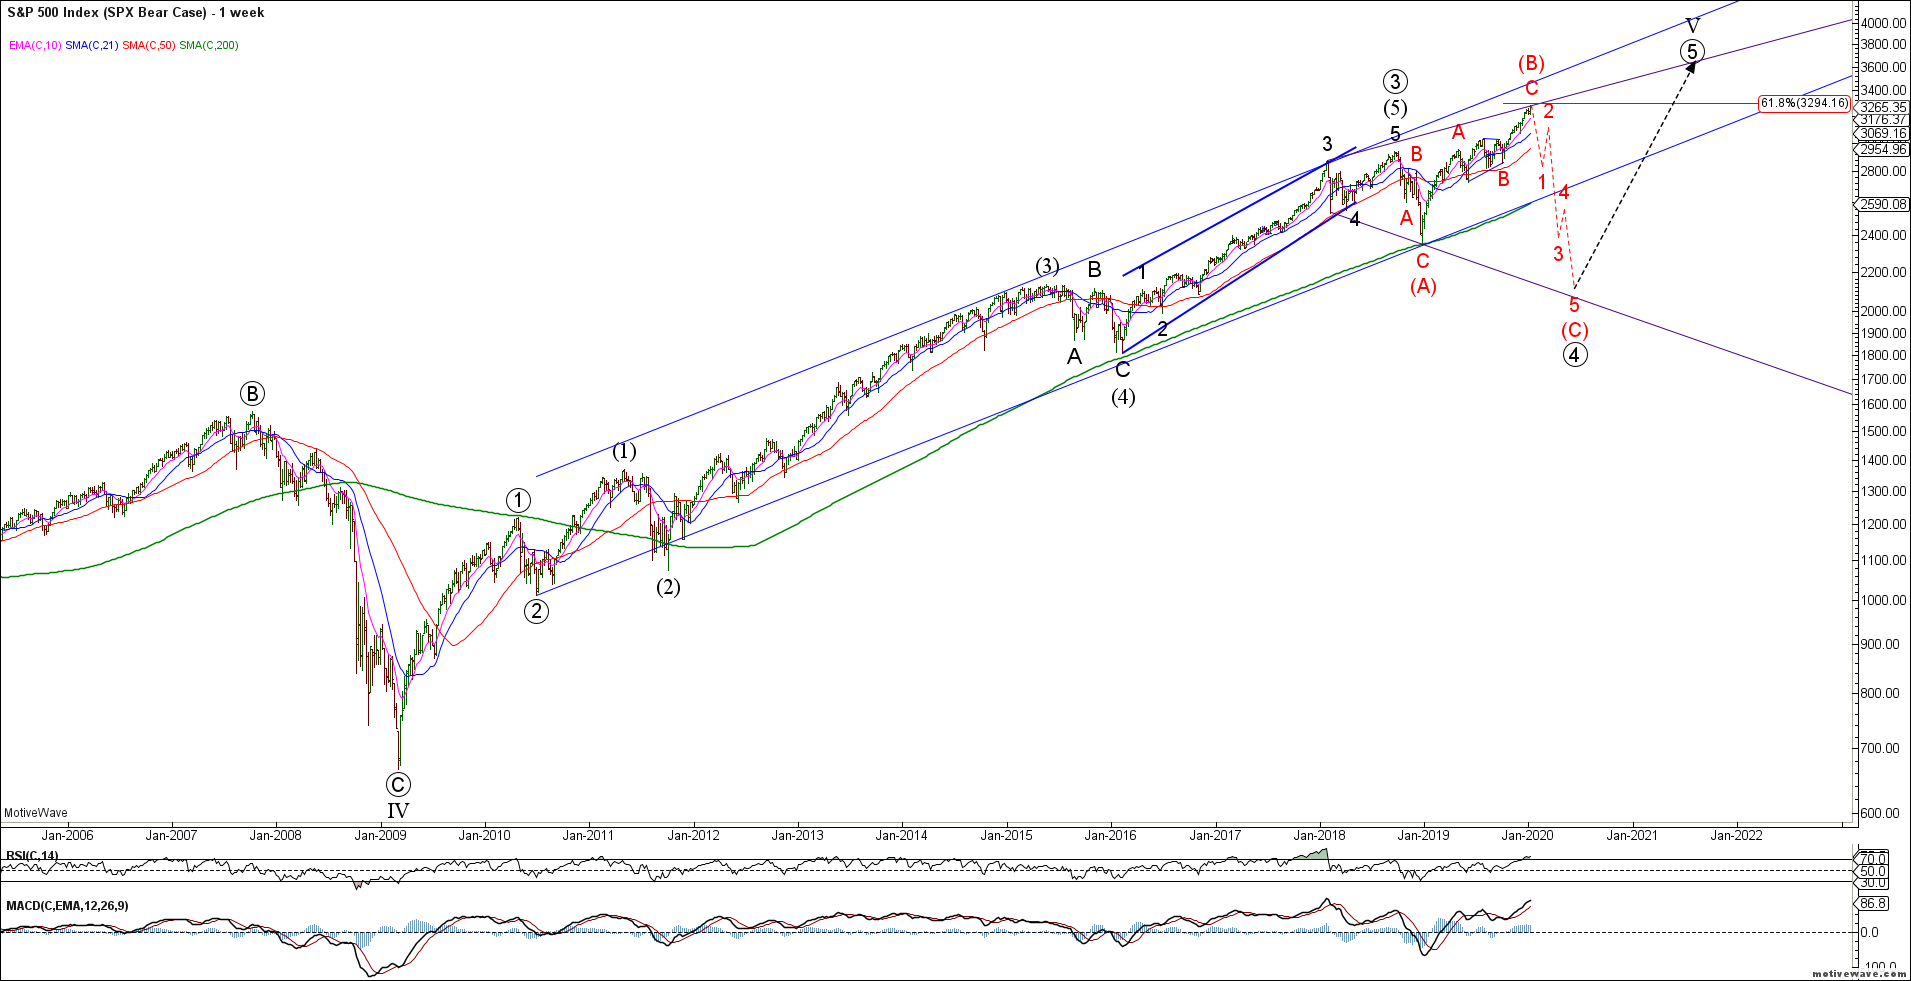
Global risk as defined by the SPX has so far rallied in 3 waves from the December 2018 lows. We have been assuming that this rally will soon terminate for wave (B) of a running triangle wave 4. This analysis implies a choppy corrective sideways market for 2020 before a final push higher wave wave 5 to complete the bigger picture rally from the 2009 lows. The 200 week sma remains critical support for this structure.
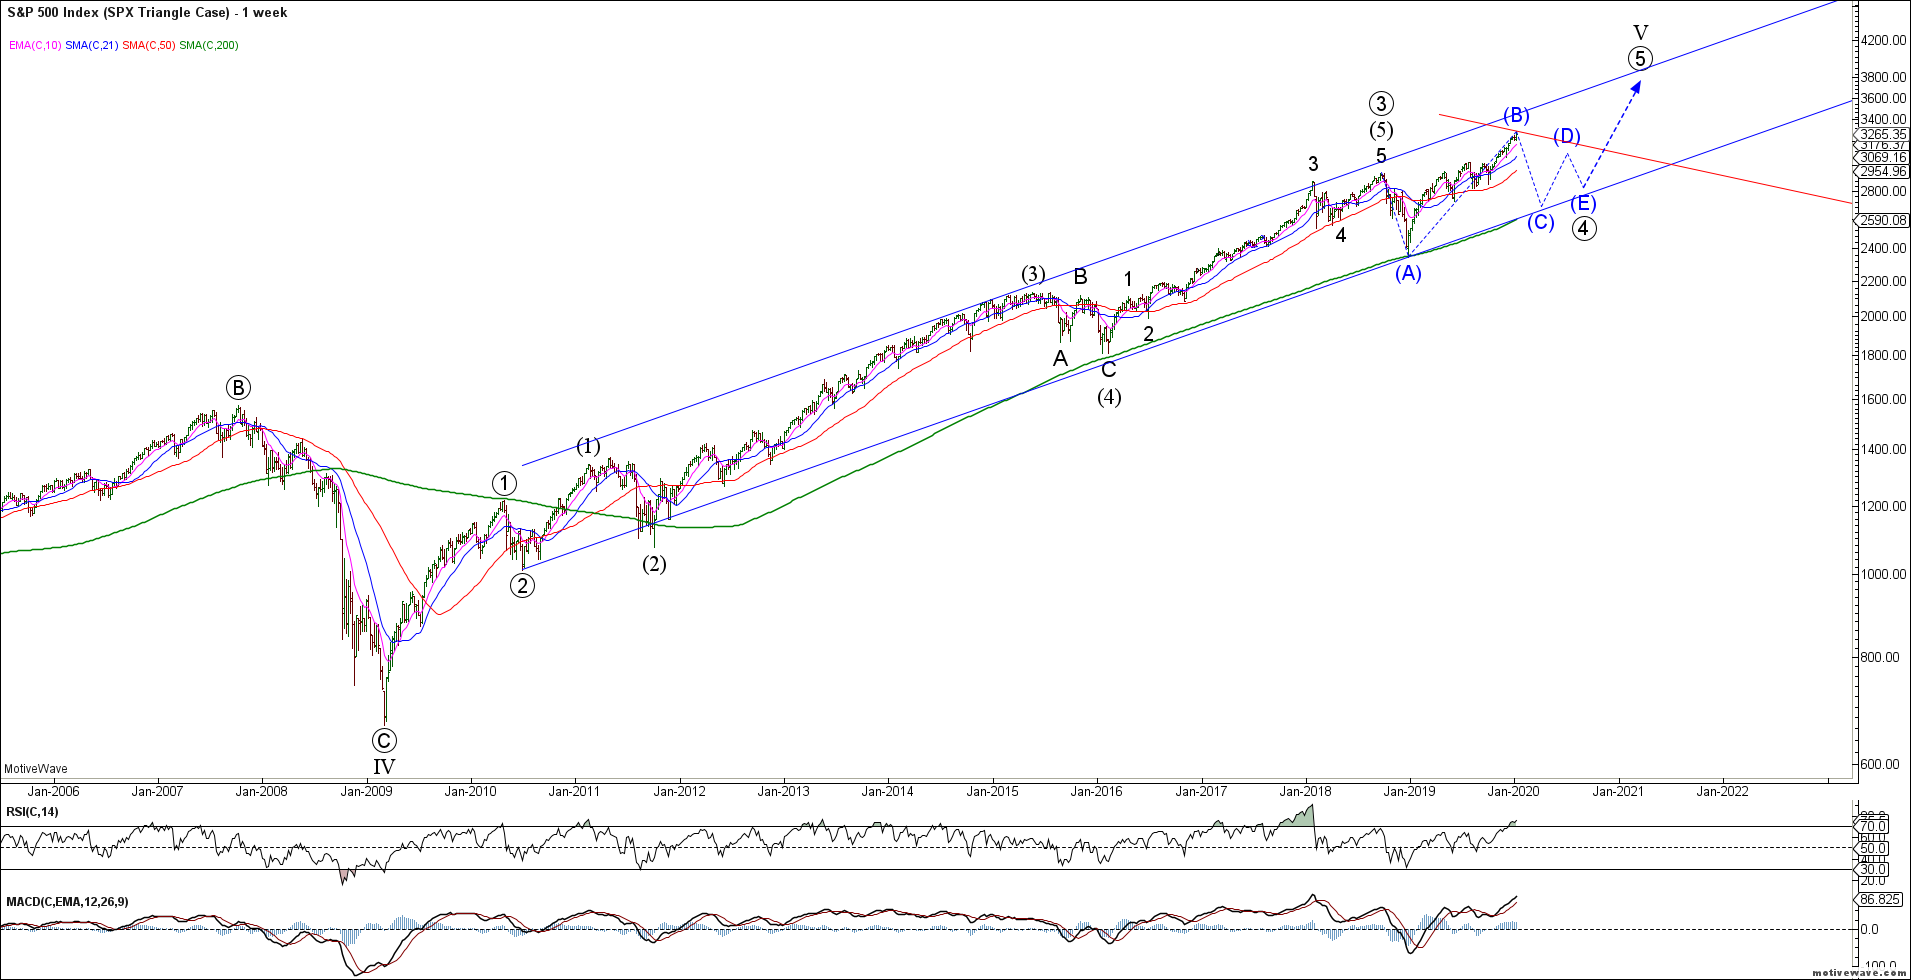
This SPX Triangle implies a near immediate bearish reversal that trades back below the key 3030 breakout level. We now have enough waves in place to complete the wave C of (B) rally into the 61.8% extension. What we do NOT have is clear evidence of a bearish reversal and impulsive decline.
The bullish alternate SPX case is a continued rally that extends into 5 waves from the 2018 lows throughout 2020. While this is not our preferred count, we are mindful of the strength of herding behaviour and animal spirits of this Fed induced rally.
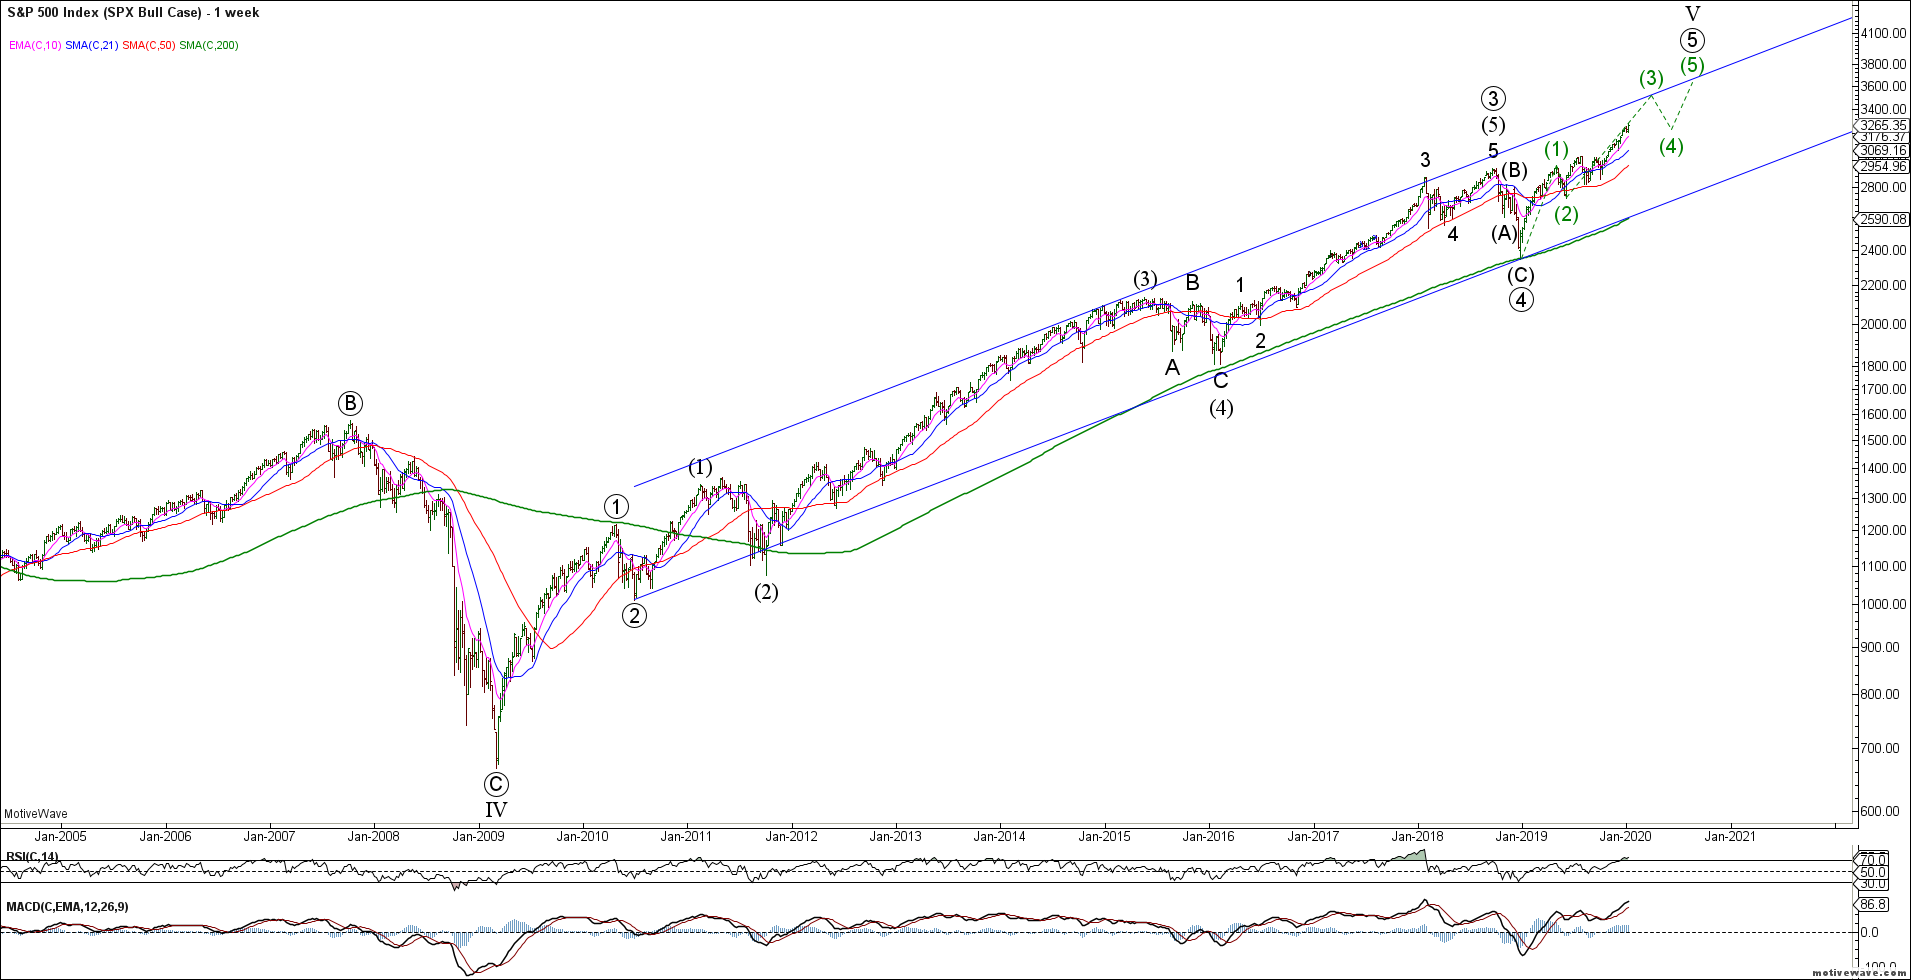
The key for this bull case is for the SPX to remain above the 3030 overlap and keep extending higher in 5 waves. This count assumes we are currently completing wave 3 of (3) of (5) which would likely mark the end of the post-2009 rally.
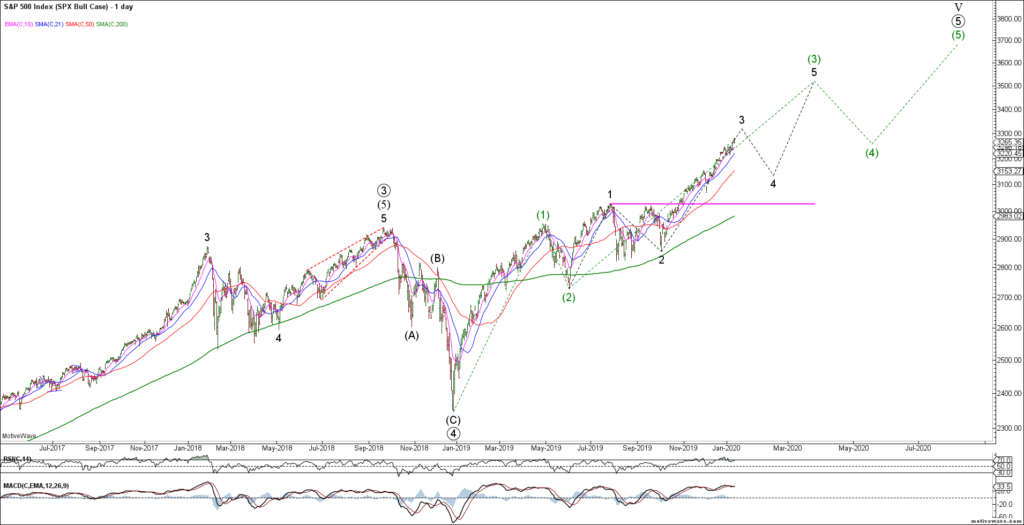
While lower probability, given extreme bullish sentiment and one-way trade, we must be aware of the potential bear case of an Expanded Flat wave (4). This would imply a strong impulsive decline back below the 2018 lows triggered by a break of the 200 week sma and long term trend channel. This is why low cost long dated puts or VIX calls may be a preferred strategy.
The ES has enough waves in place to complete the wave (c) rally. No evidence yet of a bearish reversal but we do have 5th wave momentum divergence at last week’s highs.
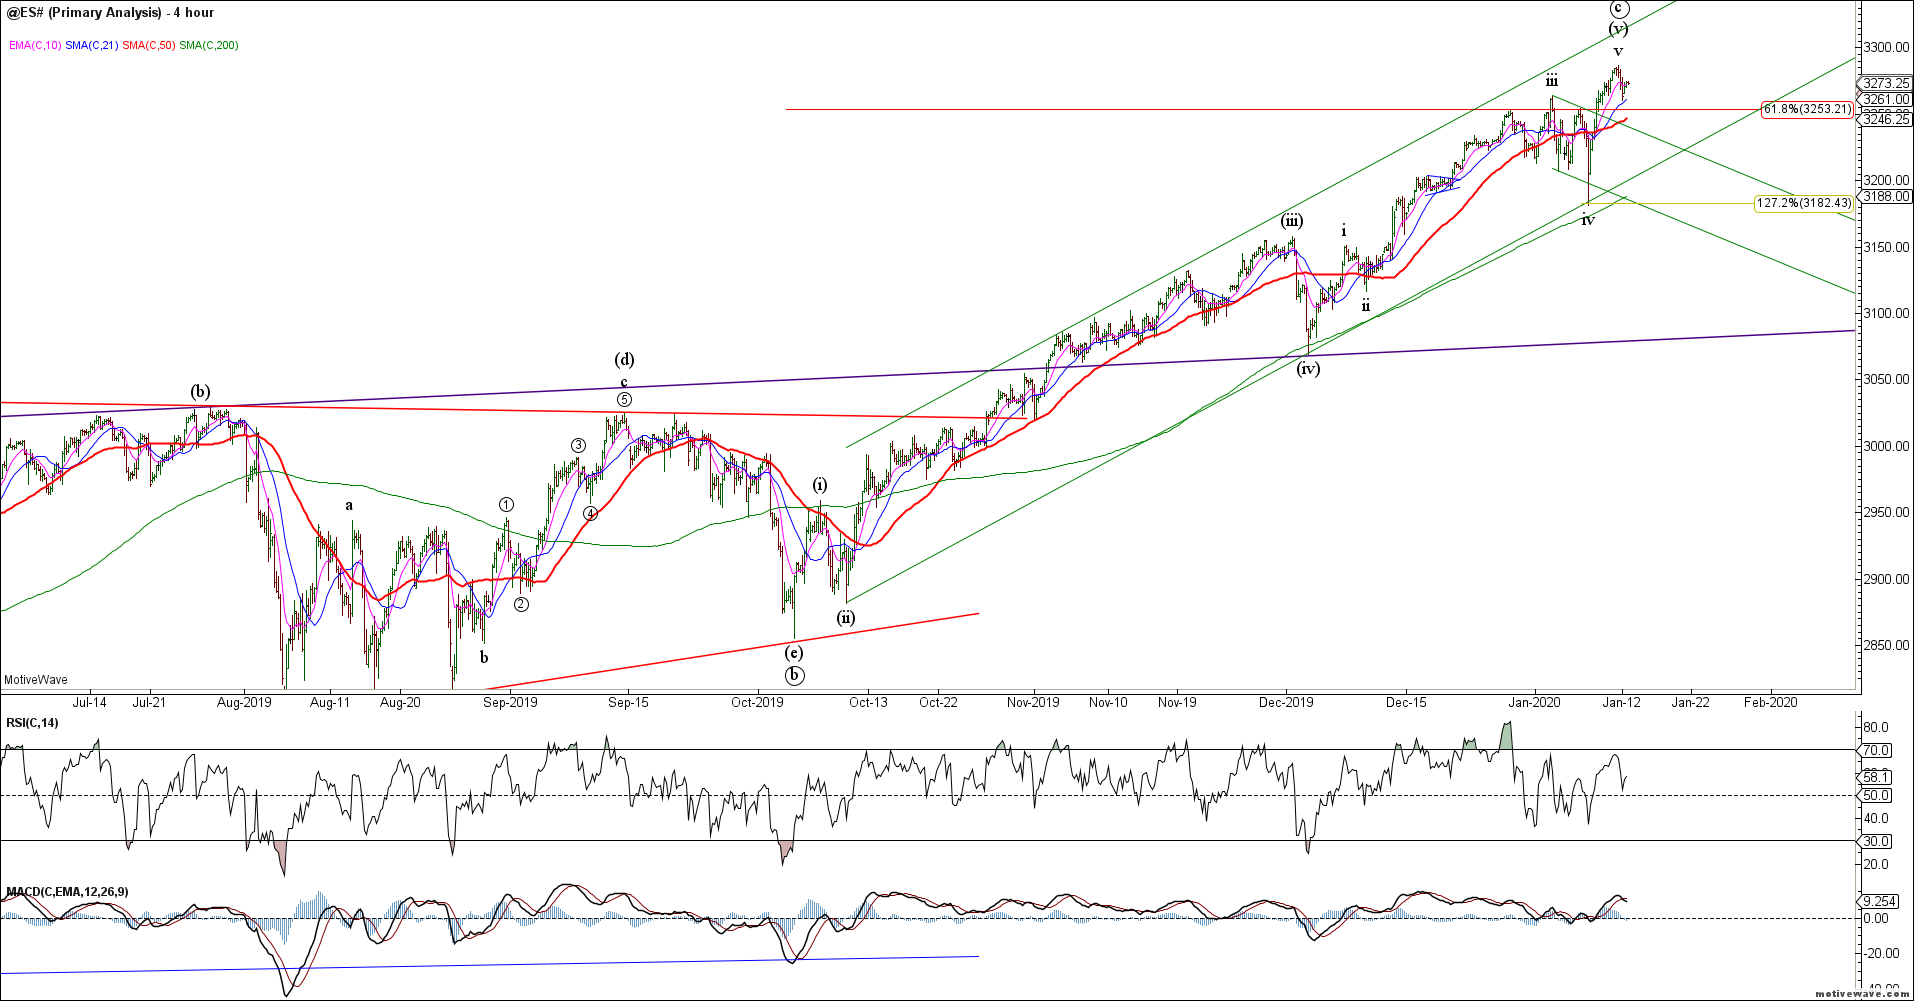
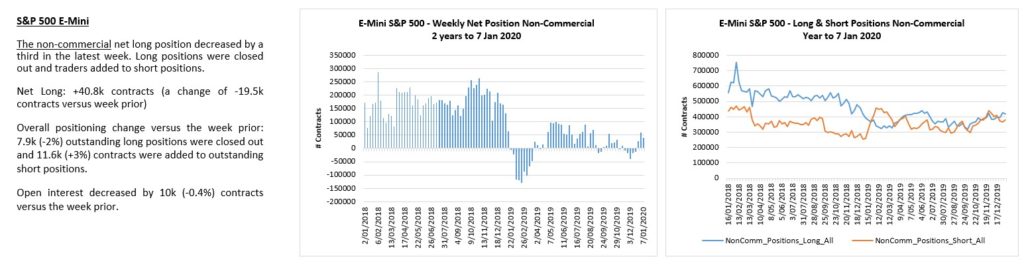
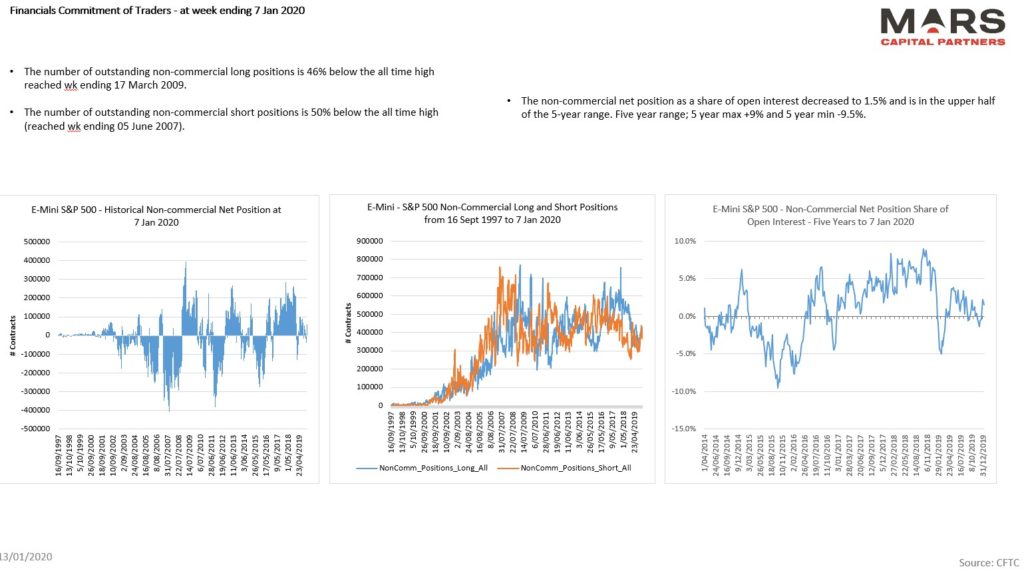
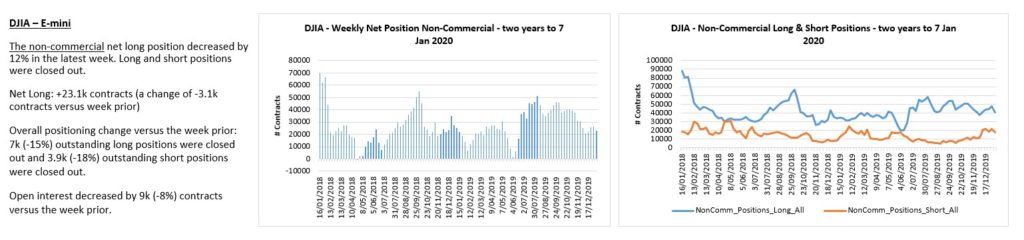
Futures traders remain flat with volumes traded at cycle lows. I suspect that this trend represents complacency and a focus on individual stock exposure. Futures traders are not driving this market melt-up.
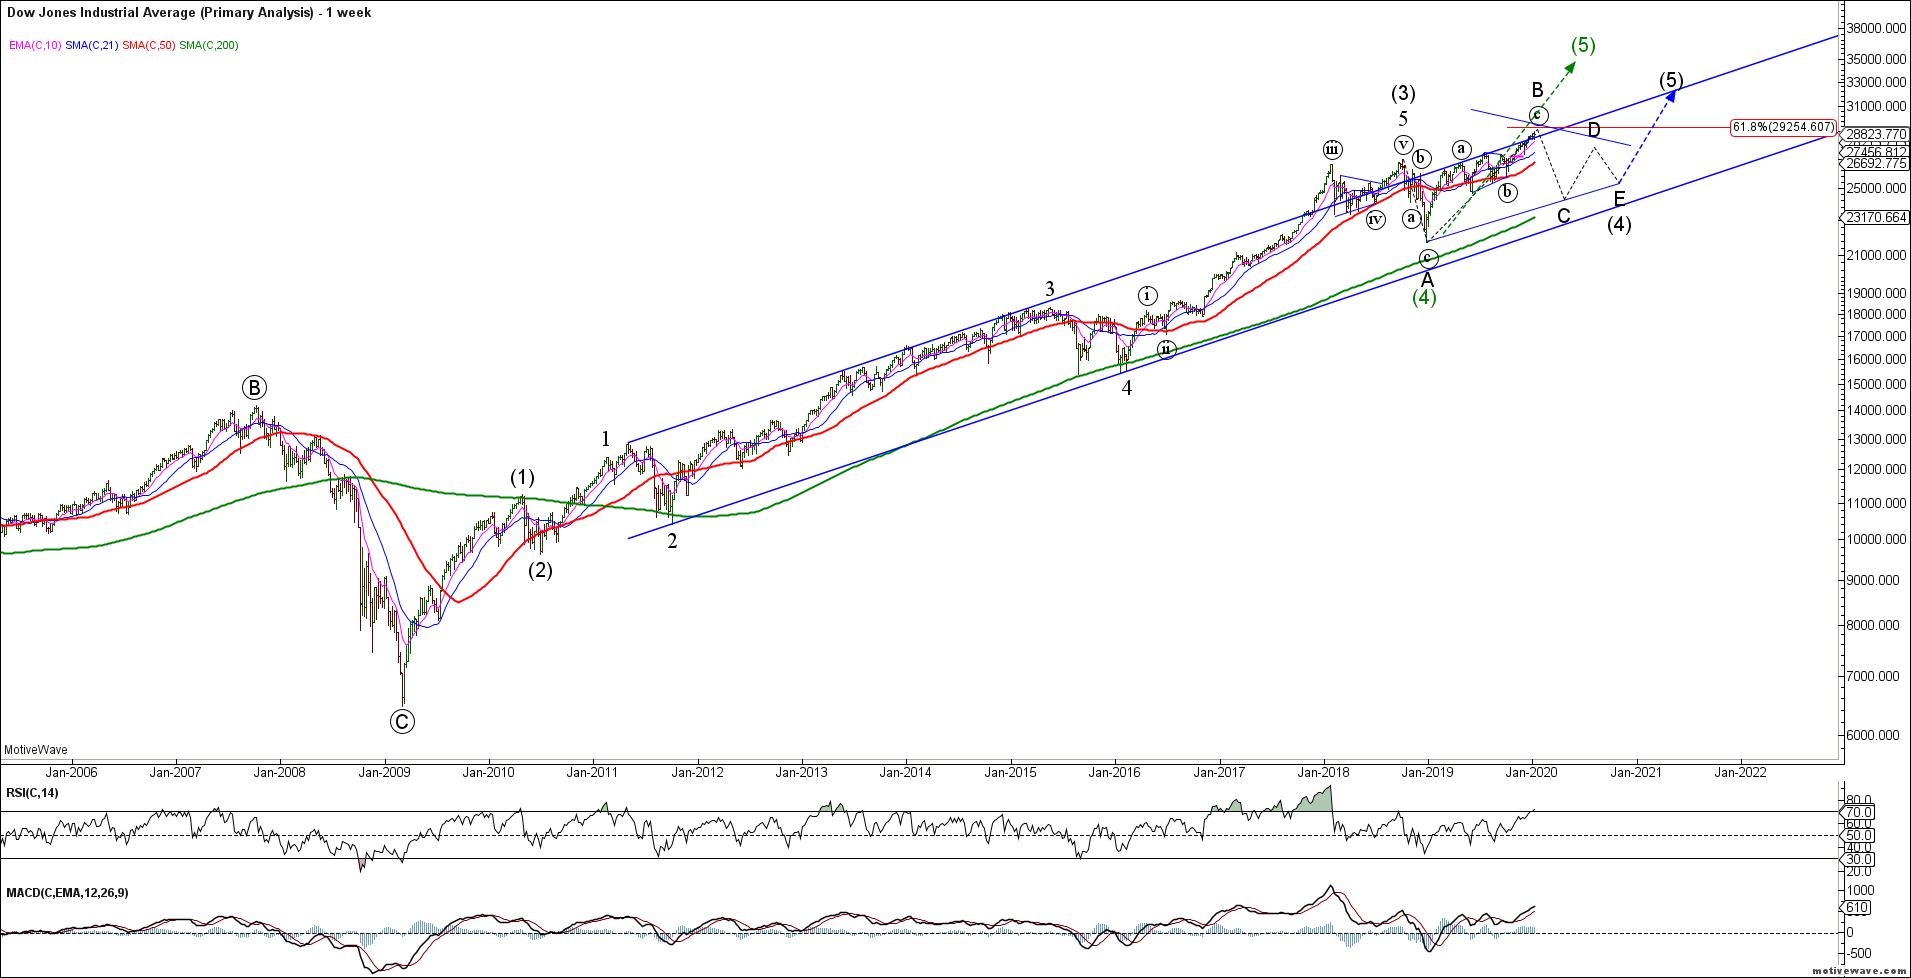
The DJIA shows the same potential structures. So far, we only have 3 waves up from the December 2018 lows. While our base case remains a larger degree 4th wave triangle throughout 2020, the potential remains for a continuation of the bull trend to develop into 5 waves (green count) if the melt-up continues.
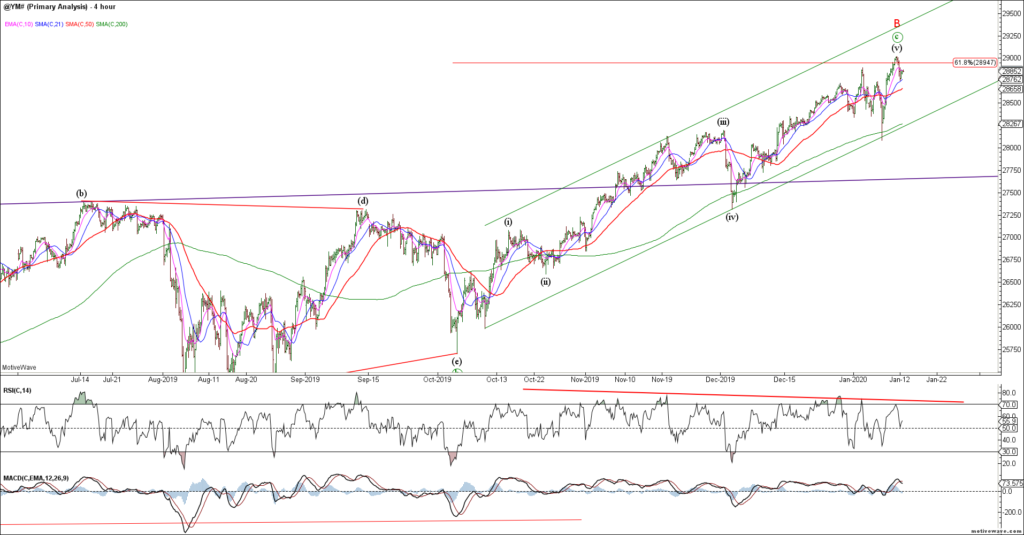
The YM shows momentum divergence at recent highs. We now need to see evidence of a bear reversal.
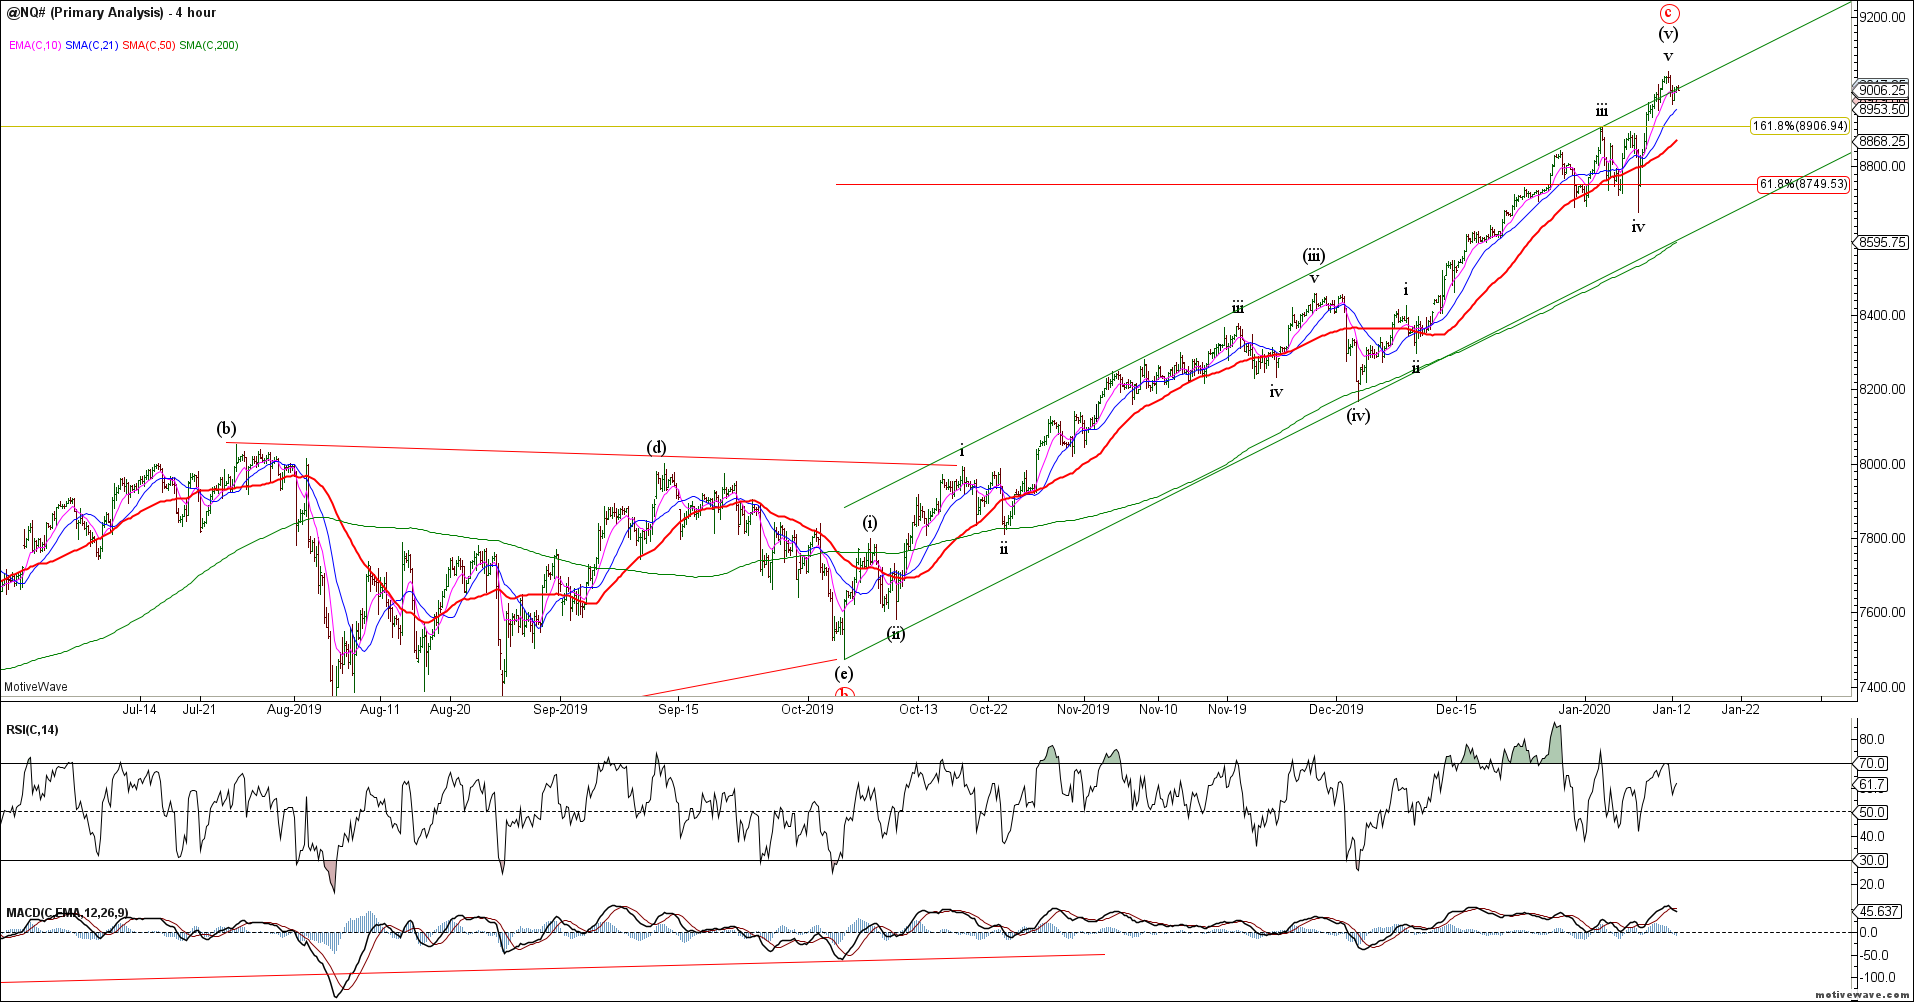
The Nasdaq shows the same potential structures with 3 waves up from the December 2018 lows so far. Last year we highlighted the expectation of new ATH’s for the Nasdaq indices. This index has a clearly definable trend channel for the post-2009 rally. The bulls remain in control while above the key 8330 breakout.
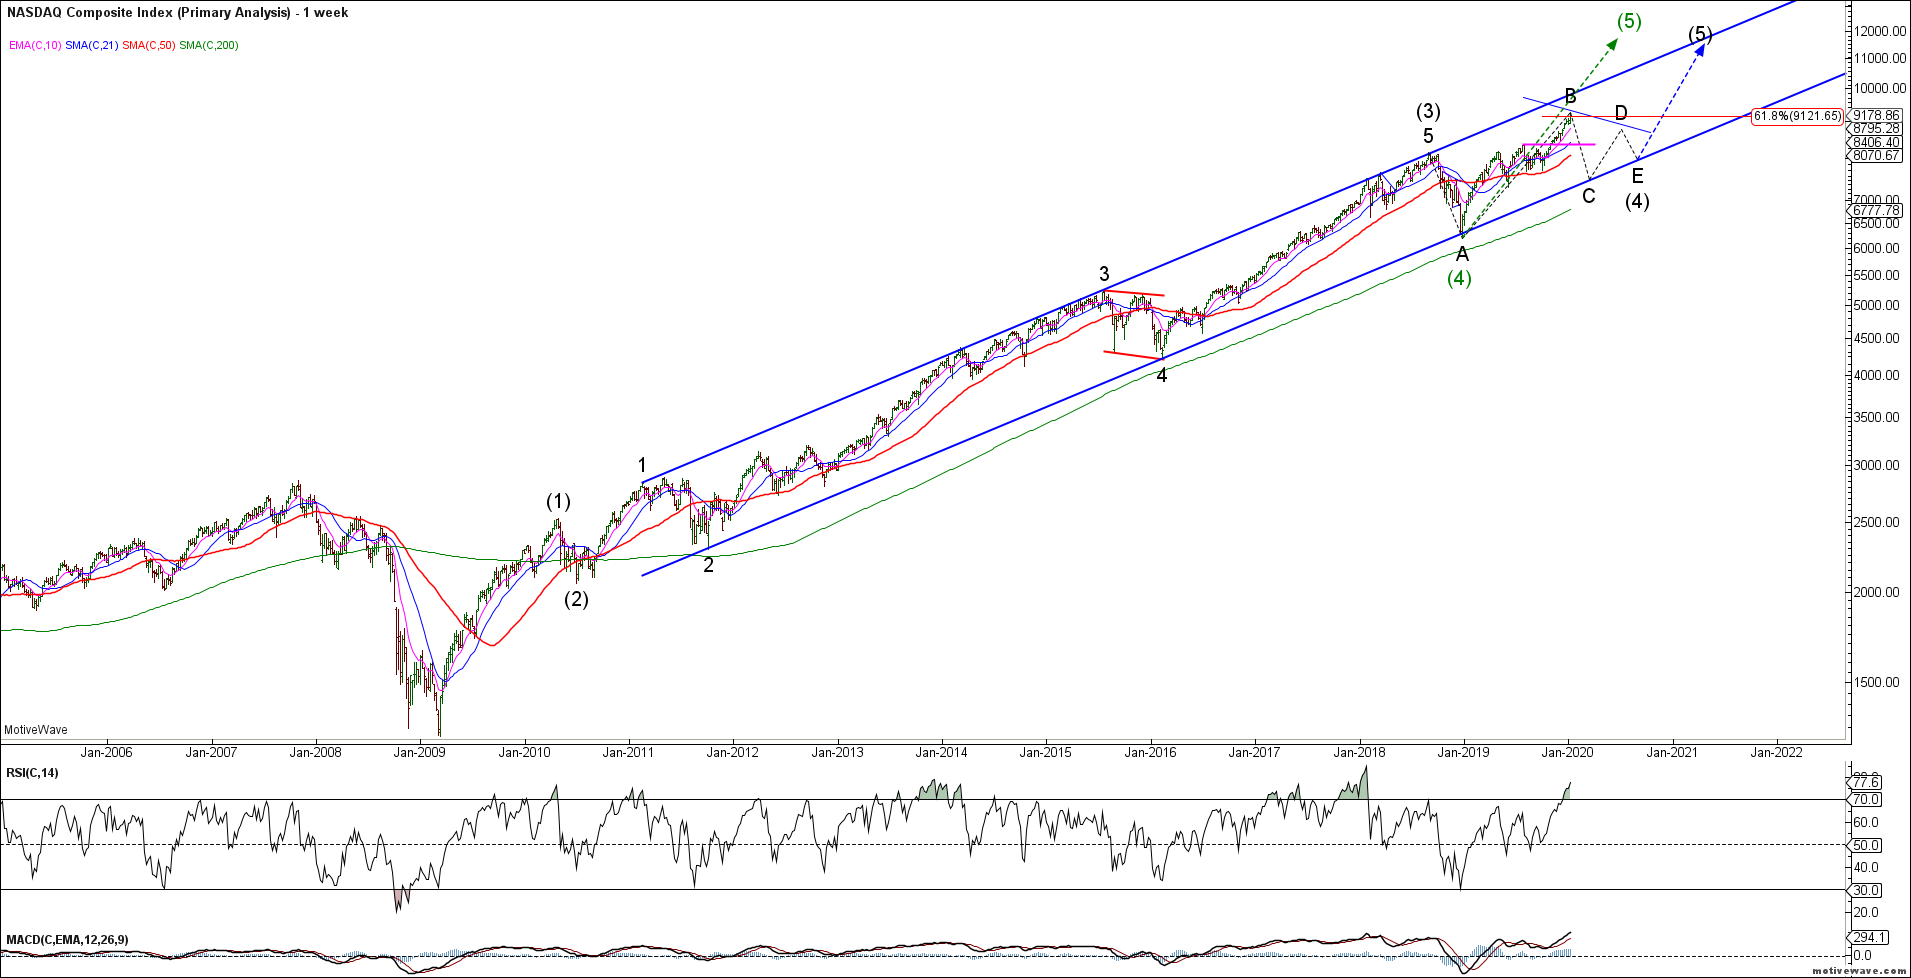
NQ now has near term 5th wave divergence. Bears need to break these trend channels.
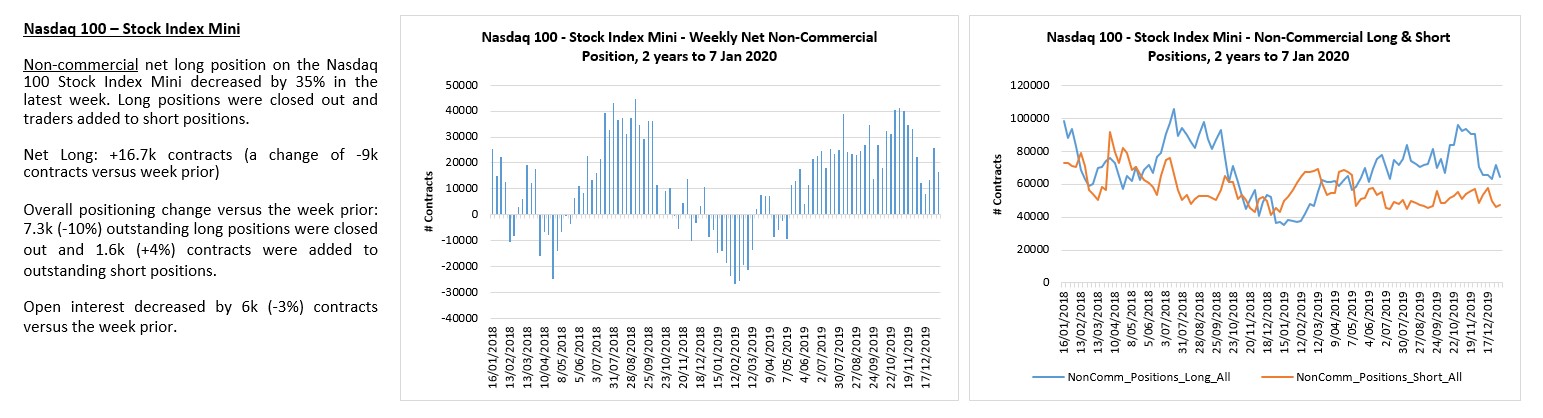
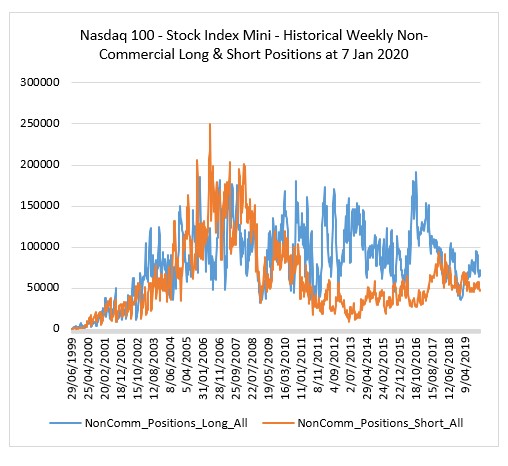
NQ traders are slightly long but volumes are less than half cycle peaks. Traders just want to own stocks.
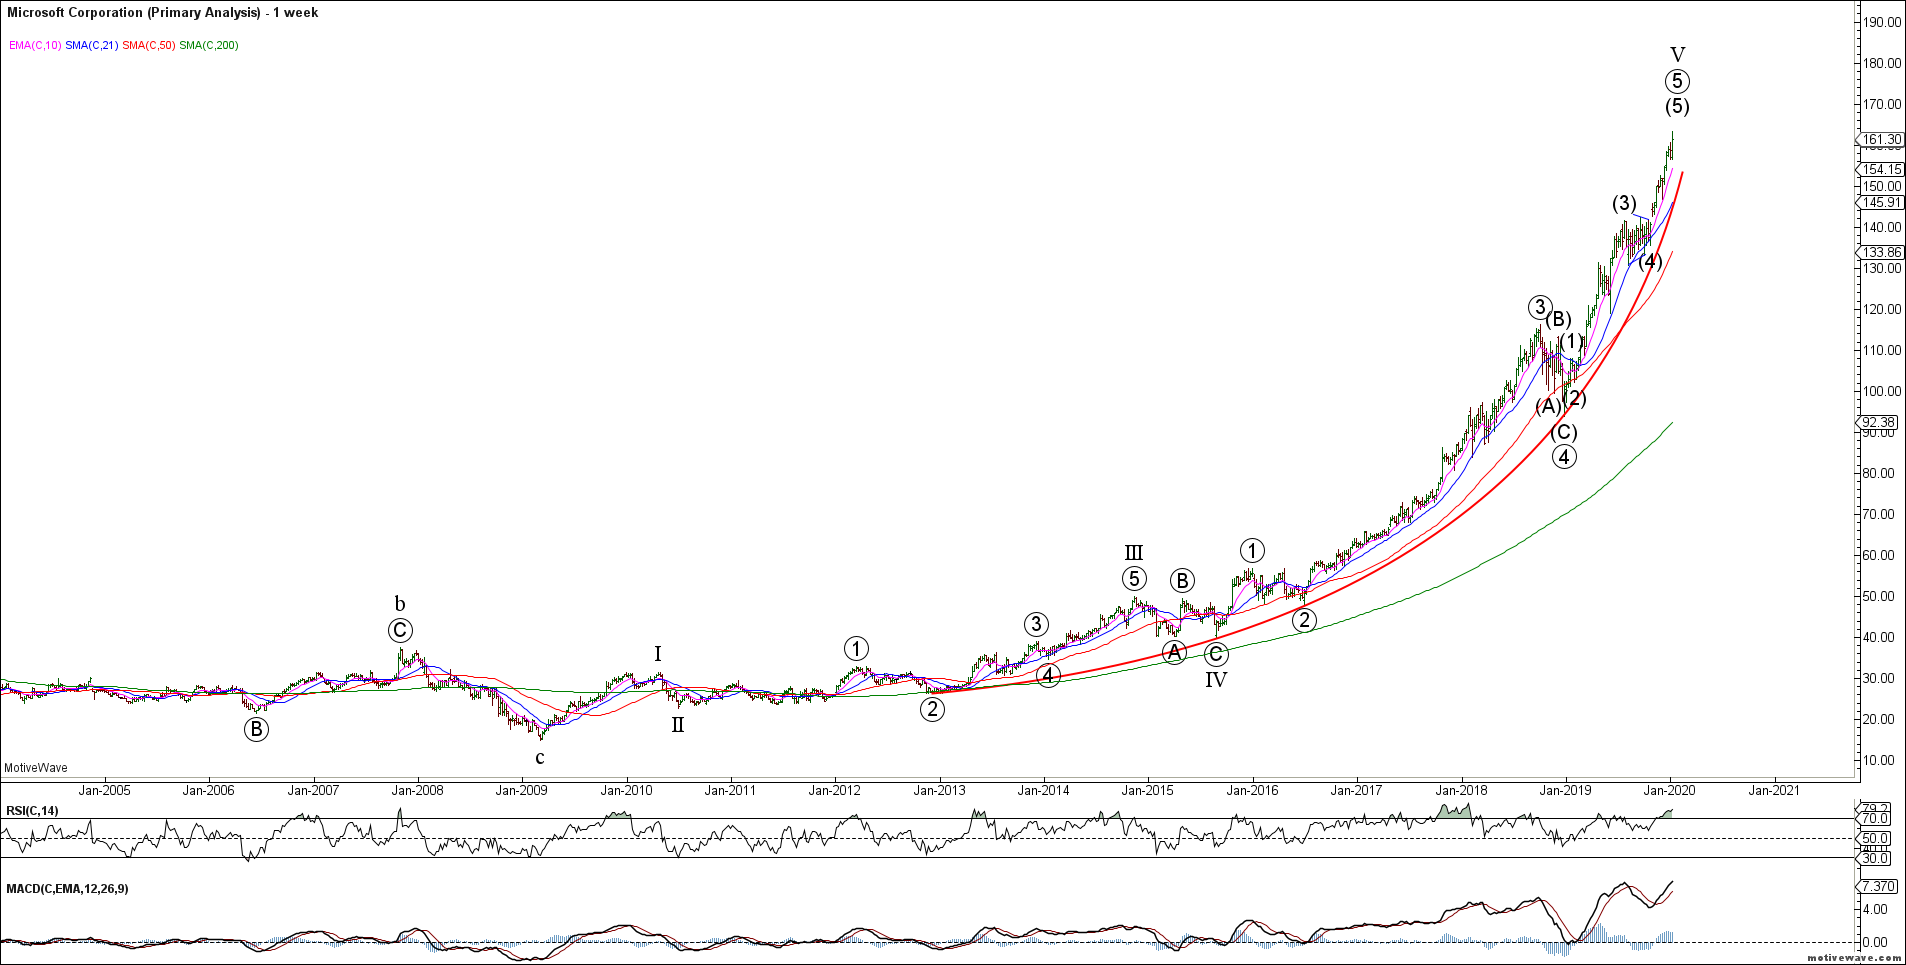
MSFT may be the best representation of the parabolic stock chase taking place supporting the Nasdaq. Parabolic runs always retrace violently so we will continue to watch MSFT for evidence of a tradable top.
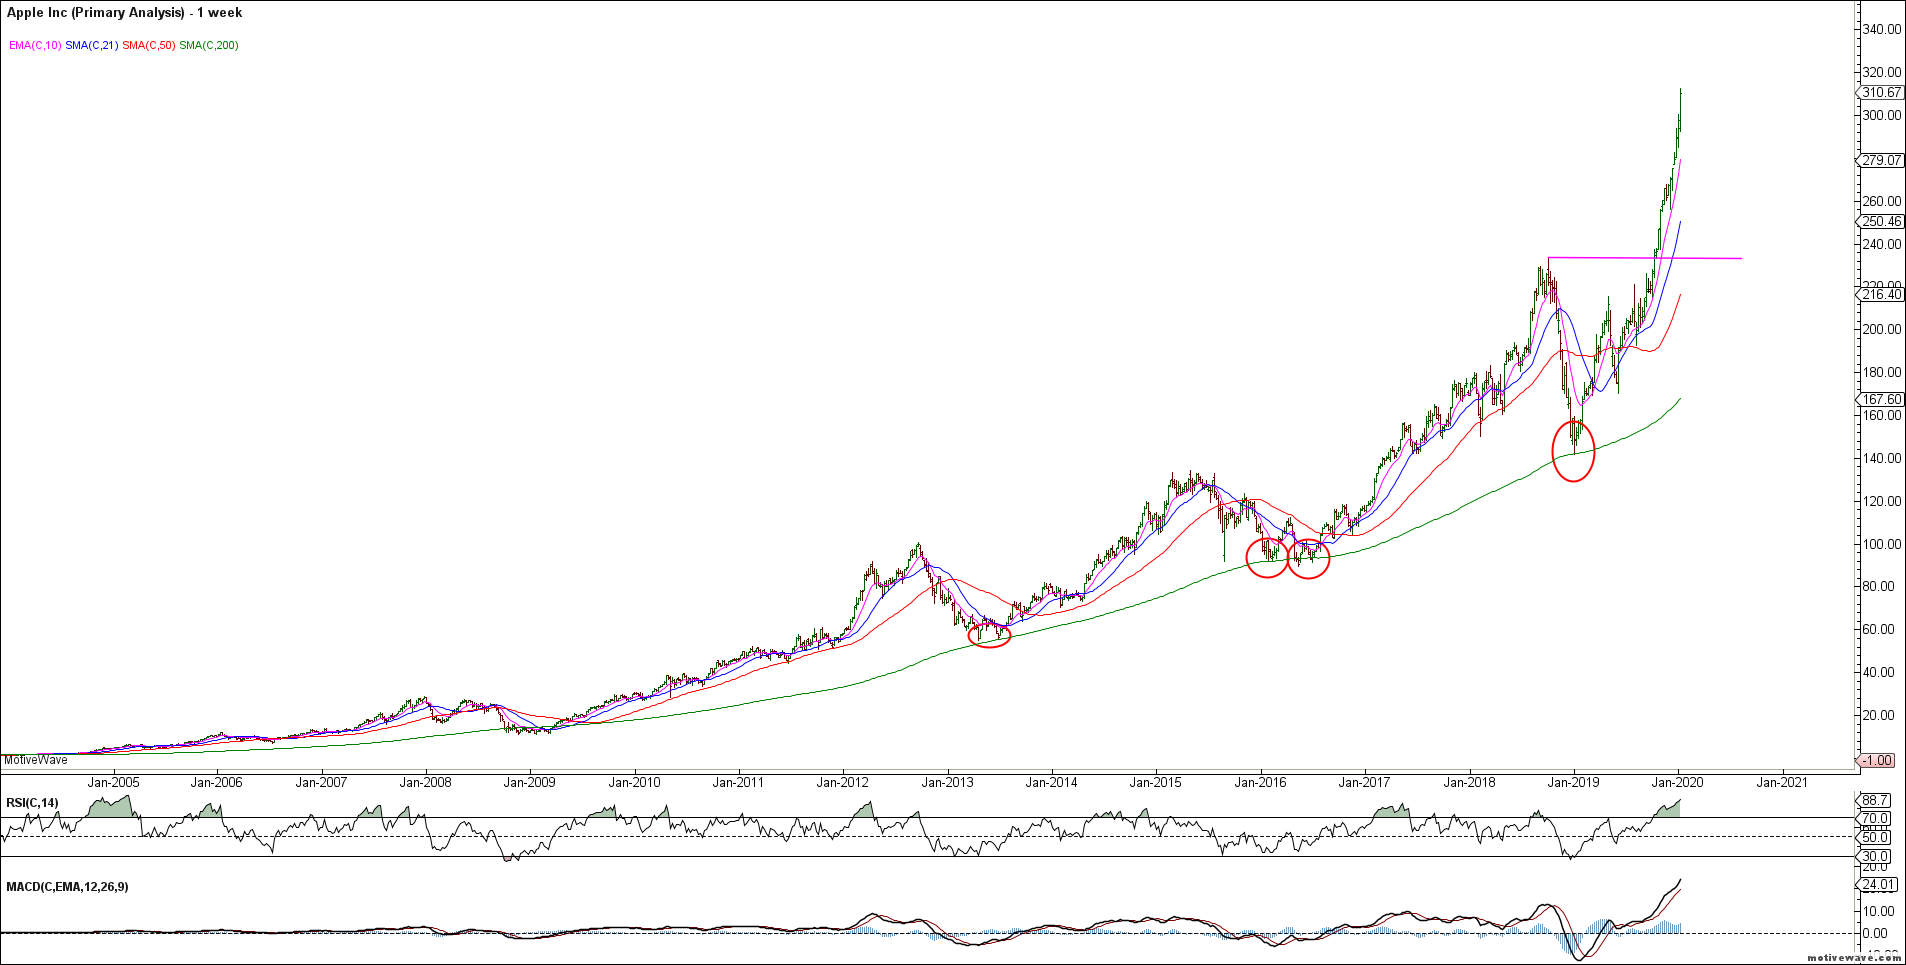
Similarly, AAPL has more than doubled in price since bouncing off our 2018 support and is now in a parabolic rally. These individual darling stocks are driving the larger indices.
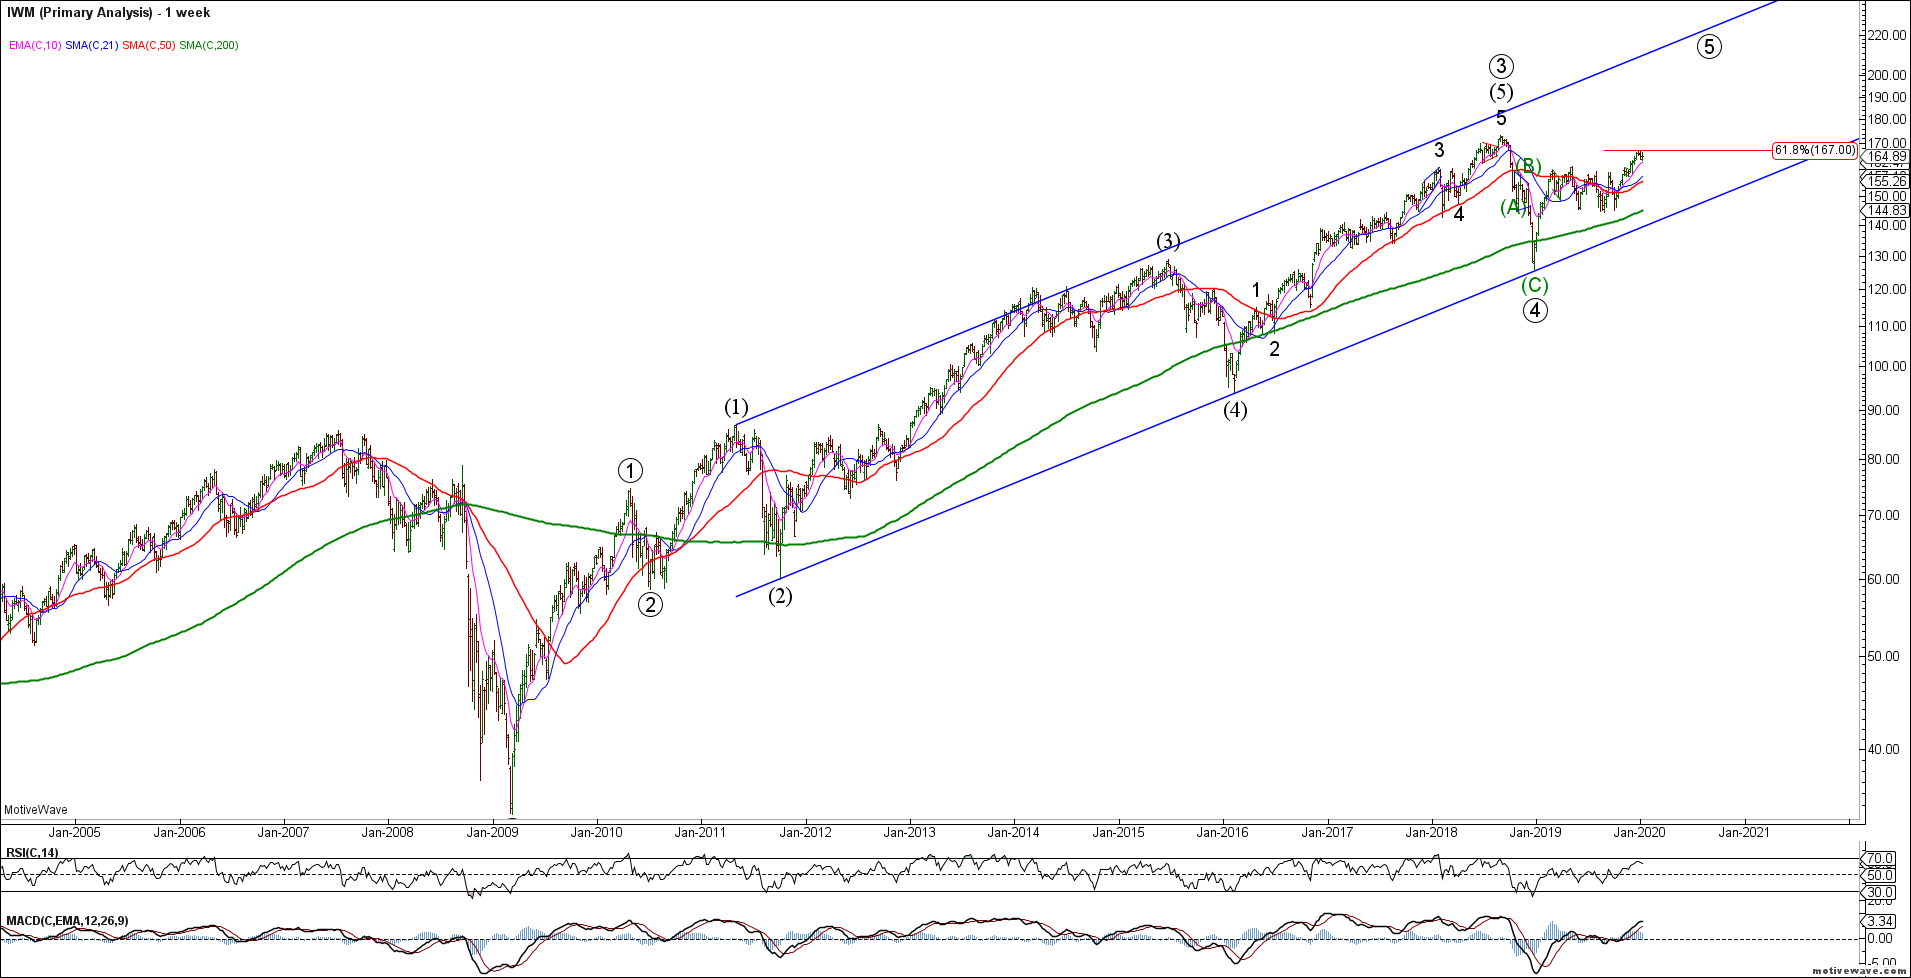
The Russell 2000 small caps have lagged the broader indices and remains below its 2018 highs. The corrective 3 wave decline in 2018 implies that we do NOT have a bigger picture change in trend and we should ultimately expect new ATH’s in 5 waves. So far, the rally is only in 3 waves so could still be part of a larger corrective wave (4). Bulls need to extend this rally into 5 waves to maintain near term momentum.
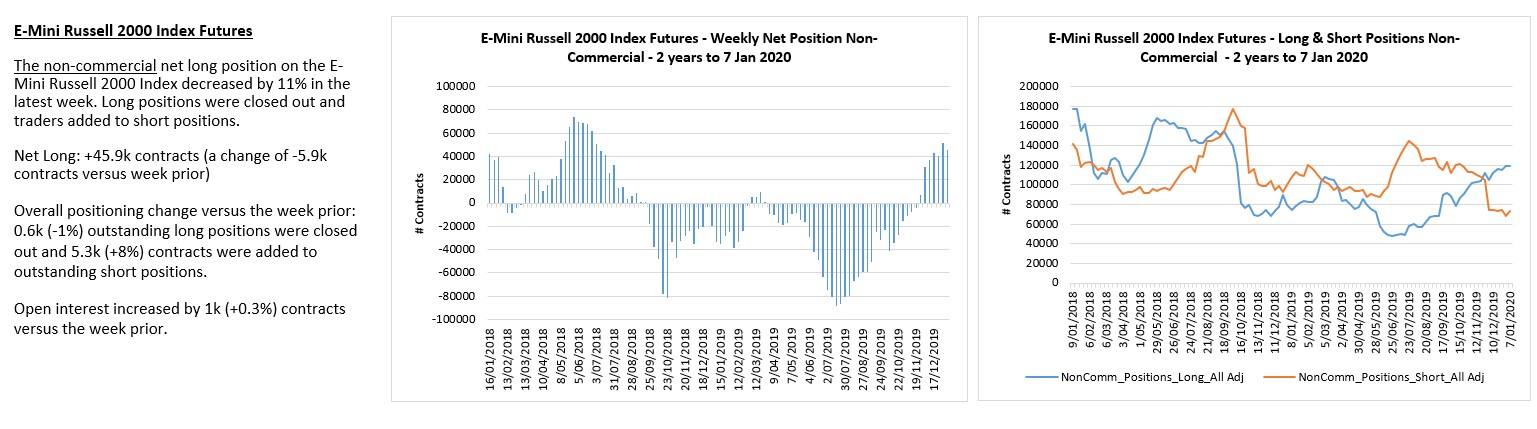
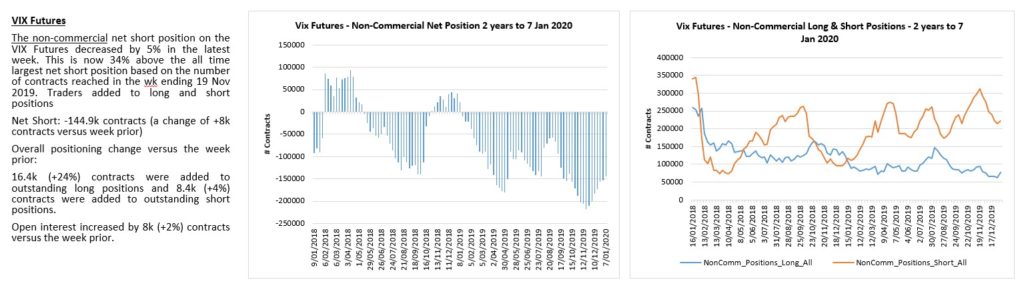
Complacency reigns as shorts hit new cycle lows.
The Fed has been successful in compressing volatility. The VIX is contracting sharply but remains above the 2018 lows forming an inter-market divergence. Portfolio insurance remains cheap given the over-extended nature of this rally. Extended volatility compression leads to sudden expansion. Forewarned is forearmed…
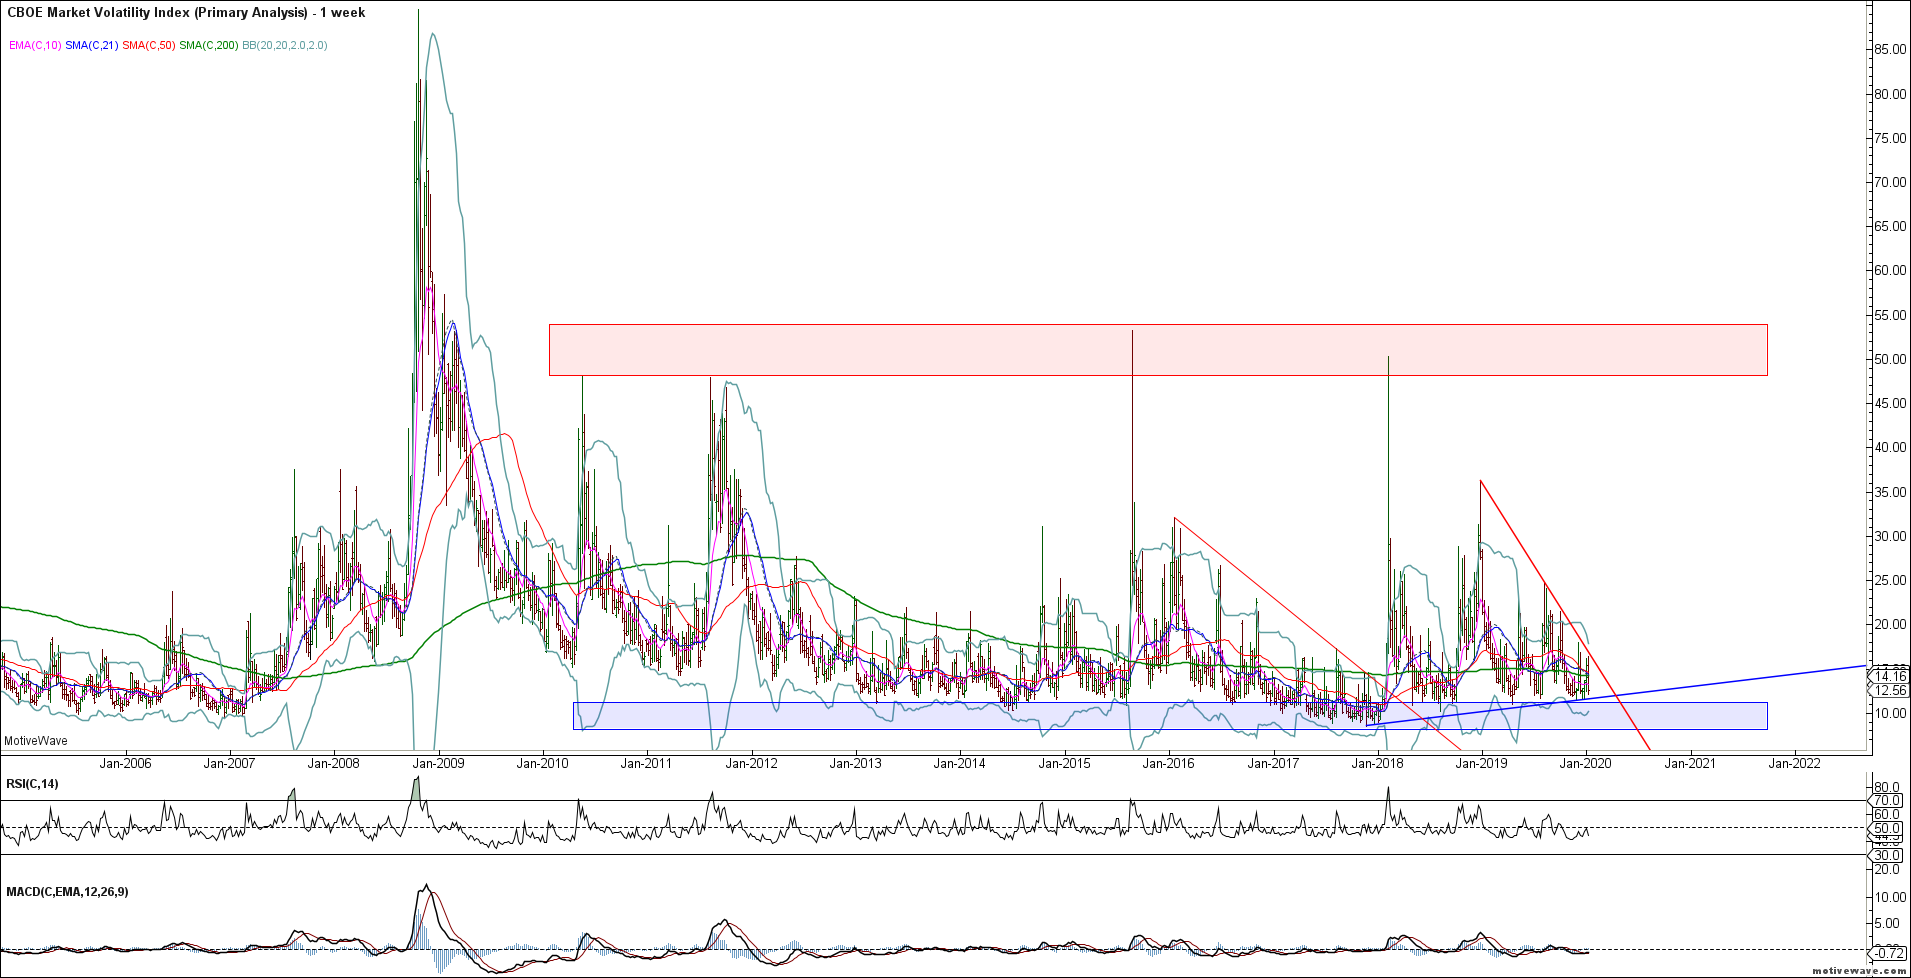
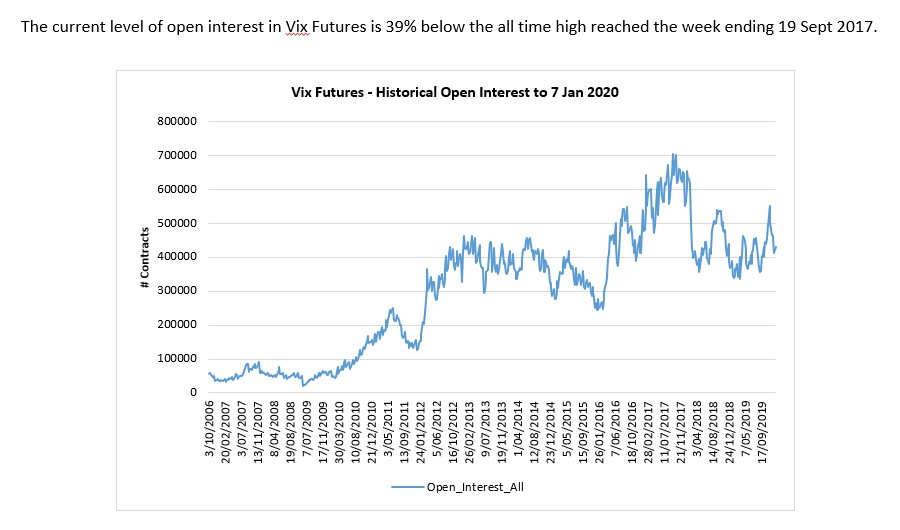
VIX volume is 39% below its peak.
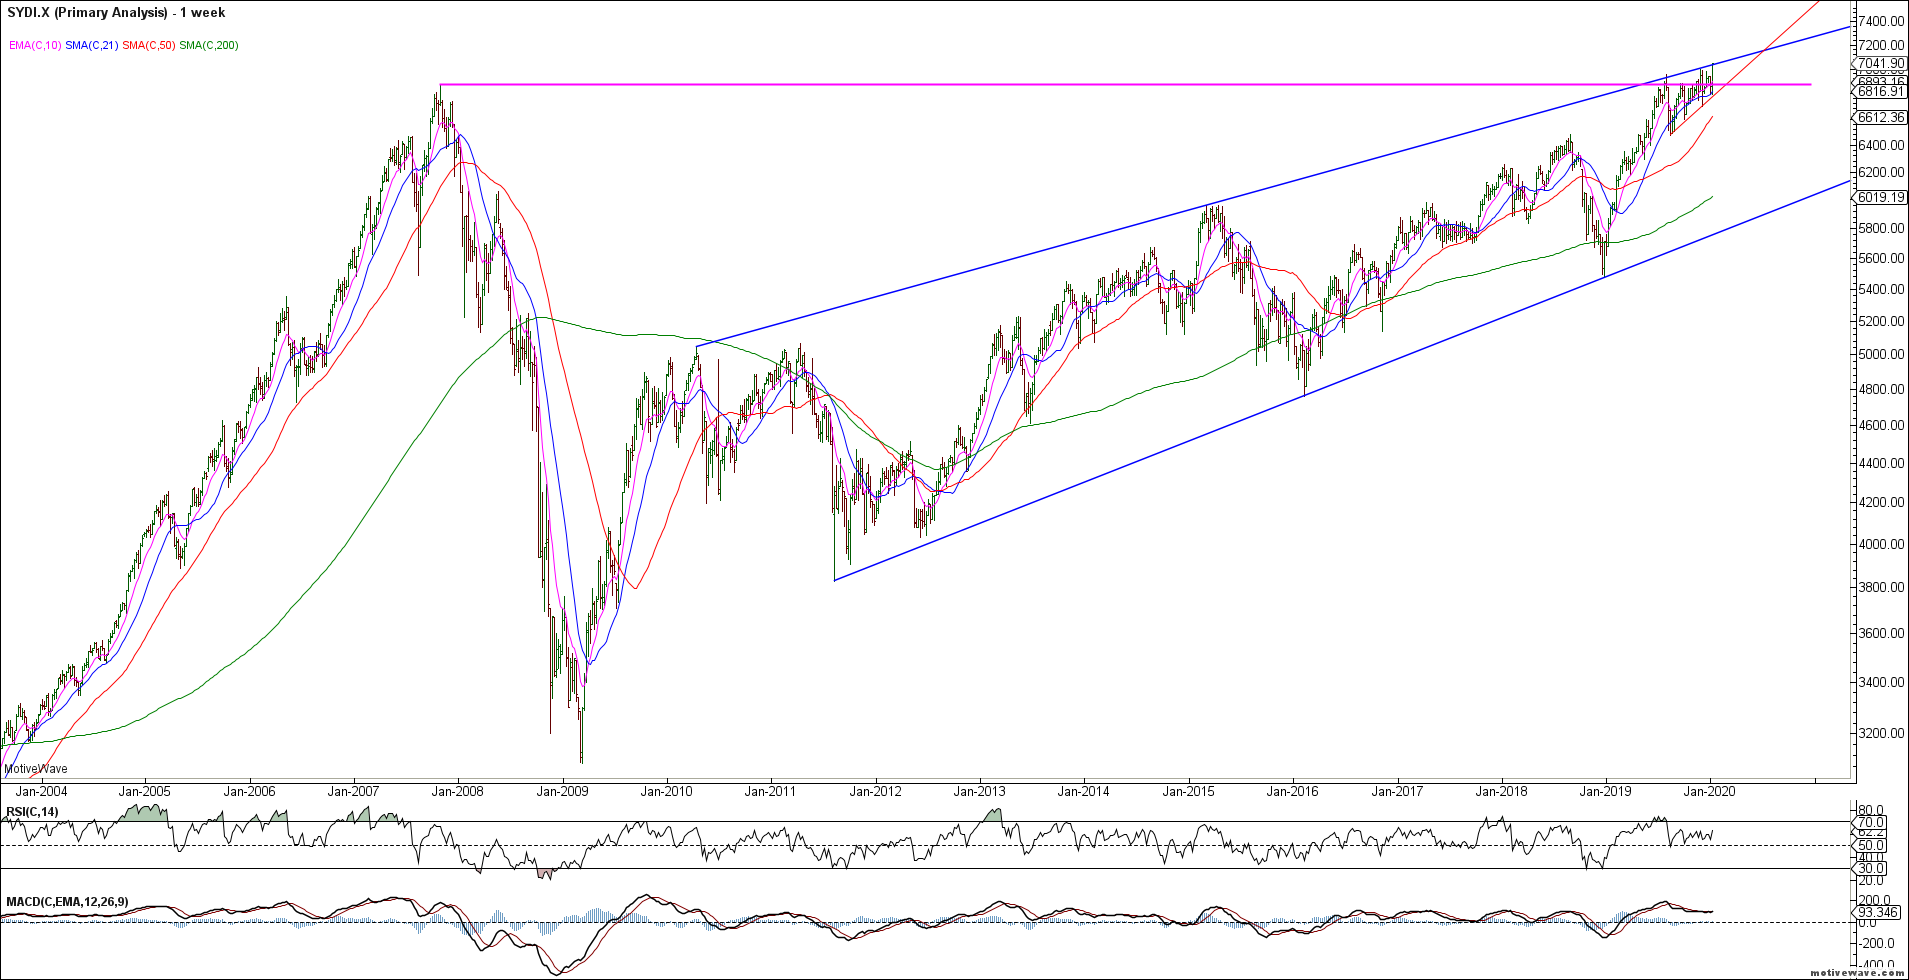
To the global equity markets and we appear to be wedging towards major market highs. The ASX200 appears to be a good example now making new ATH’s in a clearly defined wedge. These are usually ending patterns so we are alert to a bearish reversal in the Aussie stock market.
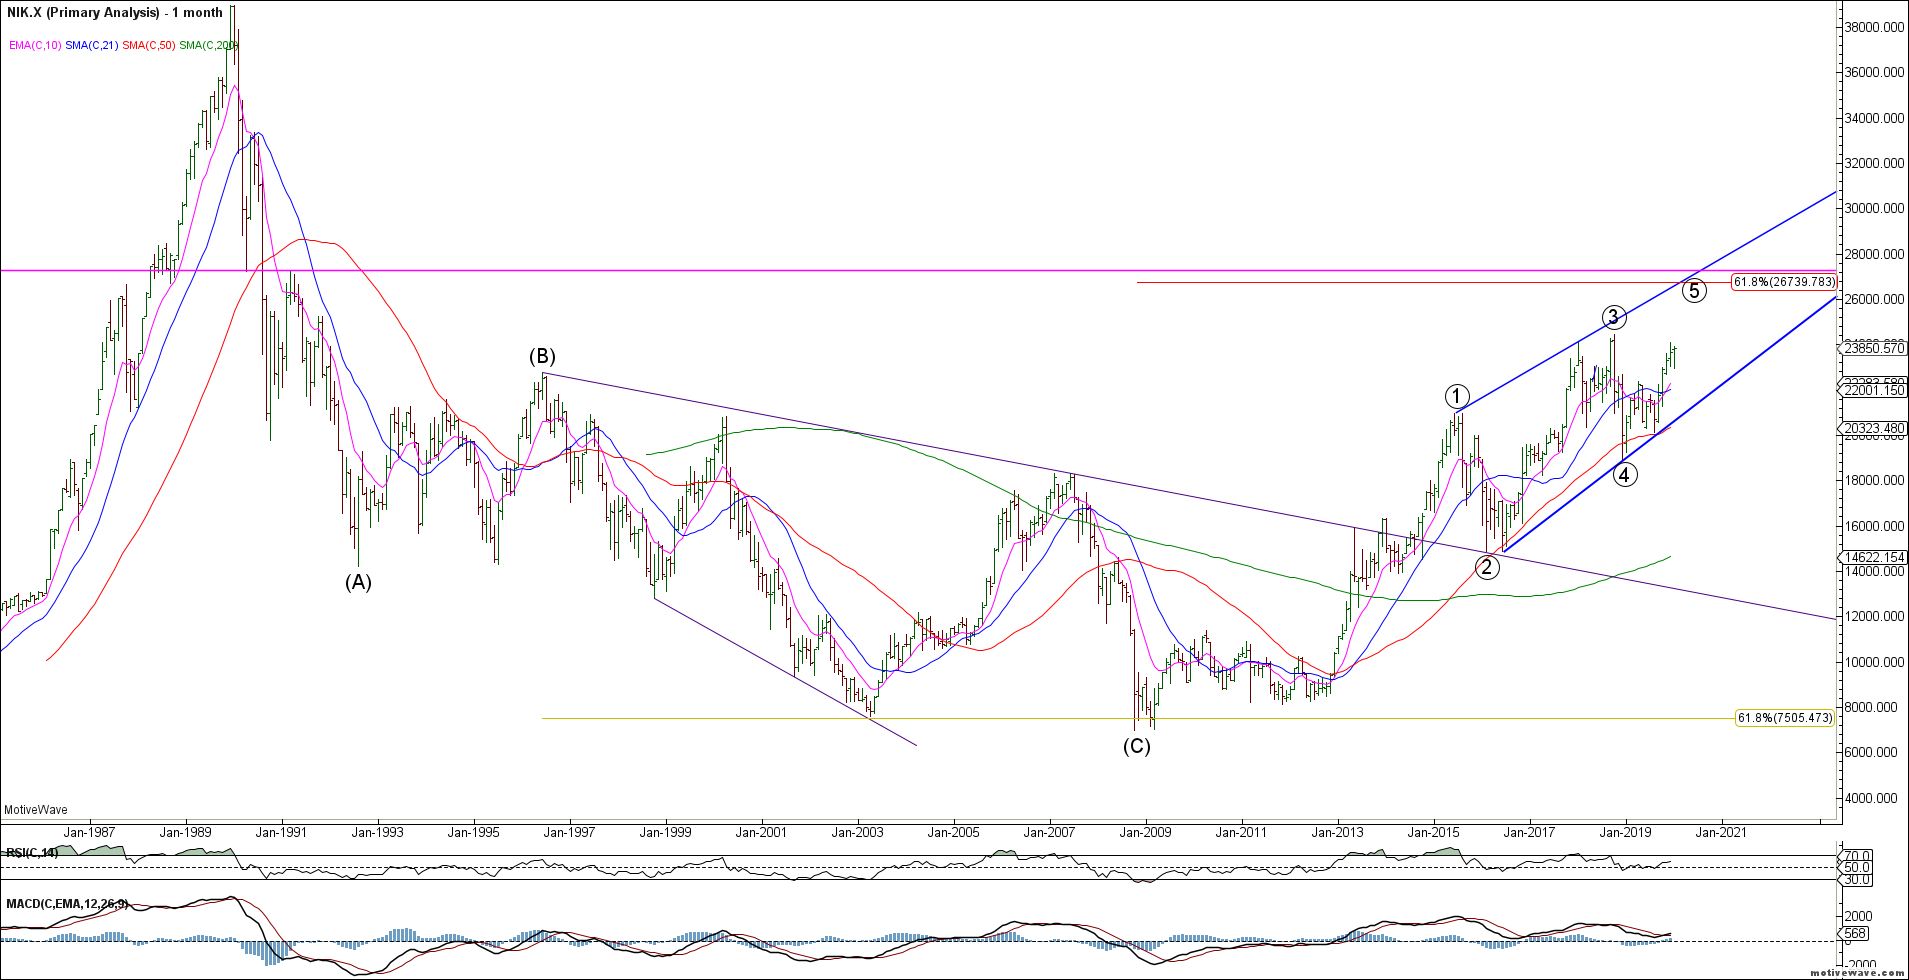
Similarly, the Nikkei 225 appears to be in wave 5 of an ending wedge. We still need to see a final push above the wave 3 highs (24448) to help confirm this outlook.
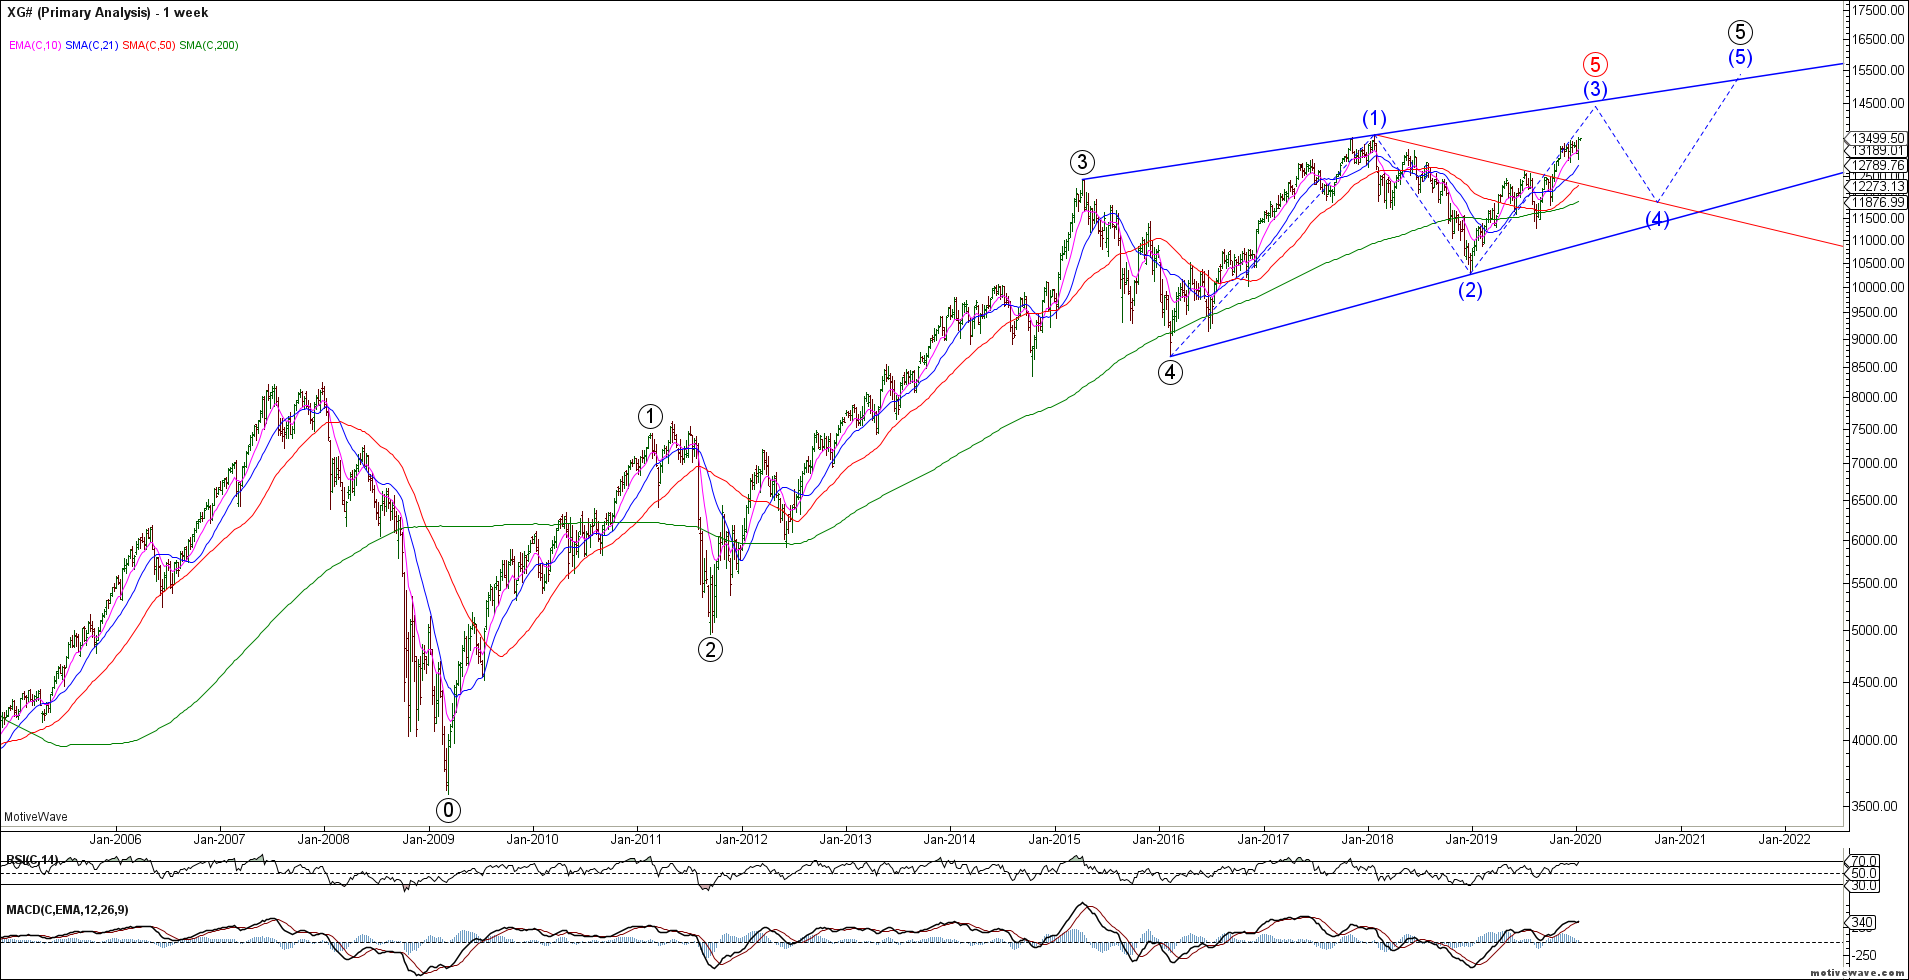
The DAX also appears to be wedging into the highs but would look best with a final push higher towards 14500 as it is yet to break the 2018 highs. It is either completing blue wave 3 of (5) or all of red wave (5). Likely topping near term.
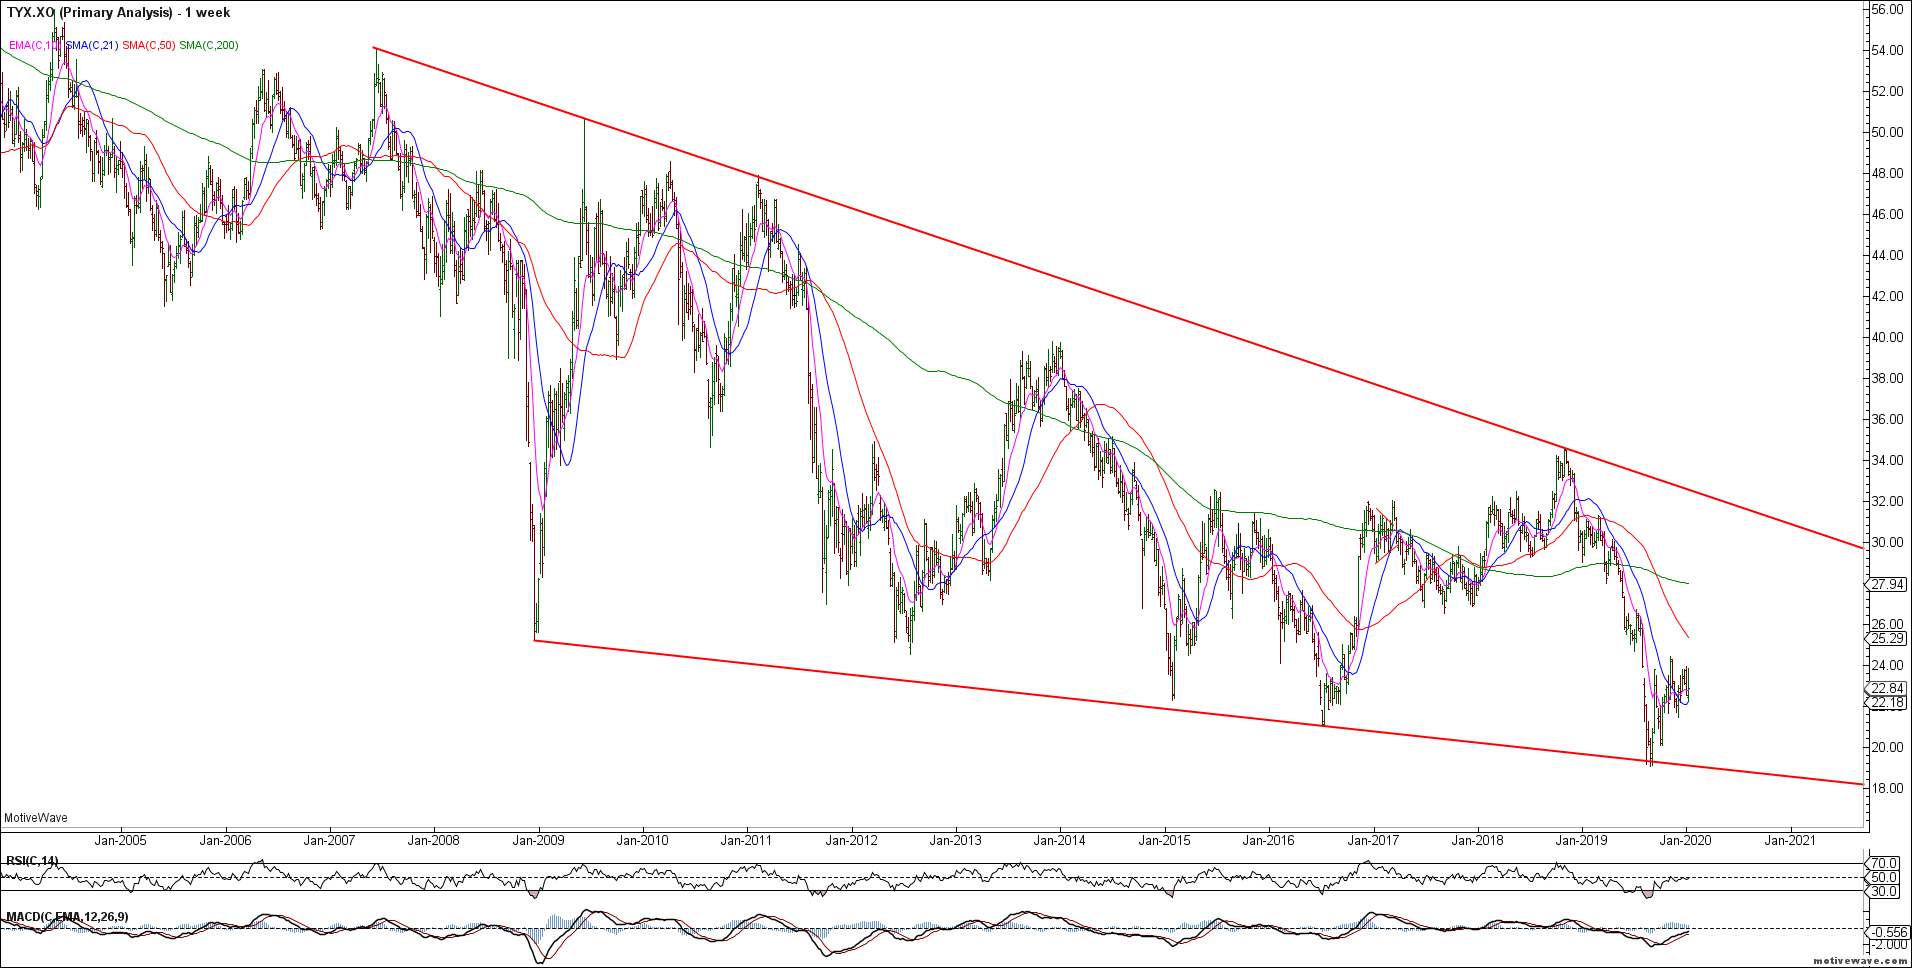
To the bond markets and last year we highlighted the probability of a new cycle low in rates given our bullish bond outlook. The TYX made a new low in September from which we have seen a corrective recovery. We remain bullish bonds until proven otherwise as we look for the 10yr and 5yr to confirm a push to new cycle lows. From there we would be looking for a trend reversal in bonds across the board as MMT is fully embraced.
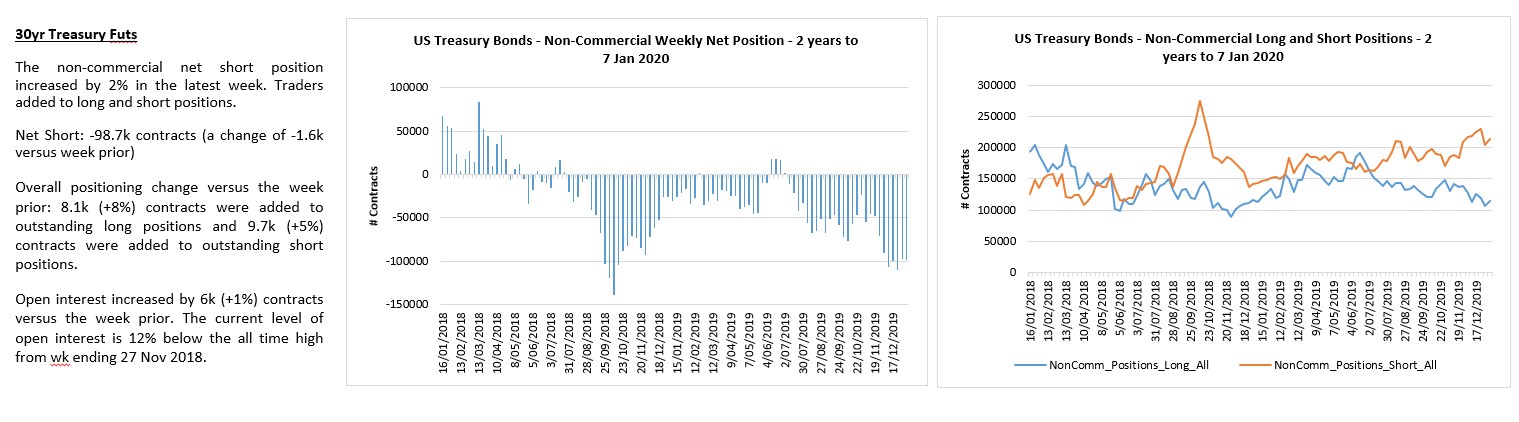
The US 30yr / ZB should be ending its wave 4 correction as we look higher for a wave 5 rally to new cycle highs. The decline from the August highs appears corrective and continues to hold support in the 153-155 area. While we should allow a further decline towards 153, our bullish bond outlook remains in tact.
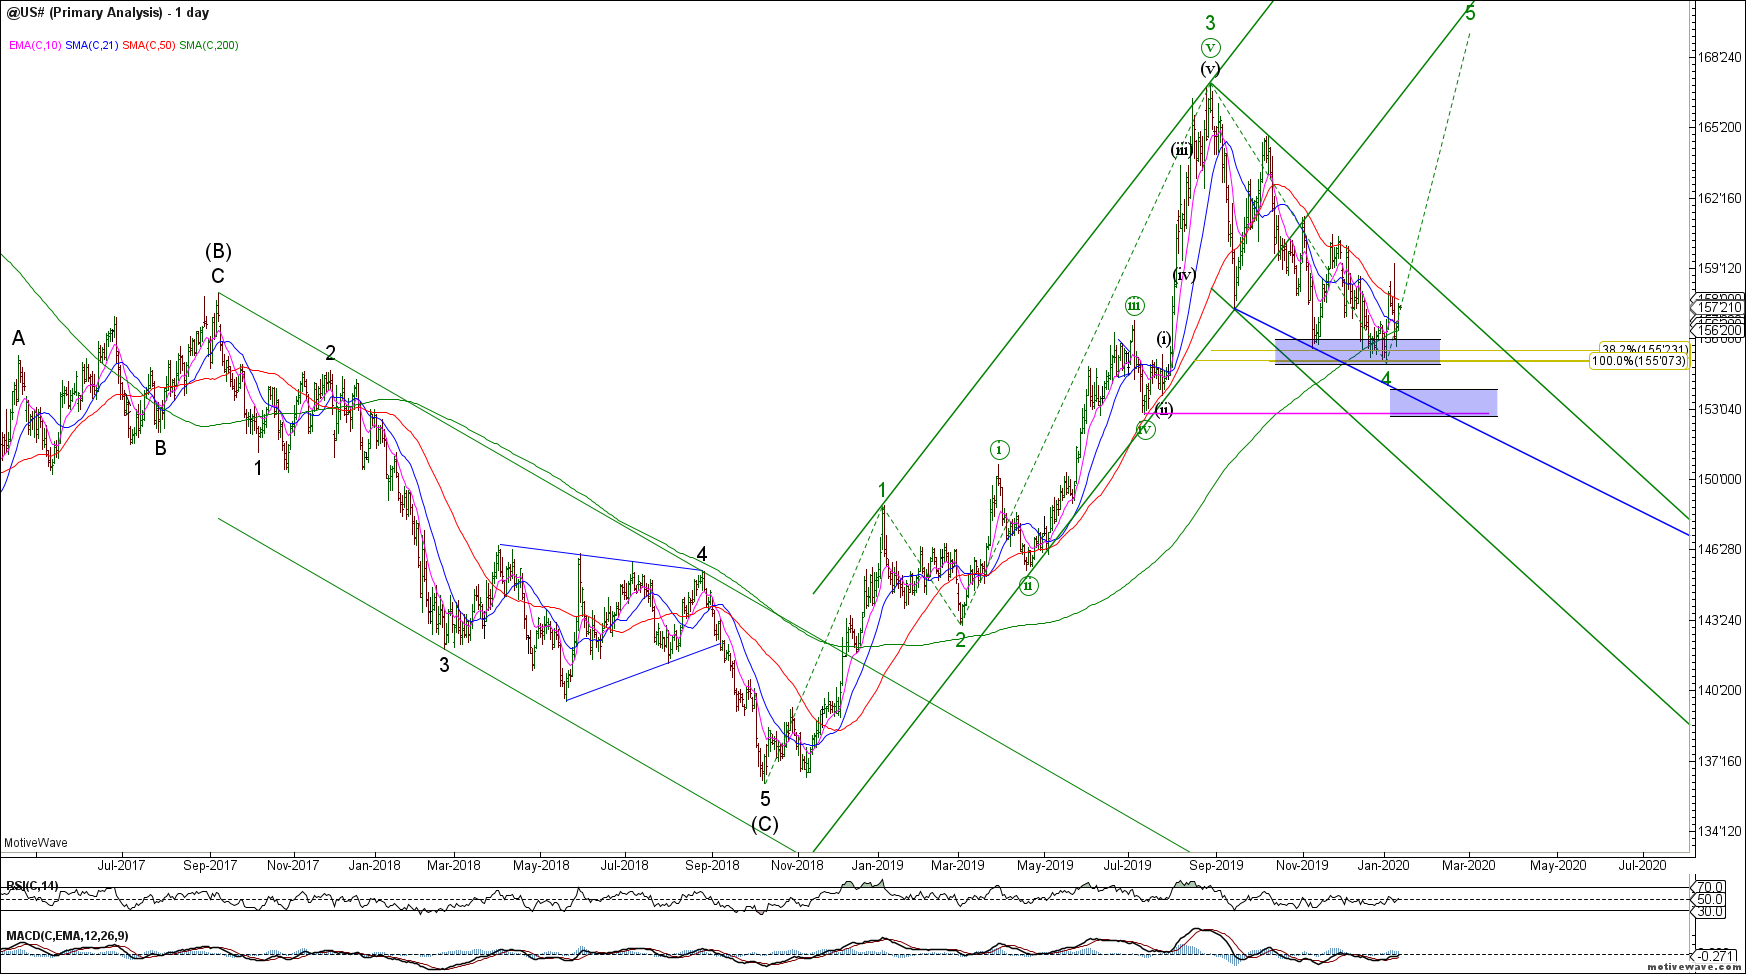
Traders are pressing shorts into support.
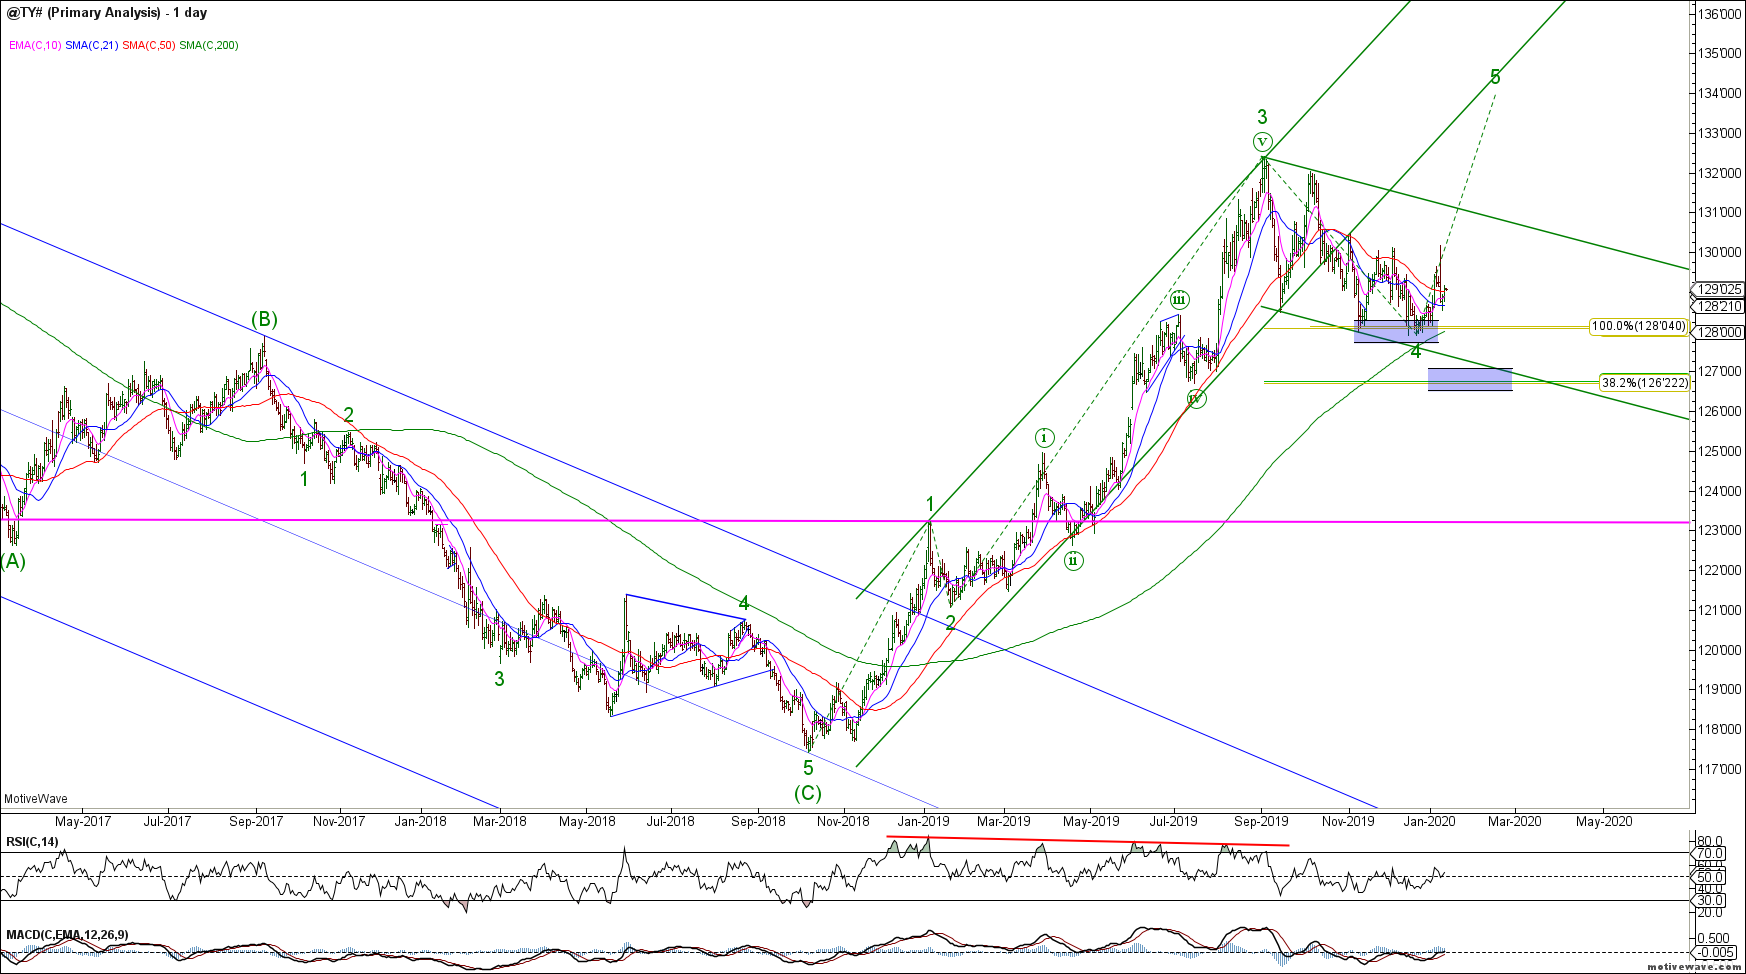
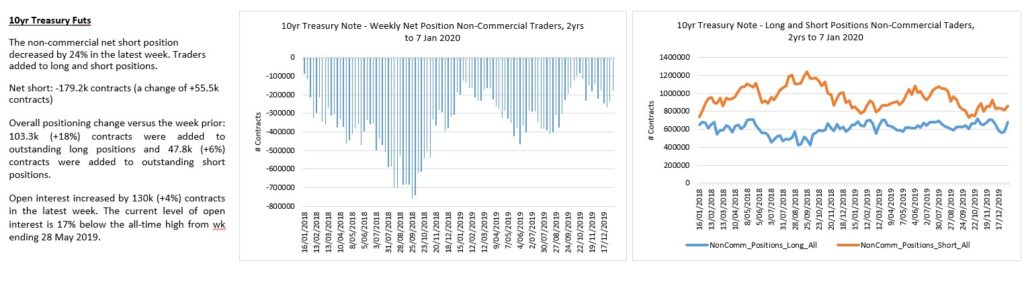
The 10yr / TY shows the same corrective wave 4 decline into strong support. We remain bullish bonds from a big picture perspective as we look for wave 5 higher from initial 128 support or secondary support in the 126’24 area.
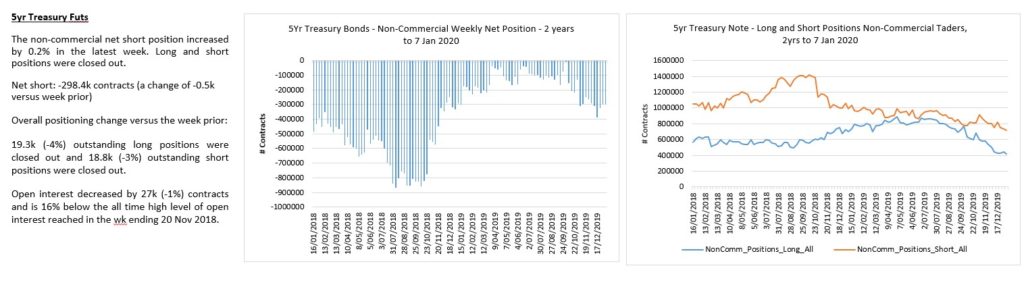
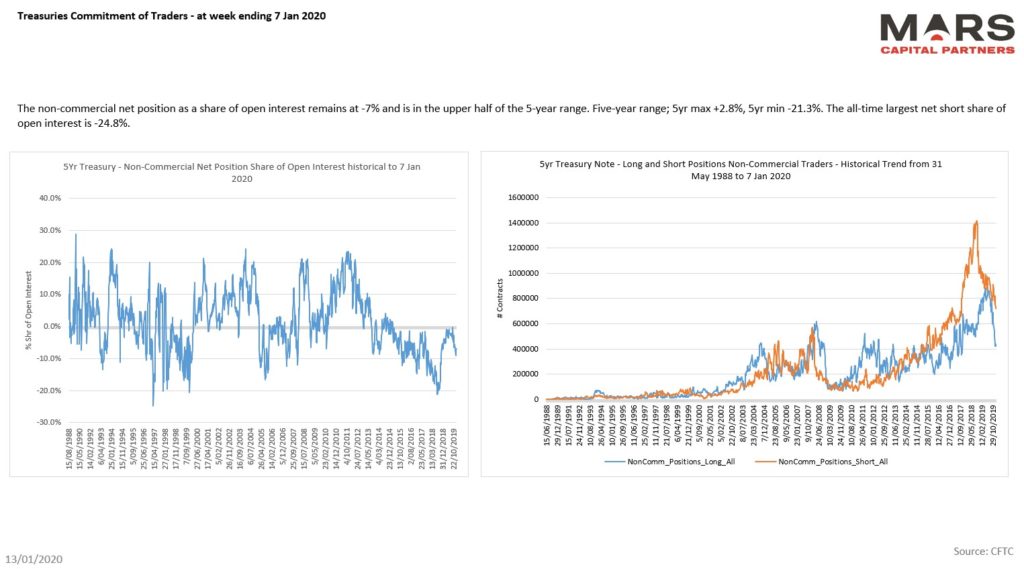
The 5yr / FV remains range bound as we look for a wave 5 rally higher from 118 or 117 support. No reason to change our bigger picture bullish outlook given the corrective nature of the decline.
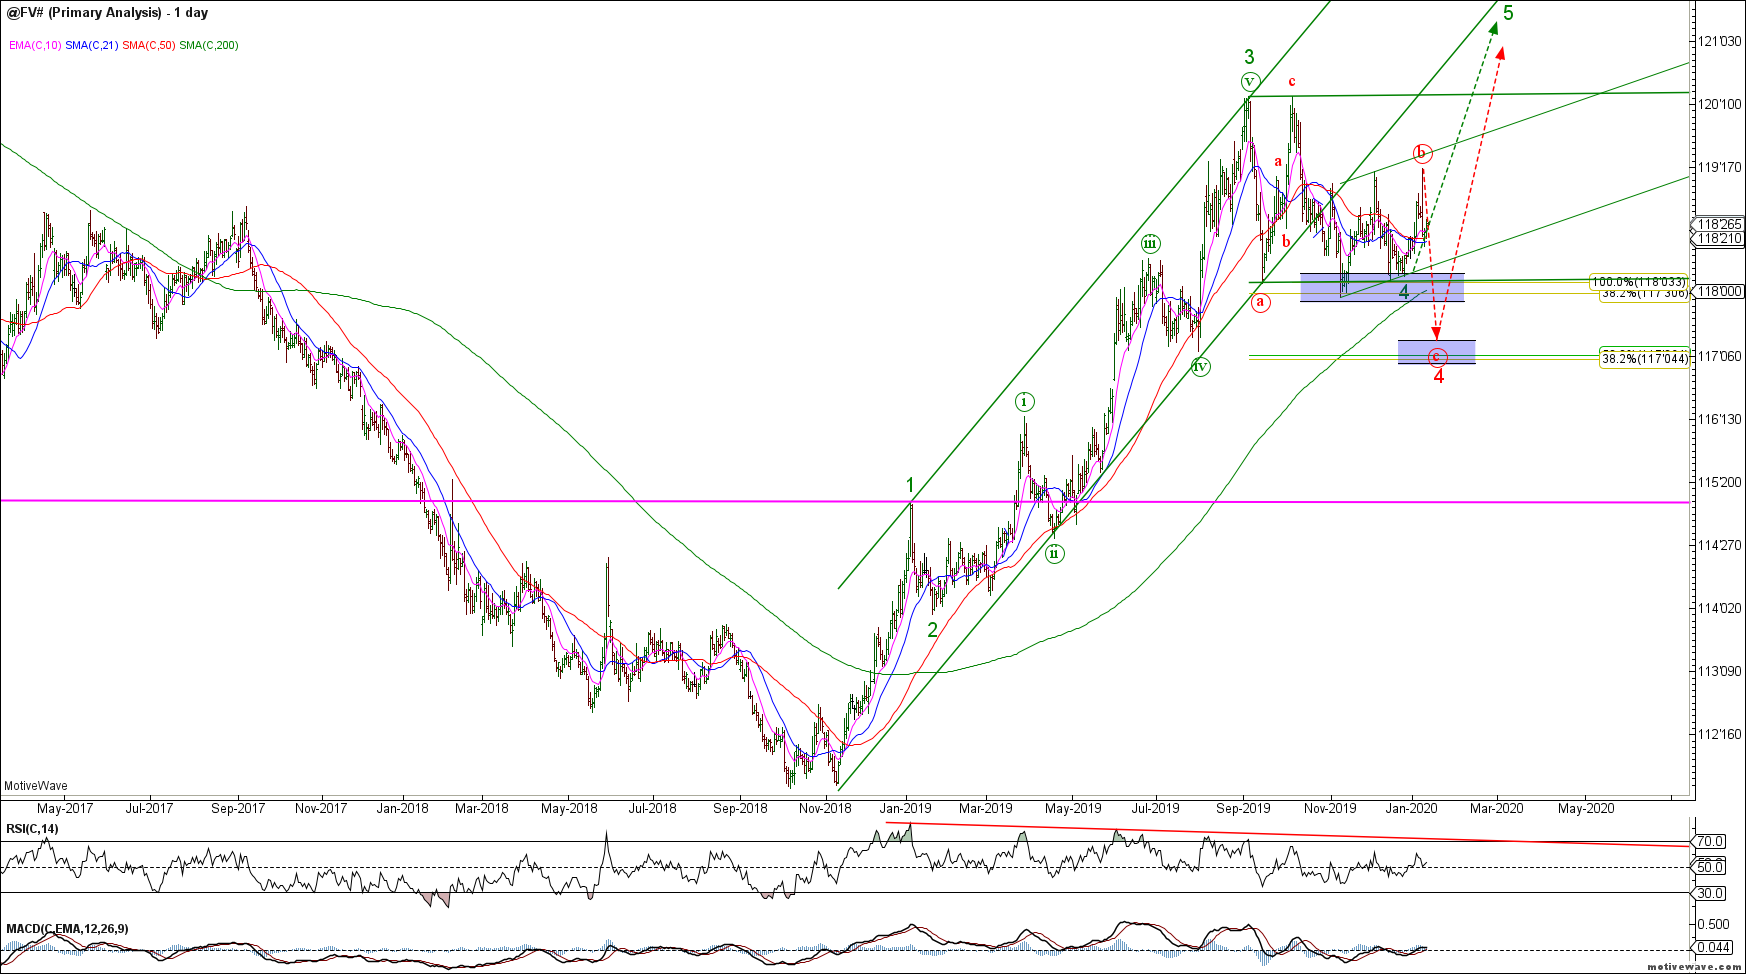
Traders are exiting both longs and shorts in the short end. Trading volumes have collapsed.
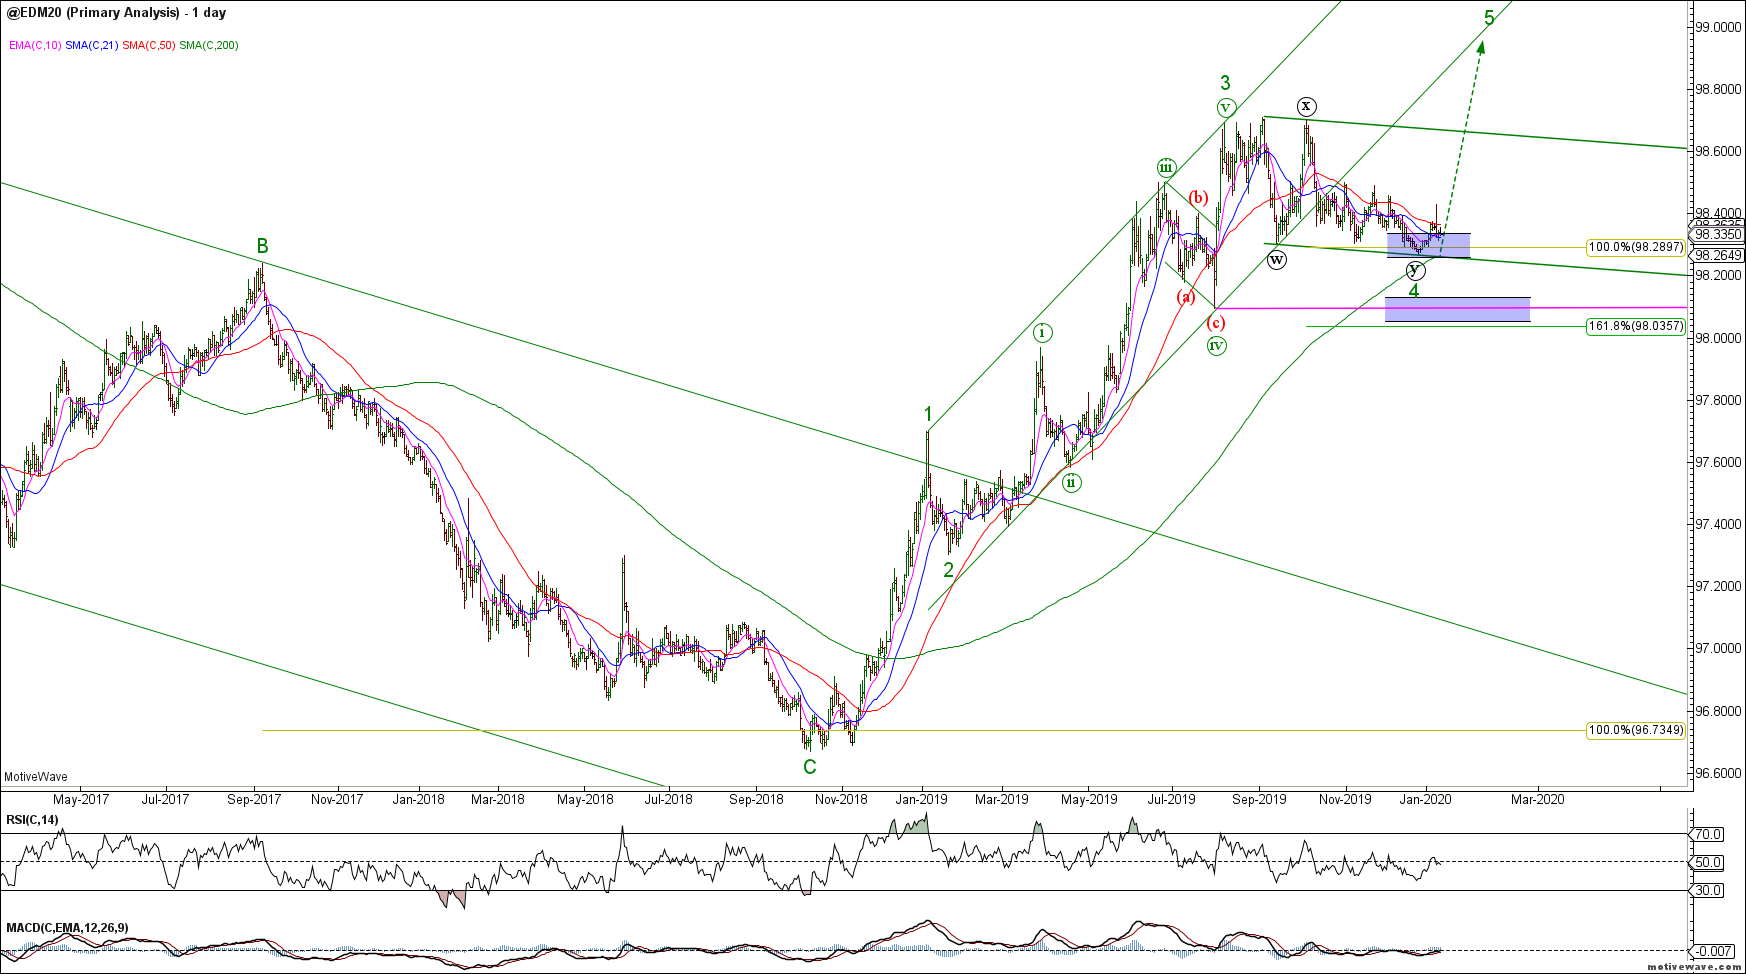
The Eurodollar continues to look bullish as it holds our initial support zone. The EDM20 would look best with a strong wave 5 rally to new cycle highs which would likely signal further economic weakness or risk-off.
To the FX markets and we have been looking for a bearish turn in the US dollar. We still do not have confirmation of a bearish trend change. Most major currencies remain range bound in this low volatility asset environment. We will remain bearish while recent swing highs hold but at this point, the structure is very low conviction.
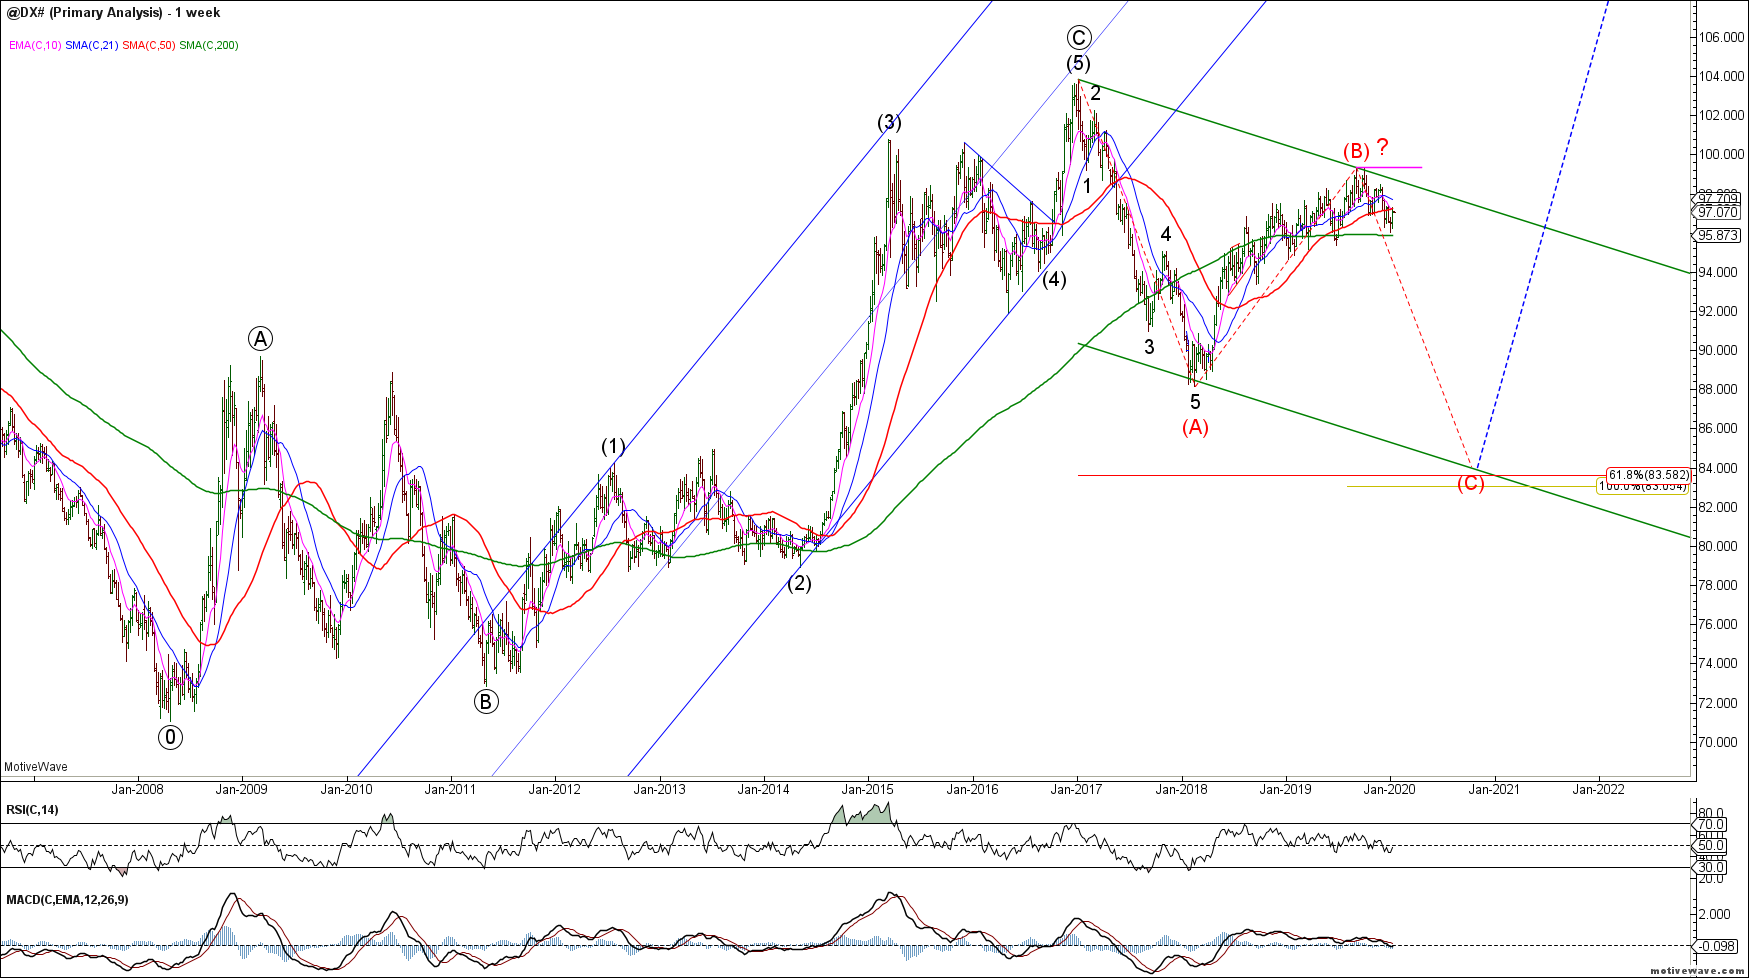
The DXY does show a potential leading diagonal for wave 1 but it is not high probability. This near term bearish potential is invalidated at new cycle highs. Bears need to break the series of higher highs and lows since early 2018. This market remains range bound until proven otherwise.
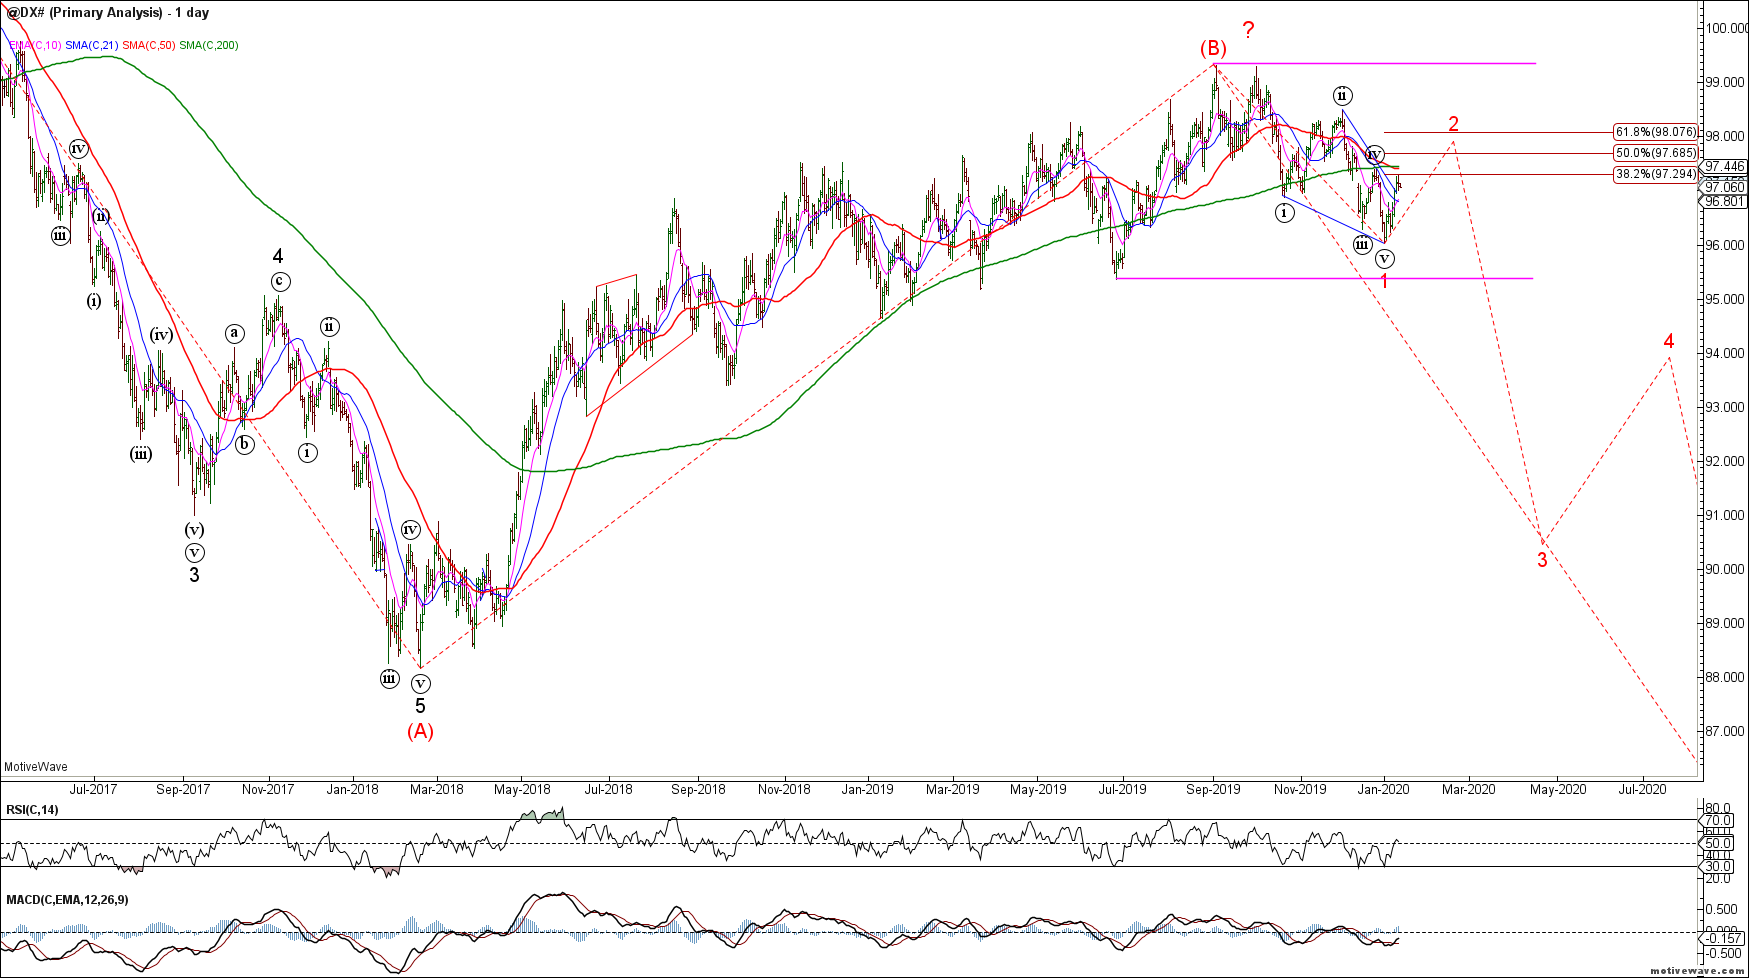
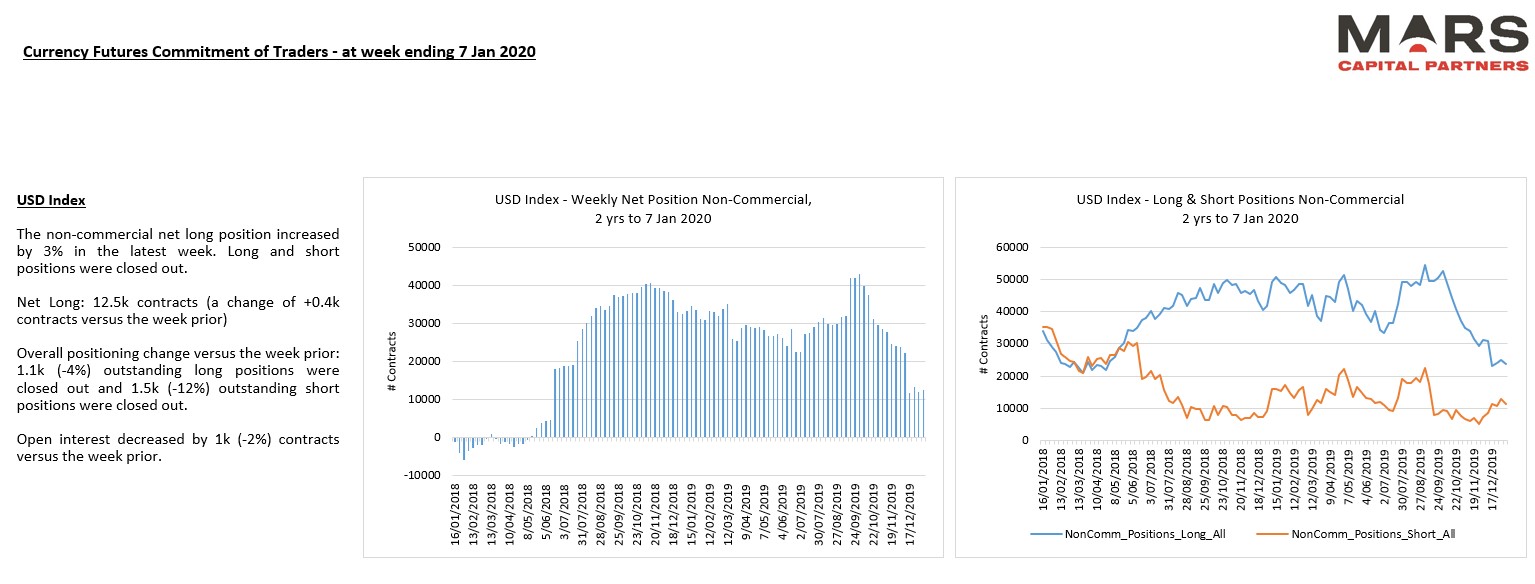
Concerning for the US$ bears is that DXY longs have halved but price has barely moved in the last 12 months.
The Euro has been attempting to establish a base to rally from but the initial rally does not look convincing. The Euro bulls have not yet proven anything except hold the lows. We remain tentatively bullish but there is a high risk of failure.
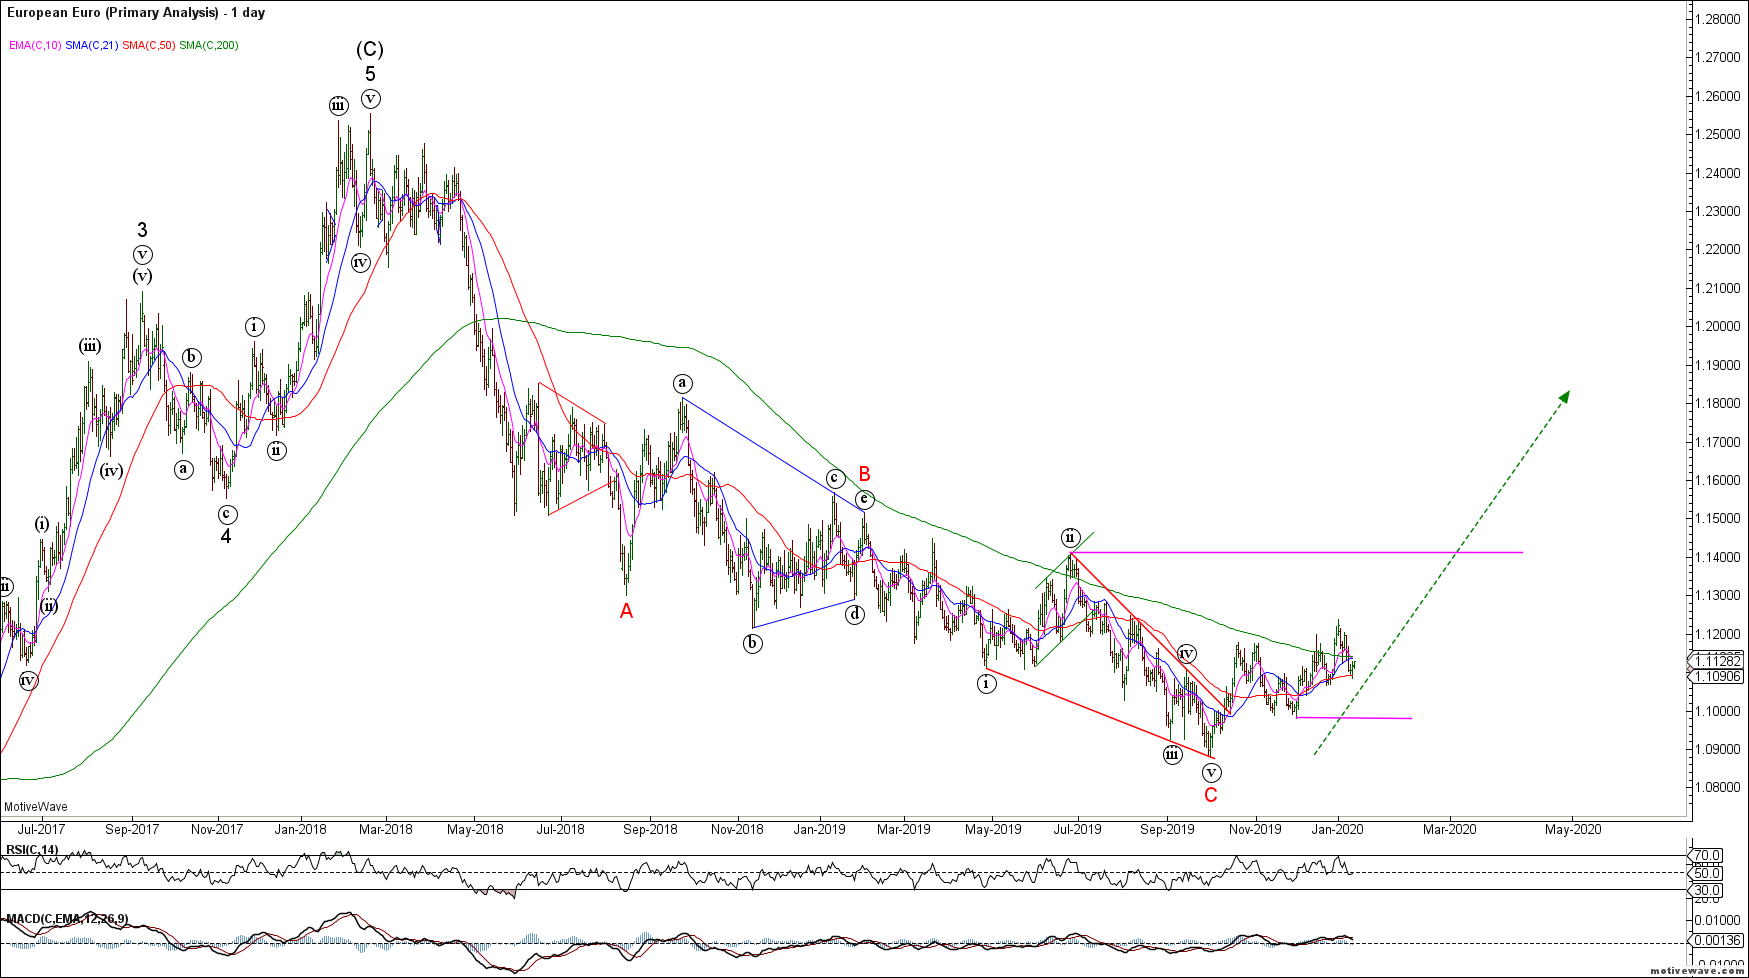
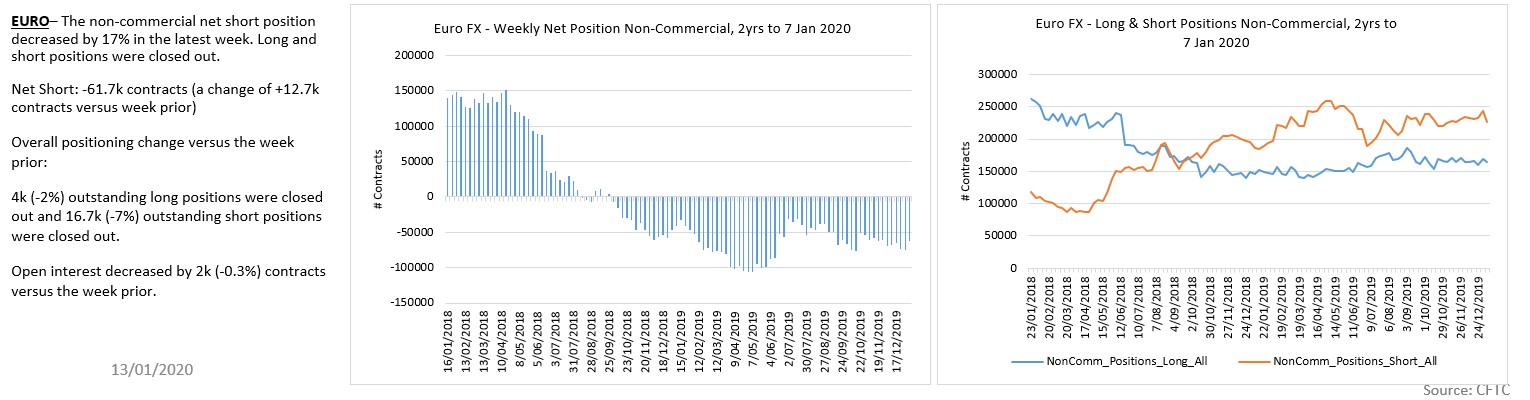
Euro traders remain net short.
The Yen continues to trade within its bigger picture triangle. Near term, given last week’s bearish reversal, we should expect a retest of the lower trend line with potential towards Fib equality in the 0.8850 area.
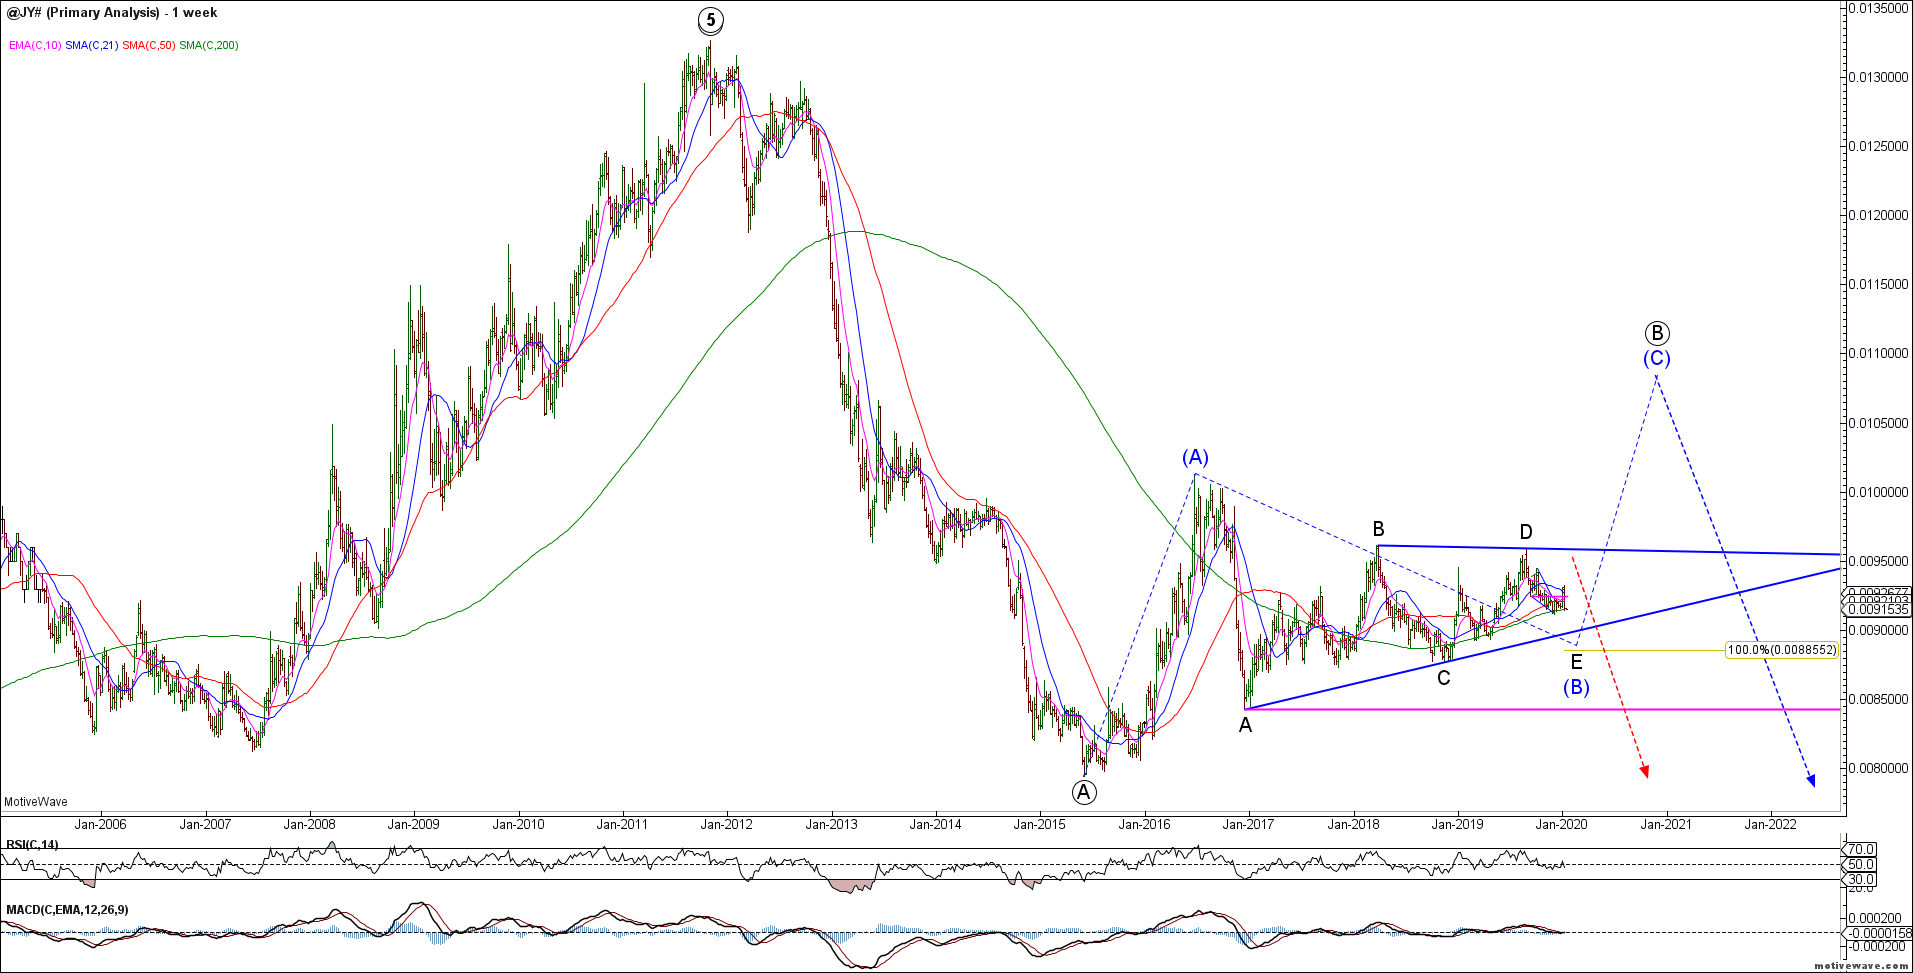
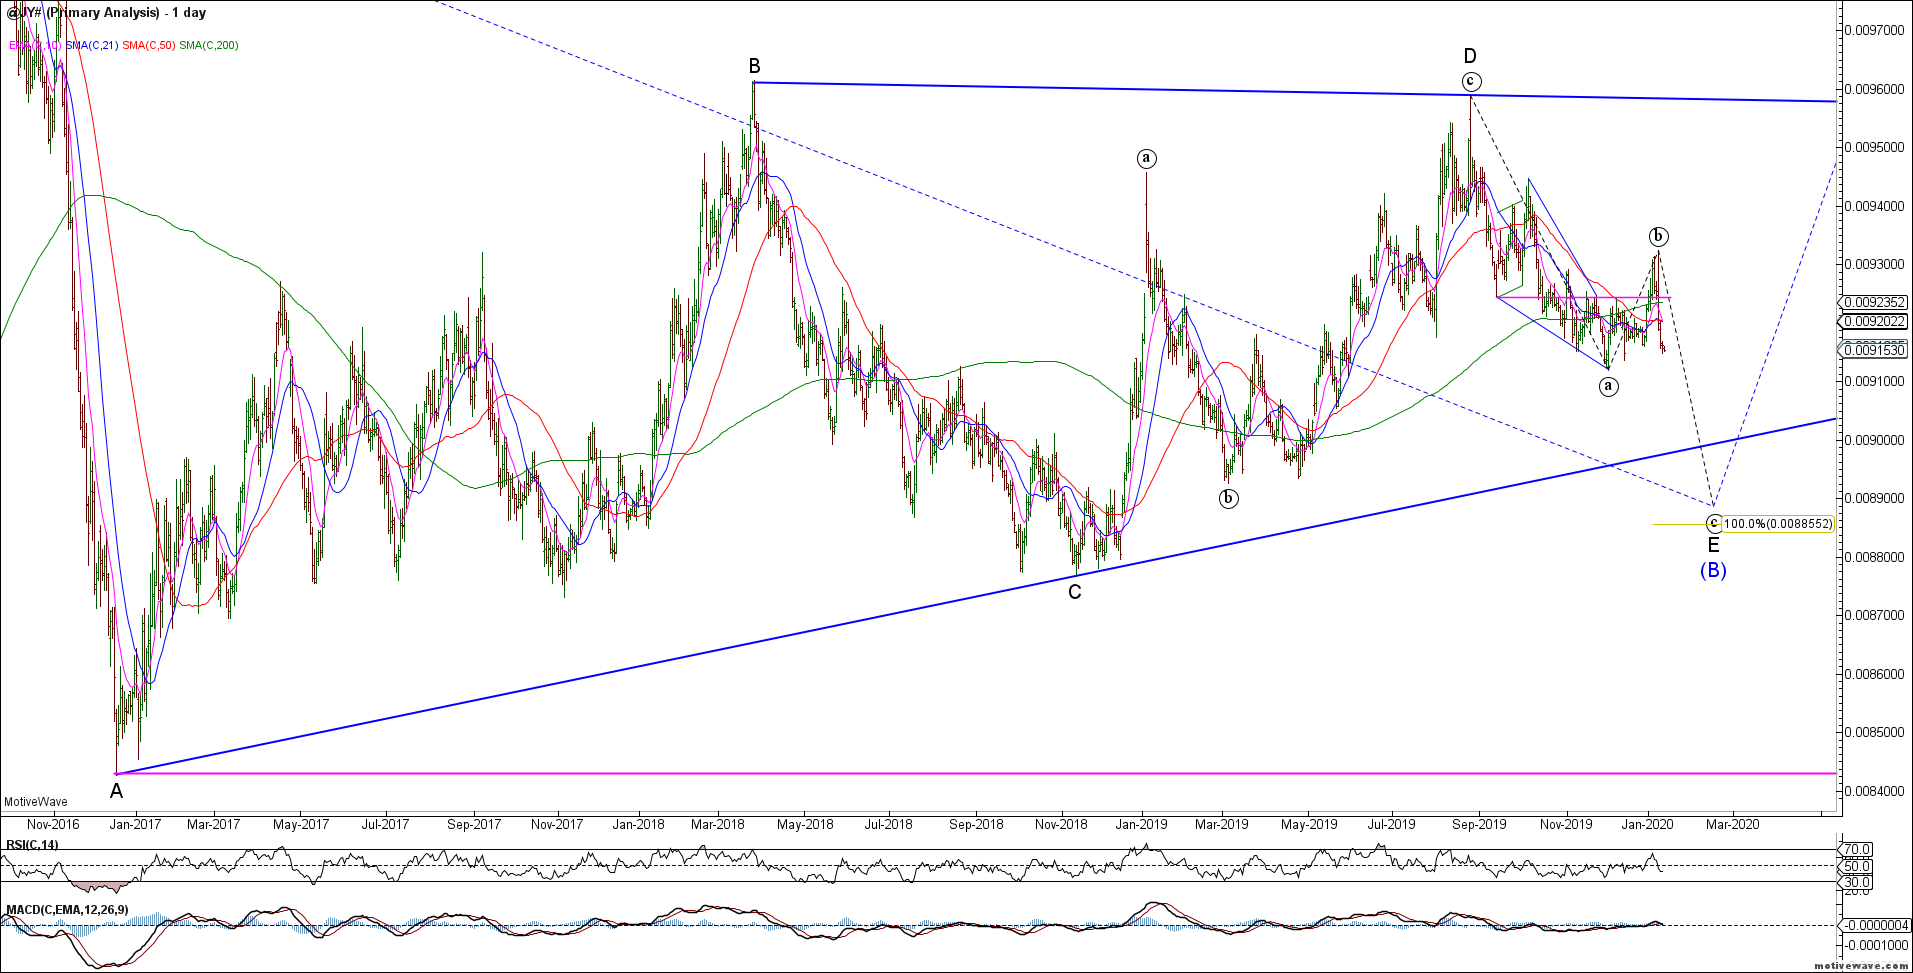
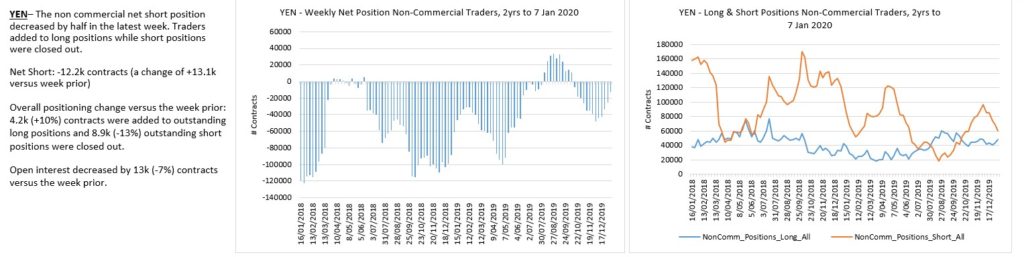
Yen traders are flat.
The Swiss Franc remains range bound and controlled by the SNB. Compression usually results in volatility expansion and we should expect the Swissie to do the same. Tough to fight the SNB until we get a convincing trade setup with controllable risk. Option sellers have been rewarded for the last few years but I’d rather take the other side looking for a break when the opportunity presents.
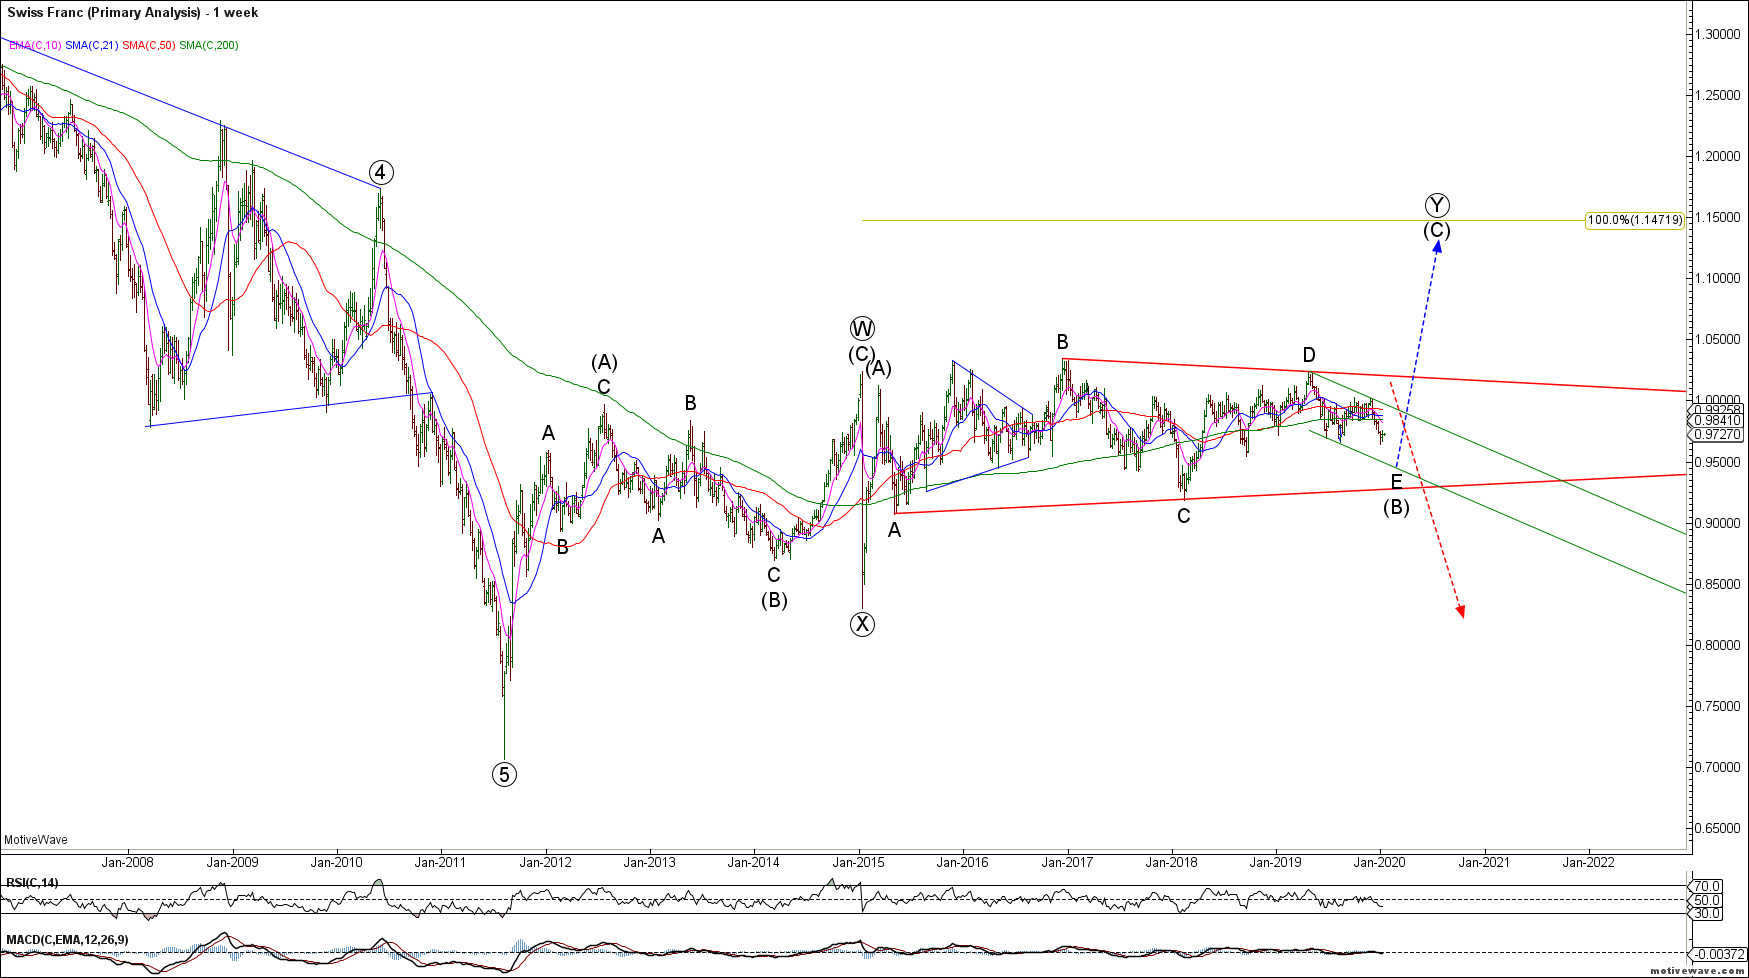
CHF shorts have capitulated.
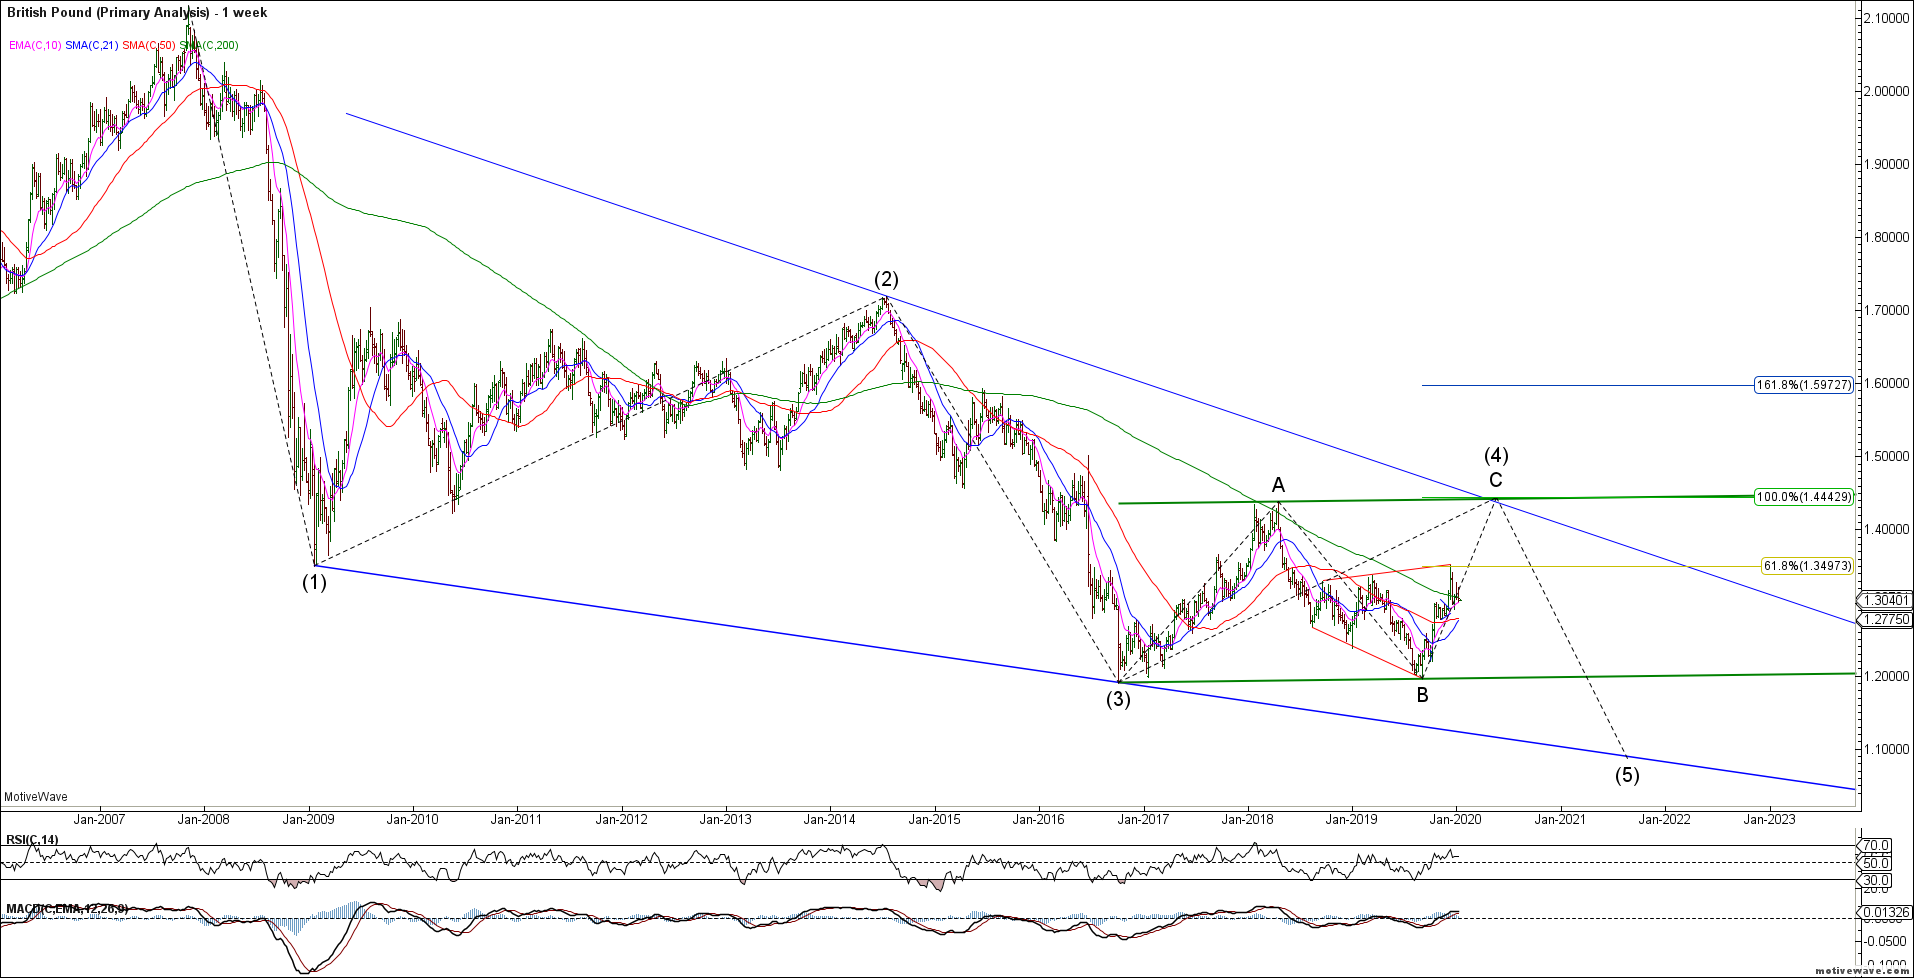
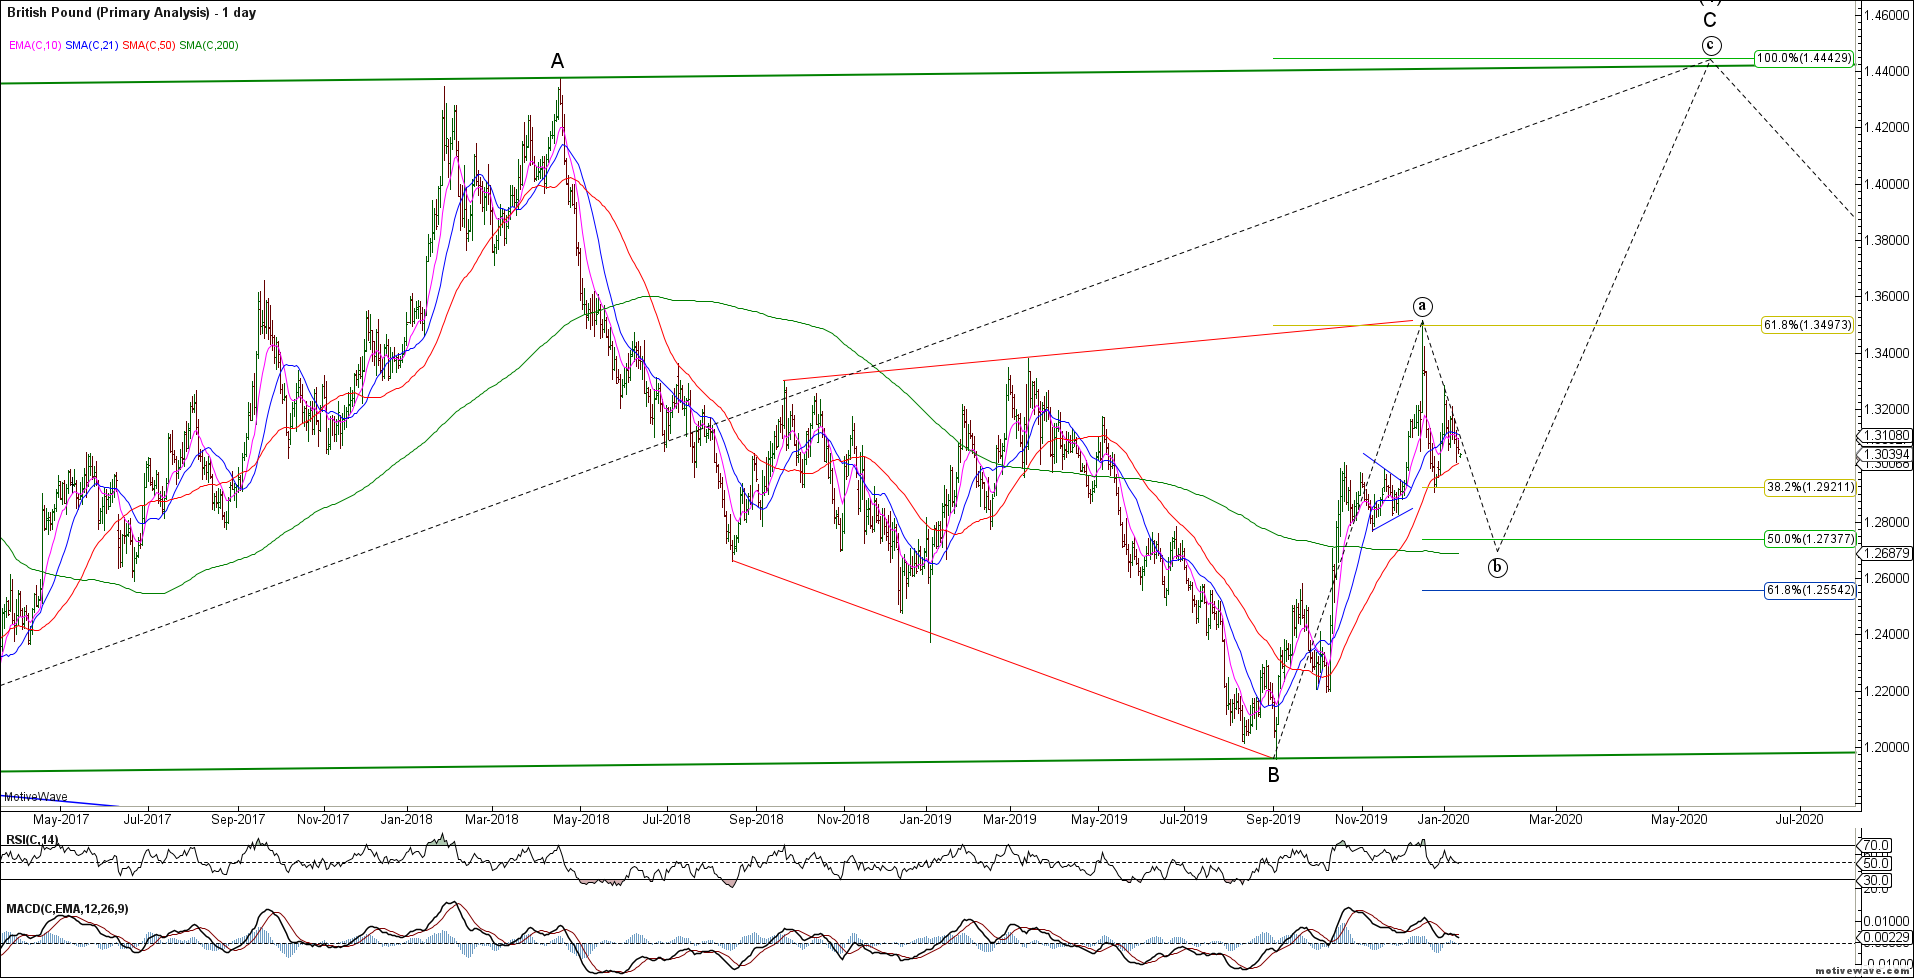
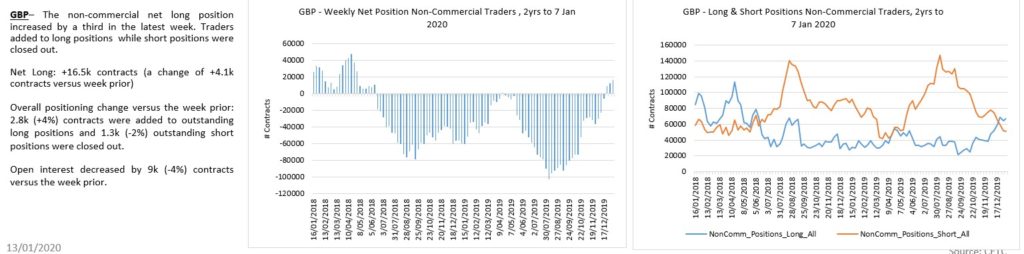
Despite Brexit and leadership challenges, the Pound continues to hold post Brexi lows. The recent impulsive rally off the lows argues for higher prices towards 1.45 once the near term correction is complete and it can clear 1.35 resistance.
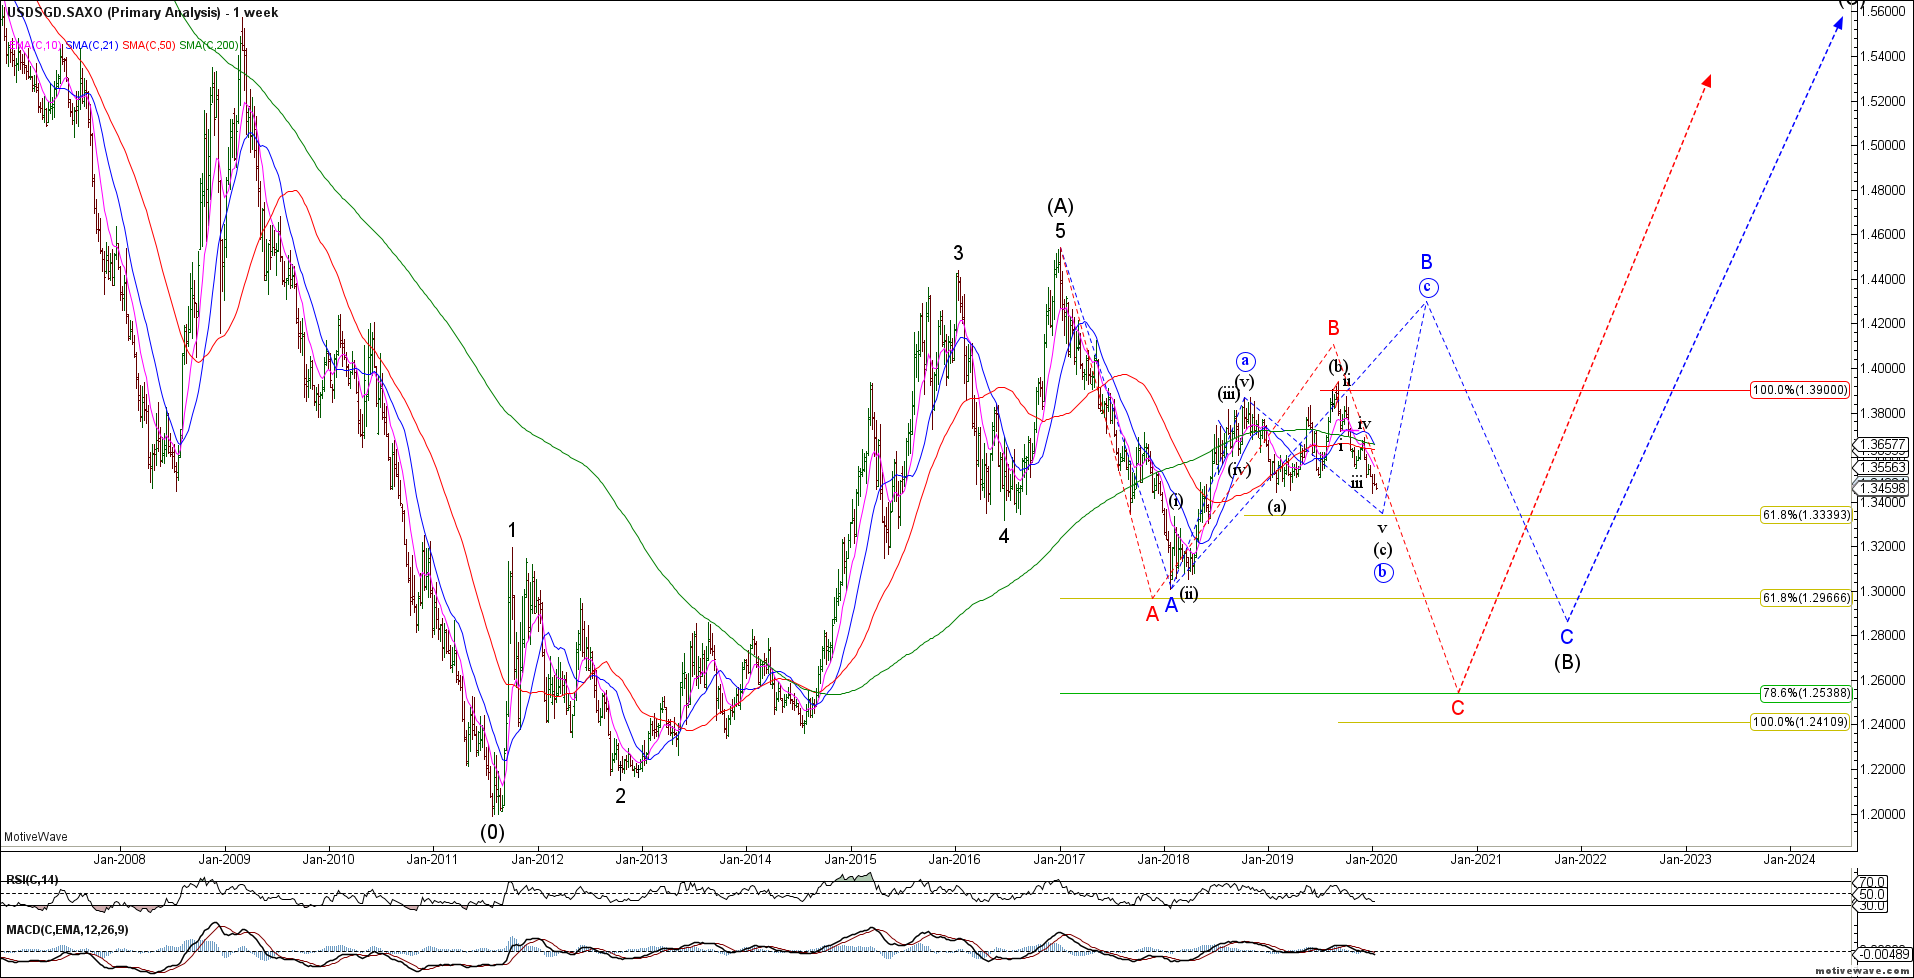
The USDSGD is approaching a near term inflection point. Our base case (blue count) implies a corrective decline is ending (expanded flat wave b) as we look for a bullish reversal. The alternate red bear count suggests a continued US$ decline back towards 1.24-1.25 long term support. The impulsive rally from the 2011 lows keeps us bullish from a big picture perspective.
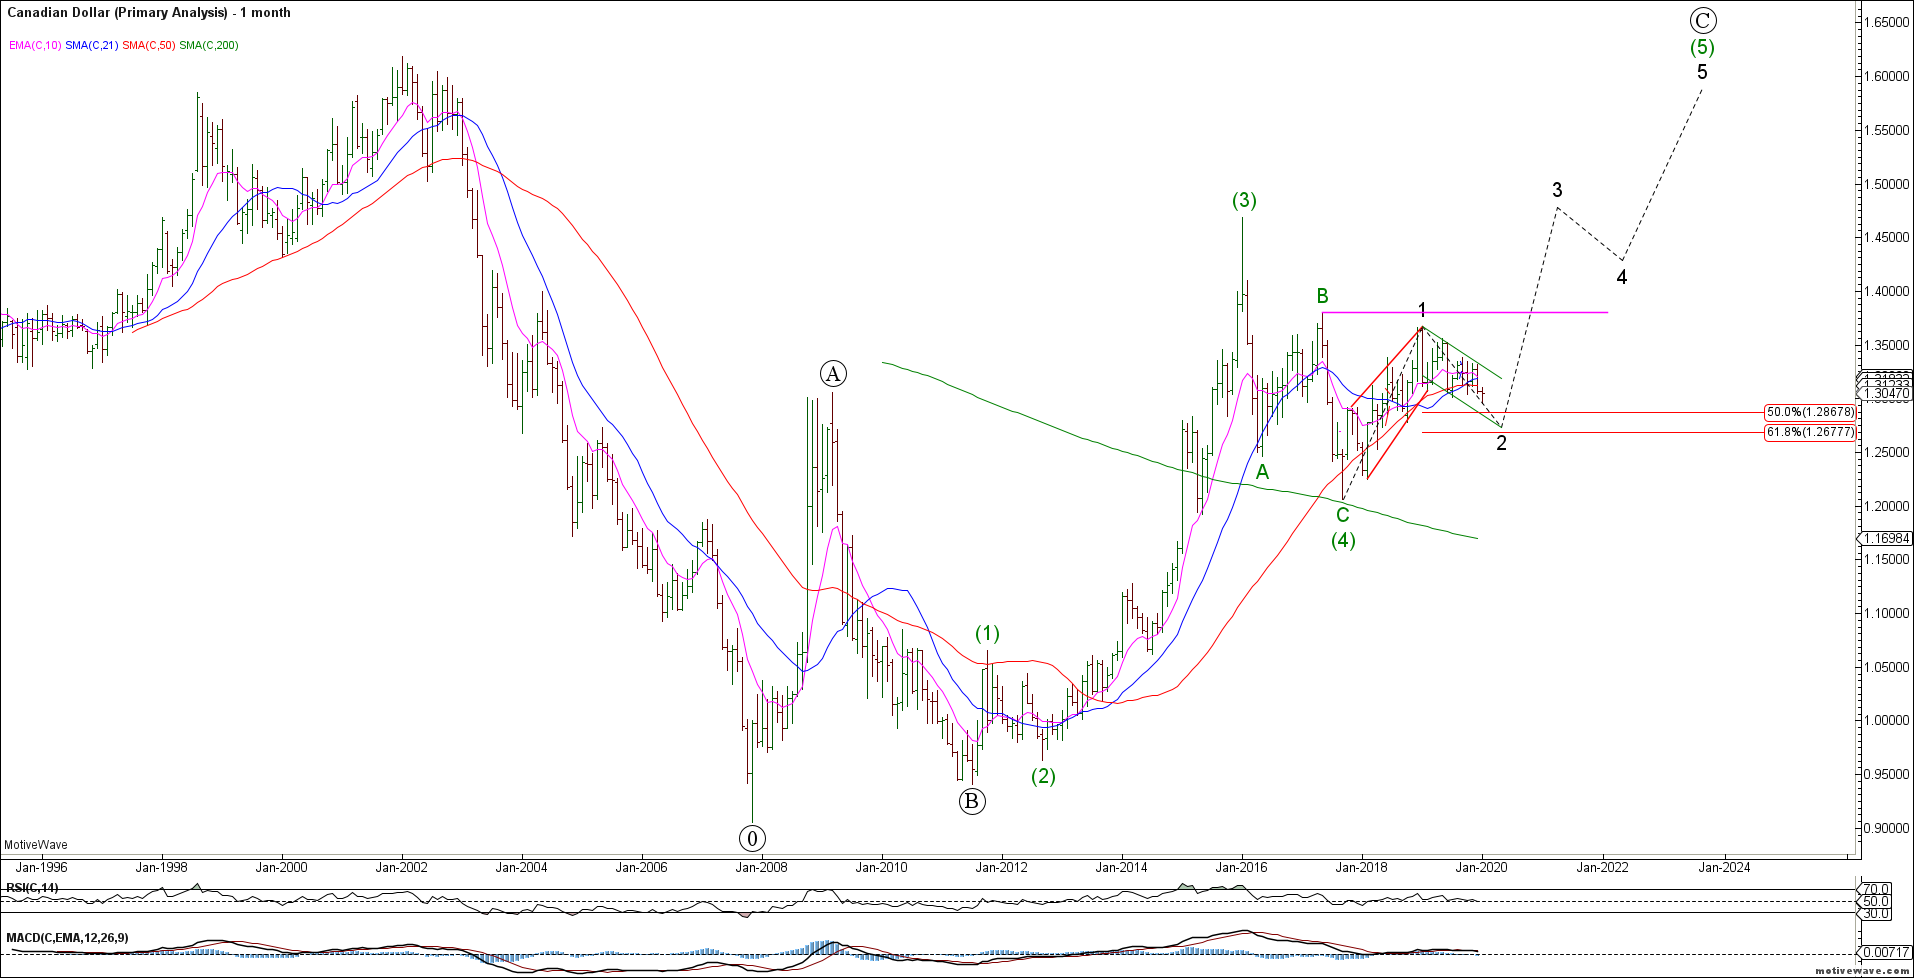
The USDCAD invalidated our near term bull case but the bigger picture remains bullish for the US$. Bulls need to clear 1.3800 major resistance for an extended rally. Strong support resides in the 1.2670-1.2870 area.
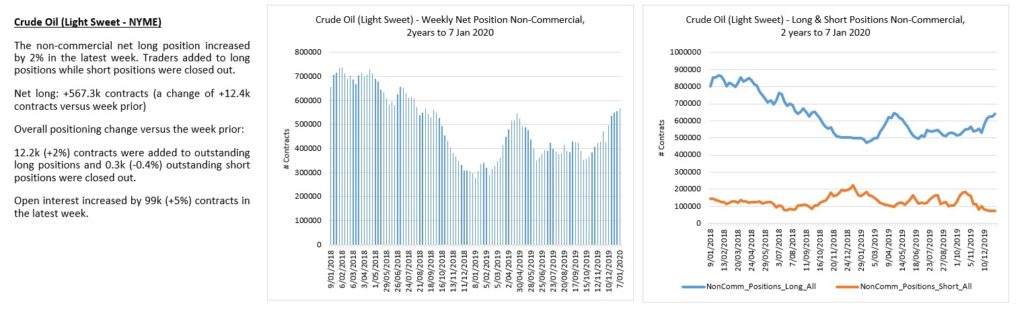
To the commodity markets and Crude Oil reversed sharply lower from resistance forming a weekly bearish engulfing reversal. We are bearish CL from a bigger picture perspective while last week’s highs hold.
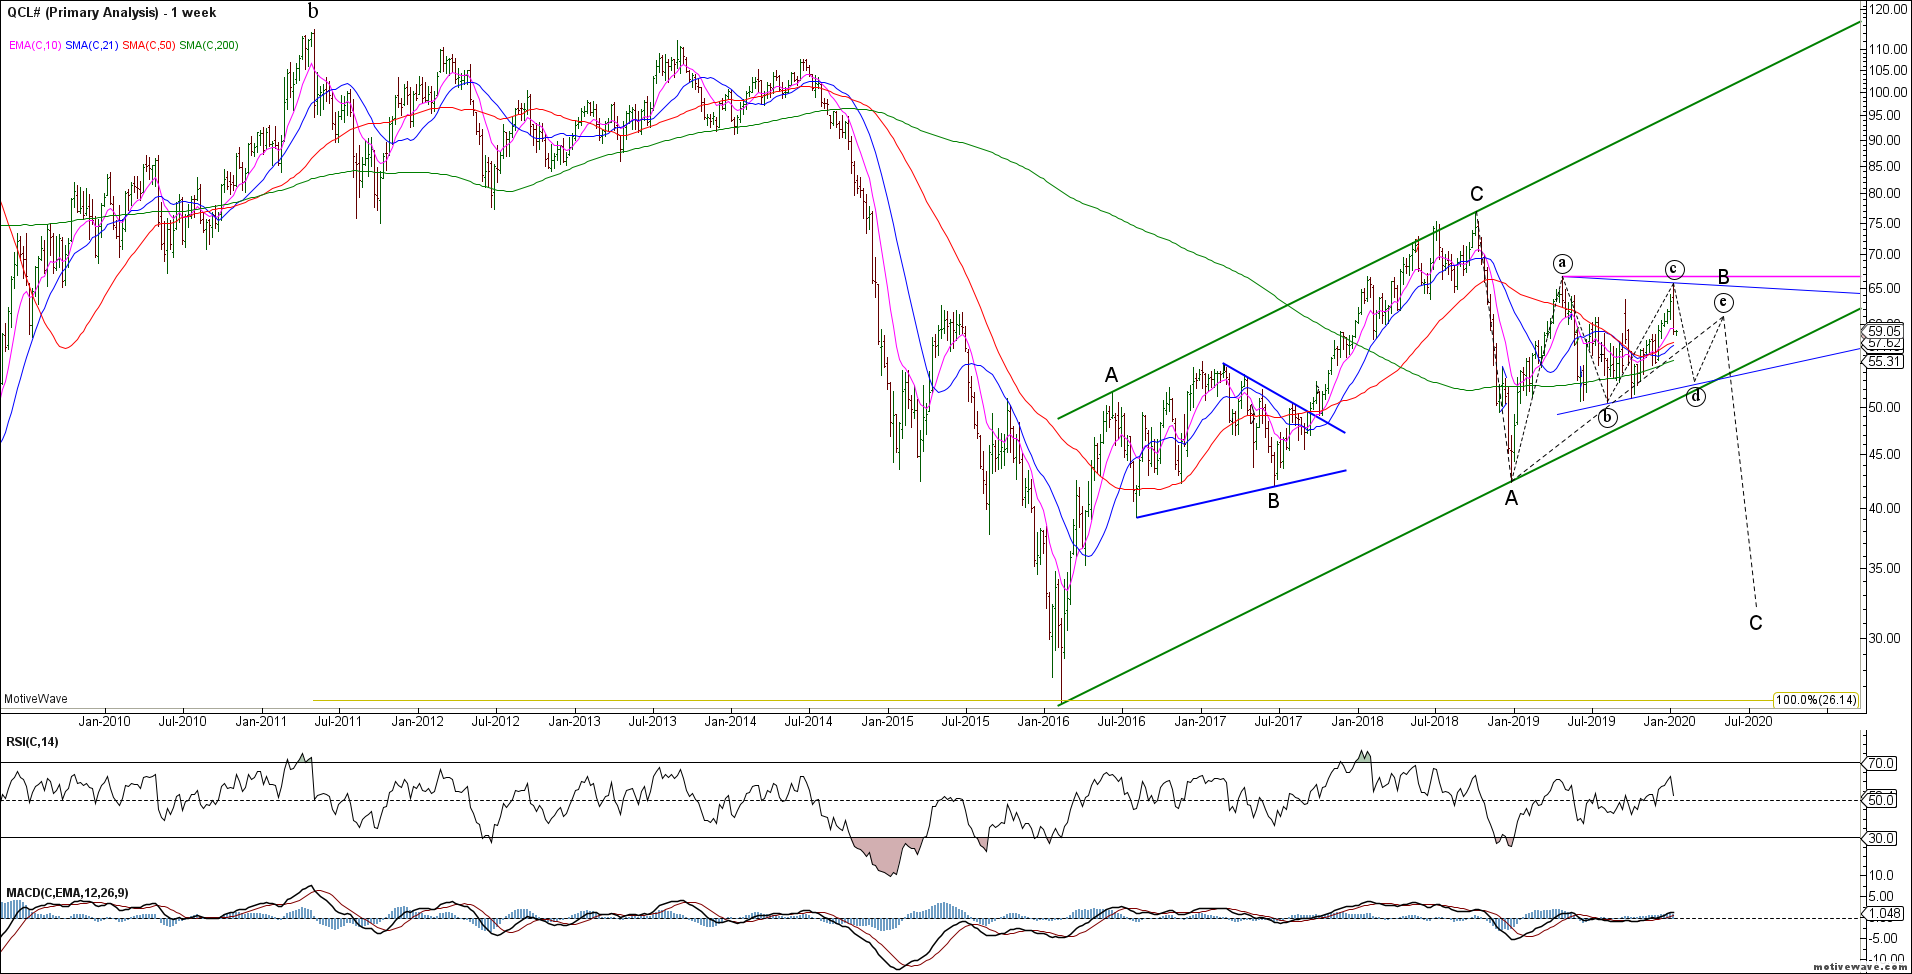
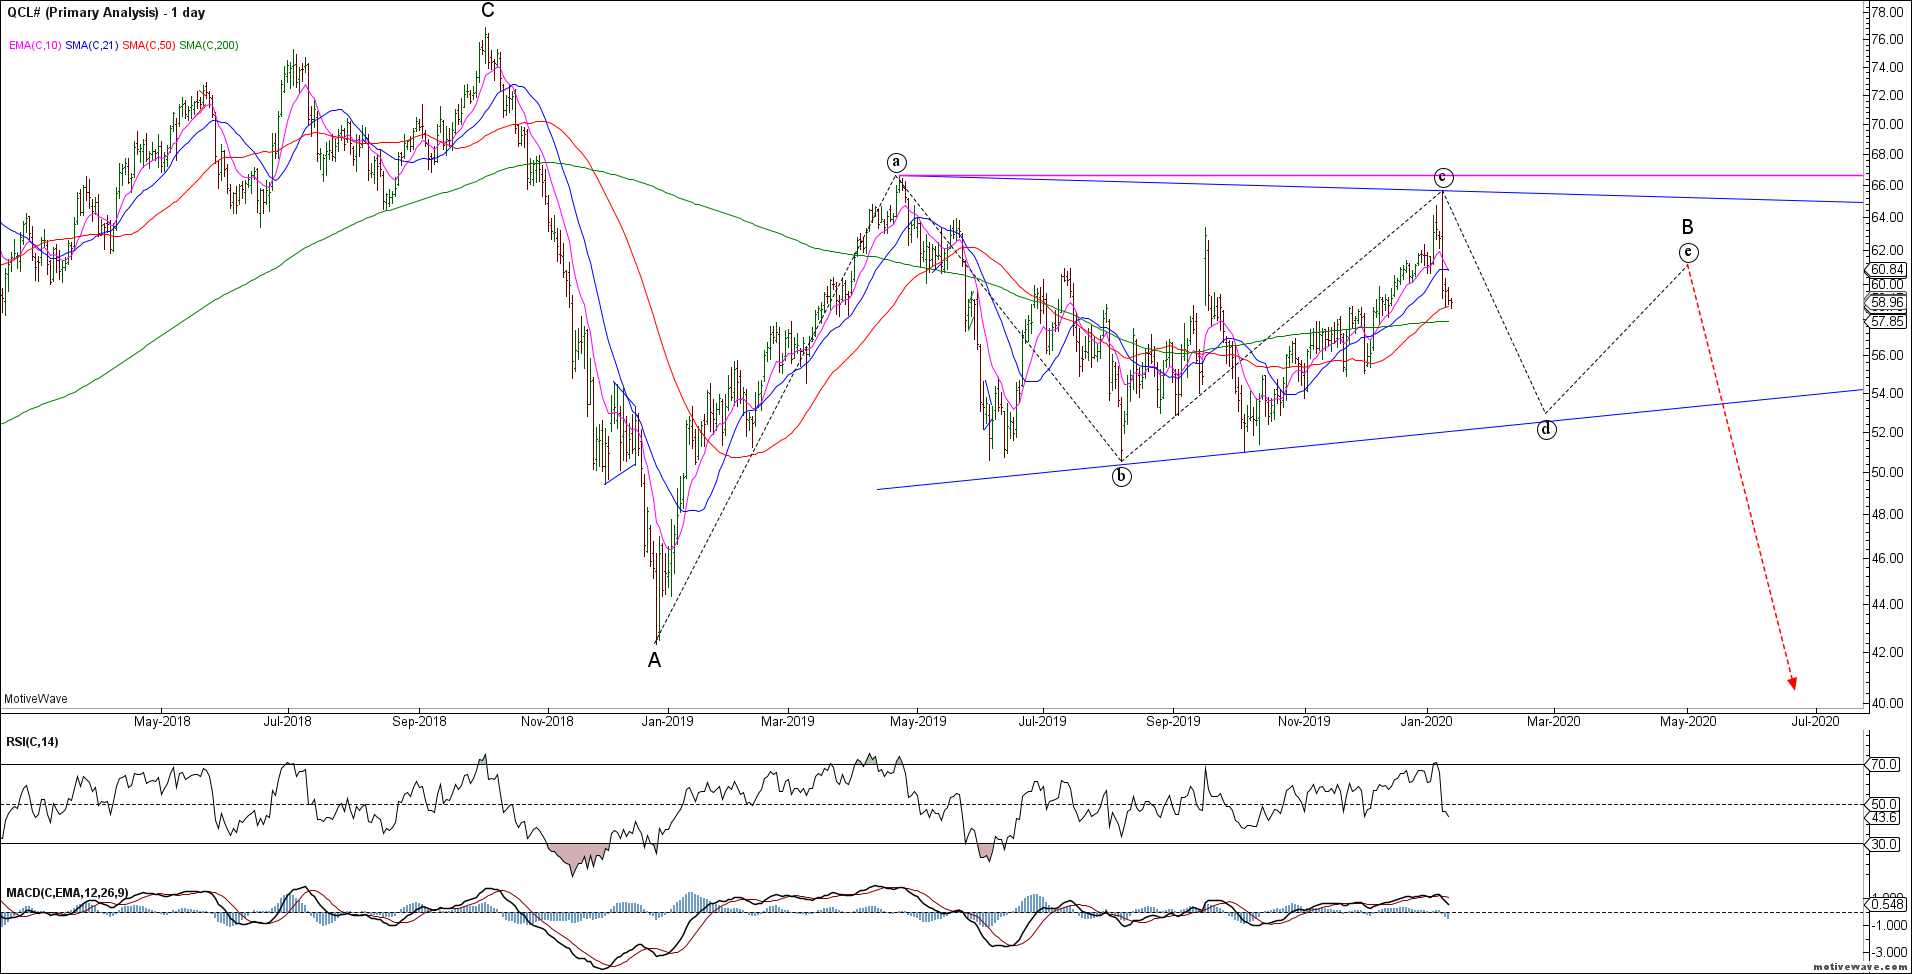
CL appears to be in a wave B triangle before the next strong thrust lower. Looking to short a counter trend rally that does NOT exceed last week’s highs.
CL traders were pressing longs into that bearish reversal. Likely caught long.
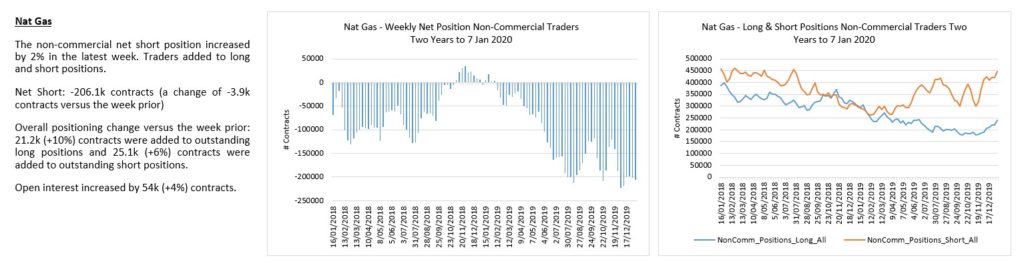
Natty Gas continues to drift lower with long term targets towards 1.00 given the corrective rally from the 2016 lows.
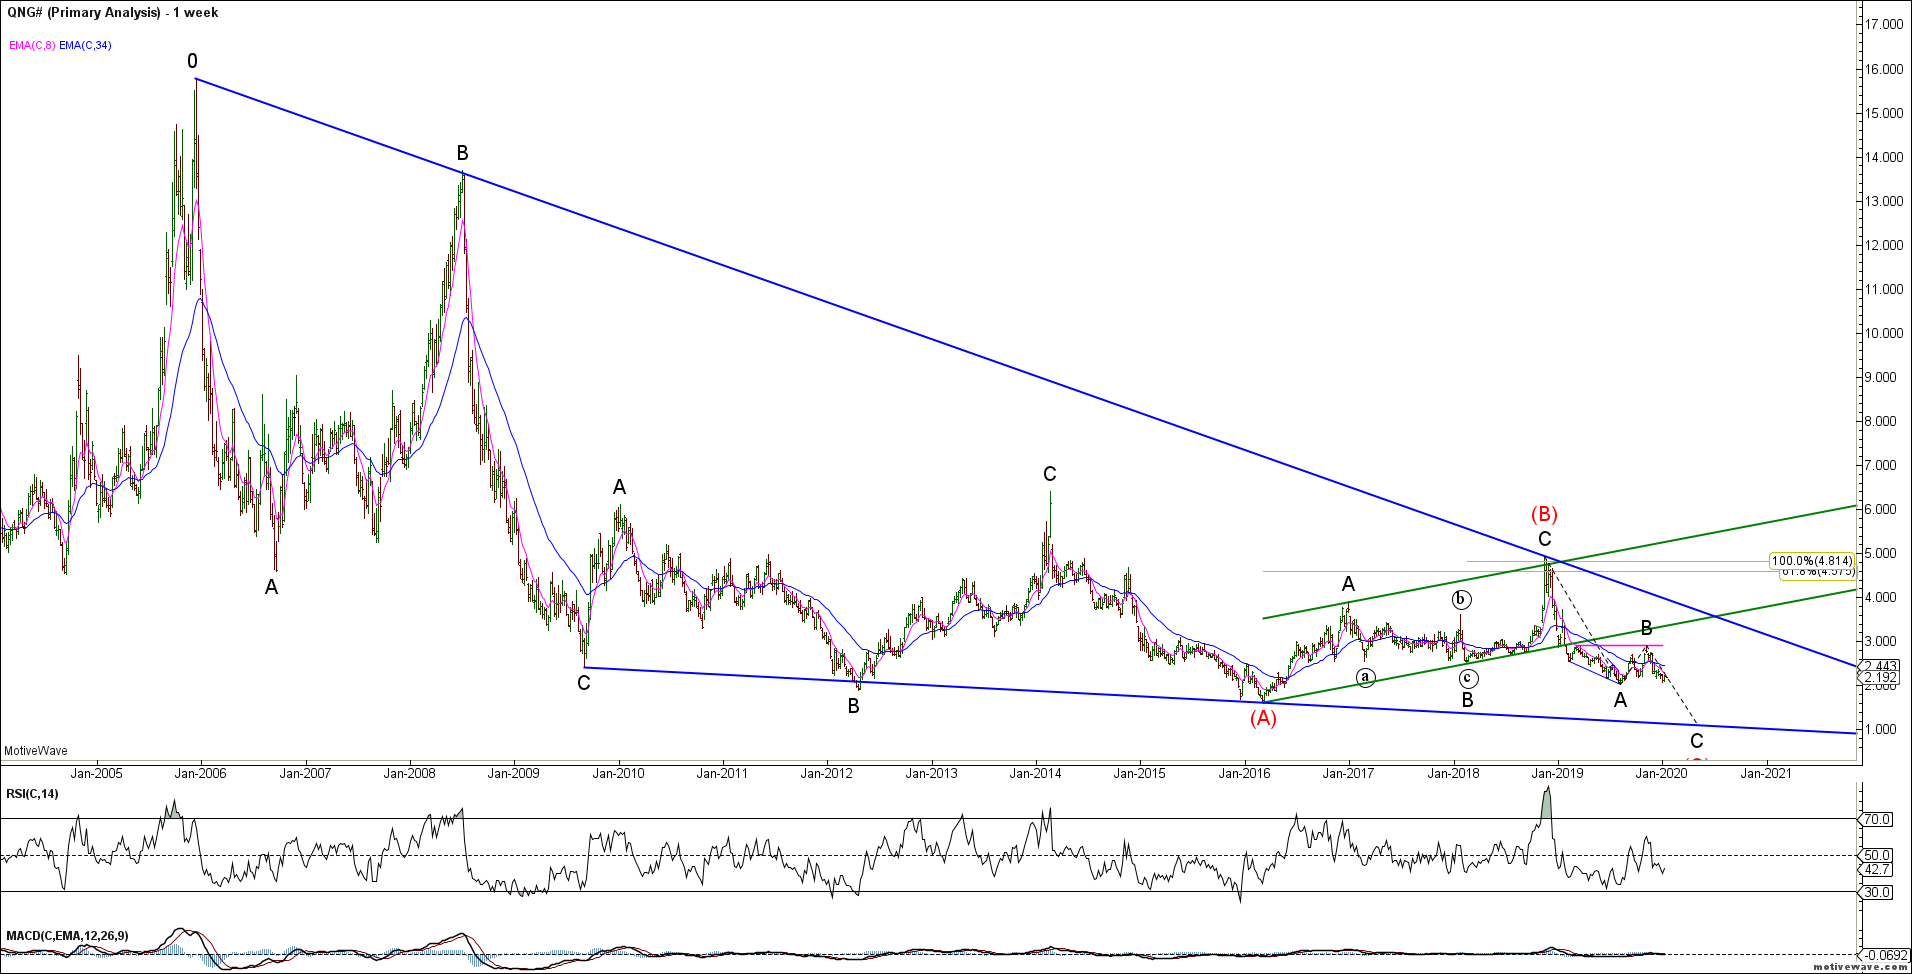
Near term, the decline from the wave (c) of B highs appears impulsive to retest cycle lows. Note the bullish momentum divergence at recent lows that indicates a tradable low may be near. Ideally, I’d like to see a false break of 2.00 support and bullish reversal for a trade. No strong evidence of a tradable low. Highly speculative.
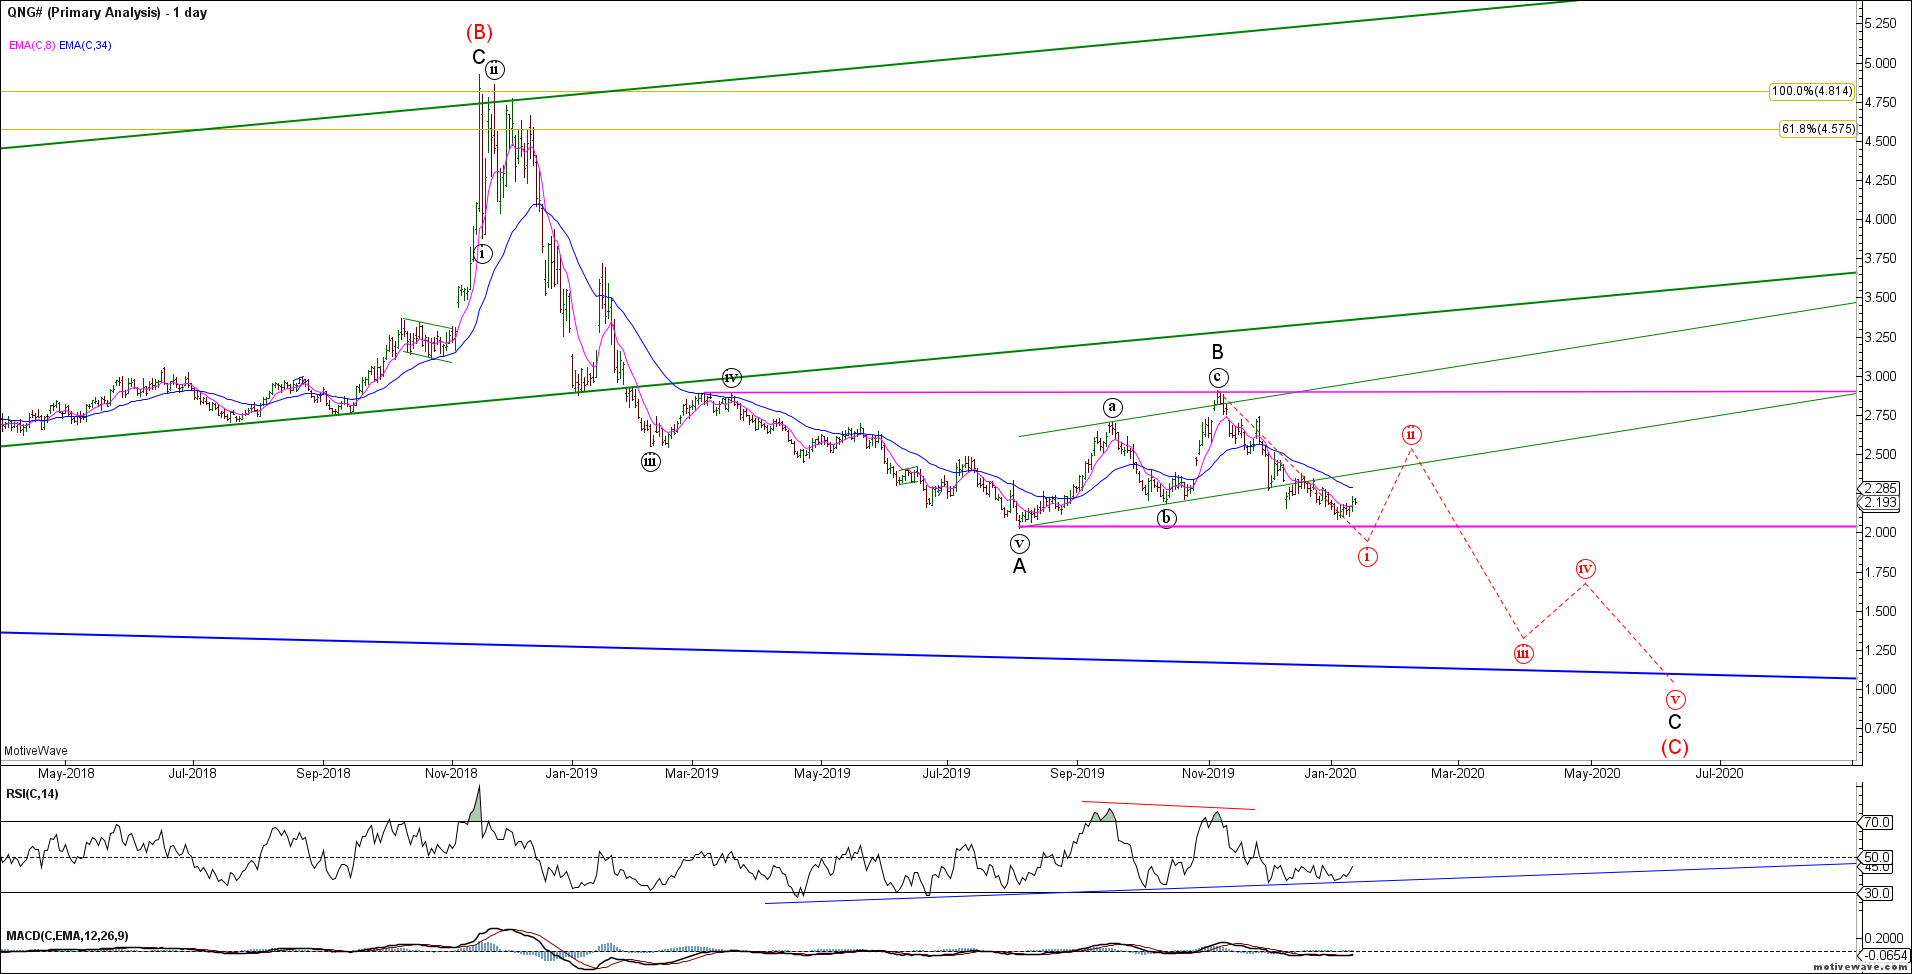
NG shorts are a very crowded trade. Avoid.
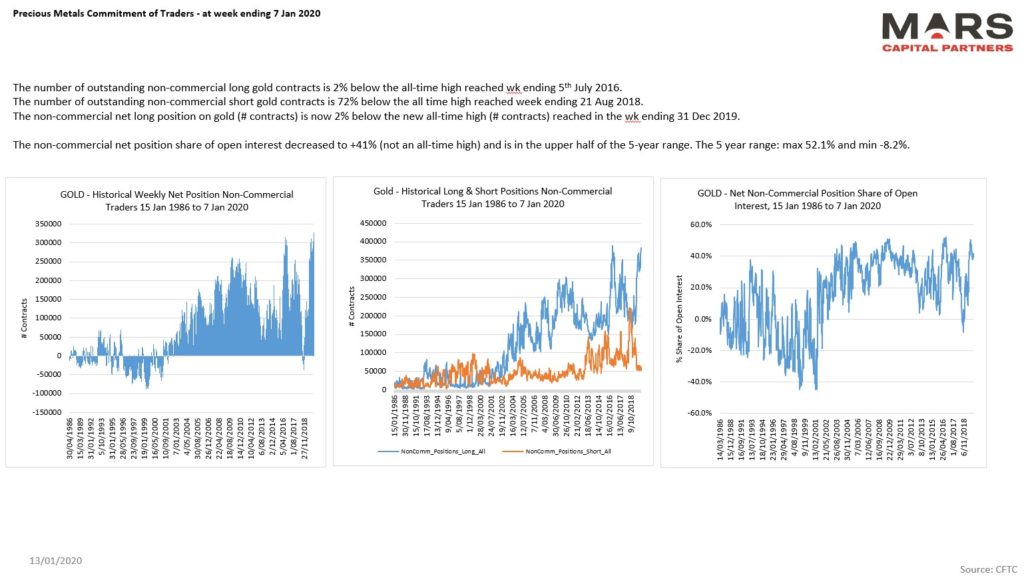
To the PM’s and Gold met minimum upside objectives for wave 5 of C before reversing sharply lower. The initial decline appears impulsive so we should expect further downside near term. The Bear count shows a completed 3 wave rally from the 2015 lows and the potential for a large wave C decline.
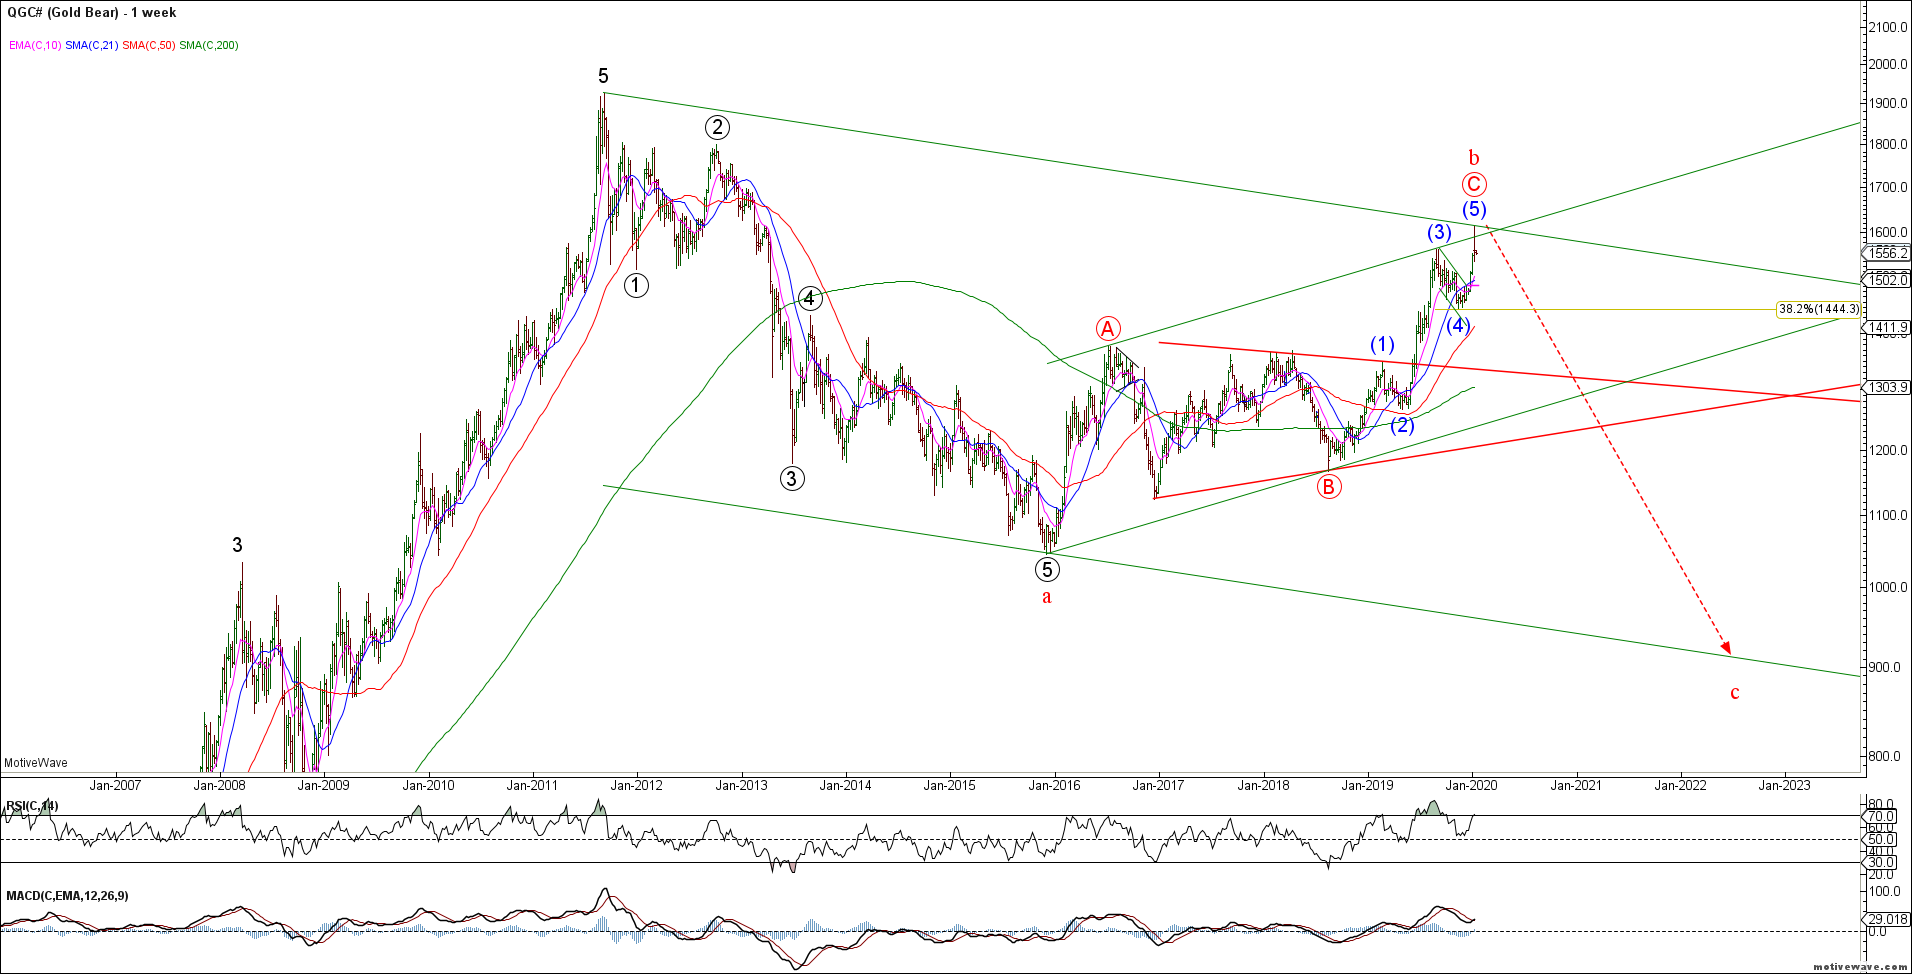
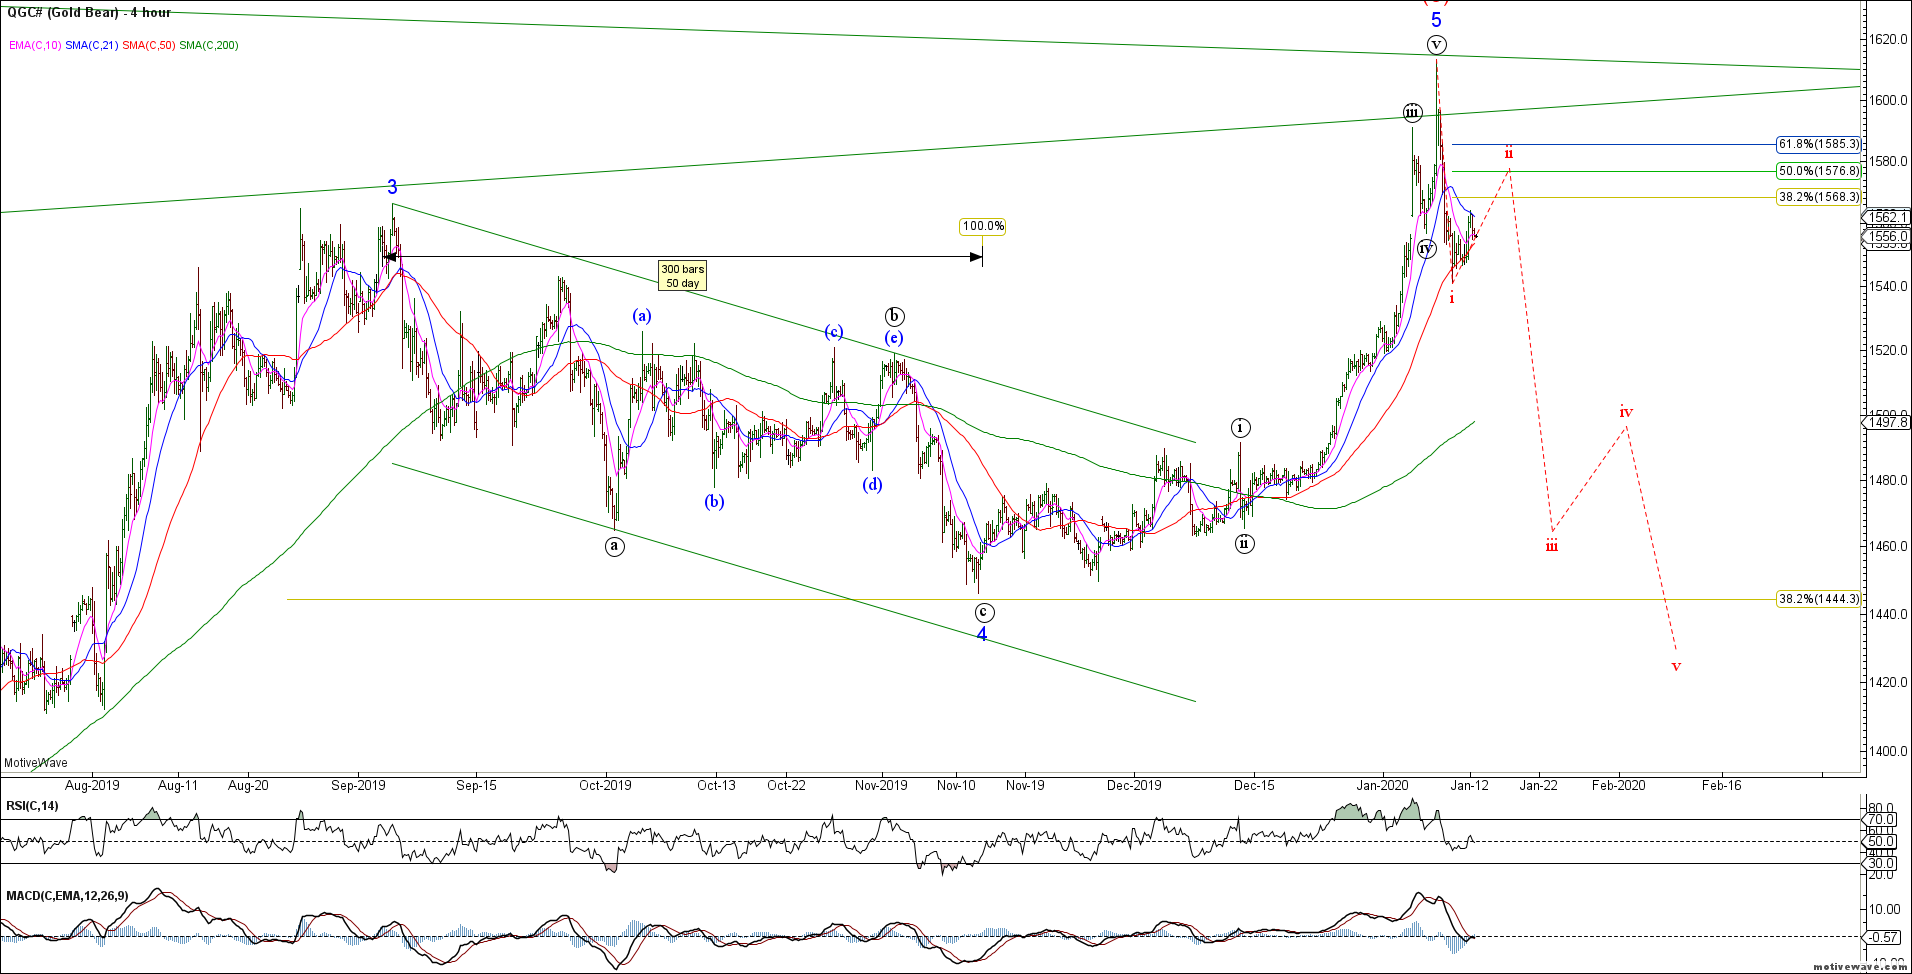
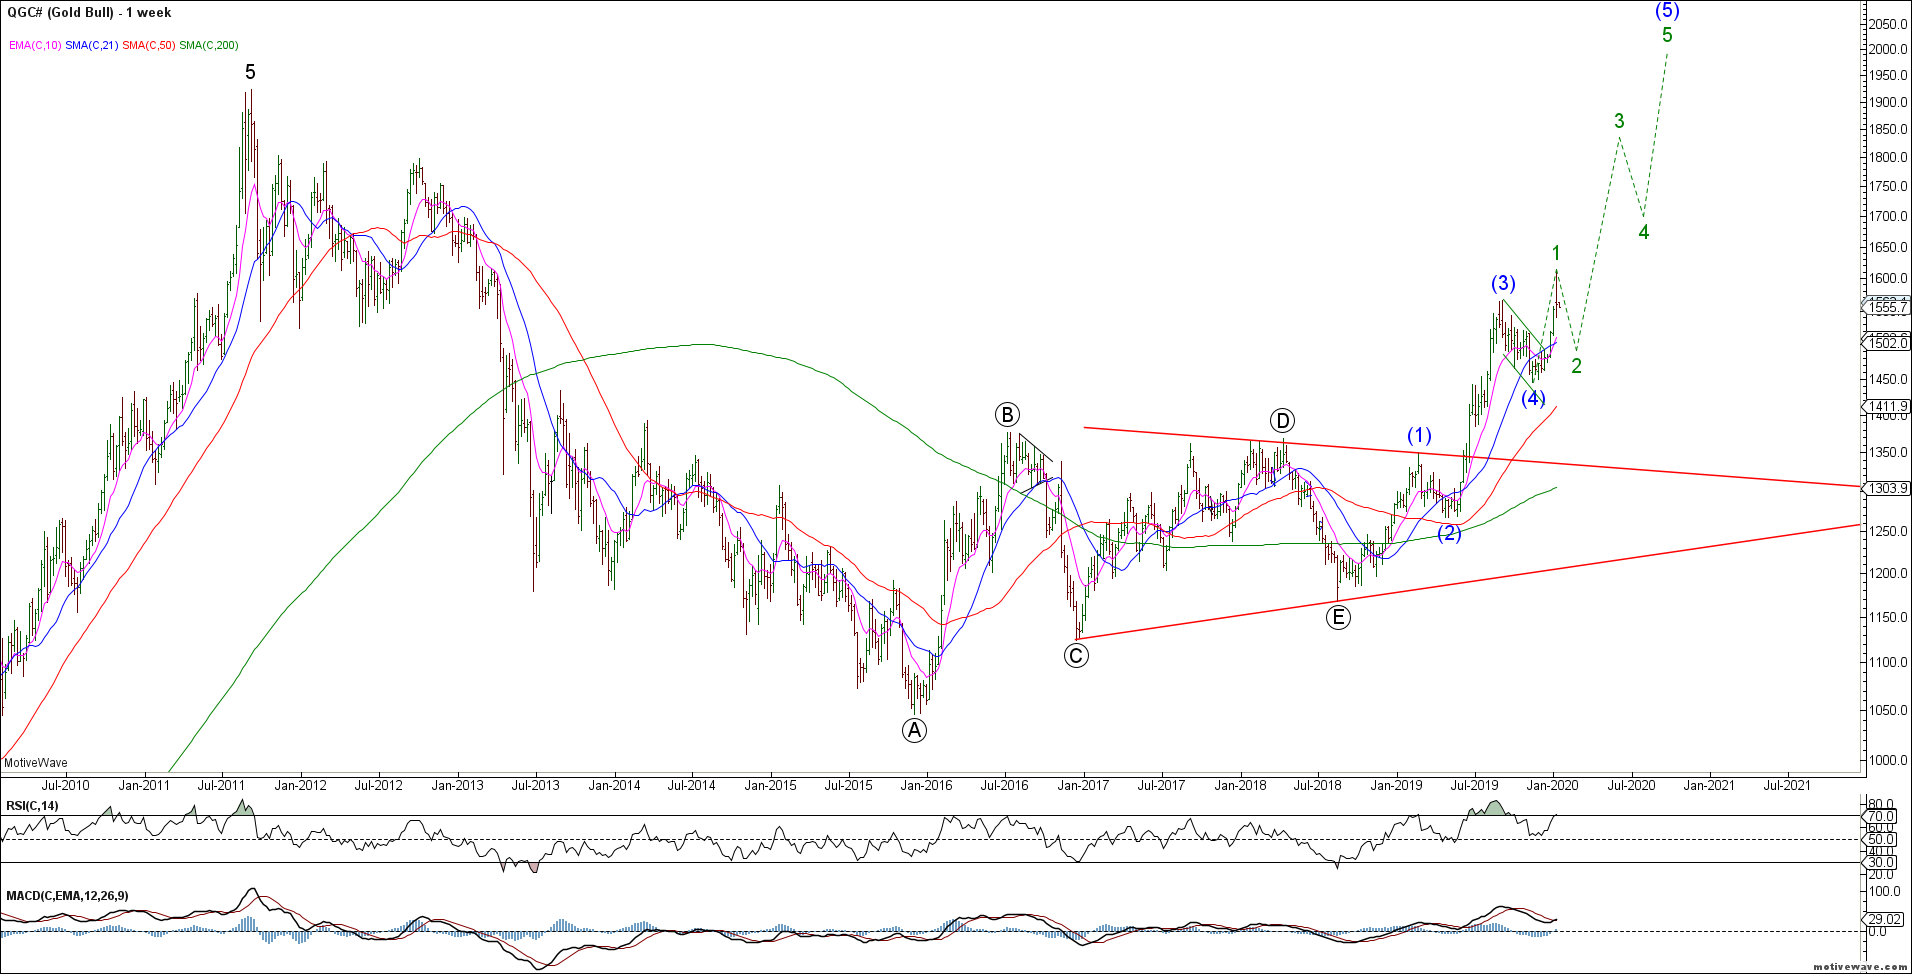
Remember, for the bear case to take hold we need to see an impulsive decline from the recent highs as shown above. The bullish alternative is that last week’s rally was only wave 1 of an extended wave (5). This would align with Silver’s bullish potential and see a retest of the 2011 highs..
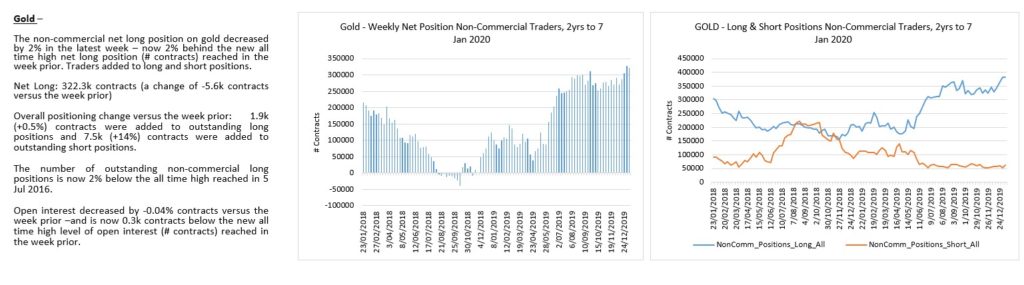
Traders extreme long positioning in Gold favors the bear case.
Silver rallied impulsively from recent swing lows but did NOT confirm Gold’s push to new cycle highs. This either means that the rally was a bullish wave 1 of (5) with strong support at the 50 day sma (green bull case) OR Silver remains trapped within a wave 4 triangle (red bear case).
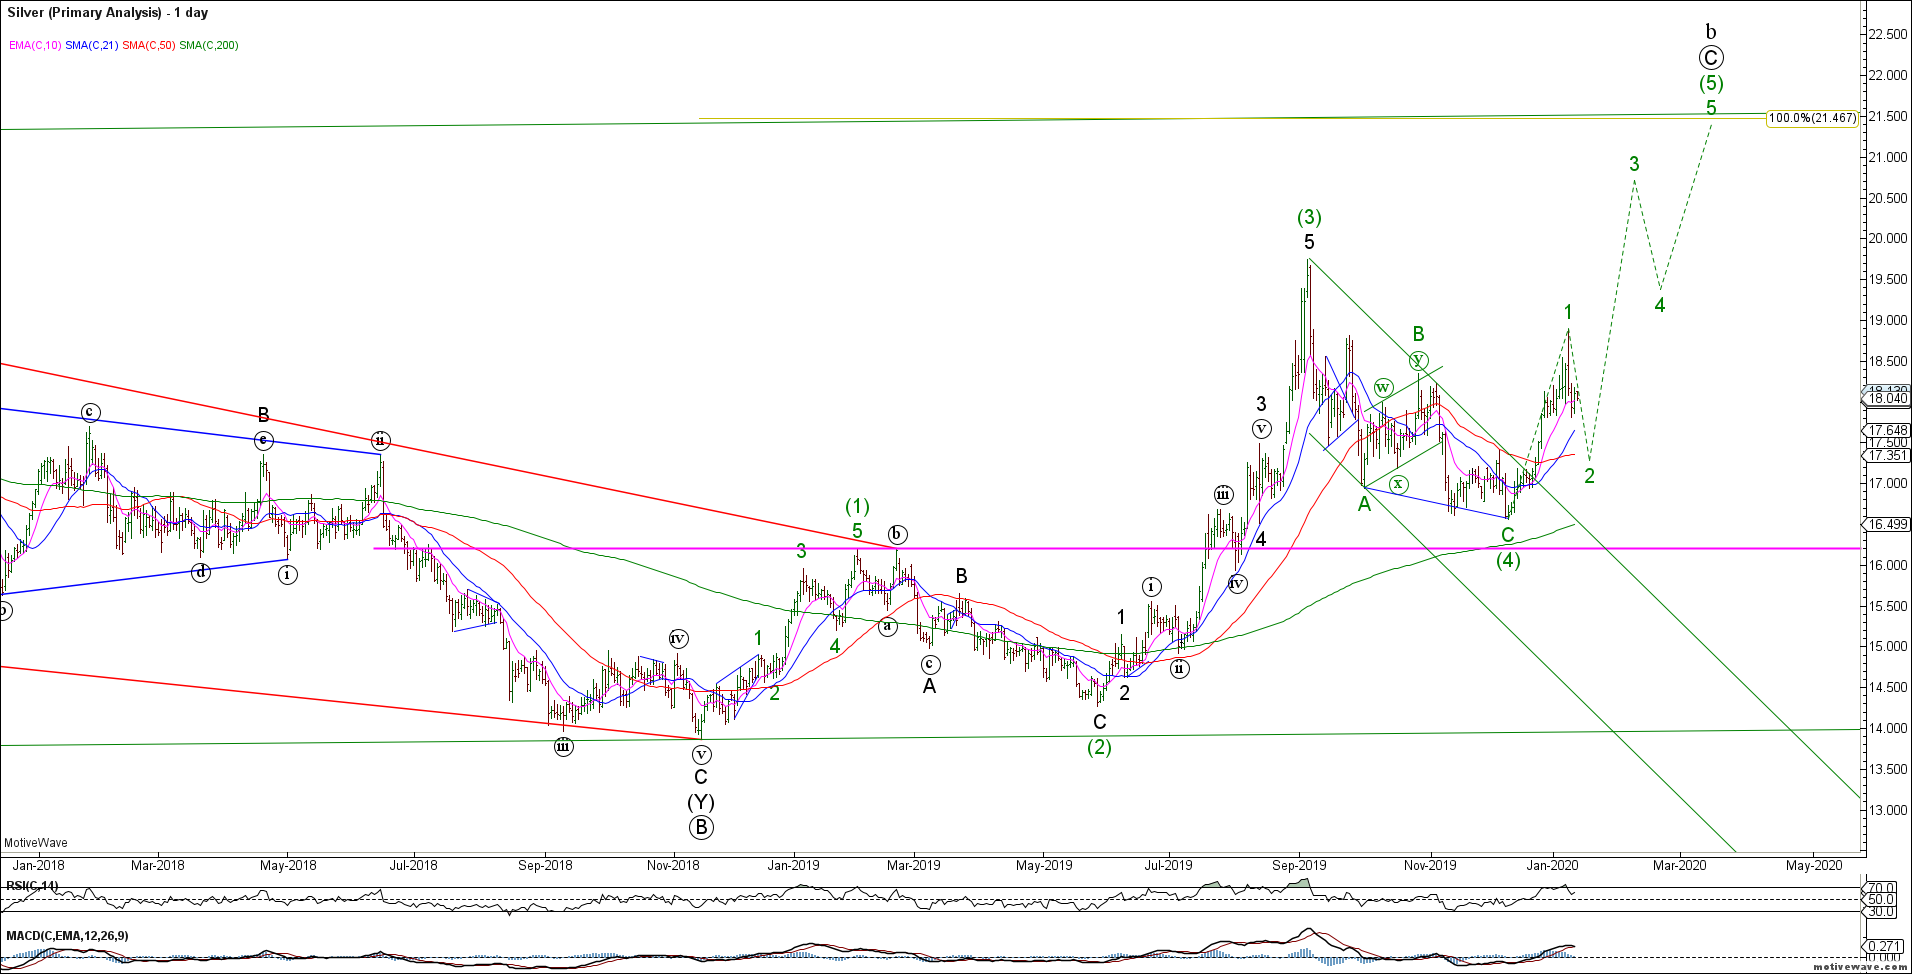
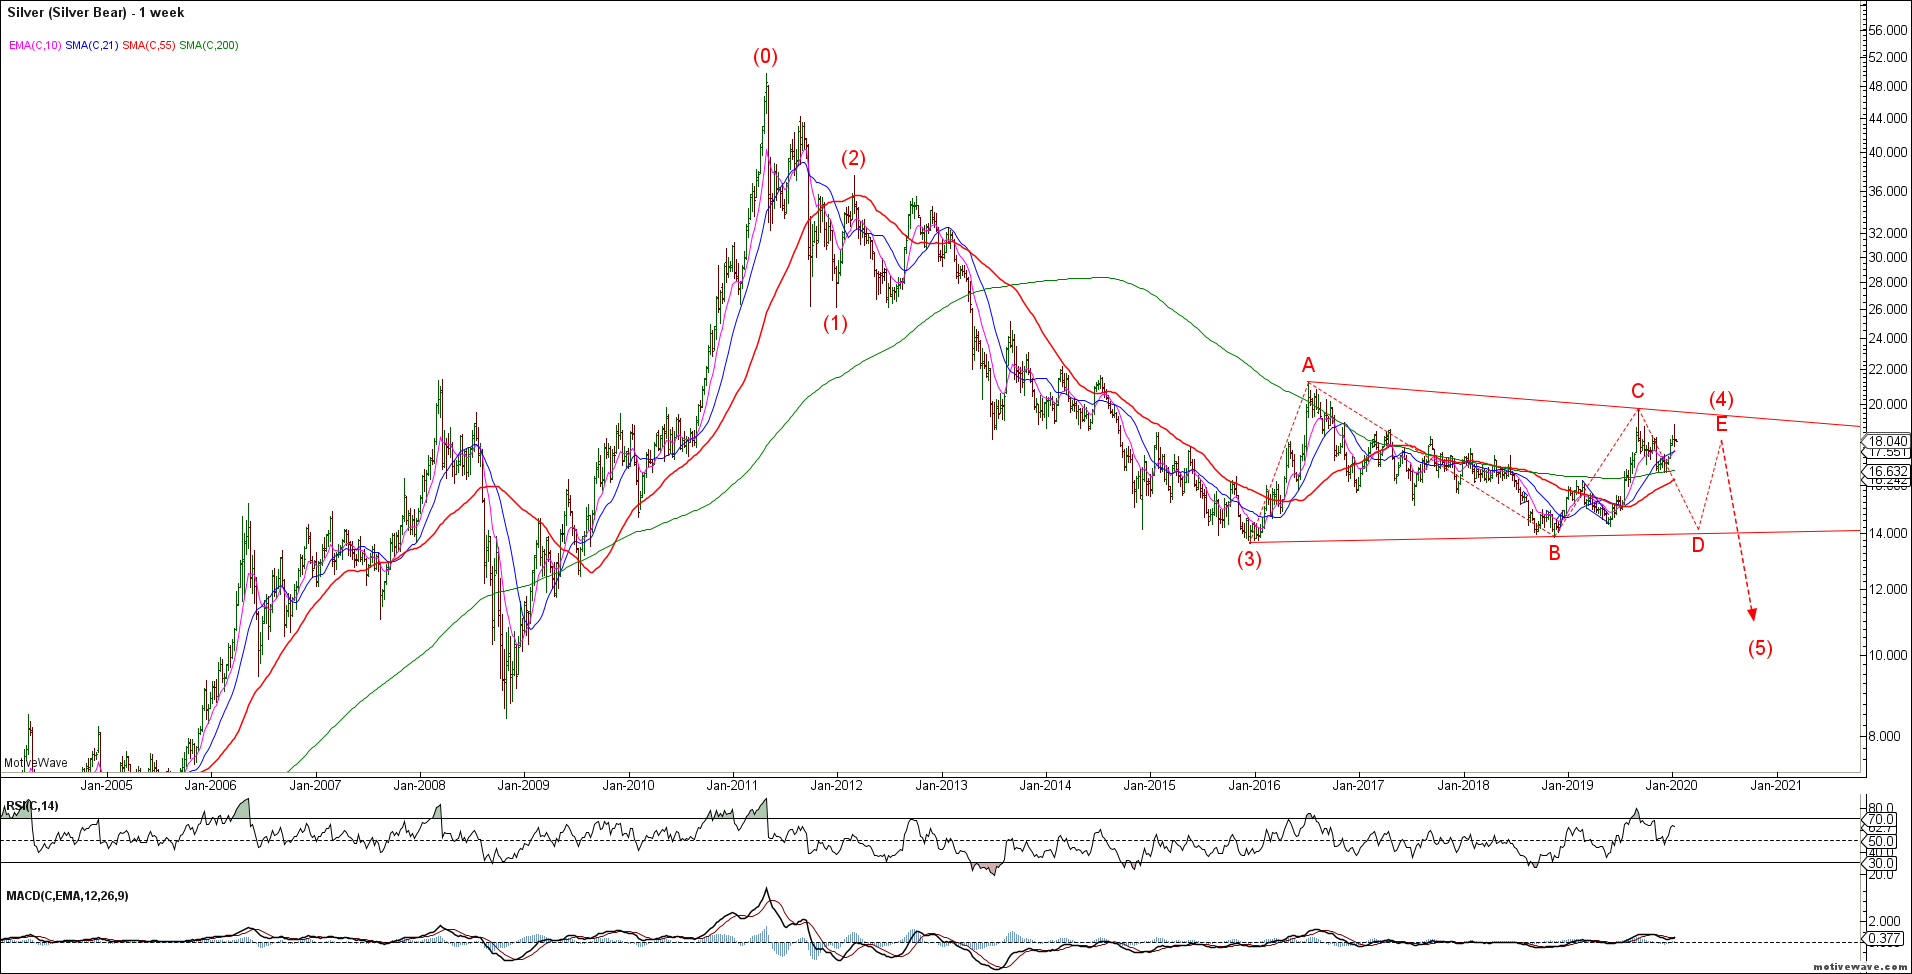
Importantly, like Gold, it is important what happens next for Silver’s big picture outlook. A 3 wave corrective decline opens the door to much higher prices while an impulsive 5 wave decline is far more bearish for the big picture trend. Important inflection point here for PM’s.
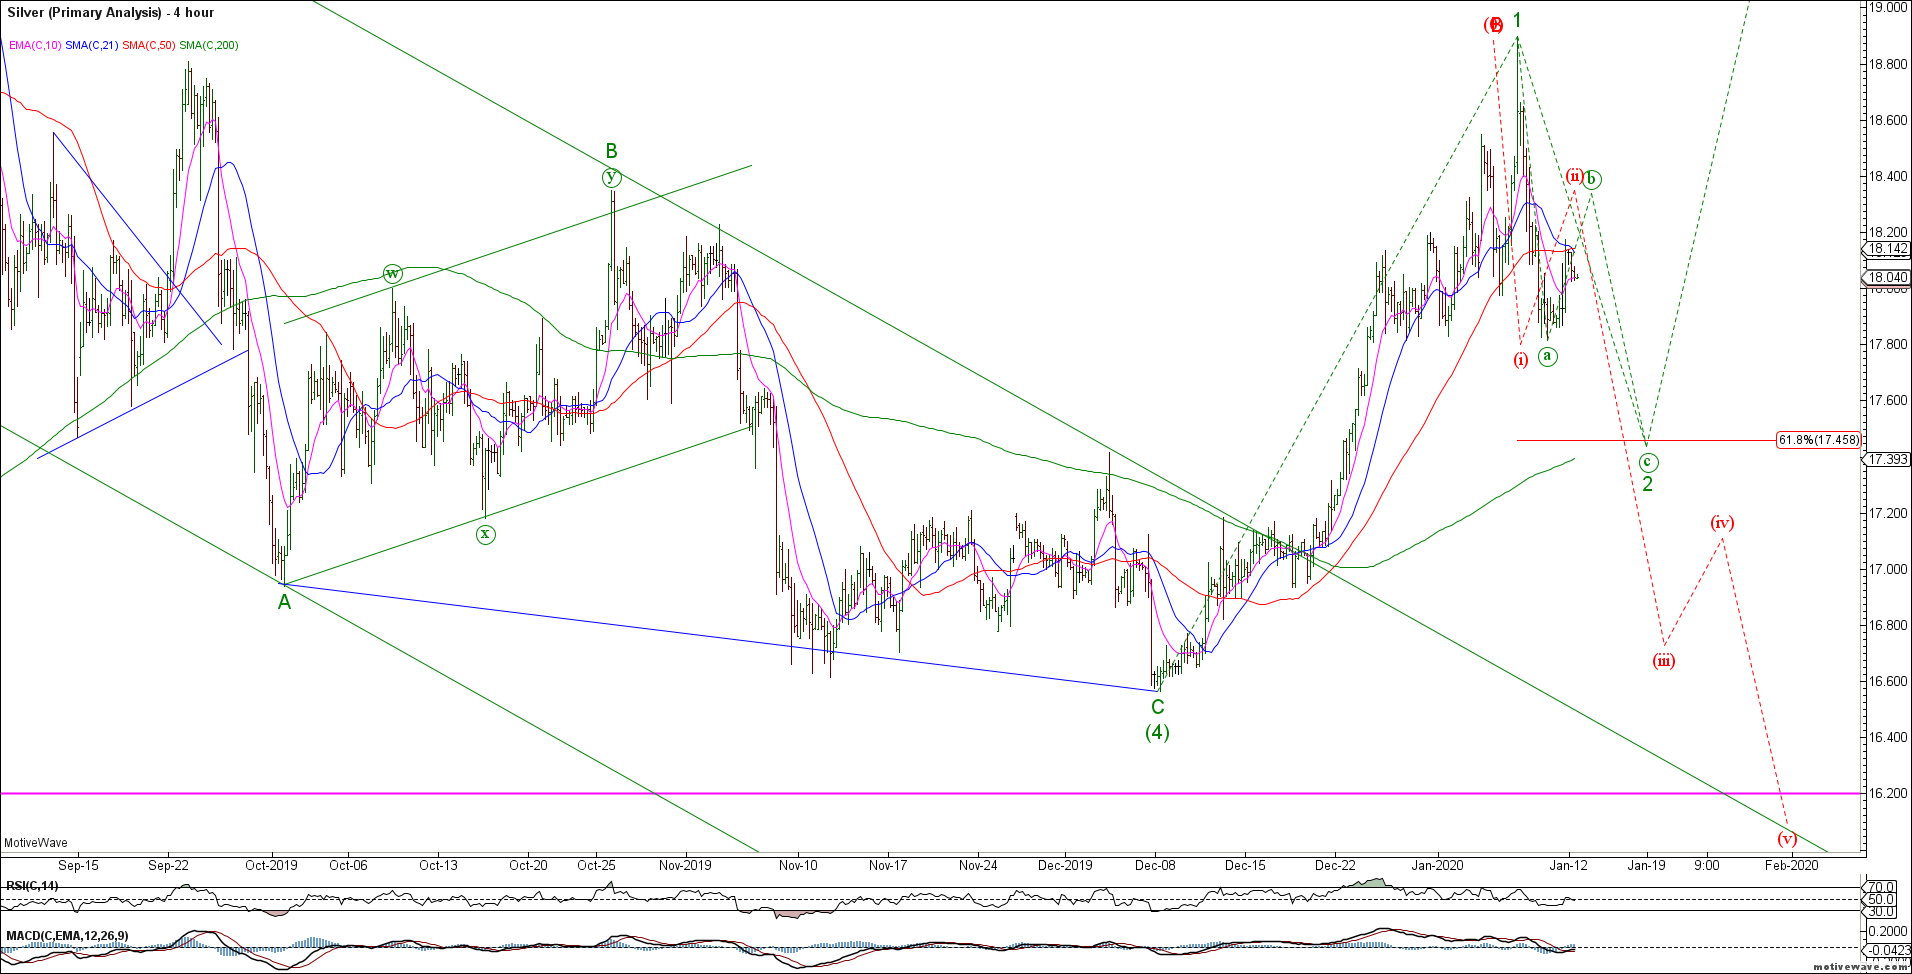
Traders caught long.
That’s all for now. I’m off for a well earned vacation so I’ll see you in a few weeks 🙂
The Weekly Macro Brief for w/c 6 January 2020
The weekly macro brief for w/c 6 January 2020 – This week, markets are likely to continue to follow geopolitical developments regarding the US and Iran. We will also hear more about a possible signing of the US-China phase one trade agreement. At this stage, there appears to be tentative plans for a delegation from China to visit the US for a 15 Jan signing.
On the data front, there are several important highlights this week;
In the US; Non-farm payrolls and employment data for Dec, ISM non-manufacturing PMI for Dec and factory orders for Nov.
There is also a speech of interest coming up this week by Vice Chair of the US Fed Richard H. Clarida on the U.S. Economic Outlook and Monetary Policy.
Data for Europe includes the final services PMI’s for Dec as well as Germany factory orders and industrial production for Nov.
Final services PMI’s for Dec will be released for the UK, Australia and China as well this week.
Aussie retail sales for Nov will also be released later this week.
It will be a lighter week for US Treasury settlements. The US Treasury will settle approx. $148bn in ST Bills this week, with a paydown of approx. $12bn. The US Treasury will auction approx. $78bn in notes and bonds this week, that will settle next week, raising approx. $32.6bn in new money.
More detail, including a one-page calendar of key data releases, is provided in the briefing document – download the file here;
Comments and feedback are welcome. Please email me at kim.mofardin@marscapitalpartners.net
Brief MCP Market Update: January 6th, 2020 – Topping?
