UPDATE TO THE WEEKLY MACRO BRIEF 31 Mar 2020 – After posting the briefing document, the US Treasury added two Cash Management Bills (CMB) for the week – a 42-Day and 69-Day CMB. Together, this increased the total of Bills and Coupons settling this week by $105bn. Totals have been updated in the briefing document.
The weekly macro review for w/c 23 March 2020 – The more timely indicators of activity for Mar indicate a severe drop in economic activity.
To further support the supply of dollar liquidity, the US FOMC
announced on Mon morning that QE would effectively be open ended. Last week in
our briefing we noted that the Fed had already likely purchased $275bn in the
first week of a proposed $500bn QE target for “a couple of months”. From the
FOMC this week;
“The Federal Reserve will continue to purchase Treasury securities and agency mortgage-backed securities in the amounts needed to support smooth market functioning and effective transmission of monetary policy to broader financial conditions.” https://www.federalreserve.gov/newsevents/pressreleases/monetary20200323a.htm
The Mar prelim PMI’s for the US, Europe and Asia confirmed
that output and employment growth contracted sharply. Services business
activity was hit very hard. The manufacturing PMI’s declined, but not to the
same extent – in most cases lengthening supplier lead times (usually a positive
indicator of rising activity, but not in this case) offset historic falls in
output and new orders.
The two regional US manufacturing surveys for Mar were mixed.
The Richmond Fed index was little changed but the fall in new orders indicates
weakness in future output is possible. The Kansas City Fed survey for Mar
indicated a much more severe decline in activity was underway. There was an
important anecdote in that survey;
“$30 per barrel oil is a much bigger problem that people are not focusing on because of C-19.”
The increase in US initial jobless claims for the week prior
was shocking at 3.28m new claims – even though we knew to expect an extremely
high number.
Consumer sentiment is deteriorating quickly. Prelim Mar
results were revised sharply lower in the final report for this week. The
indexes haven’t recorded historic falls yet – but the 7-day moving average,
should it stabilize at these levels, indicates that Apr may set-up for a
historic fall of over 30pts in a 2-month consecutive period. While financial
support can help to mitigate an adverse financial situation for many, it’s not
likely to tip the scales from pessimism to optimism and this sets the
expectation for large shifts in spending and saving.
US mortgage applications also declined again this week. Refi
activity also declined in the week, but remains up over +195% versus the same
week a year ago.
“The 30-year fixed mortgage rate reached its highest level since mid-January last week, even as Treasury yields remained at relatively low levels…”
“…this week’s additional actions taken by the Federal Reserve to restore liquidity and stabilize the mortgage-backed securities market could put downward pressure on mortgage rates, allowing more homeowners the opportunity to refinance.”
There are more data releases covered in the review document. Use the links on the contents page to navigate to different country sections. Download the review here;
The outlook for w/c 30 March 2020 – UPDATED 31 Mar 2020 – After posting this brief, the US Treasury added two Cash Management Bills (CMB) for the week – a 42-Day and 69-Day CMB. Together, this increased the total of Bills and Coupons settling this week by $105bn. Totals have been updated in the first paragraph below and in the Treasury Issuance section of the brief.
[Edited] Treasury issuance to increase. There will be a significant increase in the supply of US Treasuries settling this week. The US Treasury will settle approx. $493bn in ST Bills, TIPS, Notes and three (3) CMB’s this week, raising approx. $237bn in new money for the week. There was an increase in auction amounts across all Bills plus the addition of three (3) CMB’s.
Looking forward, the initial Q2 Treasury financing schedule
released back at the start of Feb had a recommended net $56bn paydown (Bills -$278bn
and Coupons +$222bn). The next update is not until mid Apr, but several
estimates indicate that revisions to the Treasury financing needs, across Q2
and Q3 could reach over a trillion USD in net new money raised.
QE is now open
ended. This week, the NY Fed will purchase approx. $345bn in Treasury Securities
and approx. $200bn in MBS.
It’s a reasonably
heavy data week – still mostly focused on Feb data. Some of the more important Mar
data will be released this week.
In the US, the
most important released will be non-farm payrolls for Mar and initial jobless
claims for last week ending 27 Mar. Also of note will be the ISM PMI’s and the final
Markit PMI’s for Mar. Several important regional manufacturing/business
conditions reports will be released this week – NY, Chicago and Dallas.
The prelim
Eurozone CPI for Mar will be released this week.
We will get a more global view of the state of the economic impact via the release of the final PMI’s for Mar this week.
More detail (including a calendar of key data releases) is provided in the briefing document – download the file here;
Last week the Fed introduced extreme measures (0.25% interest and unlimited QE) to stabilise the financial system... and stabilise it did. Fortunately we were looking for a tradable low and trend exhaustion as we flattened positions across the board. Perhaps the biggest impact of the Fed intervention was not the equity rally but rather the […]
The weekly macro review for w/c 16 March 2020 – More countries, as well as individual US states, have tightened quarantine measures in an effort to slow the spread of the Coronavirus. This is having significant impacts on economic activity – not to mention enormous social impacts. Governments and central banks are ramping up stimulus, safety net support and liquidity measures.
Major central banks made out-of-cycle announcements on
policy changes and further accommodations during the week. There was further co-ordinated
central bank action to address USD shortages during the week.
On Mar 20, the EC proposed activating the ‘general
escape clause of the Stability and Growth Pact’ – allowing member states to
respond with greater fiscal flexibility. In the US, a $1TR stimulus package was yet to be approved by the
Senate at the time of writing (will likely pass with changes).
The combined Jan-Feb data for China started to show a
severe impact – retail sales fell by over 23% (real terms), industrial
production fell by 13.5% and fixed asset investment fell by 24.5%.
The Mar data for US, Europe and Asia will start to
highlight the extent of the economic shock. Once the extent of this shock
becomes apparent, there is likely to be some further calibration especially
with required levels of fiscal stimulus.
US data this week – starting to show some impact in the
hard data. The first two Mar regional manufacturing surveys both showed a
significant fall in manufacturing activity. Initial jobless claims increased by
70k to 281k – and this is expected to get much worse next week (estimates are
for initial claims to be in the millions). There was some softness in mortgage
applications.
US housing – strength in West/South existing home sales
in Feb, but conditions starting to weaken into Mar. Retail sales (val) already
weakening in Feb – well before the oil price shock (from first week of Mar).
There are more data releases covered in the review document. Use the links on the contents page to navigate to different country sections. Download the review here;
The outlook for w/c 23 March 2020 – The human and economic cost of the spread of Coronavirus will remain the key focus. Quarantine requirements continue to be stepped up across countries and regions. There is some good news in the form of slowing growth in the number of new cases in some regions (due to quarantine), including Asia, that are further along in this outbreak.
The
fall-out for the financial markets continues. Central banks continue to
implement measures to ease liquidity issues.
The
focus now starts to shift to the understanding the extent of economic shock and
how fiscal stimulus will be applied. This week, we will start to gauge that
impact with the prelim PMI’s for Mar across the US, Europe and Asia. Two other
important data points will be US Initial Jobless Claims from last week (20 Mar)
and the final version of the University of Michigan Consumer Sentiment for Mar.
Estimates for Initial Jobless Claims from last week have hit extreme levels
(millions) – and there was talk that this number may not be released.
The supply of US Treasuries settling this week will remain heavy. The US Treasury will settle approx. $236bn in ST Bills, a FRN and a new 79-day CMB this week, raising approx. $43.1bn in new money. The US Treasury will also auction approx. $125bn in Notes this week, to settle next week (raising approx. $42.5bn). Liquidity will be supported with further significant increases in repo operations each week, as well as purchases of Treasury securities by the Fed. There is still no forward schedule released for the planned purchases of securities – details to be released daily on the NY Fed website. On Mon 23 Mar, the Desk at the NY Fed will purchase approx. $75bn in Treasuries. While the results of purchase operations for last week have also not yet been released, the ‘planned’ purchases for last week totalled $275bn. Last week the Fed announced purchases of $500bn “over the coming months” – last week’s purchases represents over half of those planned purchases just in the first week. Further announcements from the Fed are likely as it looks for new ways to ease financial conditions.
More detail (including a calendar of key data releases) is provided in the briefing document – download the file here;
Last week saw a continued liquidation of global risk. Our expectation was that the decline had not ended and we were looking for wave (v) of the decline. Last week’s 2-way price volatility warned of a likely 4th wave as the markets continued to stair step lower. We are now seeing bullish momentum divergence across the board as we look for a bottom in wave (v). This is NOT a given as liquidations could continue. The global policy response has been unprecedented as the enormity of this economic decline becomes clearer. We have been on the right side of this decline and capital preservation / risk management remains our primary objective. This is not a time for complacency and we are essentially flat across the board.
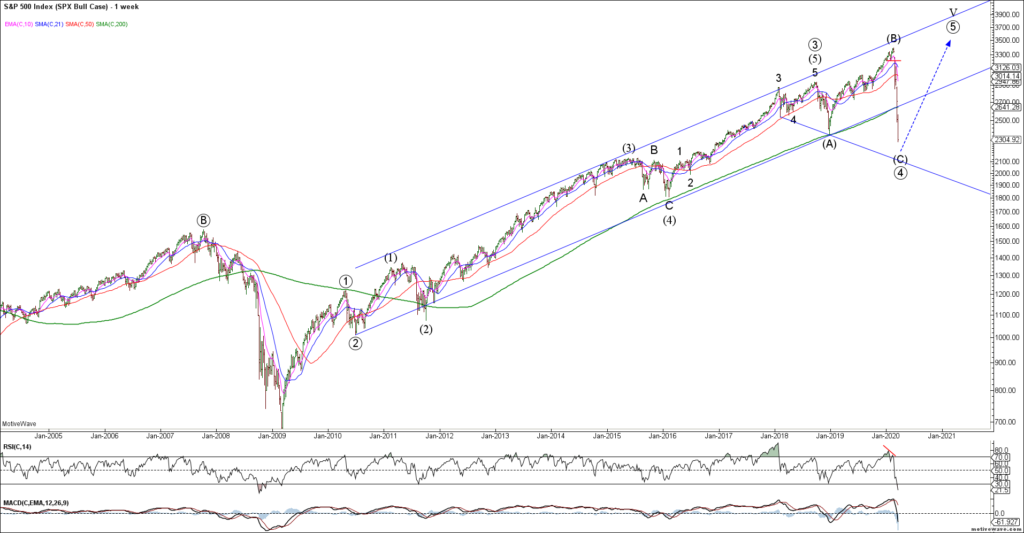
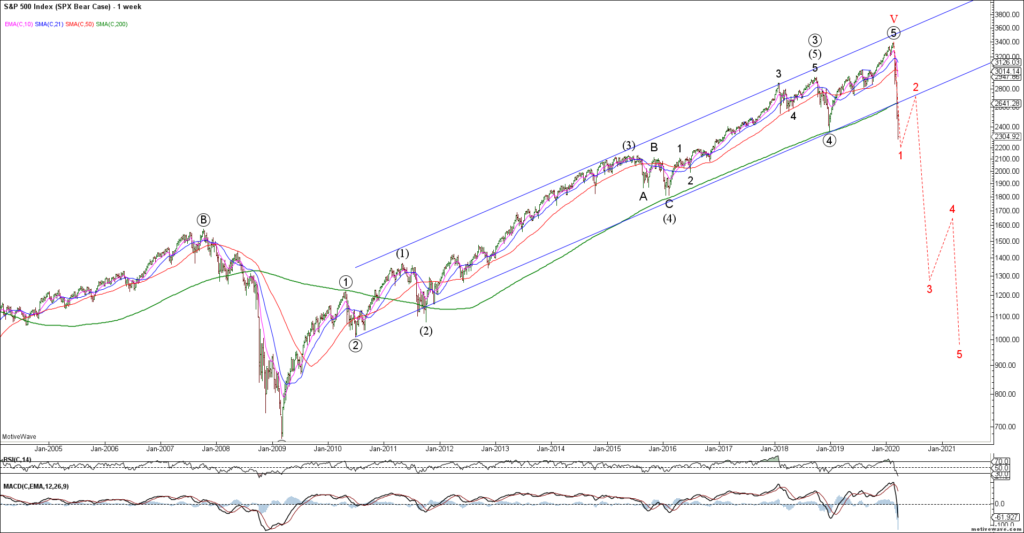
Last week’s continued decline in the SPX / ES invalidated the running triangle case and leaves two likely structures. Either way, we are looking for evidence of near term trend exhaustion and the potential for a counter-trend rally. 1. Bull Case – wave C decline to complete wave (4) of an expanded flat in the 2000-2100 area before a final push to new ATH’s (hard to see until Covid-19 is mitigated) 2. Bear Case – completing wave (v) of 1 down of a larger bear market that retraces the entire post-2009 rally.
SPX Bull Case WeeklySPX Bear Case Weekly
While the minimum requirements for a 5 wave decline for SPX / ES have been met, there is no strong evidence of a tradable low. While bigger picture support resides in the 2000-2100 area, the next major support is at 1800 (prior 4th wave). We are flat here looking for evidence of a tradable low and bullish reversal.
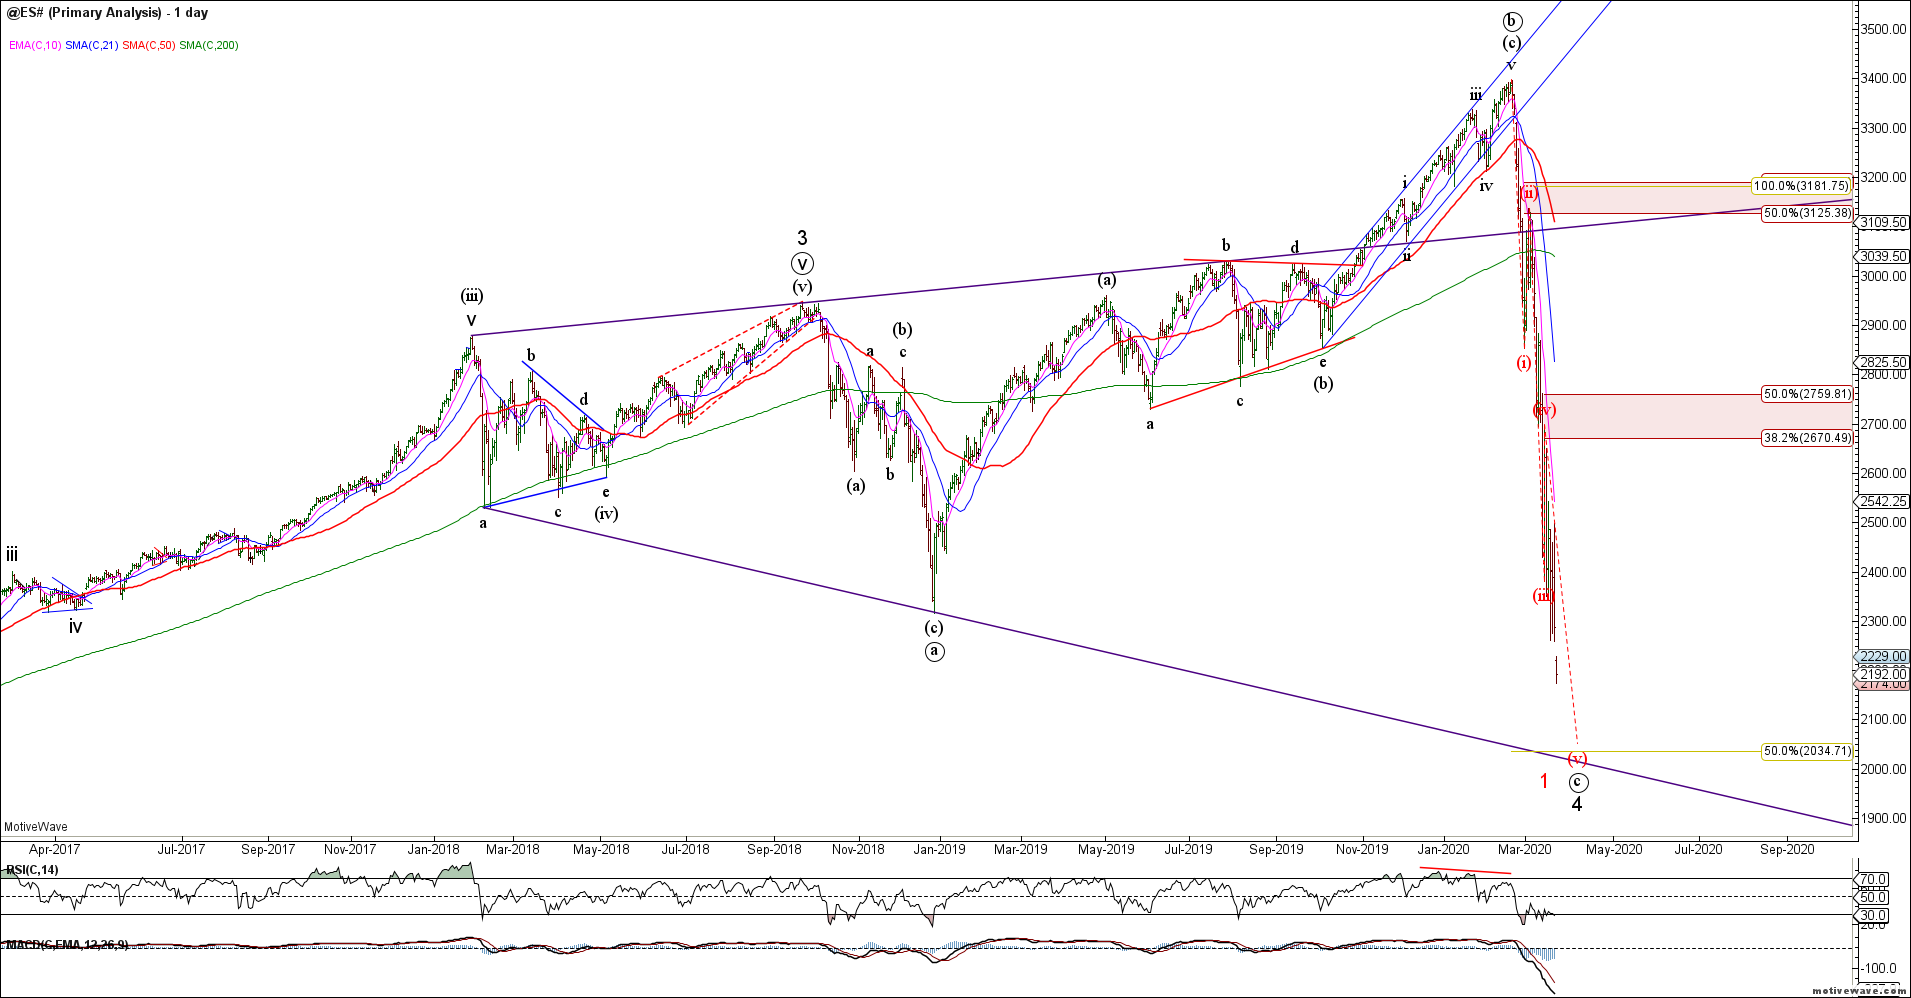
ES Daily
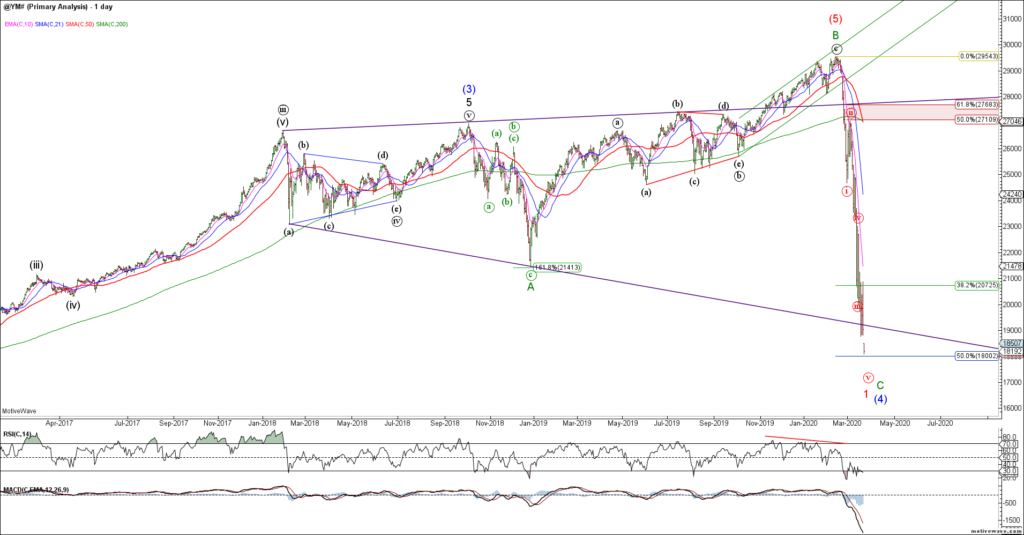
The DJIA / YM also made new 5th wave lows but there is no evidence of a tradable low. This latest decline should be an ending wave (v) so we alert to the potential for a bullish near term reversal.
YM Daily
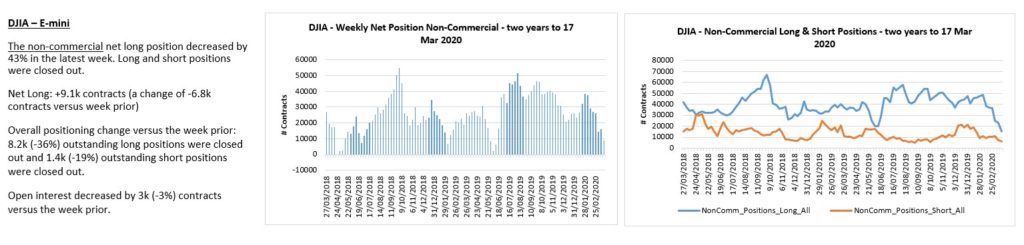
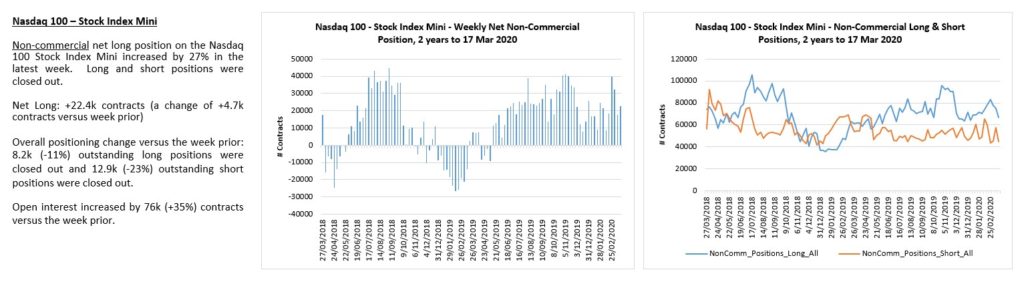
YM longs have left the building.
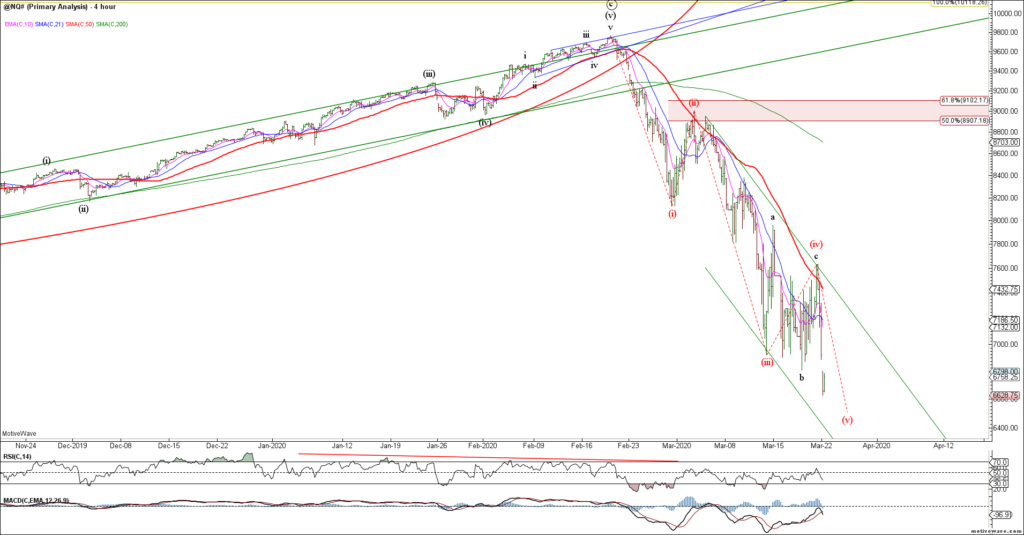
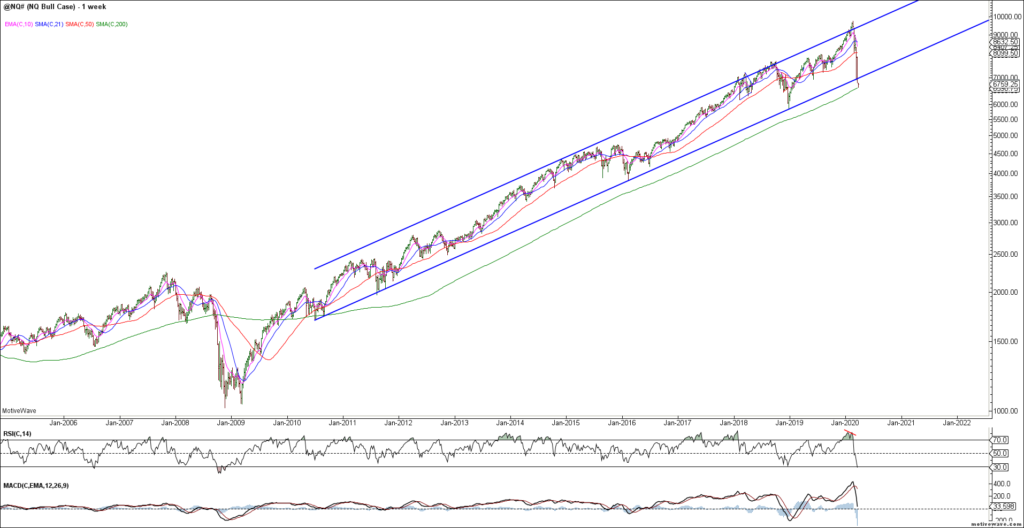
Similarly, the Nasdaq / NQ extended to 5 waves down but the near term structure is choppy and likely incomplete after tagging the 200 week sma. Looking for evidence of a tradable low but keeping an eye on MSFT which looks vulnerable if it breaks near term support.
NQ H4NQ Weekly
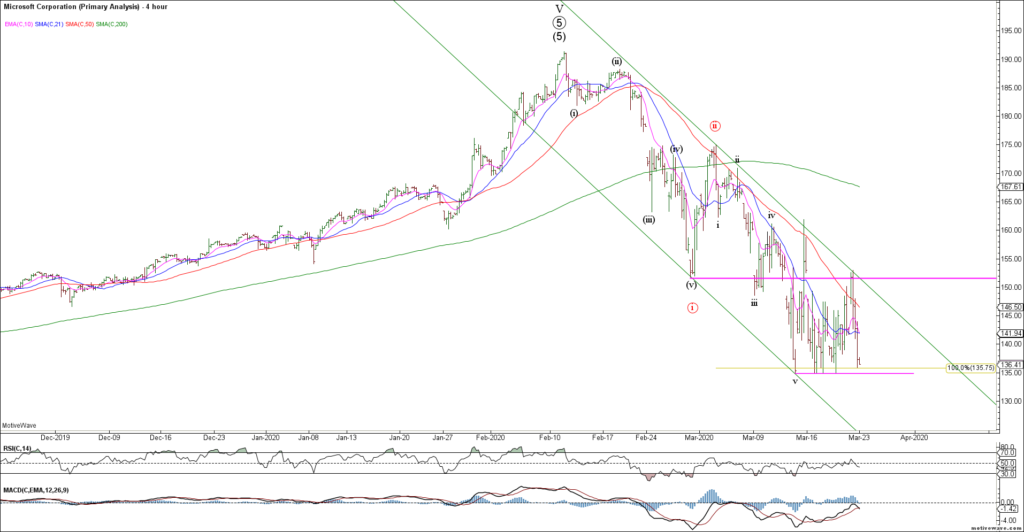
MSFT is our canary in a coalmine and is threatening to break below shelf support. The question is do we hold support, gap and drive lower or see a false break and bullish reversal? Not pre-empting but watching closely for clues on the broader market. Today’s close will be very important.
MSFT H4
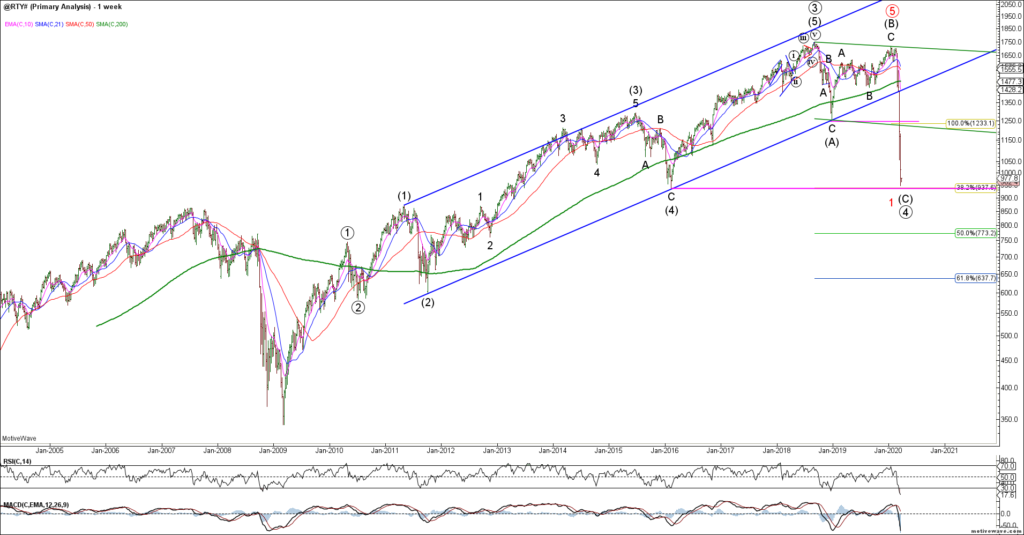
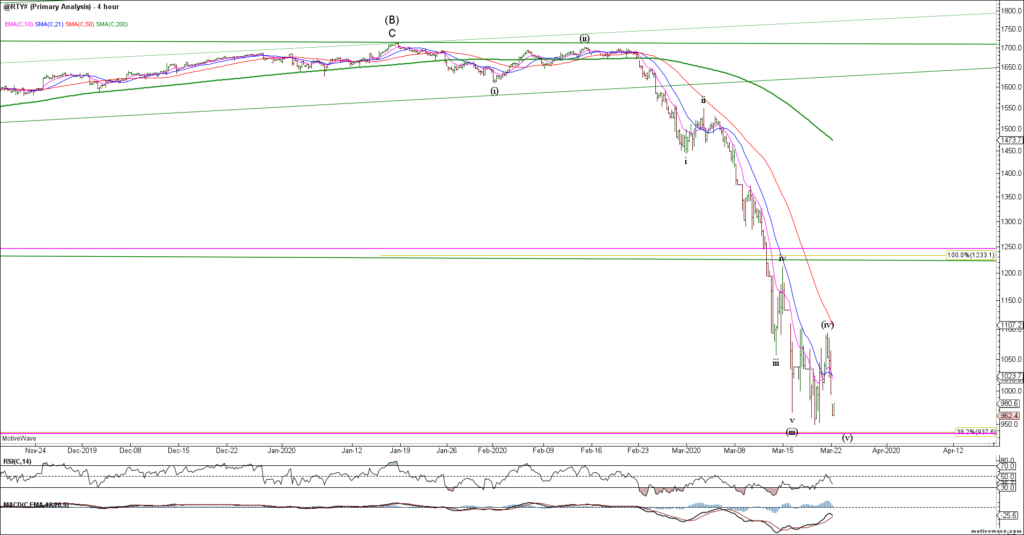
The Russell 2000 / RTY is approaching strong fib and prior 4th wave support. Looking for potential trend exhaustion and evidence of a bullish reversal.
RTY WeeklyRTY H4
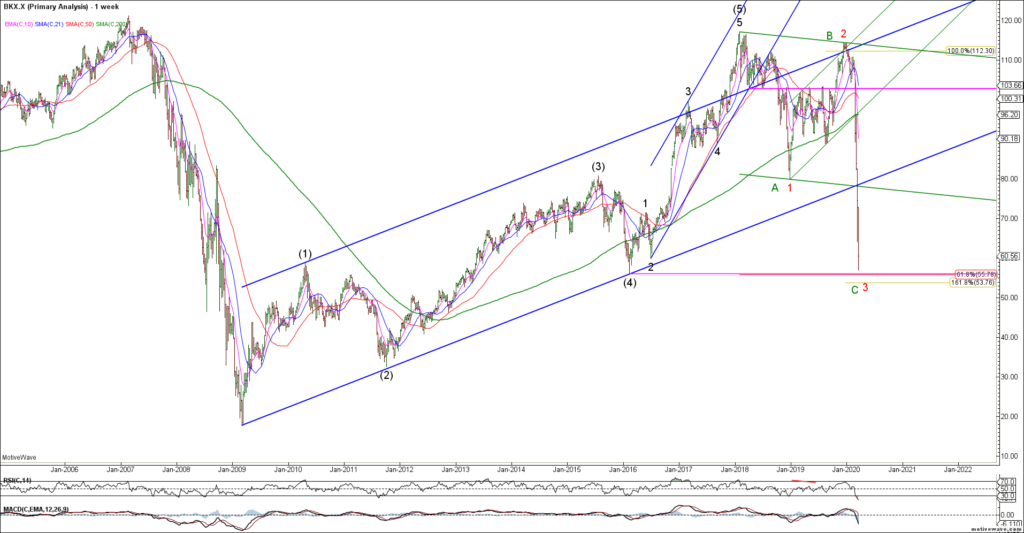
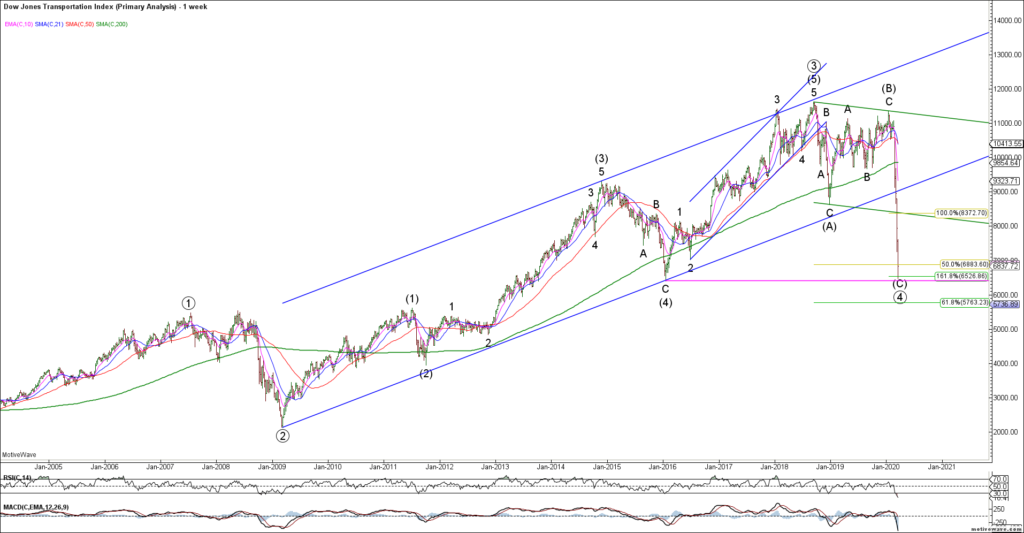
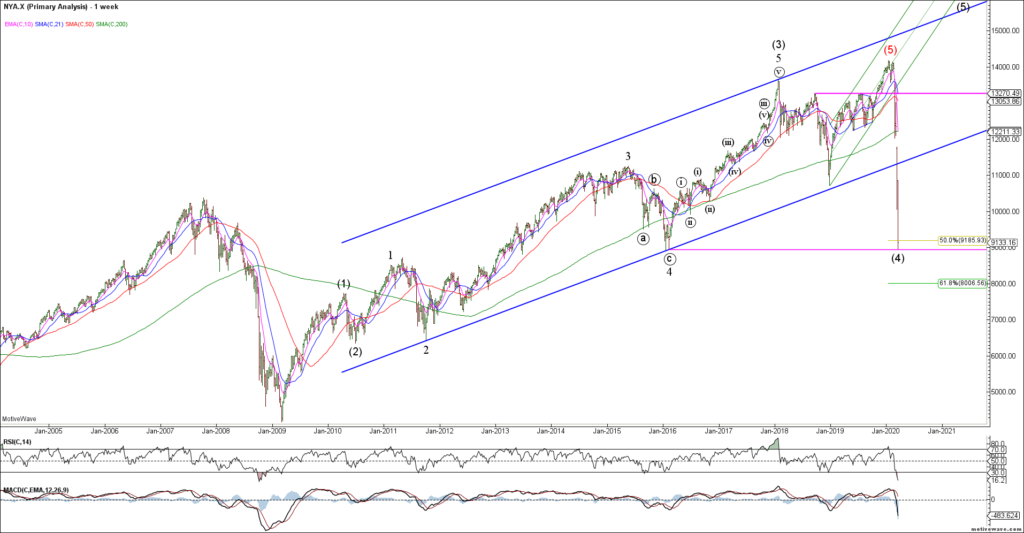
Like the Russell, the BKX, DJT and NYA (Composite) are all testing major fib and prior 4th wave support…. an area you would expect the bulls to try and make a stand.
BKX WeeklyDJT WeeklyNYA Weekly
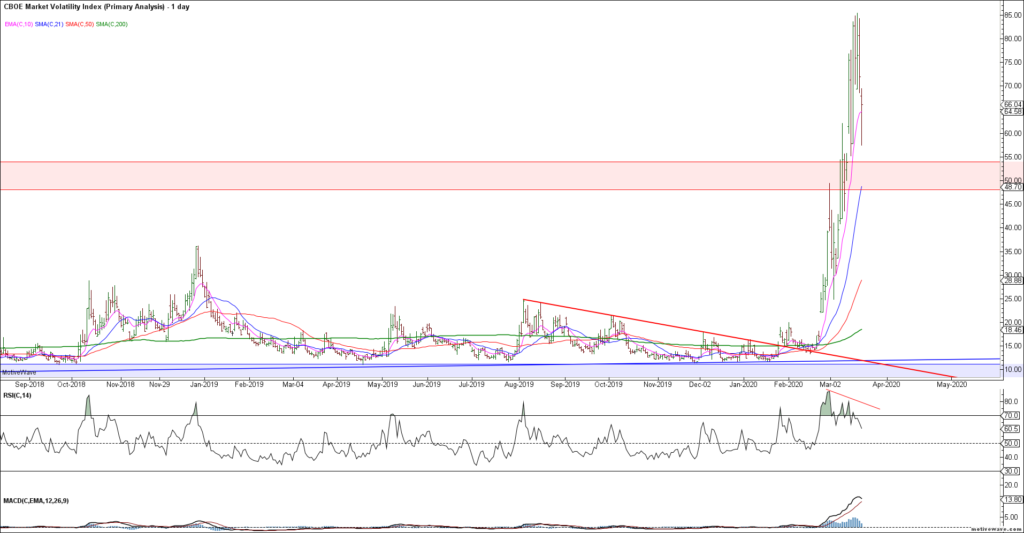
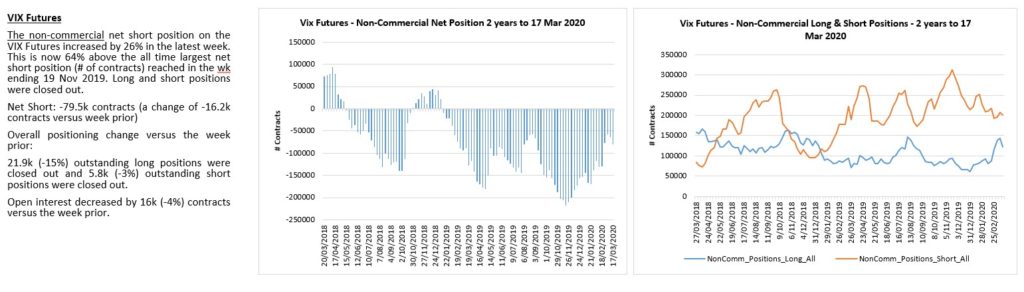
The VIX remains elevated but we are seeing bearish momentum divergences as the markets try to hammer out a near term low. Ideally, a new 5th wave low in equities is NOT confirmed by a new high in VIX which would provide more inter-market divergence and bullish potential for equities.
VIX Daily
VIX traders remain marginally short.
To the global equity markets and like the US, we see evidence of 4th wave consolidation prior to a 5th and final wave down. A 5th wave thrust to new lows in ESTX and DAX could potentially complete the impulsive decline as we look for evidence of a tradable low.
DAX H4ESTX H4
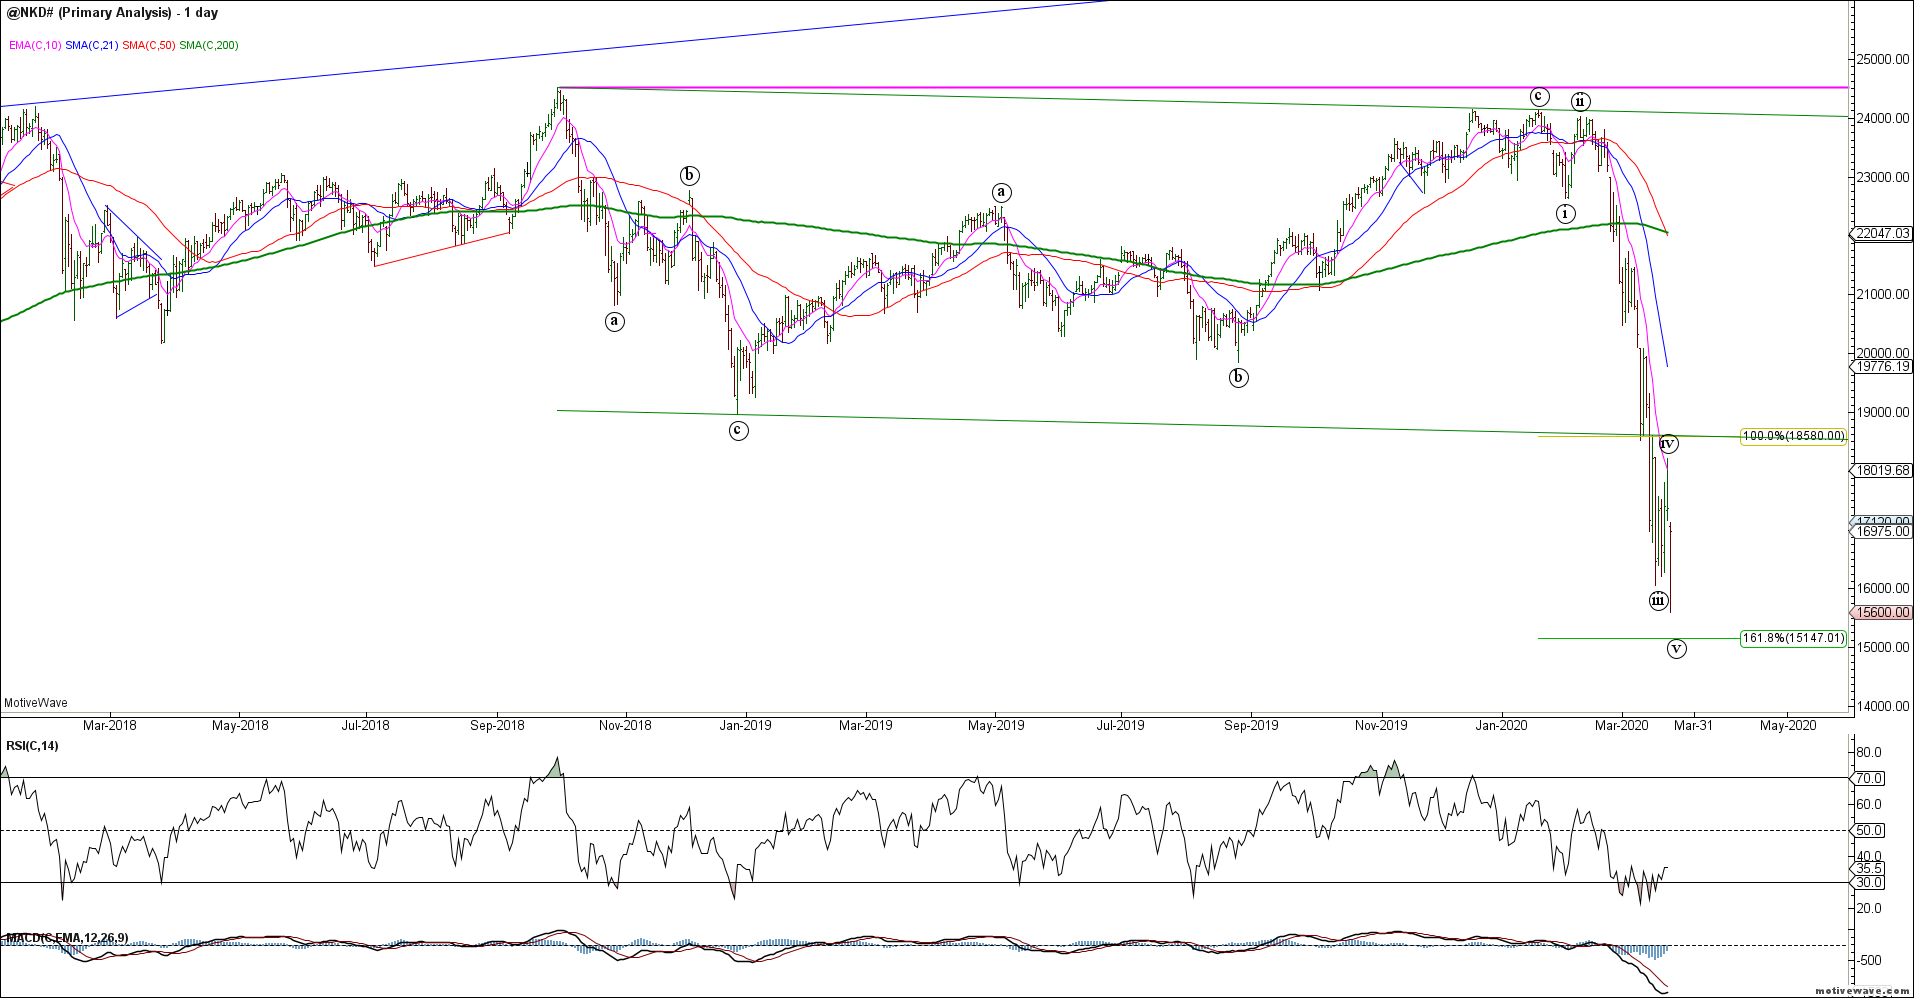
The NKD thrust to new 5th wave lows this morning and may have completed its most recent decline. Looking for evidence of a tradable / hammer low with upside follow through.
NKD Daily
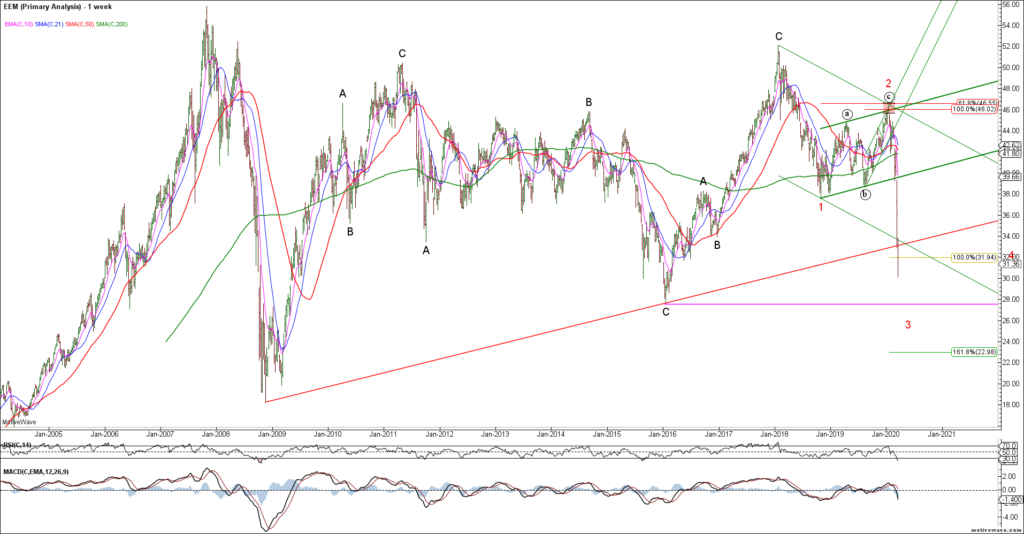
The EEM broke trend support and continues to be pressured by a strong US$. Despite minimum targets being met, this chart remains bearish until proven otherwise.
EEM Weekly
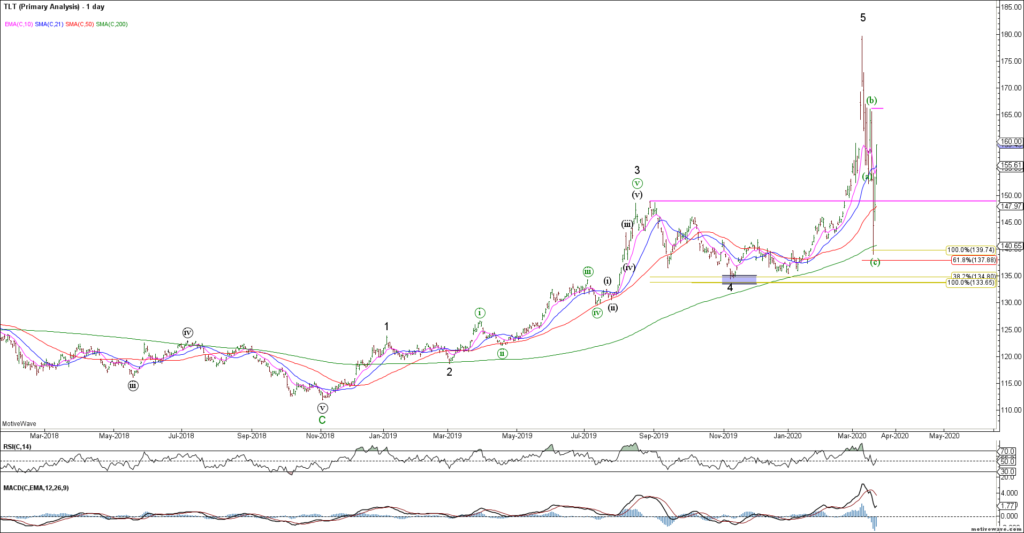
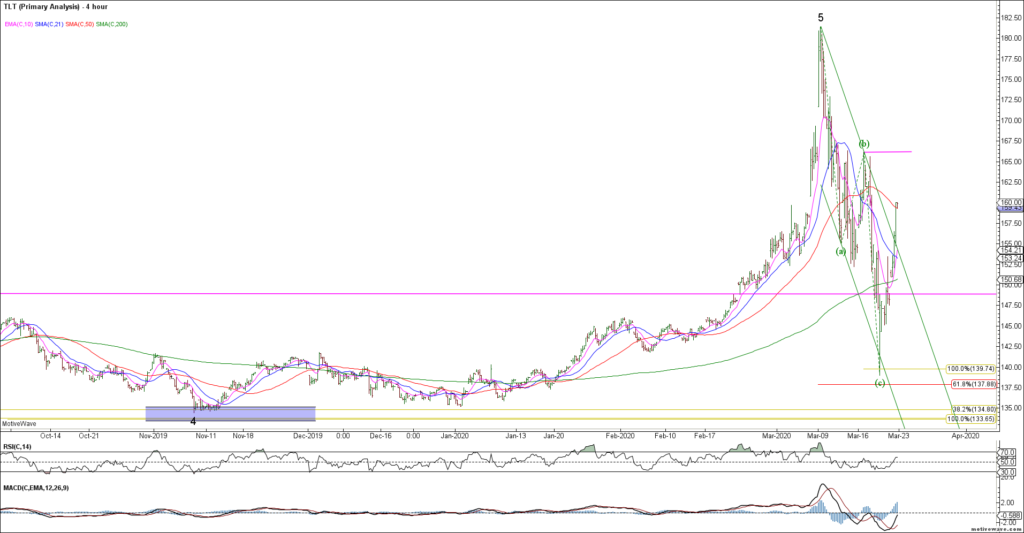
To the bond markets and last week saw a sharp decline as RV funds liquidated. The TLT appears to have declined in 3 waves of equality so far into the 61.8% fib support. This tells us that so far, the decline is corrective from a bigger picture perspective and the trend likely remains higher while last week’s lows hold. Obvious 2-way risk here given market volatility but prima-facie we should probably expect new lows in rates going forward.
TLT DailyTLT H4
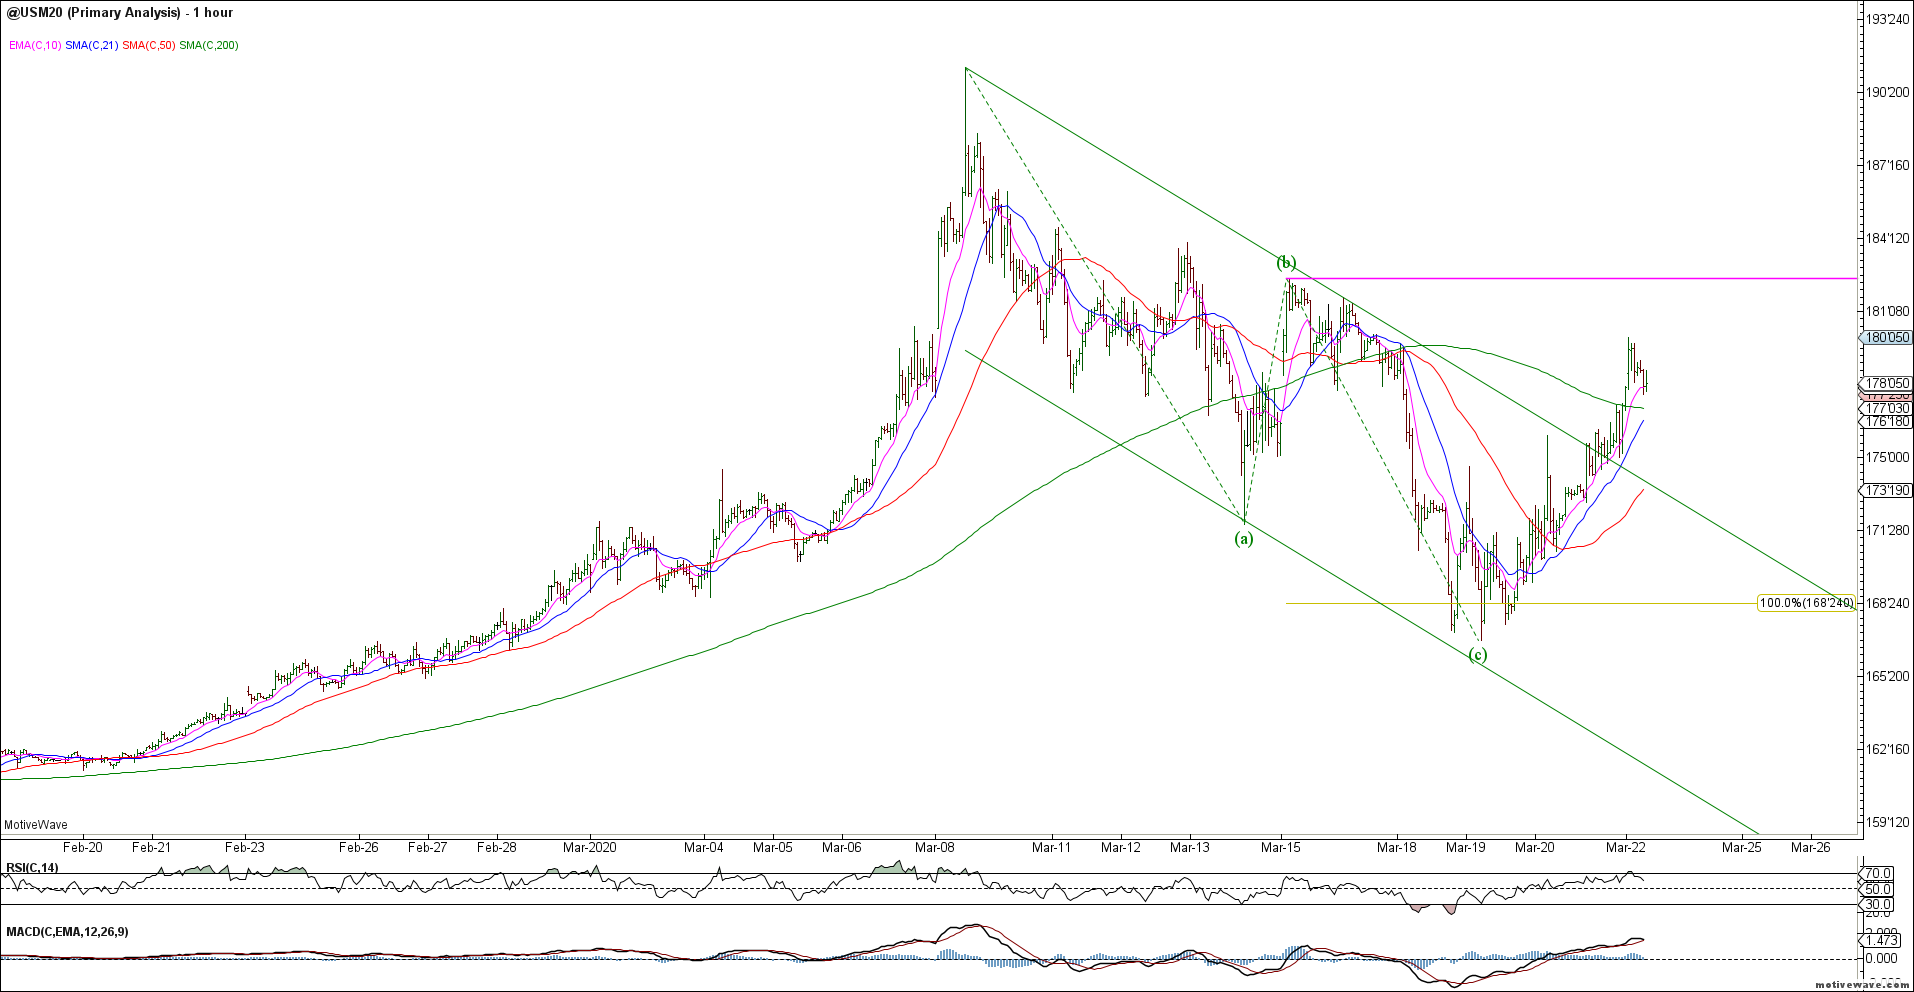
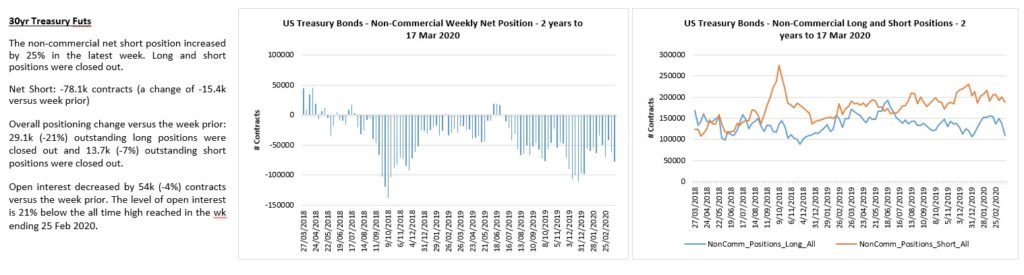
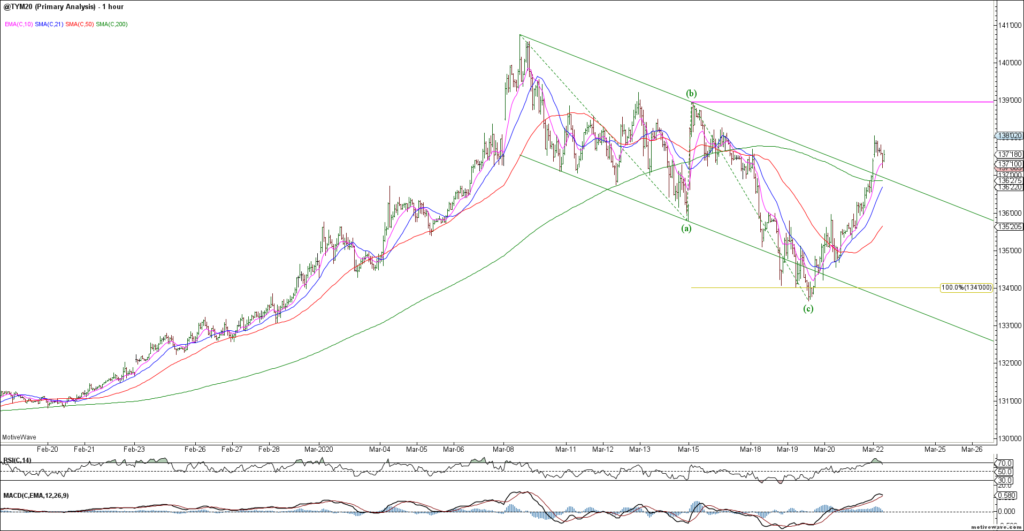
The US 30yr / ZB decline appears corrective as it stair stepped lower last week. This is a difficult environment for bonds given the cross-currents of deflation and massive stimulus and forced liquidations. So far, it’s an a-b-c decline but bulls need to clear wave (b) resistance to confirm a corrective decline.
ZB H1
Last week saw a sharp decline in ZB longs.
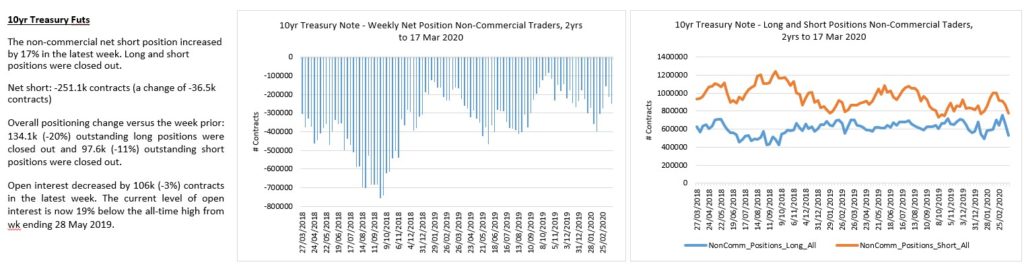
The TY shows the same corrective decline of equality but needs to clear wave (b) resistance to help confirm. It could also be part of a larger correction so 2-way risks remain in these volatile times. Tread lightly.
TY H1
TY longs and shorts have been liquidated.
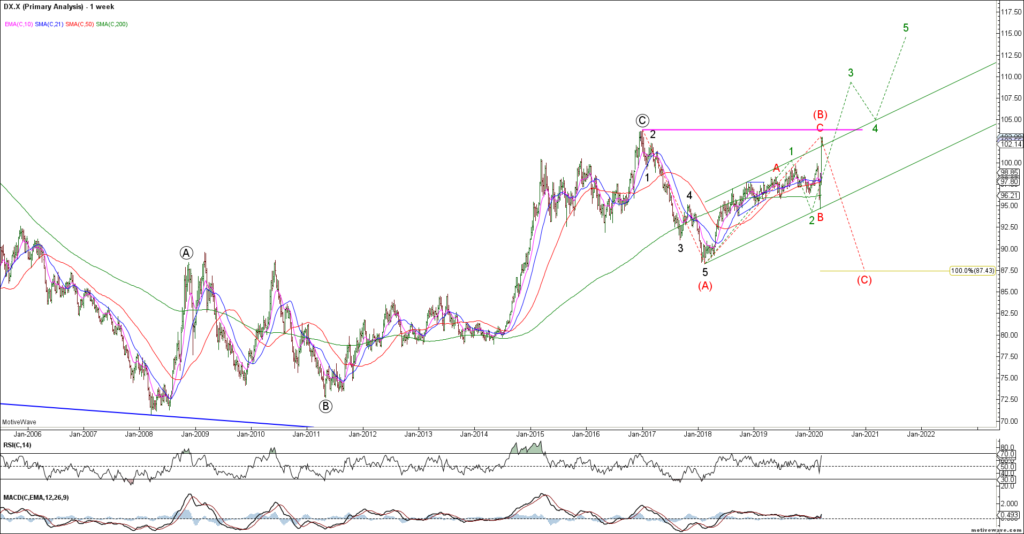
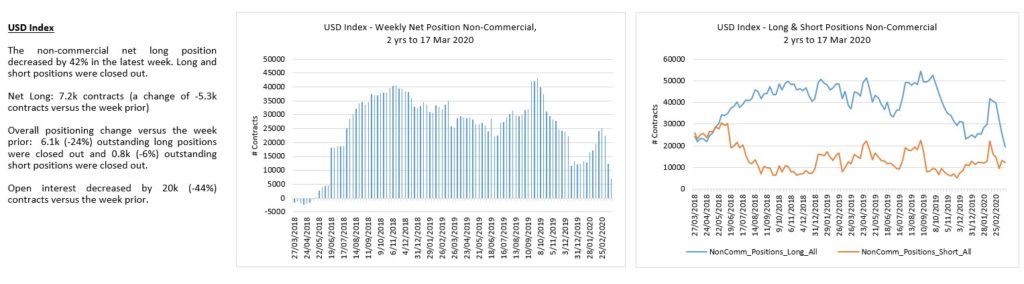
To the FX markets and the US dollar is at a key inflection point across many crosses. The DXY broke higher above 100 as warned and is now testing major cycle highs. The US government will try to weaken the dollar so we should expect extraordinary measures to do so. Resistance is resistance until broken and the wave count is binary here. Bullish green count on a strong close above 104 likely sees a wave 3 extension higher. The red bear count sees an impulsive rejection of major swing highs.
DXY Weekly
DXY traders cut longs and shorts amid the volatility.
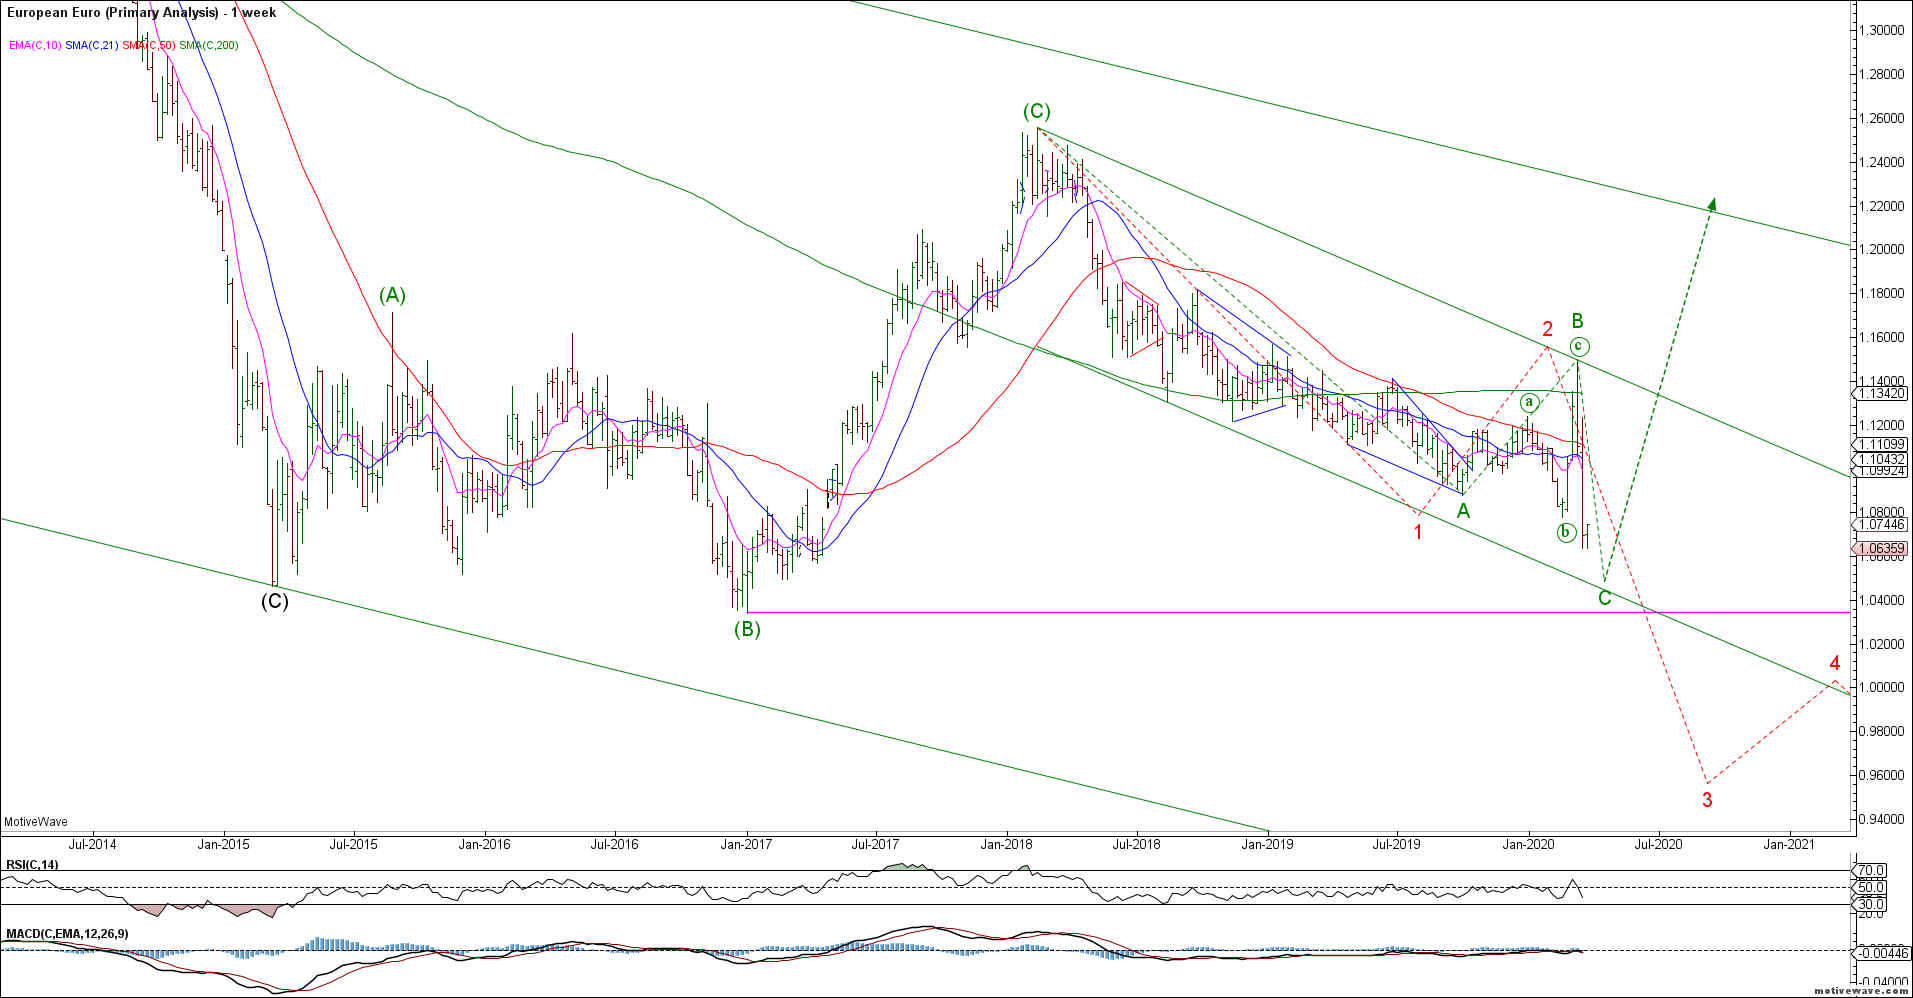
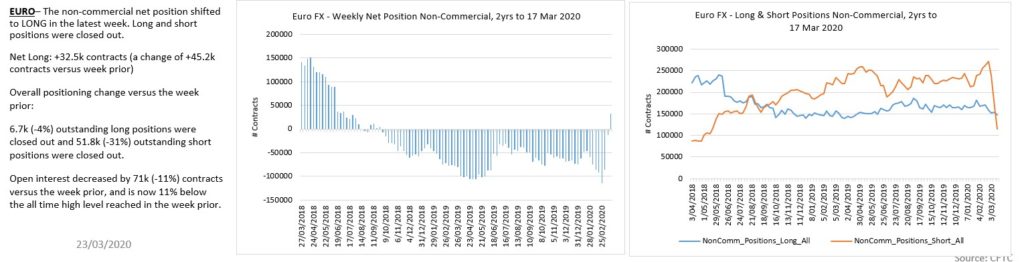
The Euro also broke near term support and is now testing major support (key inflection point). If support breaks it likely trades through 1.00 towards 0.95 but support is support until broken. Too much 2-way risk for me as we could break either way. If in doubt, stay out and let the market confirm.
EURUSD Weekly
Euro traders have been whipsawed over the last week.
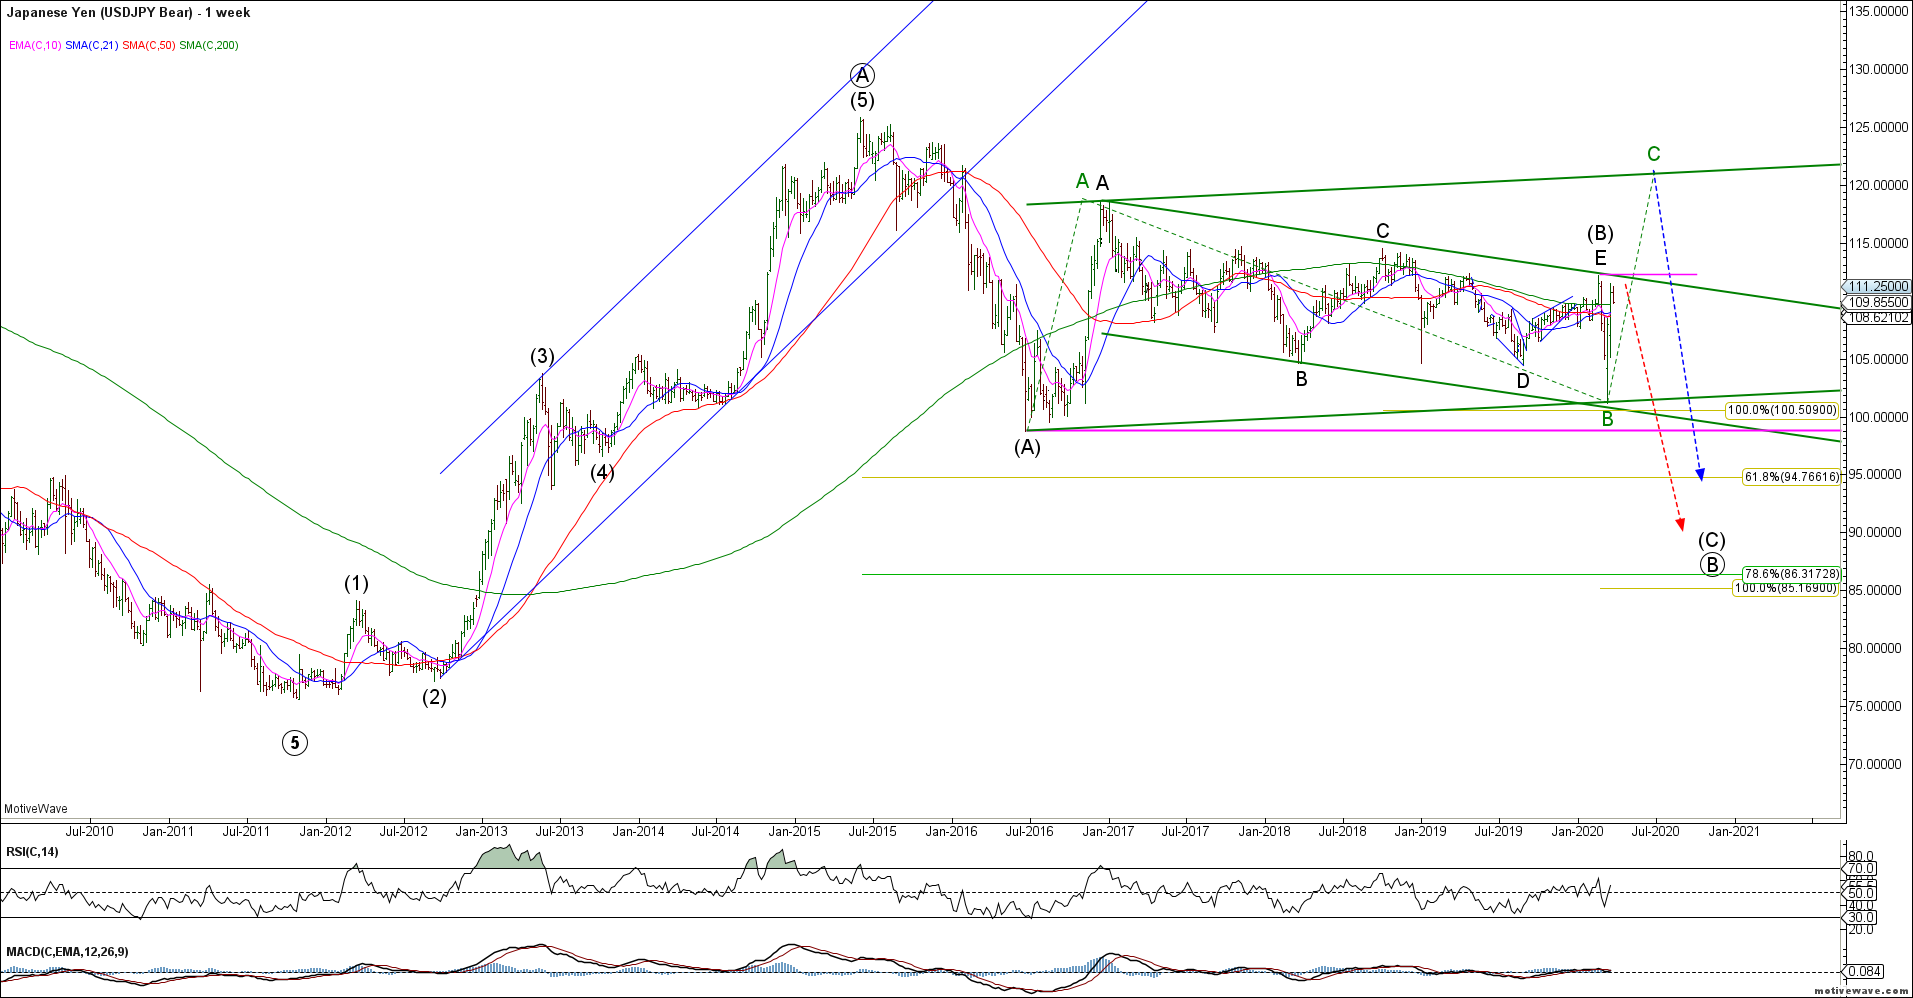
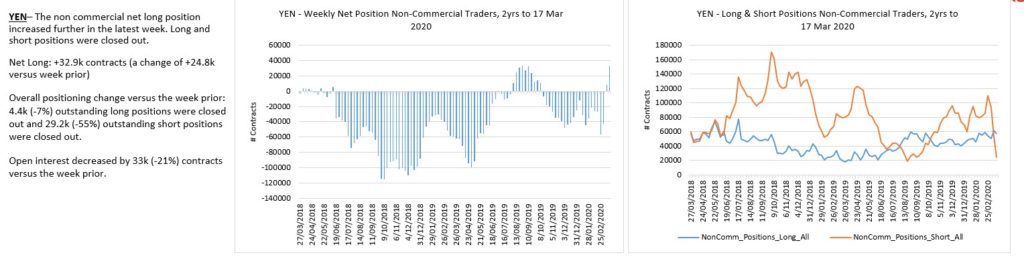
The USDJPY continued to push higher above near term resistance and is retesting key swing highs for the triangle bear count. Trade above 112.30 opens the door towards 120 on a continued US$ rally. Key inflection for the dollar here against the Yen and it is unclear which way it breaks. Not trading this until I get confirmation either way.
USDJPY Weekly
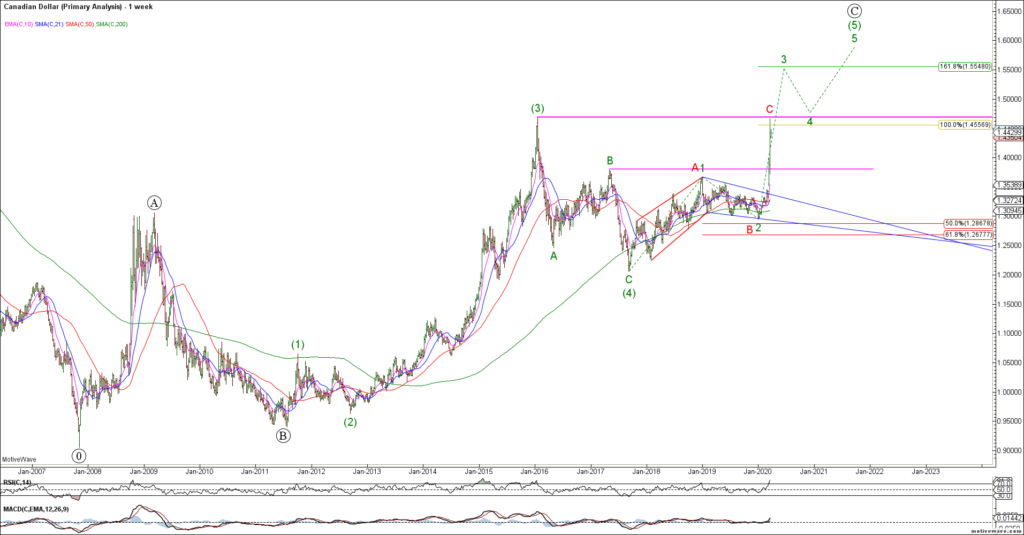
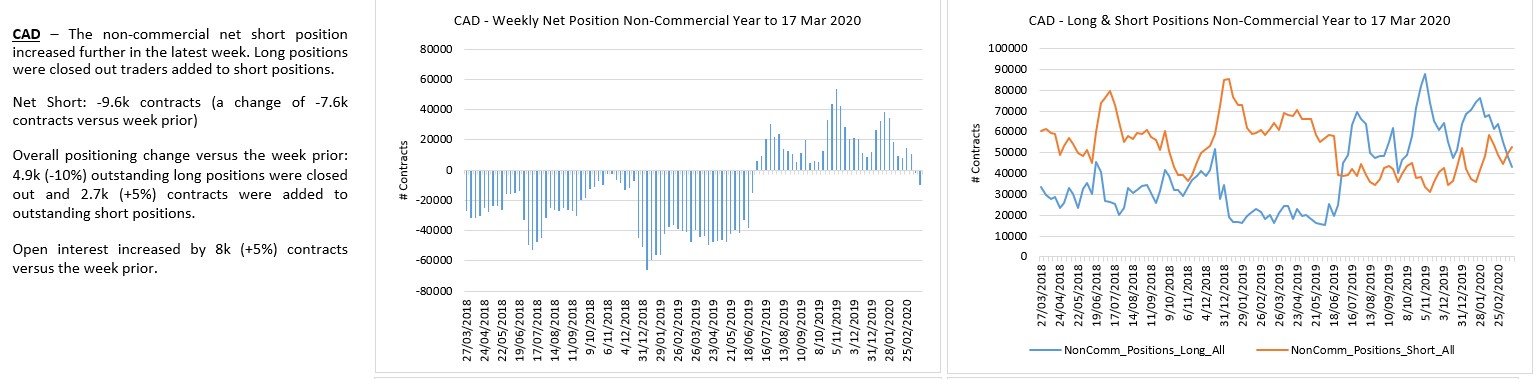
The USDCAD also tagged major resistance last week, a key inflection point for the dollar.
USDCAD Weekly
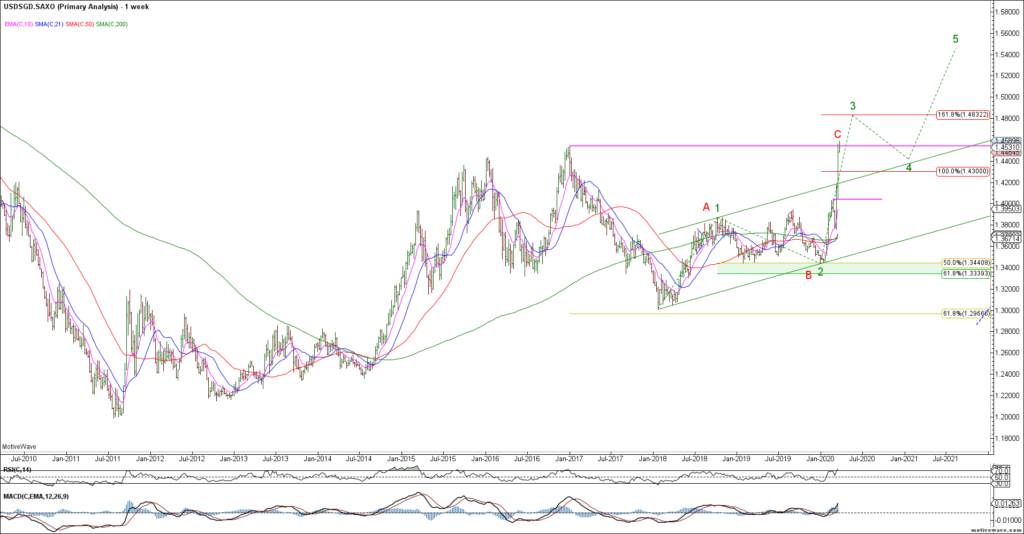
The USDSGD met our measured targets and is trying to break through major swing highs. Reverse or continuation? We can make a case for both scenarios but risky either way.
USDSGD Weekly
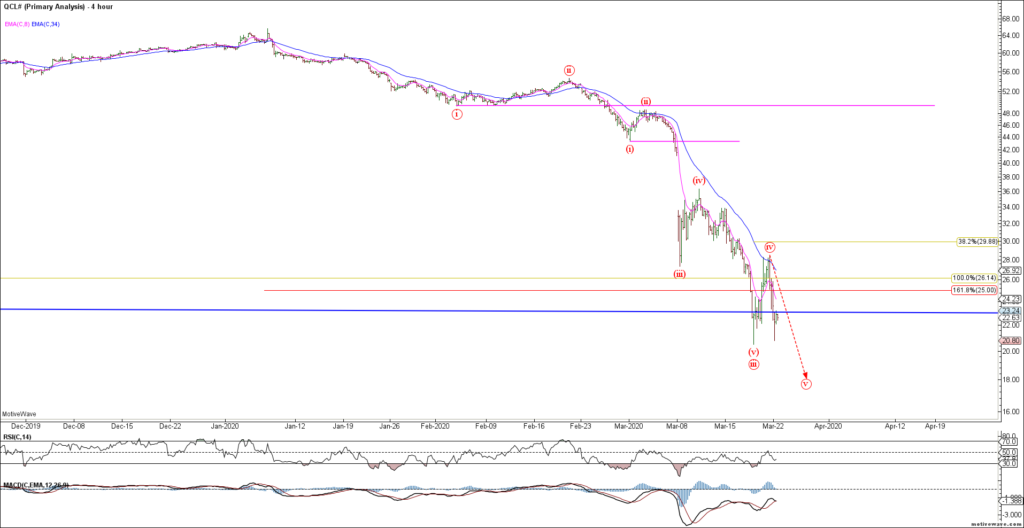
To the commodity markets and CL is retesting swing lows after bouncing last week for what was likely a wave (iv). Ideally, we’d like to see a push to new cycle lows to complete wave (v) followed by a bullish reversal. We are approaching near term trend exhaustion in Crude as we look for a final flush and bullish reversal.
CL H4
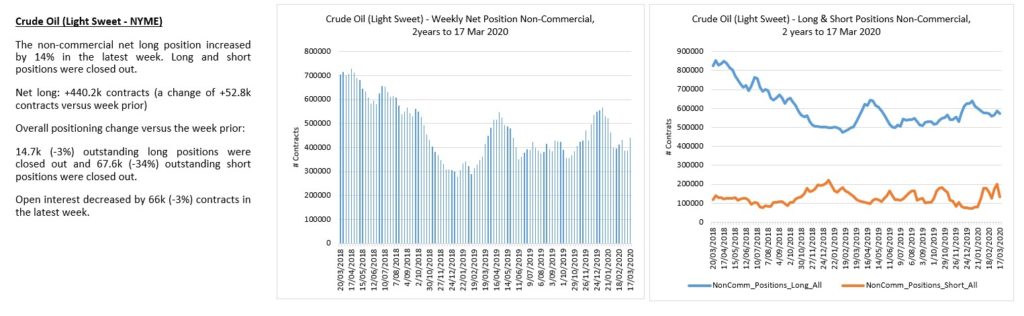
Crude traders remain too long despite the recent severe decline.
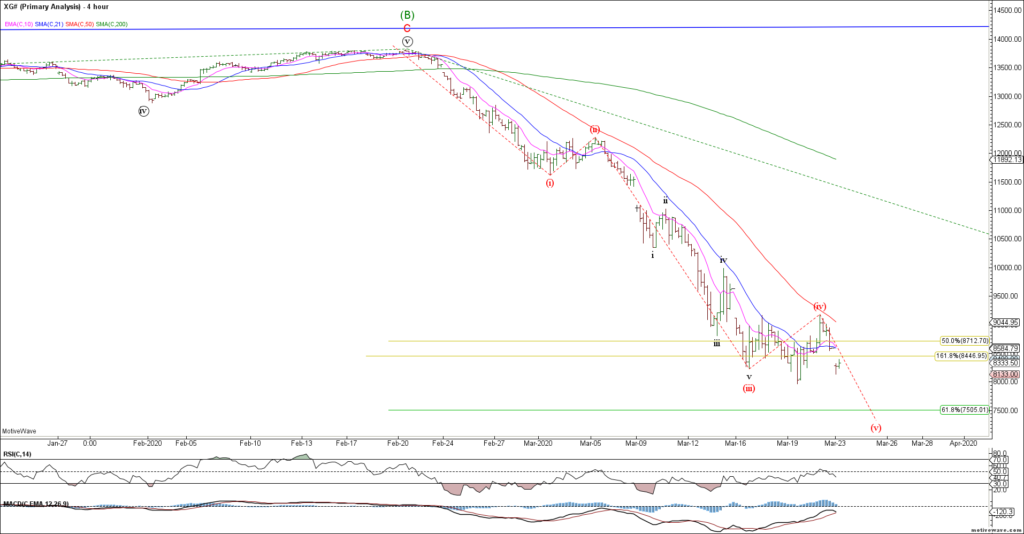
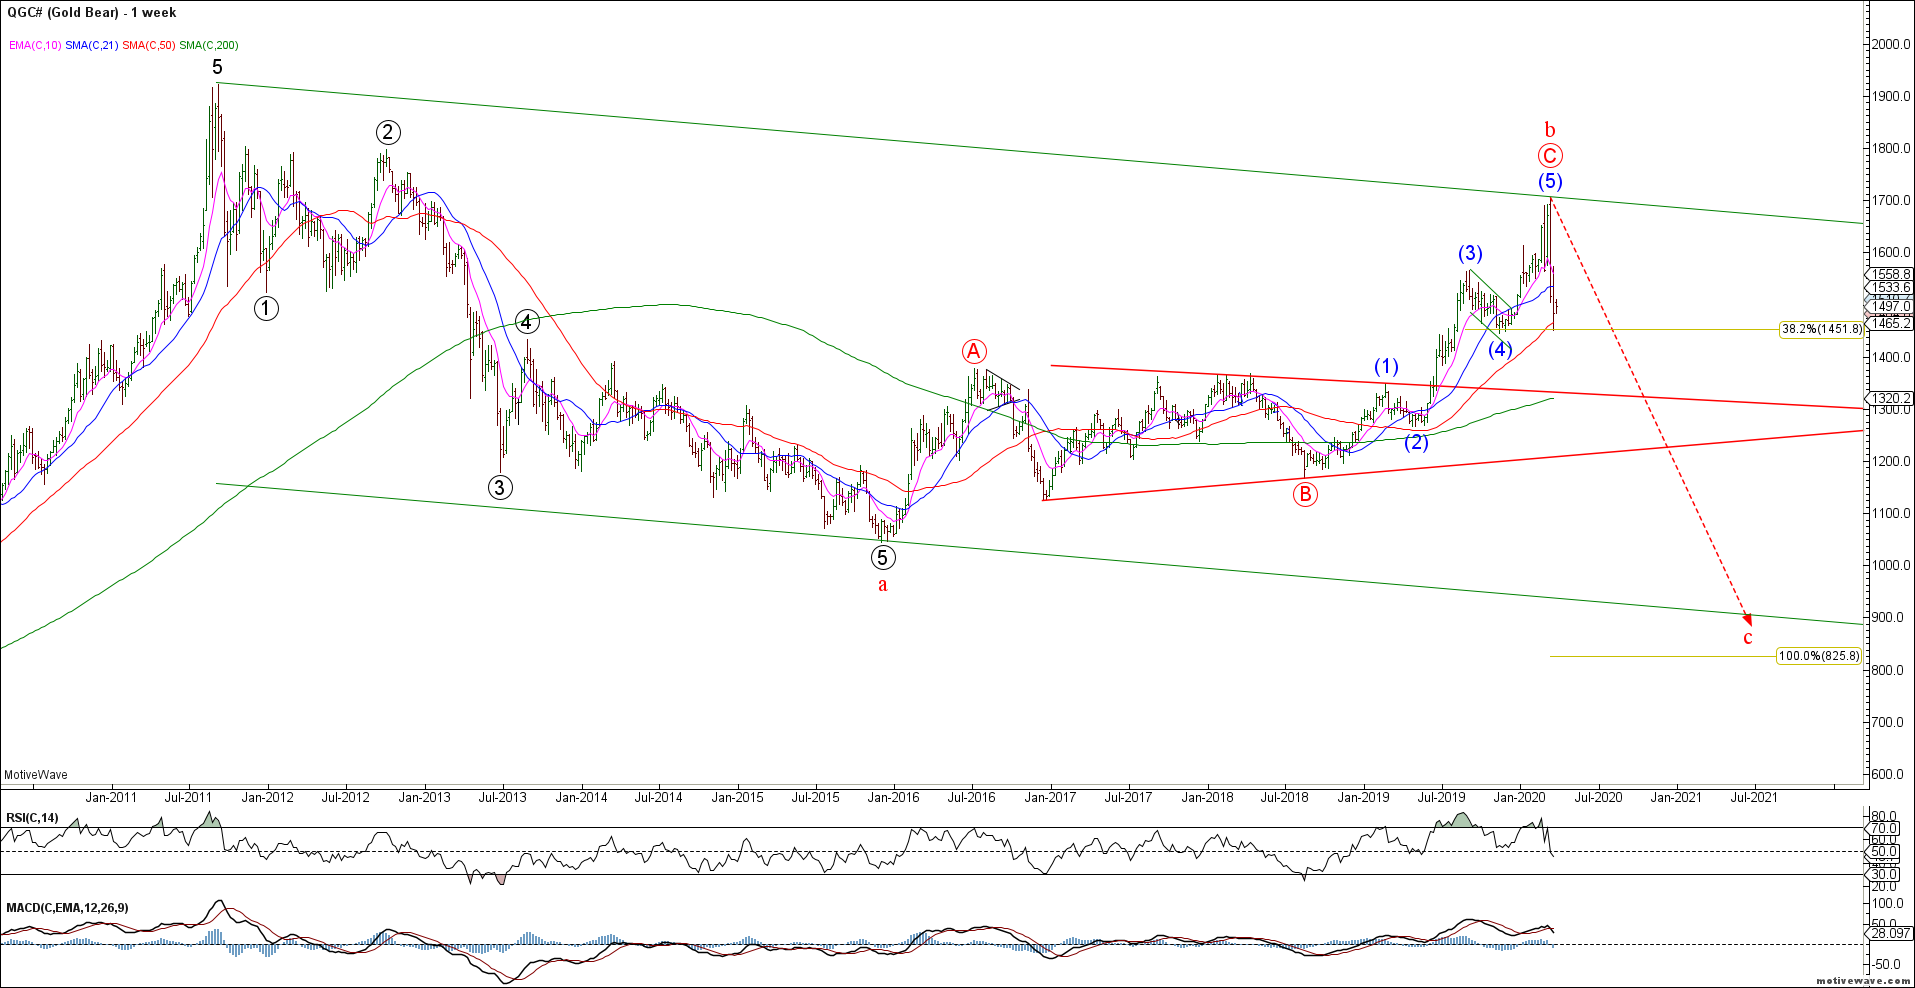
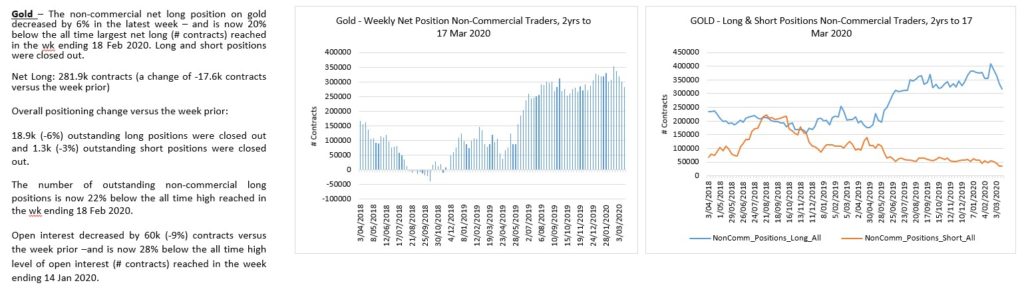
Gold consolidated above support last week after declining impulsively from recent swing highs. The bigger picture structure remains bearish but needs to break 1440 to help confirm the break lower.
Gold Weekly
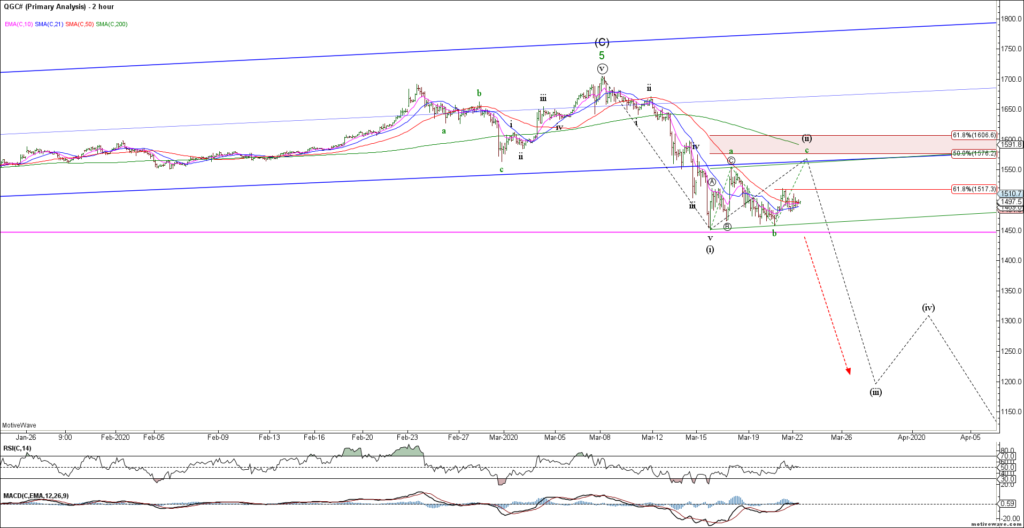
Near term, Gold declined impulsively into shelf support from where we have seem a corrective rally. A close below 1440 likely triggers the next wave lower, either directly or after another rally towards 1575-1600 resistance.
Gold H2
Gold traders are starting to pare back longs.
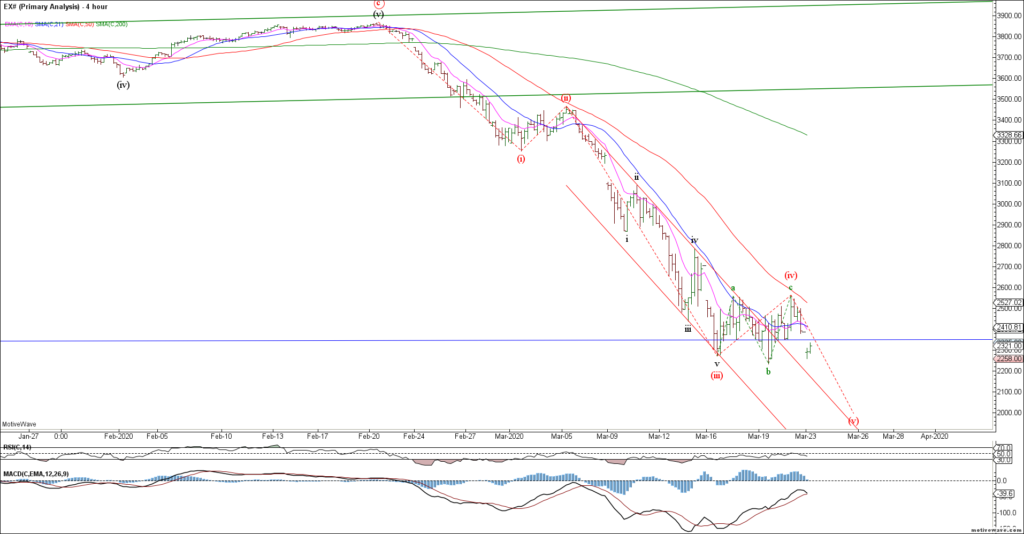
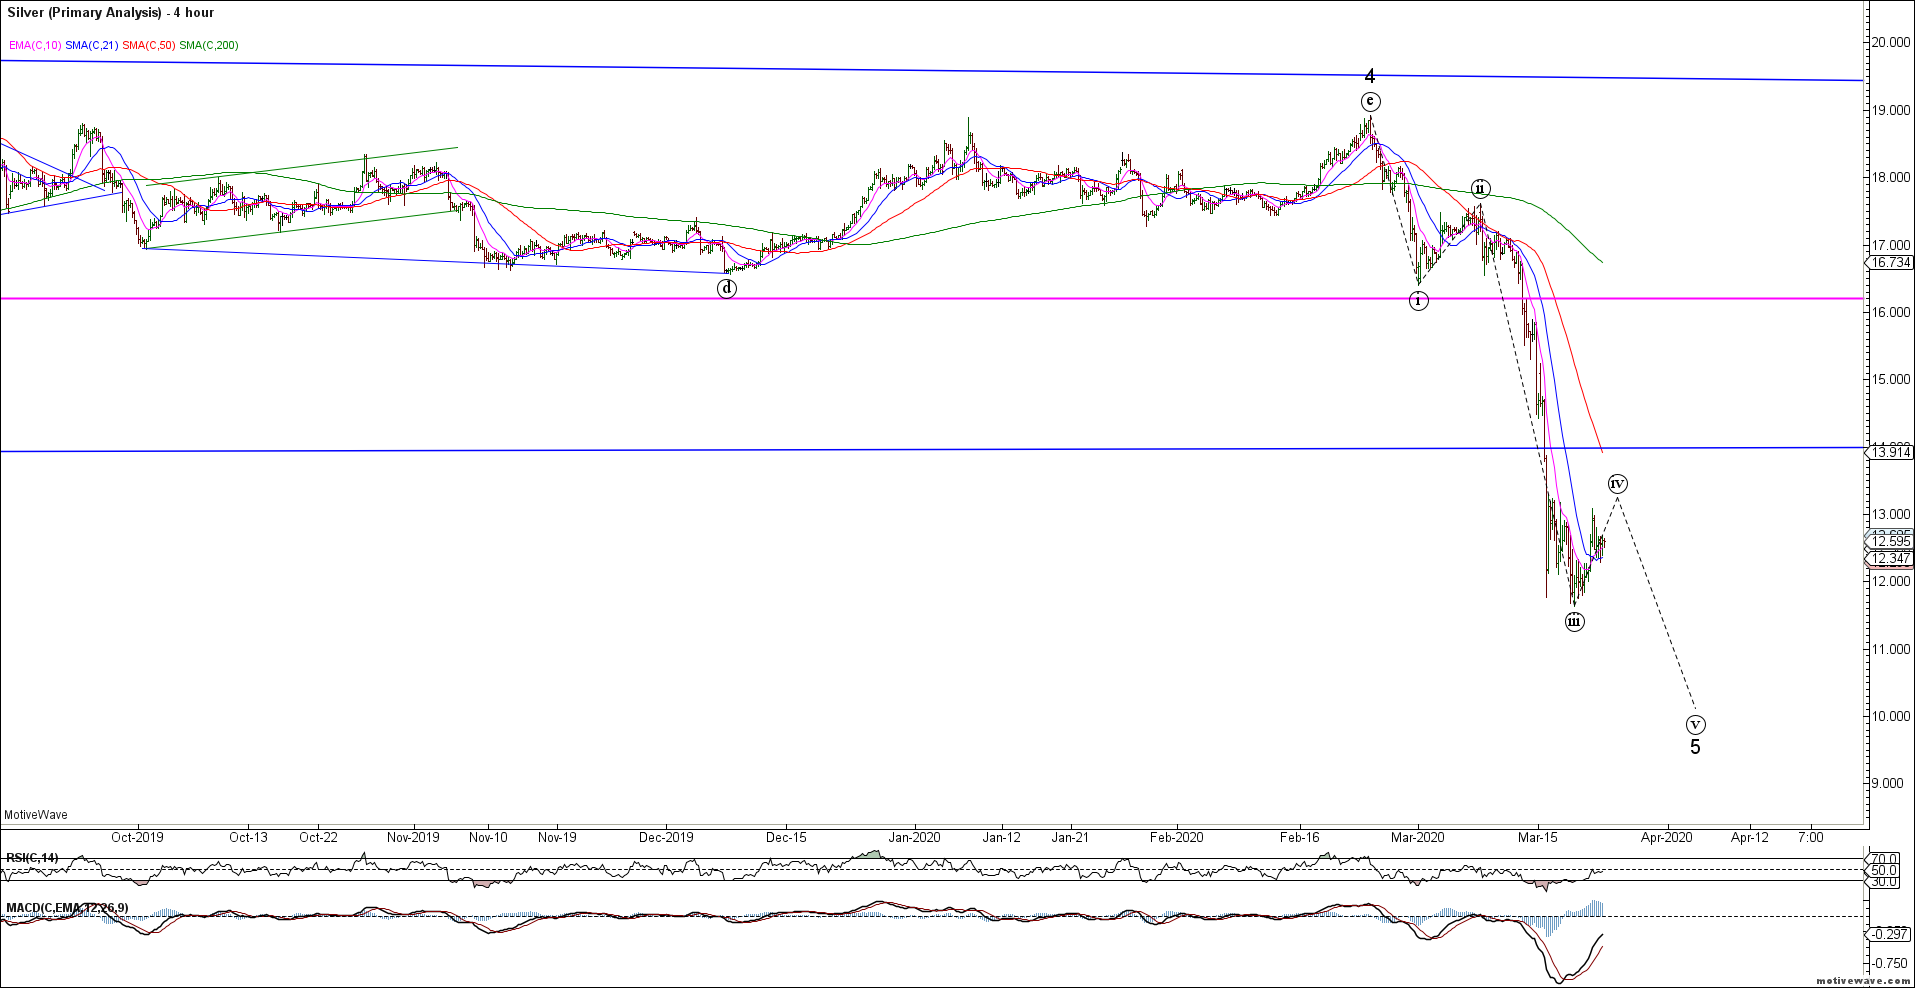
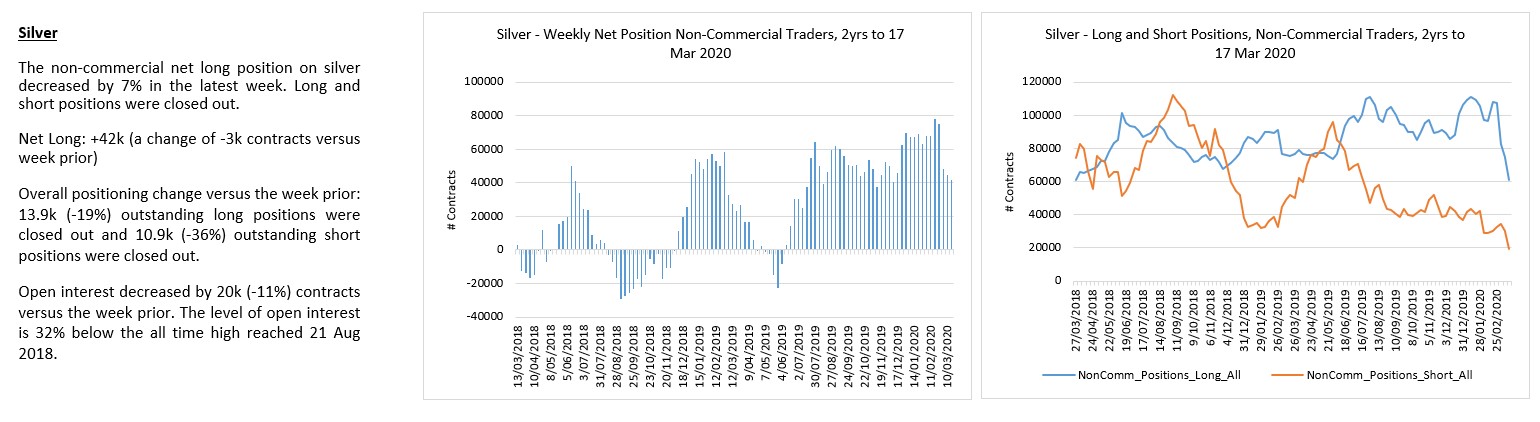
Silver remains bearish and would look best with a wave (v) decline to new cycle lows.
Disruptions to financial markets continued last week. Central banks have responded with emergency rate cuts and further measures to ease financial conditions. The RBNZ cut rates by 75bps to +0.25% and the US Federal Reserve cut rates by 100bps to 0-0.25% ahead of its scheduled meeting this week.
The US Fed
announced a range of further significant policy easing measures on 15 Mar
(details included in this briefing document), including the coordinated Central
Bank action to “enhance the provision of liquidity via the standing US dollar
swap line arrangements”.
Although the RBA cut its benchmark rate two weeks ago, further liquidity measures were announced today (16 Mar) – https://www.rba.gov.au/media-releases/2020/mr-20-07.html. This includes the purchase of AU bonds in the secondary market and standing repo operations. The statement indicates that further policy measures will be announced during the week on 19 Mar. This is likely to include a further reduction in the overnight cash rate to 0.25% and possible details of a QE program. The Aus government has also indicated that further fiscal stimulus is to be announced shortly.
Data out of
China early this week indicates significant declines across retail sales,
industrial production and fixed asset investment over the Jan-Feb period.
Data of note this week; US retail sales (Feb), regional
manufacturing data (Mar) and US industrial production – we will include a special
focus on US initial jobless claims and weekly mortgage applications data.
Labour market reports from Aus and the UK will also be in
focus this week.
The supply of US Treasuries settling this week will be heavier.
The US Treasury will settle approx. $246bn in ST Bills, Notes and Bonds this
week, raising approx. $57.3bn in new money.
This will be supported with significant increases in repo operations each week, as well as purchases of Treasury securities by the Fed. At this stage, there has been no forward schedule released for the planned purchases of securities. Purchase details this will be released daily on the NY Fed website. On Mon 16 Mar, the Desk at the NY Fed will purchase approx. $40bn in Treasuries. On 13 Mar, the Desk at the NY Fed purchased approx. $37bn in securities.
More detail, including a one-page calendar of key data releases for the week, is provided in the briefing document – download the file here;