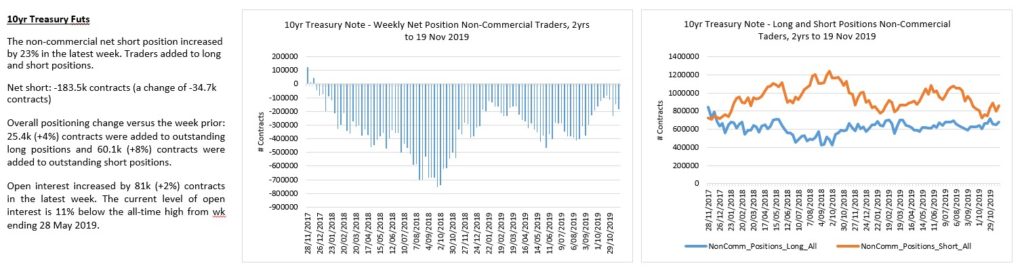
The weekly macro review for w/c 18 November 2019 – The FOMC minutes confirmed a more “wait and see” mode, allowing some time for policy rate changes to flow through to the economy. Guidance was also changed to reflect more focus on incoming data. It was noted in the minutes that the rate cut in Oct was an insurance against ongoing, downsides risks. In particular, the FOMC is concerned that weakness across manufacturing, energy, agriculture and weaker external growth could spill over into the labour market.
Other
points of interest from the FOMC minutes;
Still seeing
pressure in the repo market for year end. There have already been several announcements
since the meeting – mostly to increase size of the Fed repo facility. Still
possible that further measures will be taken to cope with year-end pressure.
The minutes
also included a discussion of policy options in the case of rates reaching the
effective lower bound. Negative rates were discussed at length as a part of the
policy options;
“…participants did not rule out the possibility that circumstances could arise in which it might be appropriate to reassess the potential role of negative interest rates as a policy tool.”FOMC Minutes 29-30 Oct 2019
The PMI’s
at a composite level – overall better view of US activity in Nov with output growth
increasing. Eurozone output growth was stagnant in Nov. Output growth in Germany
was still declining. Japan output growth was stagnant in Nov. UK output declined
in Nov. Australian output shifted into decline in Nov.
US – While
the PMI’s were somewhat improved, optimism regarding output growth in the next
12-months across both services and manufacturing was lower. Manufacturing activity
improved in the Philly Fed report, but Kansas City Fed manufacturing activity remained
in contraction.
US existing
home sales are still improving but are yet to exceed the late-2017 cycle highs.
Growth in housing permits likely positive for future construction activity.
The prelim PMI’s
across the Eurozone remained weak. The manufacturing decline abated slightly,
but services activity slowed further.
In Germany,
the composite index of output indicated a weaker pace of decline in Nov.
Services output growth continued to slow while the decline in manufacturing
output also slowed. Despite
most measures remaining weaker, optimism lifted for the first time in four
months.
Japan PMI’s
rebounded slightly – remaining mostly stagnant at the composite level. Services
activity rebounded slightly, and optimism lifted. Manufacturing activity
declined at a slower pace, but measures of demand continued to decline. Sentiment
lifted.
The Japanese
trade data for Oct was weak and the underlying detail was negative. Declines
in exports and imports in value terms were matched by declines in volume terms
(where that detail is provided) and declines were recorded across key customers/markets.
A large portion of the decline in imports versus a year ago is related to
petroleum, but again, other key imports were down in value and volume terms.
Core CPI growth in Japan accelerated slightly in Oct as the
increase in the consumption tax was implemented.
UK PMIs continue
to be heavily influenced by the Brexit process. At the composite level private
sector output declined at the fastest pace since Jul 2016 – led by declines in services
and manufacturing output.
Australian
PMIs deteriorated with both services and manufacturing output shifting into
contraction. Underlying detail on demand was also negative. Bus sentiment declined.
RBA minutes highlighted that consideration had been given to a further cut in rates at the Nov meeting. Instead, the RBA had opted to ‘wait and assess’ based on having “already delivered sizeable monetary stimulus over the last several months”. The overall assessment of the economy was downbeat.
There are more data releases covered in last weeks review. Use the links on the contents page to navigate to different country sections. Download the review here;
The outlook for w/c 25 November 2019 – This will be a shorter week for US markets with the Thanksgiving Holiday on Thu 28 Nov. Happy holidays to those celebrating this week!
Despite the shorter
week, there will still be relatively moderate data flow in the US, Australia
and Japan.
It will be mostly quiet on the central bank front with speeches by US Fed Chairman Powell on Mon and RBA Governor Lowe on Tue.
Key US data highlights;
durable goods orders, PCE price index, 2nd prelim GDP for Q3, National
house prices and a range of regional manufacturing surveys.
Data in Australia
will focus on important construction activity and private sector capex for Q3 as
key inputs for the Q3 GDP release next week (4 Dec).
In Japan, retail
trade data will be released for Oct. Retail growth has accelerated in the
months leading up to the Oct consumption tax increase – and we’ll see the
degree to which the tax hike has impacted demand.
On the trade front, headline
risk remains high regarding the US-China trade negotiations, which are ongoing.
There was no
agreement reached last week within the US on the USMCA – frustrating efforts
for a vote before Thanksgiving.
It now appears that the US has missed the deadline to announce auto tariffs as a part of the S.232 National security investigation. It’s possible that this action may take another form and we’ll continue to monitor the US Federal register for announcements.
The phase one trade deal between the US and Japan passed the lower house of the Japanese parliament last week – now likely to be ratified by the end of the year.
US Treasury supply will be a little heavier, especially after the addition of a 16-day Cash Management Bill last week which will settle this week. This week, the US Treasury will settle approx. $219bn in ST bills, FRN’s and TIP’s raising approx. $43bn in new money.
More detail (including a calendar of key data releases) is provided in the briefing document – download the file here;
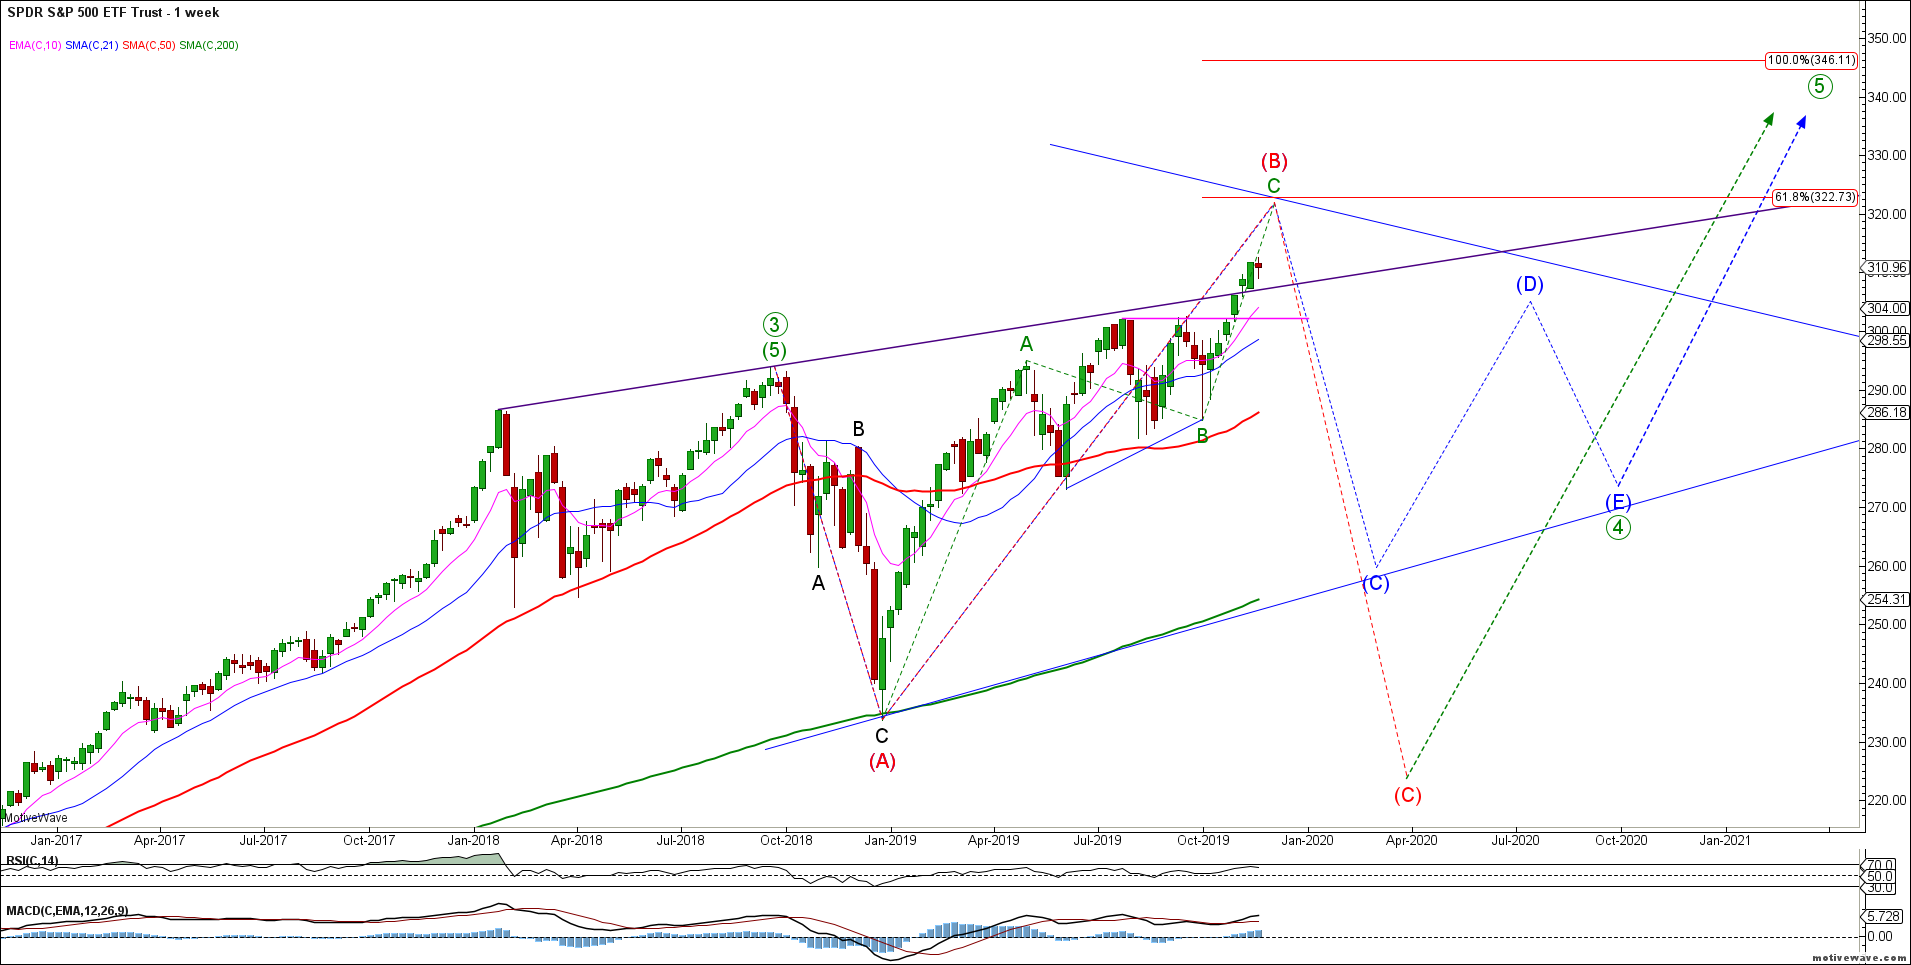
Last week, equities saw a corrective decline in what is likely a continued bullish impulse wave C of (B). Bonds continued to rally to complete an impulse up from recent swing lows. The US dollar refuses to roll over, calling into question the bearish count.
The big picture rally in SPX / ES appears in tact as wave C of (B) targets remain higher. Last week’s decline was corrective in this seasonally bullish period. We have no evidence of a tradable top in equities – the bulls remain in control.
SPY Weekly
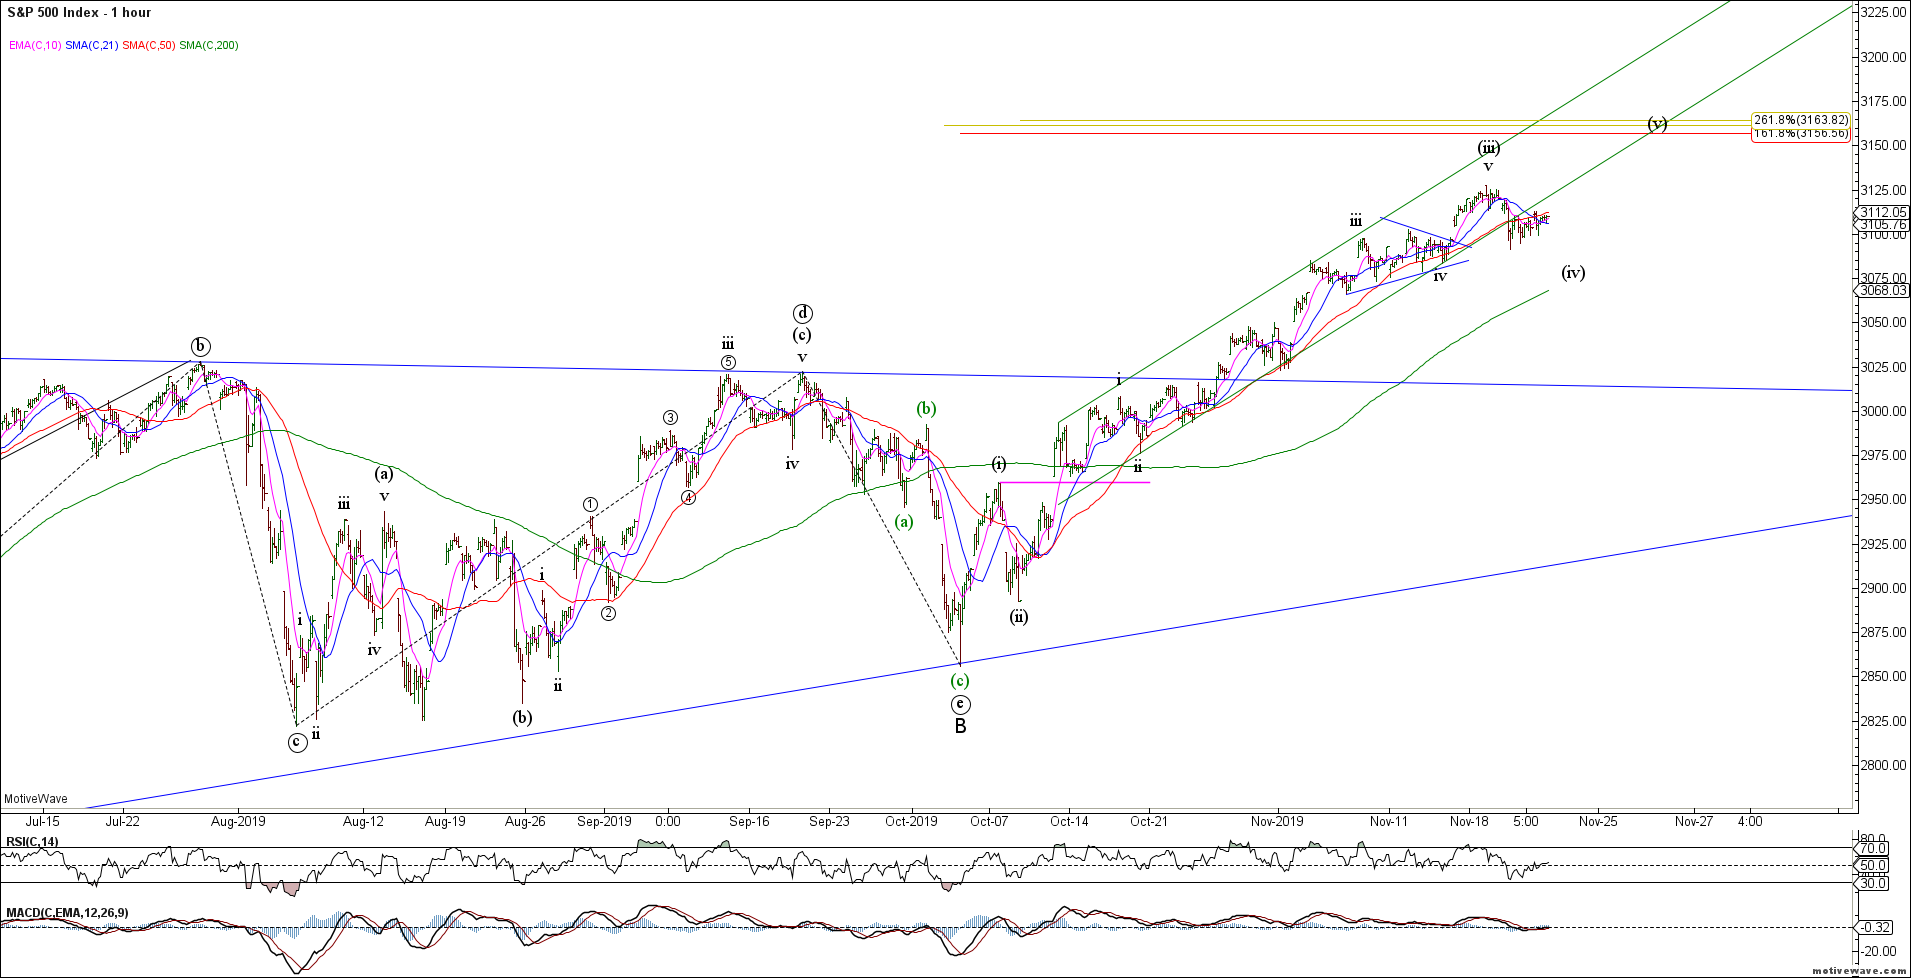
Last week’s decline in SPX / ES appears corrective for what is likely wave (iv) in an ongoing impulsive rally higher. Near term support resides in the 3075 area for the impulsive rally.
SPX H1
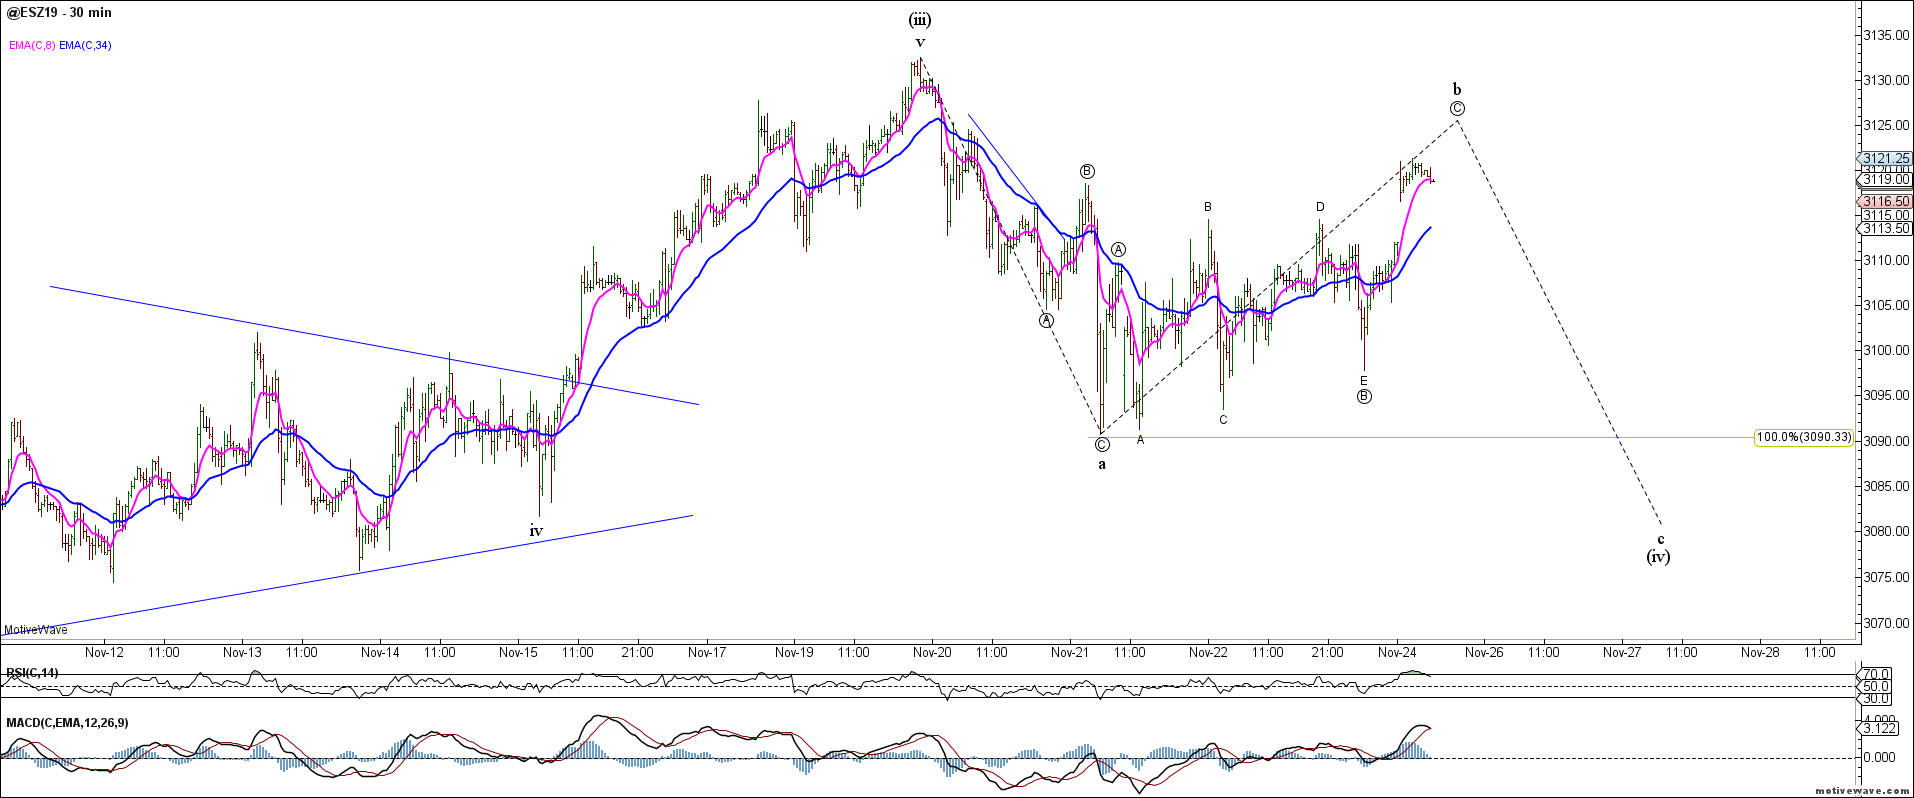
The very short term ES chart shows a corrective 3 waves down from recent swing highs. While the correction could be complete, it would look better with another wave c down to complete (iv).
ES 30m
ES traders remain flat and disinterested.
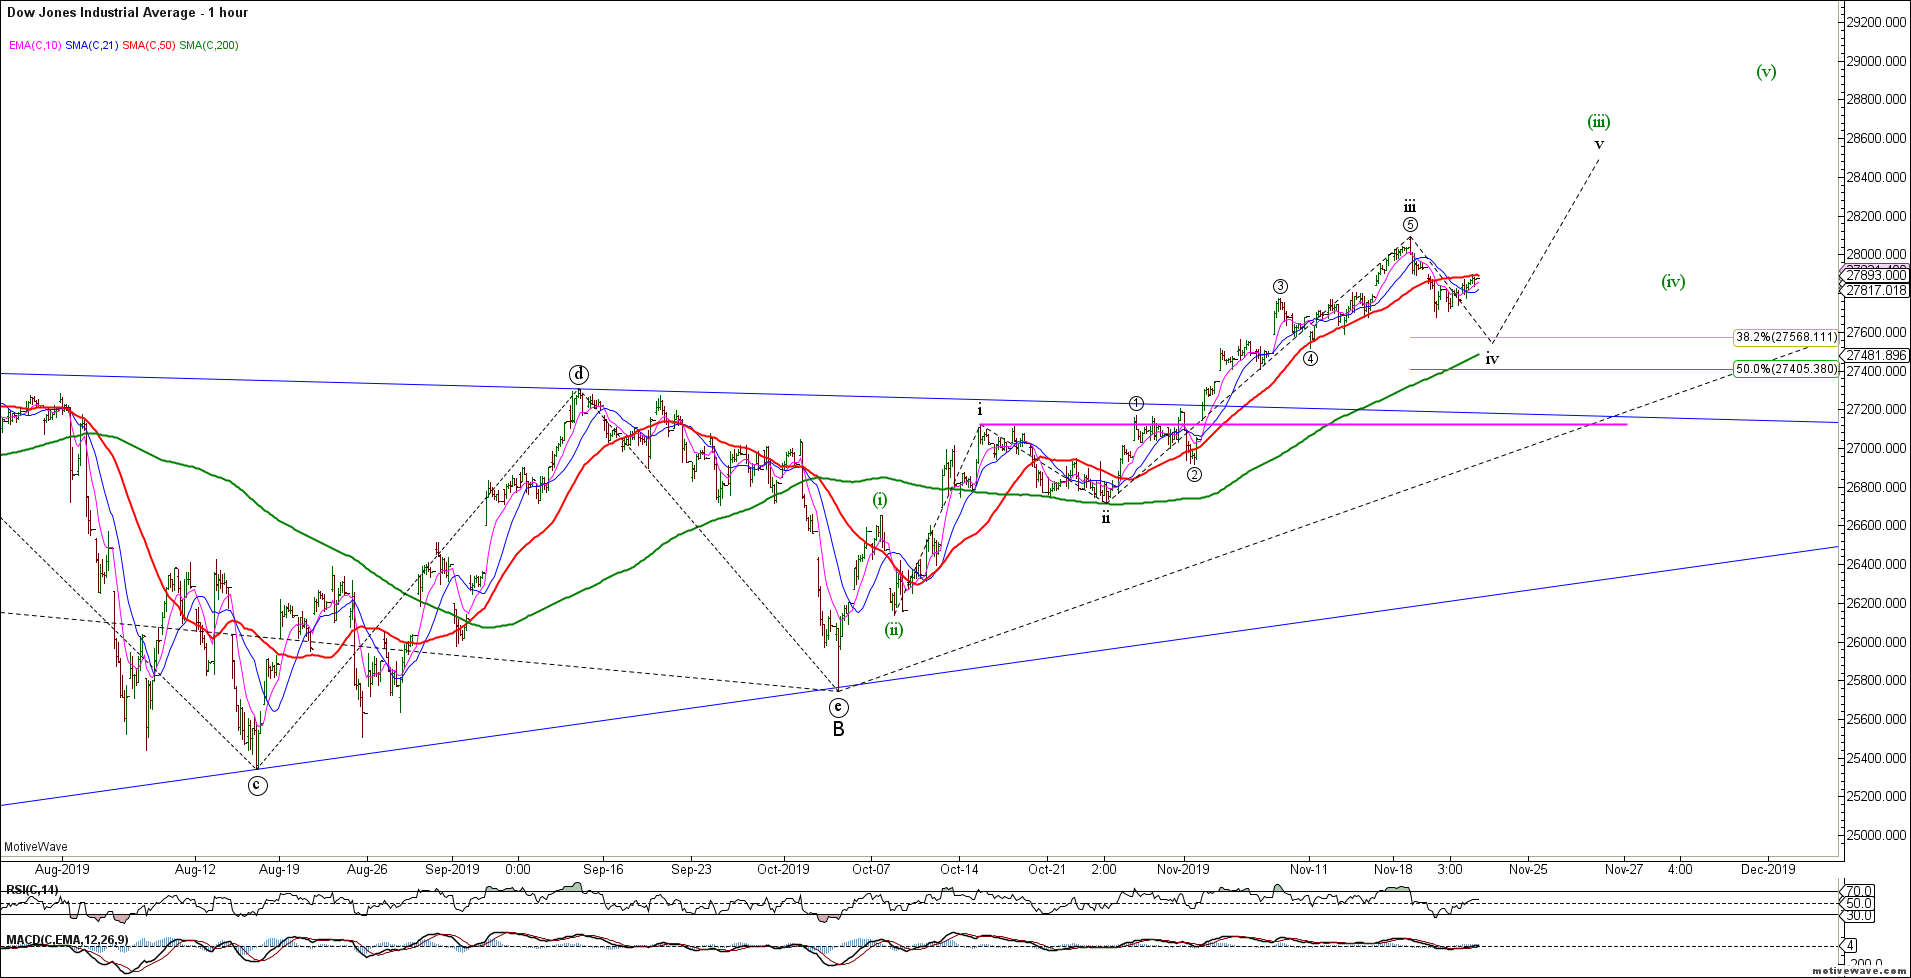
The DJIA appears to have completed a small degree wave iii in this ongoing impulsive rally. Near term support resides in the 27500 area for wave iv of (iii). Trade back below 27100 invalidates this nested bull count.
DJIA H1
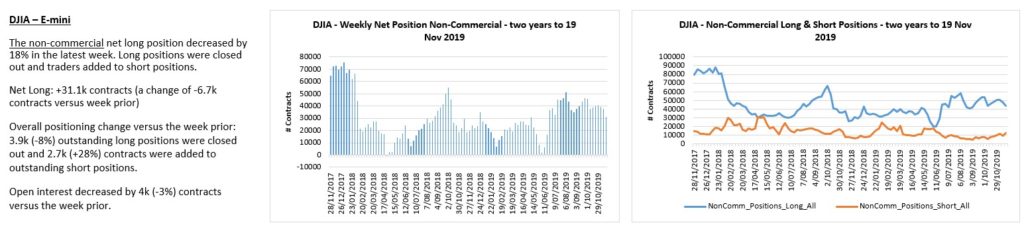
YM traders paring back longs and adding shorts.
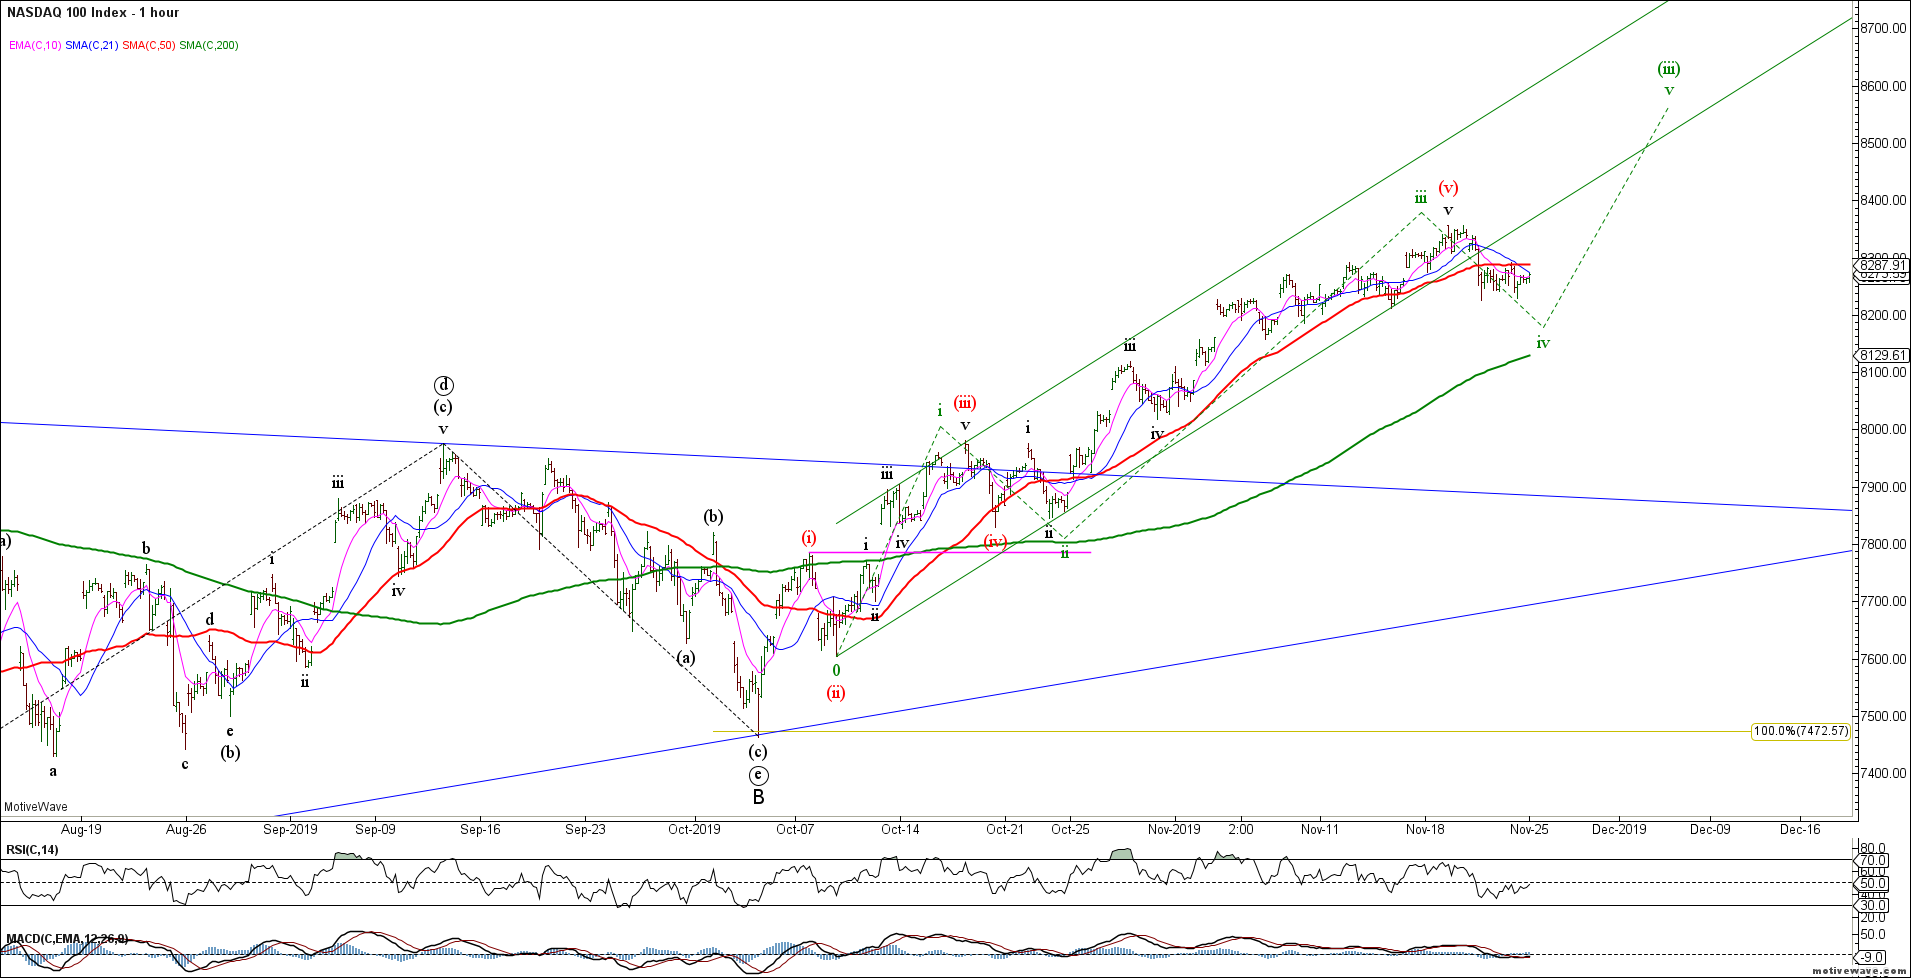
The Nasdaq also shows the potential for a completed wave (v) (red count) but more likely a wave (iv) correction in an ongoing bullish trend (green count). No reason to fight this bullish trend until we see evidence of a bearish reversal – not just a pause within a bullish trend.
NDX H1
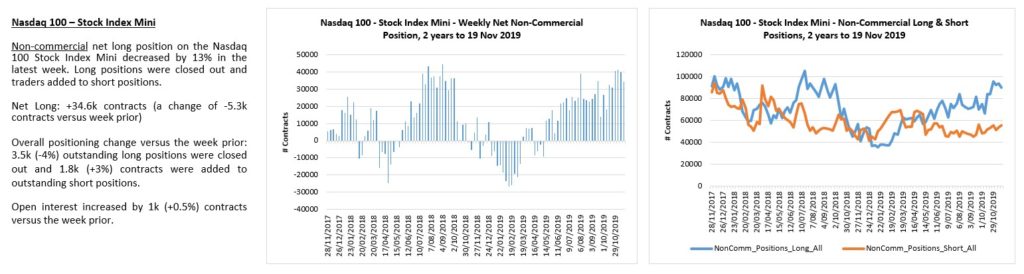
NQ traders paring back longs.
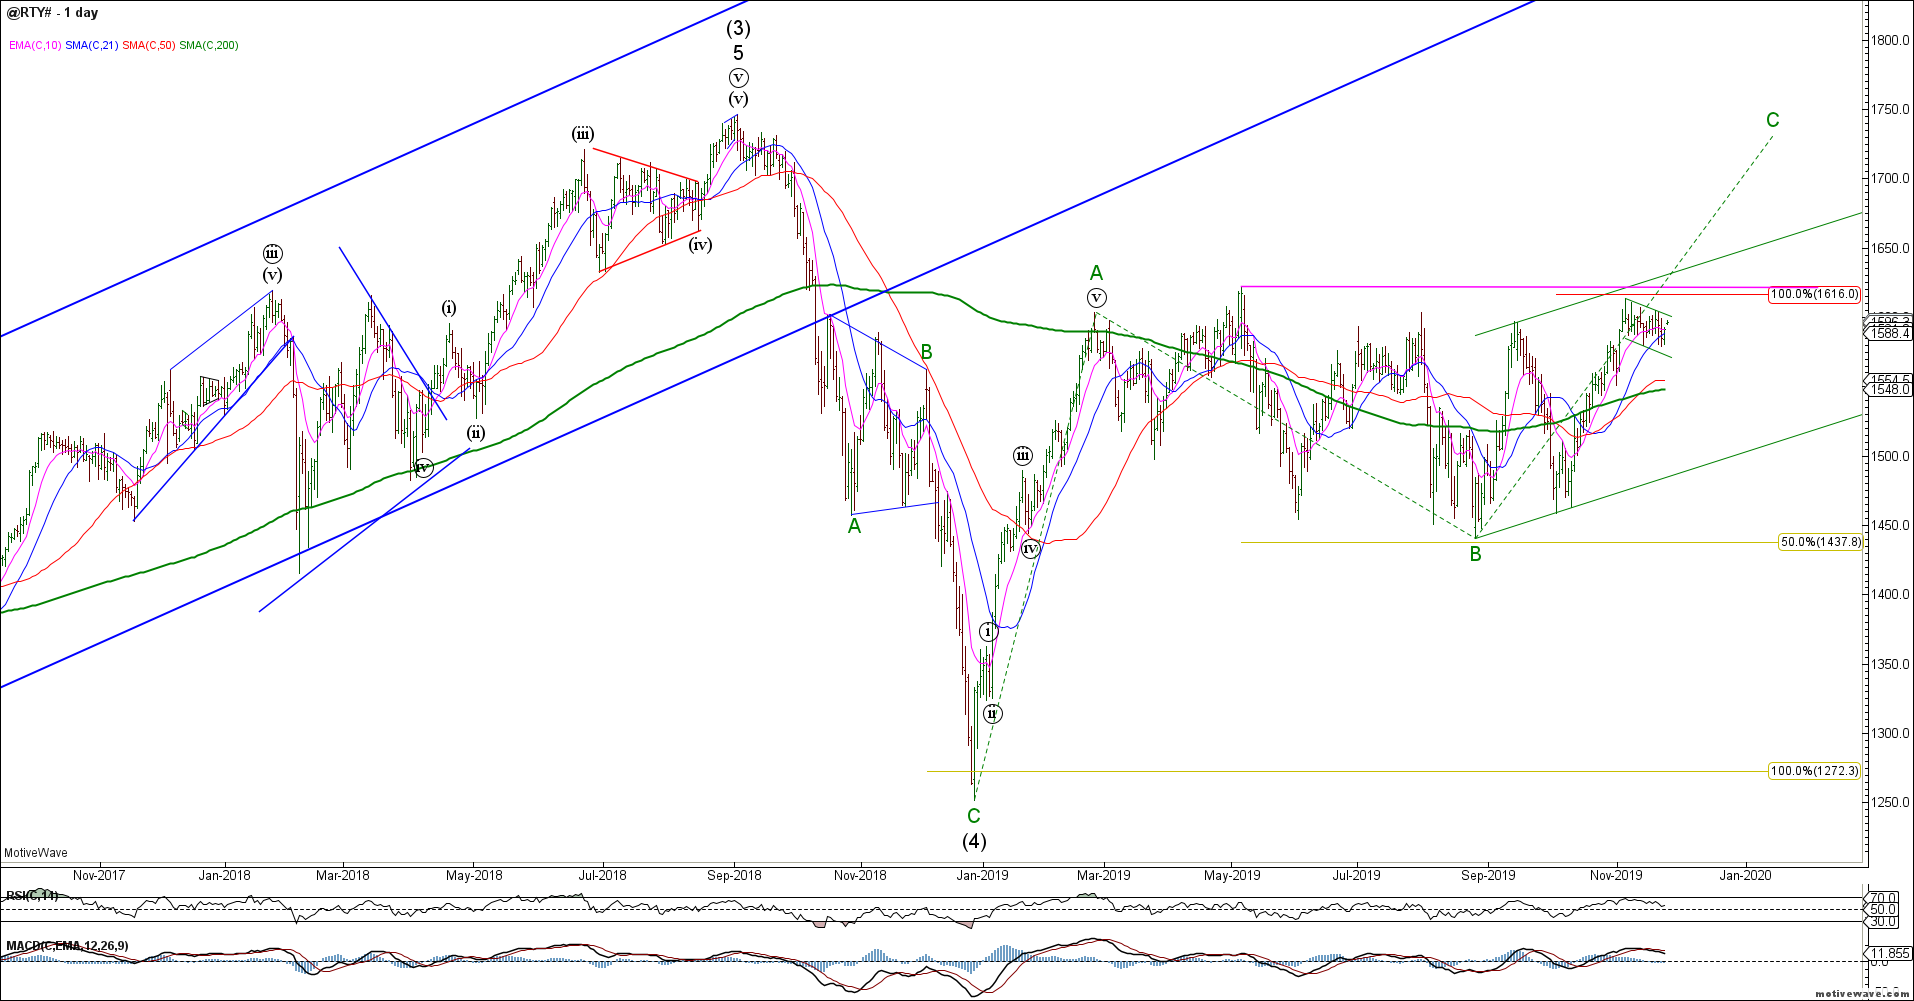
The Russell 2000 / RTY continues to trade sideways in what appears to be a bull flag prior to a range breakout. A strong close above 1616-25 resistance would likely trigger a chase higher for the small caps. In the meantime, resistance continues to hold.
RTY Daily
RTY traders are flat.
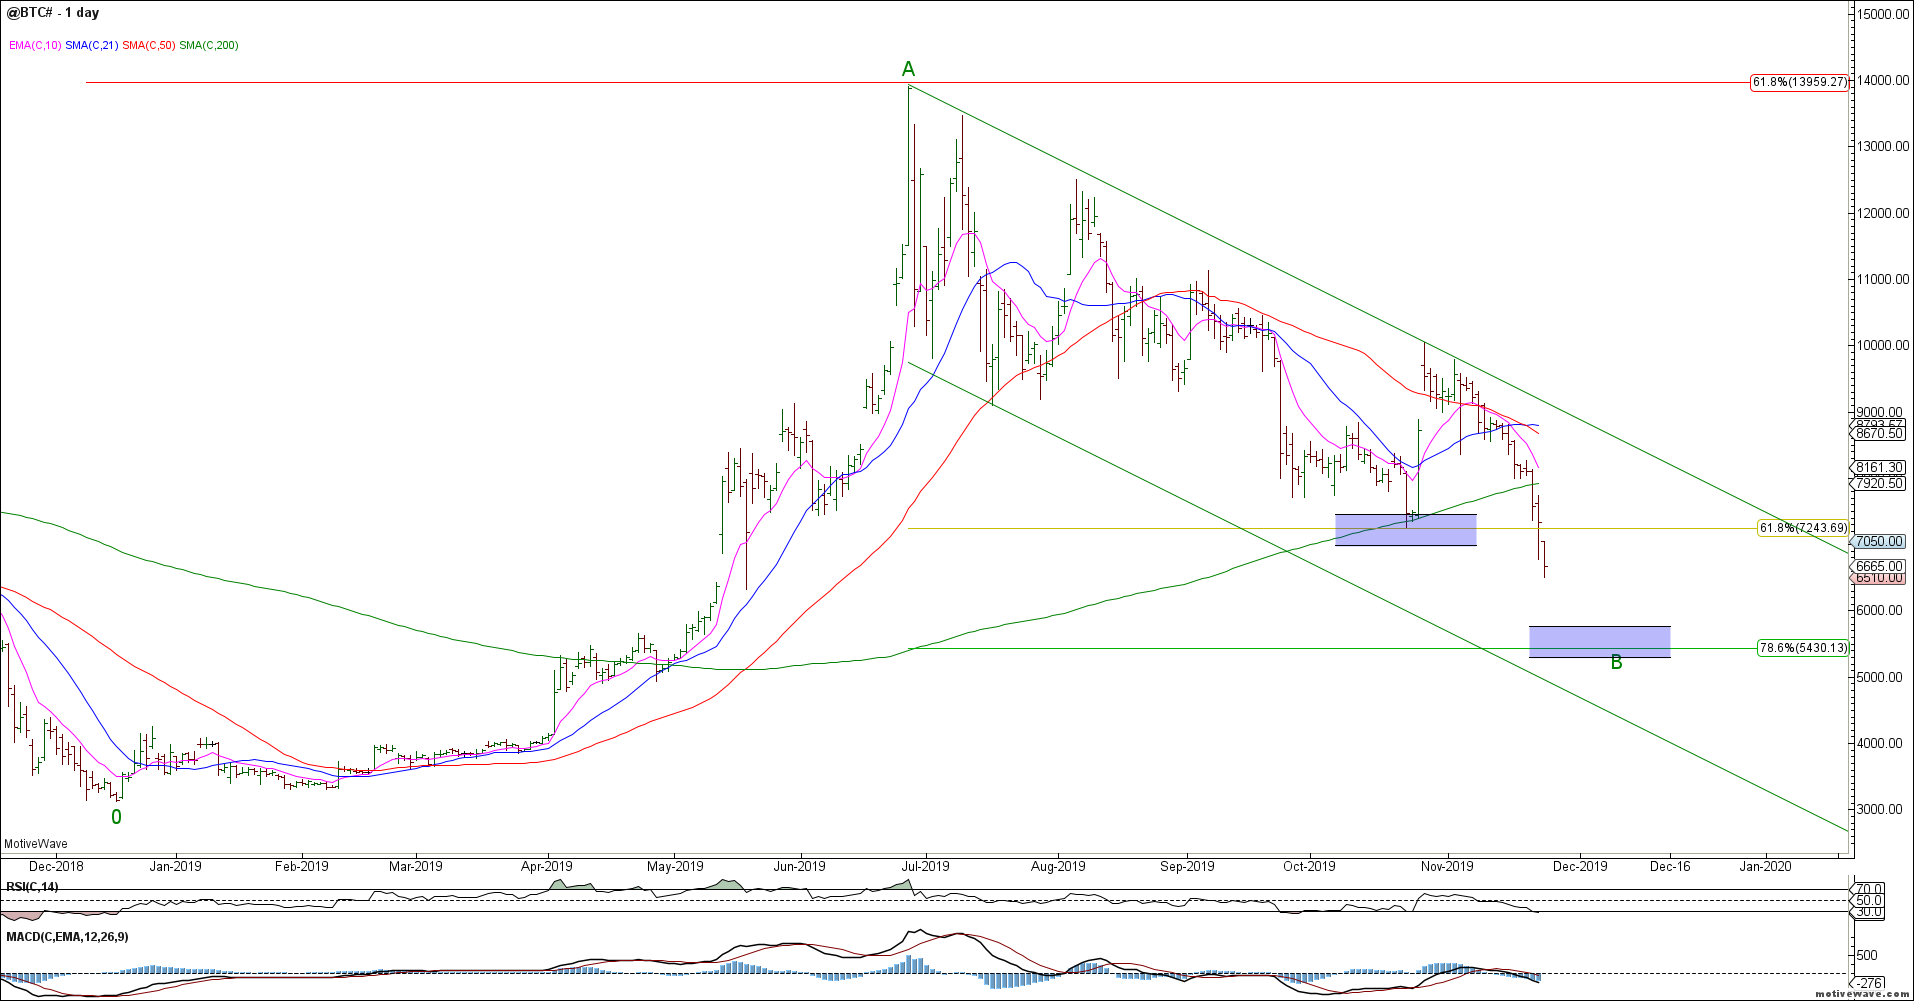
Bitcoin broke our Fib and 200 day sma support and puked lower. This decline invalidated our near term bullish count. We no longer have a clear corrective count for BTC but the next ideal downside support targets reside in the 5400 area.
BTC Daily
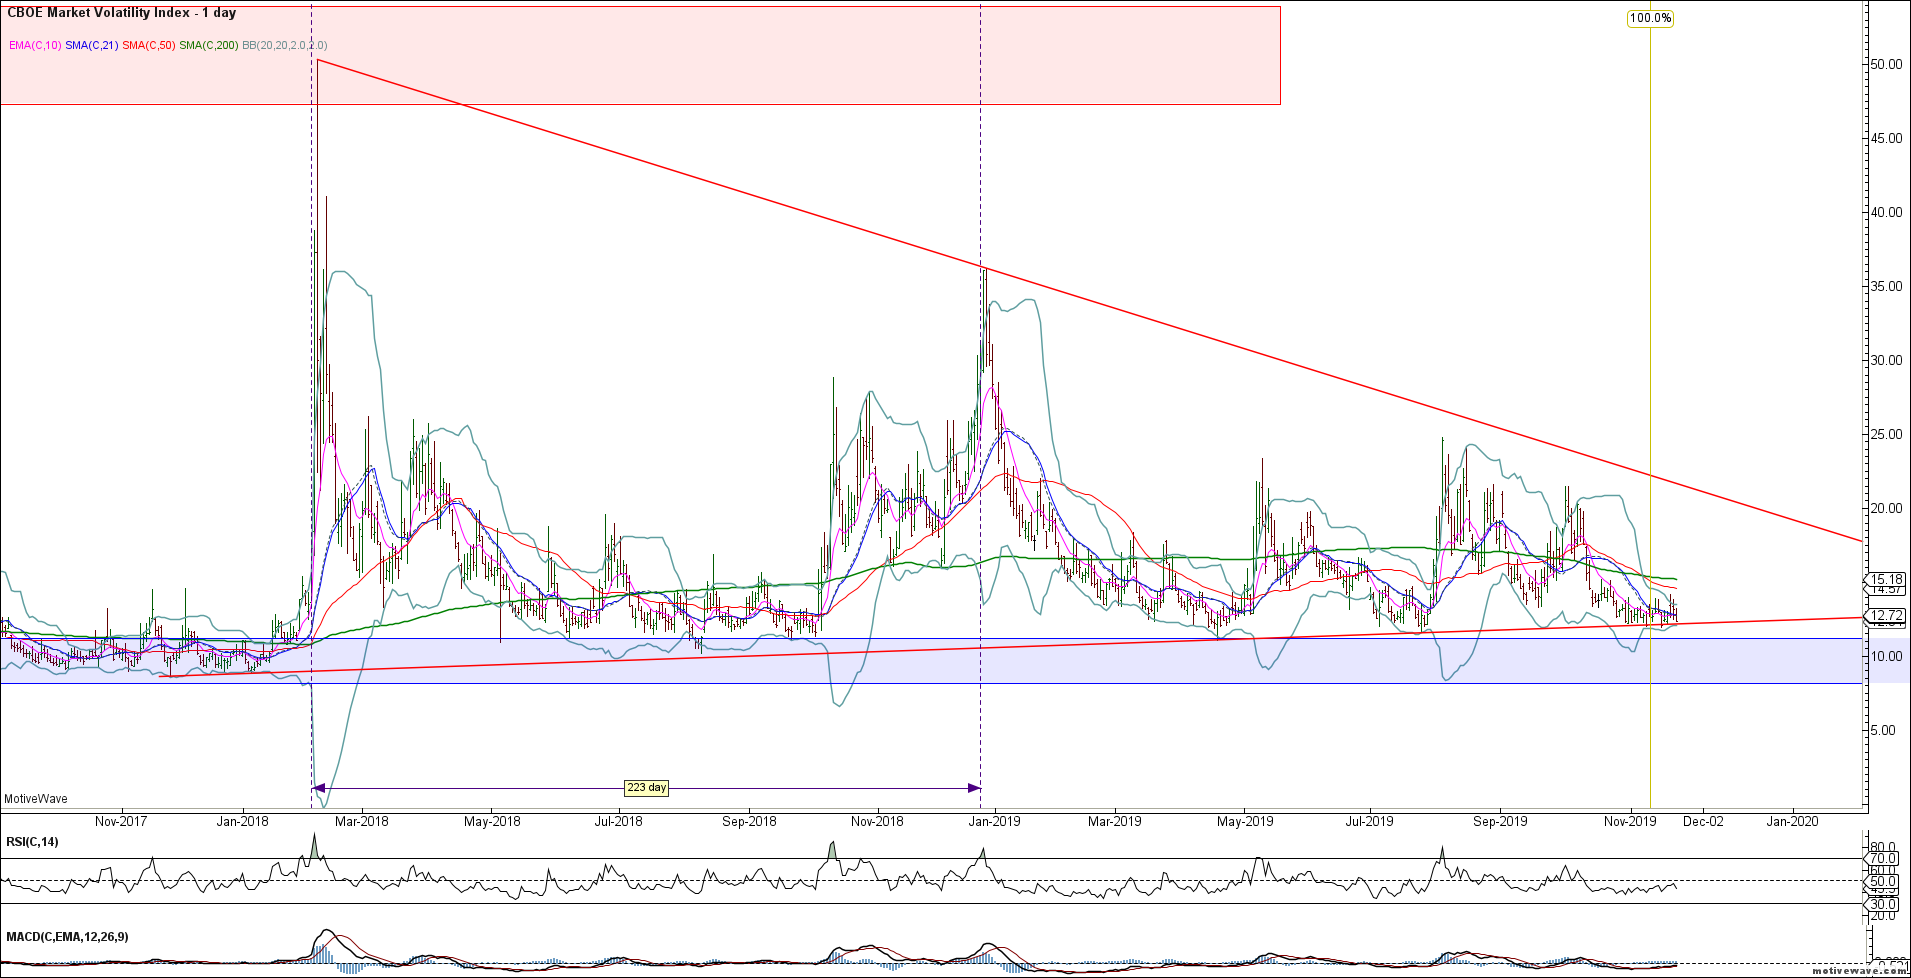
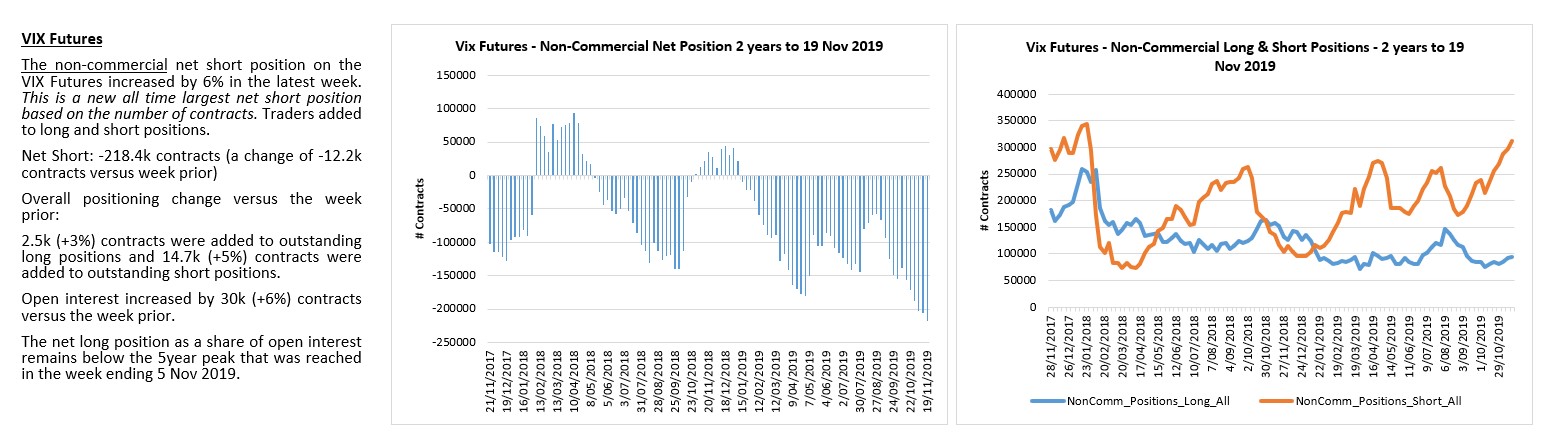
The VIX has shown no evidence of a bullish reversal and is threatening to break lower. With net short positioning at extremes the VIX is vulnerable to a short squeeze but the market has shown no evidence of trend exhaustion.
VIX Daily
Net VIX shorts continue to press into extremes.
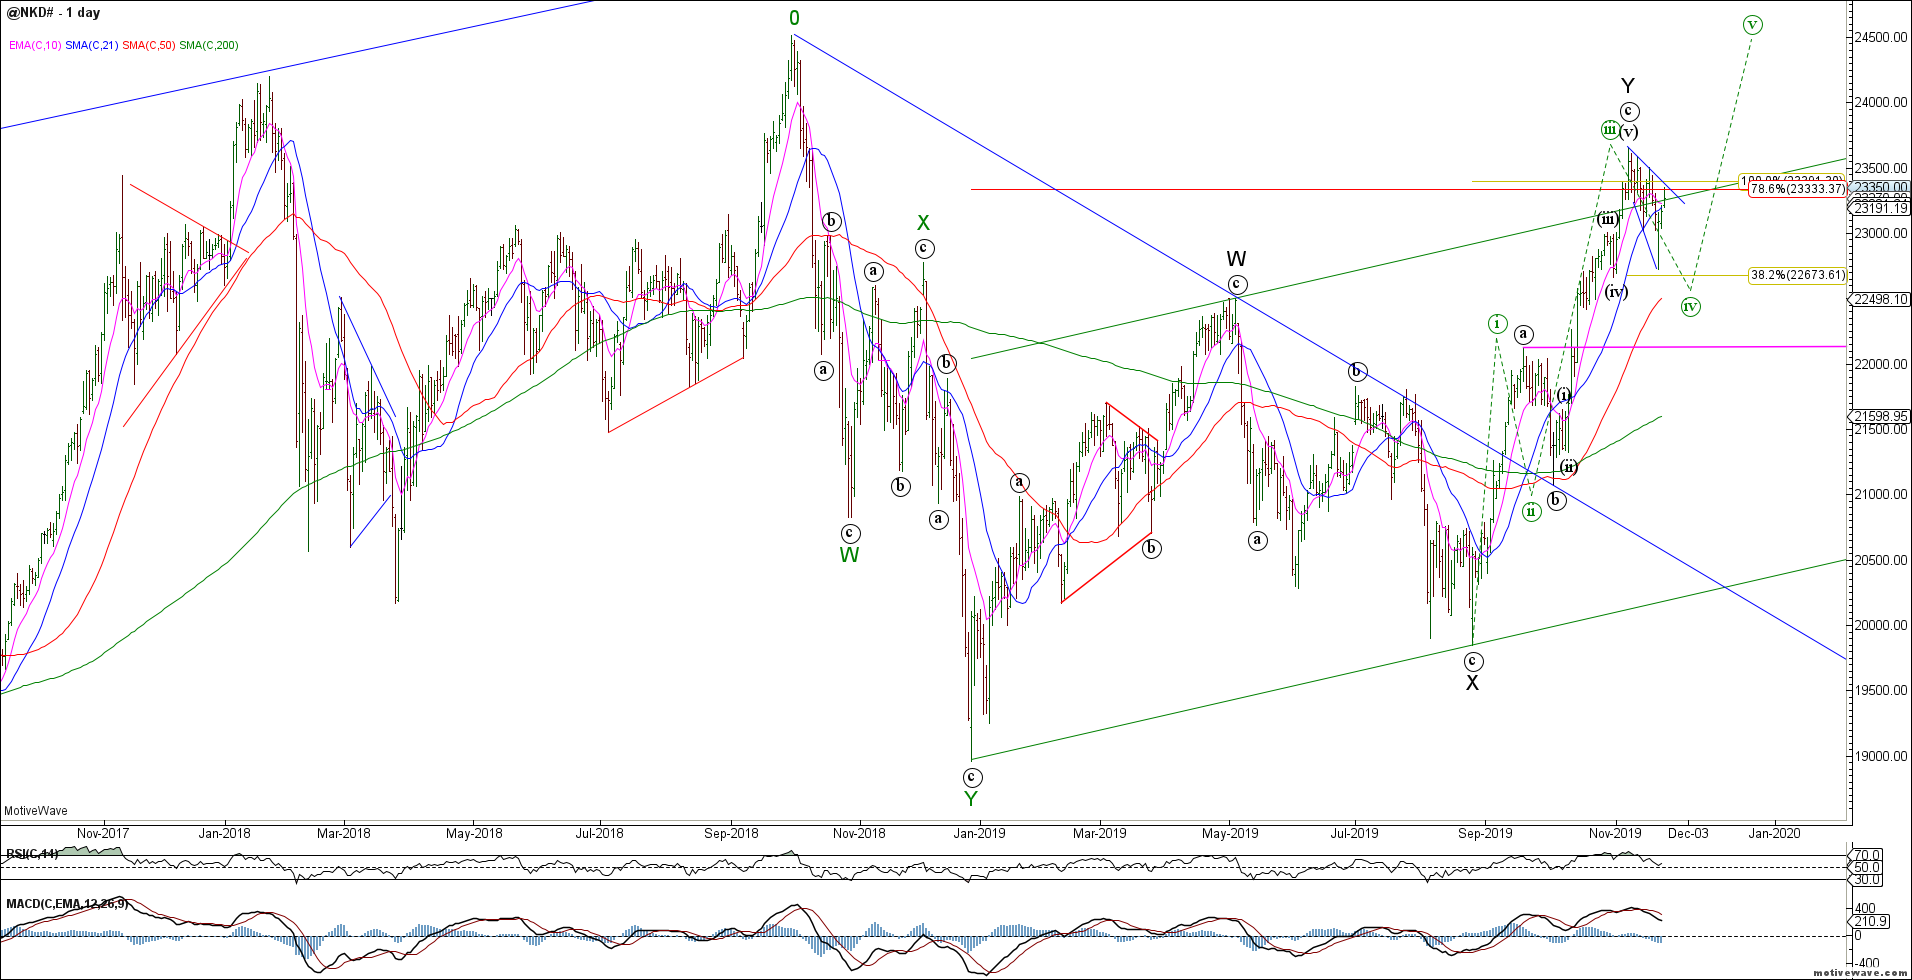
The global equity markets corrected lower last week but there is no strong evidence of a bearish reversal. The NKD declined into previous wave (iv) support then reversed higher. This opens the door to a more bullish interpretation of a wave (iv) correction before wave (v) pushes higher to retest swing highs.
NKD Daily
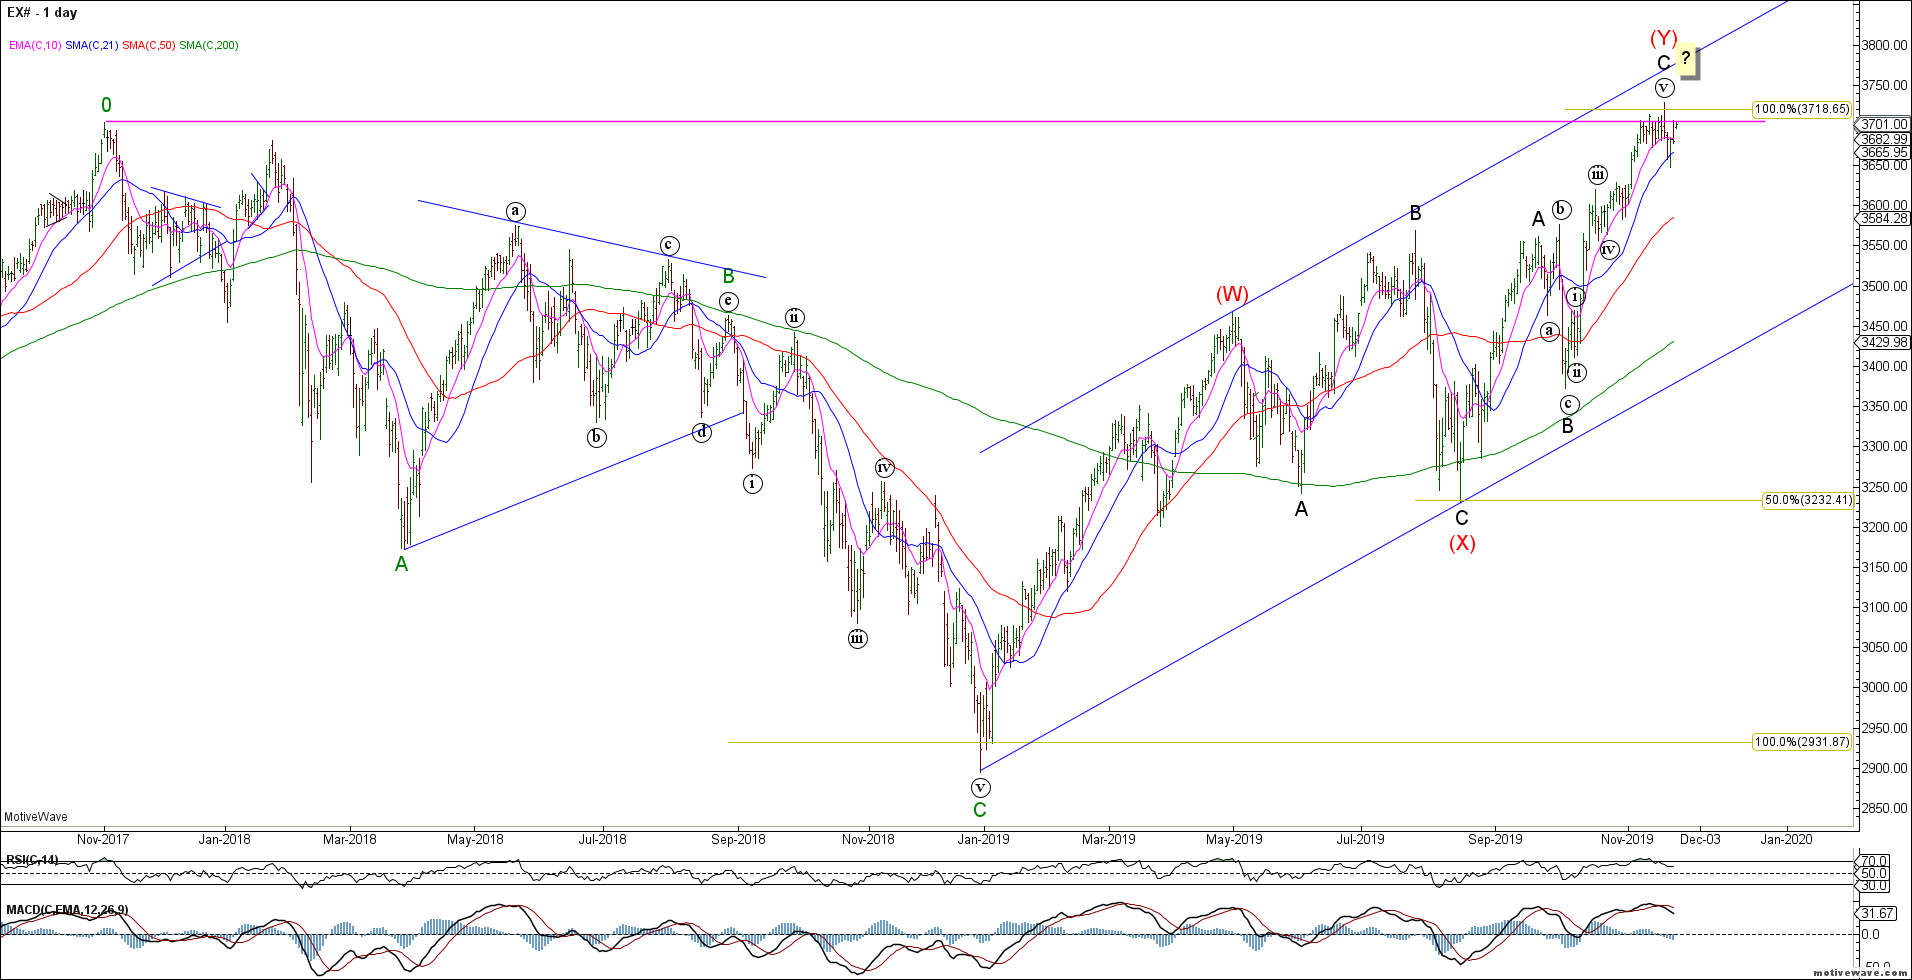
The ESTX achieved upside measured targets but failed to sustain a reversal lower. The bullish trend remains in tact until we see a clear impulsive 5 wave decline to reverse this trend. Either way, longs should be very cautious here because at best any new cycle high will likely be a final 5th wave.
ESTX Daily
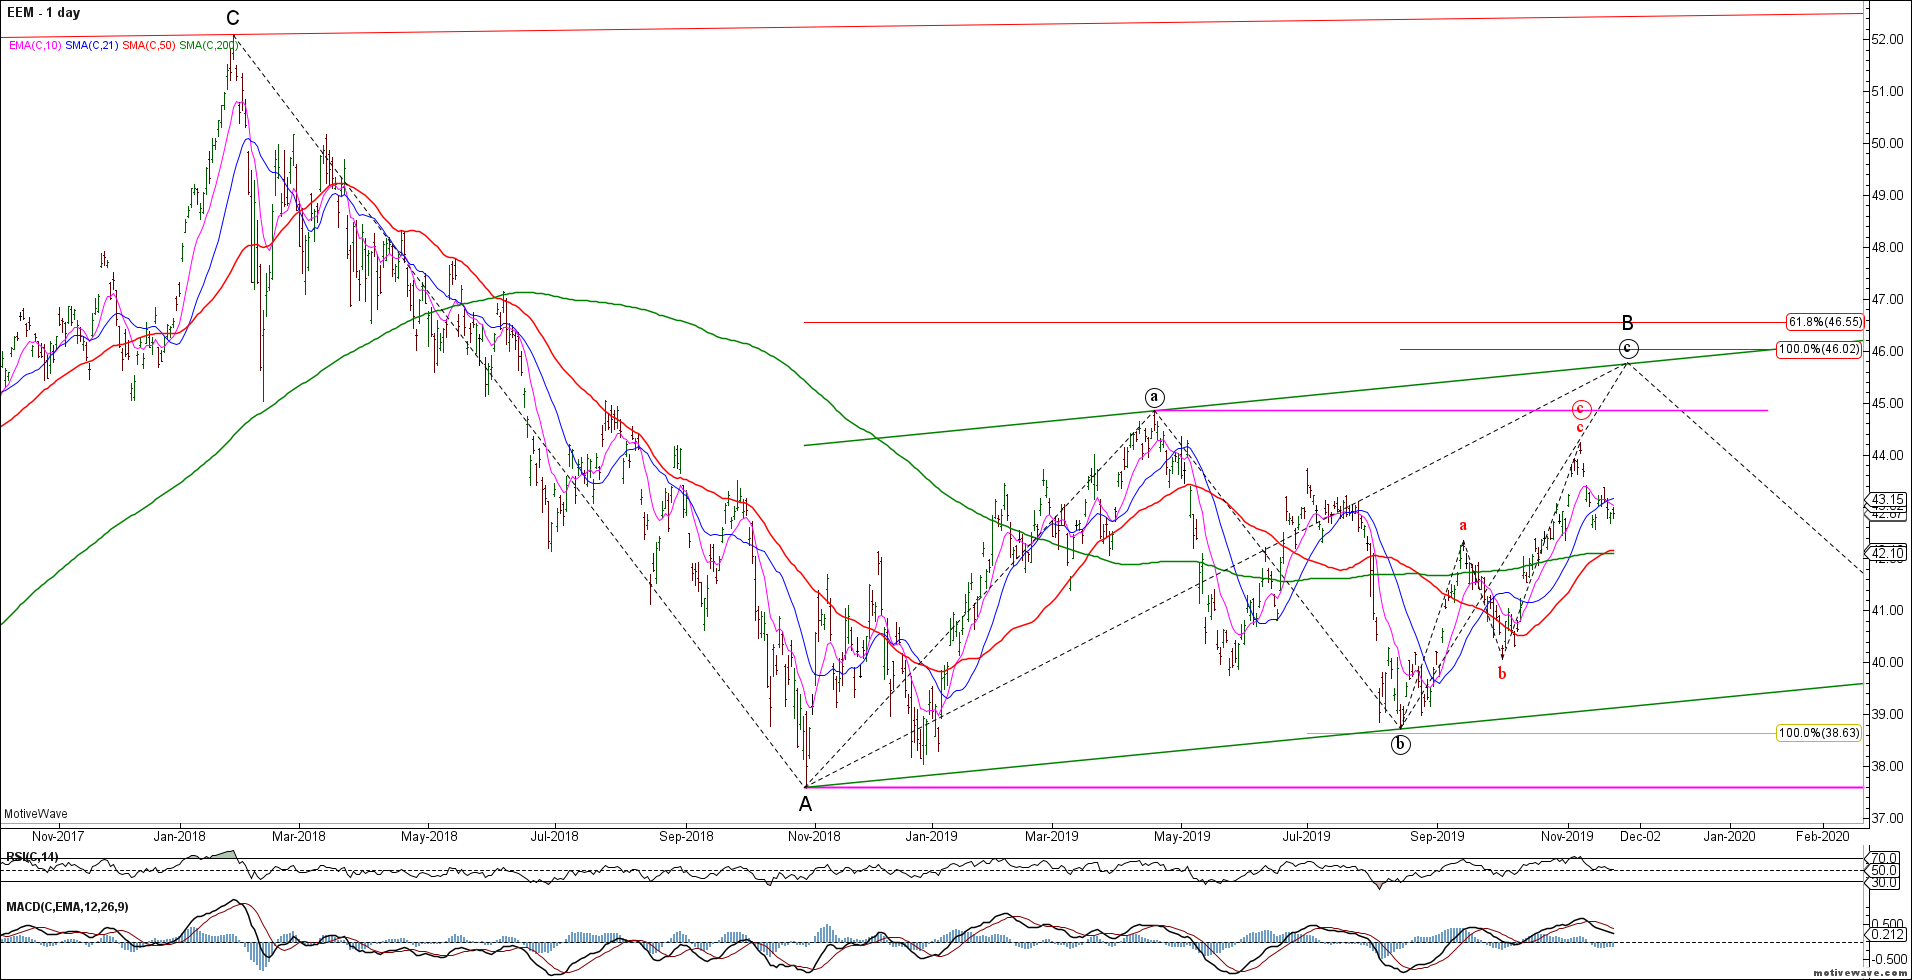
The Emerging Markets (EEM) continues to underperform and with only 3 waves up so far, it is unclear whether we get a final push higher towards ideal 46 targets. The EEM will continue to underperform while the US$ remains strong. Risks failure here given our bigger picture bearish outlook.
EEM Daily
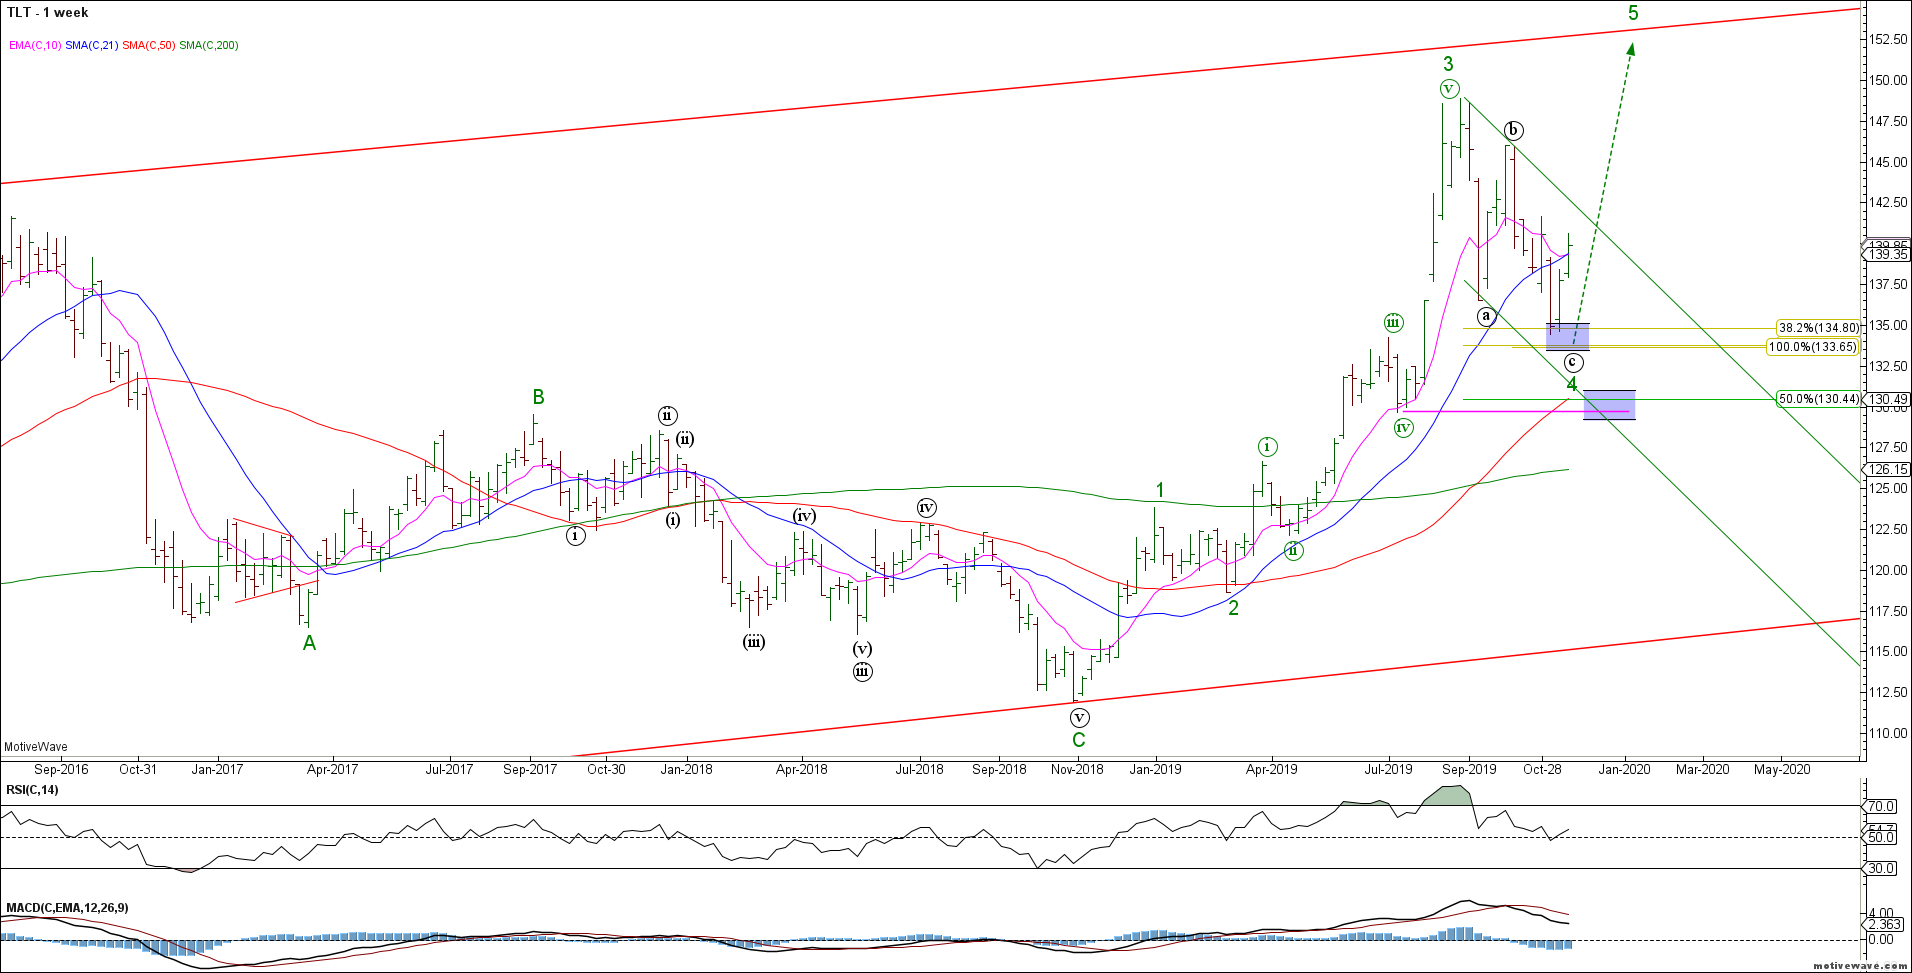
To the Bond markets and the TLT rally continued higher as expected from wave 4 support. Bulls remain in control while swing lows hold. Near term we should see evidence of a corrective decline this week.
TLT Weekly
The 30yr ZB shows an impulsive rally from recent swing lows. We remain bullish from a big picture perspective looking for wave 5 to new cycle highs.
ZB Daily
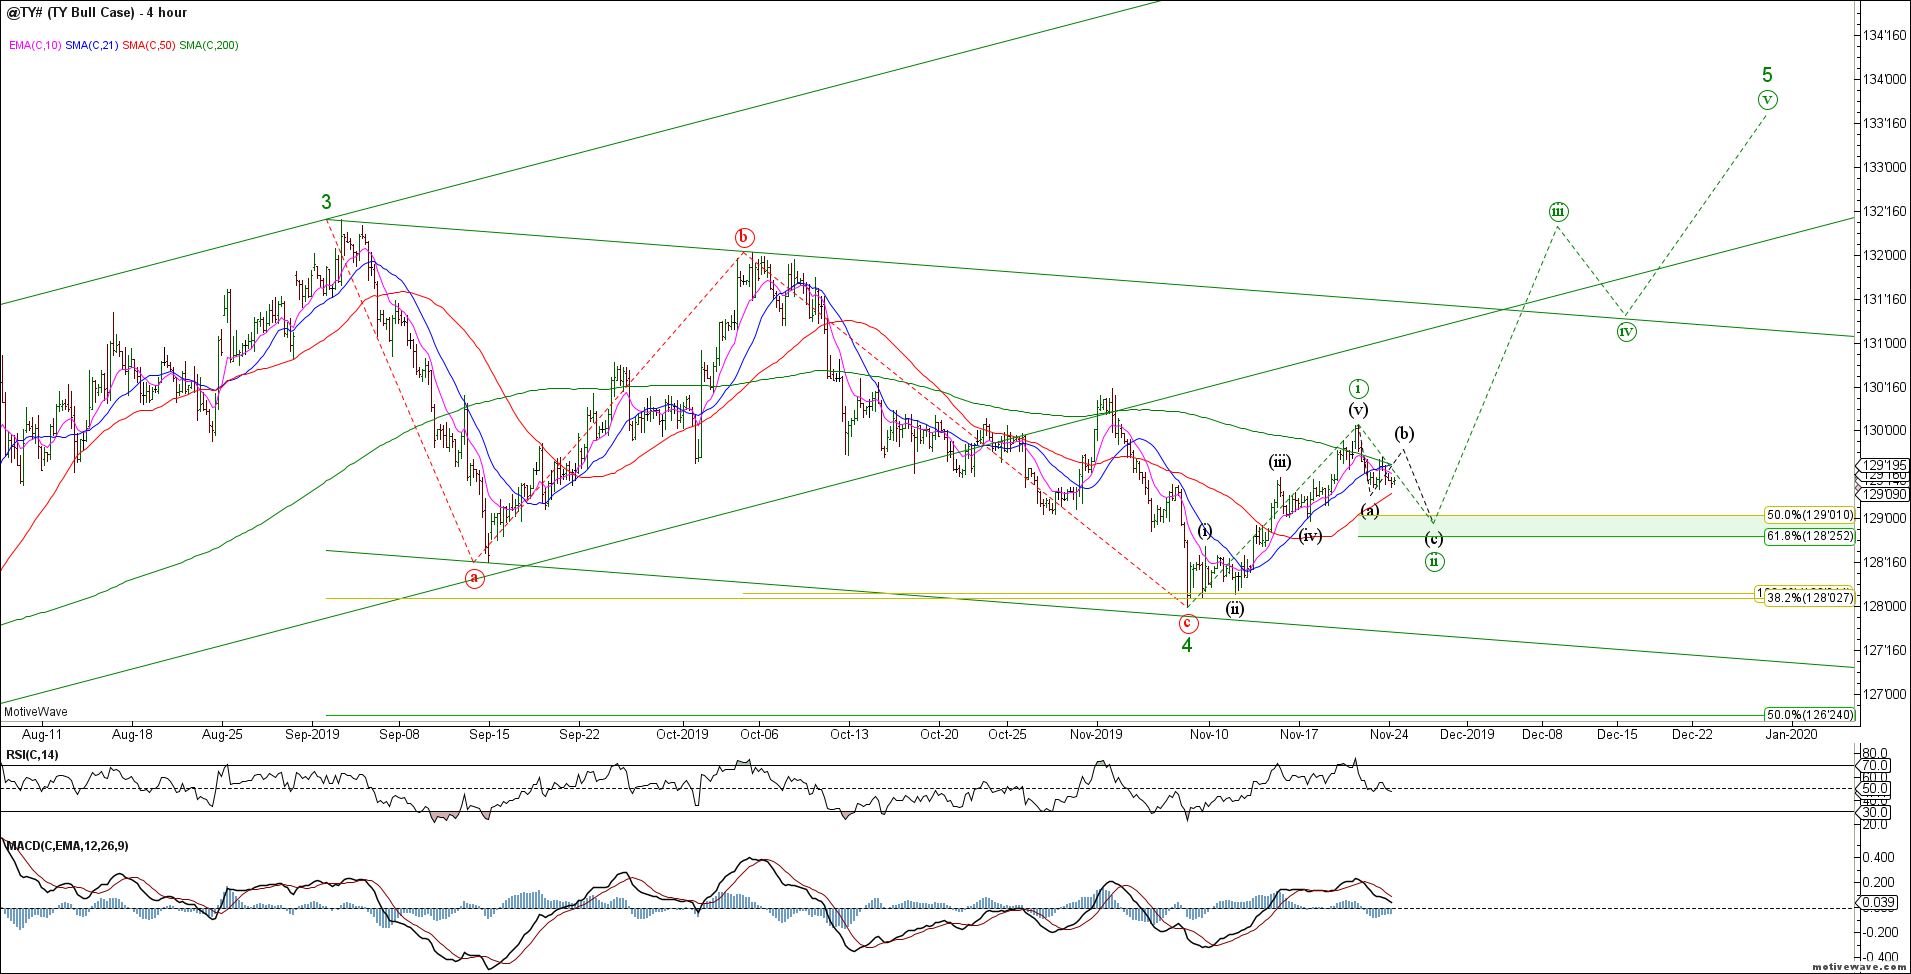
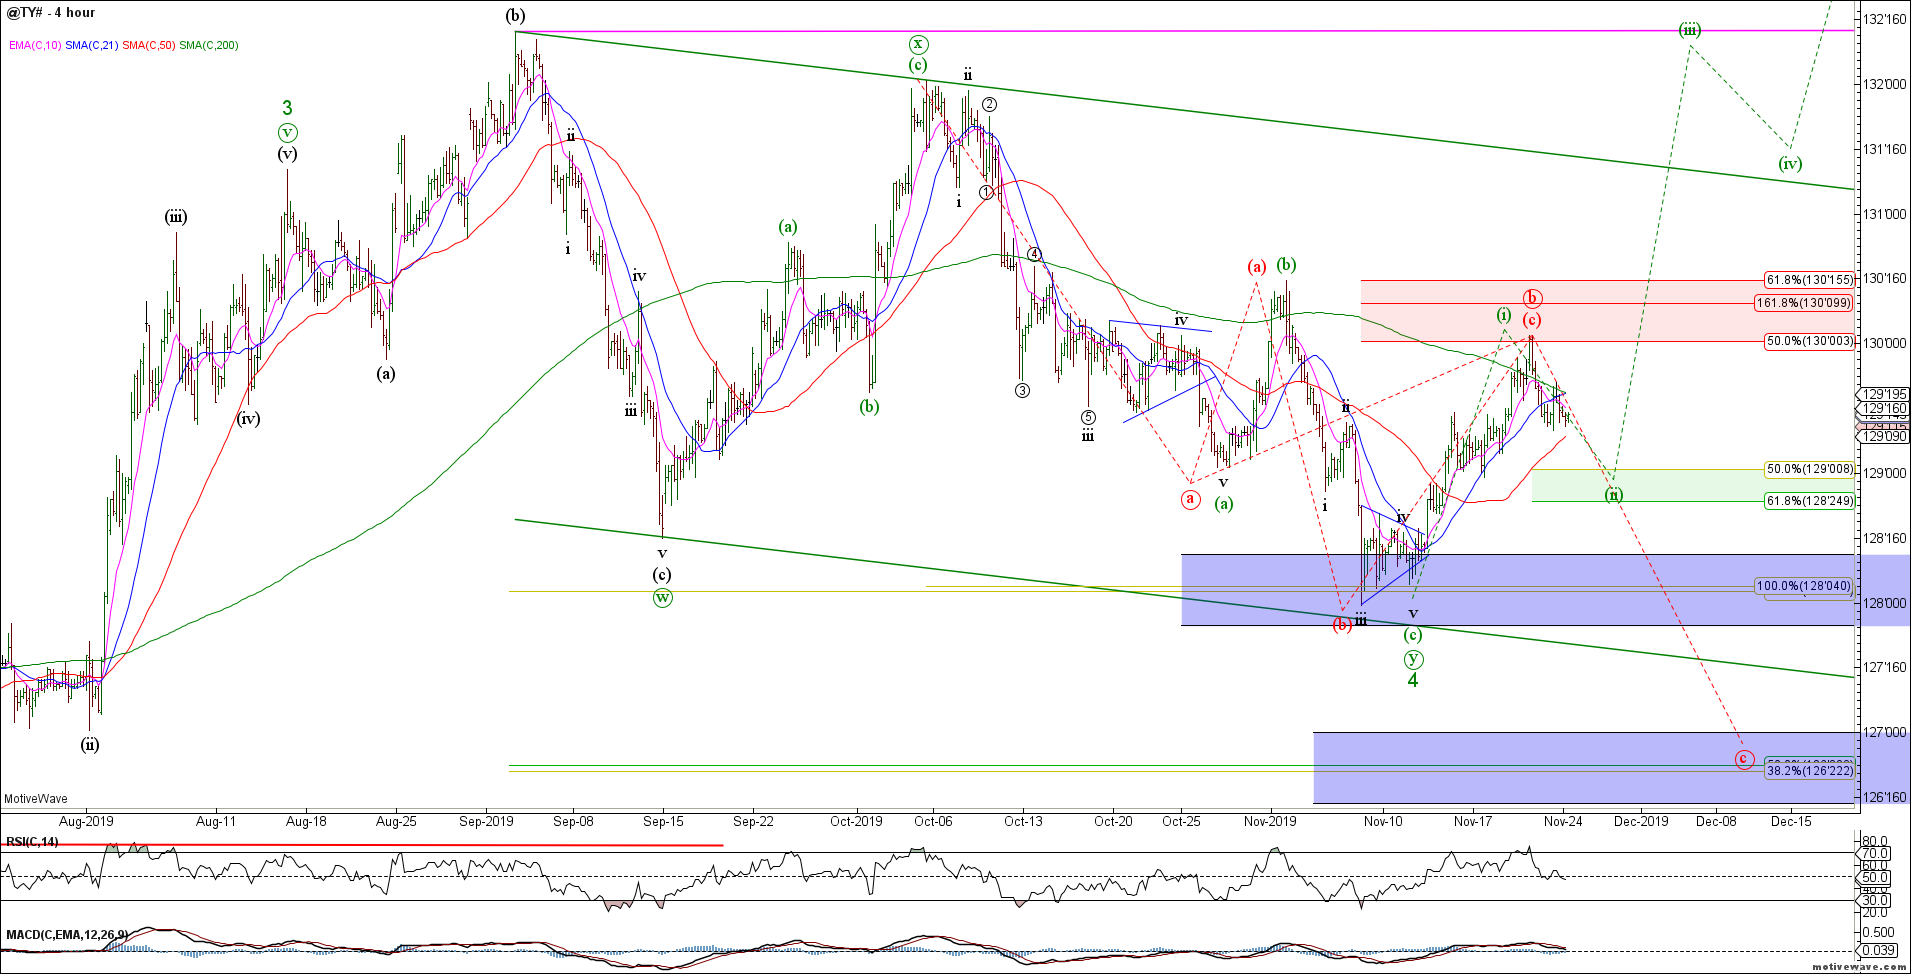
The TY shows the same bullish potential with a potentially complete 5 waves up from recent swing lows. Near term bulls should hold the 128’25-129’00 support zone for wave (ii) of the bull count.
TY H4
The TY also has a potentially bearish interpretation (red count) that while lower probability we should not ignore. That is because of the irregular swing low from an Elliott Wave perspective. Be aware of this potential if we see evidence of an accelerating decline.
TY H4
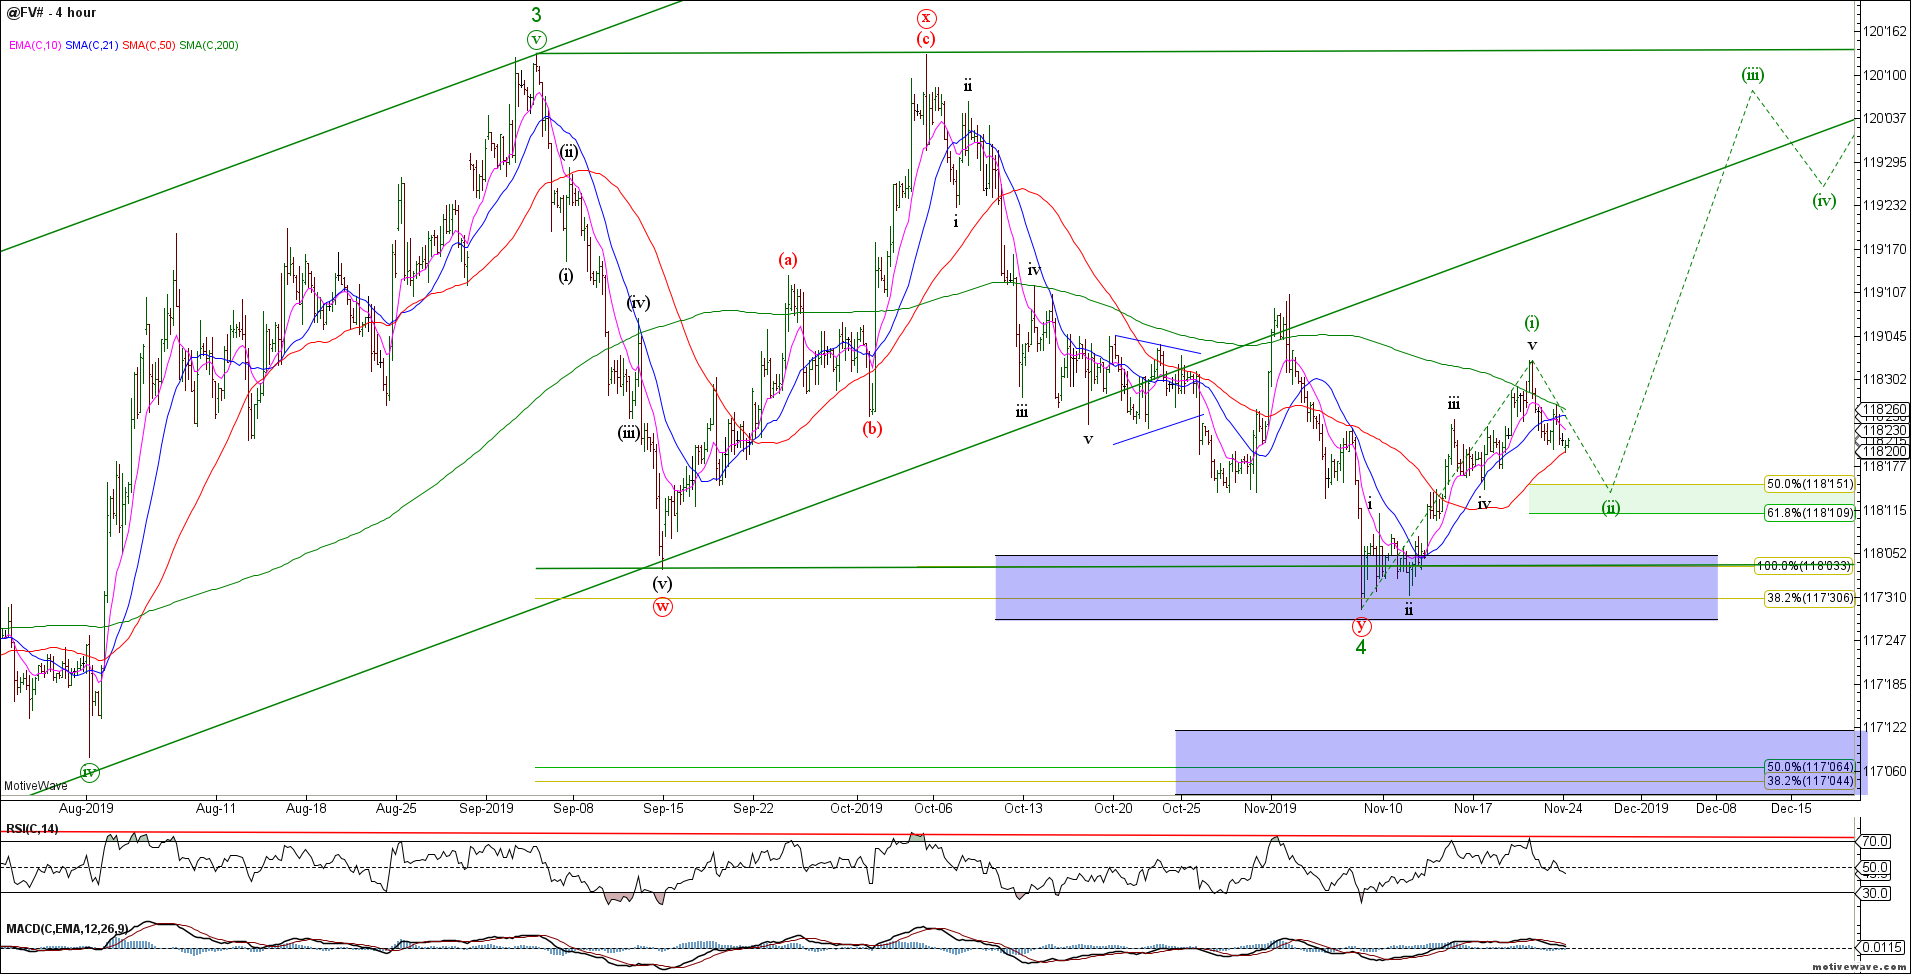
The 5yr FV shows an impulsive 5 wave rally from the recent swing lows. Bulls need to hold the 118’10 area for wave (ii) of the bull count.
FV H4
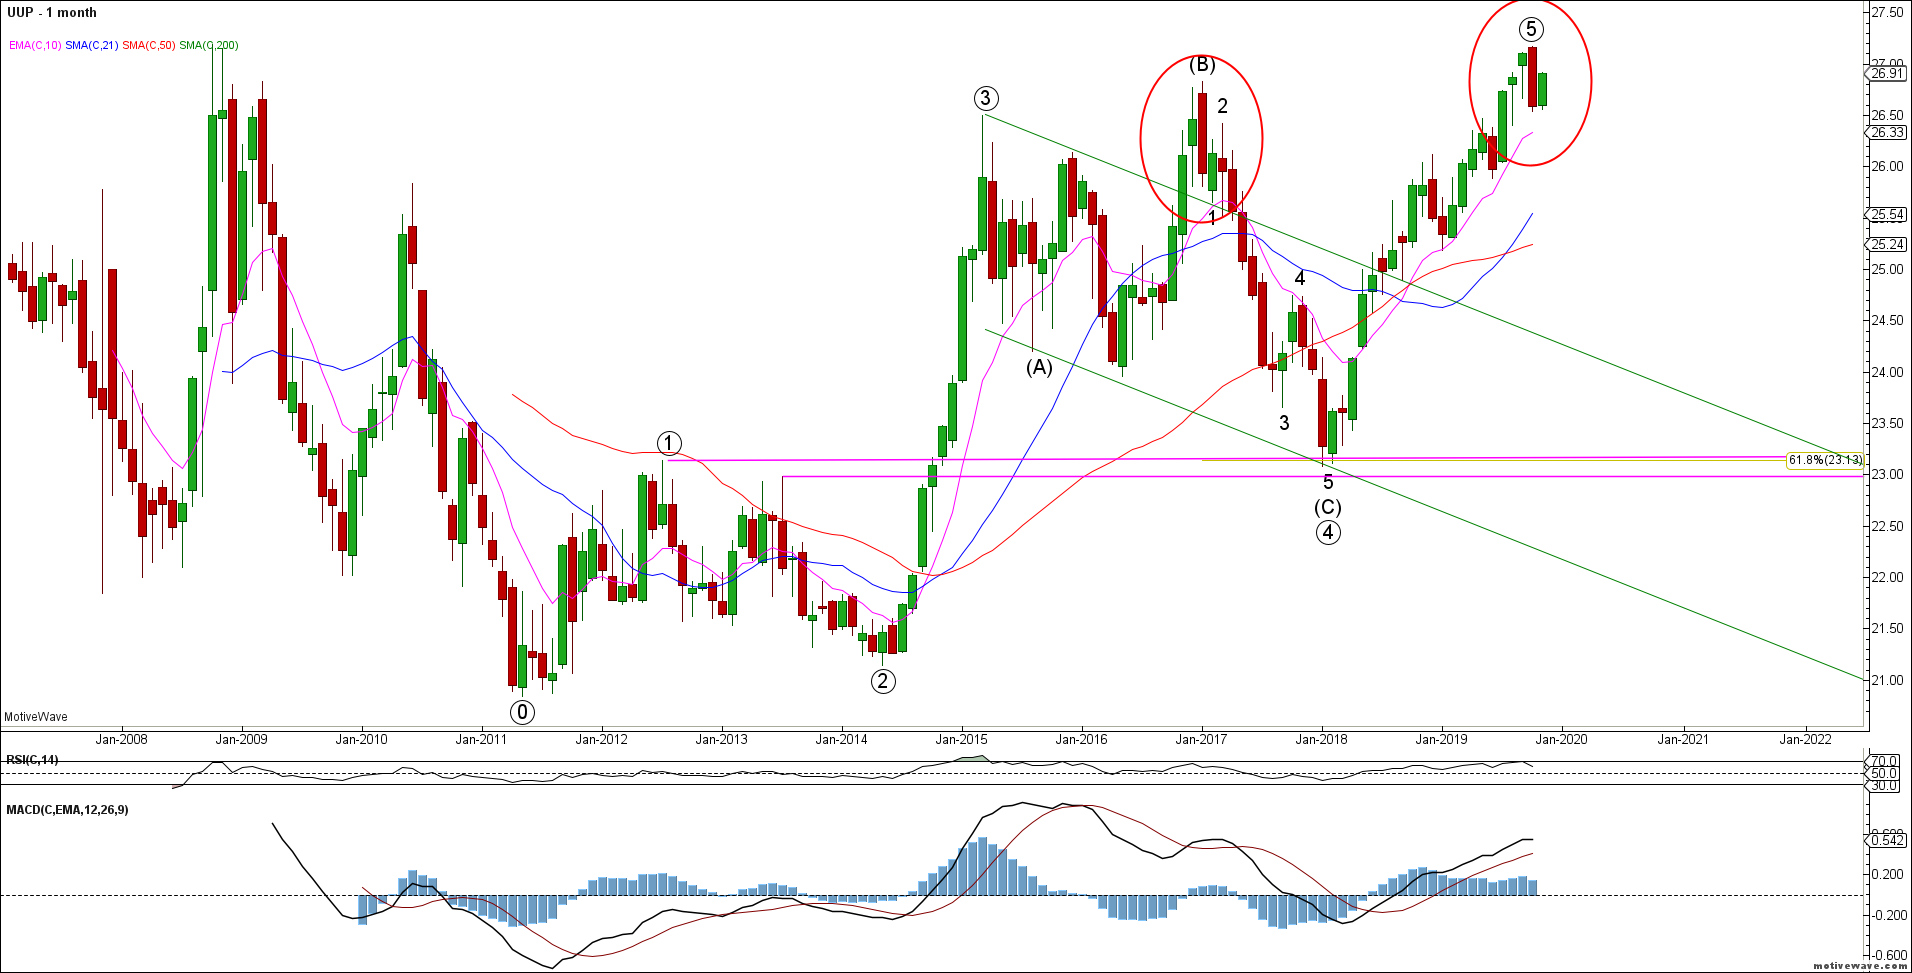
To the FX markets and the US dollar refuses to roll over. The monthly UUP chart is illustrative of the bigger picture field position of the dollar. October’s monthly bearish reversal is yet to see any downside follow through. We need to see a break of the October lows to gain any downside momentum.
UUP Monthly
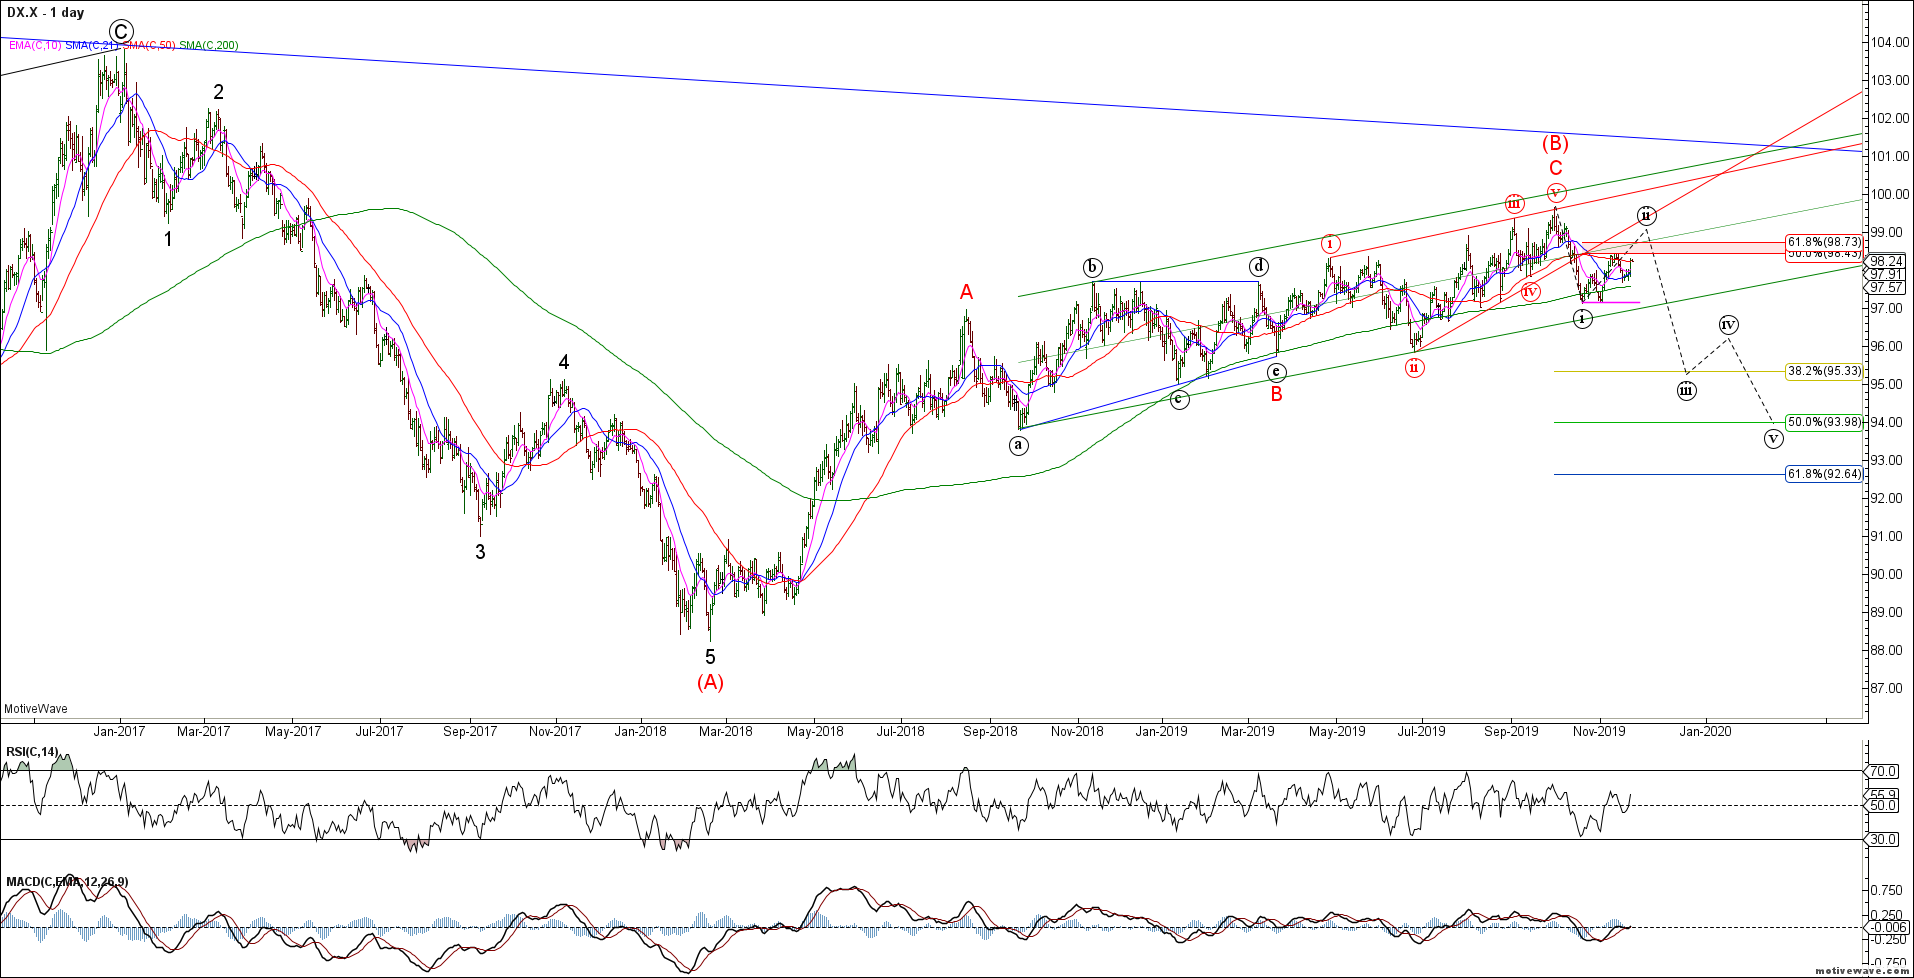
The DXY was unable to break lower last week and remains range bound. The near term structure is unclear and while we maintain a bearish bias against the October highs, our confidence level is low as no key support has been broken. Maybe another push higher to complete wave (ii)? Risky
DXY Daily
DXY longs have left the building.
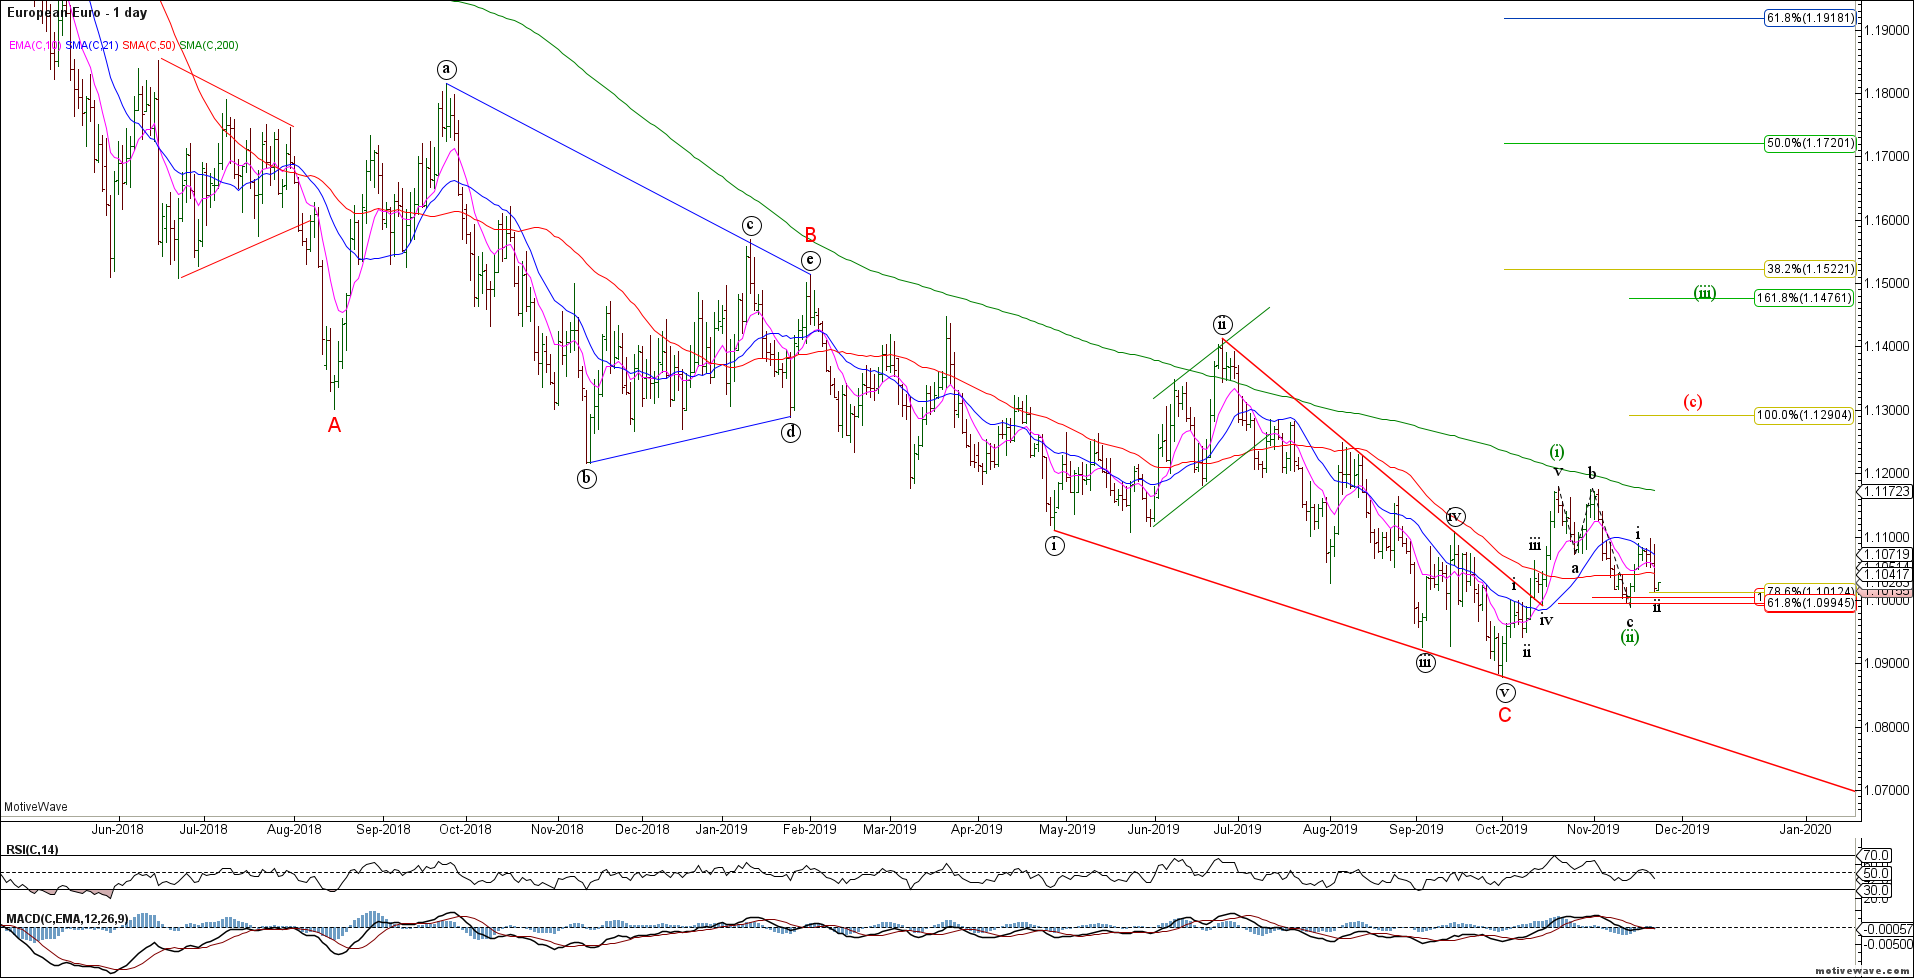
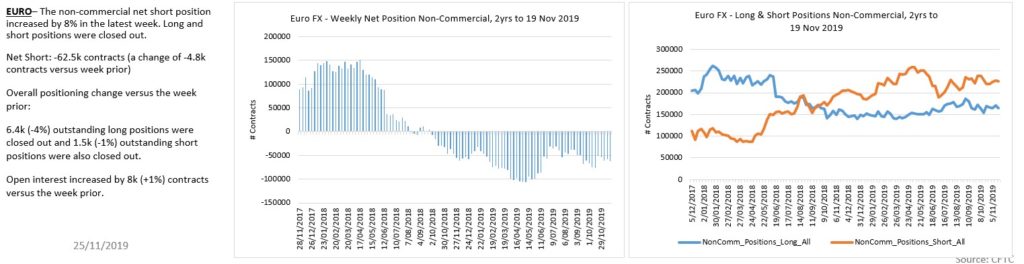
The Euro bullish potential remains in tact but the recent deep retracement calls this count into question. The Euro has not been able to maintain any of its bullish reversals as yet – risky as the bigger picture bear trend remains unbroken.
EURUSD Daily
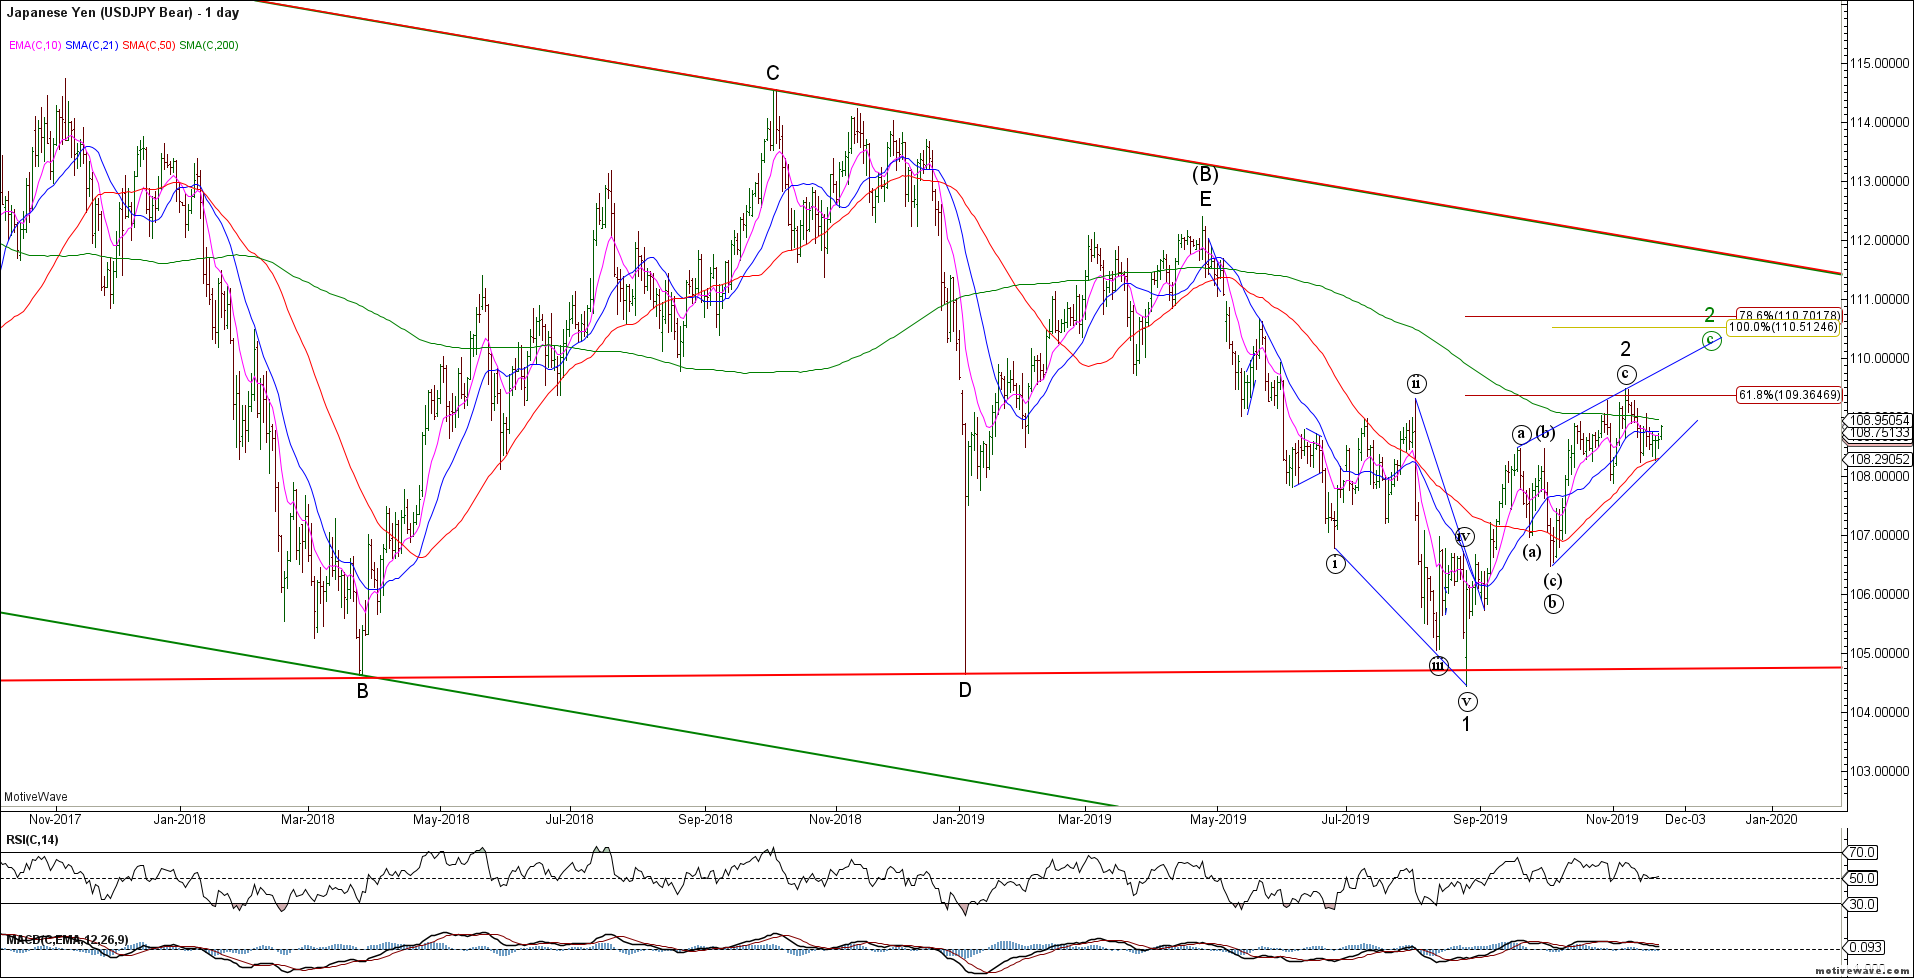
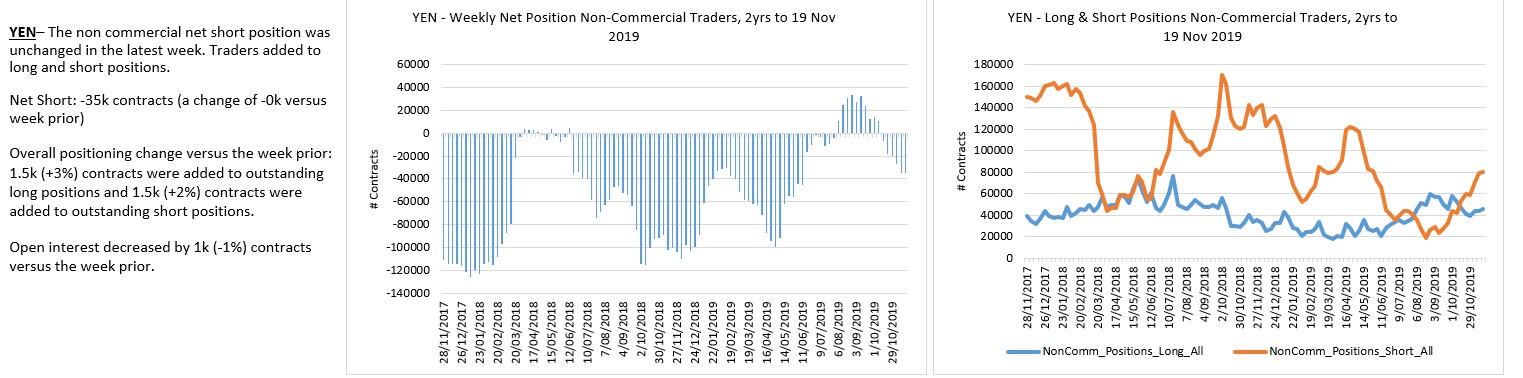
The USDJPY also refuses to break down and held its 50 day sma. We do not have confirmation of a bearish reversal so the risk is another wave higher in what appears to be a wedge / diagonal. If in doubt stay out.
USDJPY Daily
Yen traders only marginally short.
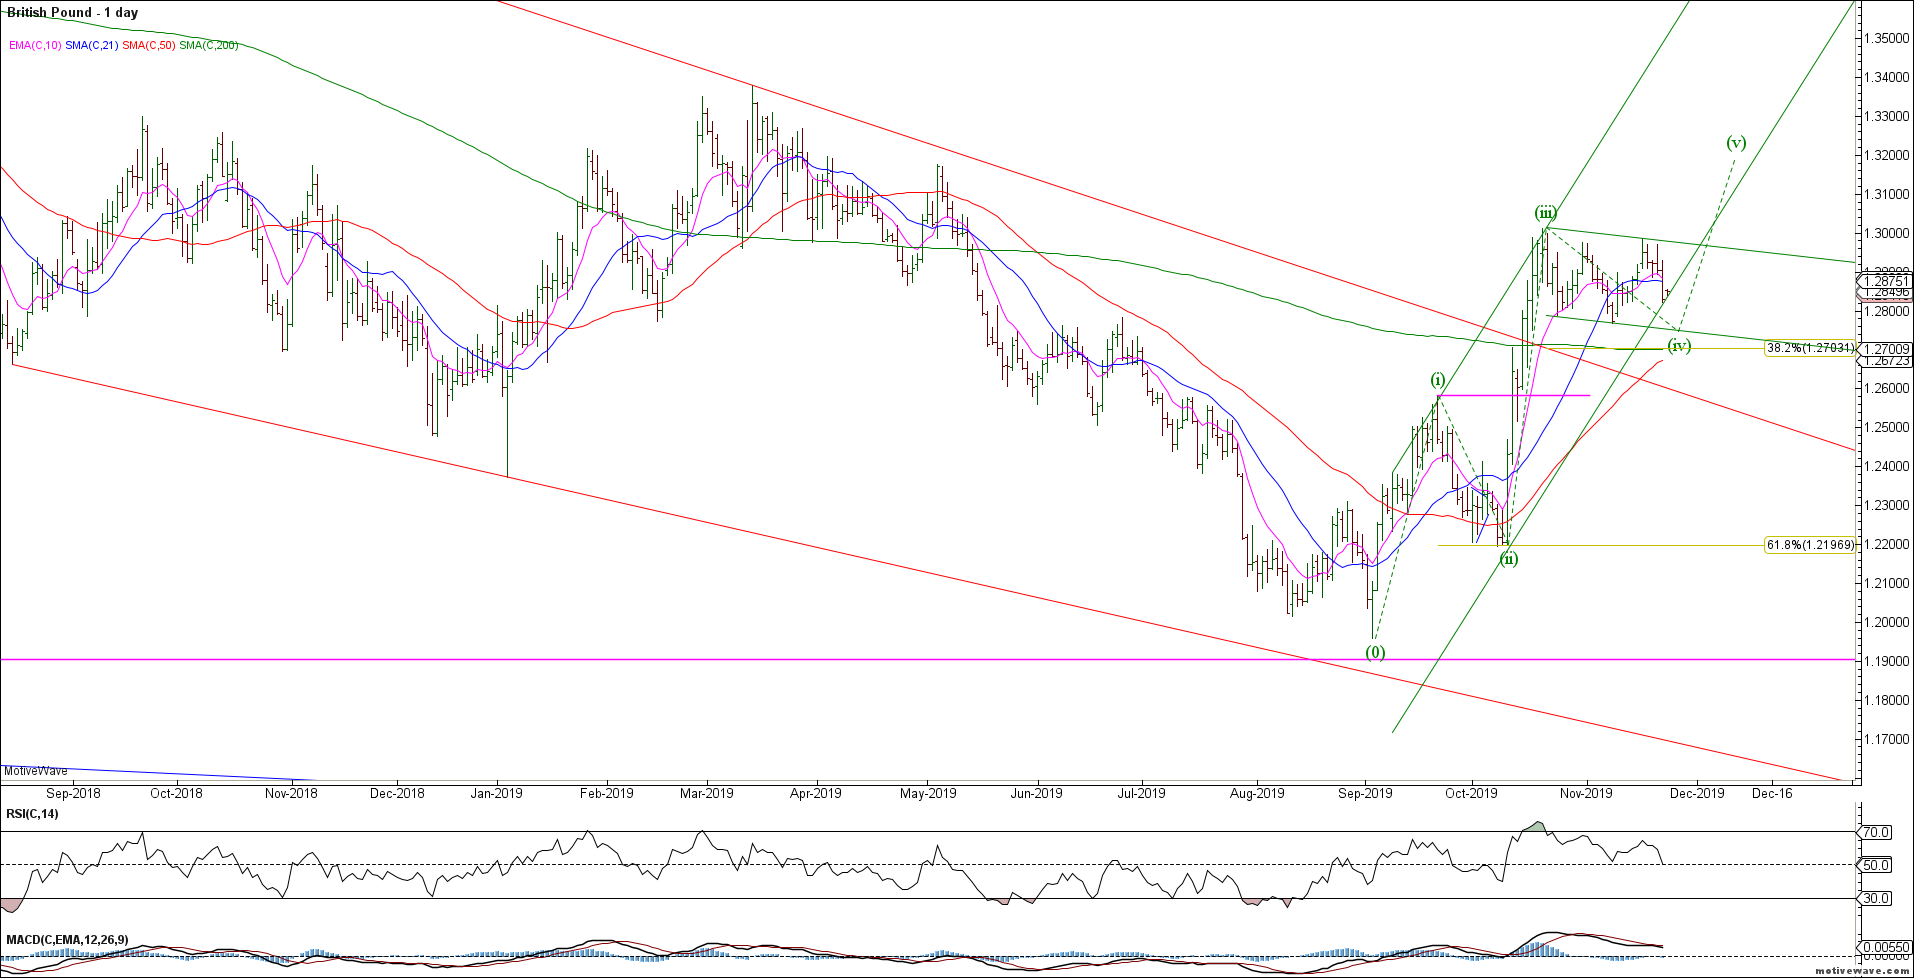
The GBPUSD failed to break out to new highs in wave (v) – bulls need to hold the 1.2700-50 area on any continued pullback and push higher to complete wave (v) for an impulsive rally. Remains bullish while above the 1.2580 wave (i) overlap.
GBPUSD Daily
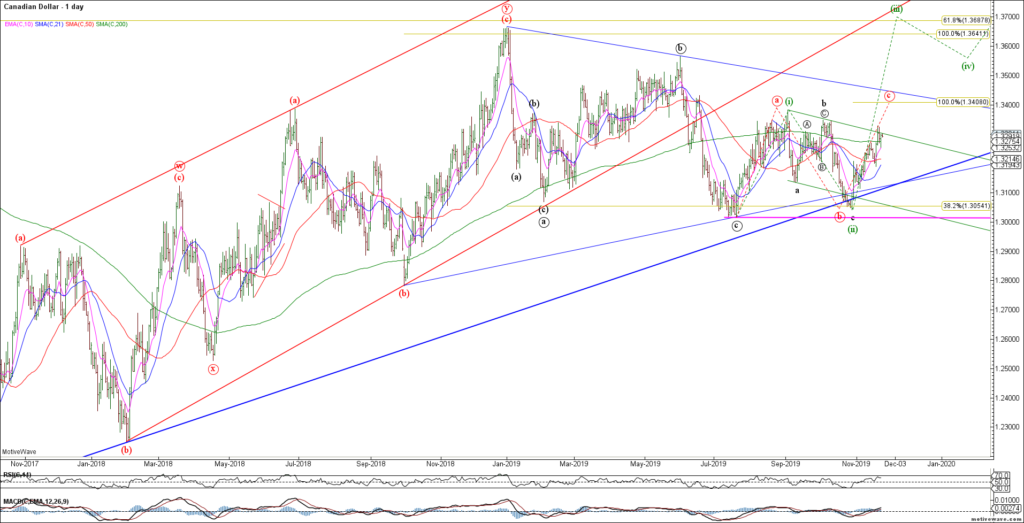
The rally in USDCAD remains constructive but remains range bound from a bigger picture perspective. Our near term target remains 1.3400 but it has been unable to break through overhead resistance so far. We’ll be patient.
USDCAD Daily
CAD longs getting nervous.
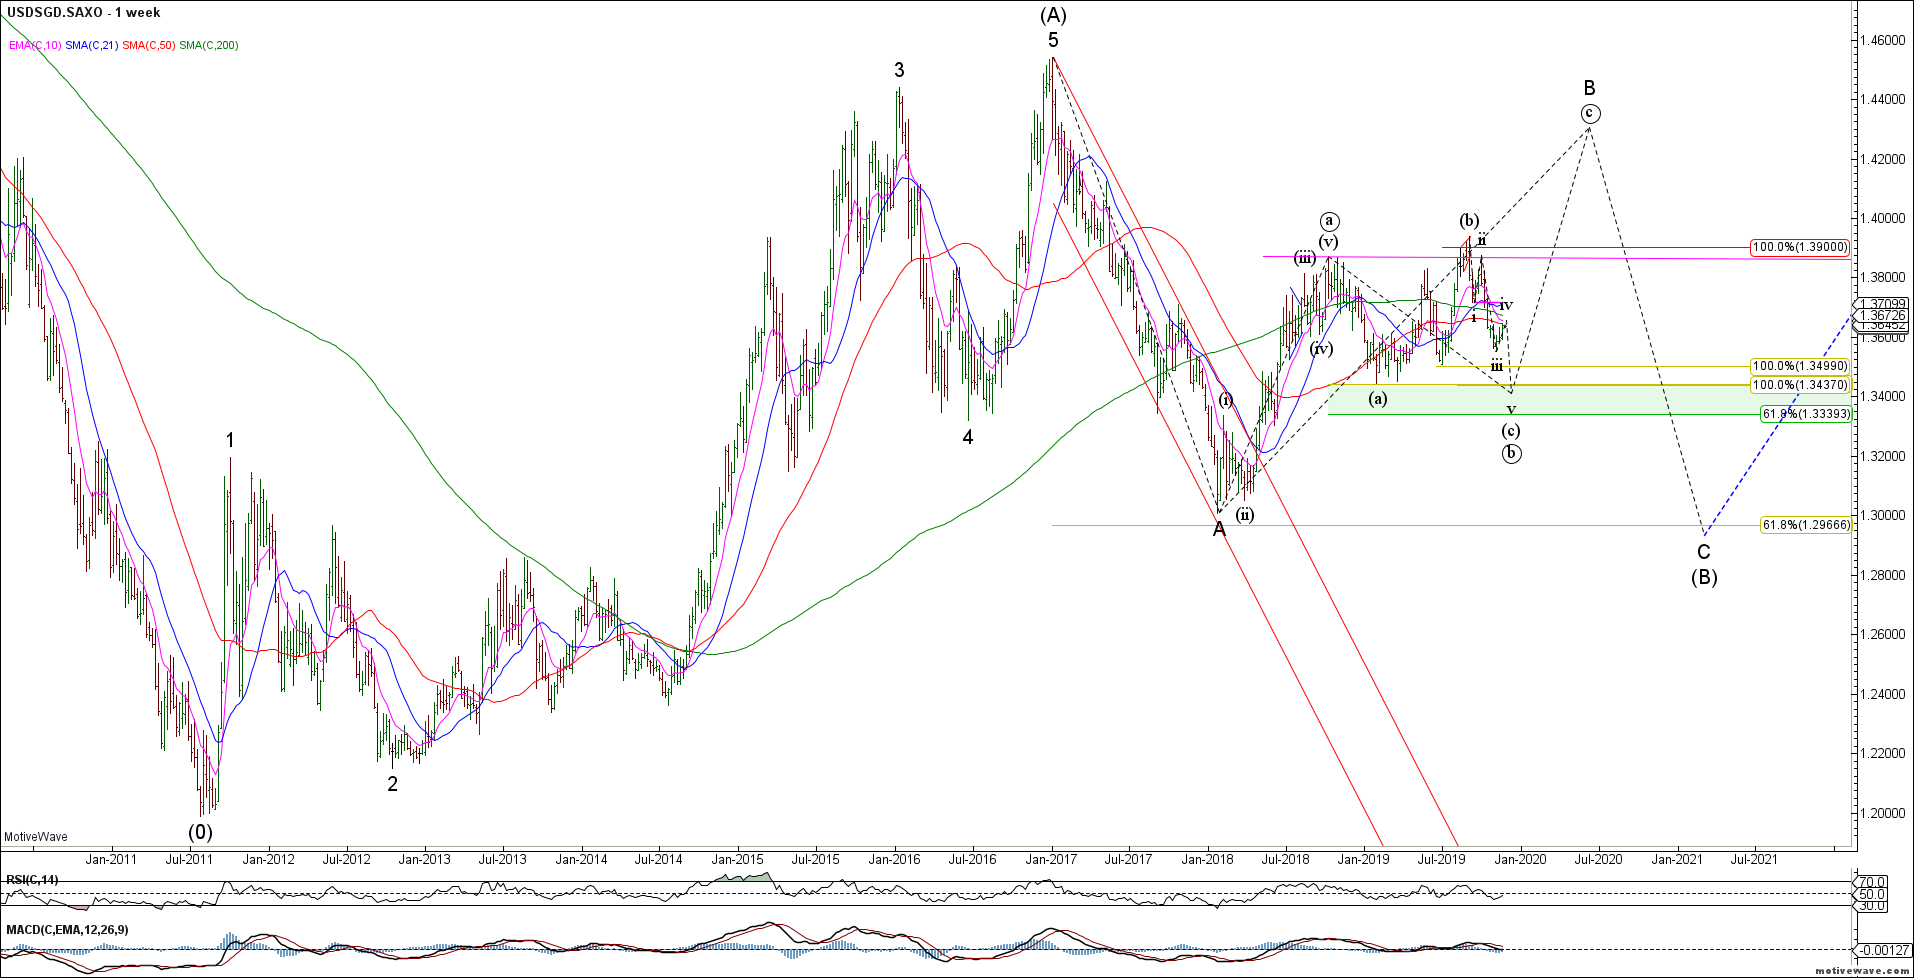
We continue to track the Singapore Dollar (USDSGD) as a proxy for the China trade deal. The structure would look best with another wave lower towards 1.34 to potentially set up a bullish trade.
USDSGD Weekly
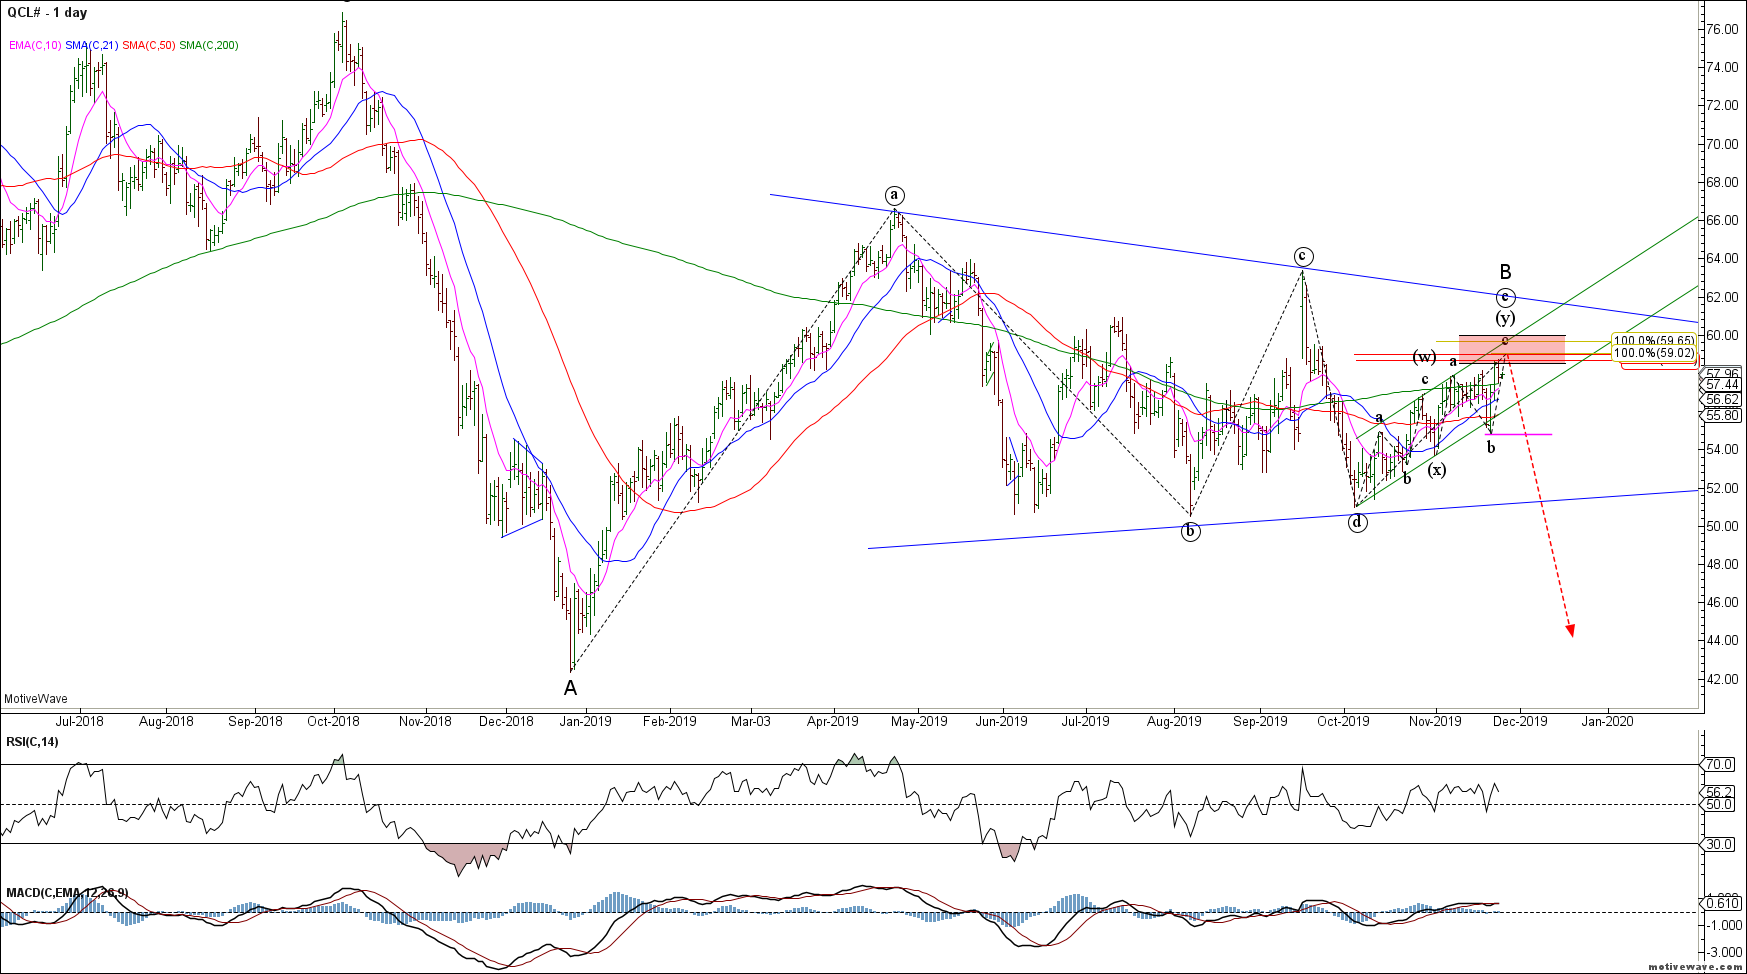
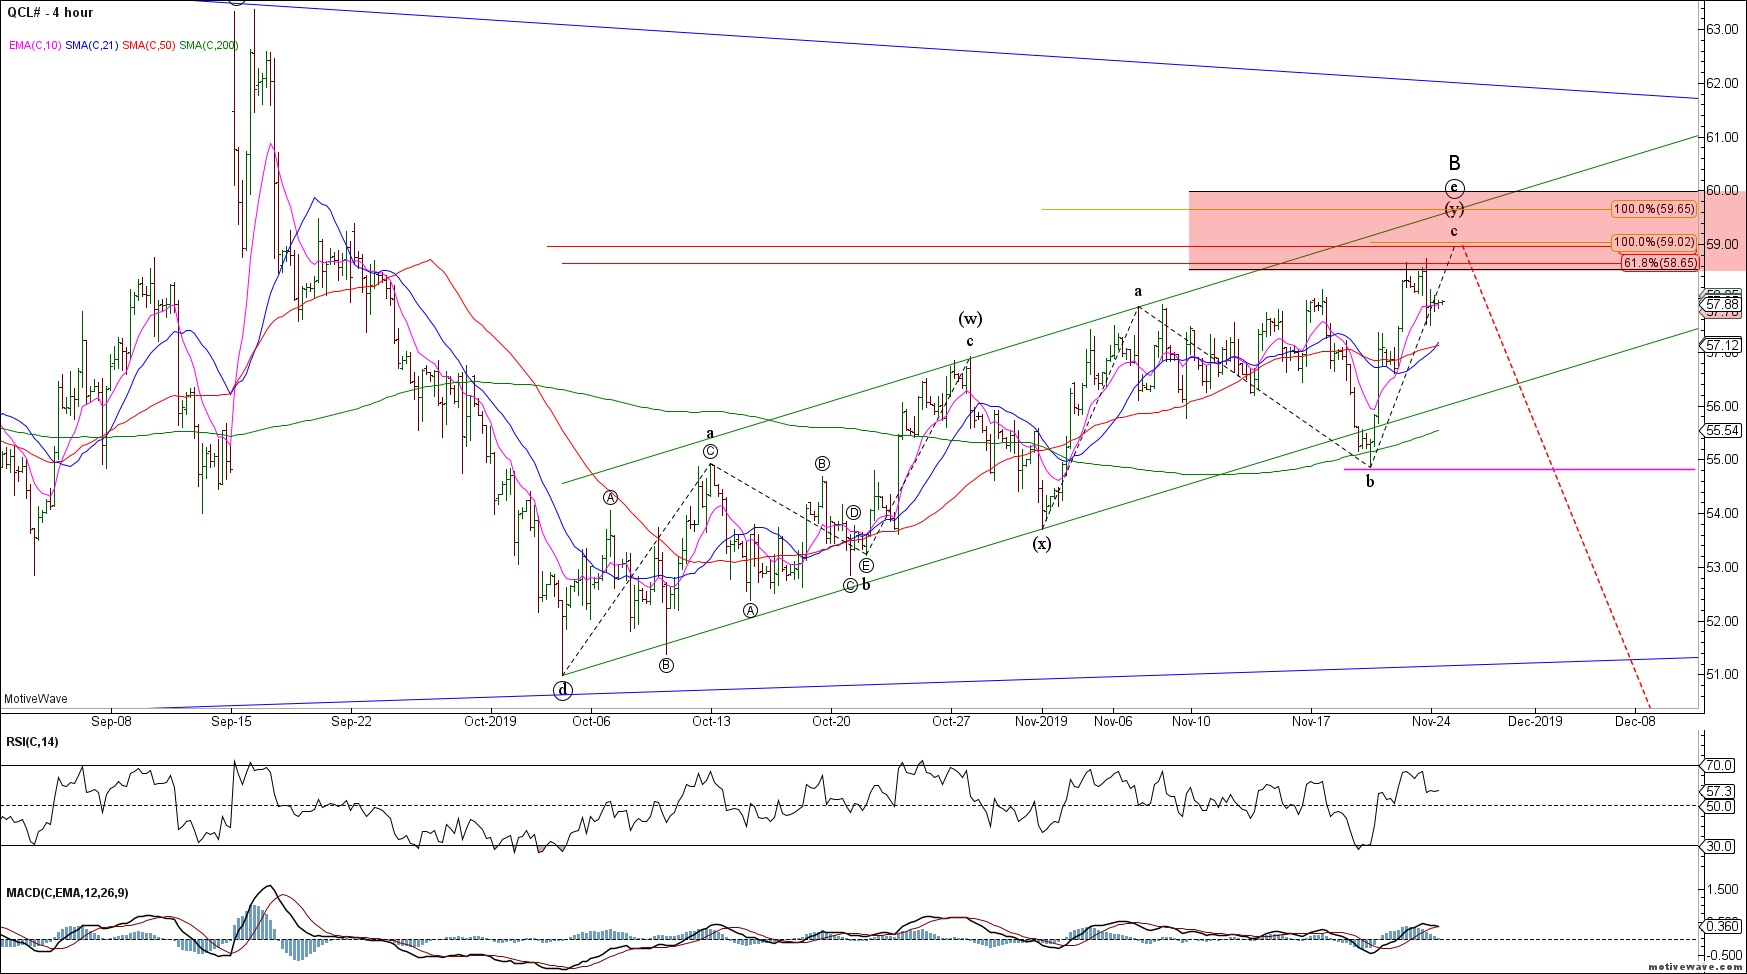
To the commodity markets and Crude Oil continues to rise correctively. Strong resistance remains in the 59-60 area as we look for evidence of a bearish reversal. Bears need to break the sequence of higher highs and higher lows with trade below last week’s low.
CL Daily
The near term CL count continues to look like a complex correction. No strong evidence yet of a bearish reversal.
CL H4
CL shorts squeezed.
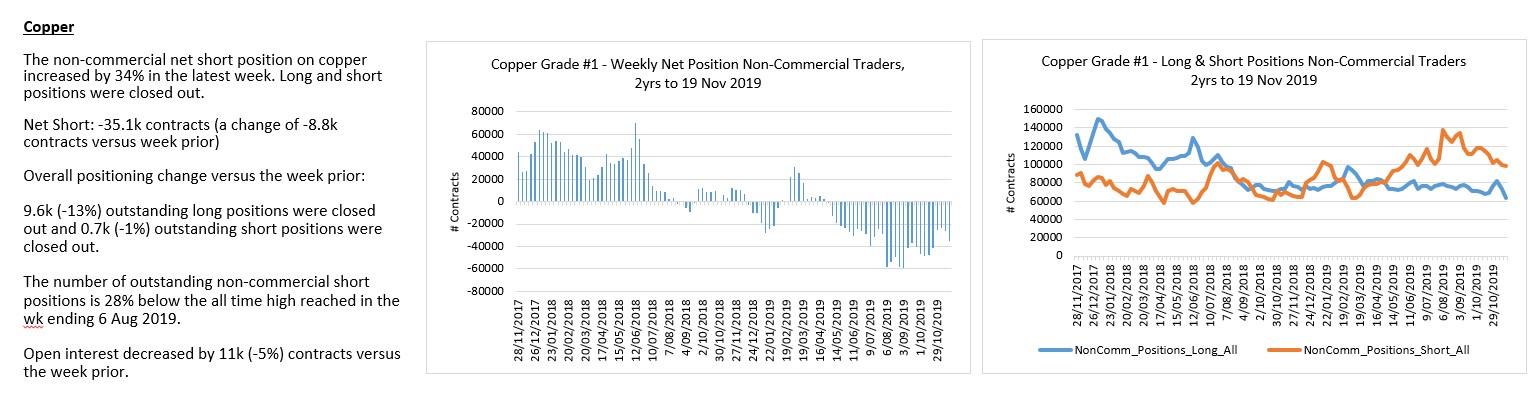
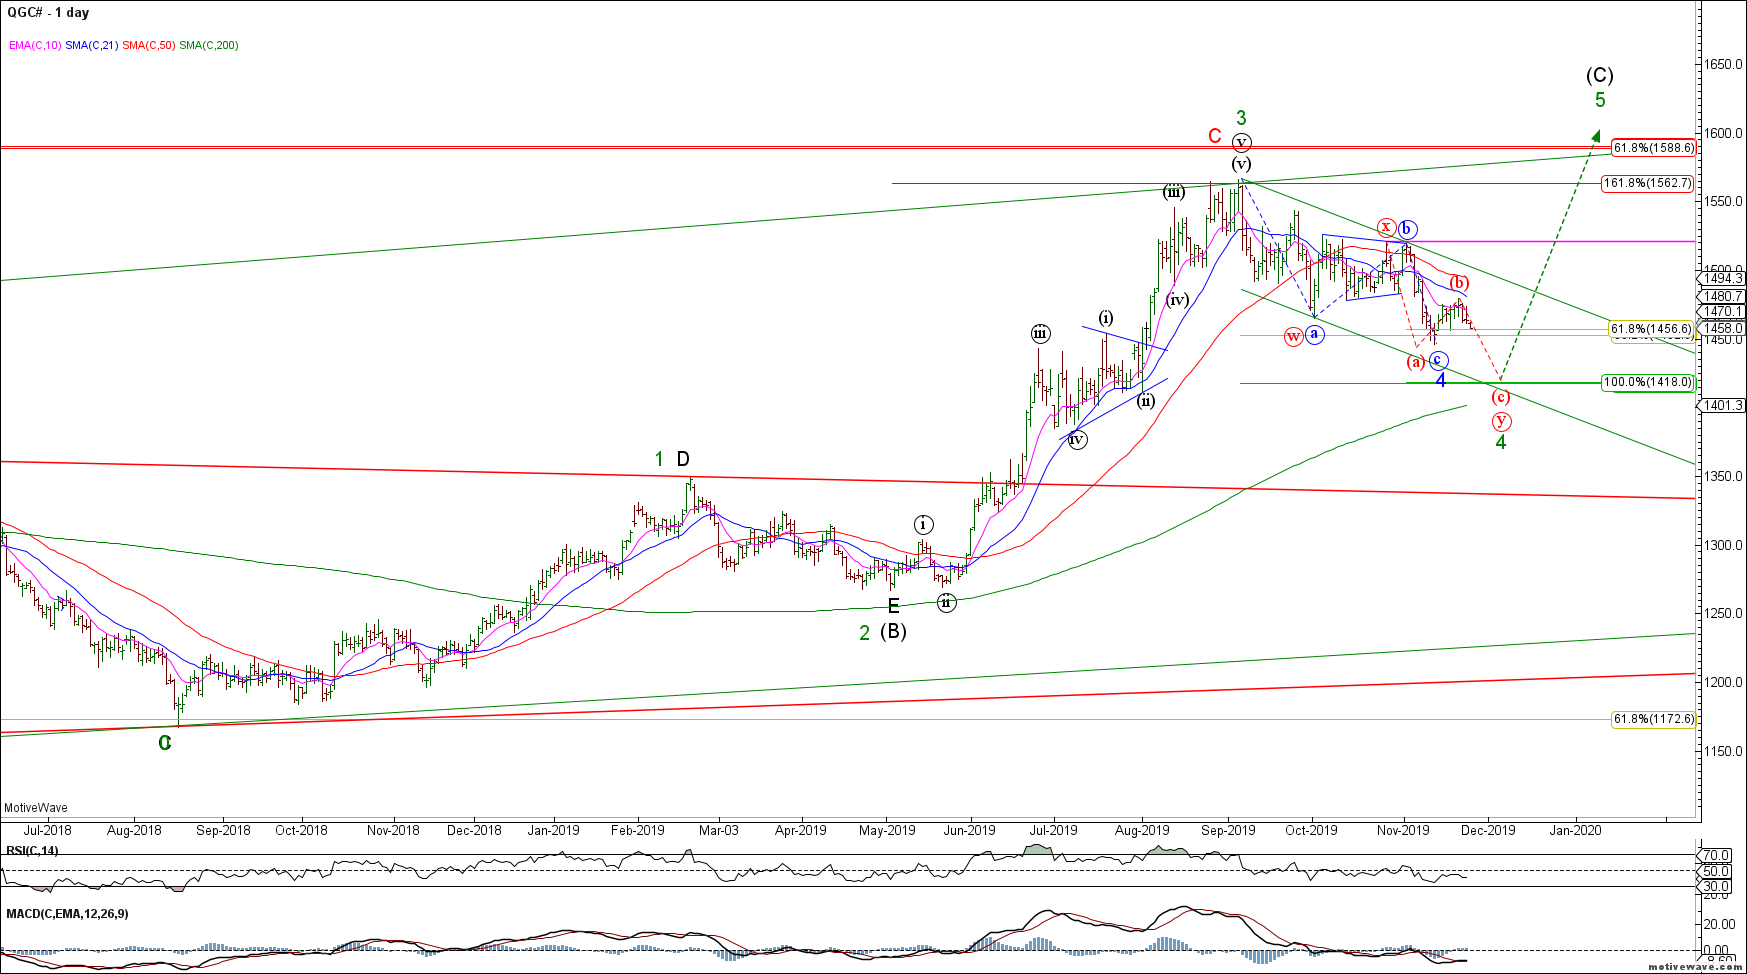
Dr Copper appears to be in a near term wave (ii) correction before the next impulse wave lower. We remain bearish.
HG H4
Copper traders closing shorts and longs.
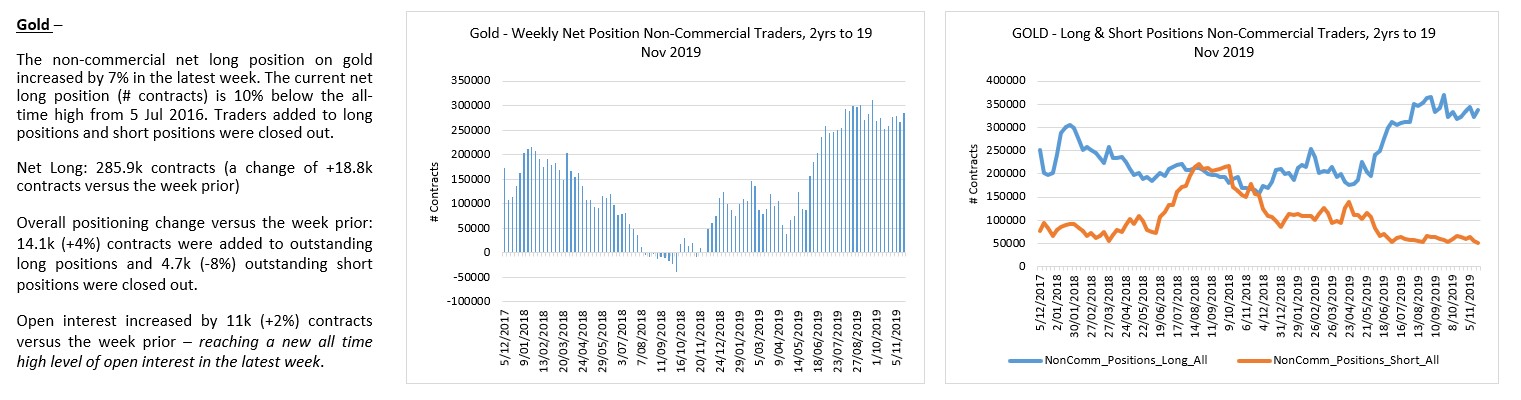
To the PM’s and the recent rally from swing lows appears corrective and likely to fail.Gold risks another wave lower towards 1418 (red count) to flush out more of the gold bugs.
Gold Daily
Gold traders remain too bullish for my liking – long side is crowded and risky.
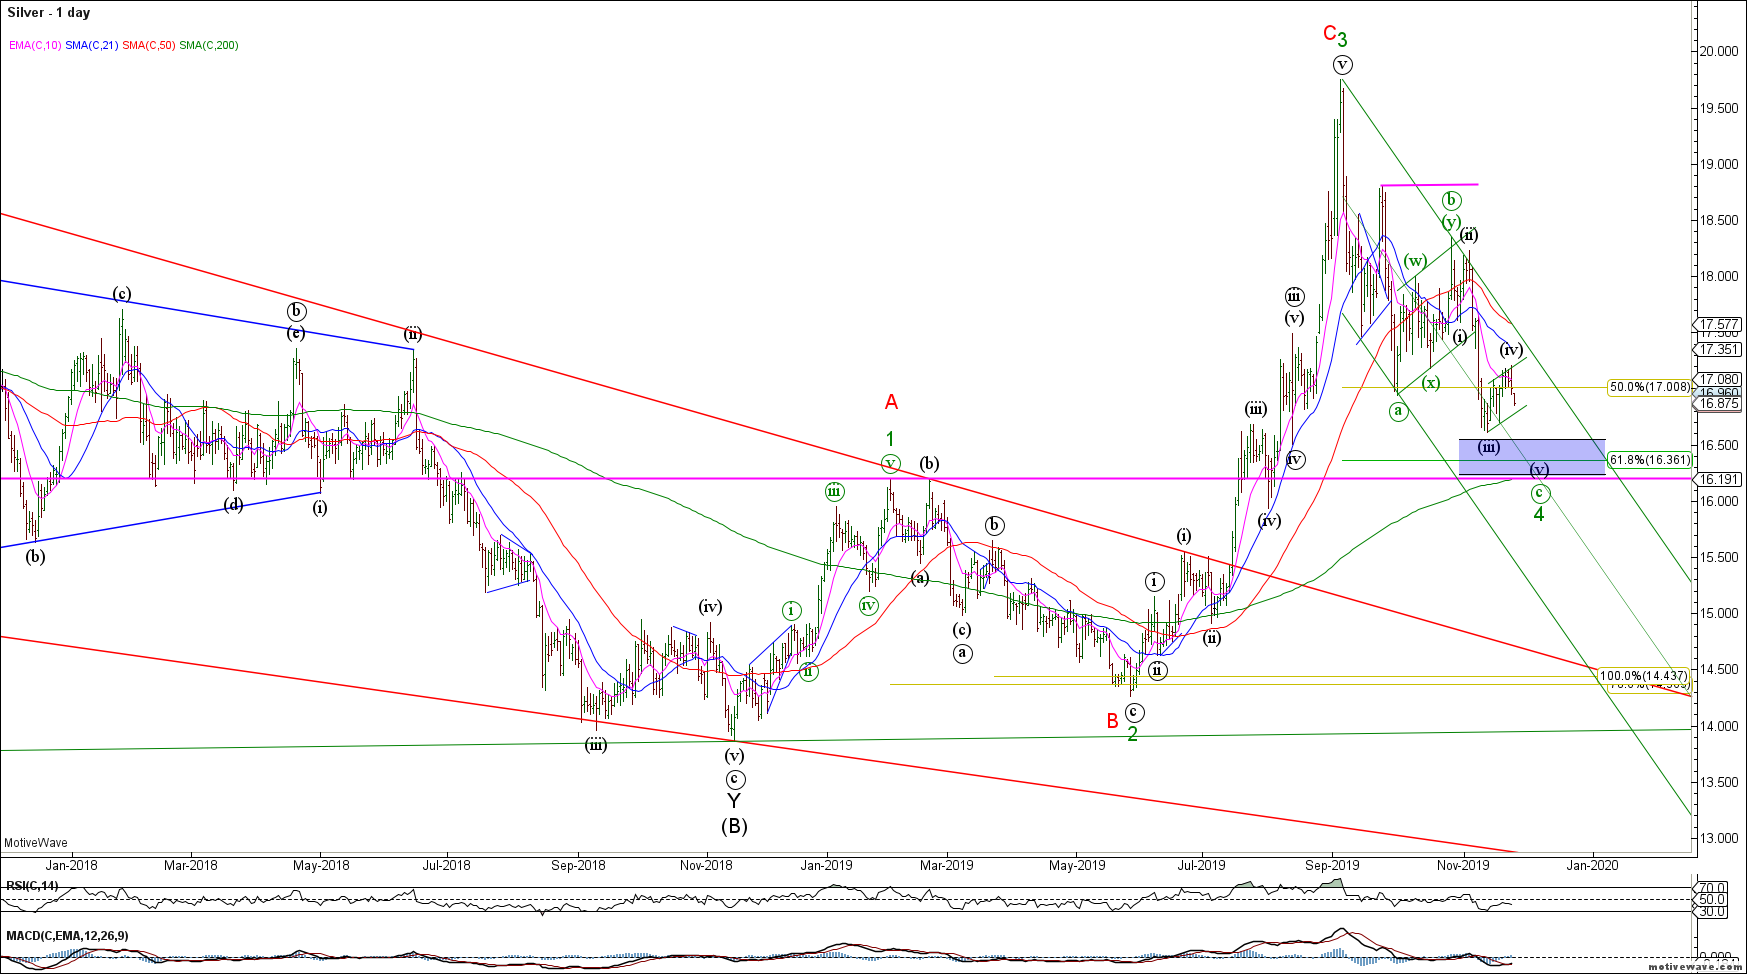
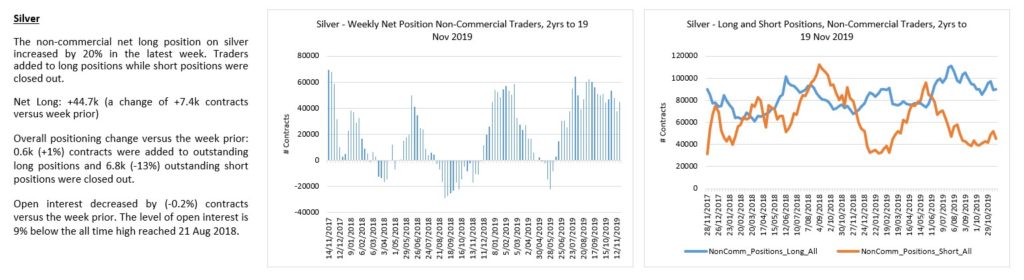
Silver continues to look bearish near term as we look for wave (v) of C lower towards the 16.30-50 area.
Silver Daily
Silver traders also too bullish here.
That’s all for now. Wishing all a happy Thanksgiving 🙂
The weekly macro review for w/c 11 November 2019 – US manufacturing data remained weak in Sep. Total industrial production declined in Sep and manufacturing led the decline. Drilling down, auto manufacturing was a notable area of weakness. Production declined at an accelerated pace of -7.1% in Oct after falling -5.5% in Sep. The NY Fed Industrial Production report still cited the GM strike as the cause of the fall in Sep. Yet, there also appears to be a demand problem. Retail sales of autos only partly rebounded in Oct after the larger fall in Sep – the official BEA data last week had total motor vehicle sales declining in Oct. Last week in the wholesale inventories report for Sep, we saw the inventory to sales ratio for autos jump to 1.8 – there are only ten months during the GFC in 2008 when the inventory to sales ratio was higher.
Prelim Q3
GDP was a highlight – growth remains subdued across Germany, Europe and Japan.
There was a small acceleration in the UK Q3 GDP growth.
The German
economy narrowly averted a technical recession. While Q2 GDP growth was revised
lower to -0.2%, the prelim Q3 GDP growth was reported as +0.1%. The full detail
will be released next week 22 Nov.
The prelim
Q3 Eurozone GDP growth was little changed, growing at +0.2% in Q3 across the
Euro area.
GDP growth in Japan slowed from +0.4% in Q2 to +0.1% in Q3. The annual pace accelerated though. The lower Q3 growth was the result of lower private consumption growth, the change in inventories detracting from growth and net exports also detracting from growth. The complete industrial production report for Sep saw production and shipments revised higher – possibly stronger ahead of the consumption tax increase. Despite the strong growth in the report, both shipments and production of one of the largest weight industry groups, transport/passenger cars, continued to decline.
Auto production remains a problematic area for Japan. In the negotiation of the phase one trade deal, the US provided no assurance that tariffs were off the table. The Japanese parliament is currently debating the US-Japan phase one trade bill with some risk that approval is delayed.
In the UK,
the lagging GDP data recorded a rebound in Q3 due to a less negative
contribution from private investment. The labour market report for Jul-Sep
continued to show deterioration in the more recent 3-month change – with
employment continuing to decline. There was no corresponding increase in
unemployed persons because participation declined over the same period.
Weakness in consumption growth appears to have persisted into Q4 with the
decline in retail sales in Oct.
Aussie data will provide some concern for the RBA. The Q3 wage growth was unchanged in the quarter and slowed on an annual basis. The labour market in Oct remained weaker with low employment growth. Unemployment increased and would have been worse except that participation recorded the first monthly decline in fifteen months. The underutilization rate increased in Oct – this is likely a large reason why wages growth has remained lacklustre and this will not be good news for the RBA. Over the last year, the combination of slower employment growth and increased labour supply have been the key drivers of the higher underutilization rate.
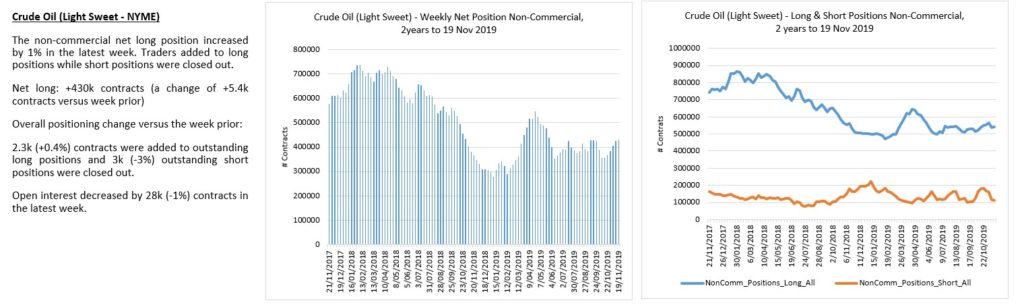
Activity in China continued to expand, but growth/momentum remains at some of the lowest levels recorded. This lower pulse of activity is likely impacting global demand and trade – given the large influence that prior Chinese stimulus and expenditure on fixed asset investment/capital goods had on global growth in the post-GFC period. Chinese consumers are also likely seeing a squeeze on real purchasing power as annual CPI growth accelerated to +3.8% on the back of higher food (meat) prices. Retail sales slowed to the equal lowest pace of growth of the last 12-months. Autos were a large contributor to the weaker retail growth, declining by -3.3% versus Oct a year ago.
There are more data releases covered in last weeks review. Use the links on the contents page to navigate to different country sections. Download the review here;
The outlook for w/c 18 November 2019 – A much lighter week of data flow. The main highlights are;
Prelim composite
PMI’s for our first view of Nov activity across the US, Eurozone, Germany,
Japan and Australia.
Central
bank meeting minutes to be released this week – FOMC, ECB and the RBA. A
relatively quiet week for US Fed speeches.
There are two other notable releases this week;
Japan CPI
for Oct – the first month after the consumption tax increase.
Germany Q3
GDP detailed release – any slight deterioration in the headline growth could
see Germany “officially” in recession.
Headline risks remain
this week;
Details of progress,
or lack of, regarding phase one of the US-China trade deal.
Possible announcement of a vote by the US House of Representatives on the USMCA.
Possible release or
decision on auto tariffs related to the S.232 report into auto imports and
national security.
The Japanese parliament
is also debating the phase one US-Japan trade deal bill. The bill will either
pass the lower house on the 19 Nov or there is the possibility of a delay. Lawmakers
remain concerned about the threat of auto tariffs.
It will be
a much lighter week for US Treasury supply. The US Treasury will settle approx.
$182bn in short term bills this week, raising only approx. $6bn in new money.
Added liquidity will be reasonably strong, especially considering the lighter issuance. There will be approx. $22.6bn in reserve management purchases settling this week – operations this week represent 42% of the total reserve management purchases for the month. The Fed will also purchase approx. $5.3bn in Treasury coupons as a part of the restarted reinvestment of principal payments.
More detail (including a calendar of key data releases) is provided in the briefing document – download the file here;
The global market melt-up continues unabated. The Fed's force feeding of liquidity continues to push asset prices to new ATH's - this, at a time when global economic growth continues to weaken. See our Macro Briefing Notes for details... The SPX / ES continues to thrust higher in what is likely to be a wave […]
The weekly macro review for w/c 4 November 2019; There were several important highlights in the US data this week – mostly reinforcing the weaker state of growth.
Factory
orders for Sep indicated the continued
weakening growth across several of the larger categories – motor vehicle bodies/parts,
non-defense aircraft and machinery. The annual decline in orders remains more
moderate than in 2014-16 but growth in 2019 has slowed from a much higher level
this time. Either way, the slower growth in orders may weigh on future shipment
growth.
The factory orders
and wholesale sales reports for Sep both highlighted the increasing value of inventory
especially across motor vehicles, machinery and metals in Sep.
Motor vehicle sales
in Oct fell relatively hard (seas adj basis) – for both autos and SUV’s. This
suggests that weakness in orders and shipments and increasing inventories is
likely to persist.
Consumer credit
growth halved in Sep – led mostly by non-revolving credit (helping to explain
to the weaker auto sales) but credit card credit also declined for the second
month.
Despite the weaker credit
growth and declines in new car sales, consumer sentiment data remains robust. The
Nov prelim sentiment readings pulled back only slightly from the larger
increase in Sep and Oct. Commentary remains positive, although there was a note
about consumers becoming more cautious spenders.
The other major highlight
in this weeks’ data was the JOLTS report. It was widely reported that job openings
continued to decline. But there was also a deterioration in the separations
data – namely a larger increase in Sep for layoffs and discharges. This has
been a one-month event so far, so it will be something to watch.
Reports into
services – ISM and Markit seemed to diverge at the headline level. But
underlying both reports, was further falls in unfilled orders continuing to
support business activity. The new orders index in the ISM indicated a negative
underlying shift in firms reporting increasing new orders, yet the new orders sub-index
increased anyway. The Markit services PMI indicated declining new orders and
employment.
Manufacturing PMI’s
out of Europe were little changed at the current levels of decline. Services
activity improved slightly but the underlying performance detail was less
positive.
Germany factory
orders in Sep improved – somewhat at odds with the Sep PMI that indicated a
further pulse lower in new orders. The factory orders data was weaker only in
intermediate goods and durable goods, which was offset by stronger growth in
orders across capital, consumer and non-durable goods. On an annual basis
though, orders for the domestic and Euro-area markets declined at a faster
pace.
Germany industrial
production was much weaker in Sep. Levels of manufacturing production in Sep
were at their lowest levels since the peak in this part of the cycle – so no
sign of a bottom in manufacturing this month. The growth in orders though
suggests that this may improve in the near future. Utilities and mining
production both recorded growth in the month but remain well below a year ago. Construction
was the only area to record growth in the month and on an annual basis.
In Australia, the
RBA kept rates on hold. While the Board expected the recent declines in the cash
rate to support growth, it acknowledged that it was ready to ease further if
required.
The RBA Board noted that a ‘gentle turning point’ may have been reached in the Australian economy. This was referring mostly to the new upswing in lending for housing and the subsequent anecdotal increase in house prices. Lending for housing has improved somewhat led almost entirely by owner occupiers. At the lowest point, lending for housing was 28% below the peak and that has now improved/grown in several months to be 17% below the peak in lending. Meanwhile Aus retail sales for Sep were disappointing. In real terms, retail sales declined on an annual basis for the first time since the recession of the early 90’s. Nominal retail sales growth remained at +2.5% for the year. In the UK, key sectors such as Services continue to stagnate amid the Brexit uncertainty. But with the general election coming up, firms and the BoE MPC noted that those uncertainties would likely begin to fade and growth would pick up into 2020.
There are more data releases covered in last weeks review. Use the links on the contents page to navigate to different country sections. Download the review here;
The outlook for w/c 11 November 2019; A full calendar of data and US Fed speeches this week.
Highlights in the
US; Fed Chairman Powell will testify before the Congressional Joint Economic
Committee and House Budget Committee on Wed and Thu respectively. The US Fed Vice
Chairman Clarida will also give a speech at the Swiss National Bank on Monetary
Policy, Bond Yields and Price Stability on Tue.
Key highlights on
the data front include CPI, Retail Sales and Industrial production for Oct.
The data dump out of
China will be important this week as we continue to look for signs of improved/changes
in demand. Highlights include trade balance, industrial production, retail
sales, CPI, PPI and new loans (since the lowering of the benchmark rate).
Prelim Q3 GDP data
will be released for Germany, the broader Eurozone, Japan and the UK – all important
barometers of current activity.
A heavy week of UK
data also includes CPI, retail sales and the labour market. The PMI’s have indicated
the economy stagnating as a result of Brexit uncertainty but expecting some
lift in the Oct data, especially retail sales, as consumers prepared (brought
forward purchases) for Brexit at the end of Oct.
The final Sep
industrial production report for Japan will be important. The prelim headline
numbers were stronger for the month, but there was notable weakness across some
categories including passenger cars.
In Australia, the
important labour market report for Oct and Q3 wage price index will be released
this week. This
will be closely watched by the RBA.
Headline
risks this week; details of phase one of the US-China trade deal, a possible
vote on the USMCA to be announced and the possible release or decision on auto
tariffs related to the S.232 report into auto imports and national security.
It will be a heavier week for US Treasury supply. The US Treasury will settle approx. $266bn in short term bills, notes and bonds this week, raising approx. $40bn in new money. There will be approx. $41bn in securities on the Fed balance maturing on 12, 14 and 15 Nov. There will be no reserve management purchases settling this week. The Fed will purchase approx. $3.4bn in Treasury coupons as a part of the restarted reinvestment of principal payments.
More detail (including a calendar of key data releases) is provided in the briefing document – download the file here;