
MCP Market Update: January 17th, 2017 – Bull market remains in tact
MCP Market Update: January 9th, 2017 – US$ Inflection Point
MCP Market Update: January 3rd, 2017 – New Year Ahead
As promised I’ve undertaken a strategic review of my outlook for 2017. I hope you get some value out of my planning for the year ahead – it took a week to write so I hope you enjoy it!
2017 is now upon us and we expect our themes of strong equities to continue. We are yet to see the market fully commit to this bull market as we continue to climb a wall of worry. Our forecast for 2016 was that we would see new ATH’s for global equities as the US took the lead on the global recovery. Our forecast 2017 is for higher equity prices as we continue this big picture wave V rally from the 2009 post-GFC lows – remember, this is an ENDING wave and we are currently in wave 5 of V as we expect this rally to end in 2017.
Our macro backdrop for 2017 includes rising global interest rates which will ultimately result in a tightening of financial conditions around the globe bringing about the end of the equity market rally. The world now has more net debt than prior to the GFC which has been sustained by low yields – the end result will be debt-deflation-destruction of capital so enjoy these healthy happy markets while you can as the party will likely end in 2017.
Our expectation is that global bond yields bottomed in 2016 and we should now see a multi-year rise in yields – not necessarily because the world is a better place and economic growth is expanding but rather credit risk and tightening financial conditions will lead to a failure of trust in the global monetary system.
Geopolitically, we will likely see the break-up of the European monetary experiment which will result in member nations like Greece and Italy depart the Euro as they reach to print their own money to help with balance sheet repair (like the US did) – this will be very bullish for the German led Euro currency – EW analysis confirms that this near term decline in the Euro and GBP should be a 5th and final wave down of major degree leading to big picture trend reversals in 2017. We are likely to see a rise in global isolationism led by Trump’s US-centric policies which will ultimately resolve in greater protectionism and decline in global trade – this will be a significant headwind for global equities in the latter half of the year.
Our strong US$ theme will be a major headwind for Precious Metals throughout 2017 as we look for much lower prices as gold ultimately targets $700-800 to the downside.
While the US equity markets have already achieved minimum conditions of wave 5 of V with new ATH’s, we expect this rally to continue to measured targets in the 2500 area for the SPX. At some point in 2017, we expect to be reversing our bullish bias and shift to strategic short positions when this rally ends. Trading a fast moving bear market is notoriously difficult as volatility expands but we will do our best to keep on the right side of the market. “IF” we are correct, the bear market should retrace the entire rally since 2009 but let’s not put the cart before the horse.
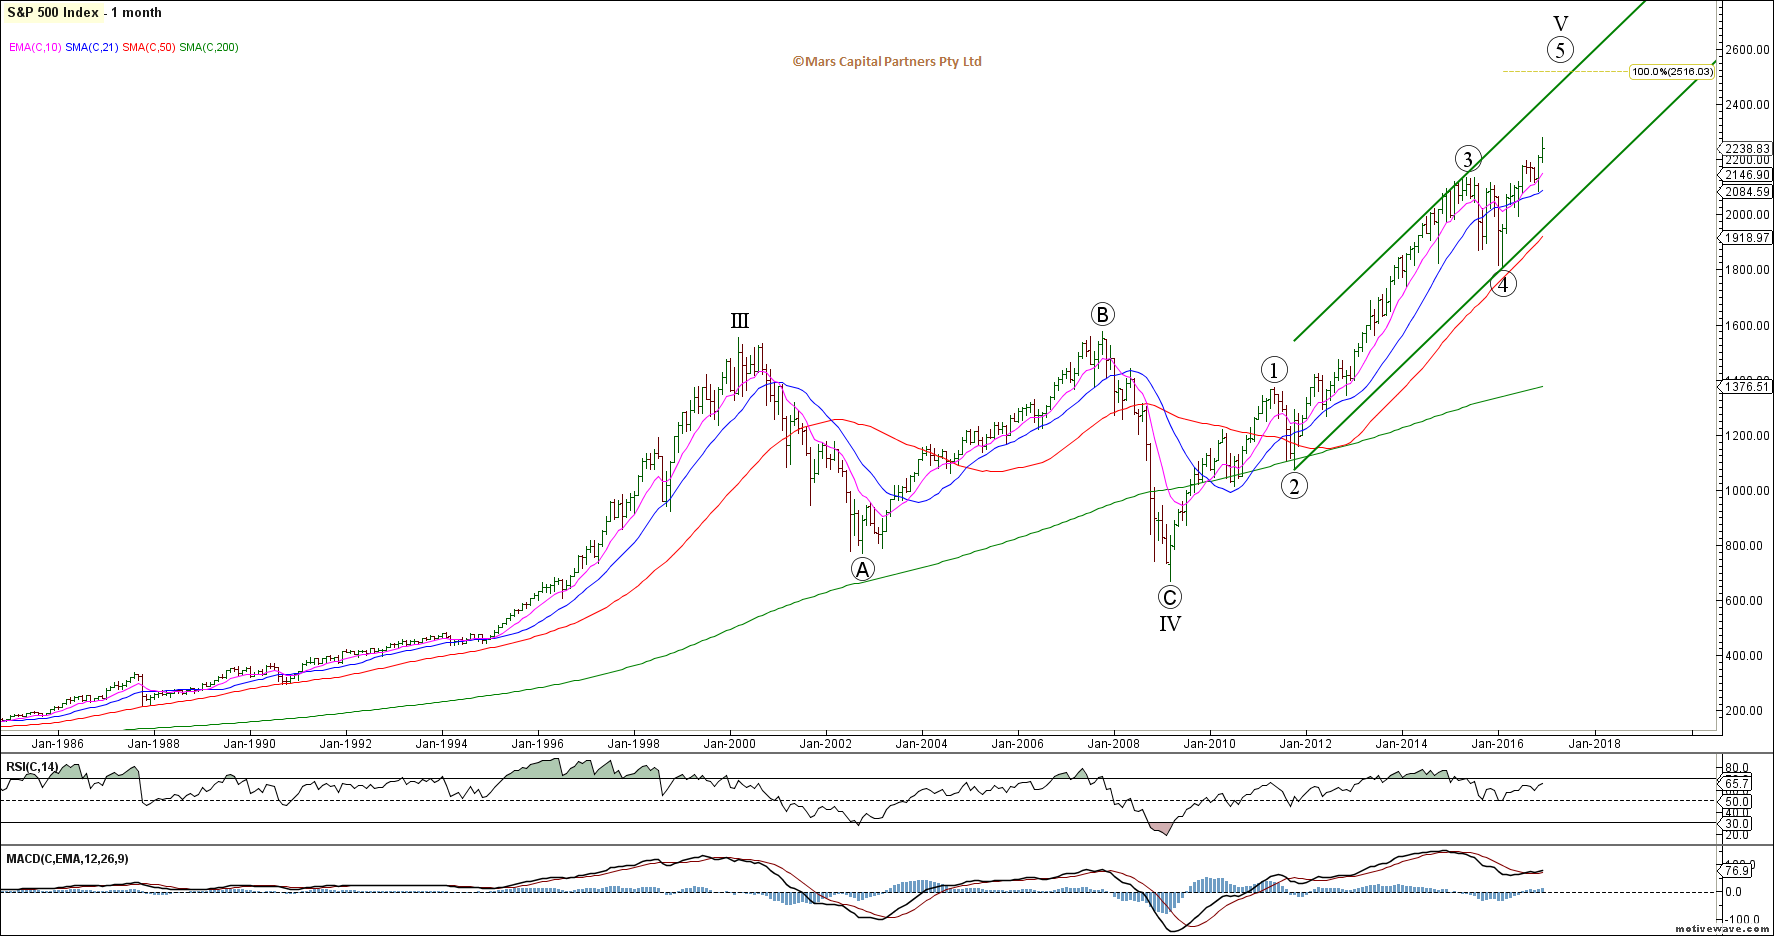
SPX Monthly
Our near term count suggests we are in wave (iv) of iii of 3 and the new year should kick off wave (v). This impulsive wave count may need to be revised on trade below 2214 – we remain resolutely bullish until proven otherwise.
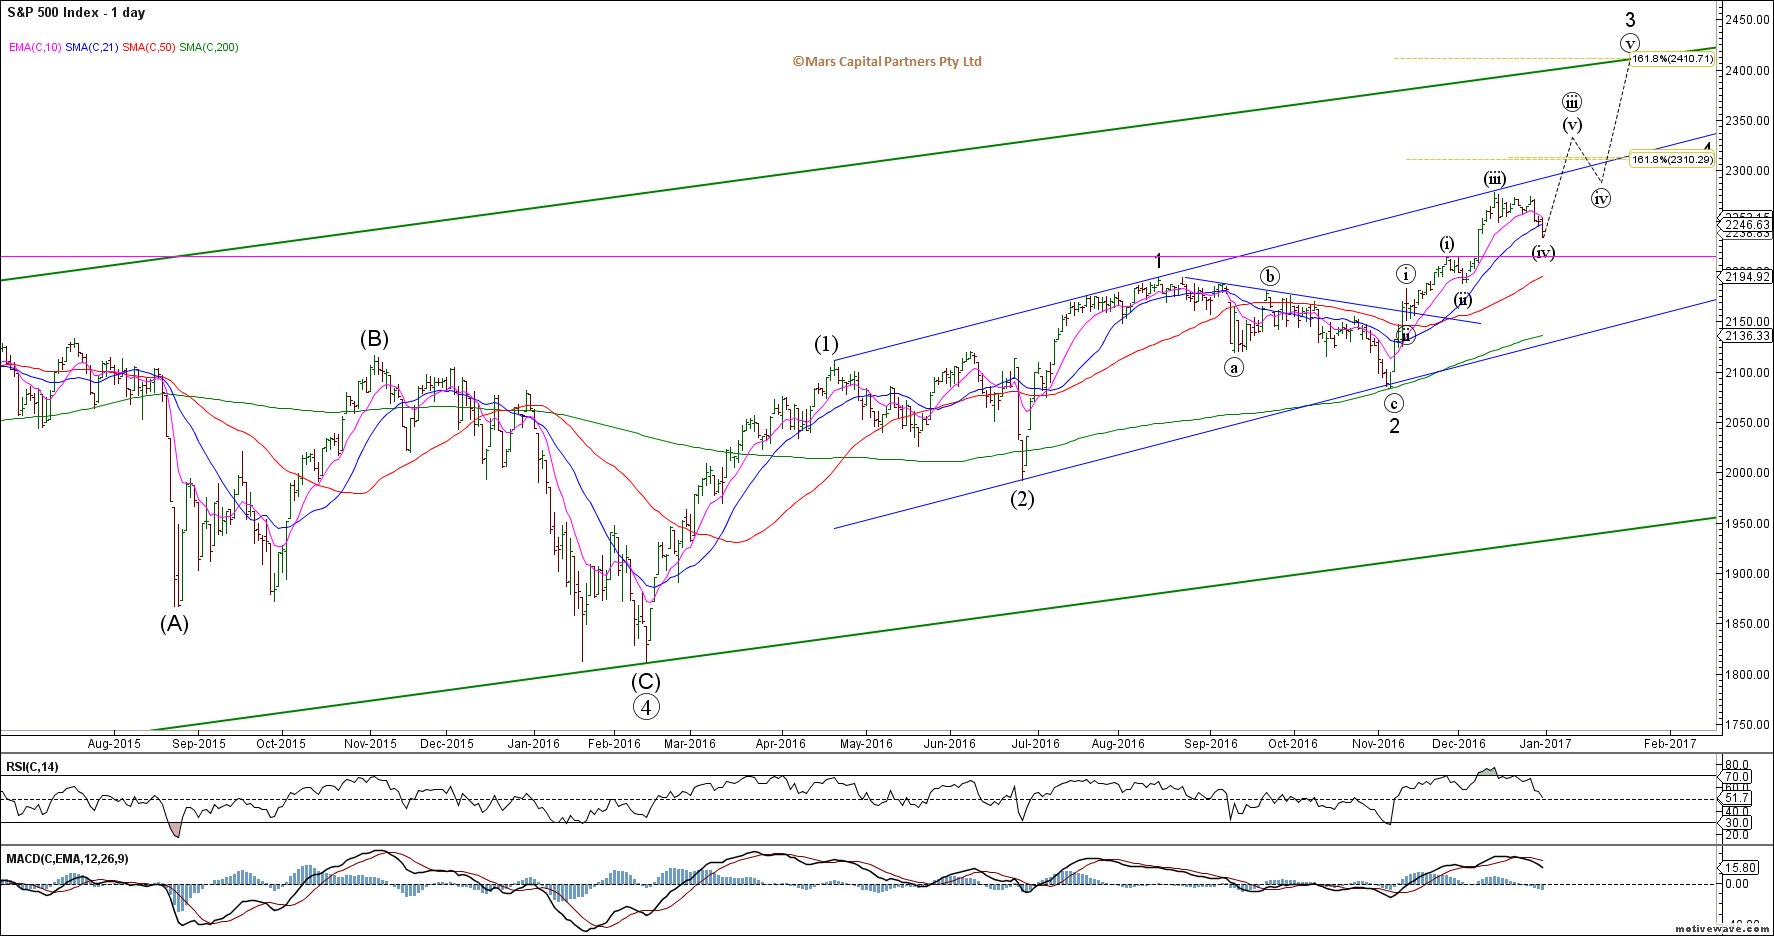
SPX Daily
The ES_F shows the same impulsive rally pattern and remains in force as long as there is no overlap between wave (i) and (iv) below 2210.
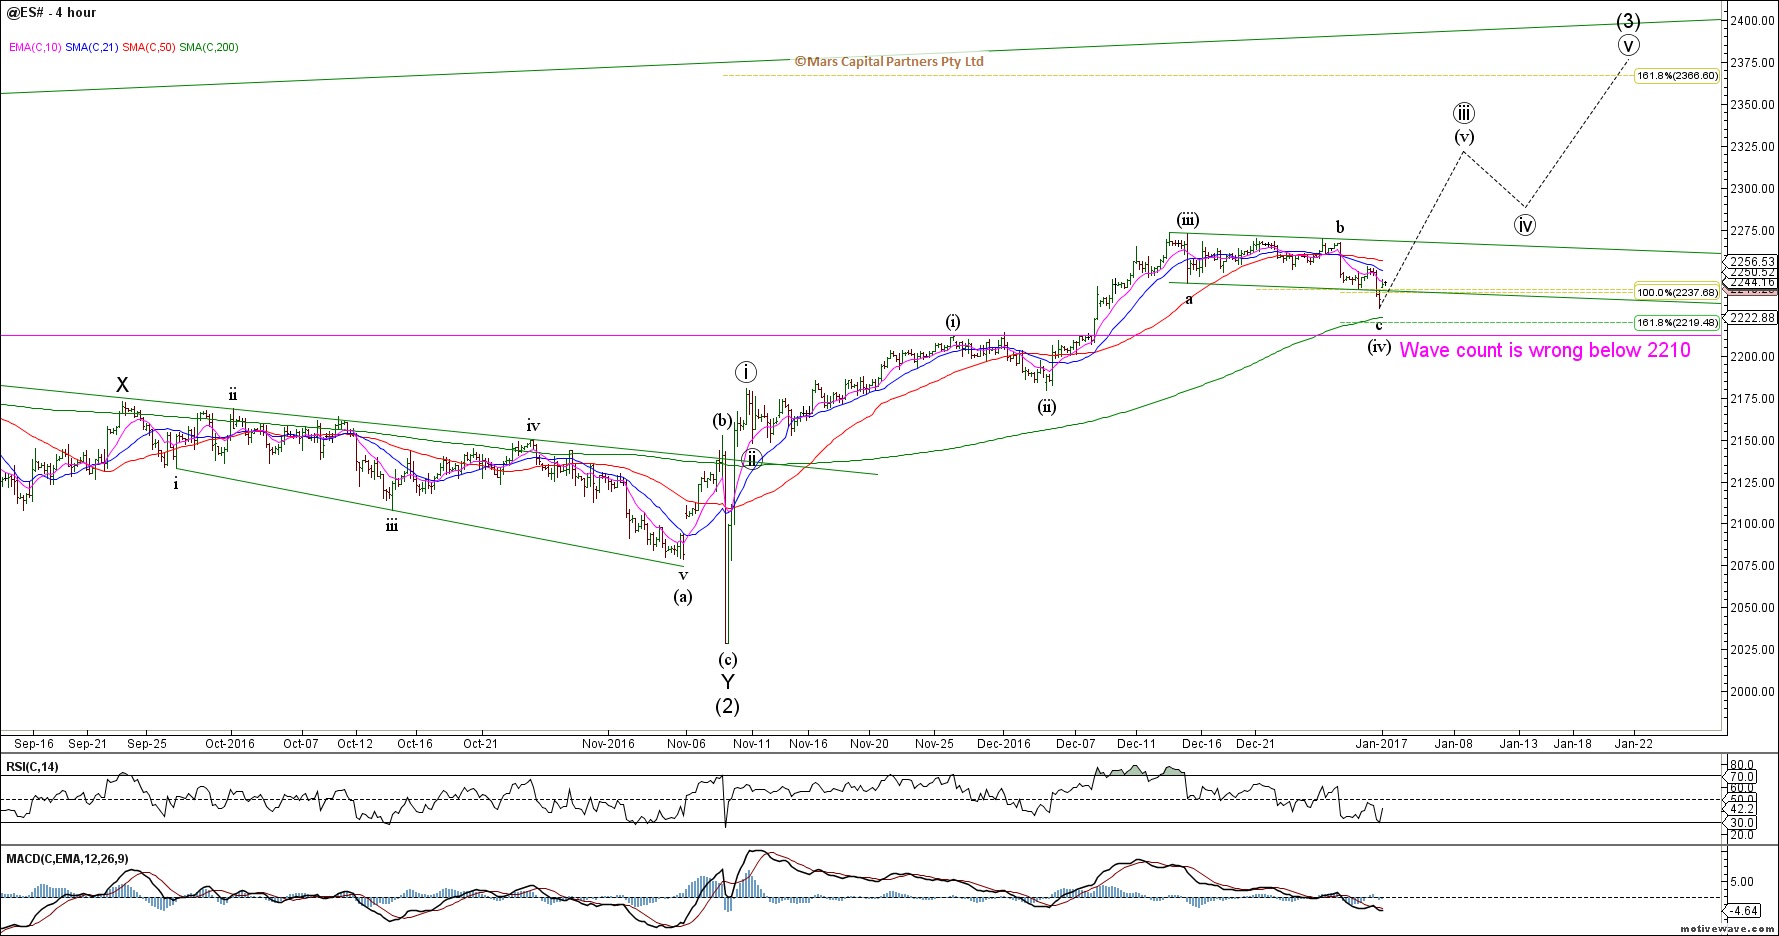
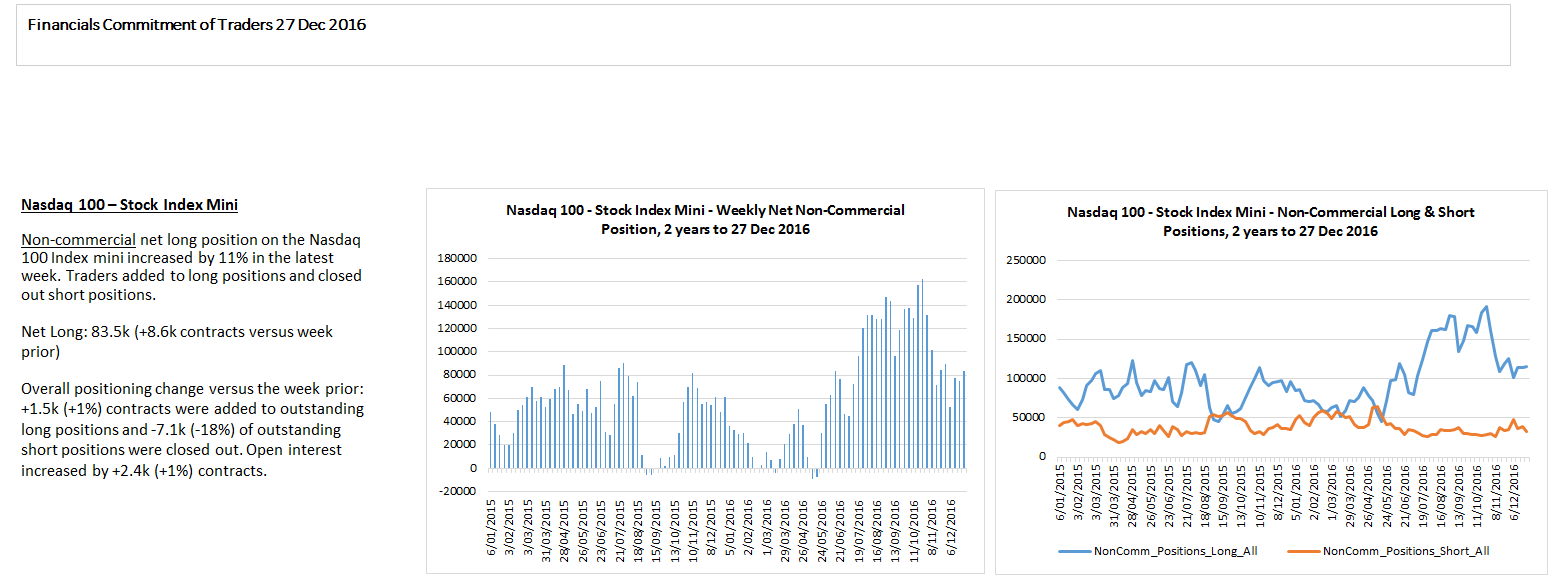
ES_F H4
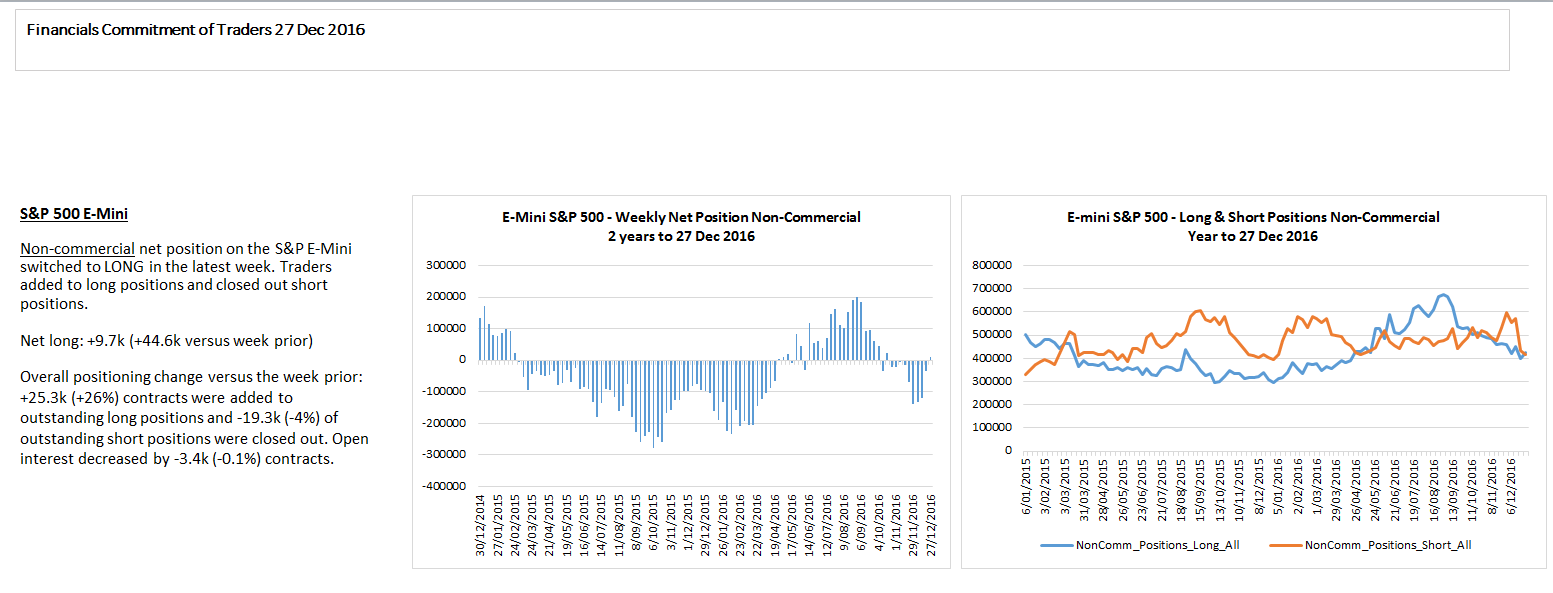
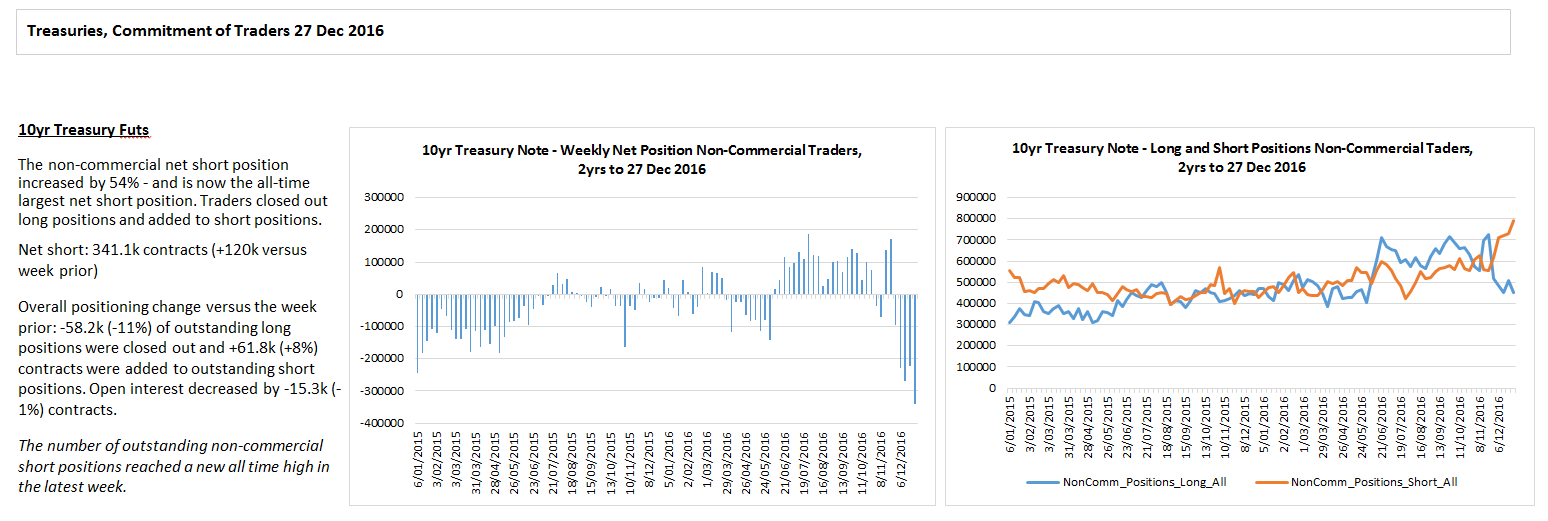
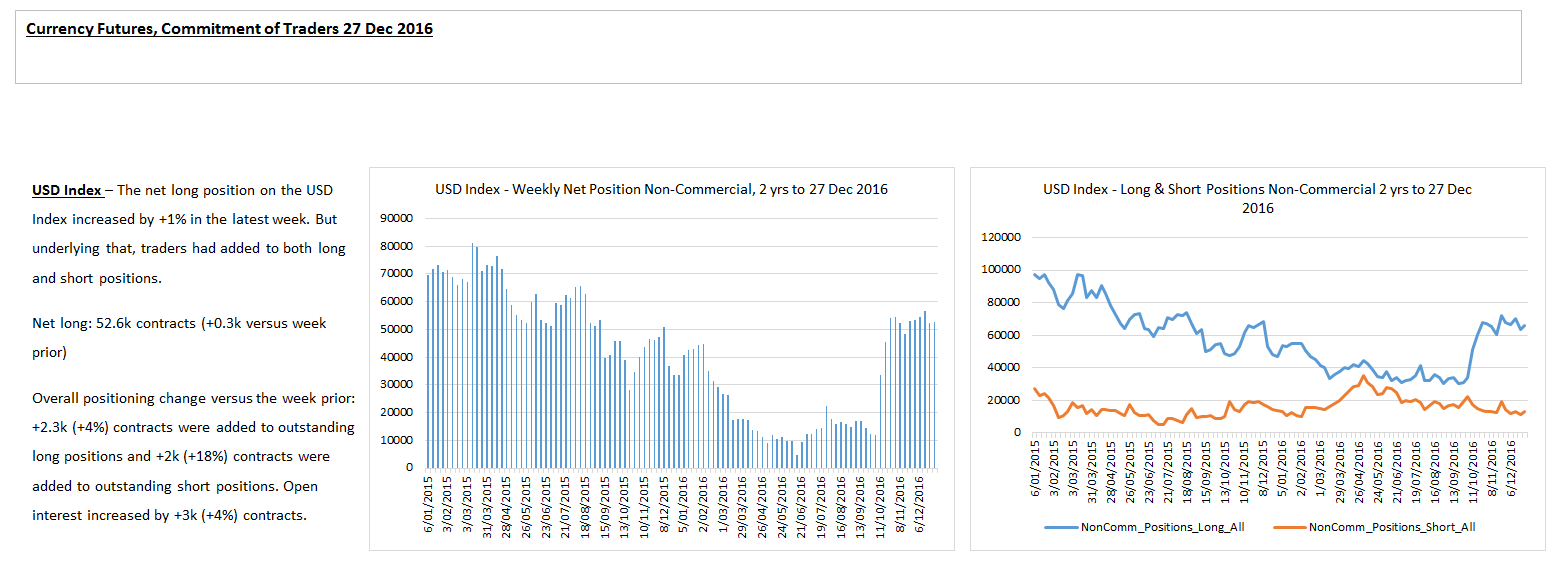
As we can see from the latest COT data, Traders have not yet bought into the nature of this rally and remain sceptical of the upside potential.
Our bigger picture upside targets for DJIA remains towards 22000 to complete wave 5 of V.
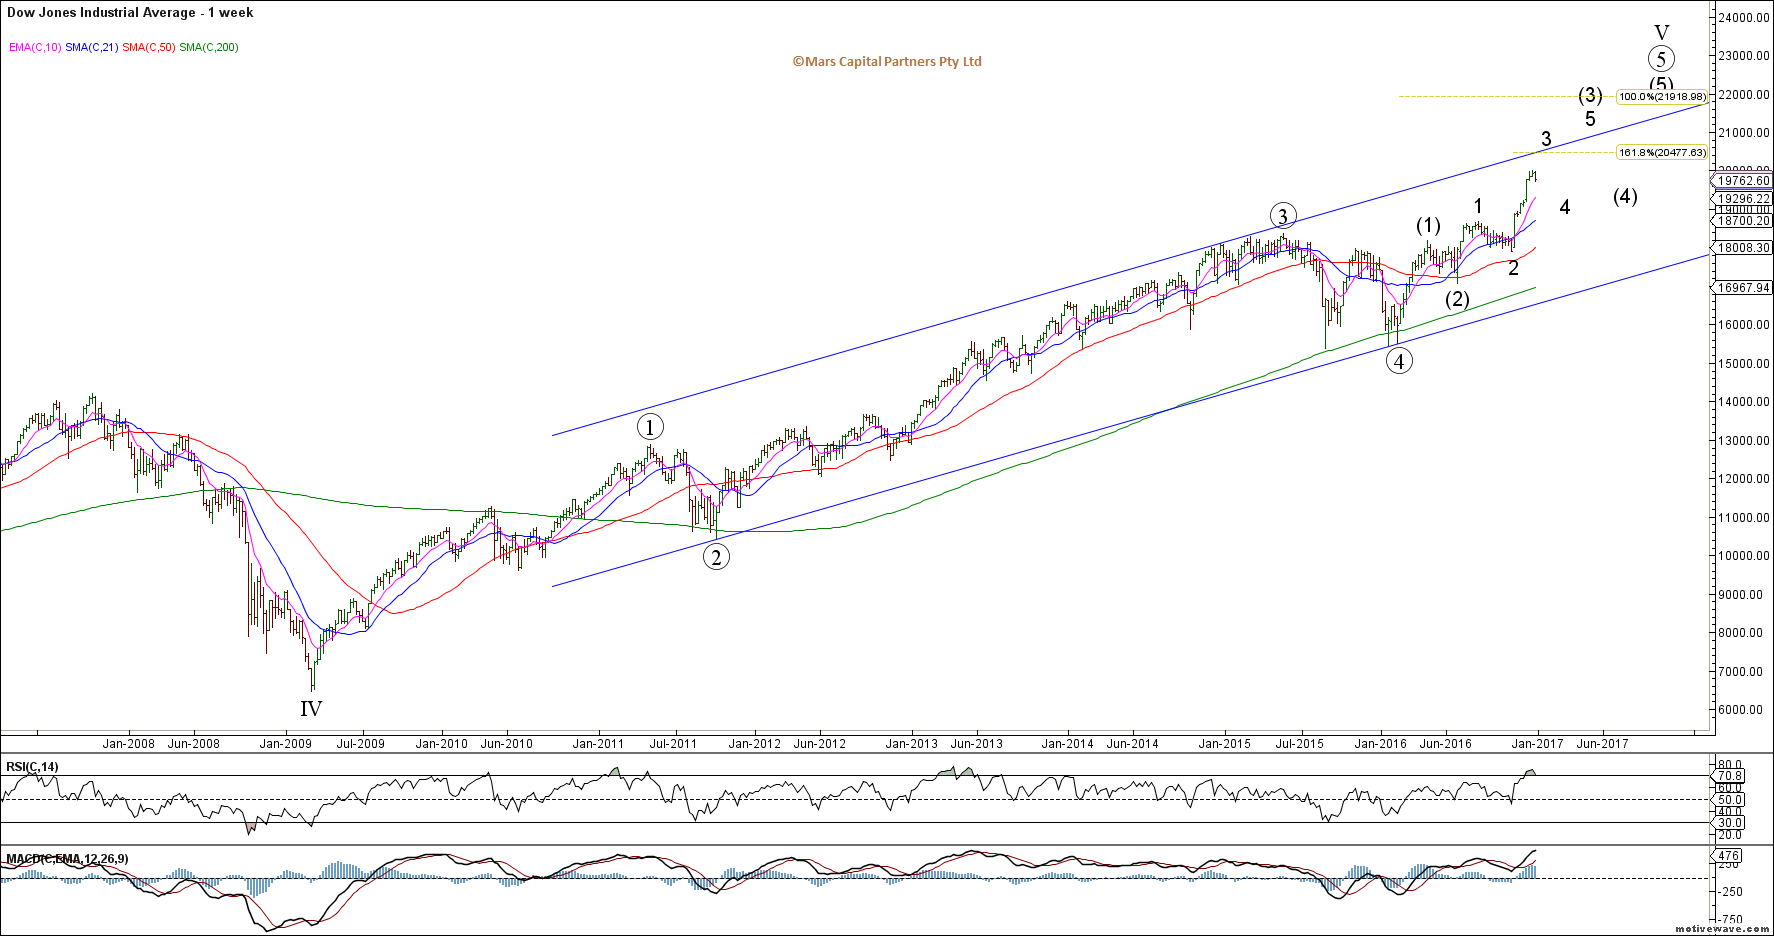
DJIA Weekly
The Nasdaq continues to look bullish to me despite last week’s low volume decline as long as it holds support in the 4810-50 area. I expect this decline was wave c of an expanded flat (as Tweeted last week). What we want to see is an impulsive rally higher from here.
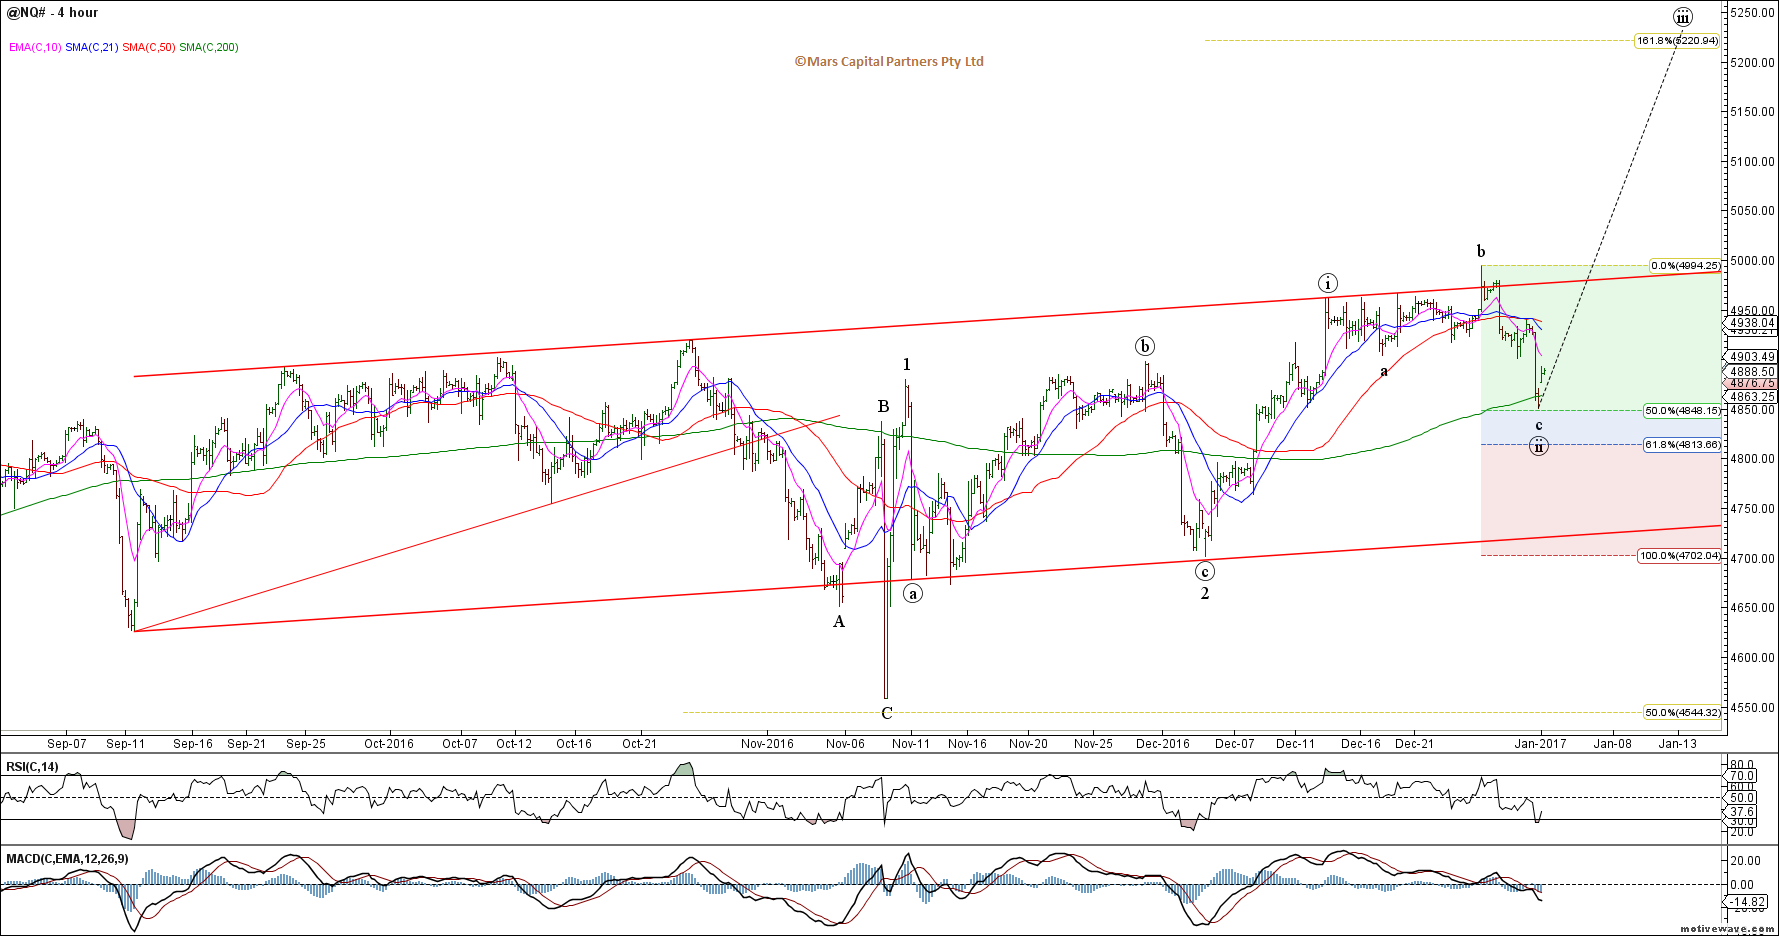
NQ_F H4
Our bullish bias in the European indices as our favourite pick has been well rewarded. The most important feature on the Dax chart is the fact that we now have a confirmed corrective 3 waves down from the 2015 highs – we must then expect new ATH’s for the European indices. In the near term, we have a cluster of Fib resistance in the 11650 area but I expect we will eventually push higher as shown below.
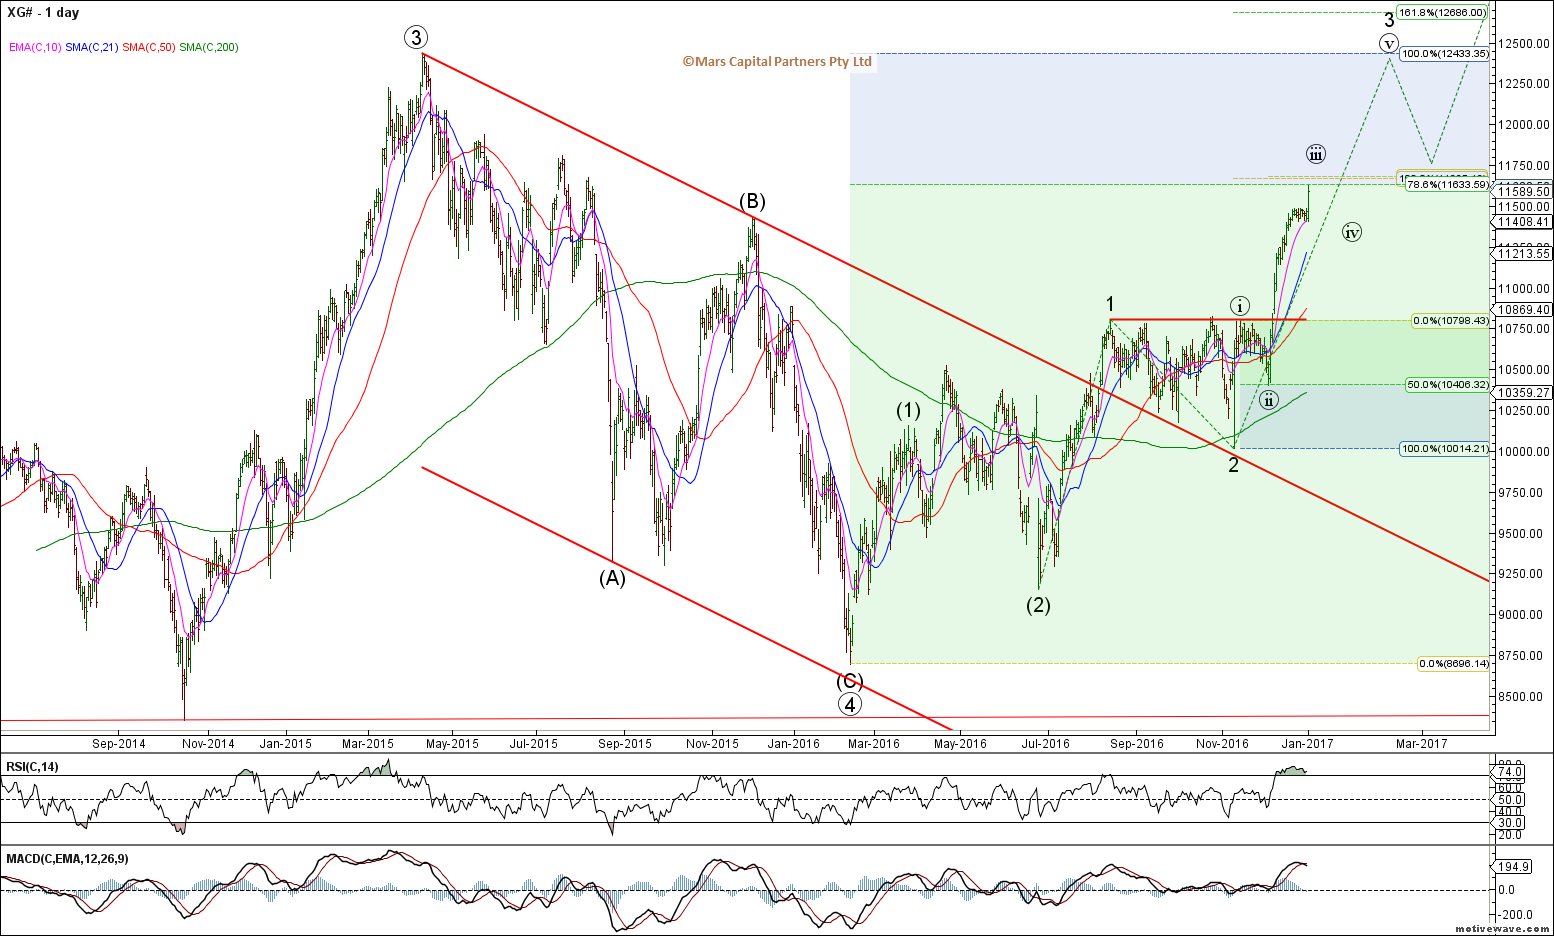
DAX Daily
As highlighted a few weeks ago, the FTSE was poised to reverse higher and we are now challenging ATH’s once again. I see nothing bearish in this chart to alter our bullish bias.
FTSE Daily
The Nikkei 225 has stalled at the 0.786 Fib retracement as has the USDJPY. So far the decline is only in 3 waves so we need to give the bulls the benefit of the doubt as we look towards new cycle highs.
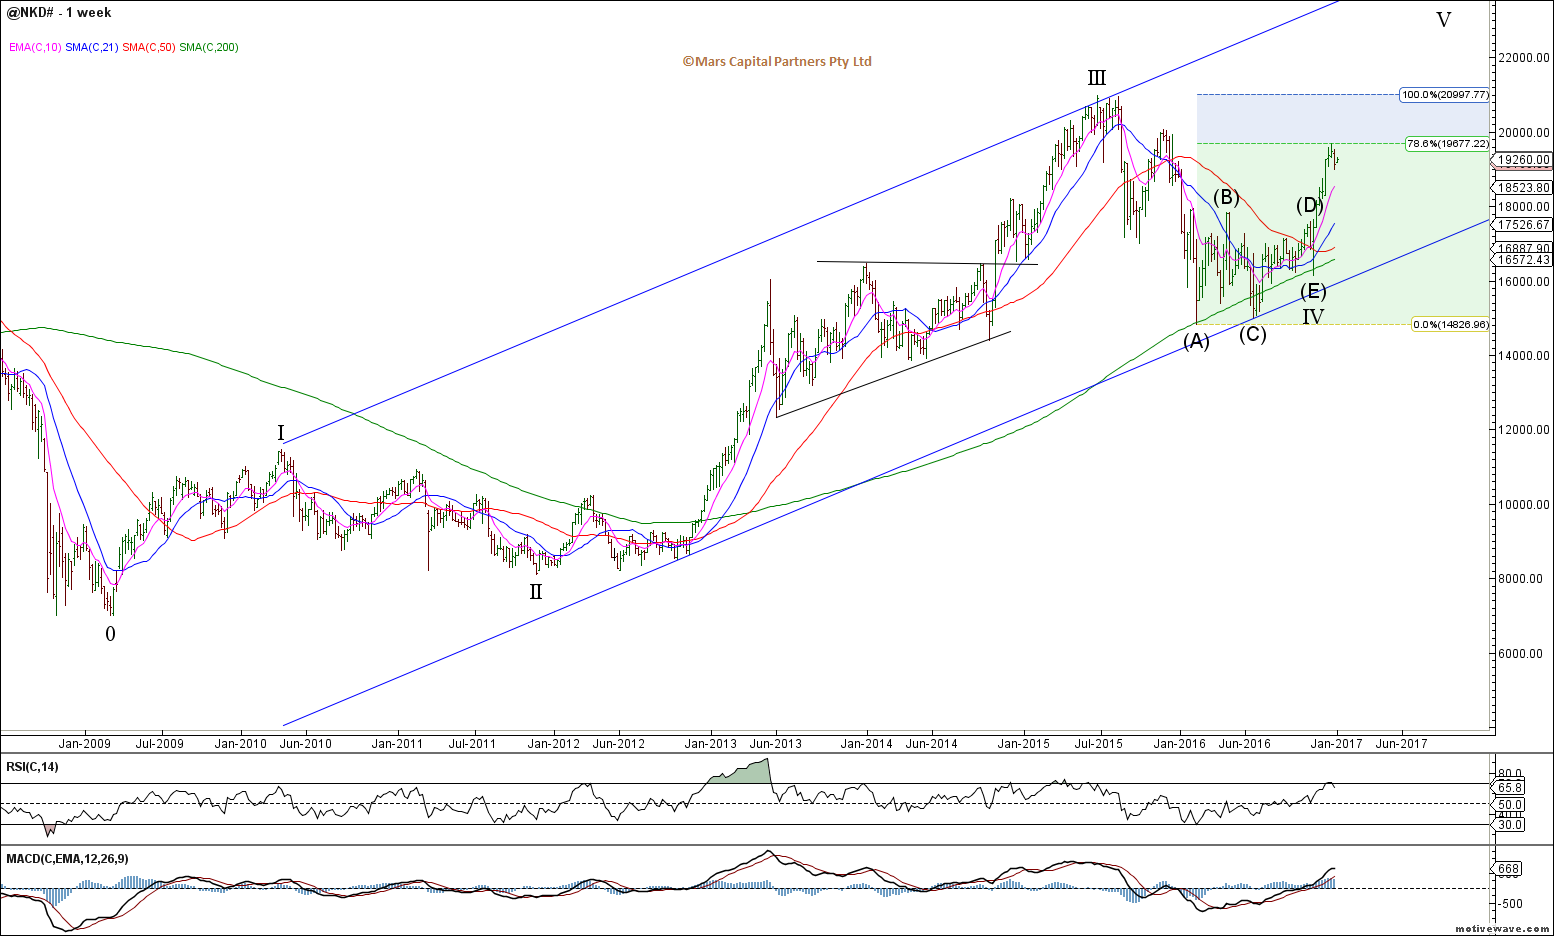
NKD Weekly
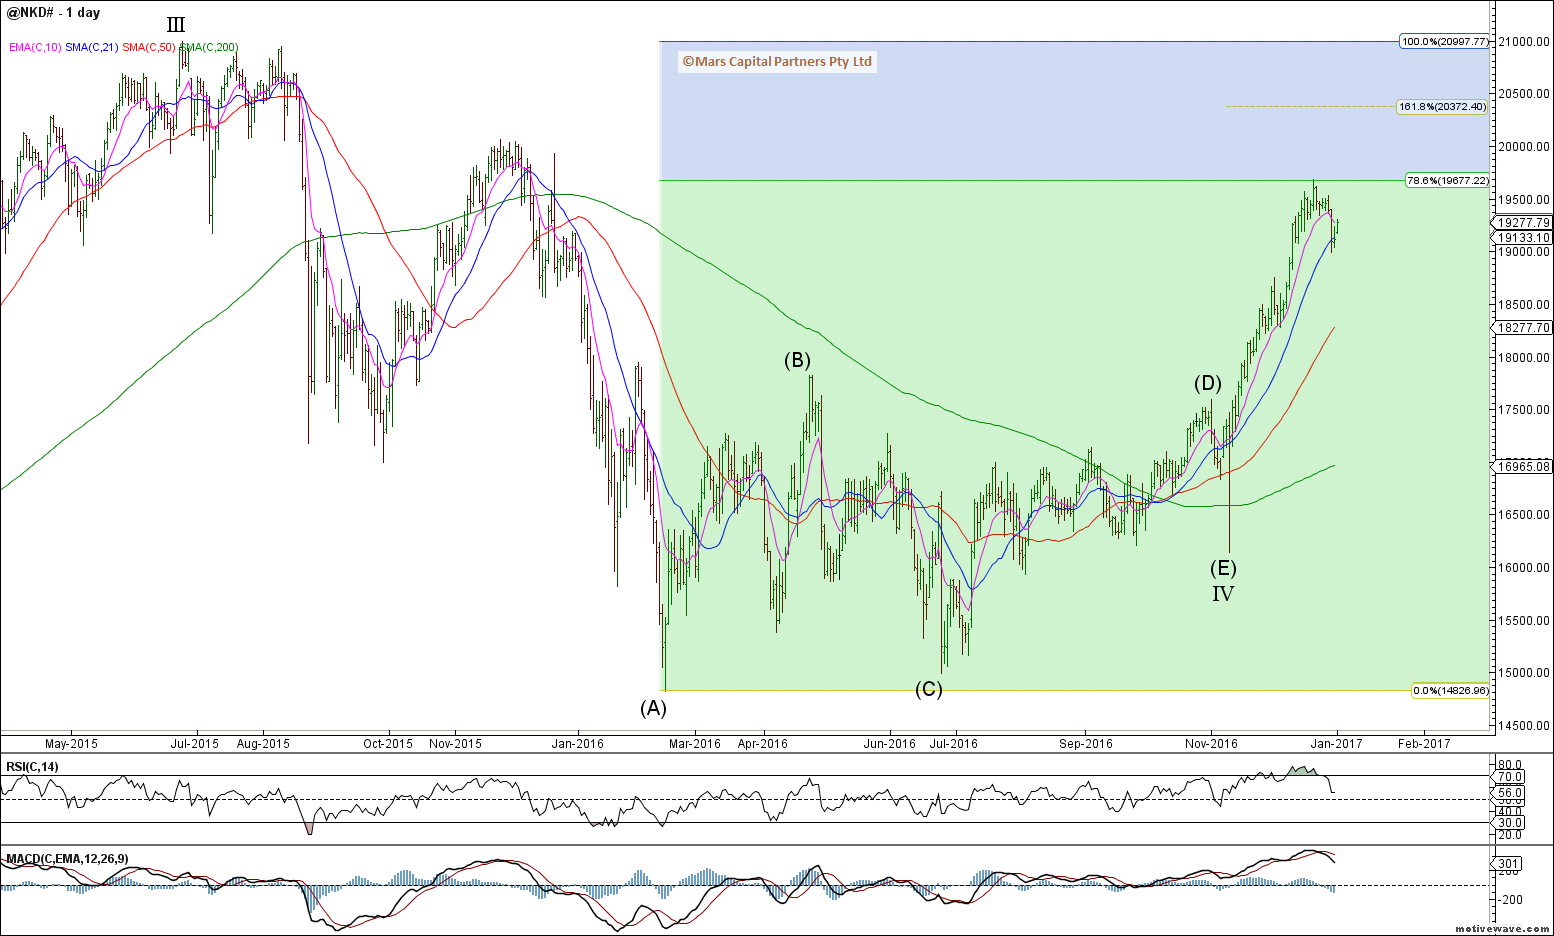
NKD Daily
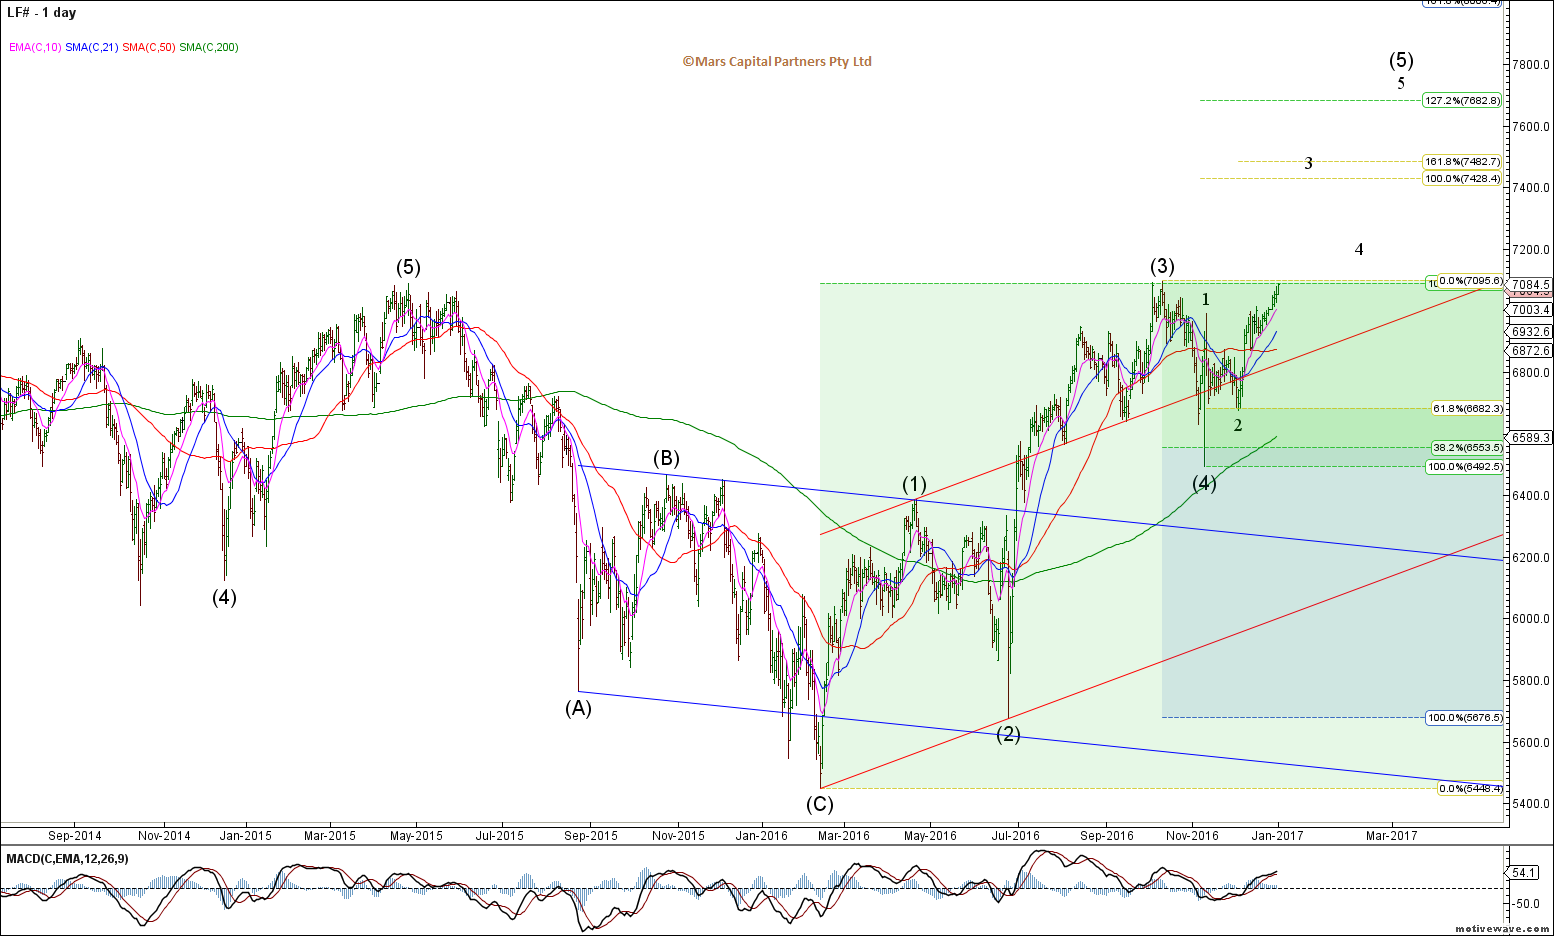
As posted last week, the ASX200 continues to extend higher towards the 0.786 retracement. This wave count is particularly unclear but you can’t fight a market with higher highs and higher lows. With the global bullish bias, I will only get short the ASX200 when the market tells me to. In the meantime I have no interest trading this as it is the most unclear pattern.
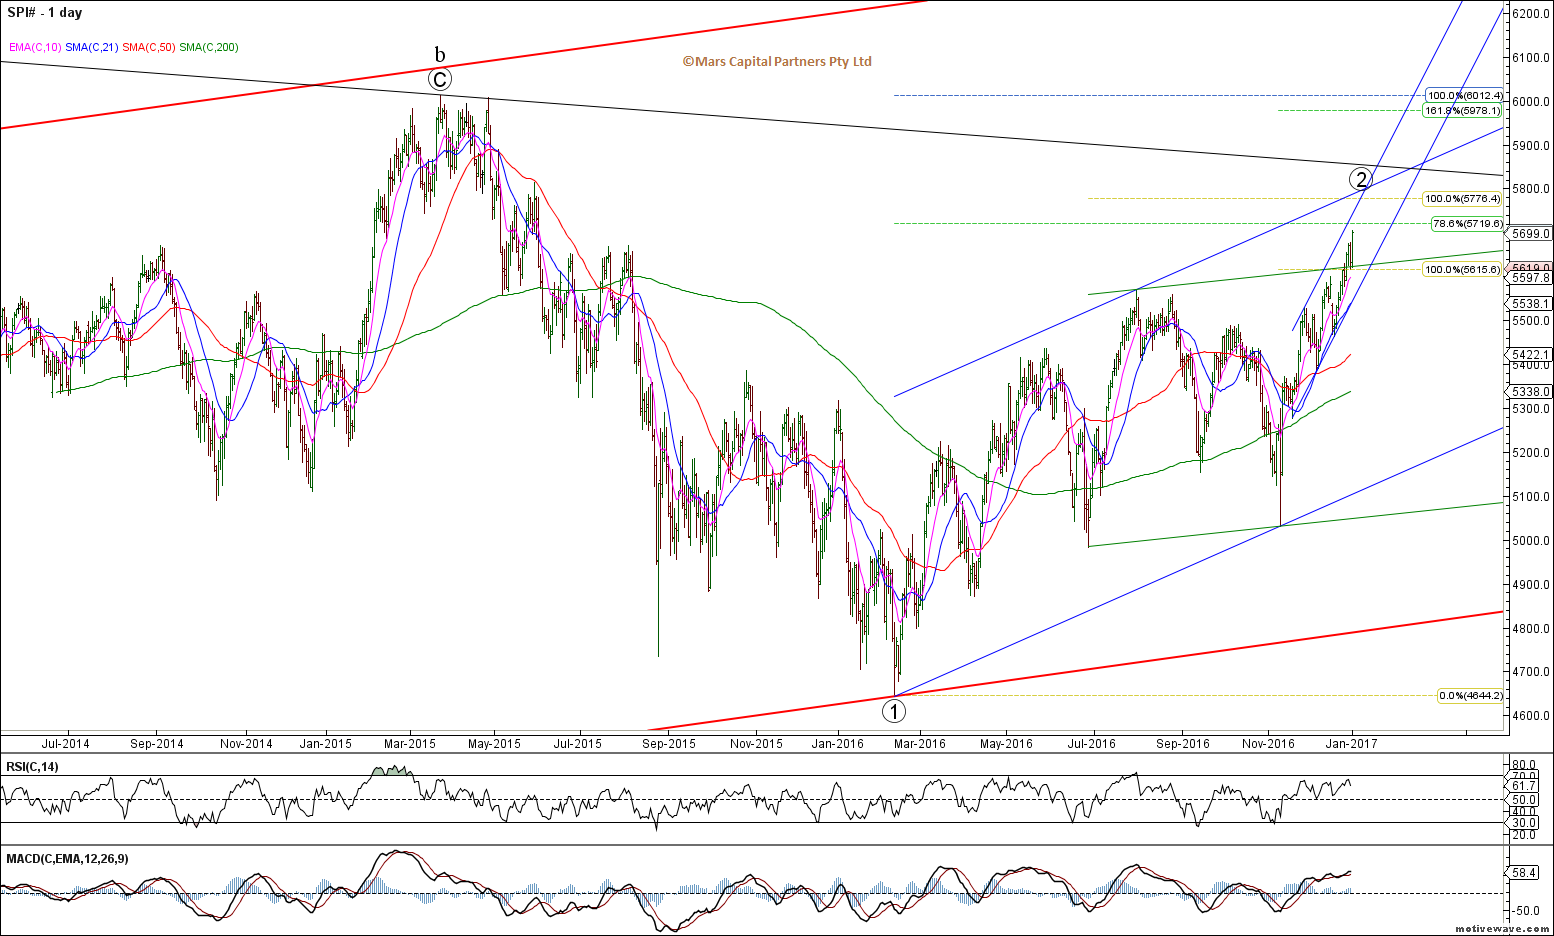
ASX200 (SPI) Daily
To the US bond market and the counter-trend rally continues as expected in this 4th wave. We remain very bearish bonds in the bigger picture and will continue to look for levels to get short again.
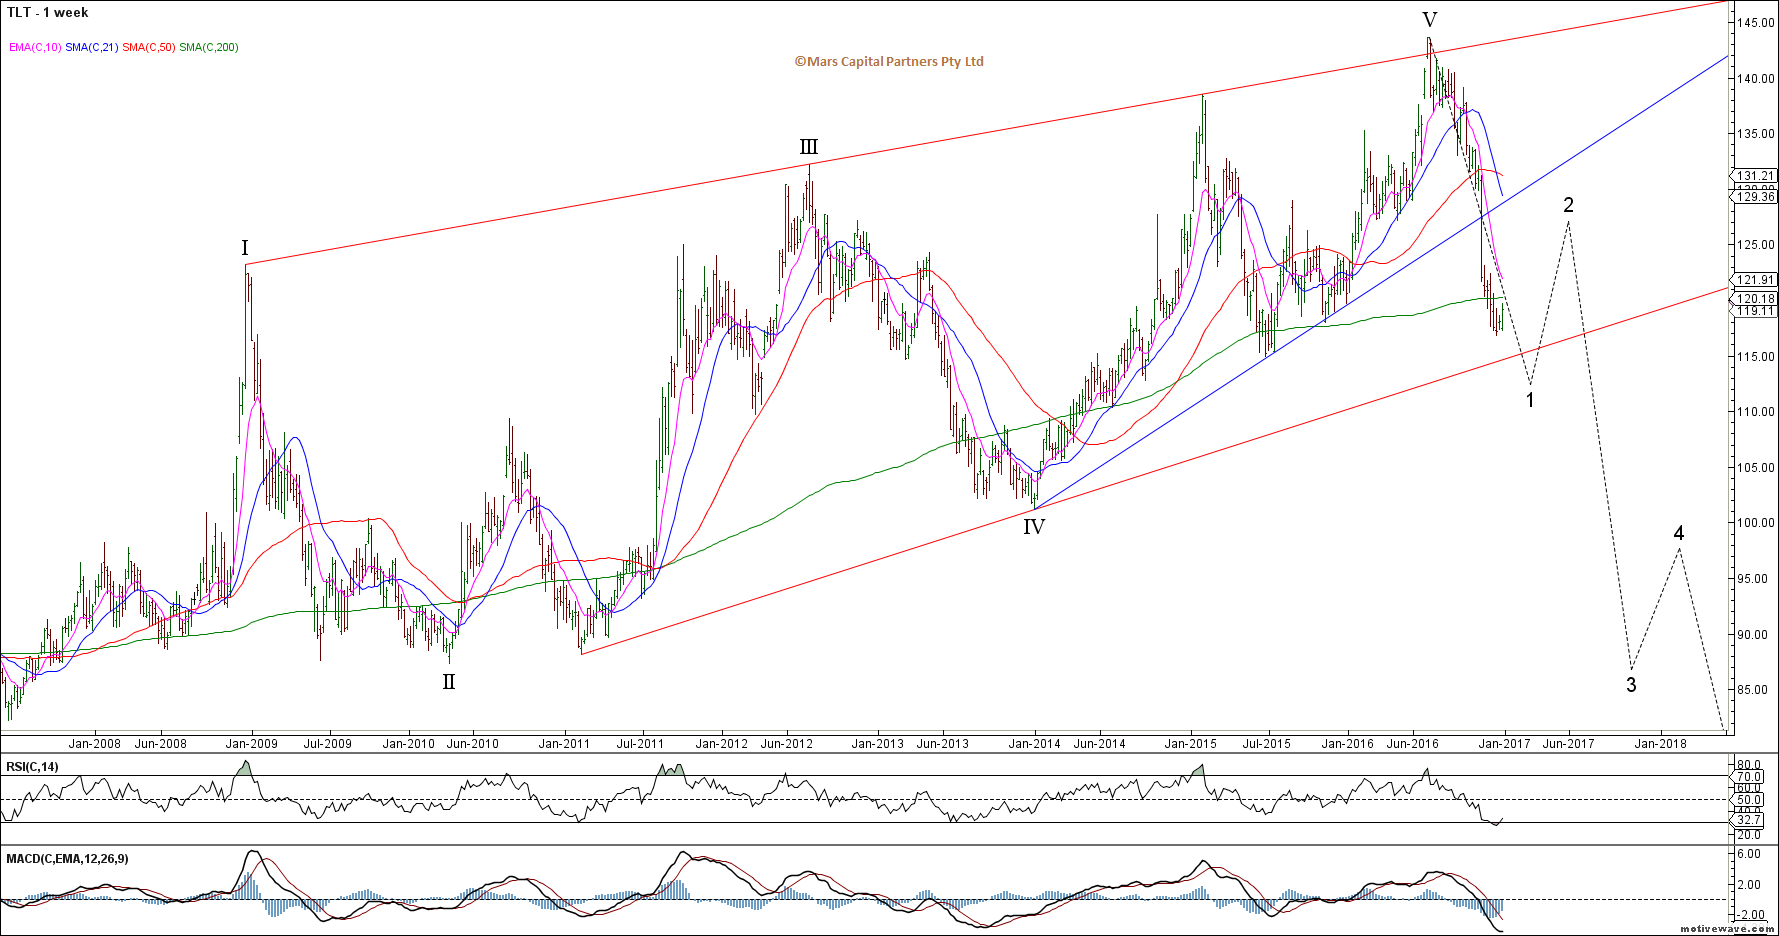
TLT Weekly
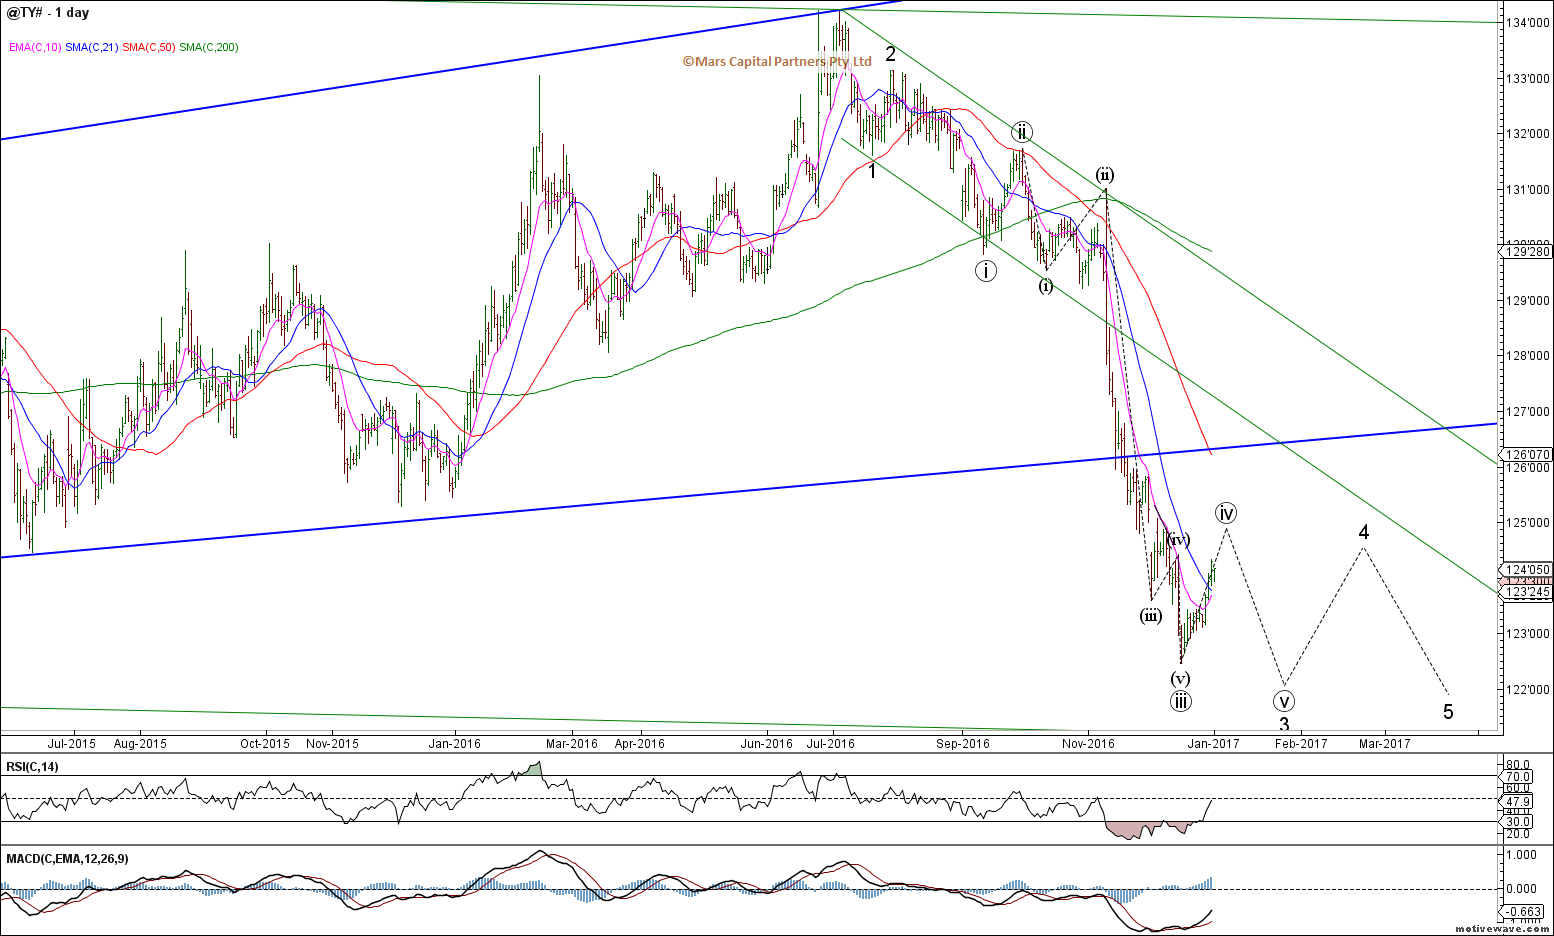
ZN Daily
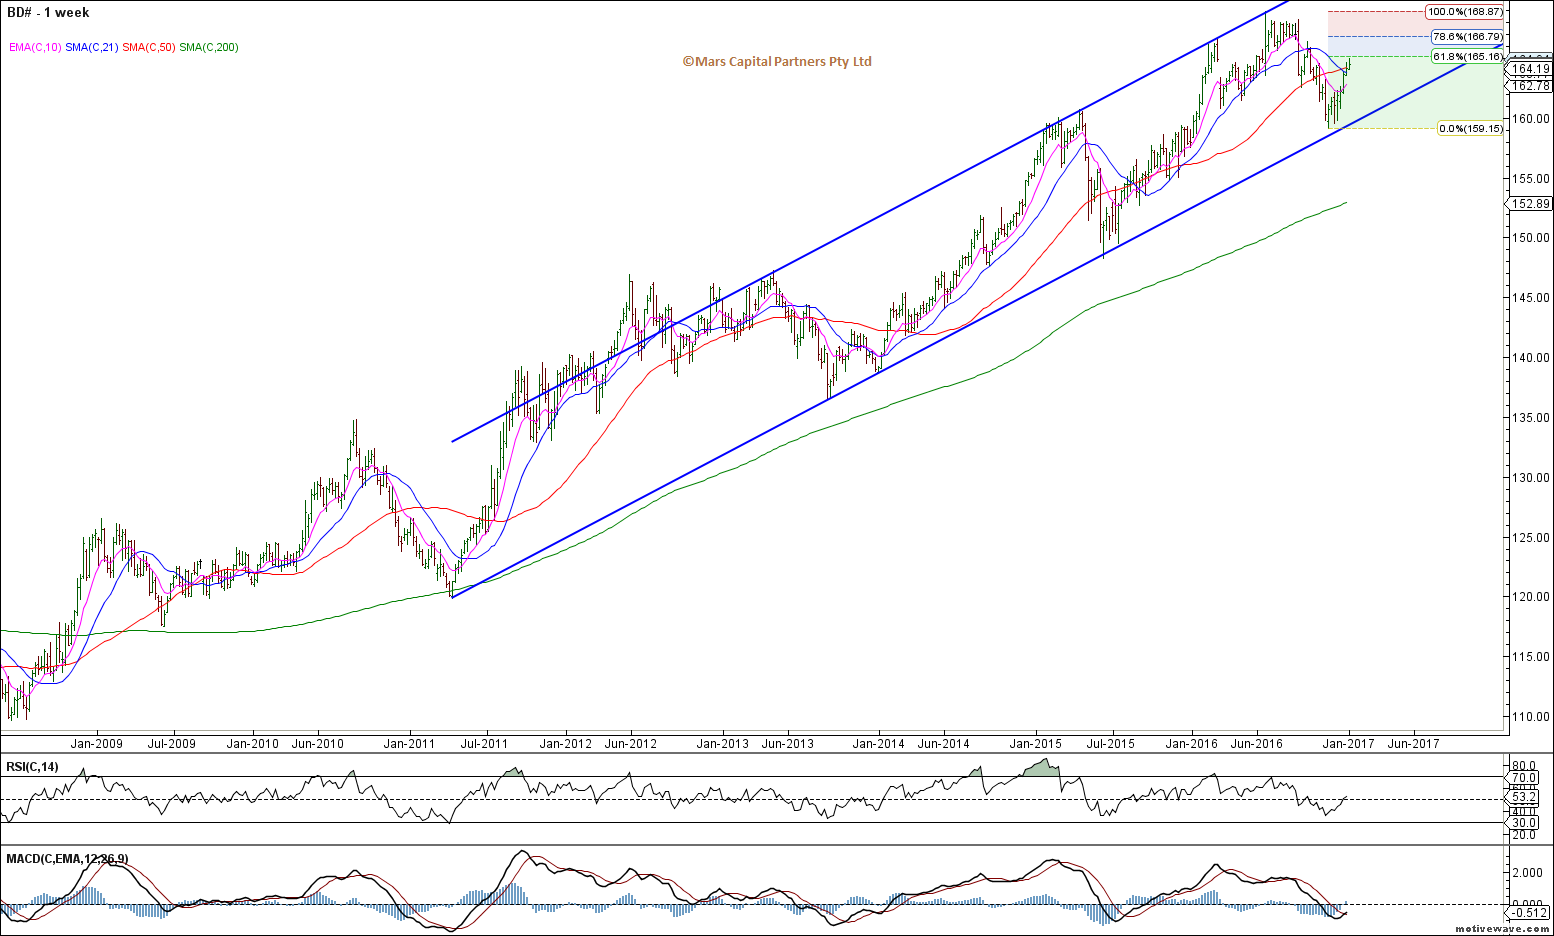
The near term count in the 30yr met our initial upside objective of 150’15 highlighted last week. There are no signs of a reversal as yet. I do expect the downtrend to continue but 4th waves are difficult to trade so we will keep an eye out for short trade setups. No good R/R opportunities here at the moment.
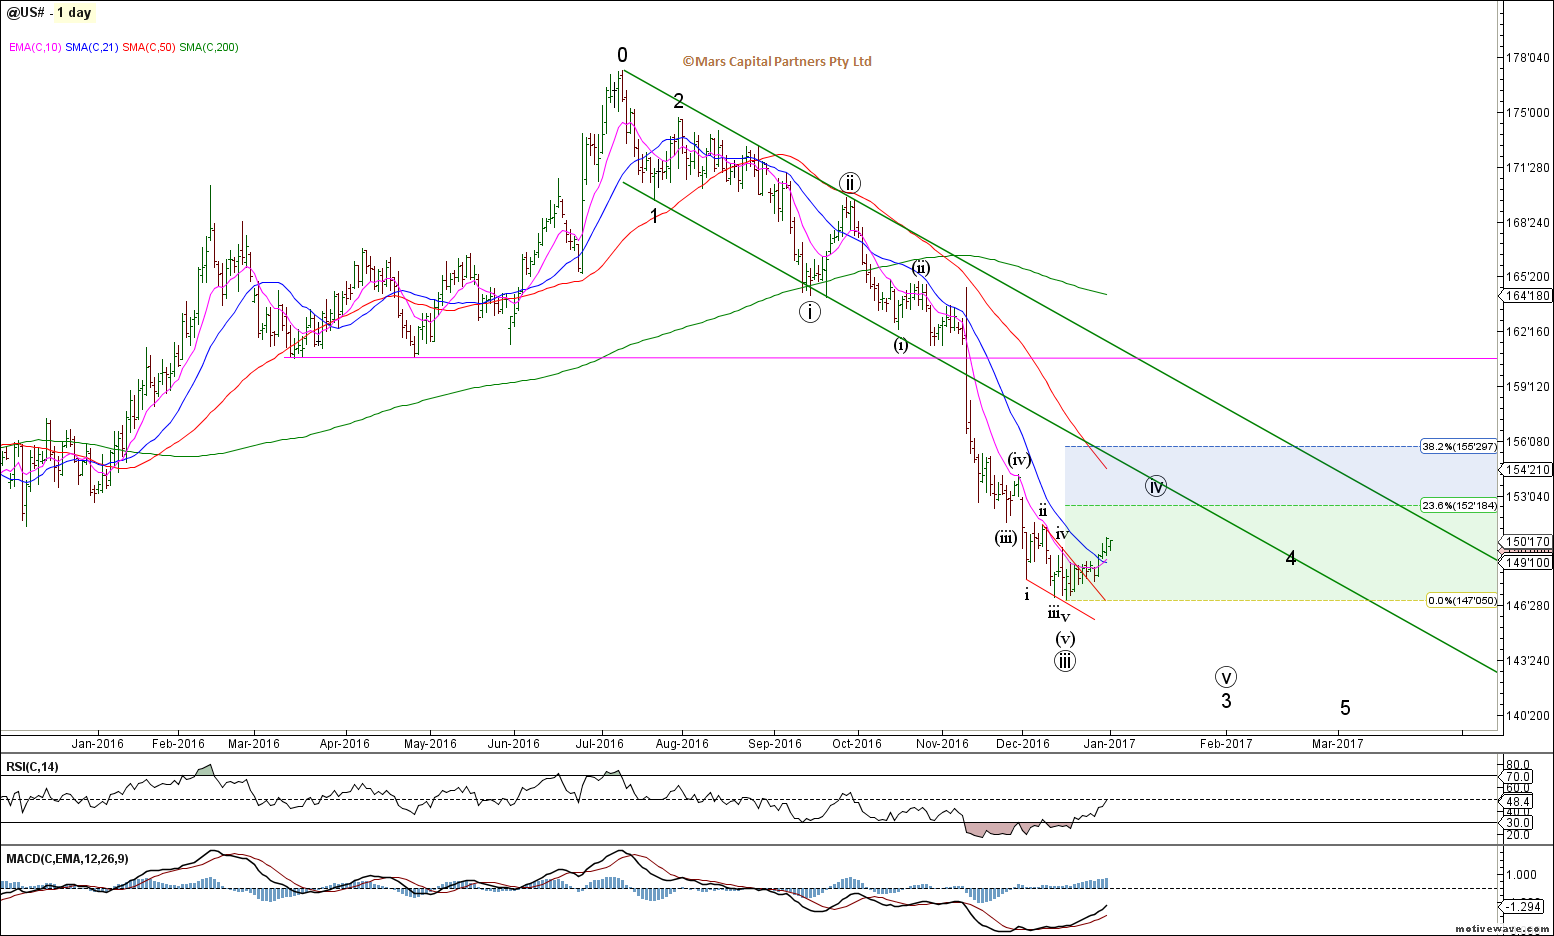
ZB Daily
Traders are shorting into the hole here… which is why I am not in a hurry to join them.
Bunds continue to climb as we approach the 0.618 retracement of last year’s decline. As the decline was not clearly impulsive we must allow for the possibility of new cycle highs for the bund. A clear break of the 6 year trend channel would be the best indication of a change in trend. I am watching this closely for a good short setup as we remain bearish on the bigger picture.
Bund Weekly
To the FX markets and my main focus is on the US$ – Our DXI measured targets were met in December. The easy money has been made and now things get far more tricky and we will need to rely on the near term counts to determine where to from here. We are at an important juncture – There are enough waves in place to complete wave 5 of III for the DXI – however, our expectations are for a much stronger US$ with US centric policies being undertaken by the Trump administration. How we get there has important implications for precious metals and US Treasuries.
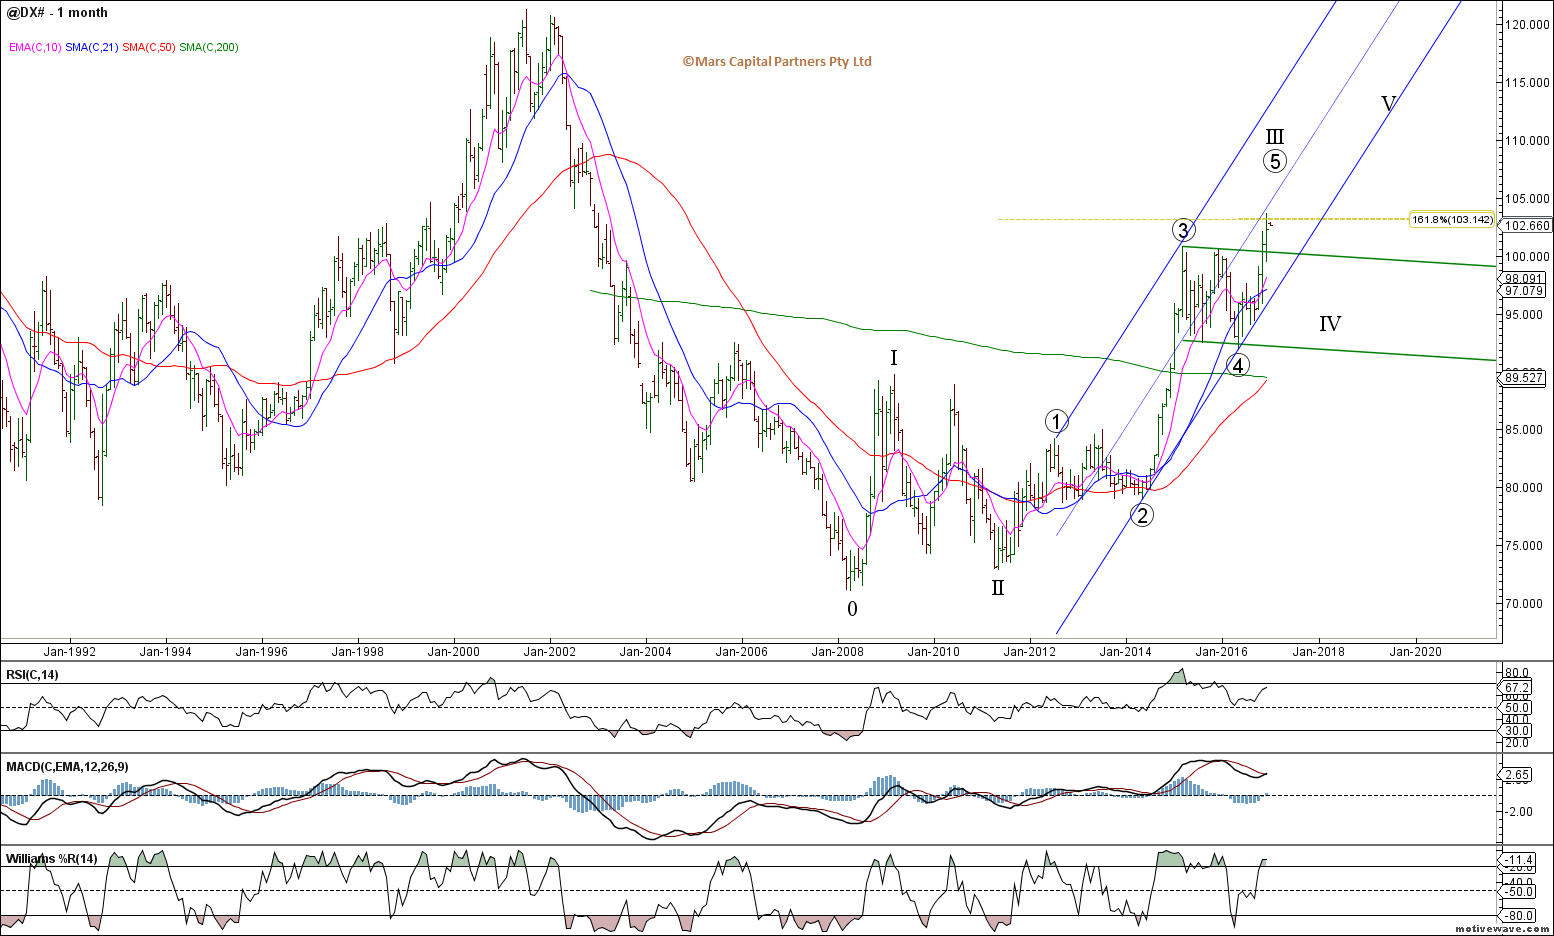
DXI Monthly
The Daily chart shows the potential for a completed 5th wave count and a deeper potential correction. We have had no clear signs of a reversal so we have no position here until we get a clearer picture of the near term structure.
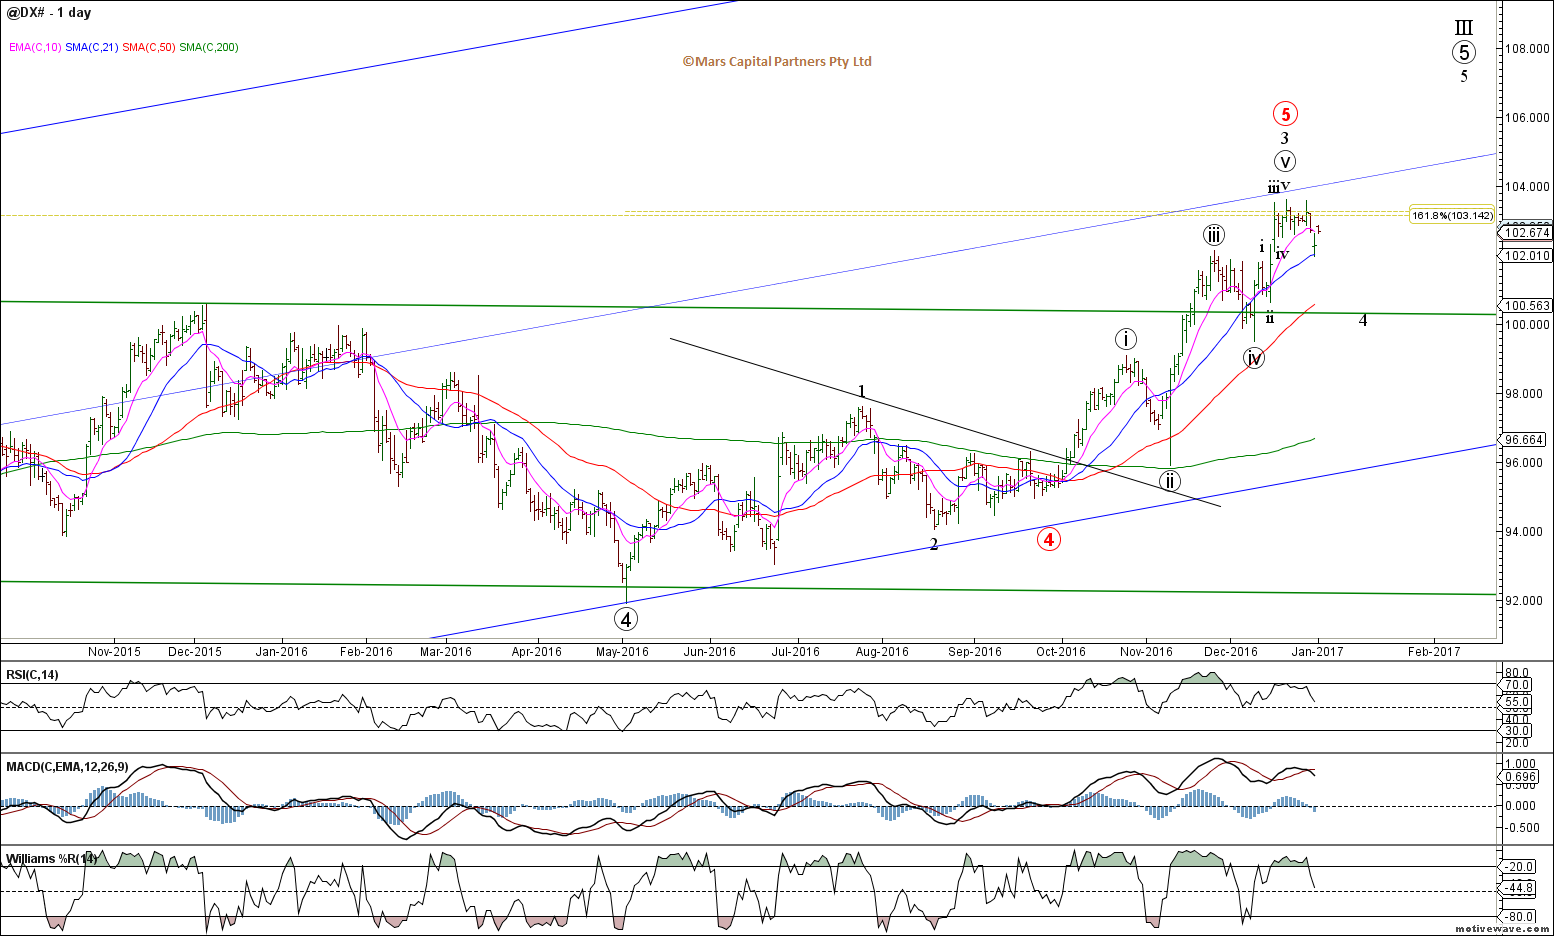
DXI Daily
The Euro is in a similar position having met our minimum downside objective of new cycle lows. While our expectations are for prices below parity, it is more a question of “how” we get there.
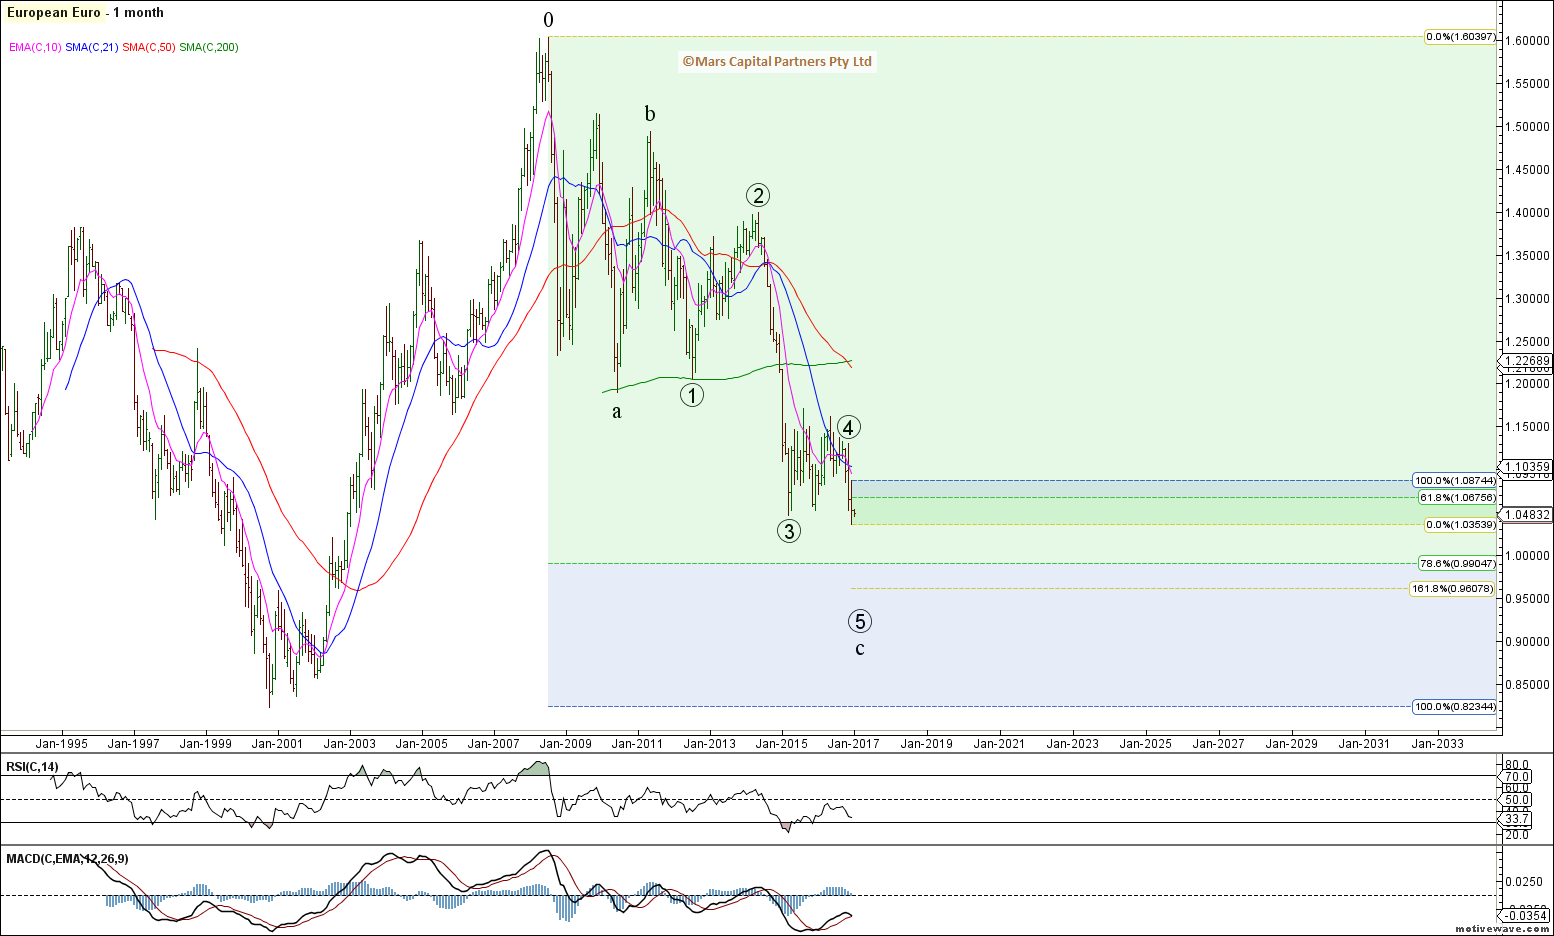
EURUSD Monthly
The near term count highlights the potentials I am watching. Either wave 2 of (3) completed last week and we accelerate lower (black count) OR we see a more complex correction for red wave 2. Either way, we remain bearish from a big picture perspective until our downside targets are met with a completed structure.
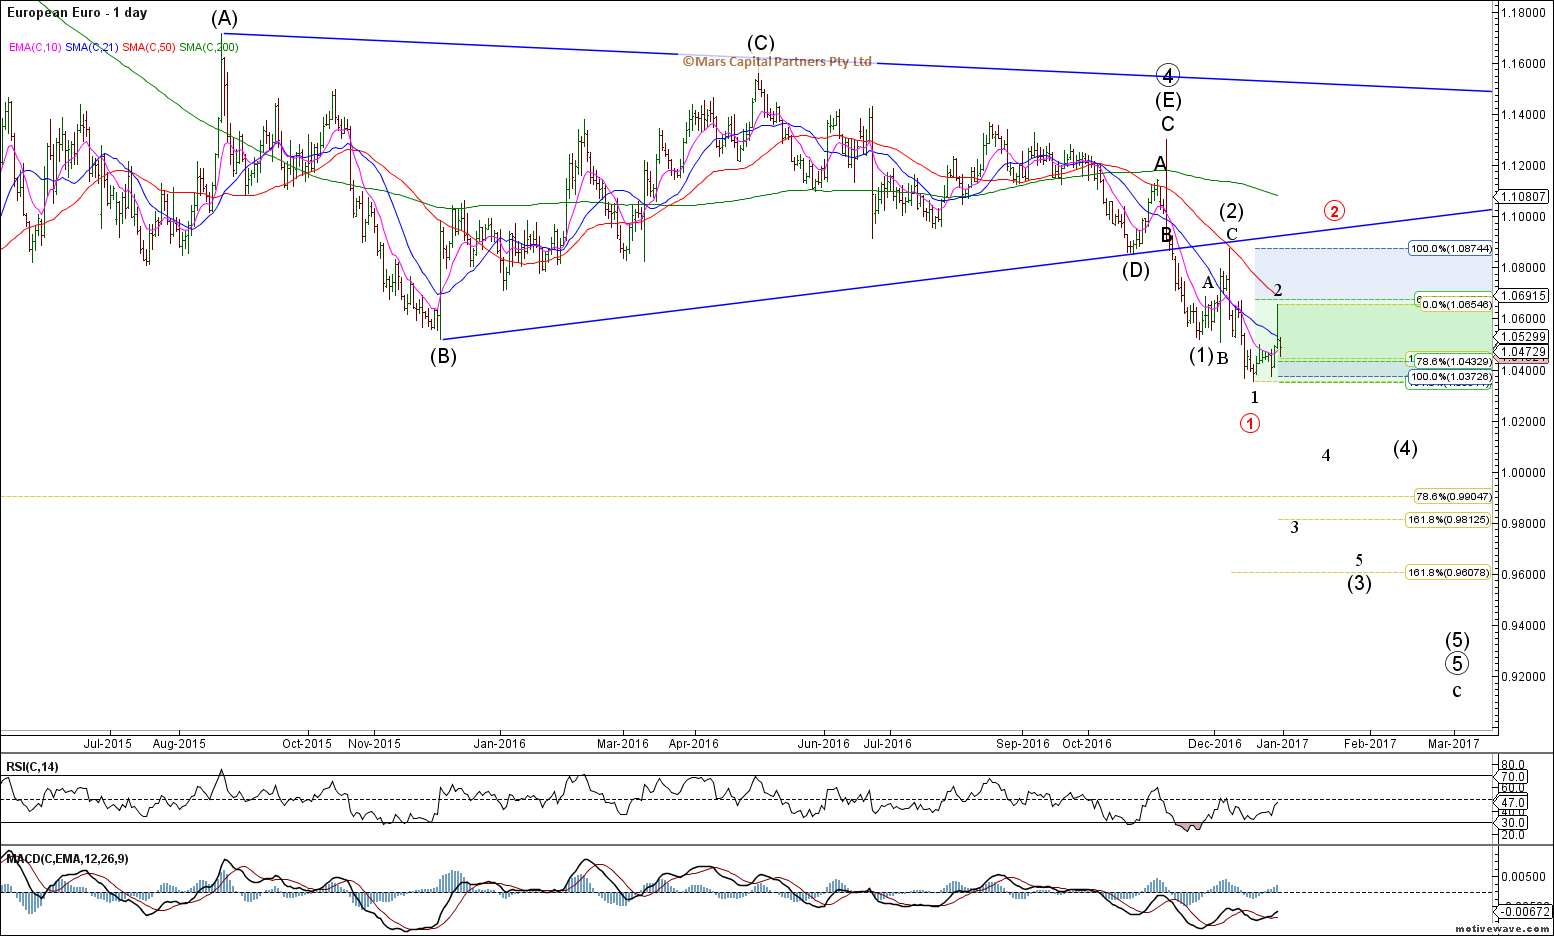
EURUSD Daily
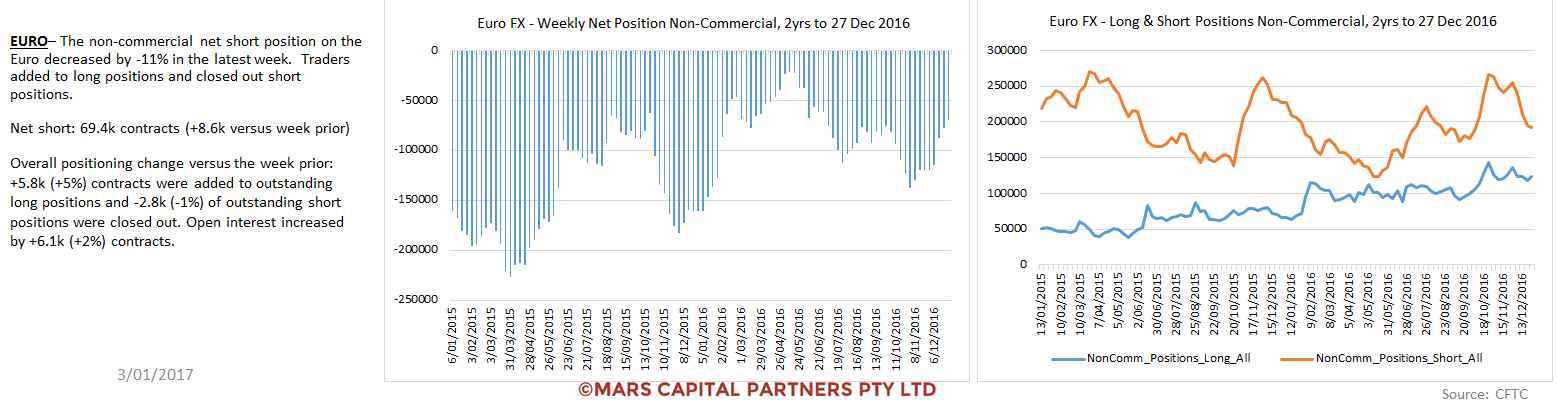
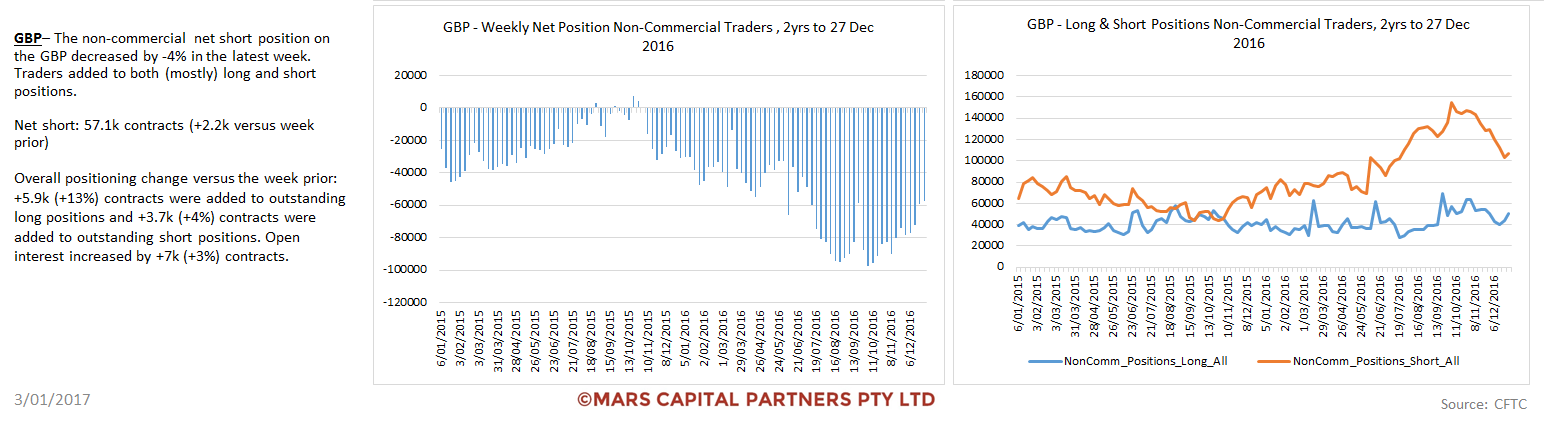
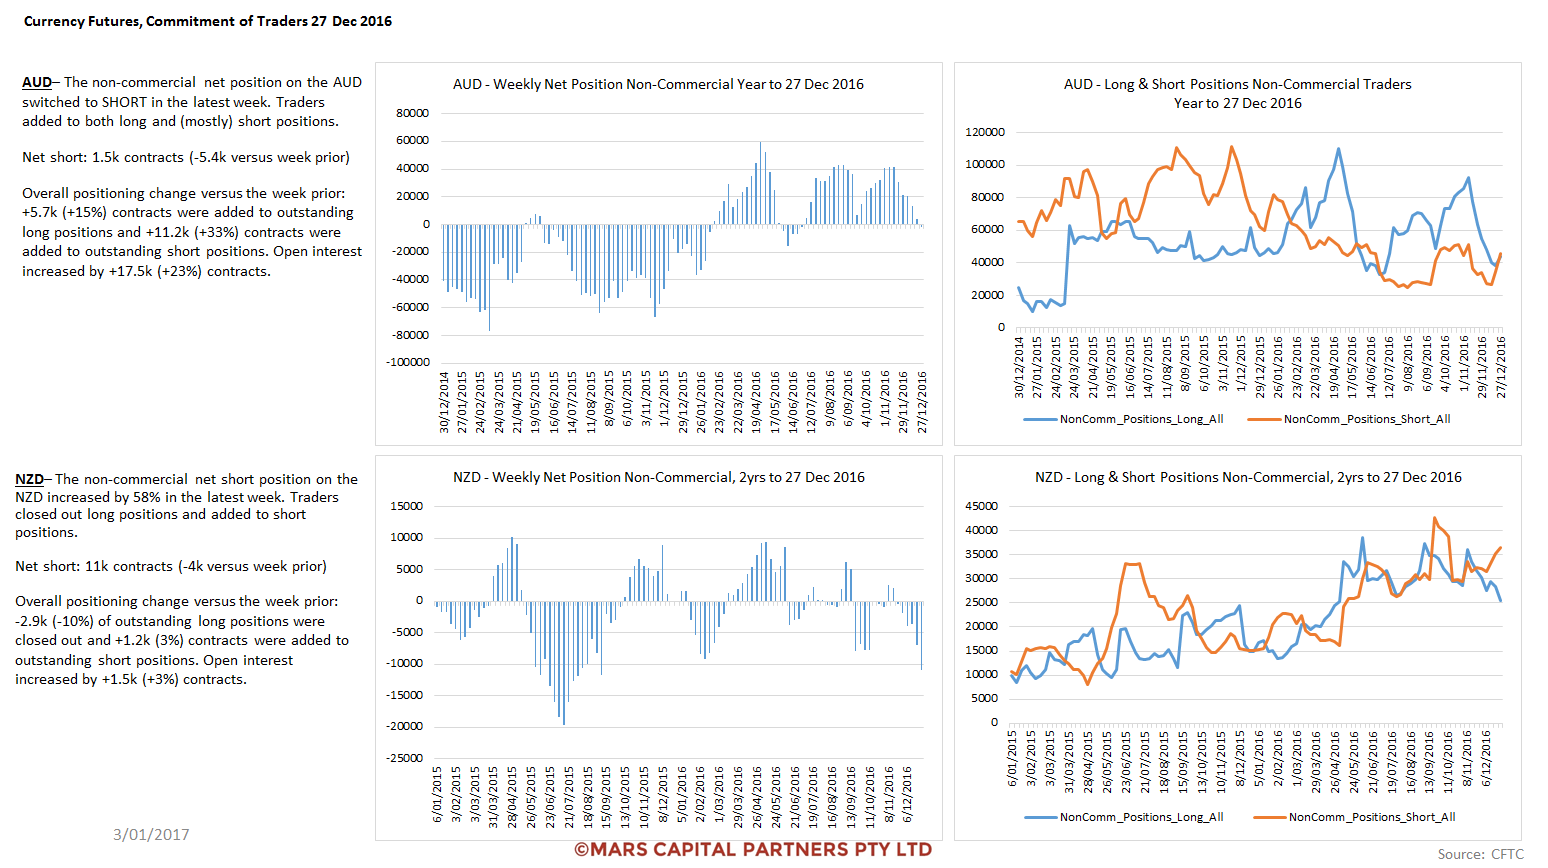
Traders pared back shorts into year end as expected but we may see a resumption of the short trade early in the new year.
The Pound looks to have found near term support at the 0.618 retracement after completing 5 waves down from December’s highs. We would expect the Pound to outperform the Euro near term. Ultimately we are looking for new cycle lows once wave 4 is complete from a bigger picture perspective.
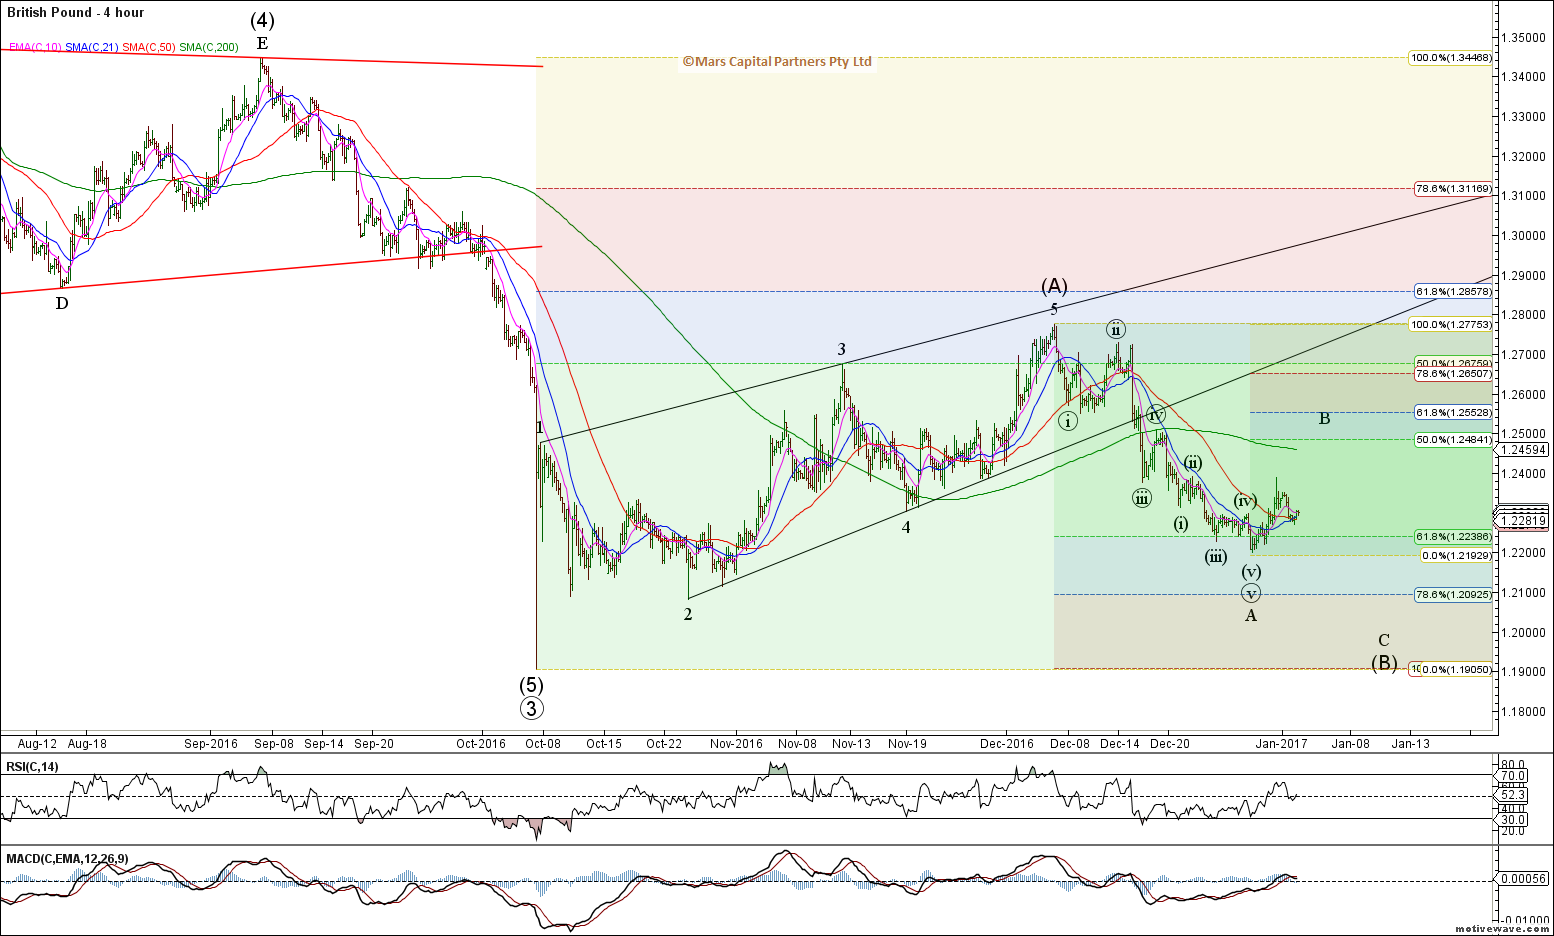
GBPUSD H4
2017 should see an end to the decline in GBP as we complete wave 5 of C towards 1.10 – while the big picture decline is not yet over, we expect to get very bullish the Pound later in the year.
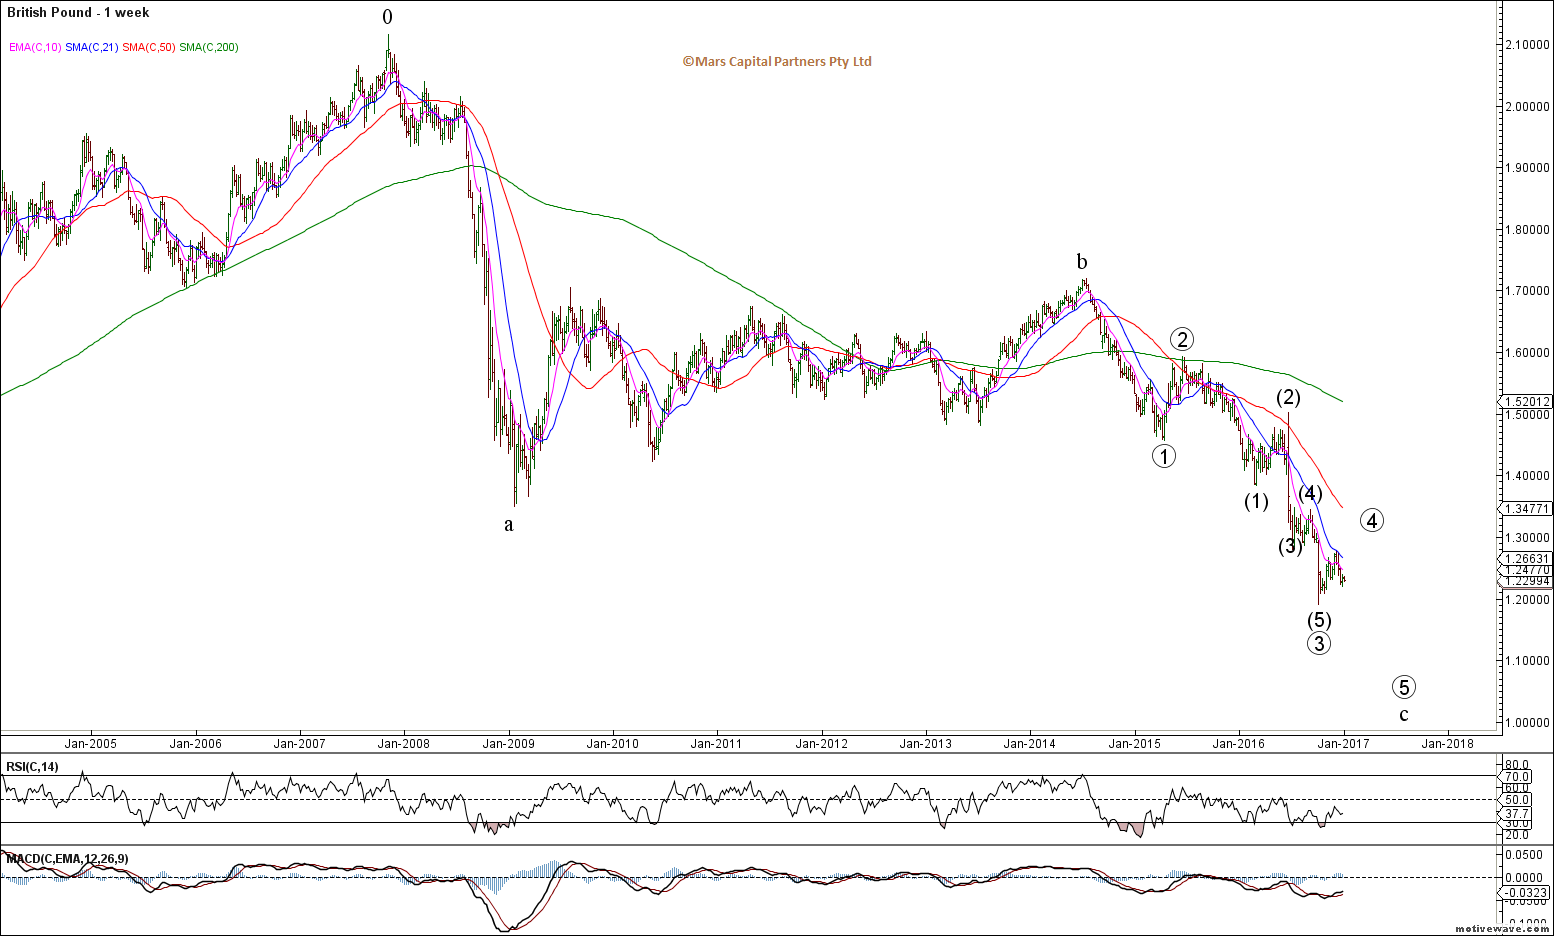
GBPUSD Weekly
The USDJPY holds the key for Precious Metals given its high historical correlation. We remain bullish this pair from a bigger picture perspective with upside targets closer to 150. The question is whether we continue to climb impulsively and directly to new cycle highs OR we get a more complex wave B?
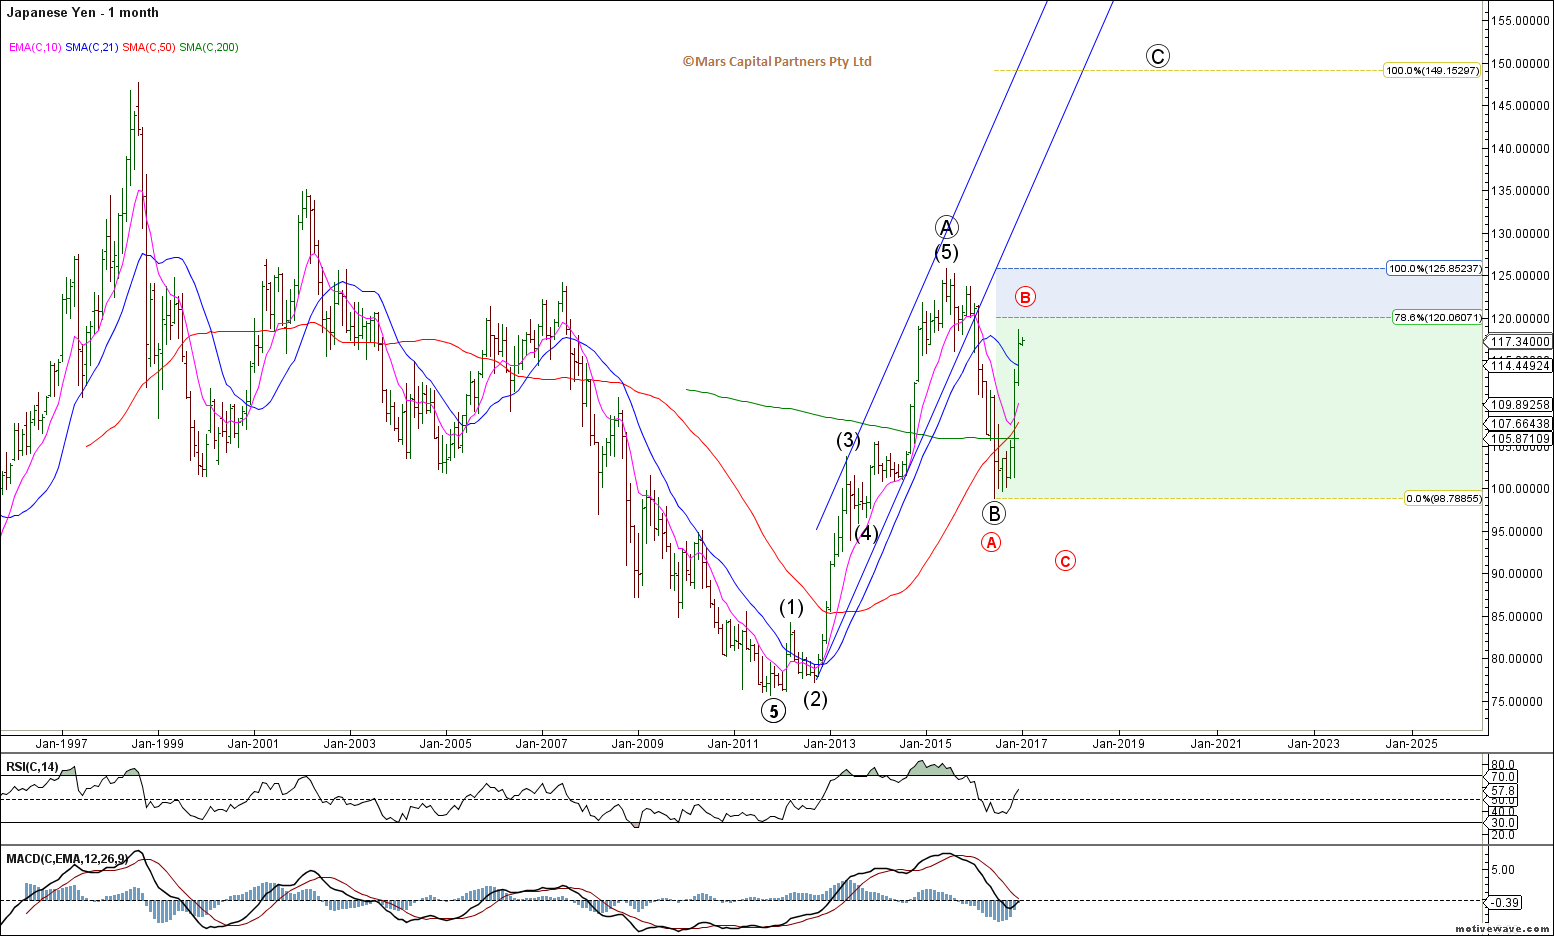
USDJPY Monthly
Importantly, the near term wave structure is corrective so we are likely to push higher towards 120 at a minimum.
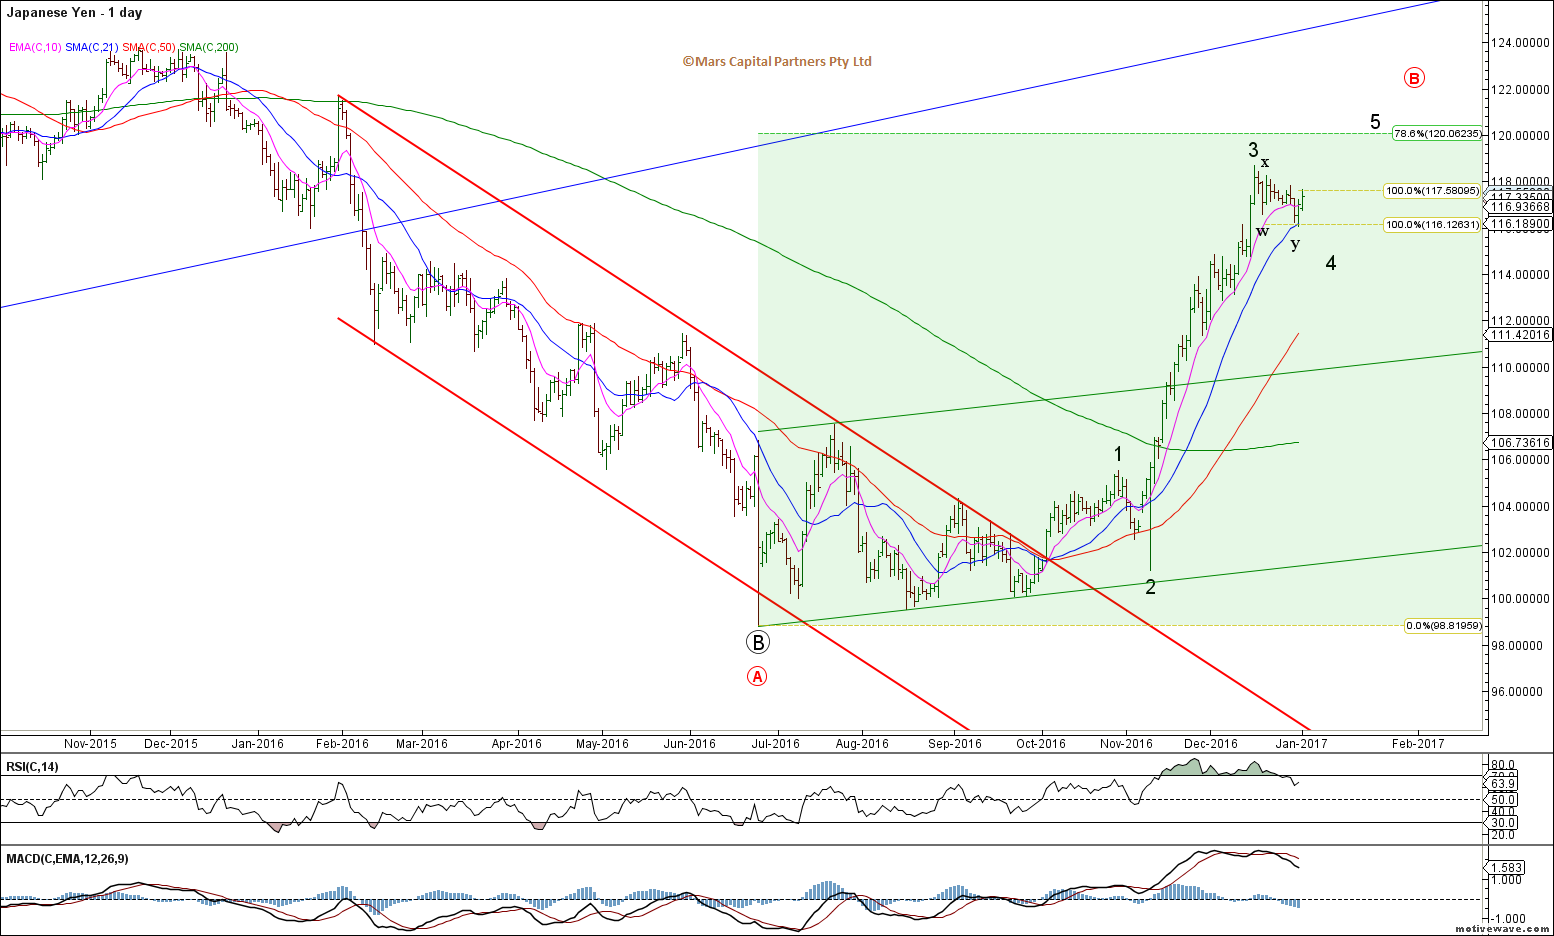
USDJPY Daily
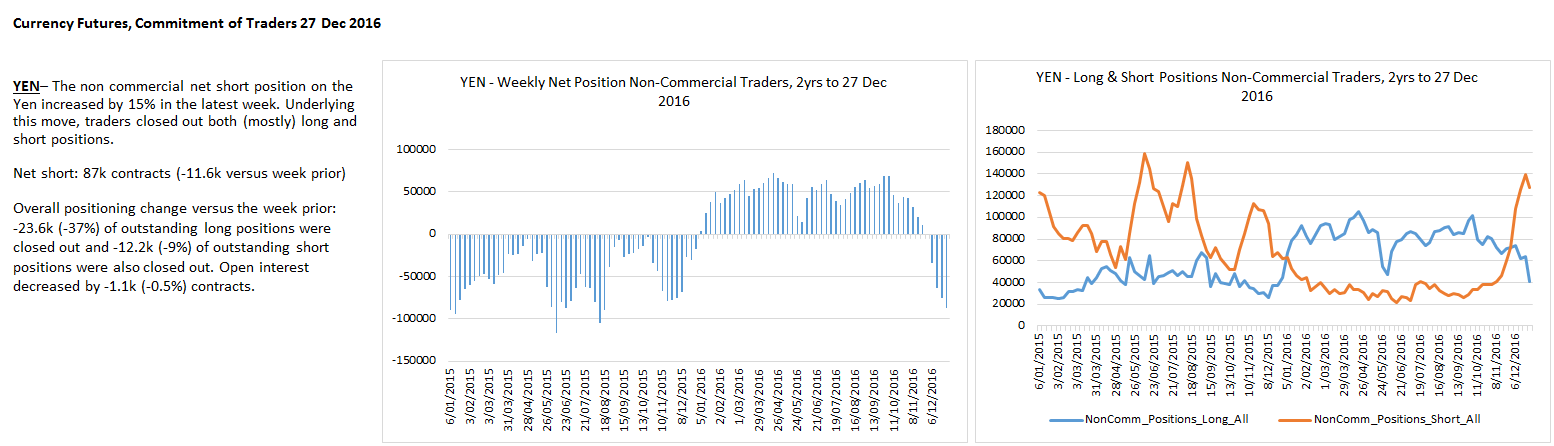
Traders are getting aggressively short the Yen here as we expect when the near term trend is ending.
The Aussie$ continues to hold near term support but we remain bearish as we look for prices back below the 2015 lows towards 0.65
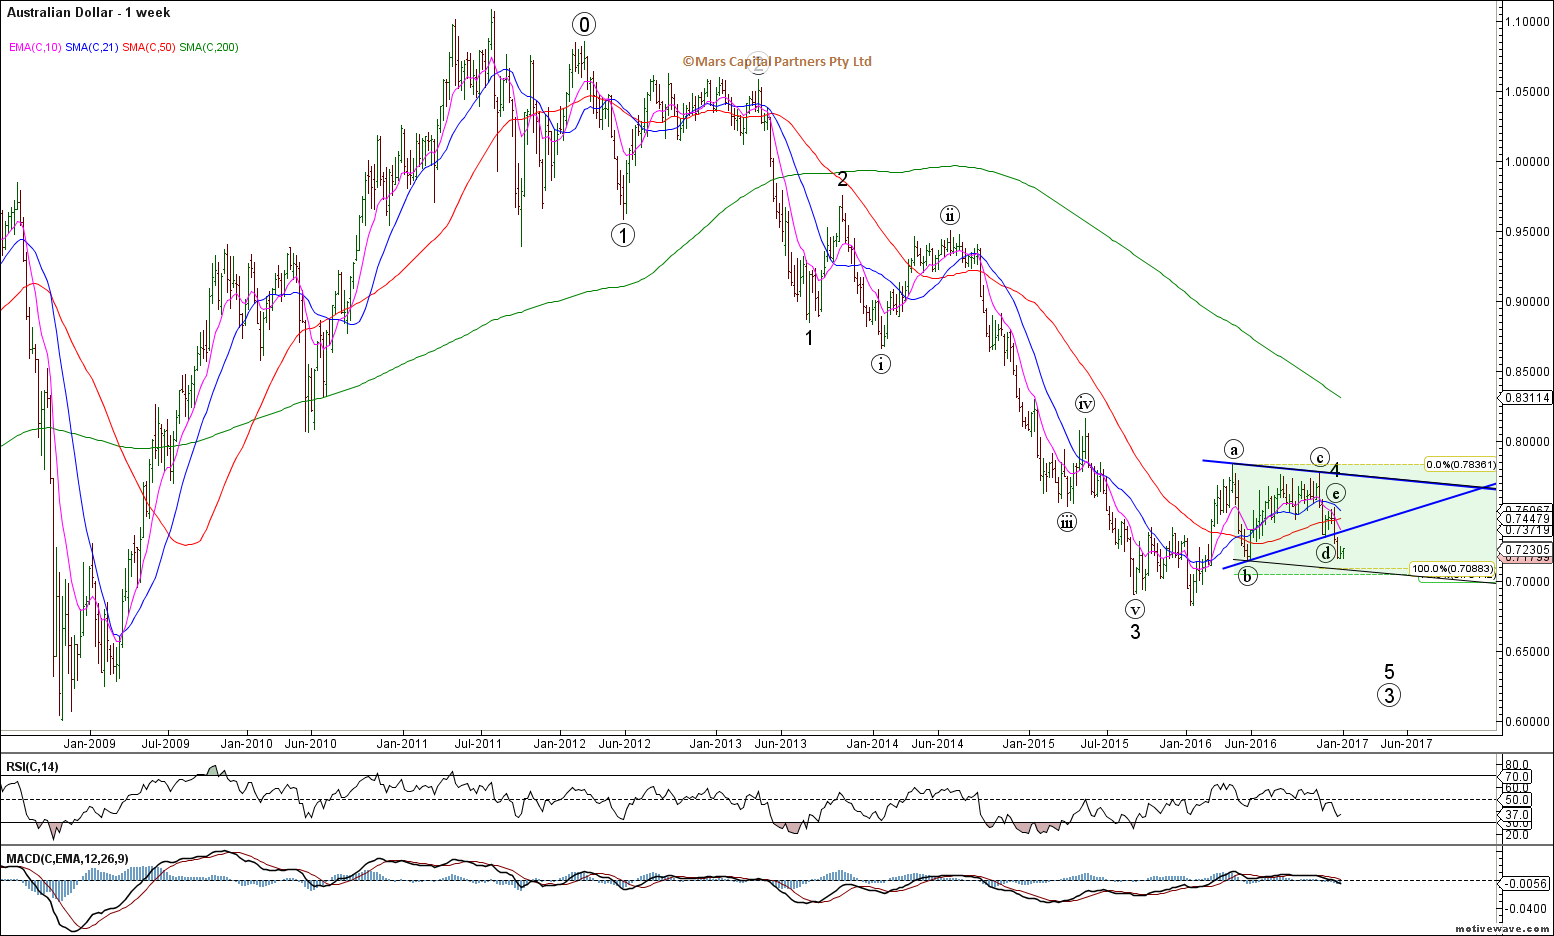
AUDUSD Weekly
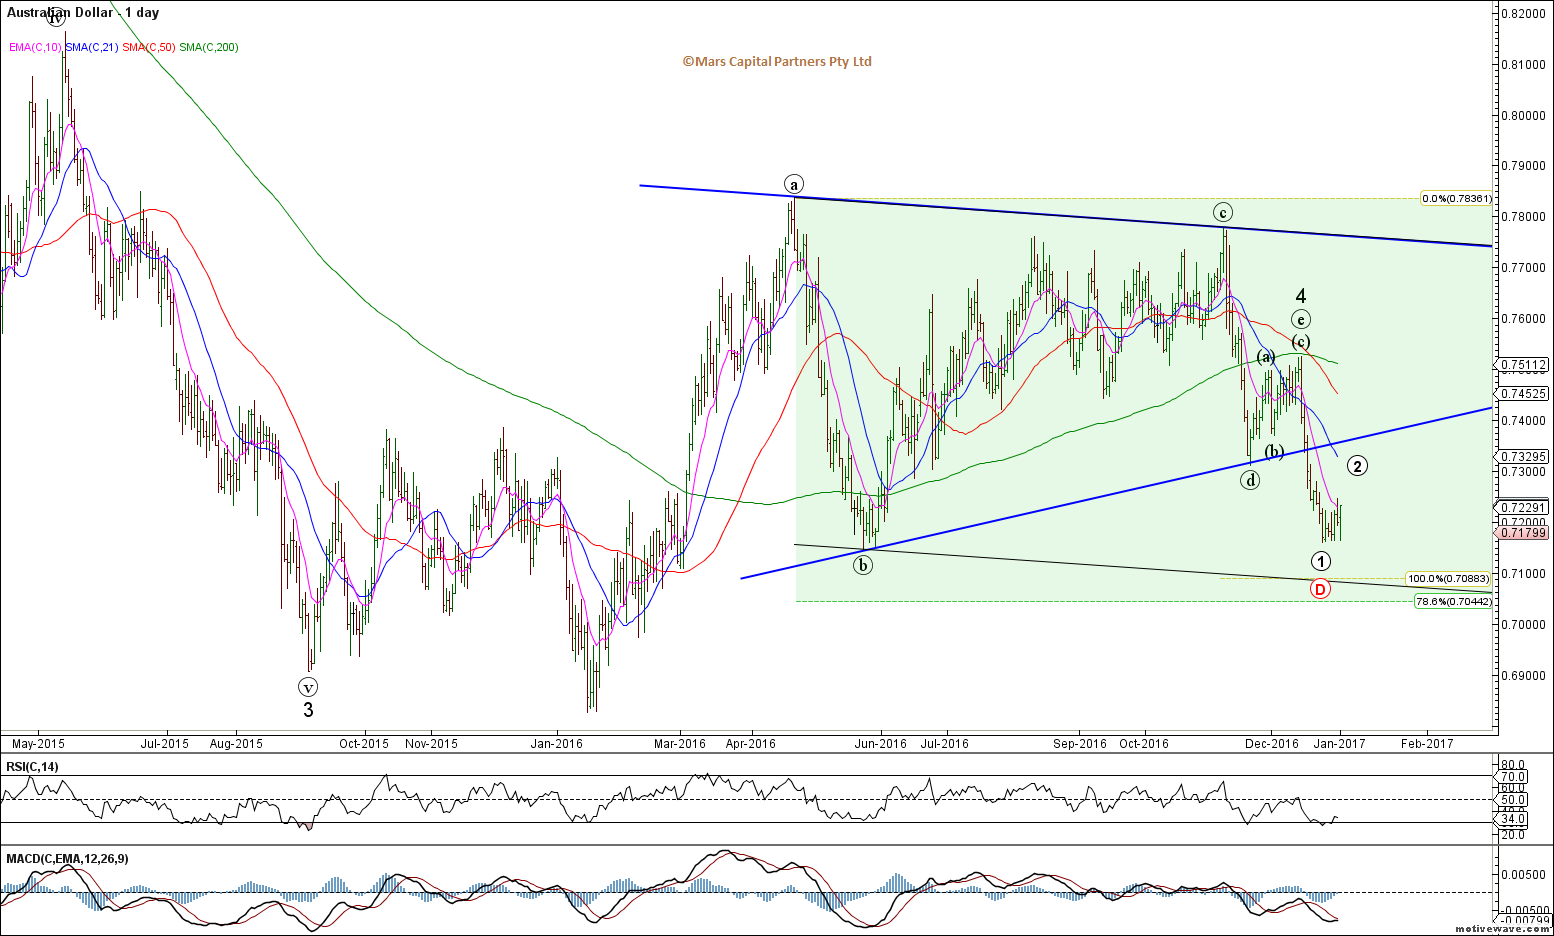
AUDUSD Daily
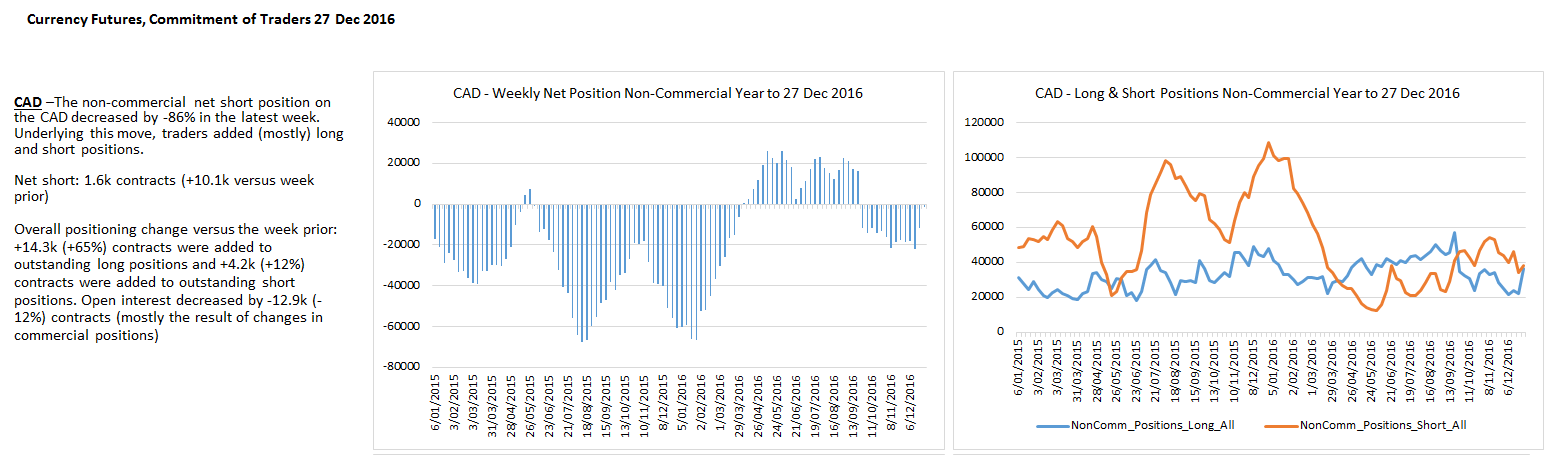
USDCAD continues to frustrate and I am now looking towards 1.38 to initiate long term shorts – alternatively, a break of the lower trend line will probably get me short. I am very bearish this pair from a bigger picture perspective.
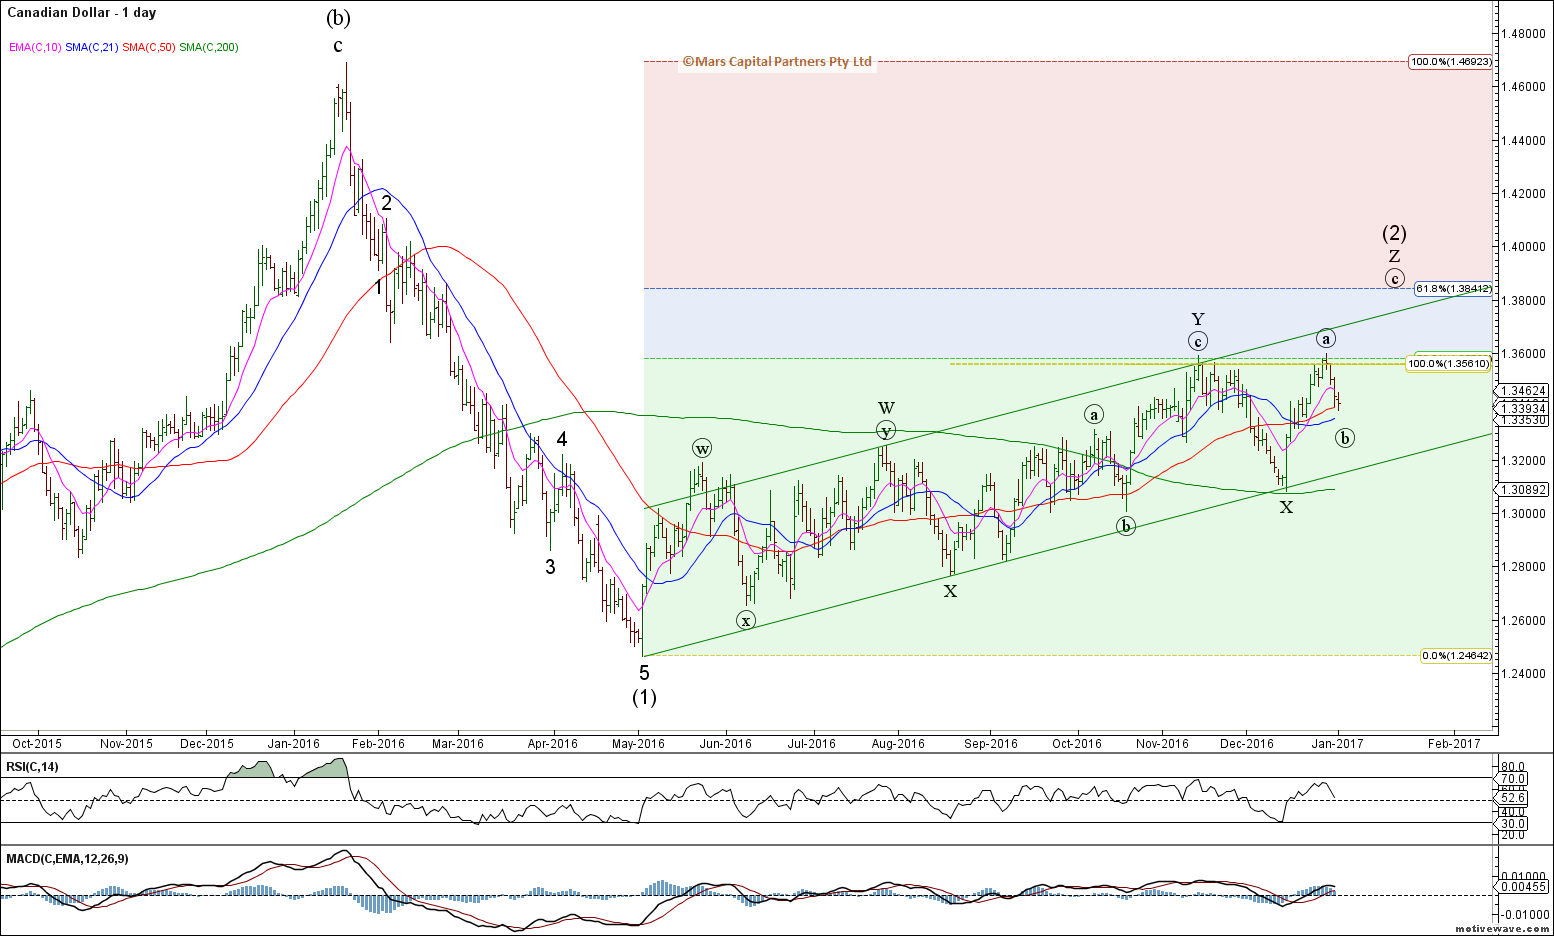
USDCAD Daily
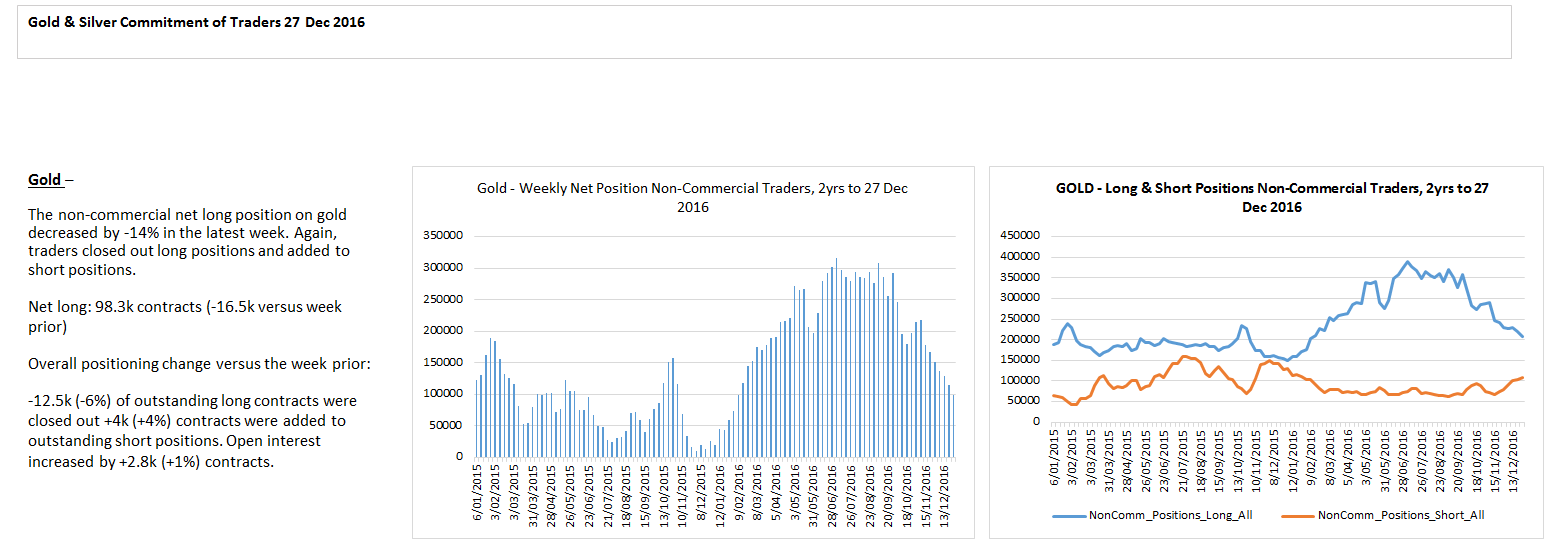
To the commodity markets and the path of precious metals will likely be determined by the Yen. Our bigger picture outlook for gold is bearish but the question is whether we need another C wave higher towards 1485 first? The rally from 1045 to 1380 could be ALL of wave red B or just A of B – this will depend greatly on whether the US$ corrects first.
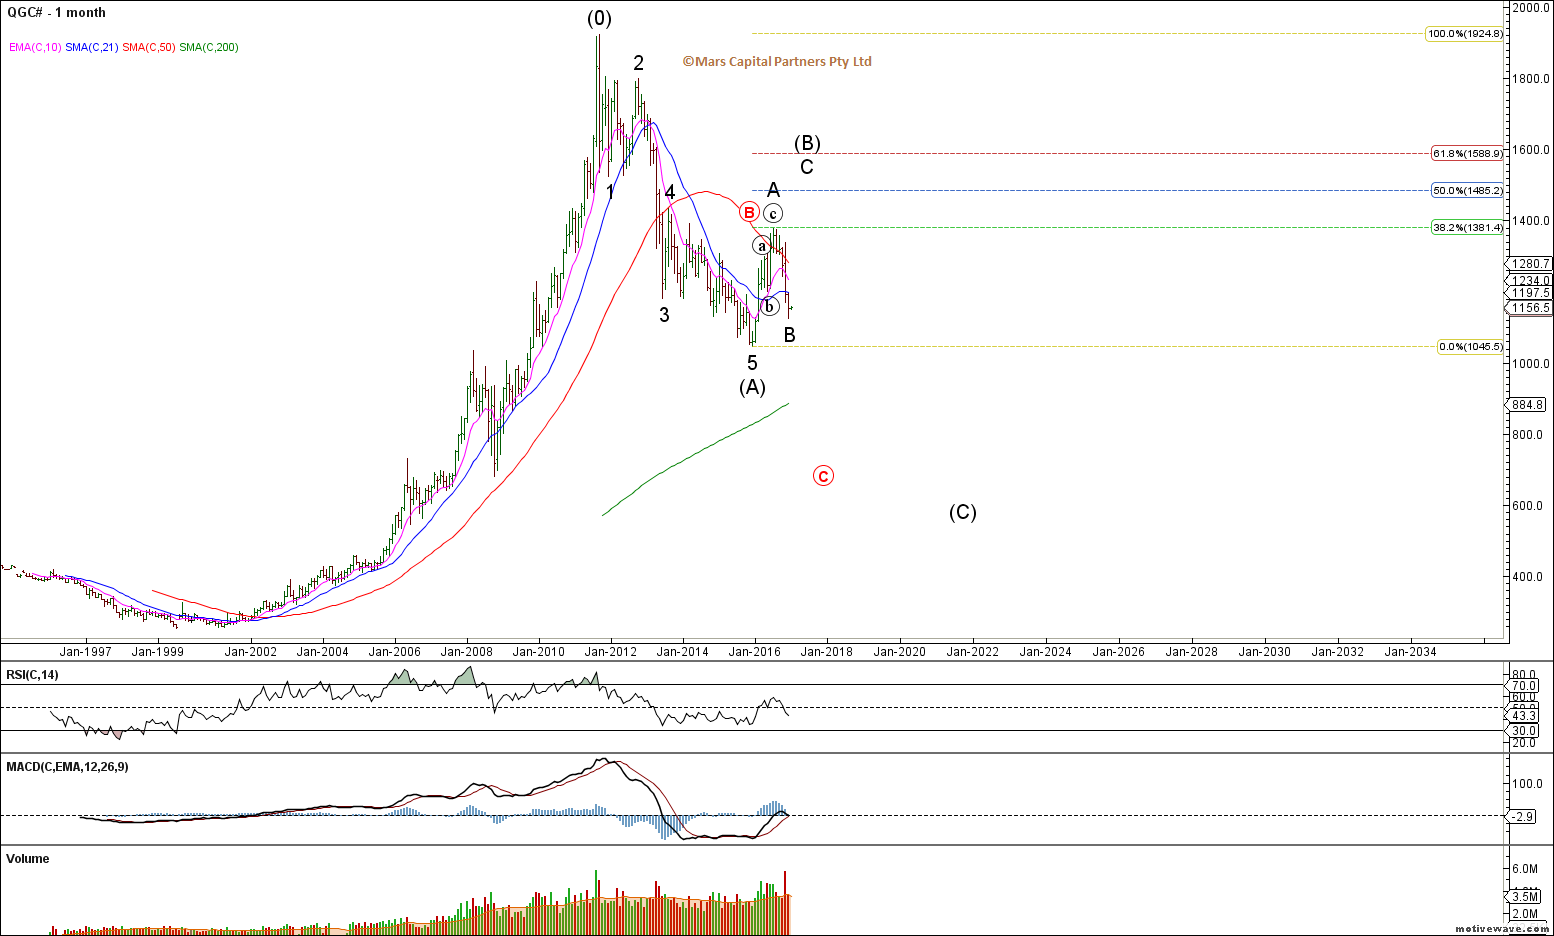
Gold Monthly
From a near term perspective, the rally in gold is not clearly impulsive from recent lows so we must respect the potentially more immediately bearish count here given our bigger picture outlook.
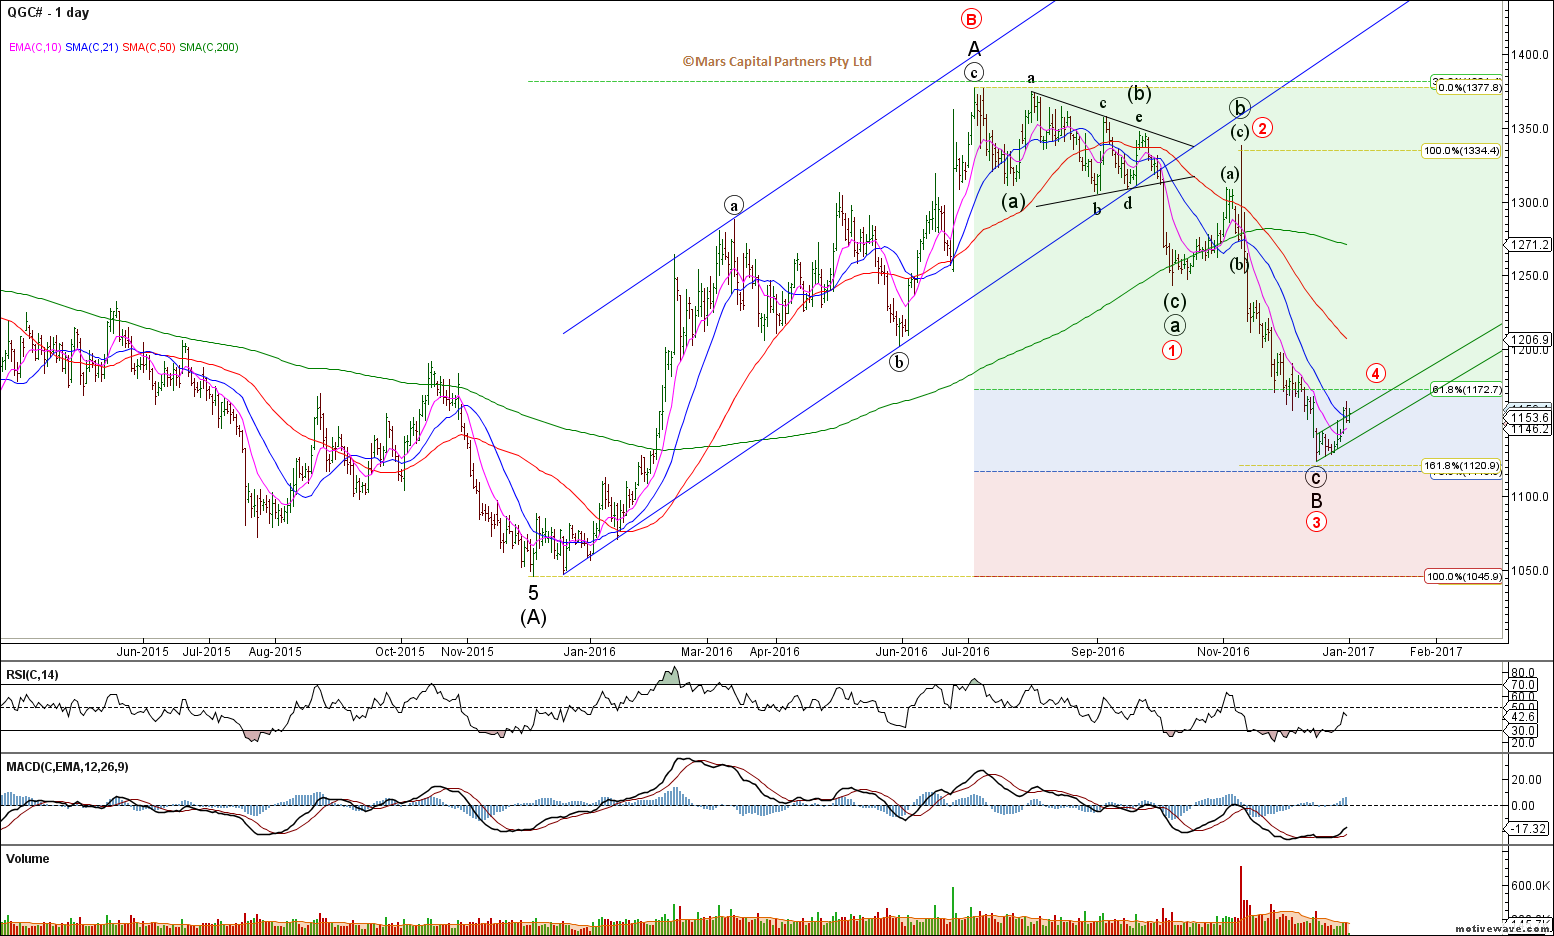
Gold Daily
Gold bulls are slowly capitulating…
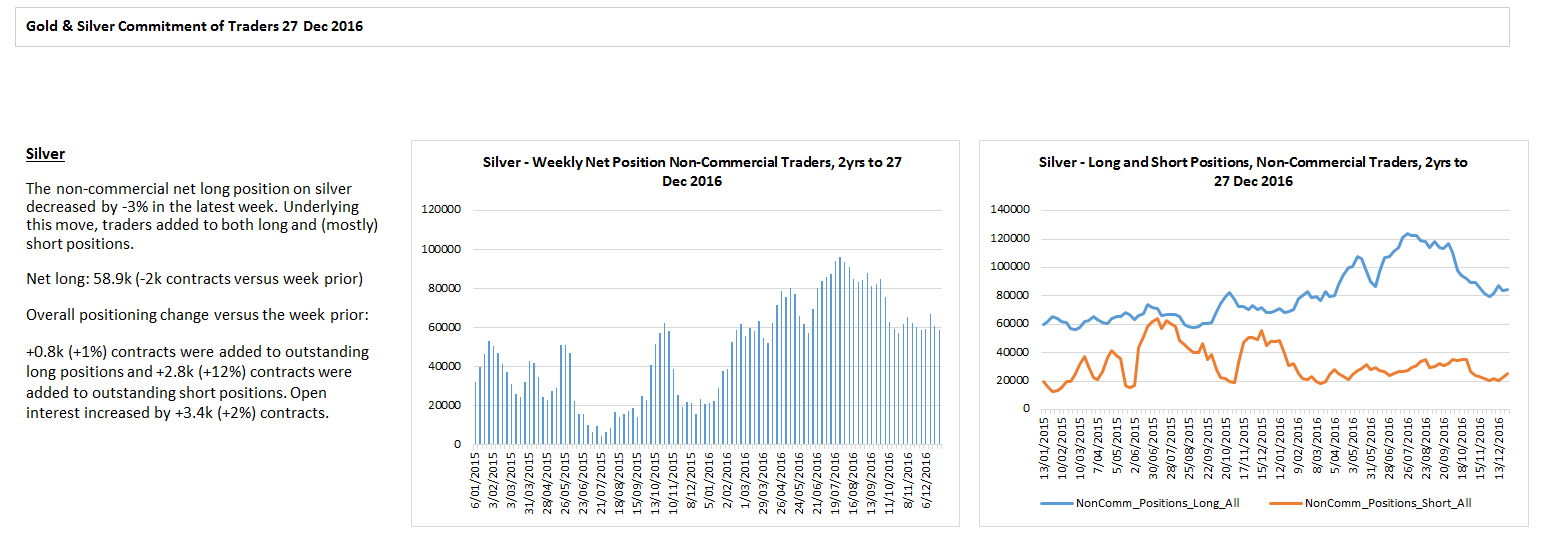
The near term rally in Silver remains corrective so we expect new lows near term as it stair steps lower towards our initial targets.
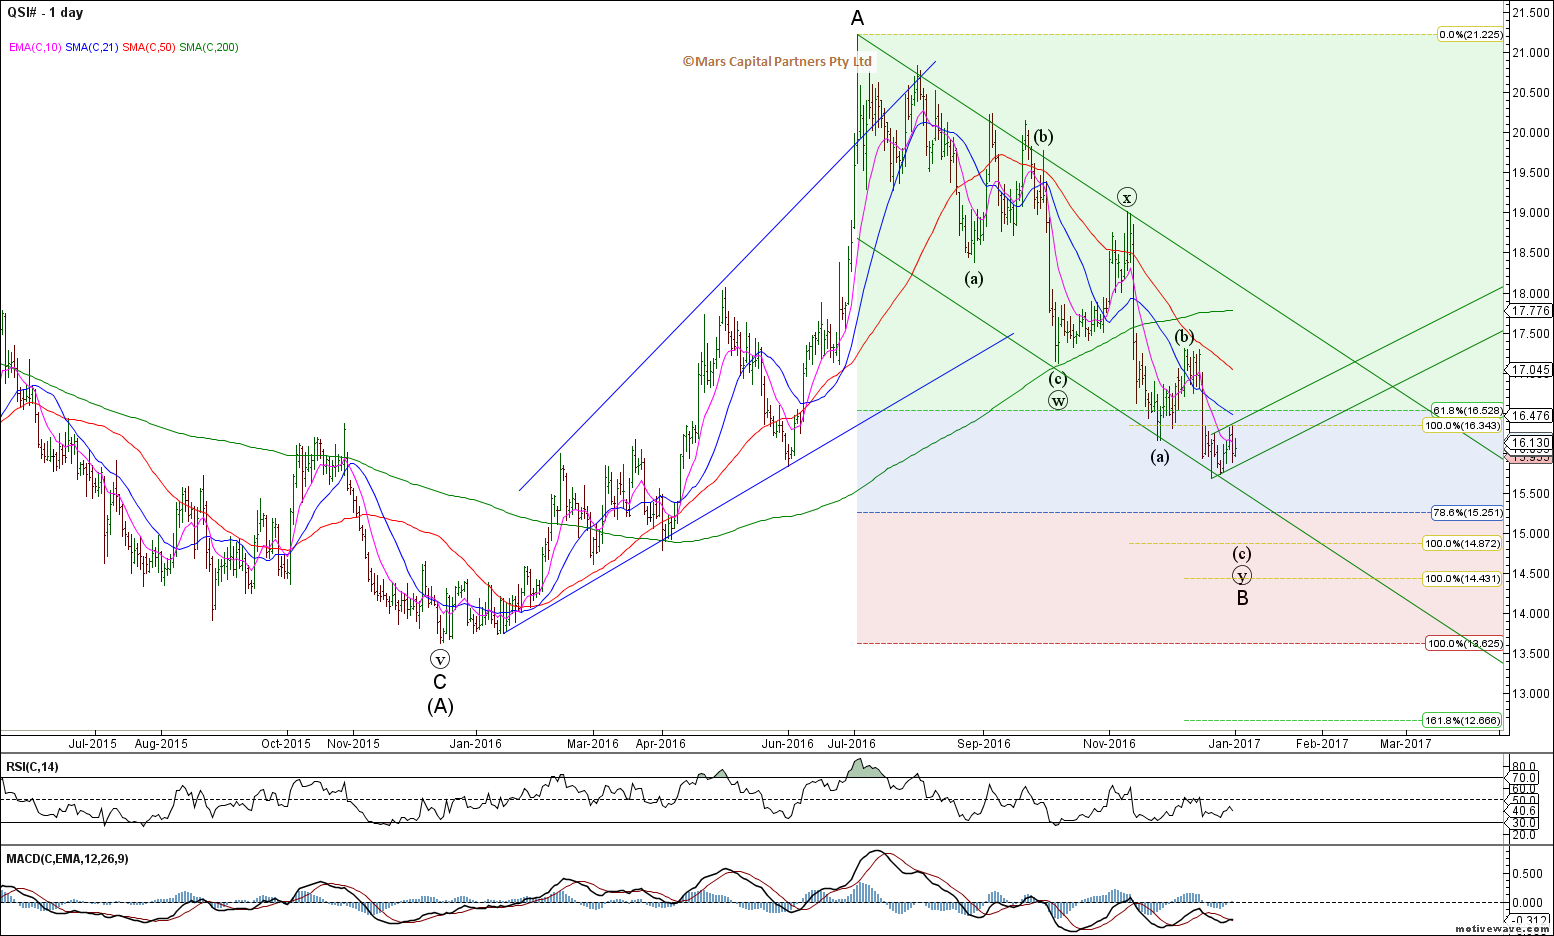
Silver Daily
Silver Traders remain overly bullish given the decline in PM’s. I think they are wrong.
Crude Oil remains bearish from a bigger picture perspective as we are counting the 2016 rally as wave 4 with wave 5 down to come to retest the cycle lows. Expect strong resistance in the $59-62 area.
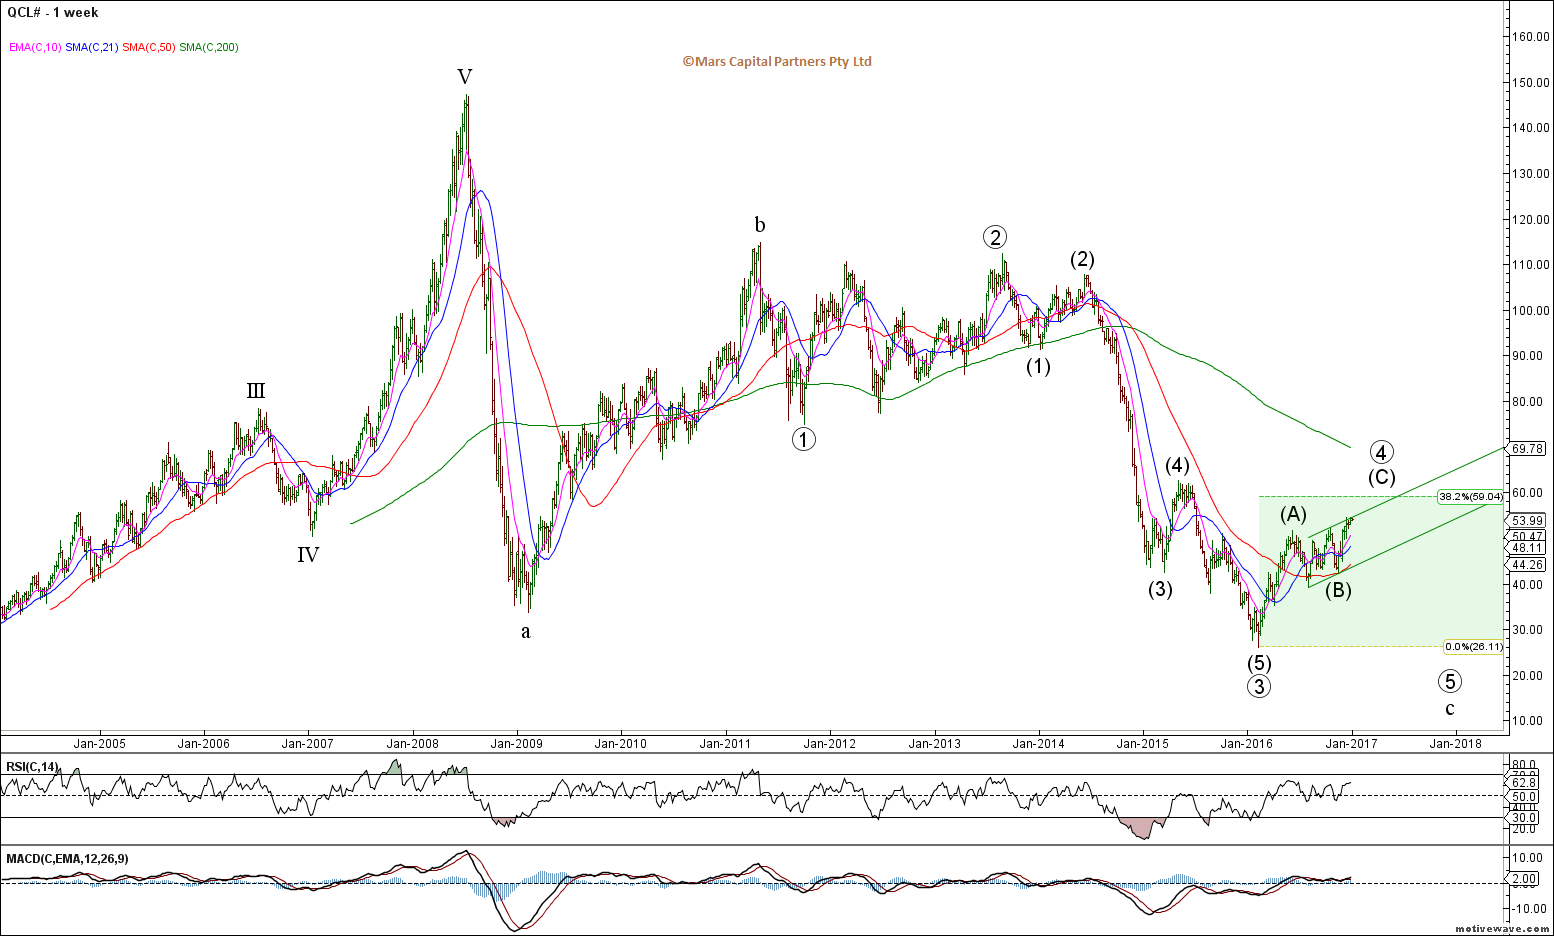
CL Weekly
The near term structure is unclear and may be forming an Ending Diagonal wave C towards our target area.
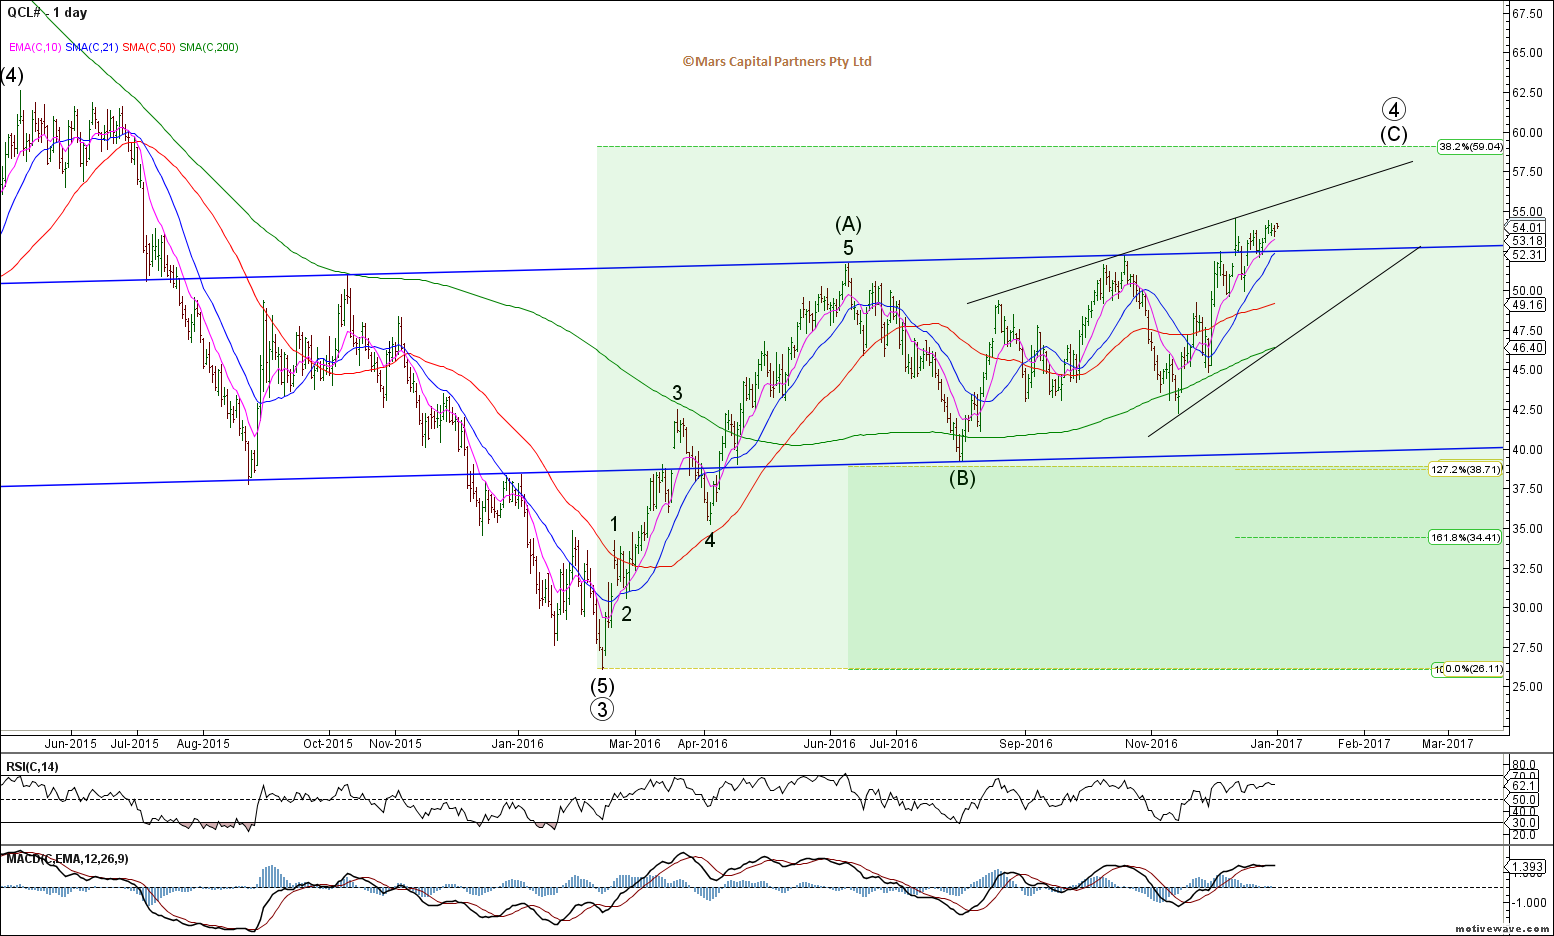
CL Daily
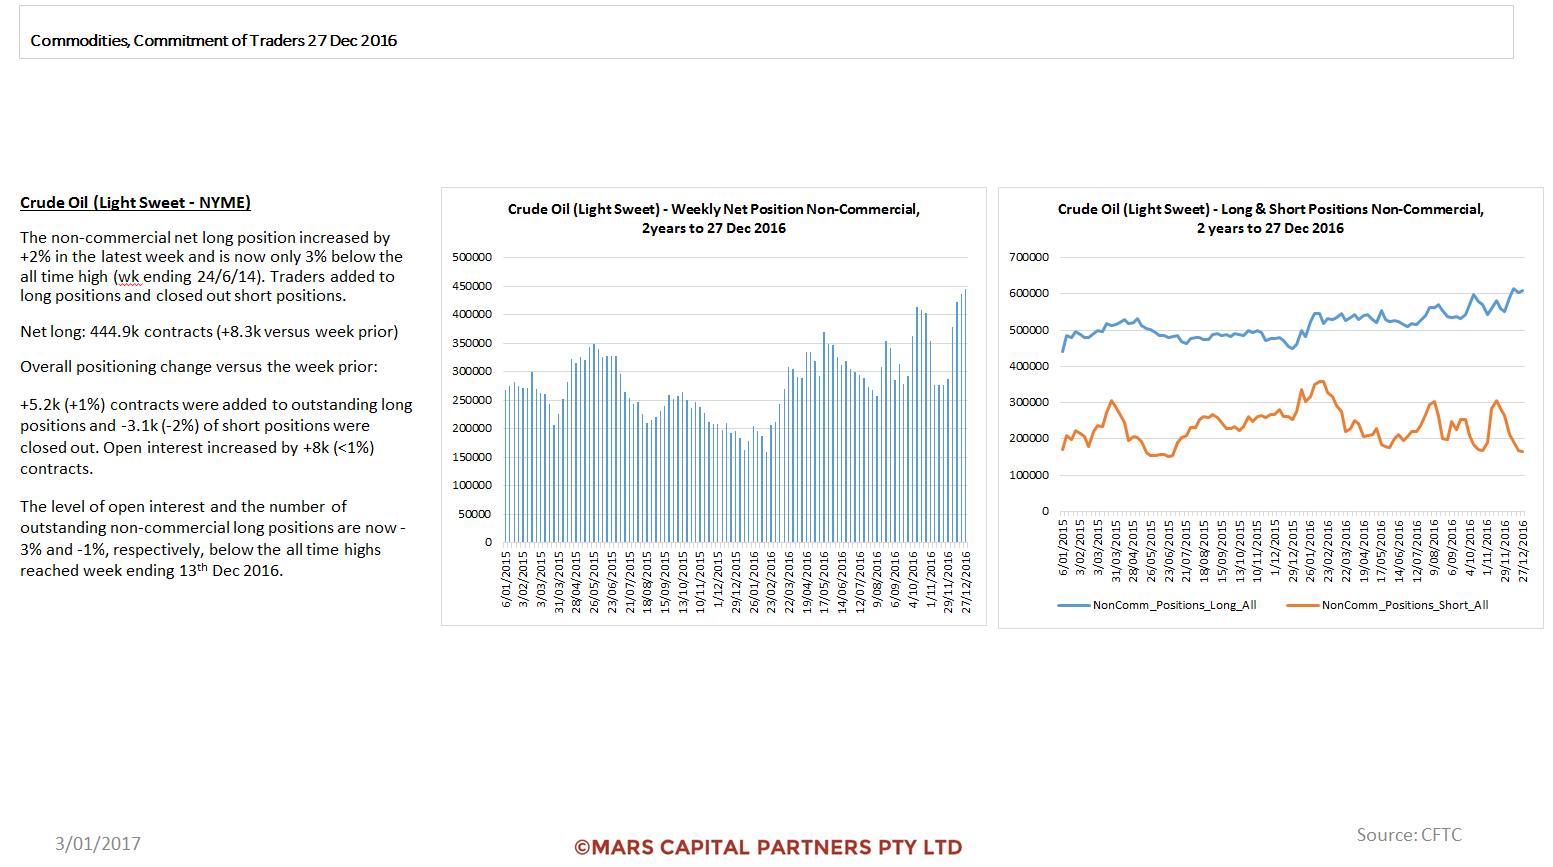
Traders appear to be max bullish which always has me looking the other way.
Dr Copper is trying to form a near term low before it pushes higher in wave 5 of C. The rally off the wave 4 low is not clearly impulsive so we should allow for a brief retest and undercut before it pushes higher near term.
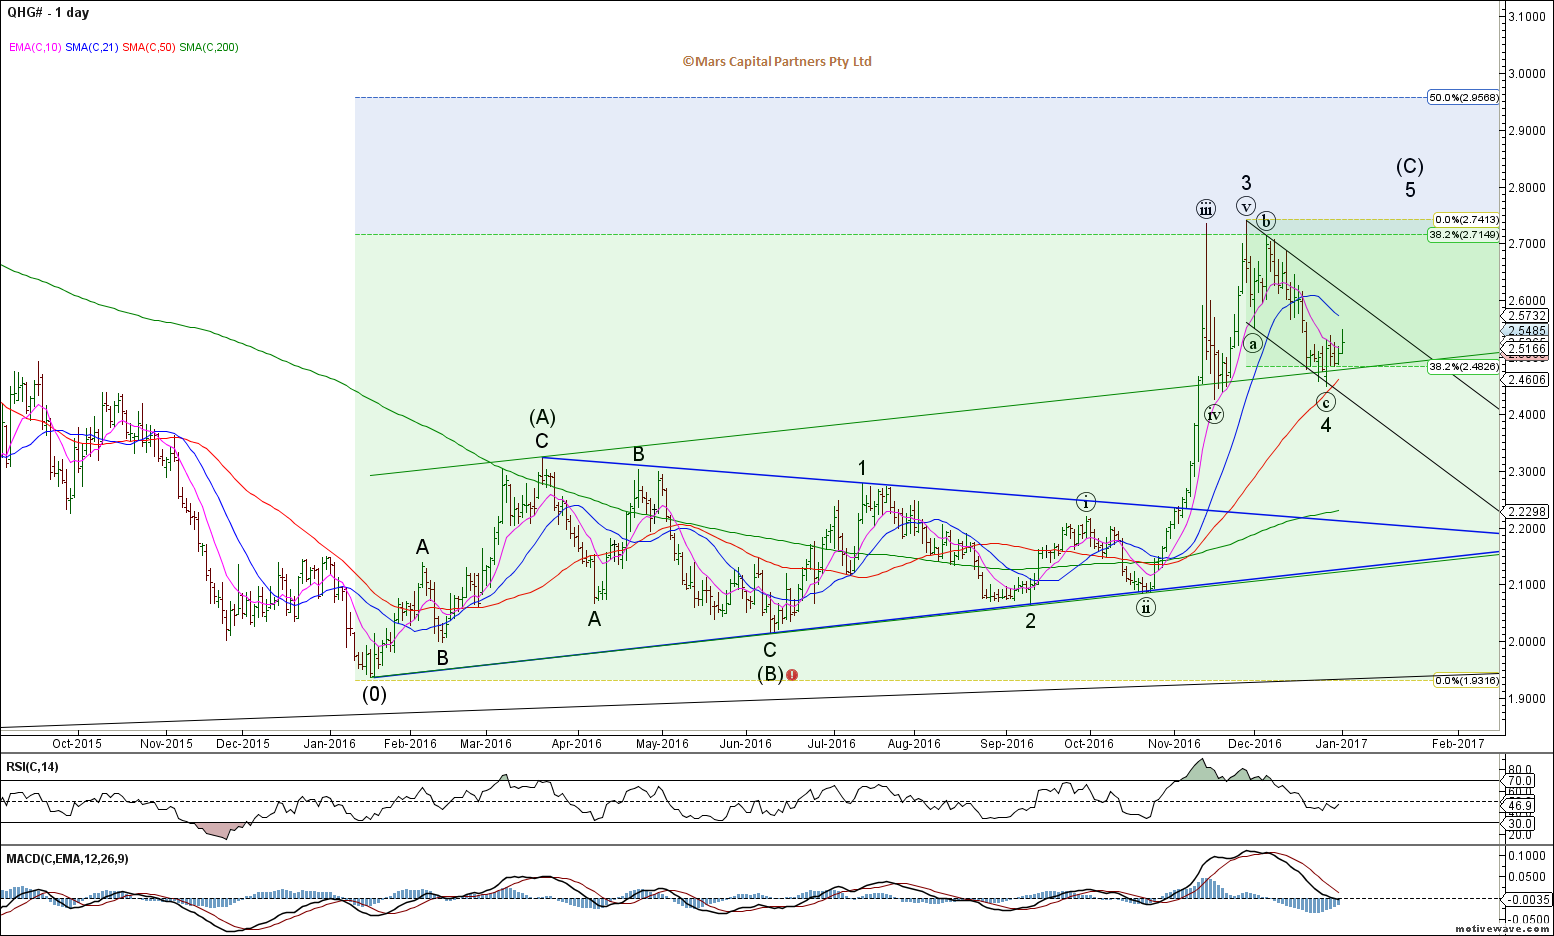
HG Daily
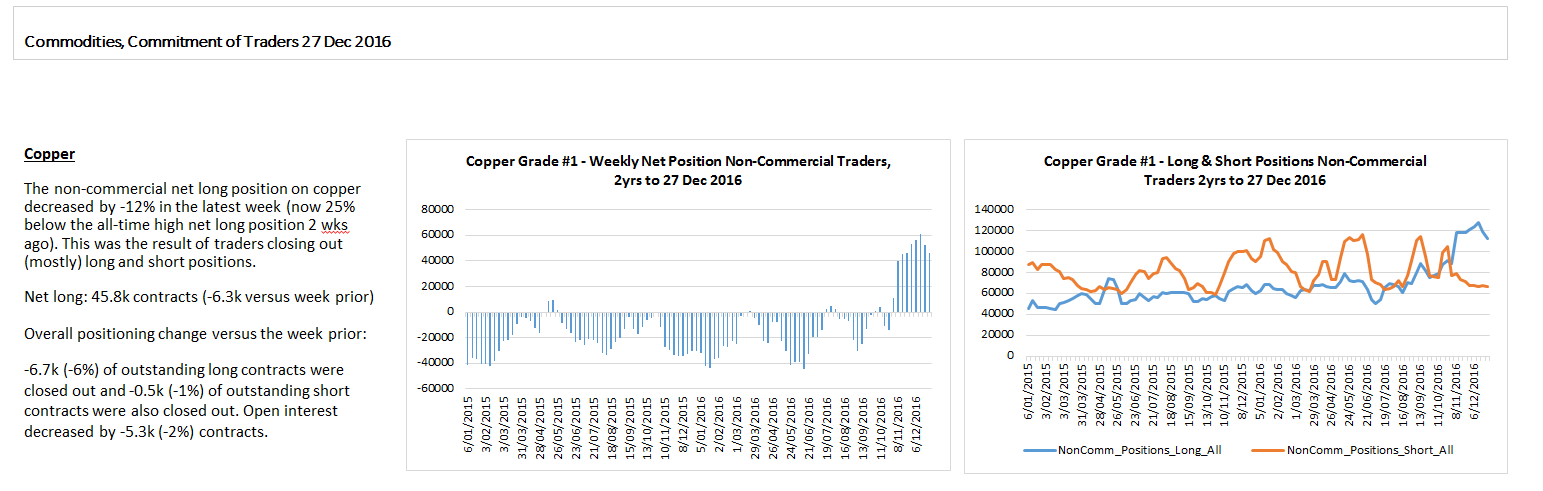
Traders appear too bullish Dr Copper for my liking so I am not buying this yet.
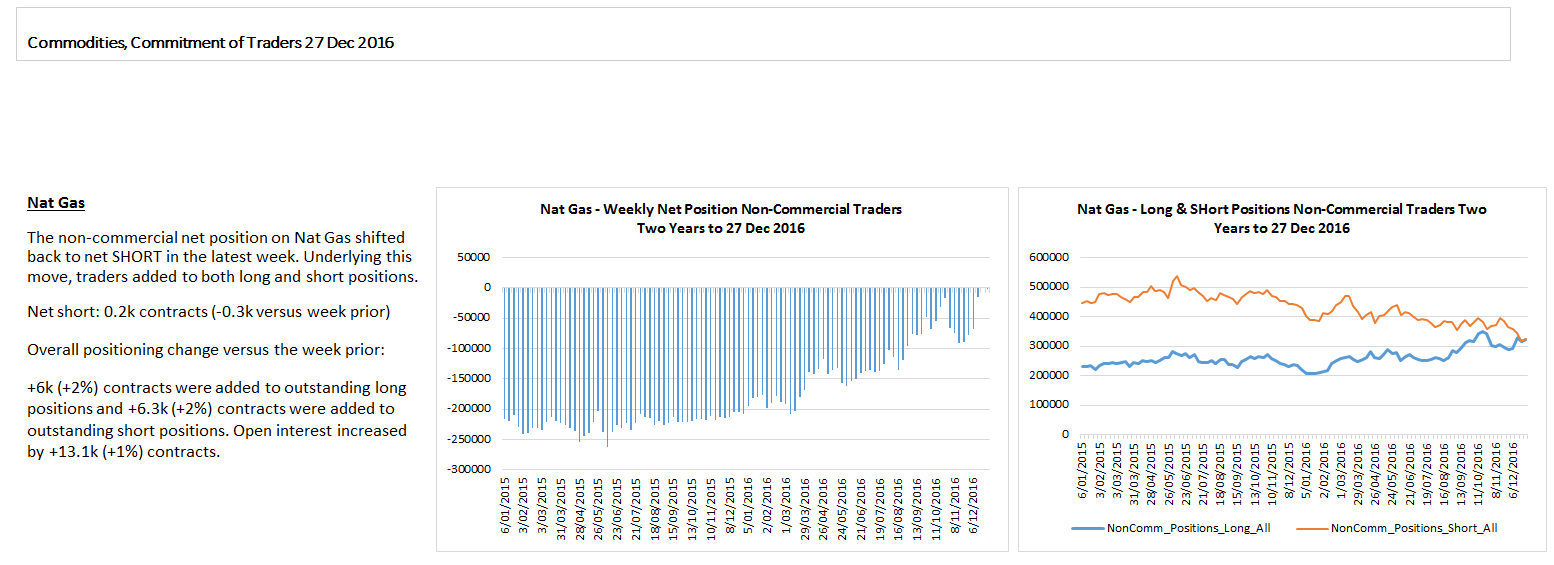
Nat Gas had a nasty gap down today but I remain bullish while we hold the wave 2 low.
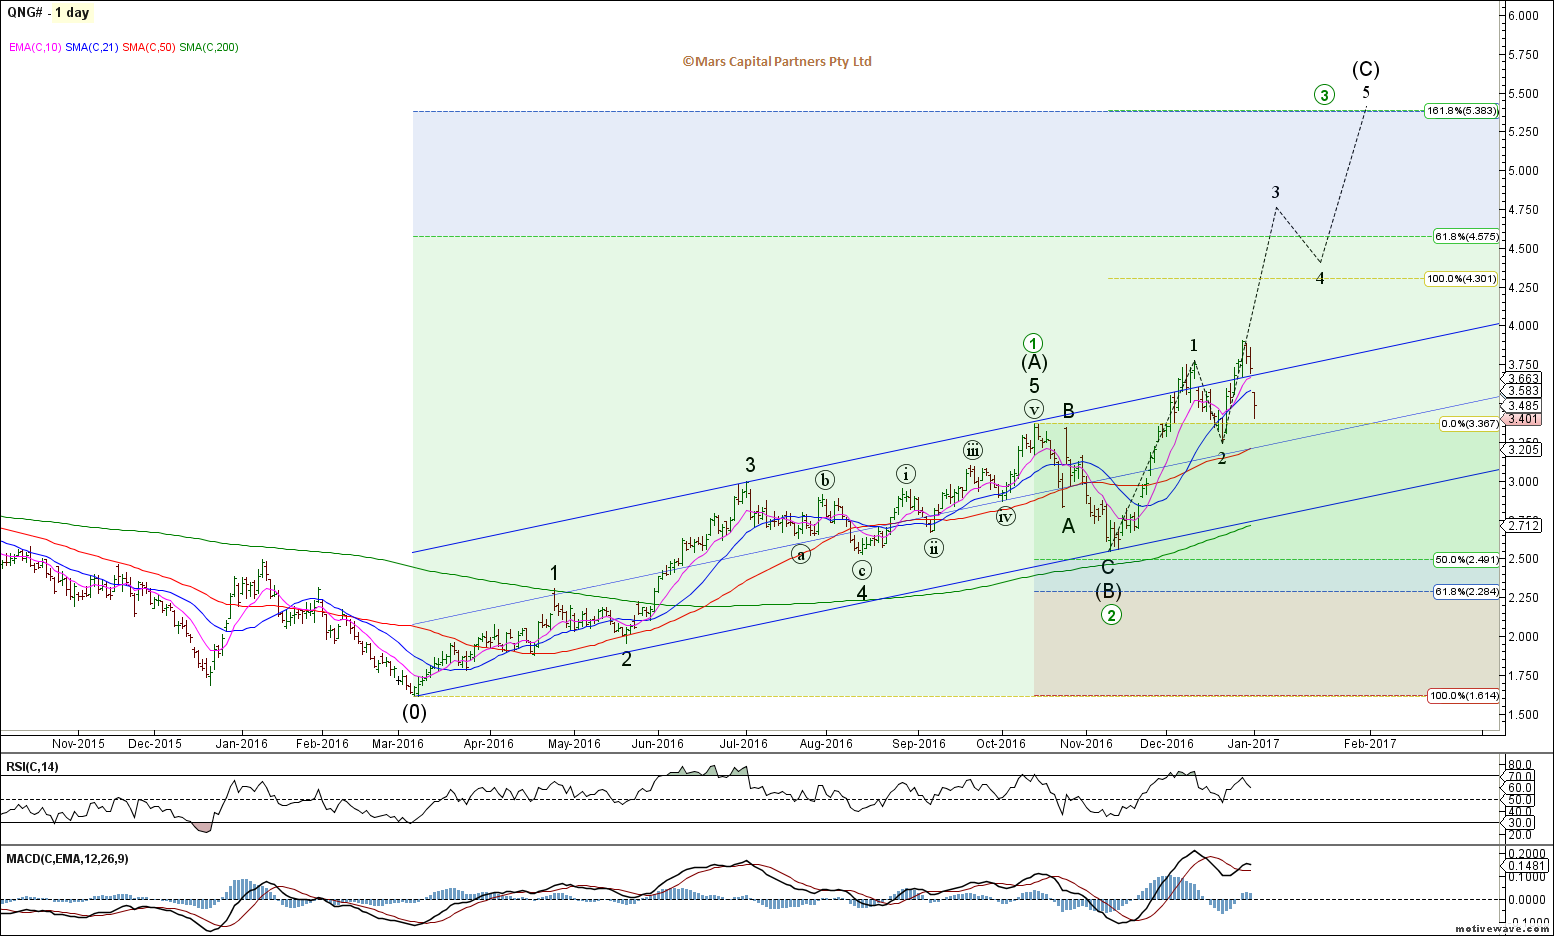
Nat Gas Daily
That’s all for now folks. Have a great week 🙂
