
Reminder: As I will be on vacation from January 29th through to February 16th, we will likely miss updates for the 5th and 12th of February – apologies in advance
US equity markets continued to rally strongly to the point of rising exponentially over the first couple of weeks of 2018 driven by the dovish Fed, Trump tax cuts and investor exuberance. I find it unusual for equity markets to accelerate this late in the cycle as usually only highly leveraged commodities like Silver squeeze exponentially (or the Nasdaq in 1990’s) – the higher we go I suspect the bigger the fall (unless the laws of gravity no longer apply).
Importantly, the US$ FINALLY made the new cycle lows we had been looking for which added further fuel for the commodity market rally – these markets are fundamentally linked (as commodities are priced in US$) and I do not expect one to turn decisively without the other. We are now looking for a completed wave structure for the decline and subsequent bullish US$ reversal. We have been patient thus far so let’s not jump the shark.
US equities including the SPX have started the year rallying at an increasing rate. This type of price acceleration “usually” occurs in the heart of a 3rd wave OR in the midst of a leveraged 5th wave blow-off. Therefore, if this is a genuine 3rd wave rally this equities rally may have a lot more upside to come. Alternatively, we could be in the final stages of a 5th wave blow-off as shown by the red count. We have blown through relevant upside targets so the key question we have to ask as speculators is whether this rally is the real deal OR are we blowing off into a speculative peak (highly unusual given the breadth of the rally). I don’t know the answer as yet but importantly we have not been fighting this. I have tried to illustrate the exponential nature of this rally by the series of rising red trend lines shown below.
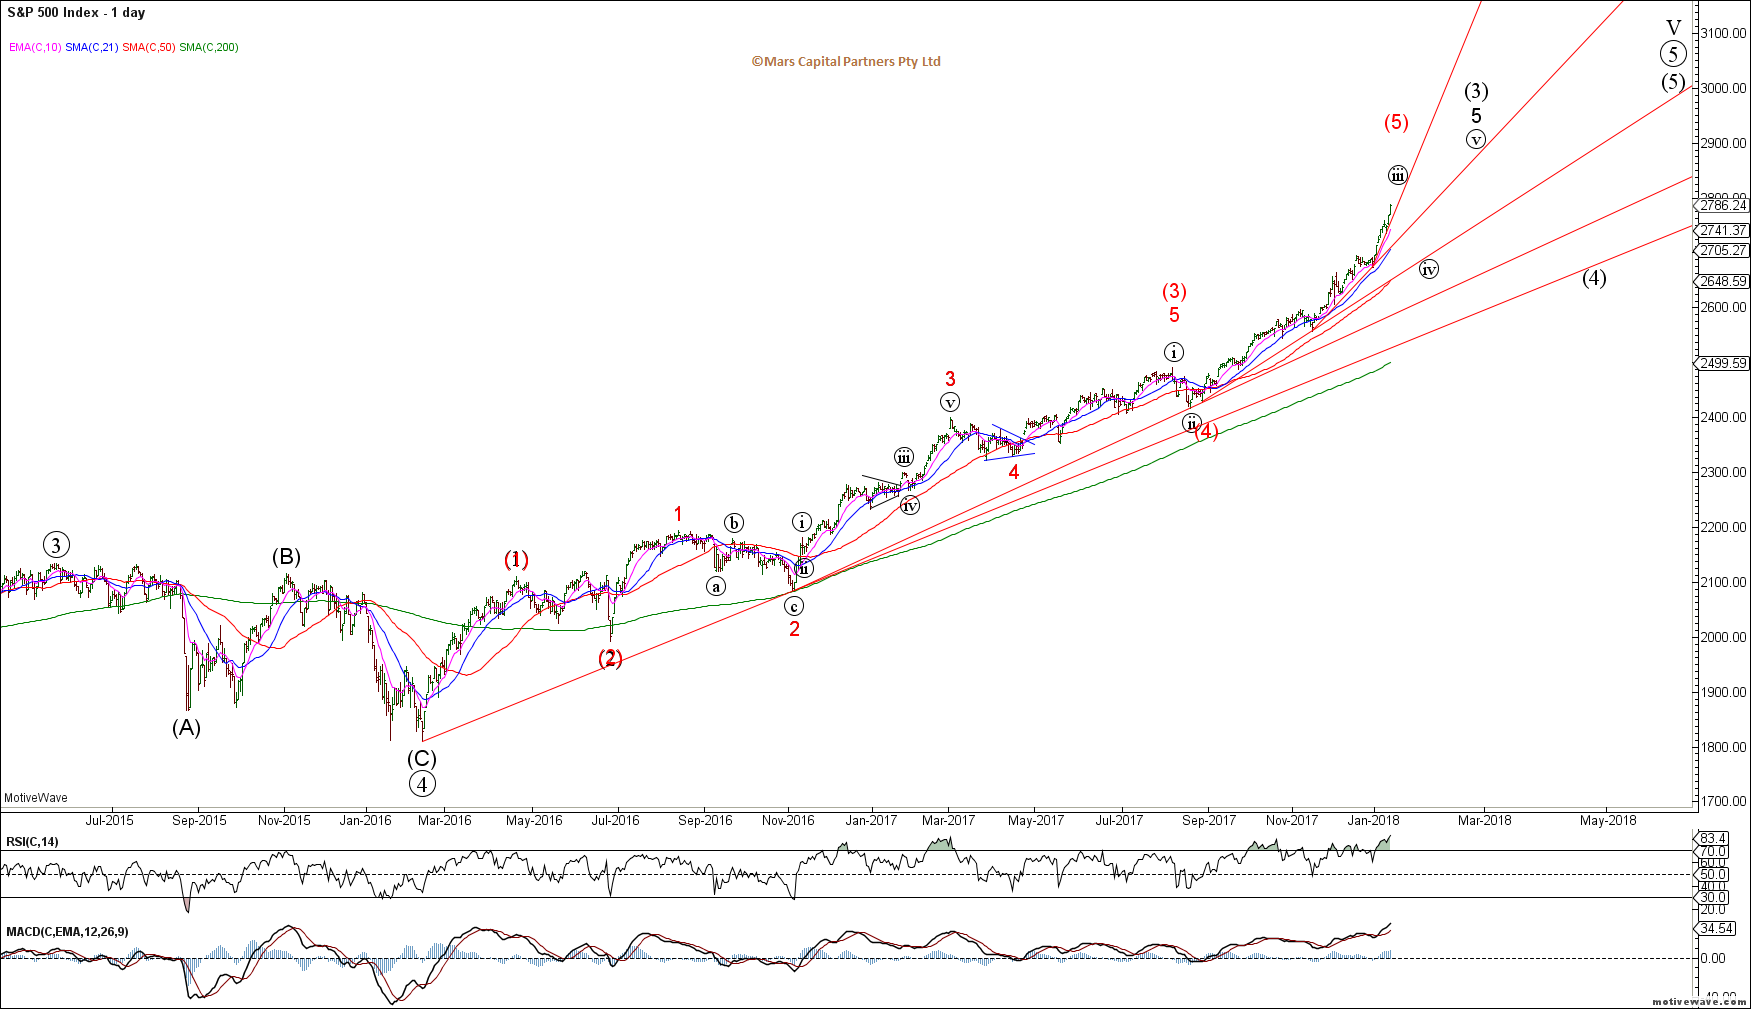
SPX Daily
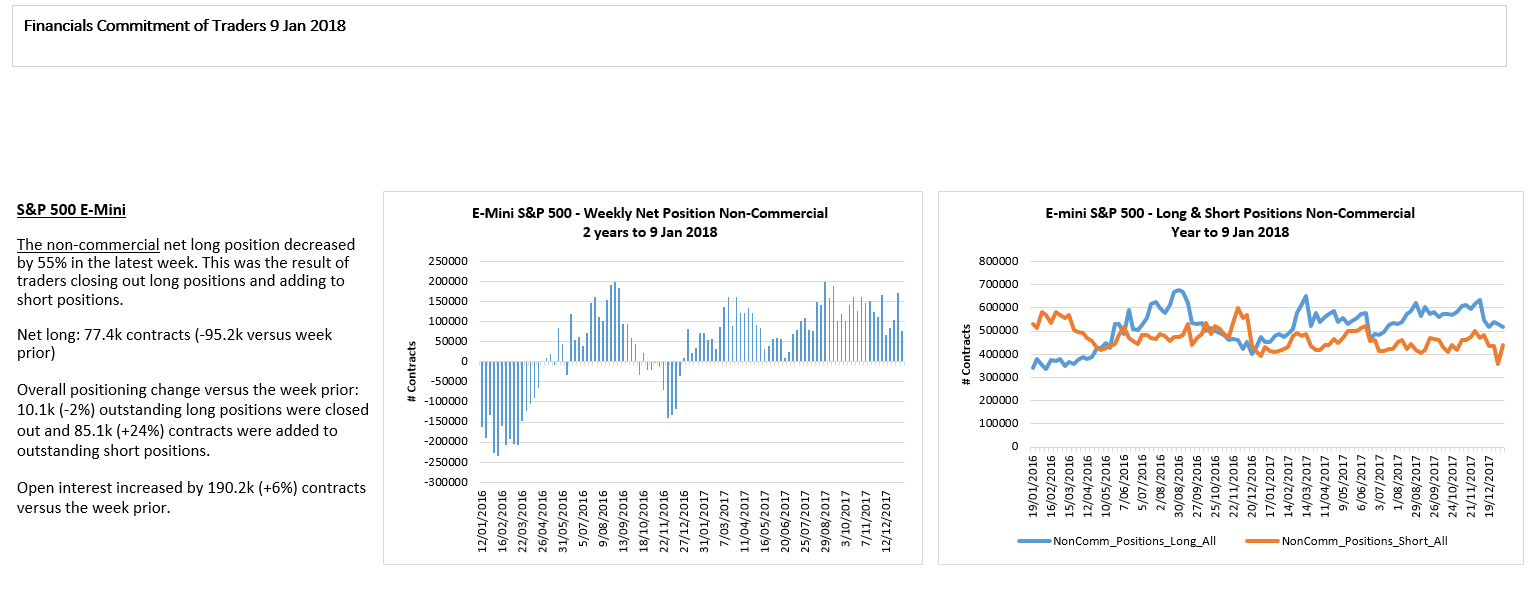
Hedgers have been adding shorts in this melt-up. Meanwhile we have Daily Sentiment at 96 for US equities.
Importantly, momentum measures are now at new high extremes since the start of the post-GFC rally. Either this rally has much further to go to the upside OR we are setting up for an epic fail. Note on the monthly SPX chart below that RSI peaked in June 1996 while the rally continued into March 2000 with a series of lower RSI peaks – the same is NOT true of the Nasdaq rally over the same period where the RSI peaked into the highs (more evidence of a blow-off top). I am pointing this out so readers are aware of the potential outcomes and the dangers of exponential 5th wave blow-offs. I don’t know which of these playbooks plays out BUT we should be mindful of the POTENTIAL of an ending blow-off (shown by the red count above) and what that might mean for markets in this time of speculative euphoria. The key message here is that we can all protect ourselves of either outcome with the use of tail hedging.
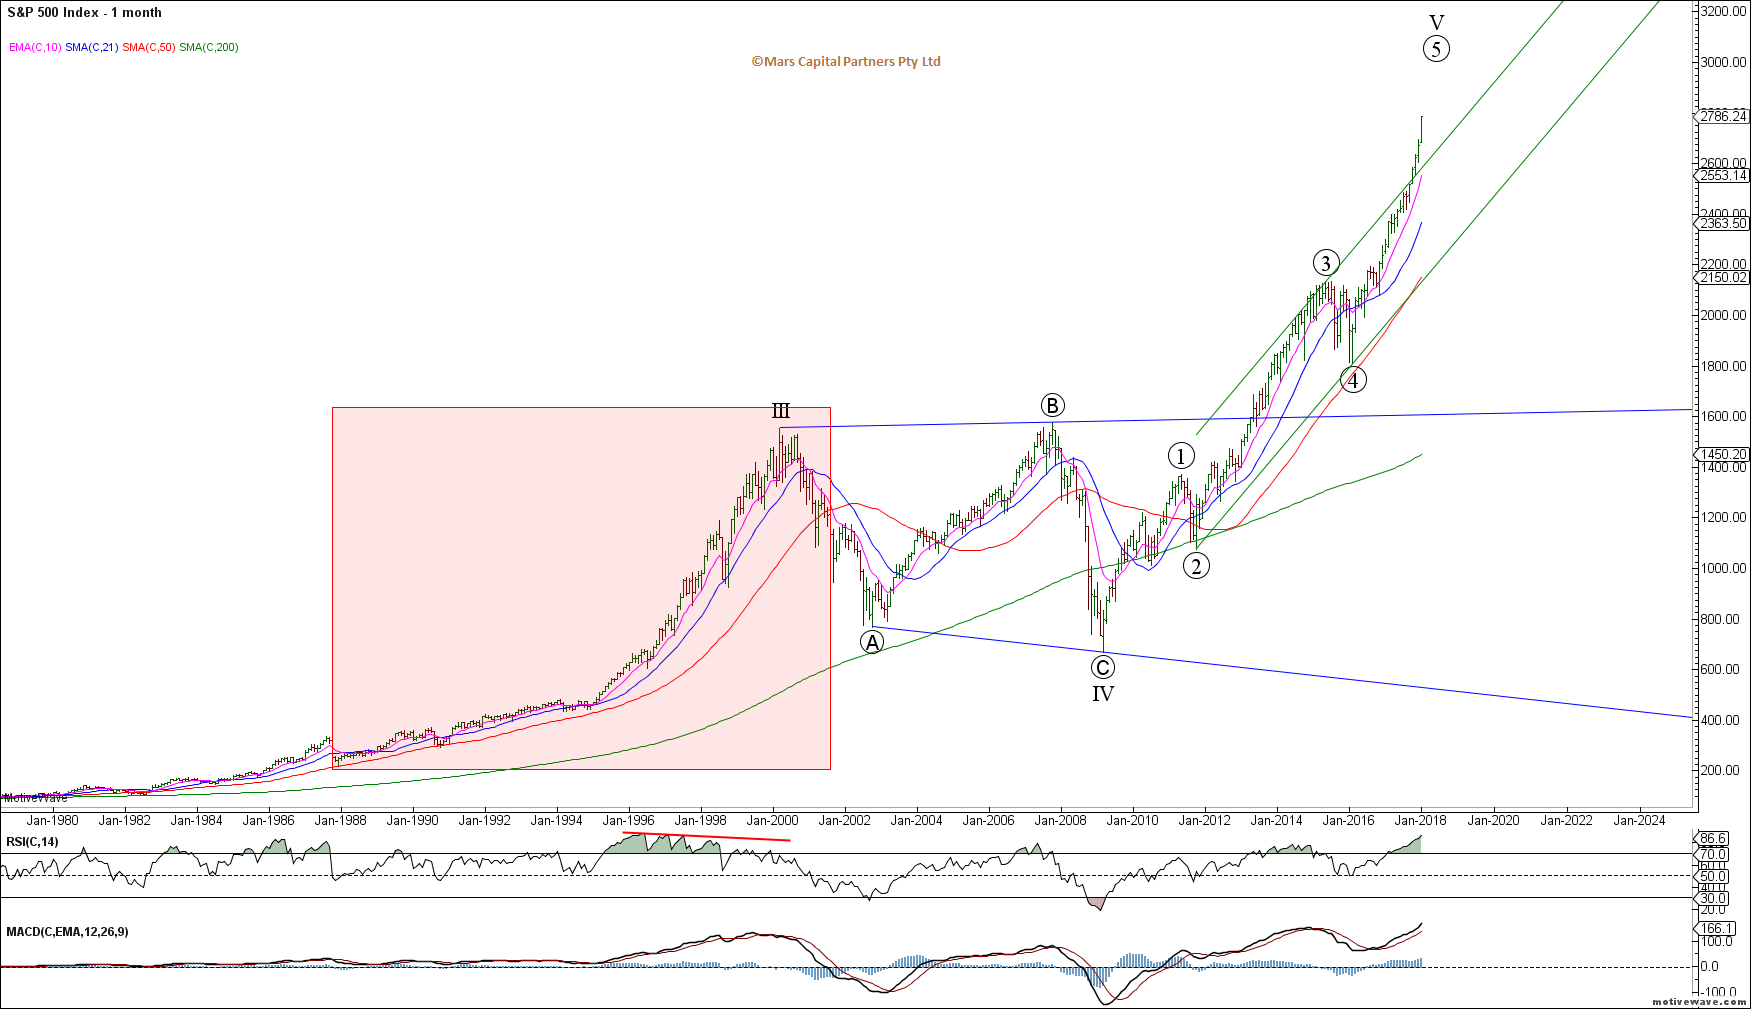
SPX Monthly
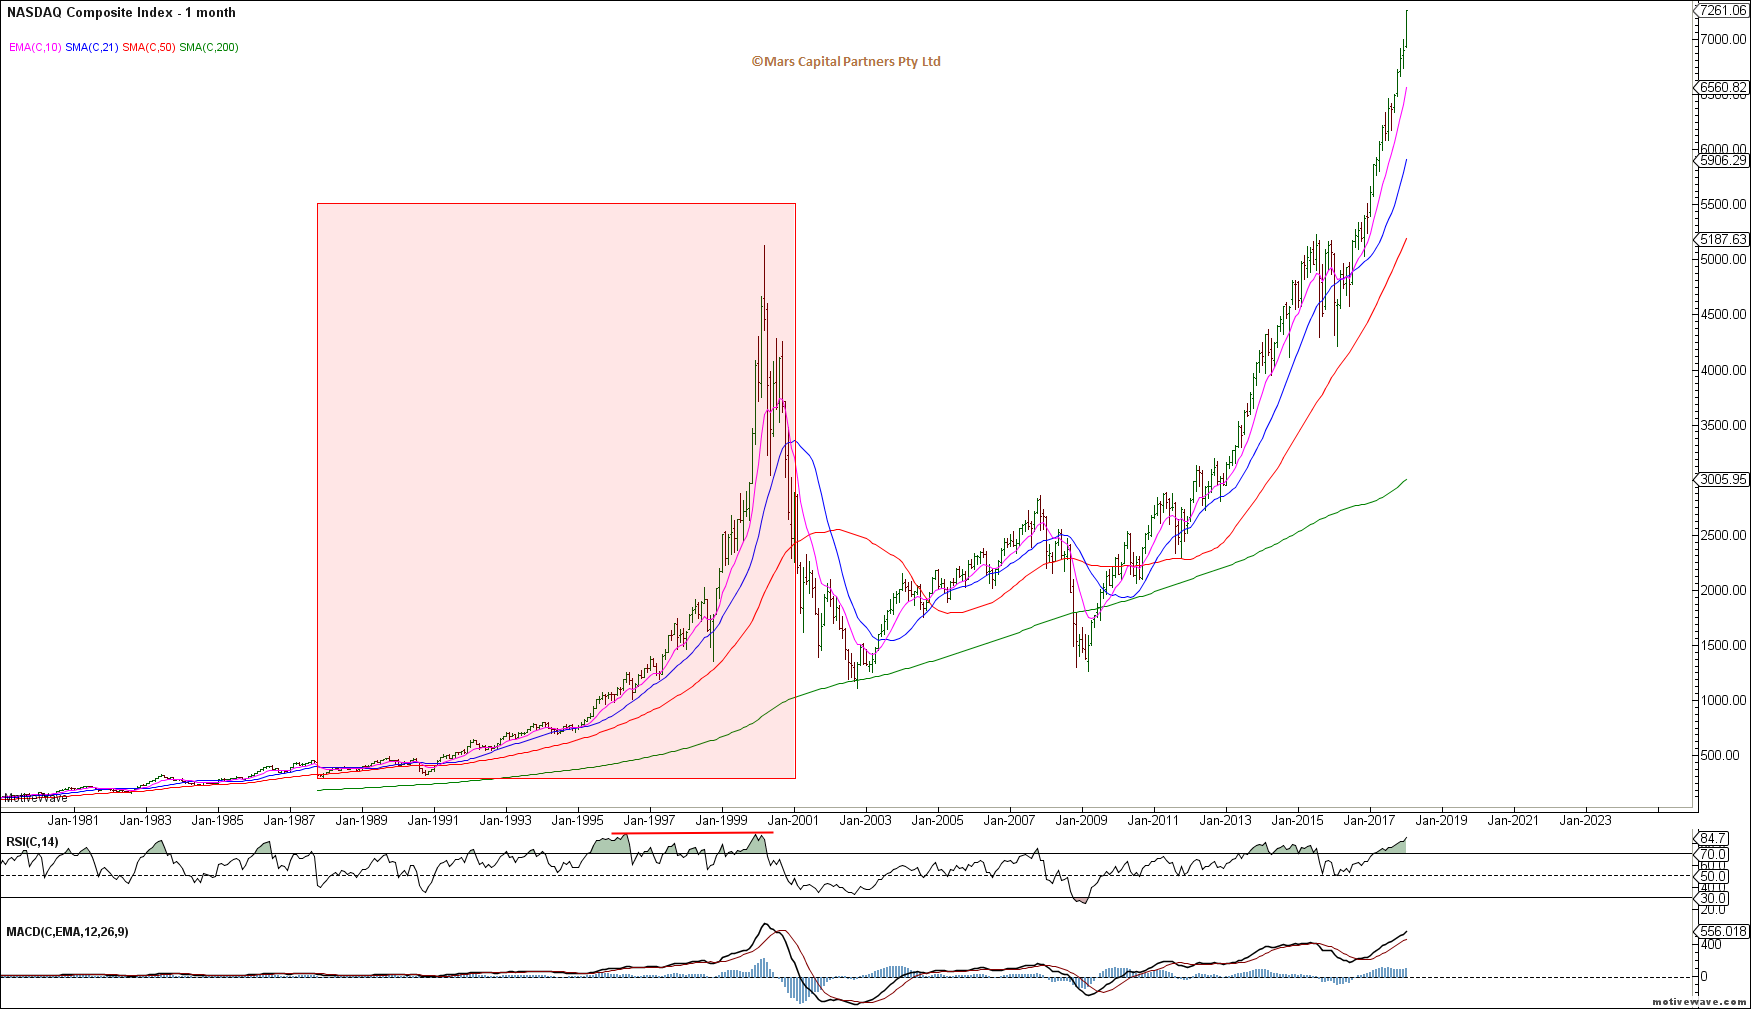
Nasdaq Monthly
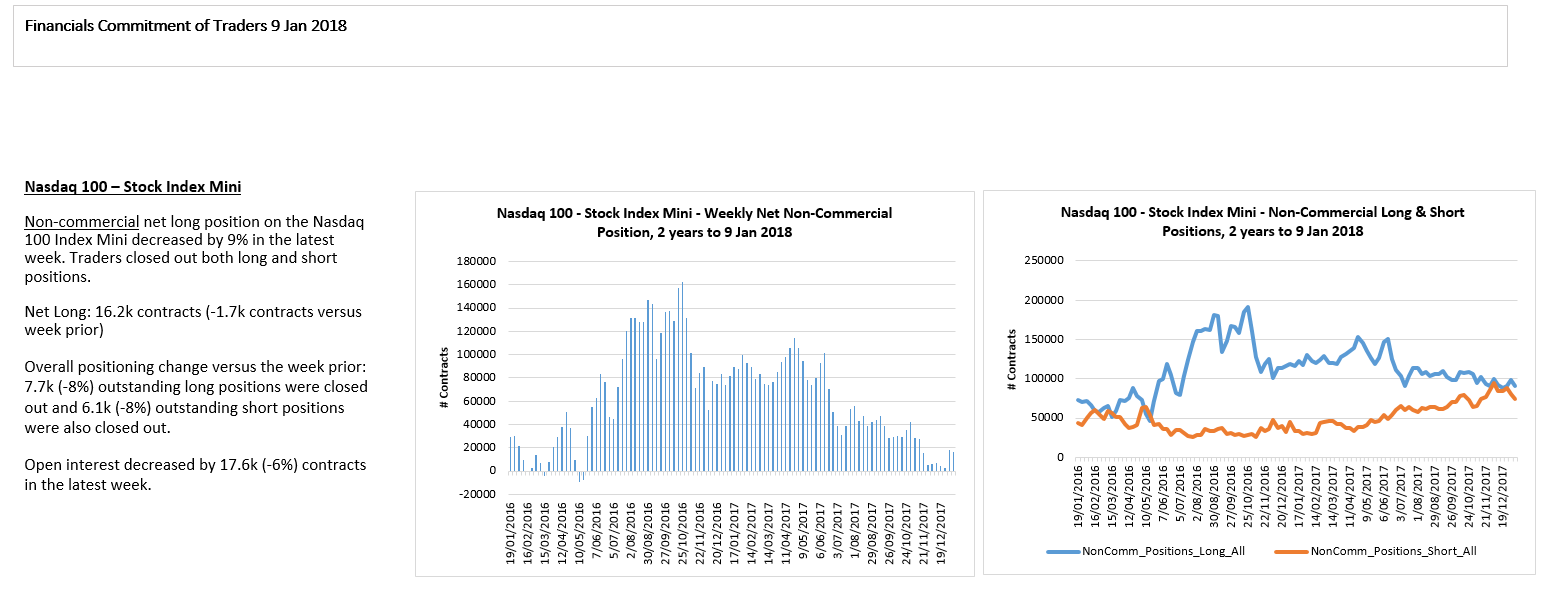
Meanwhile, Nasdaq futures shorts are getting squeezed.
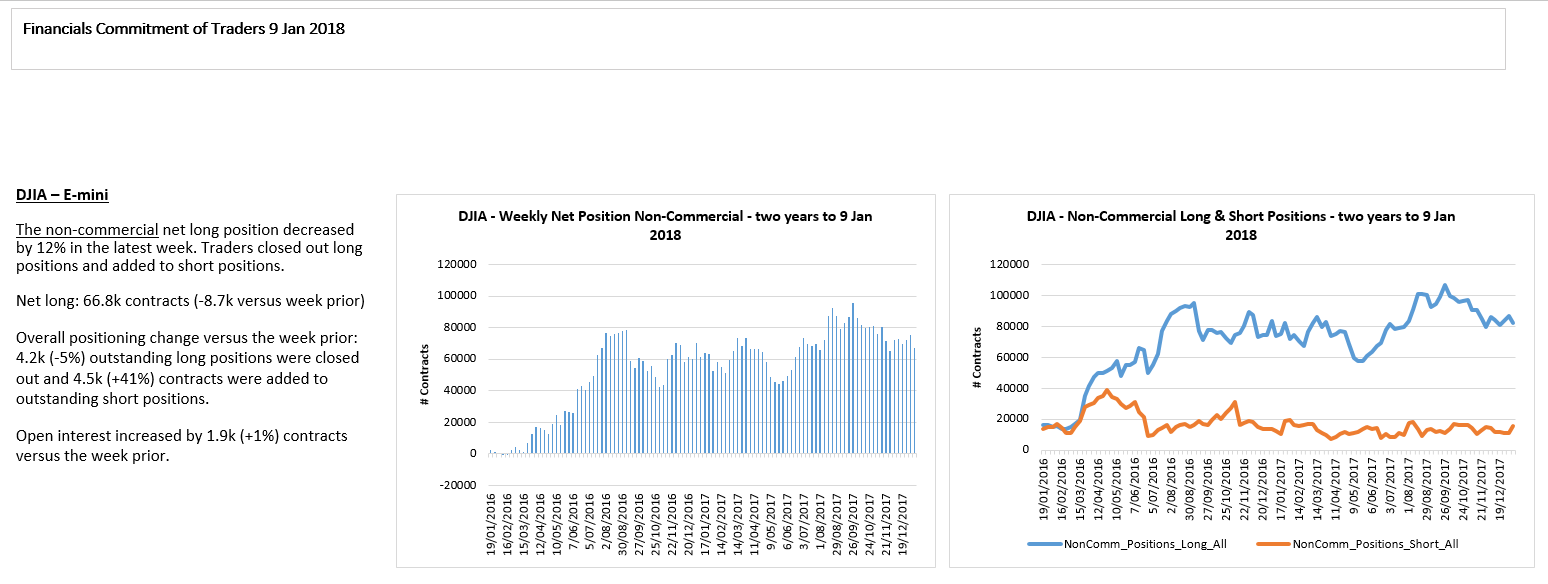
Note the DJIA’s now exponential rise in what is a muddling economy but prices are being driven by increasing leverage (debt) and speculative exuberance.
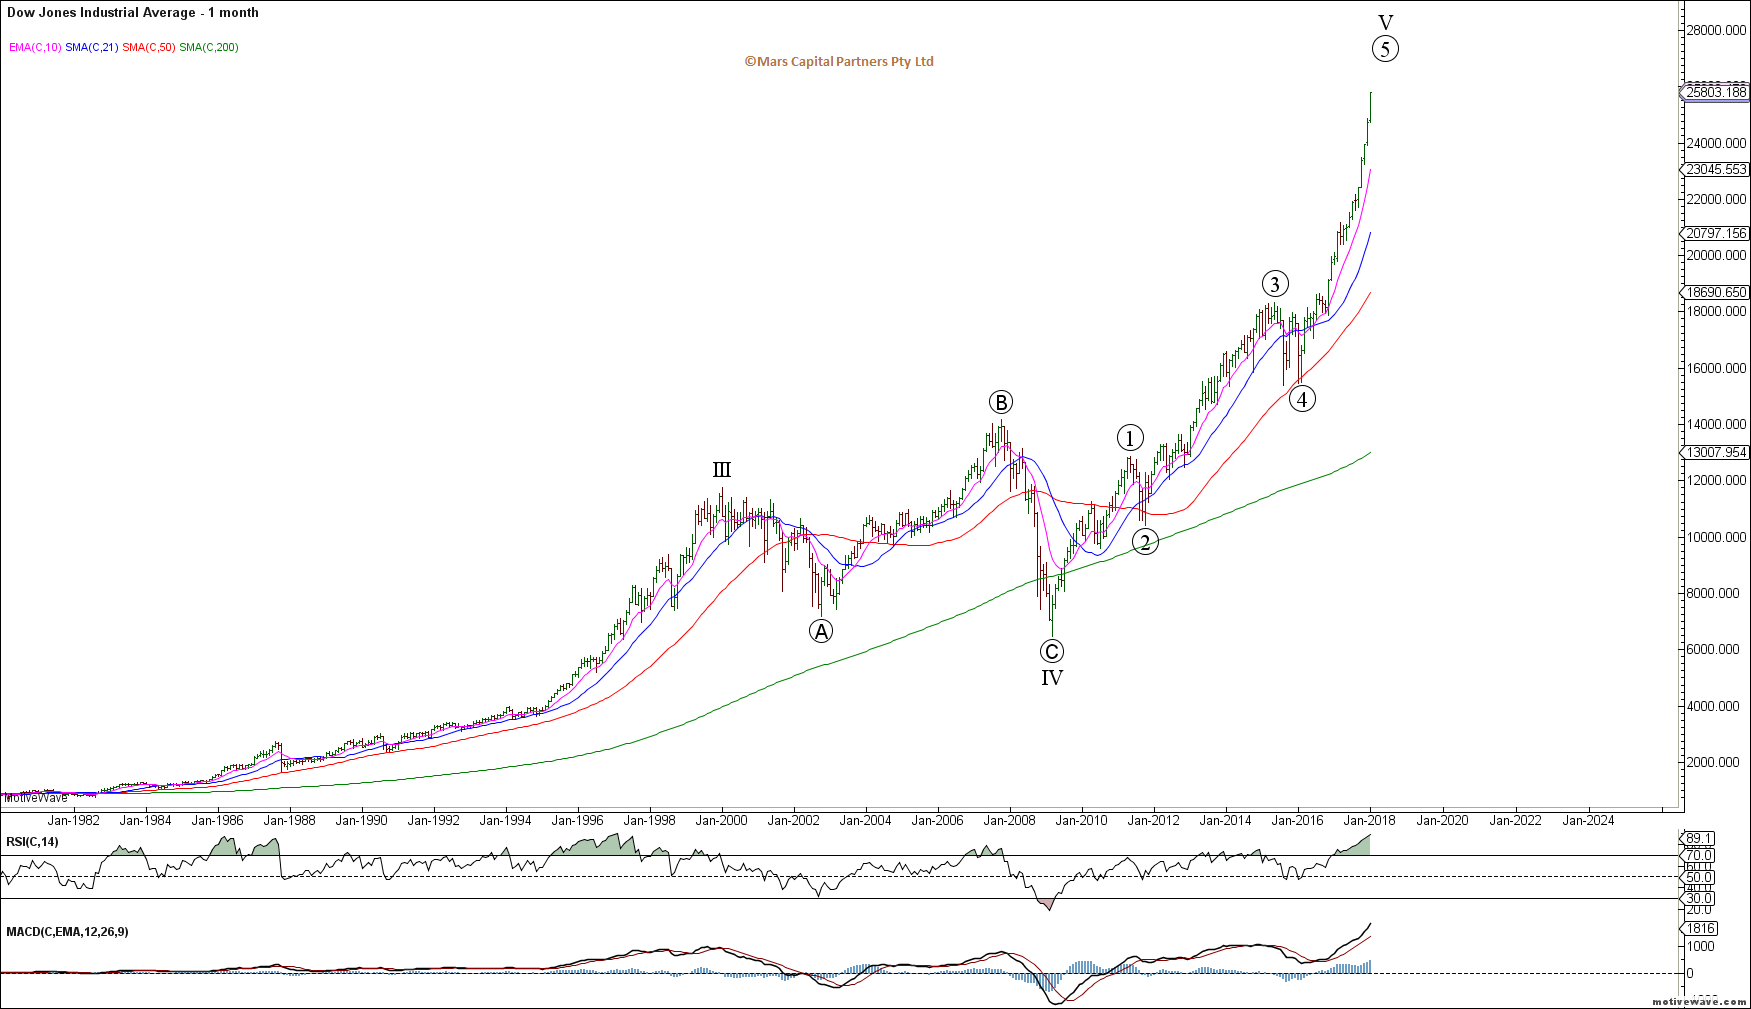
DJIA Monthly
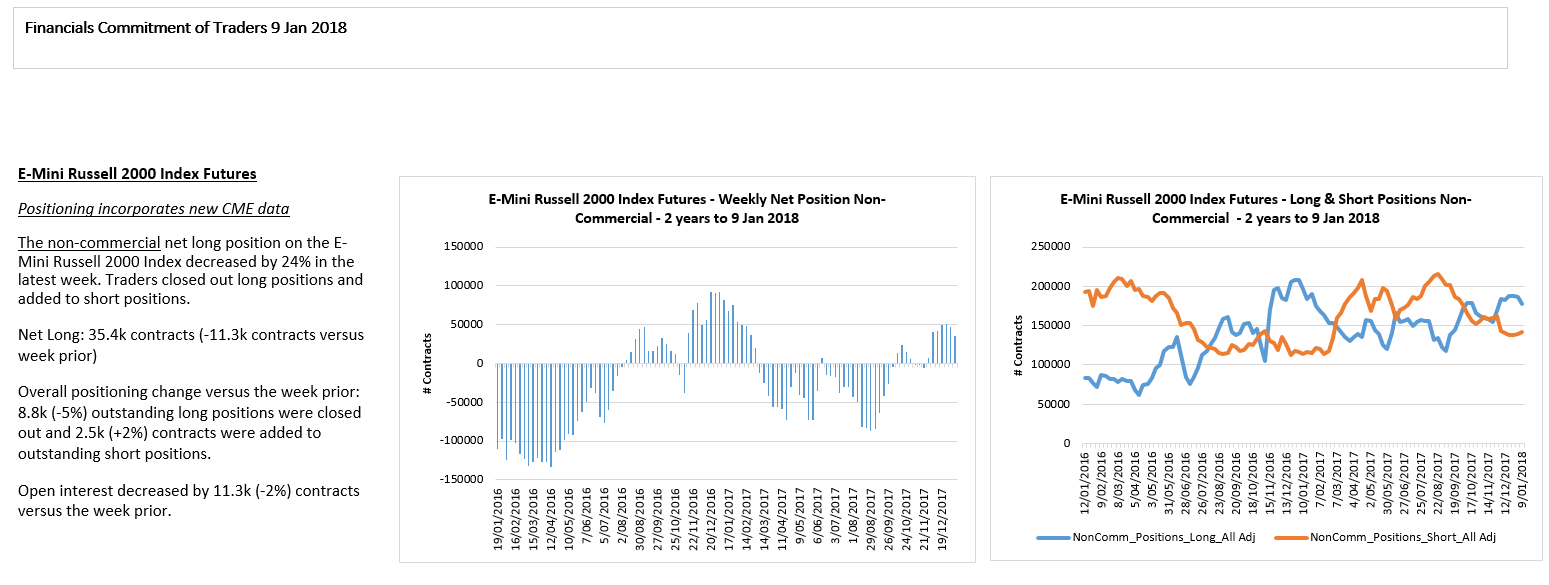
Now that the Russell 2000 has achieved our upside objective we are looking for evidence of a reversal – our “canary in a coalmine”. Trade above 160.55 for IWM invalidates the “ending diagonal” structure and will likely lead to increased strength. Key inflection point here for the small caps.
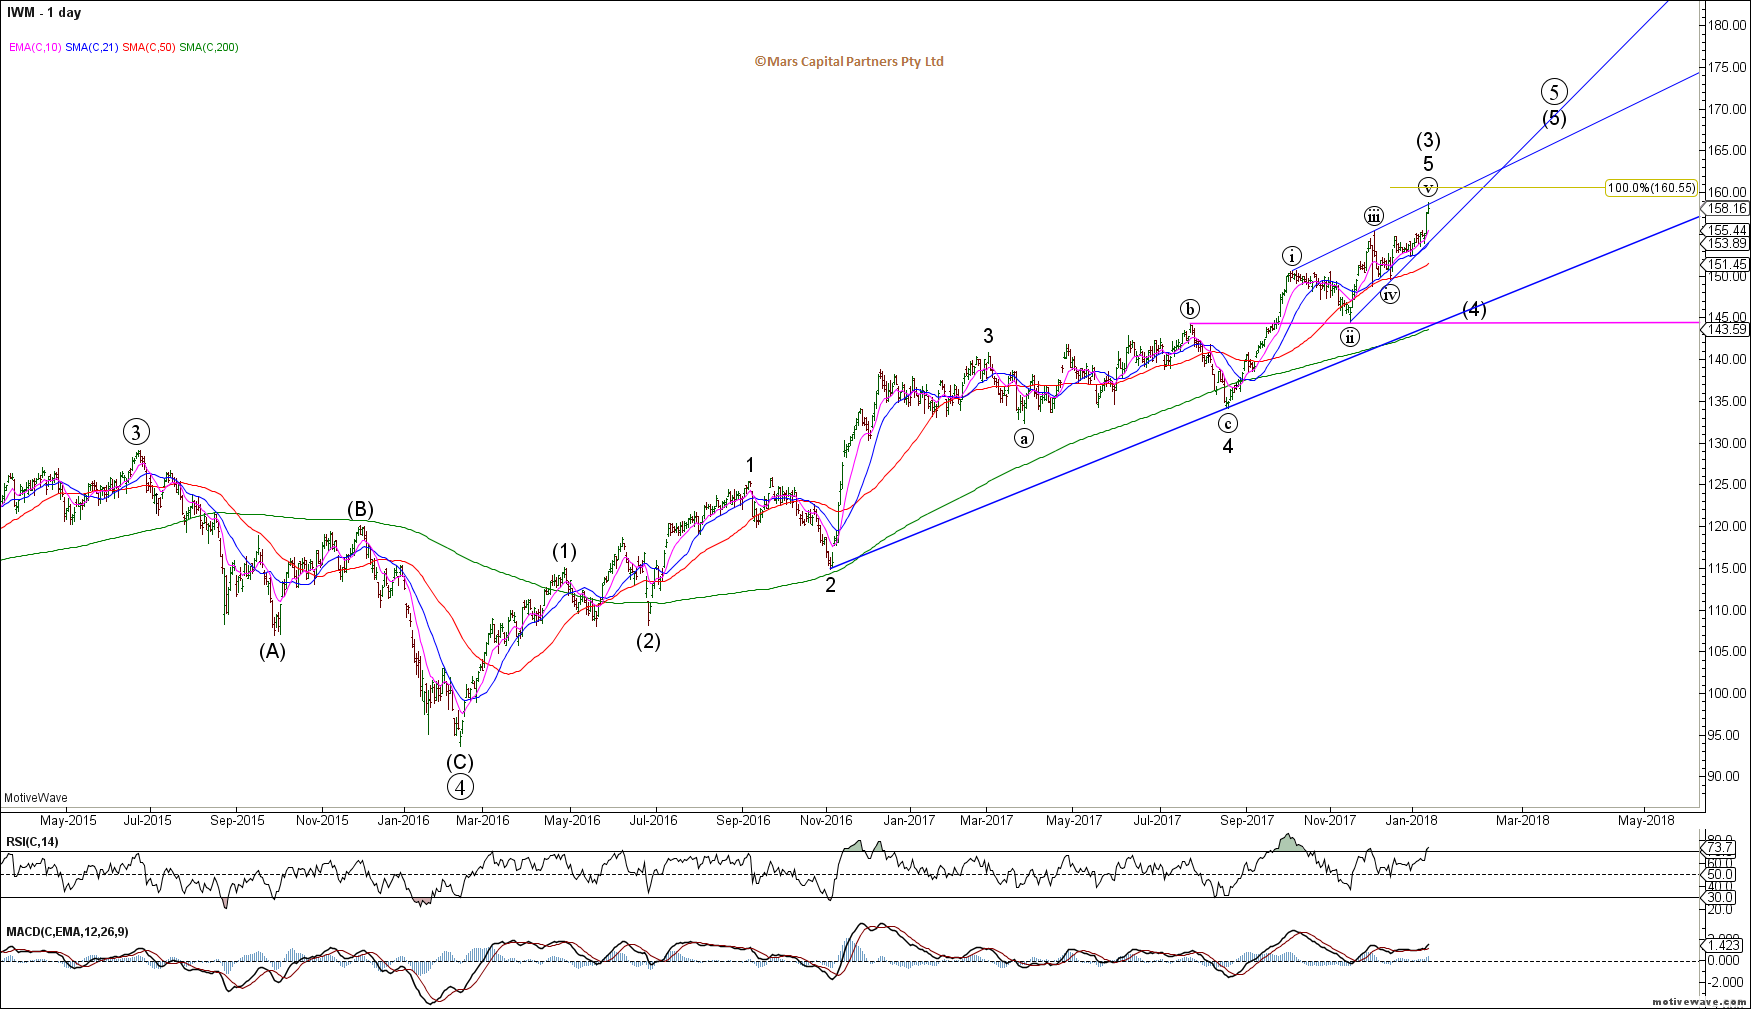
IWM Daily
RTY is approaching invalidation of its ending diagonal above 1615 – remember, if we don’t fail asap then we could extend much higher.
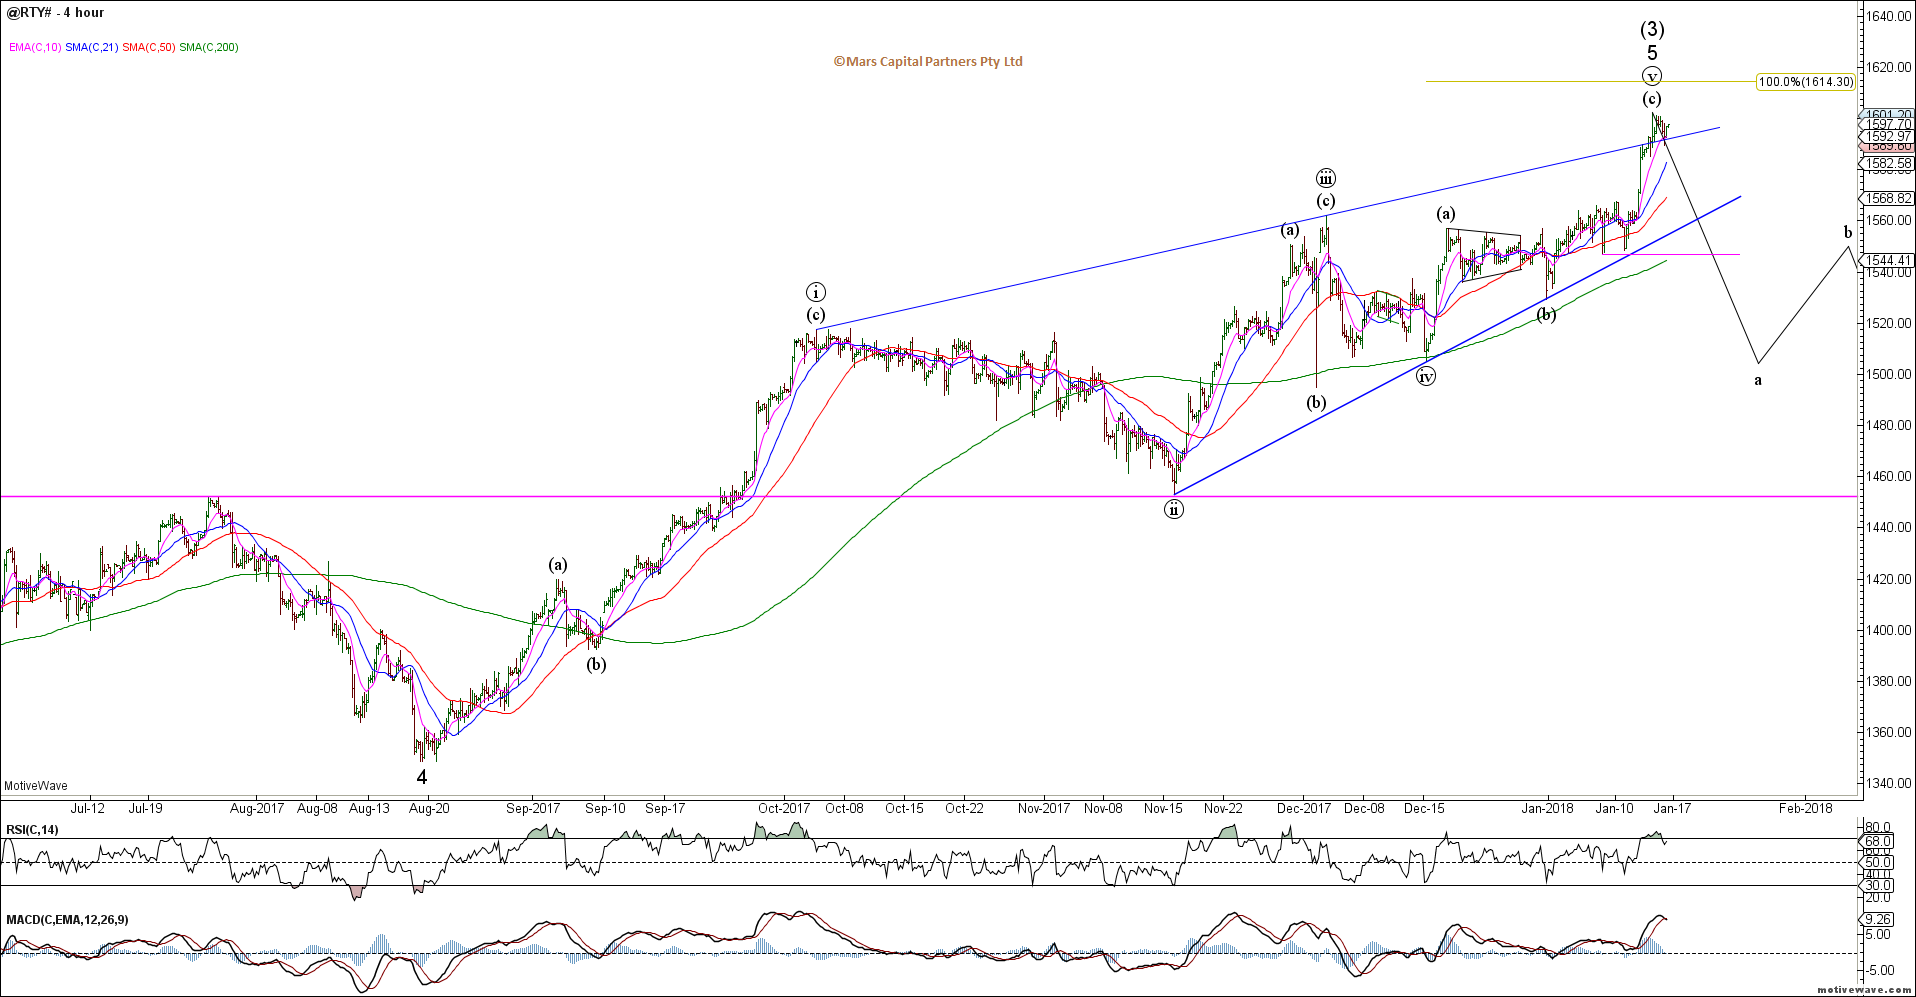
RTY H4
Interestingly, the VIX has NOT made new lows despite the strong new year run-up in US equities as this pincer move continues. Take note.
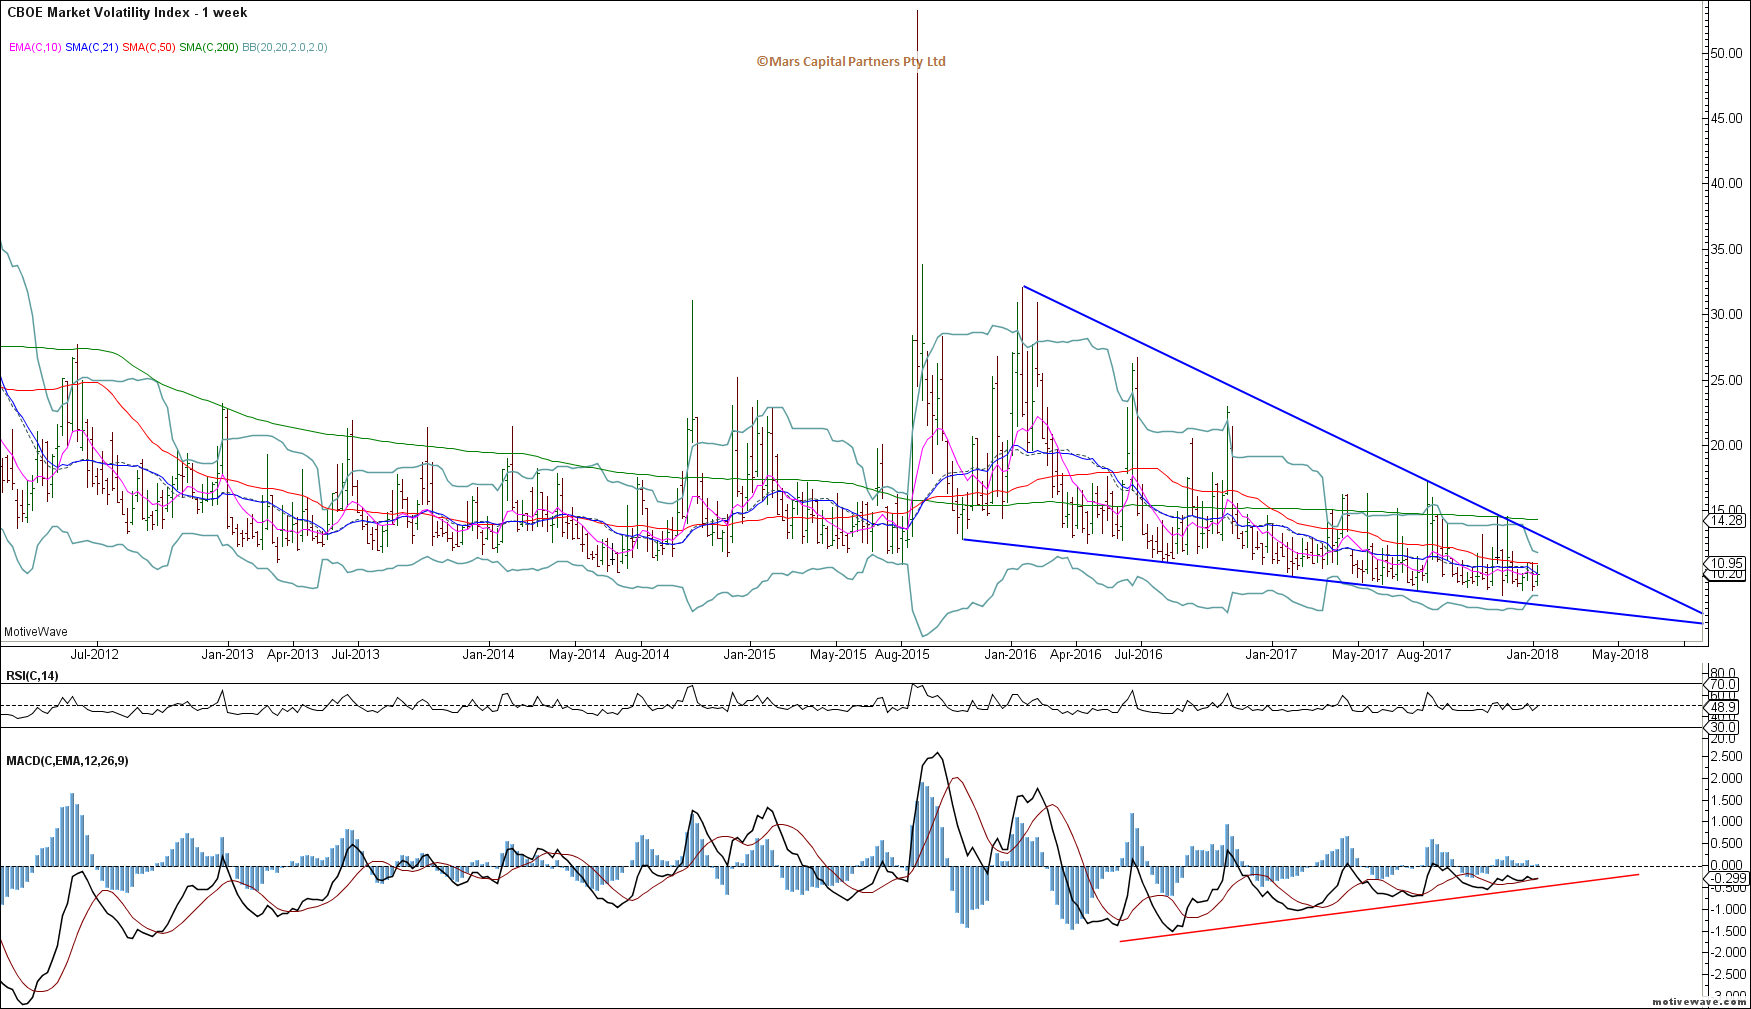
VIX Weekly
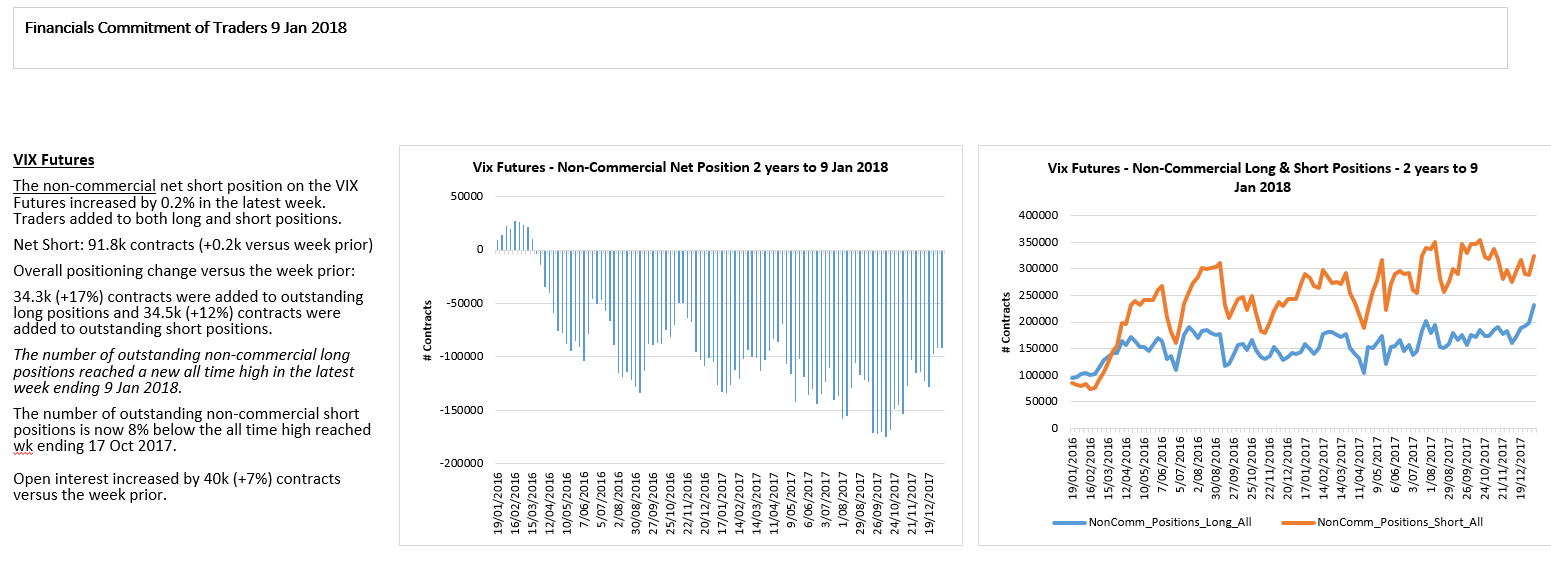
VIX traders are adding longs at a faster rate than shorts likely for tail hedging which likely explains the VIX not making new lows while equities are at ATH’s.
To the global equity markets and the DAX reversed from megaphone resistance we highlighted in prior updates. The November highs remain key resistance as trade above that will likely lead to another strong wave higher. Until then, our bias remains lower back towards 12700 and potentially much lower. Ideally, we don’t want to see the DAX trade back above 13400 to maintain bearish momentum.
DAX H4
The European Banks have broken out to the upside given rising rates in the Euro area. Bulls don’t want to see this back inside the triangle as this is likely a 5th wave rally.
Euro Banks Daily
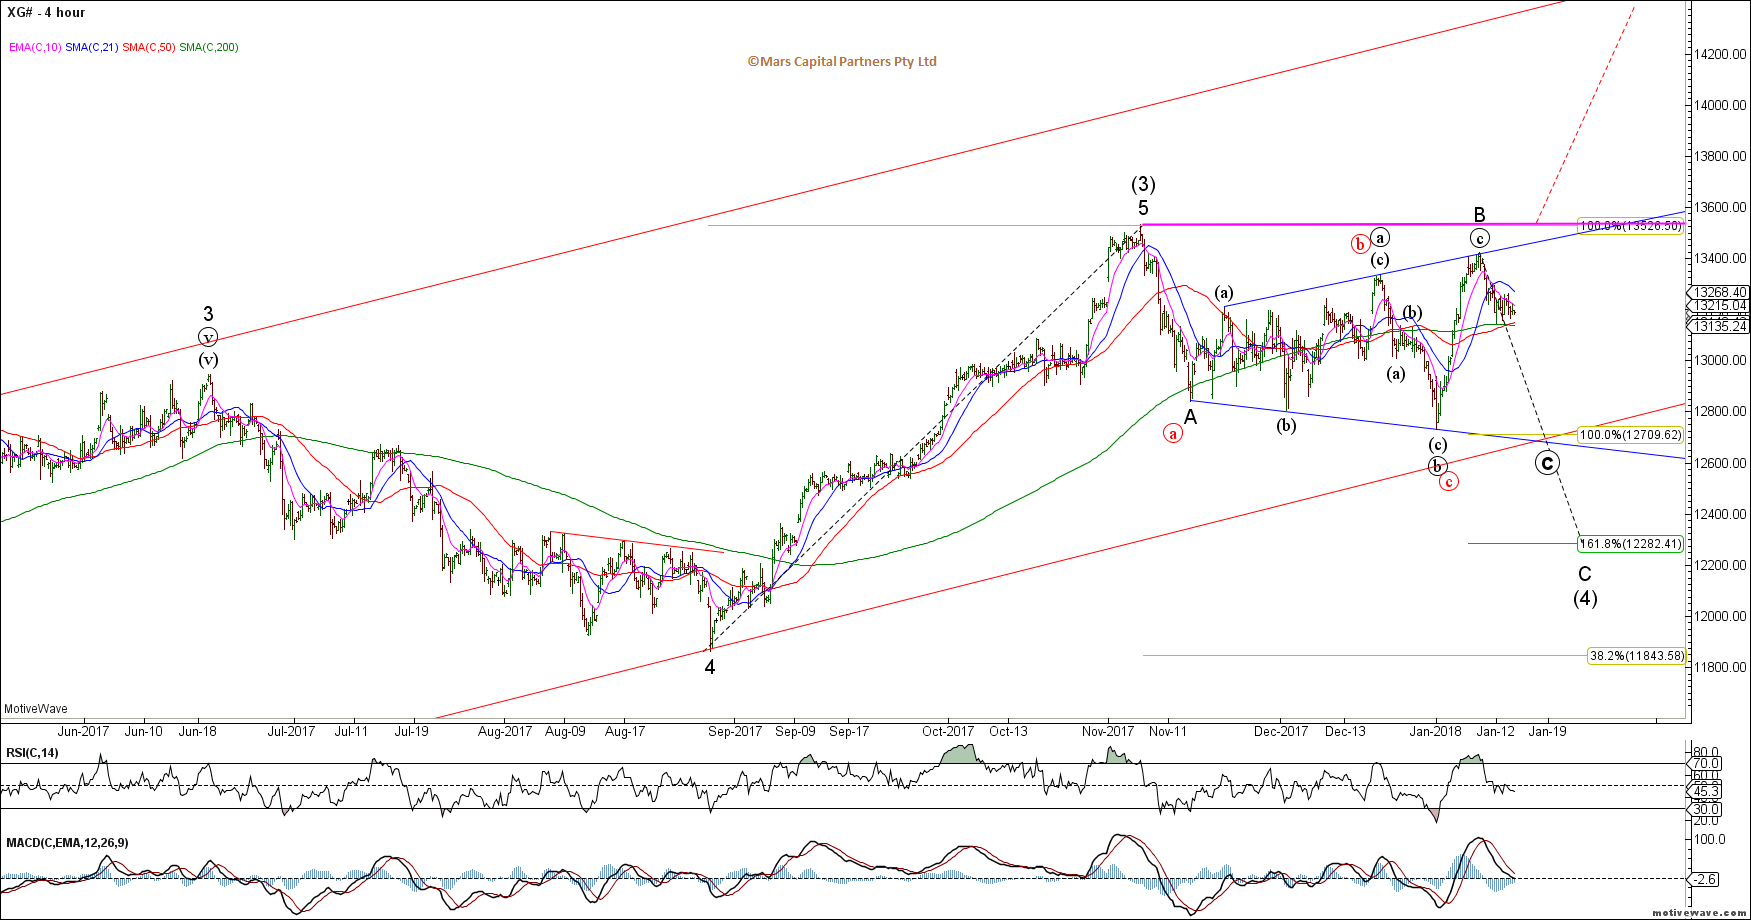
The NKD has stalled since our triangle thrust higher but has held up despite a strengthening Yen. No interest for me here as there are no clear signs of a bearish reversal so the wave may extend higher.
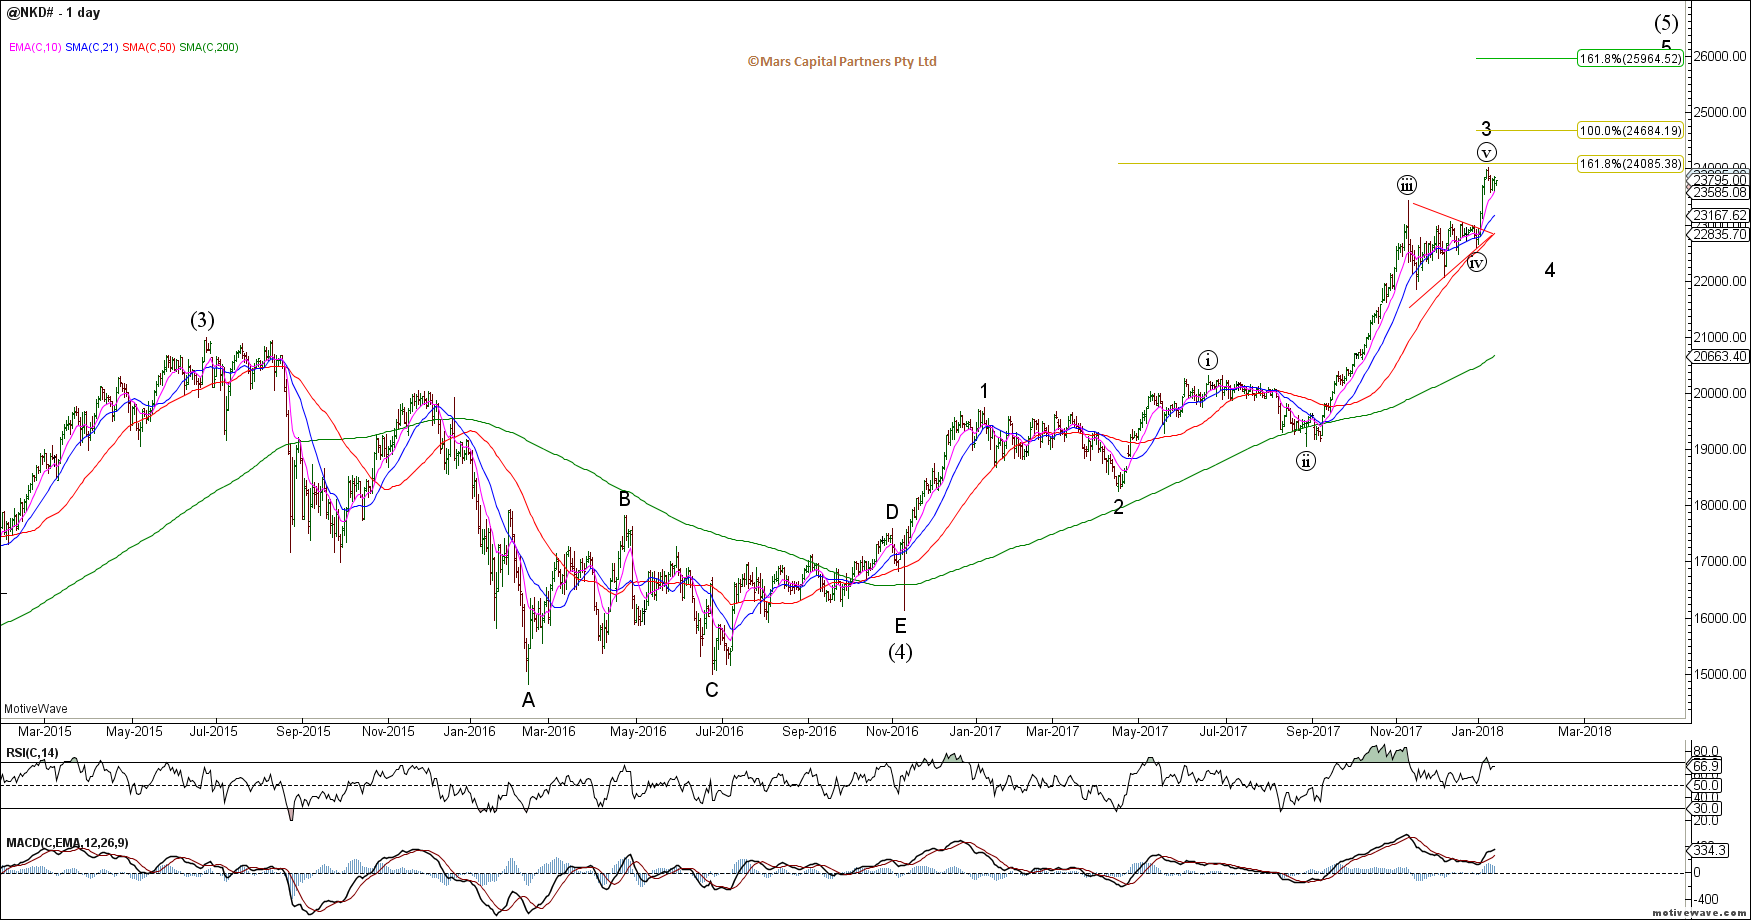
NKD Daily
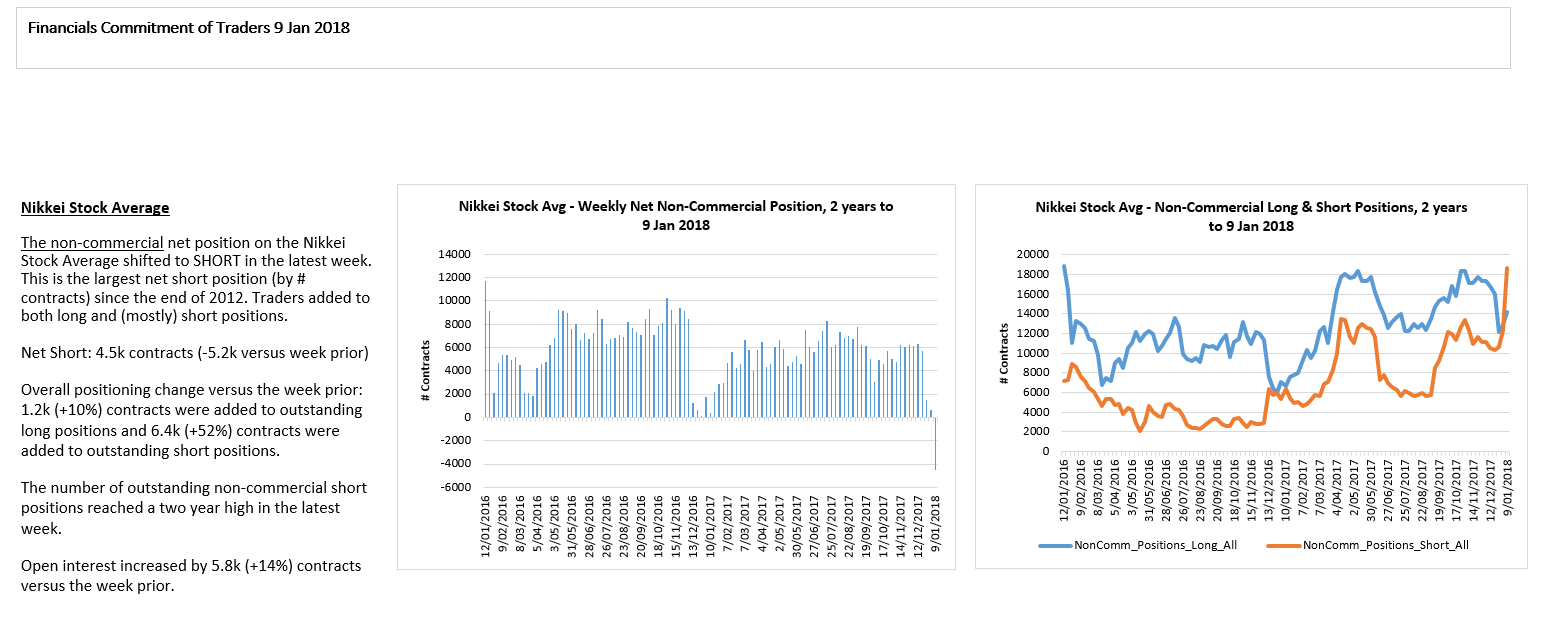
It is concerning that NKD traders have gotten so bearish which may imply that wave (v) of 3 is incomplete.
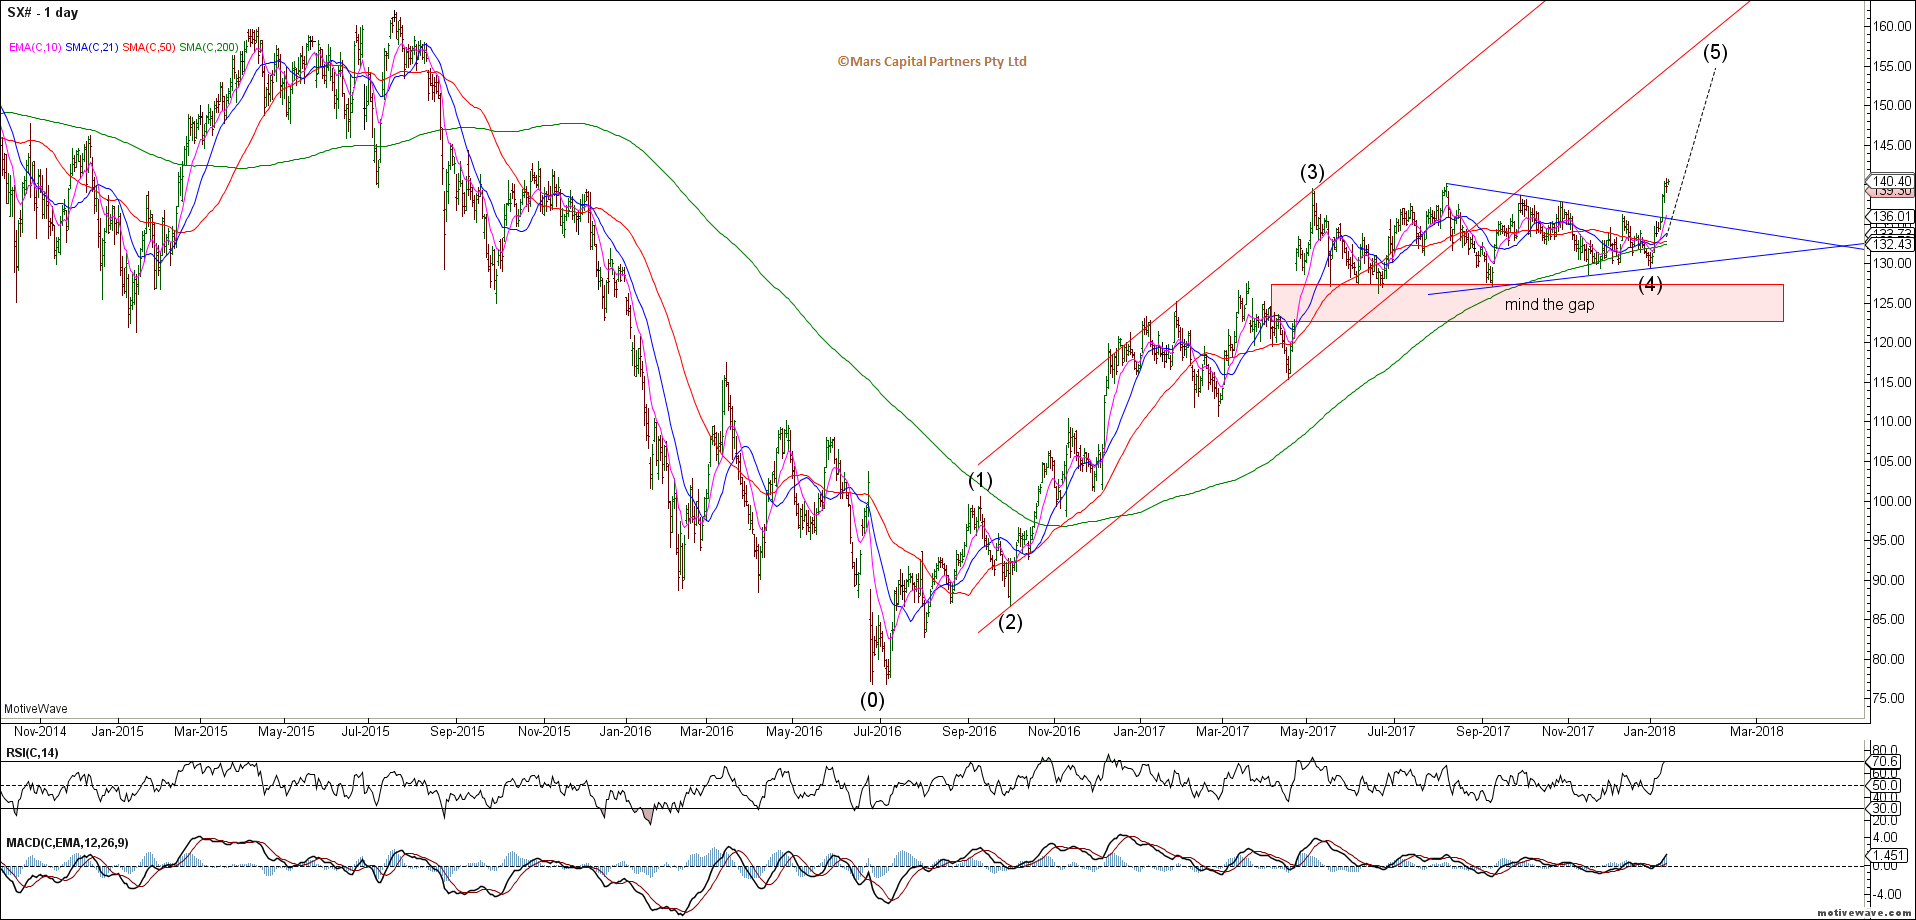
The ASX200 (SPI) reversed lower last week from recent highs but continues to hold breakout support. Still no interest for me here until we get a clearer structure to trade against. Trade back below 5950 prior swing highs may get me interested on the short side.
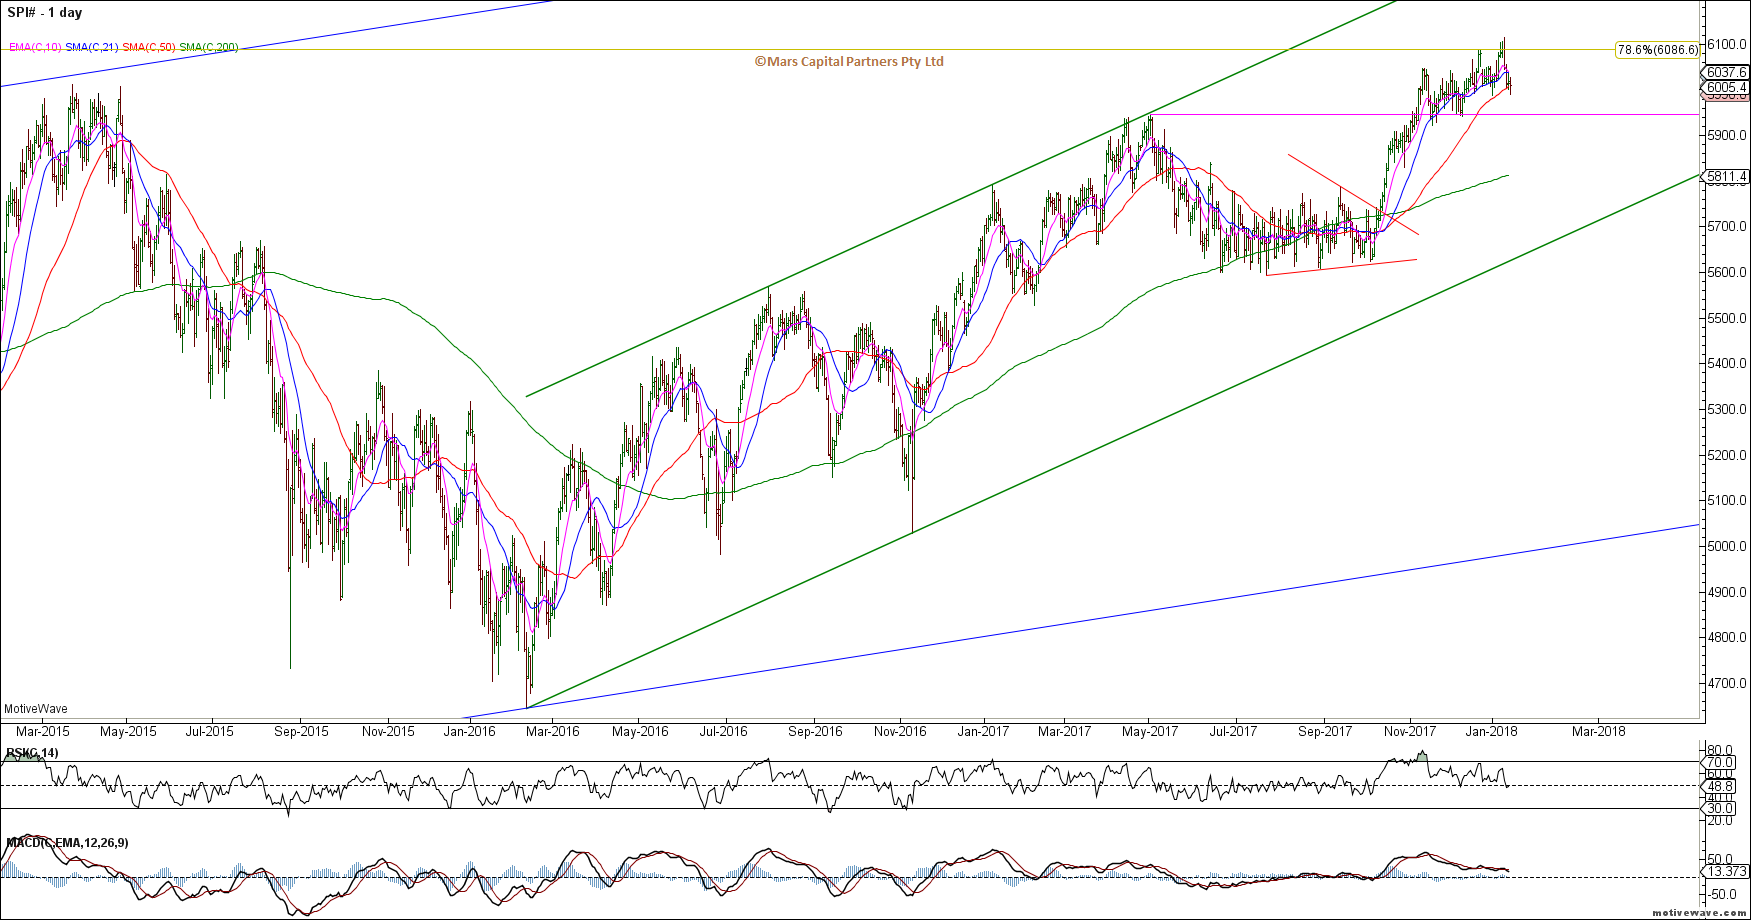
SPI Daily
To the bond markets and while the world is getting bearish bonds, the TLT chart just shows continuous range trading – strong trade below 122 would likely signify a break down in bonds and rally in rates.
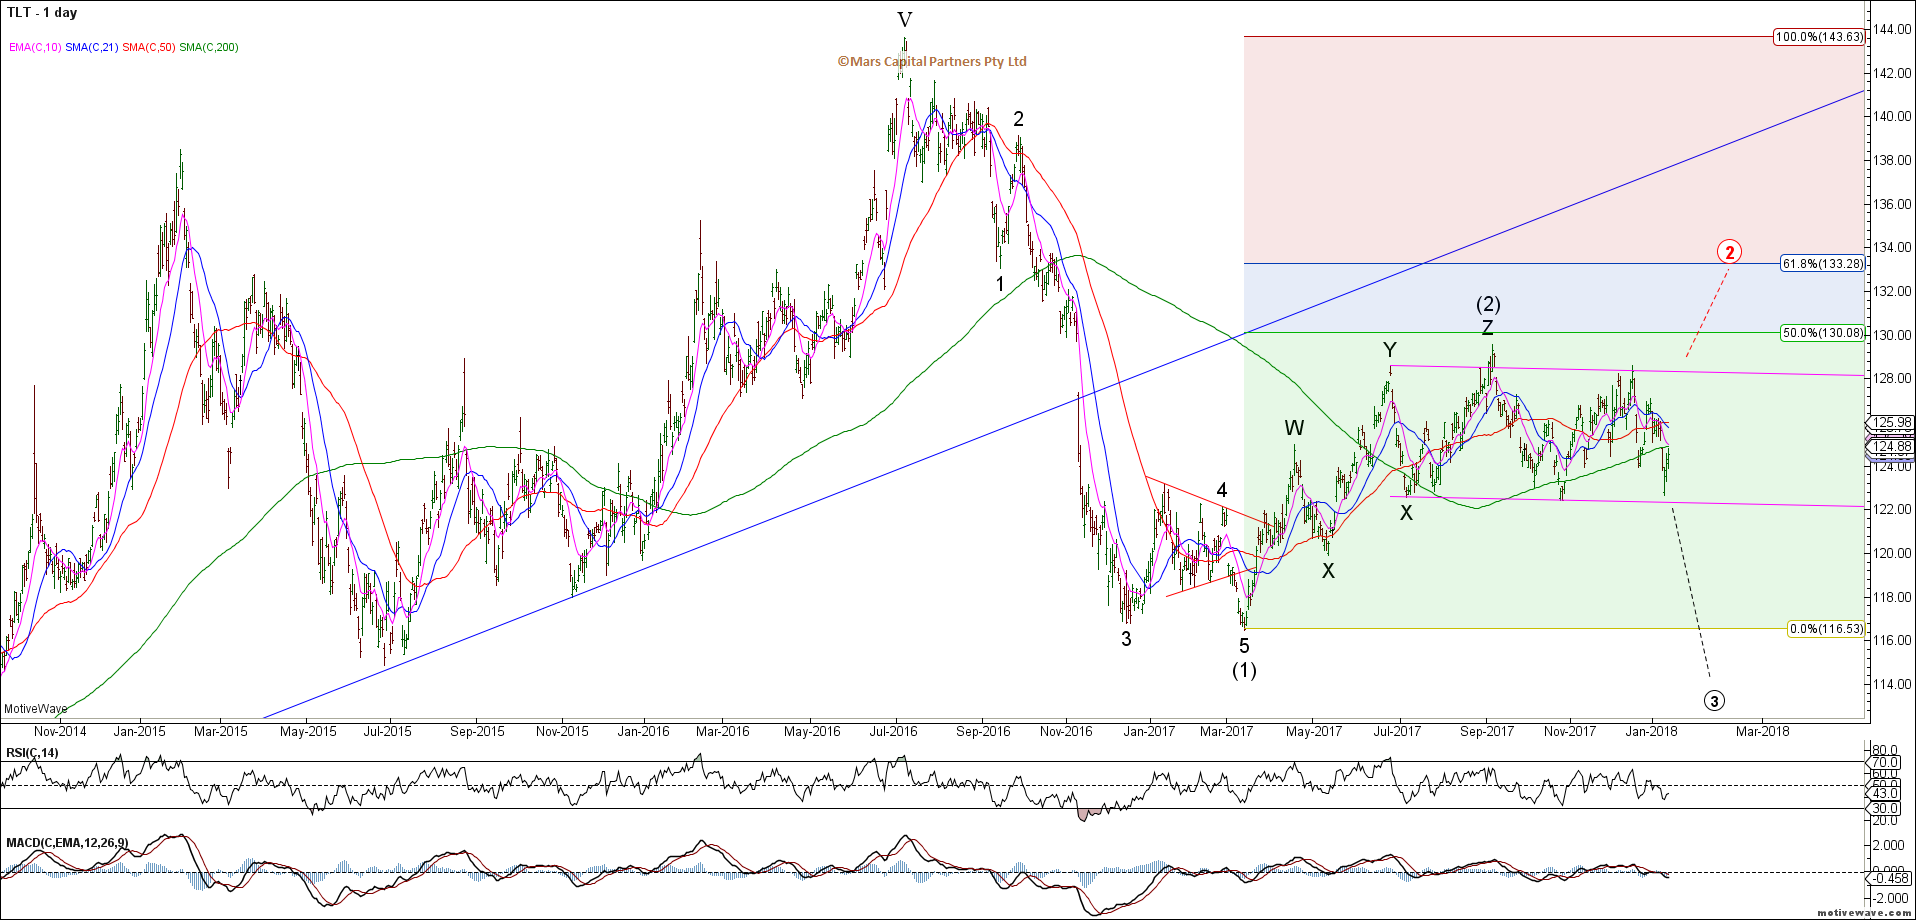
TLT Daily
The TYX shows a similar choppy structure with no clear impulse since the 2016 rally. Tough to trade until we get a clear direction but I’d prefer to buy from lower.
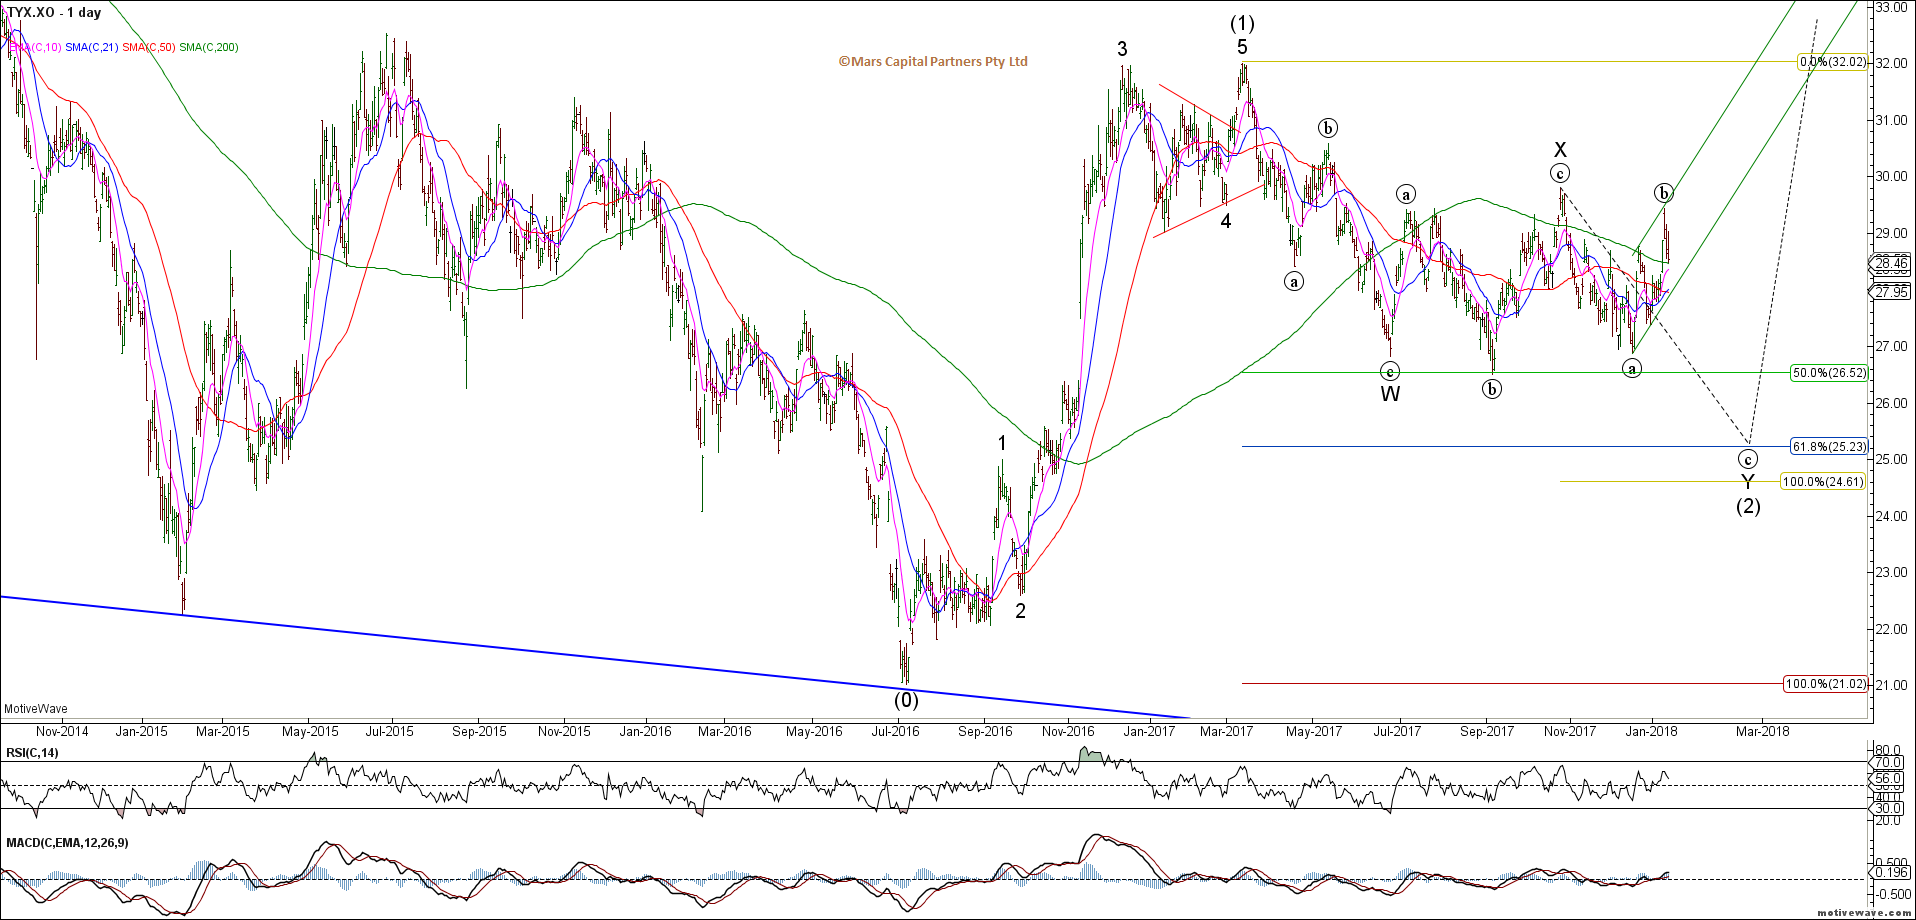
TYX Daily
The TY bond declined into long term support but there is no evidence of a bullish reversal as yet. The mood remains bearish bonds and traders are now very short into structural support. For this decline to look impulsive it would need to accelerate lower from here. I think the better bet is to buy some cheap calls against the herd as I am wary of shorting into the hole here.
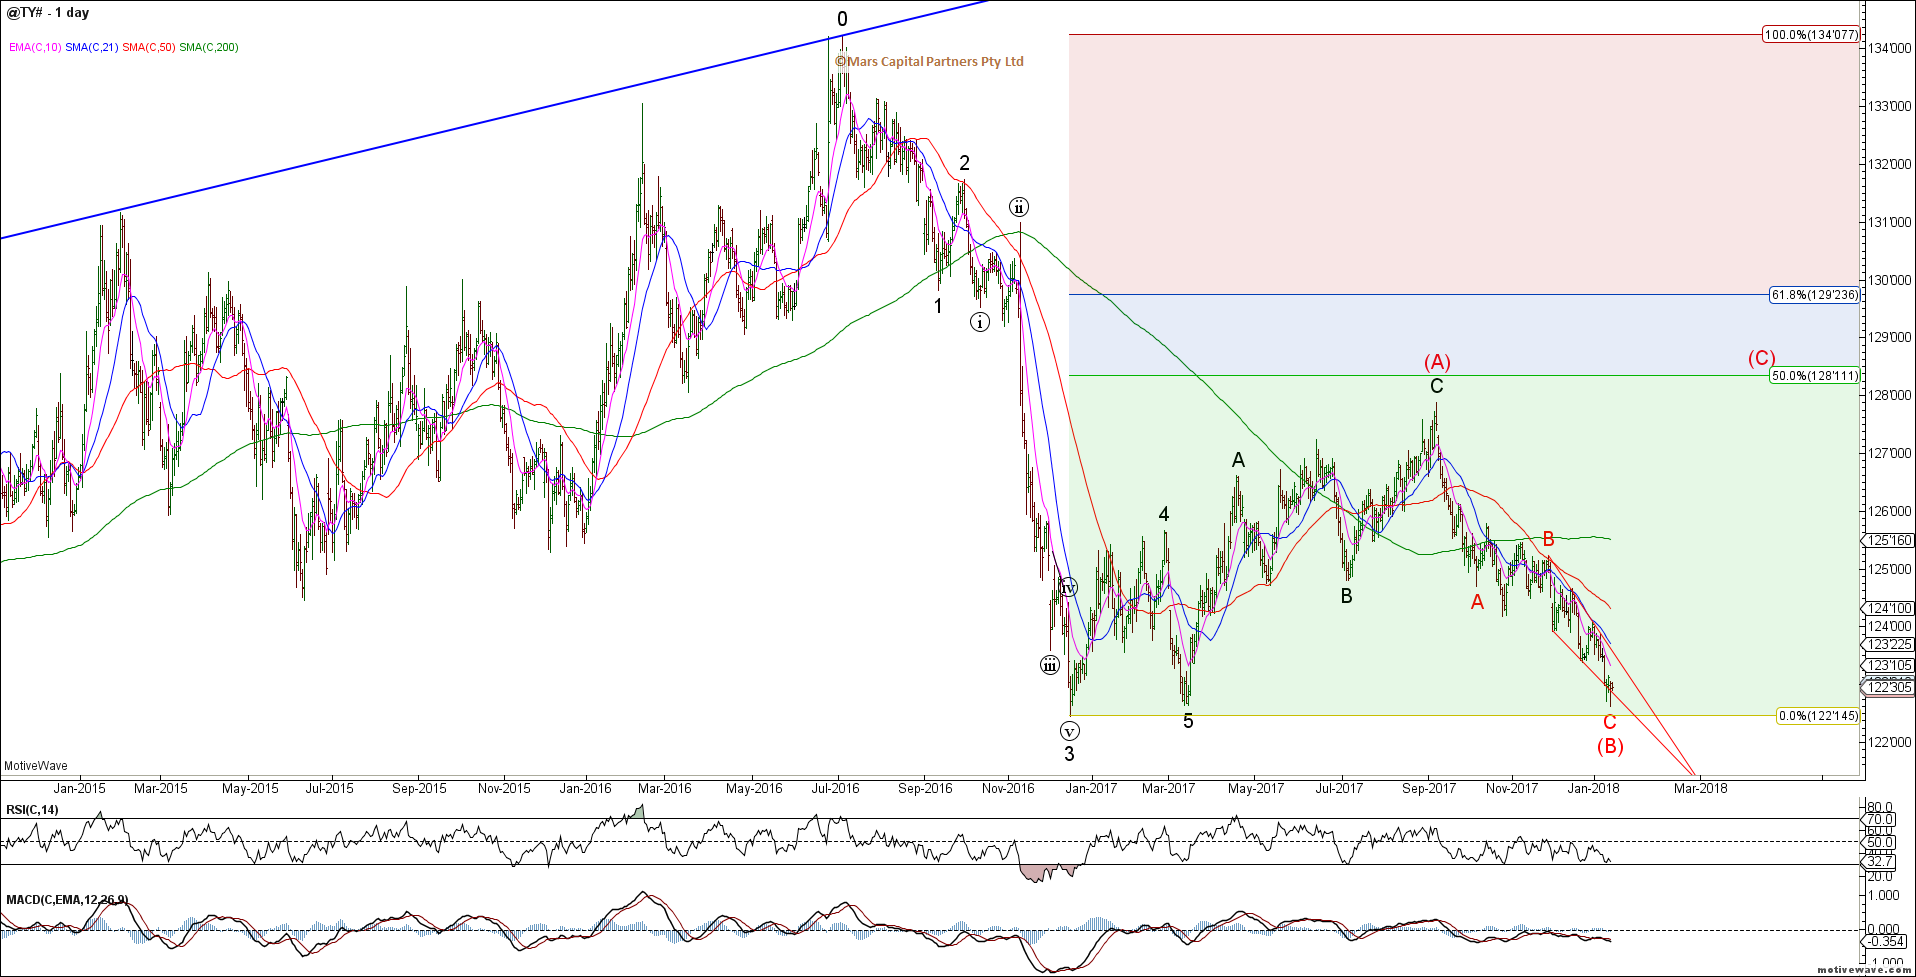
TY Daily
While I still prefer this ending wave C structure, we have no real evidence of a turn except for a small potential hammer on the Daily. Tough to call a low just yet until we get confirmation of a turn.
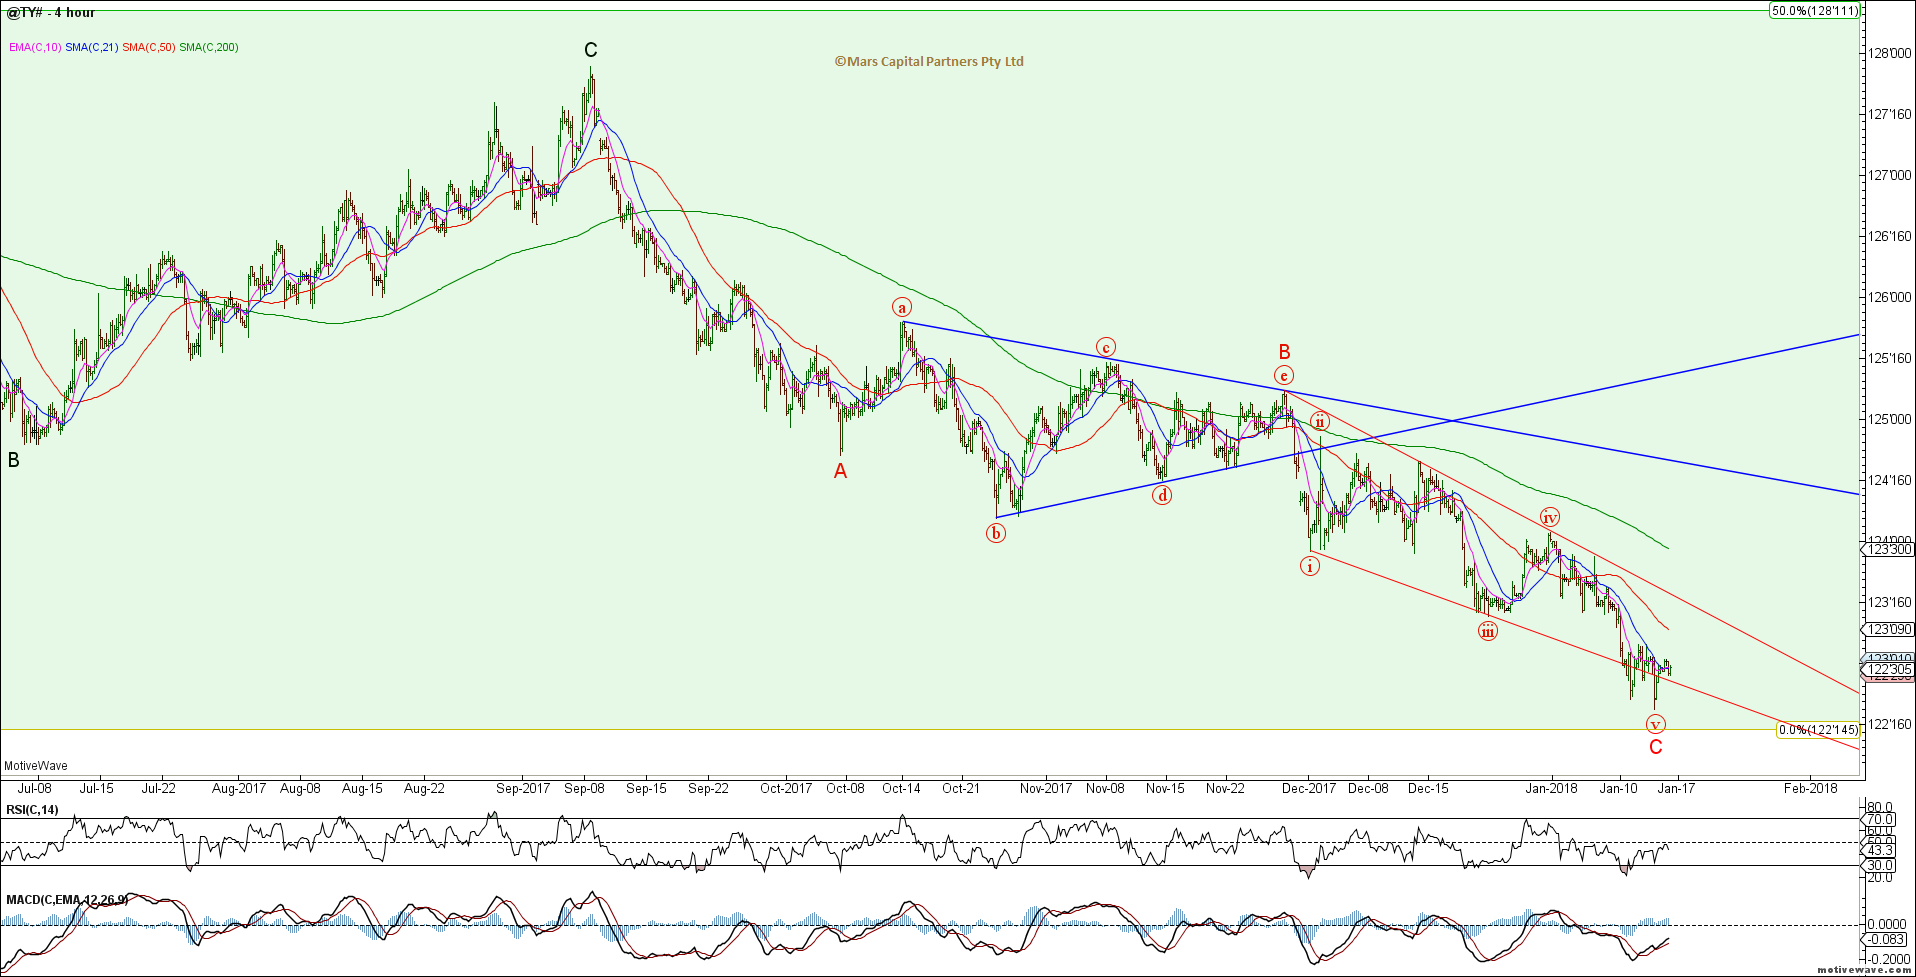
TY H4
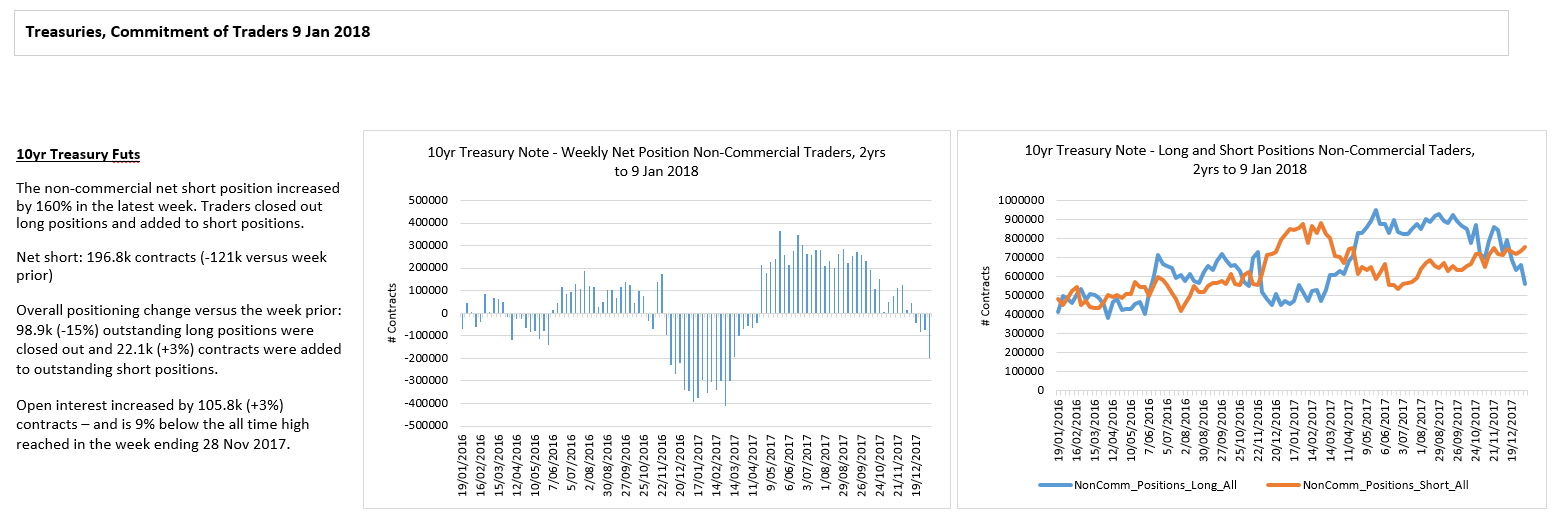
TY longs capitulating here into long term support.
The US30yr bond broke shelf support but has failed to follow through to the downside so far. Despite the bond market pessimism, prices really aren’t breaking down as yet so I am wary of the potential for a false break. The decline from the September 2017 highs continues to look corrective unless it starts to accelerate lower from here which is not my base case. I don’t like the R/R of being short bonds here near term.
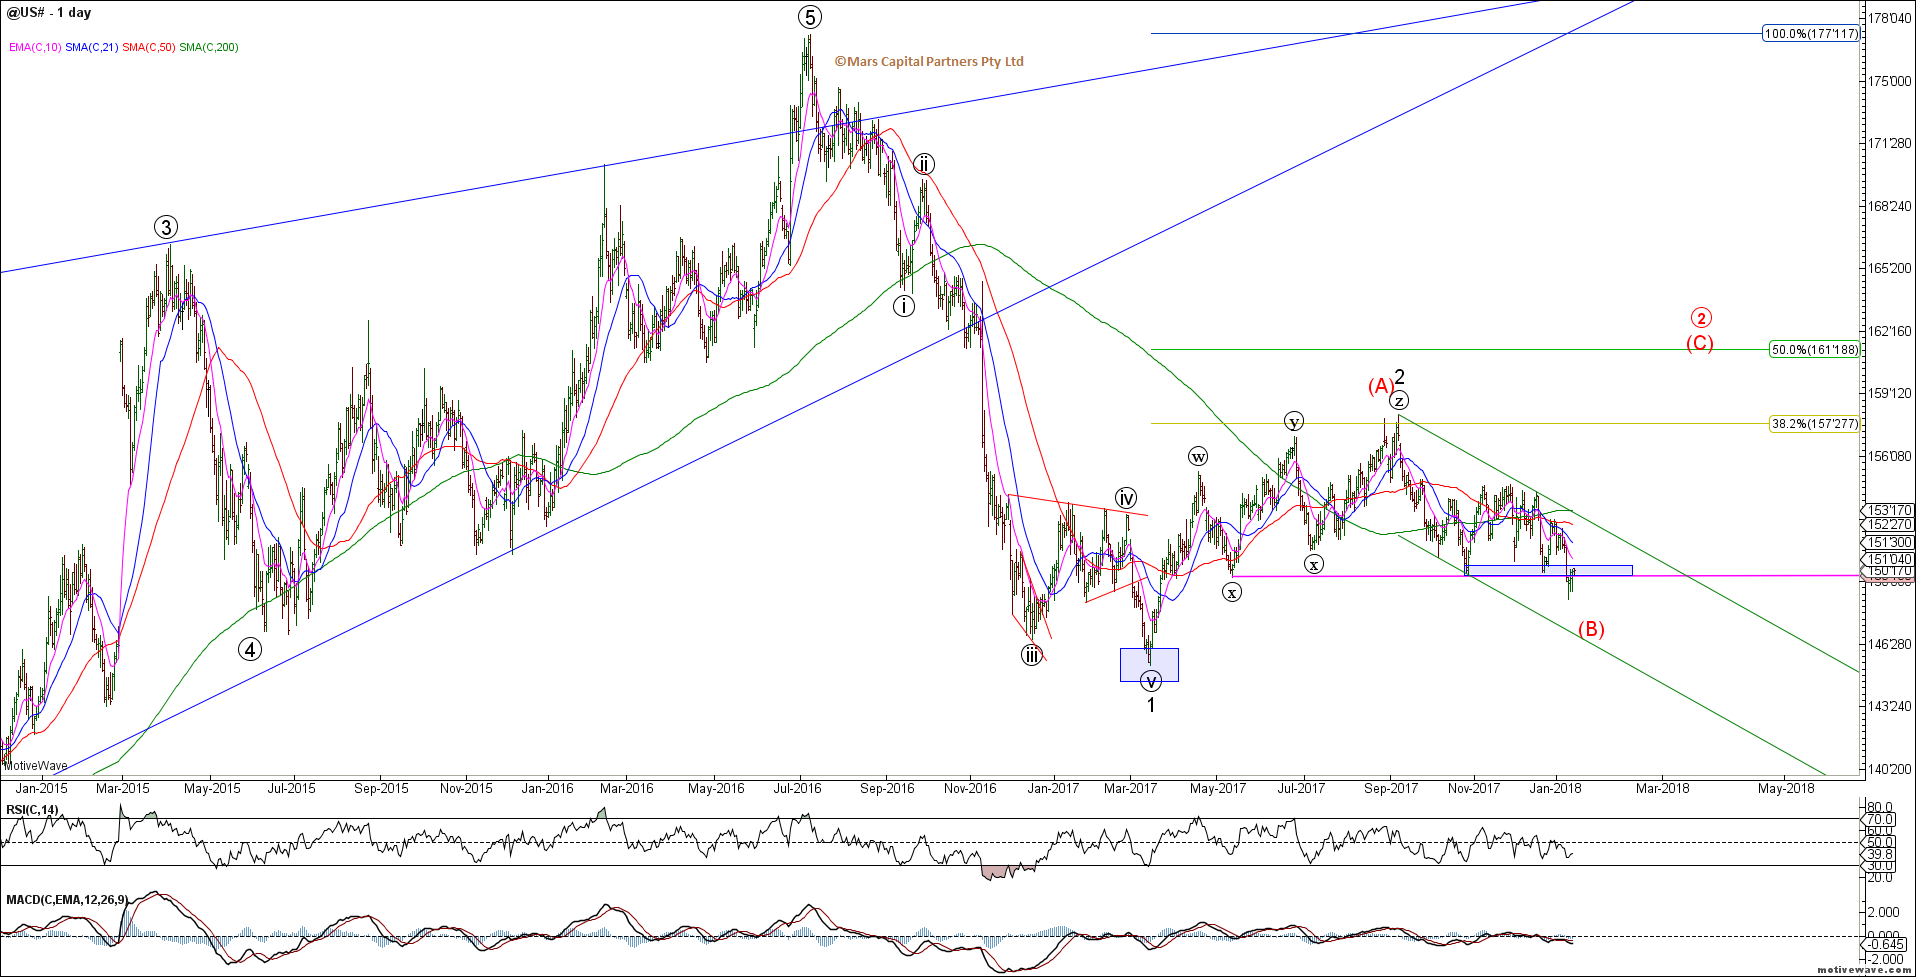
ZB Daily
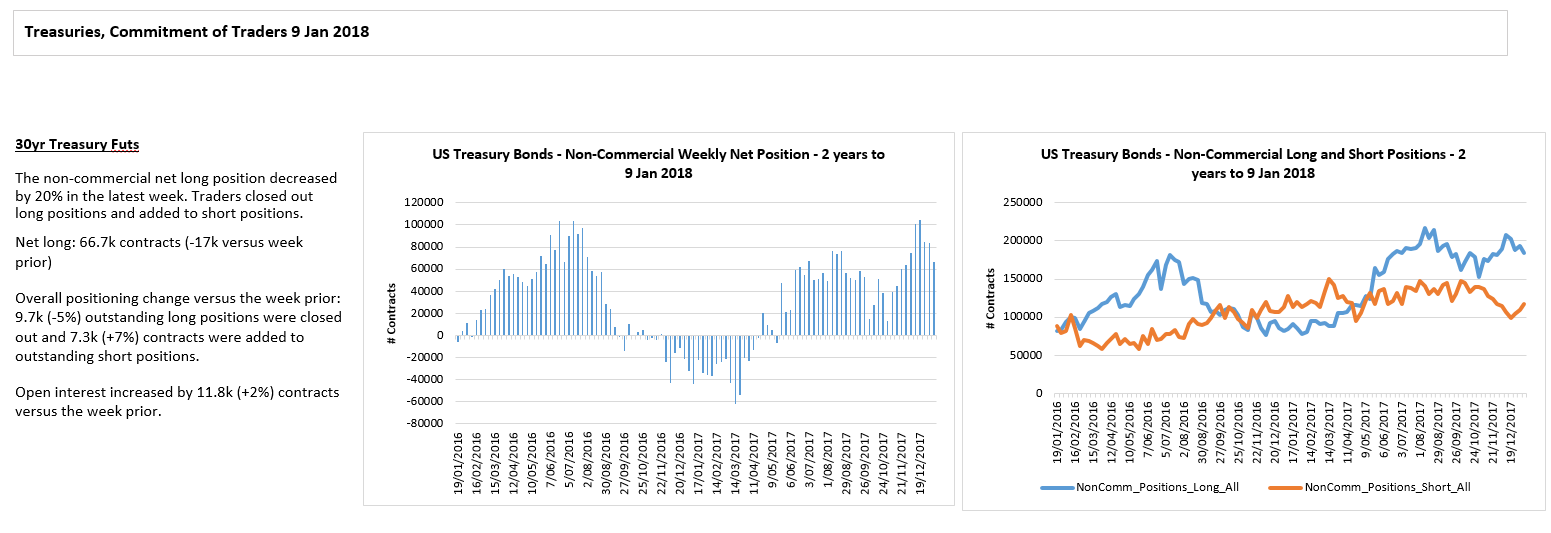
ZB bulls may also be giving up here but less one-sided than TY and FV.
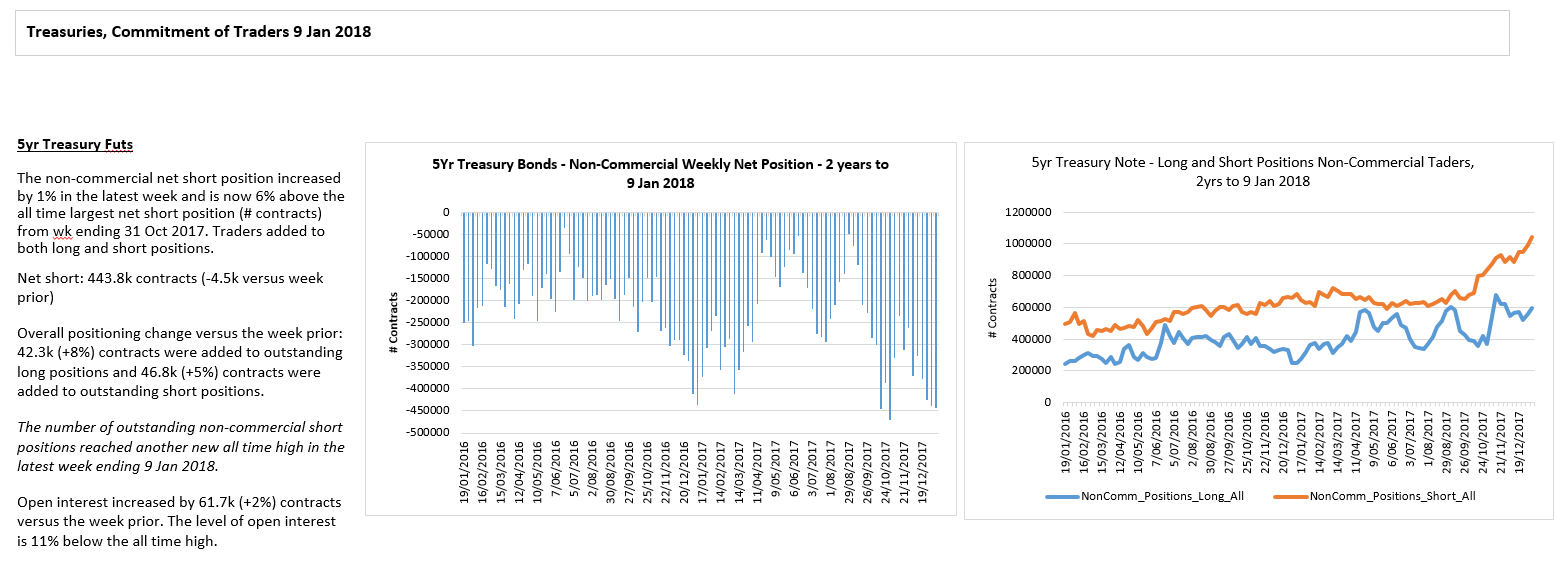
The 5yr continued trending lower with no clear signs of a bullish reversal while the declining wedge remains in play. Traders are extremely short so be careful of the asymmetric positioning!
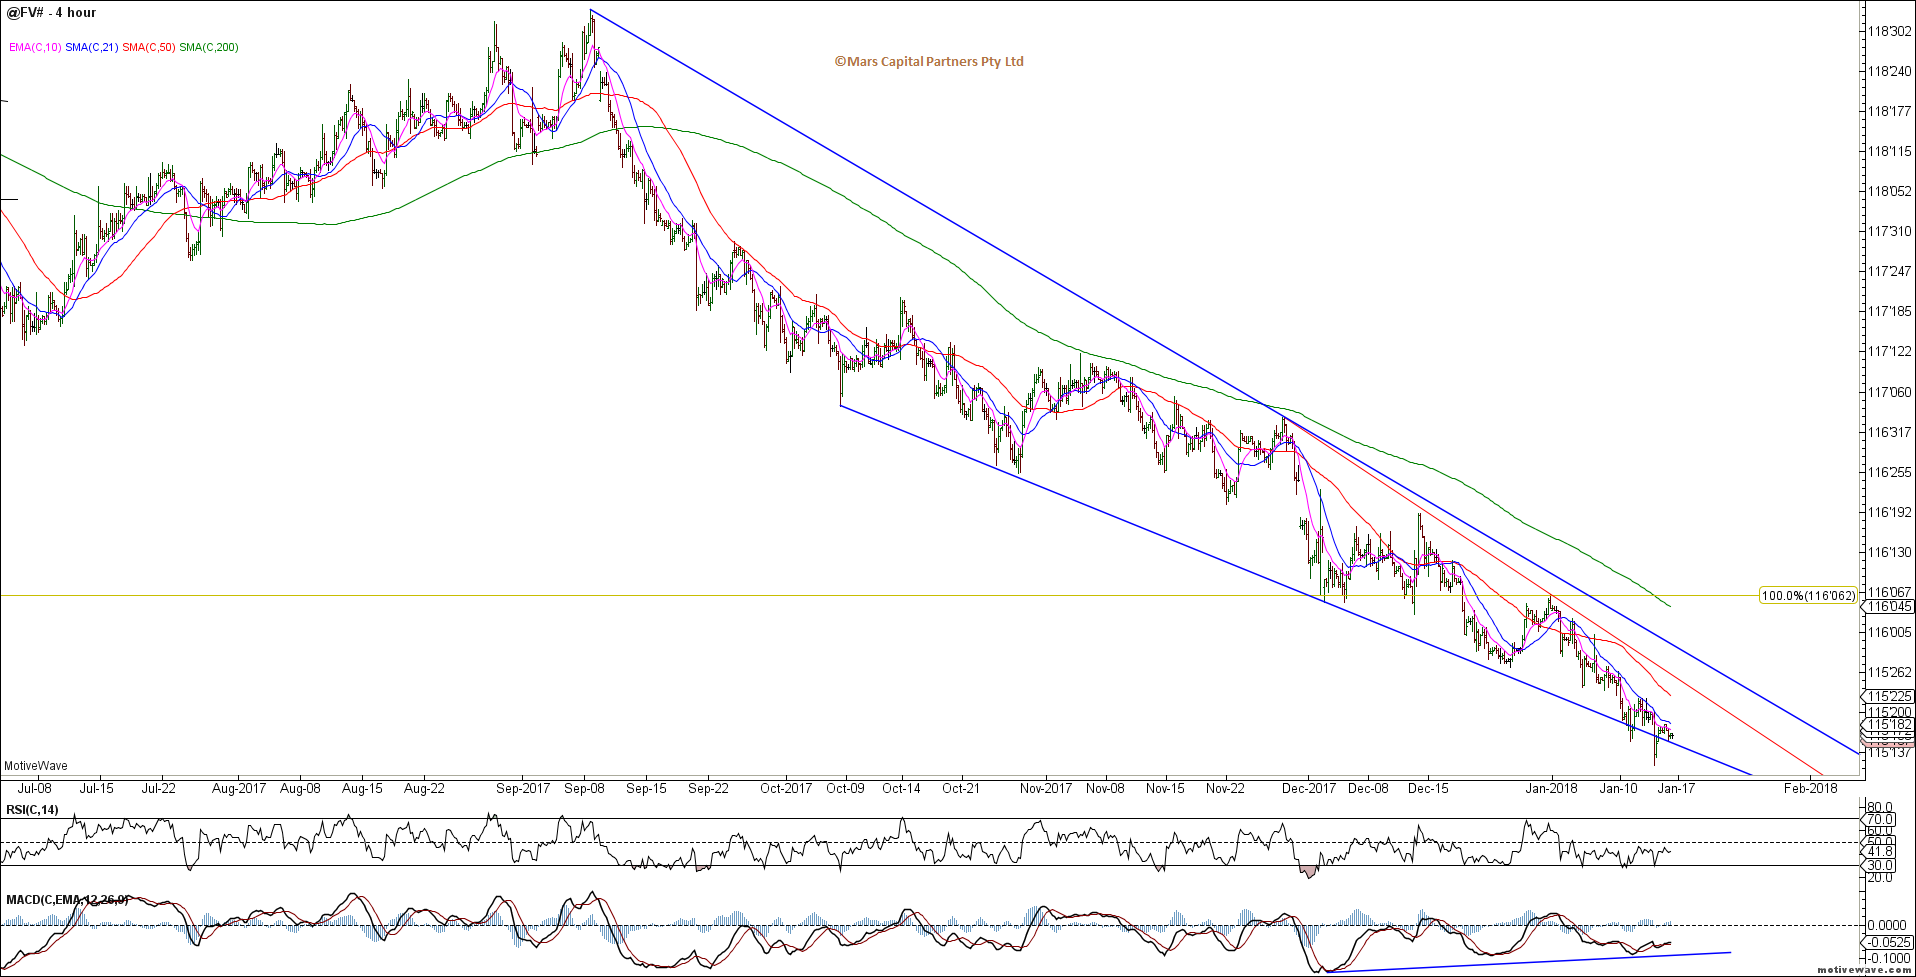
FV H4
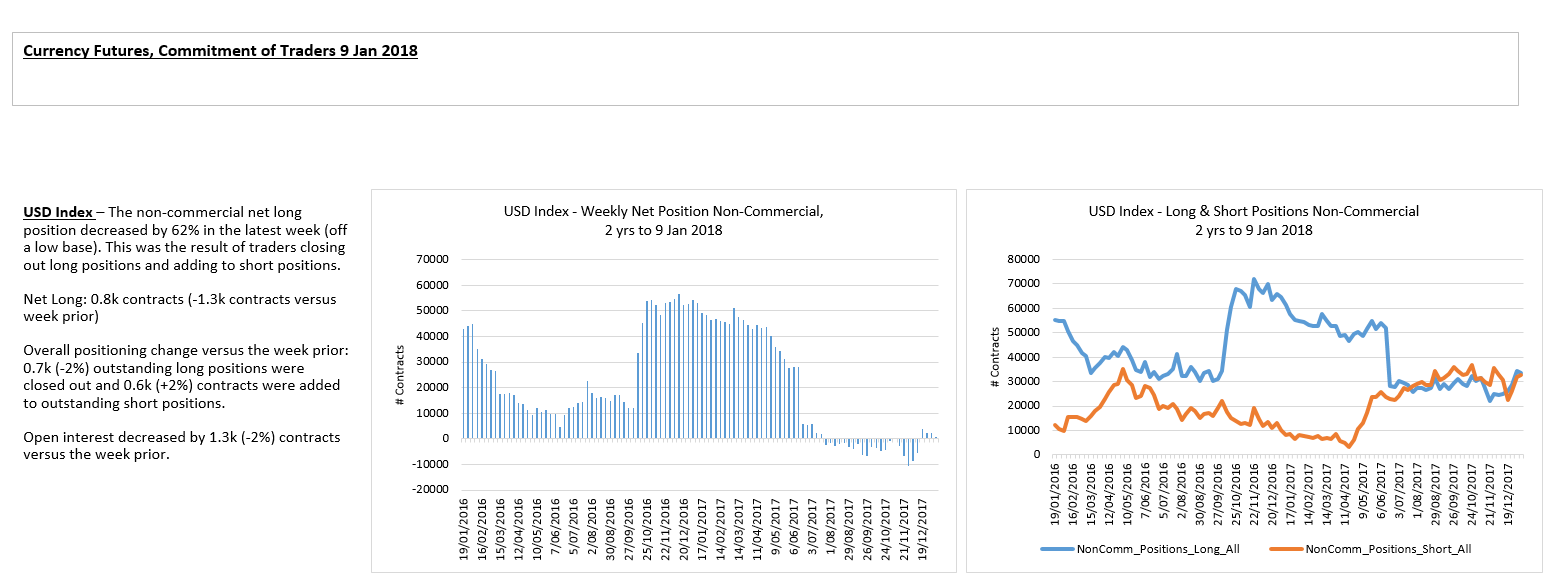
To the FX markets and the DXY finally made new cycle lows that we had been waiting for. We need to see this wave subdivide into 5 waves to complete the bigger picture decline and look for a bullish reversal. So far so good.
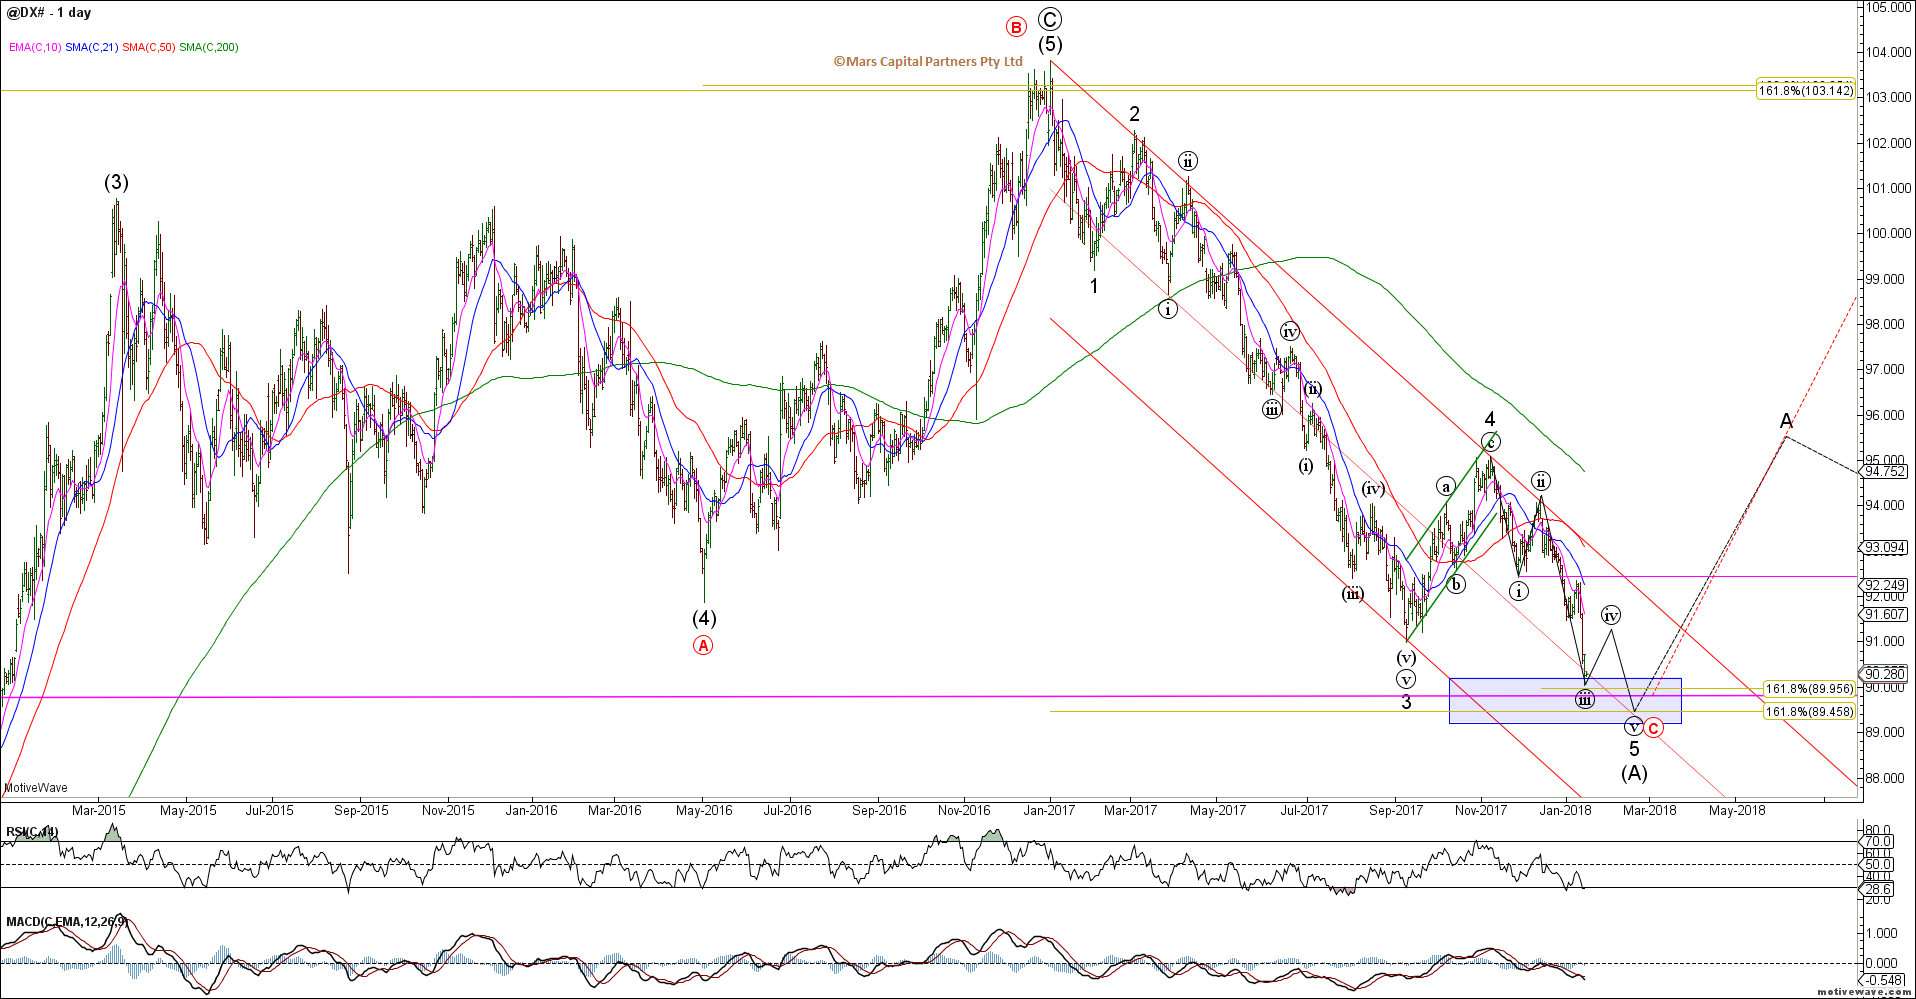
DXY Daily
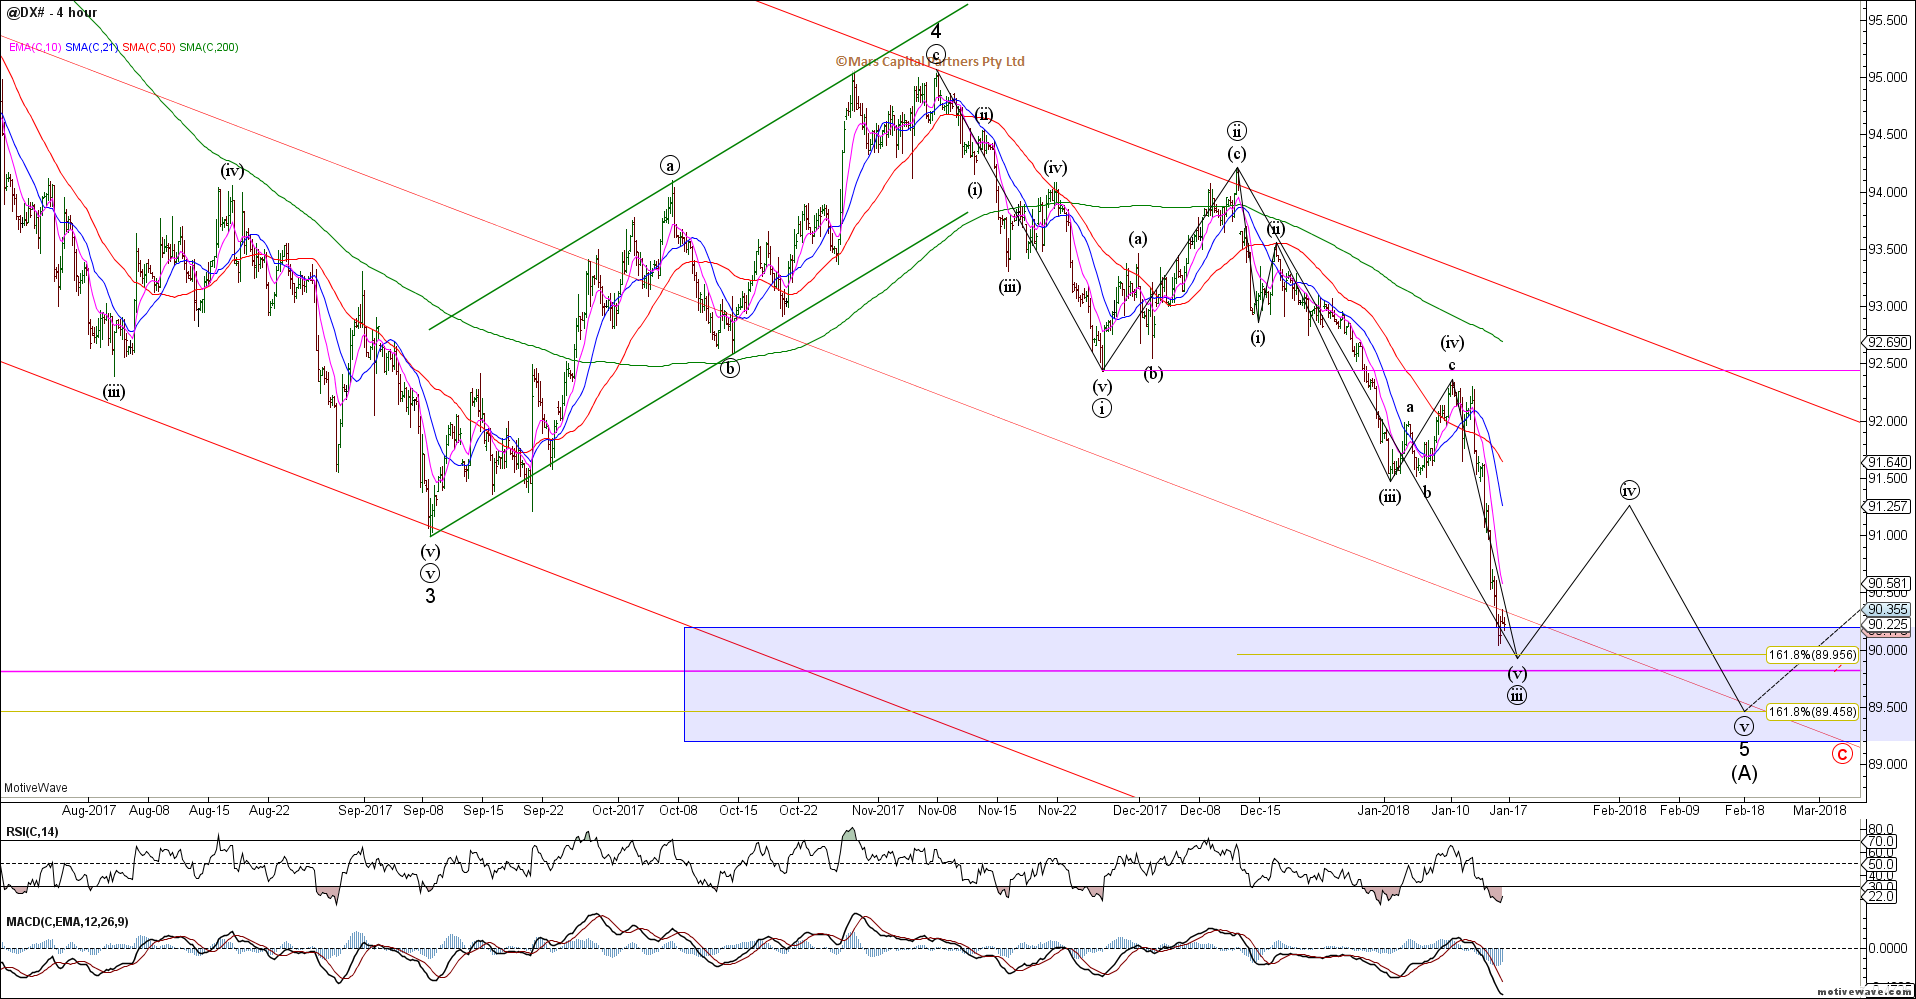
DXY H4
DXY traders remain flat as we make new cycle lows.
The Euro shows the same picture as we approach our upside targets for this rally. We continue to look at this as an ending wave prior to a bigger picture Euro decline.
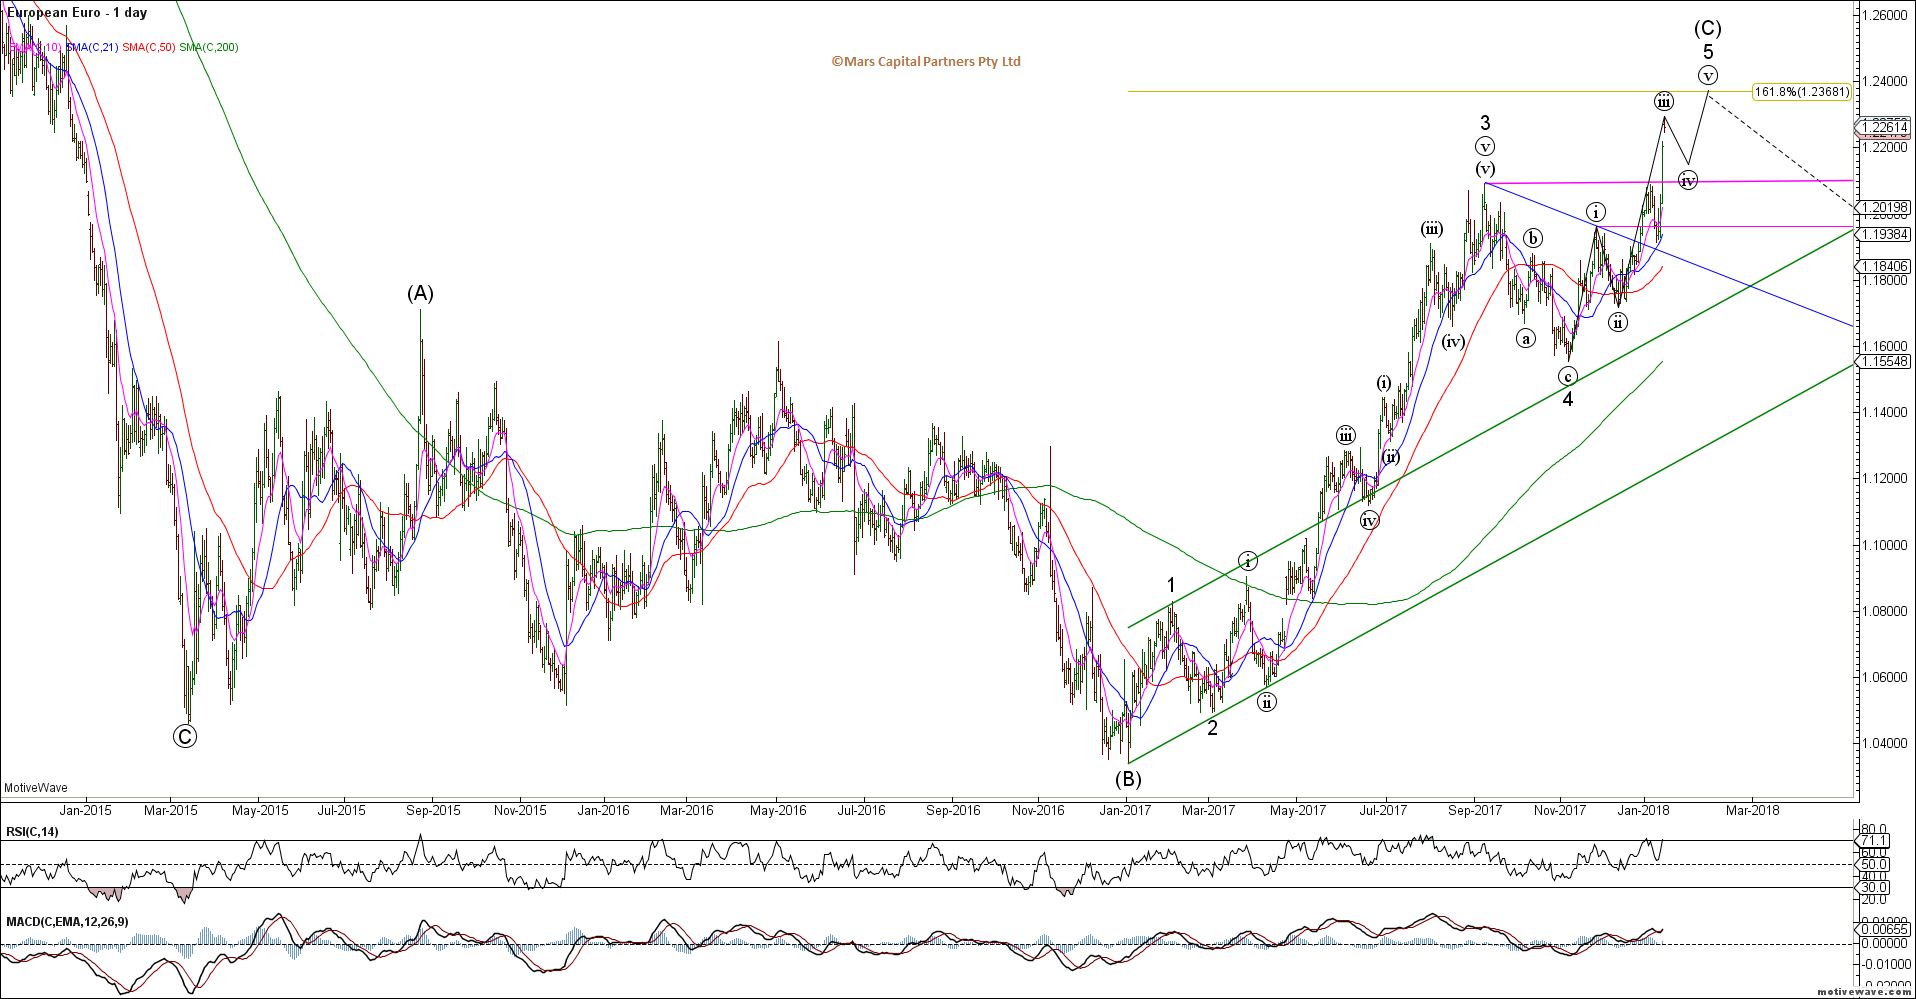
EURUSD Daily
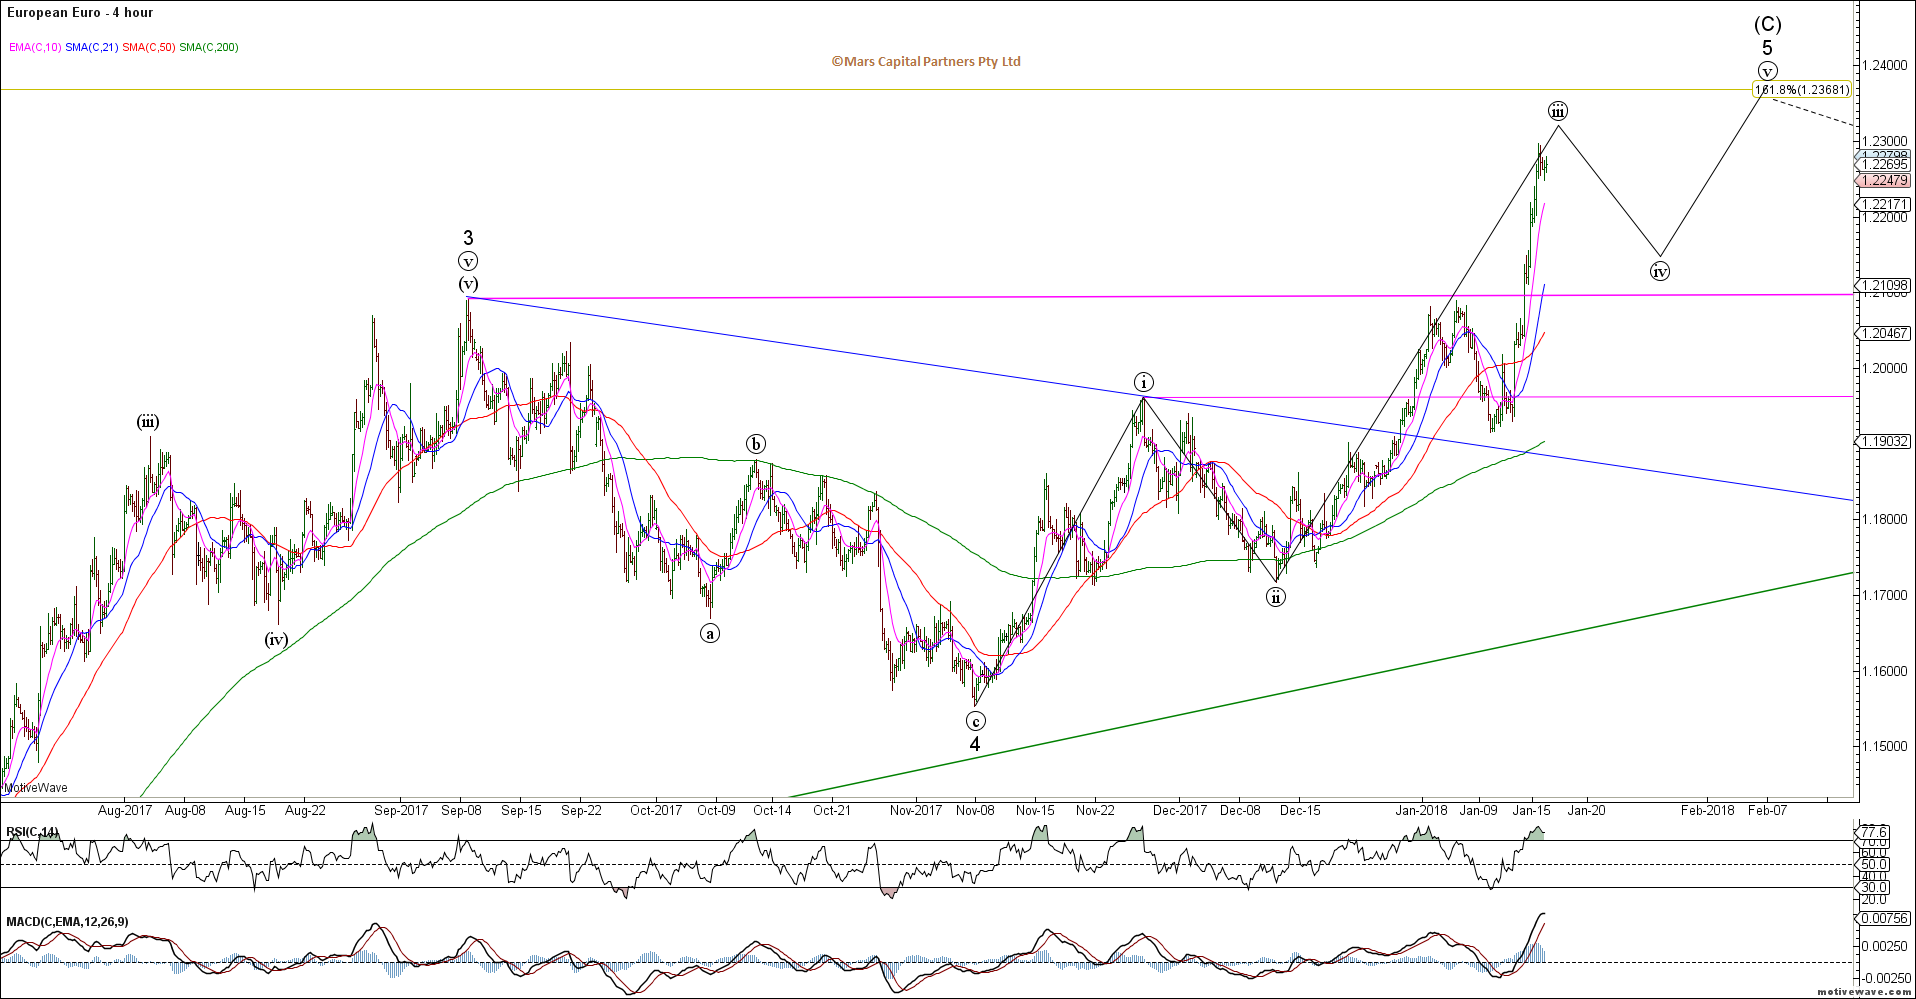
EURUSD H4
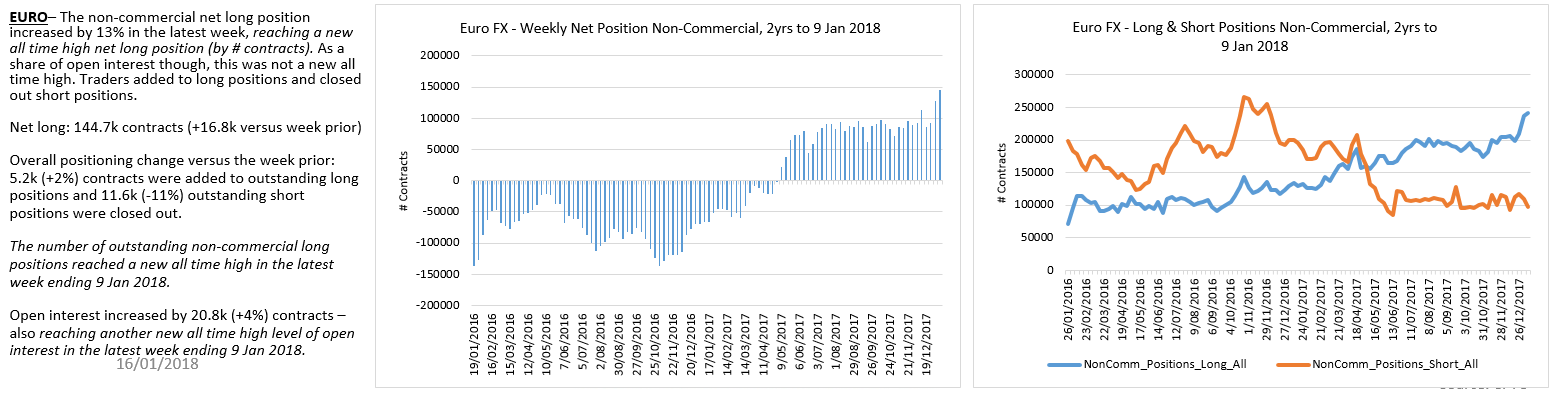
Euro traders have continued to pile in to longs while bears have capitulated – a very one-sided bet being placed here so beware.
The USDJPY declined towards our 110 support after breaking 112 as we discussed previously. We are approaching an important inflection point where USDJPY is approaching support and Gold is approaching resistance. Trade below 109 likely sees 104 under the alternate red count (if Gold breaks out to the upside). Watch correlated markets here.
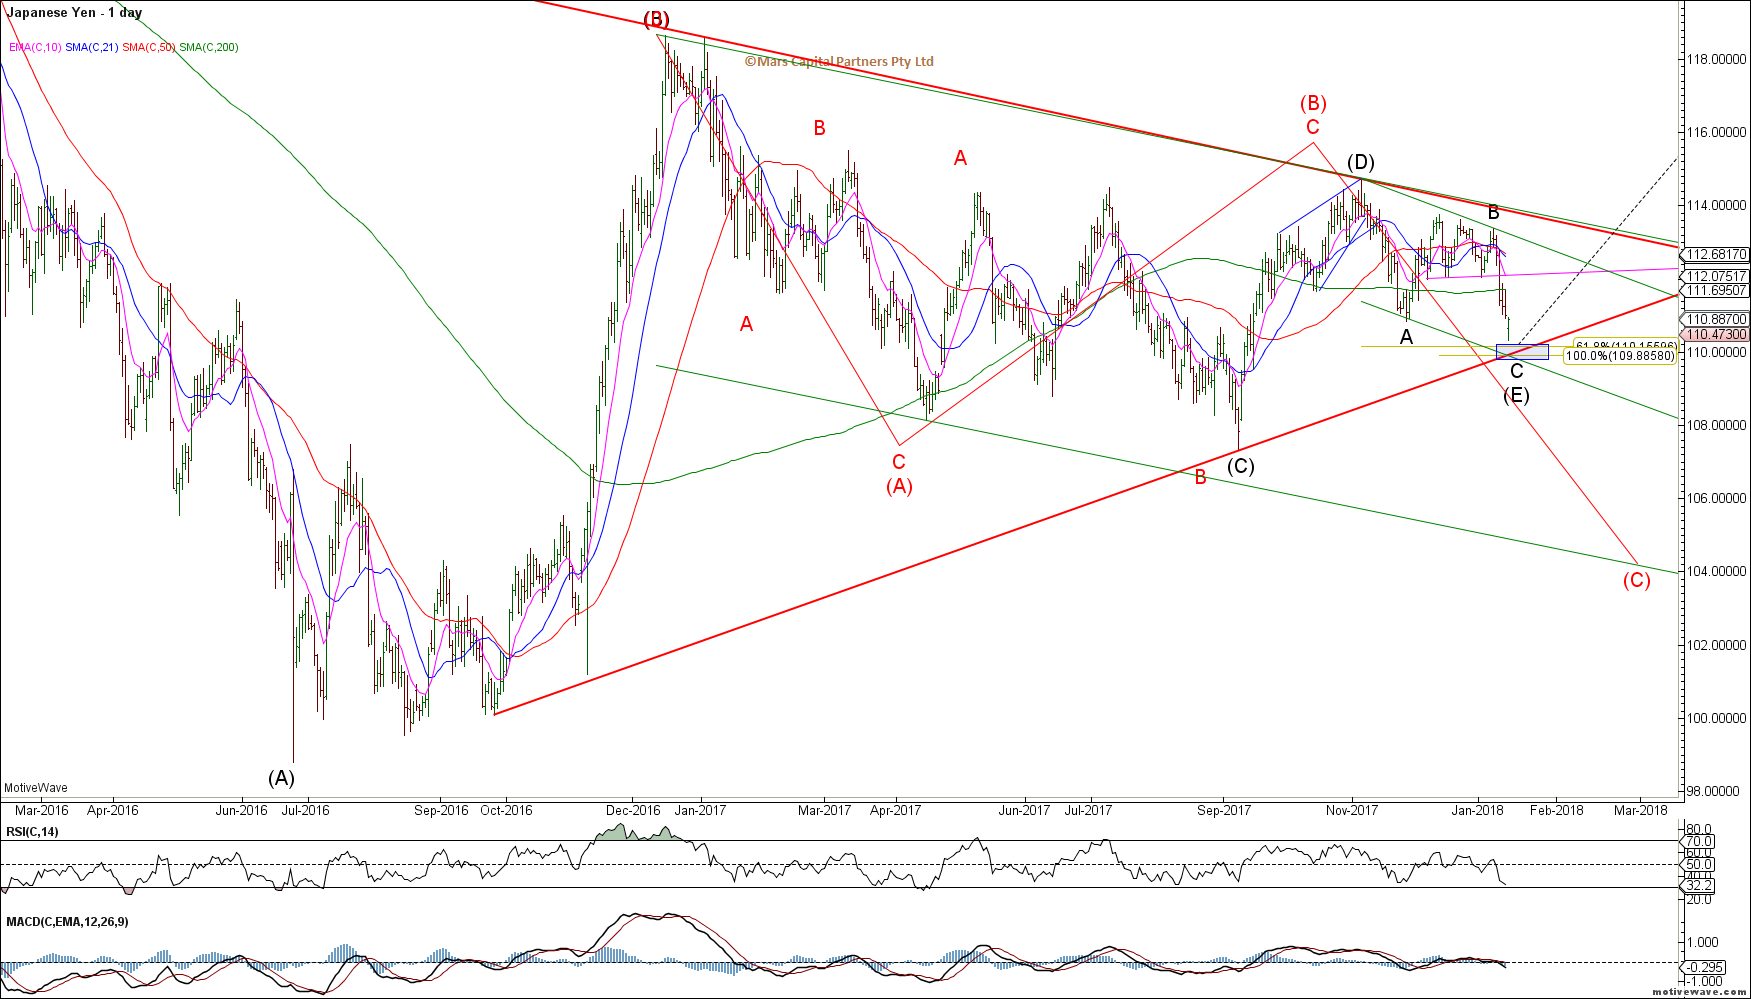
USDJPY Daily
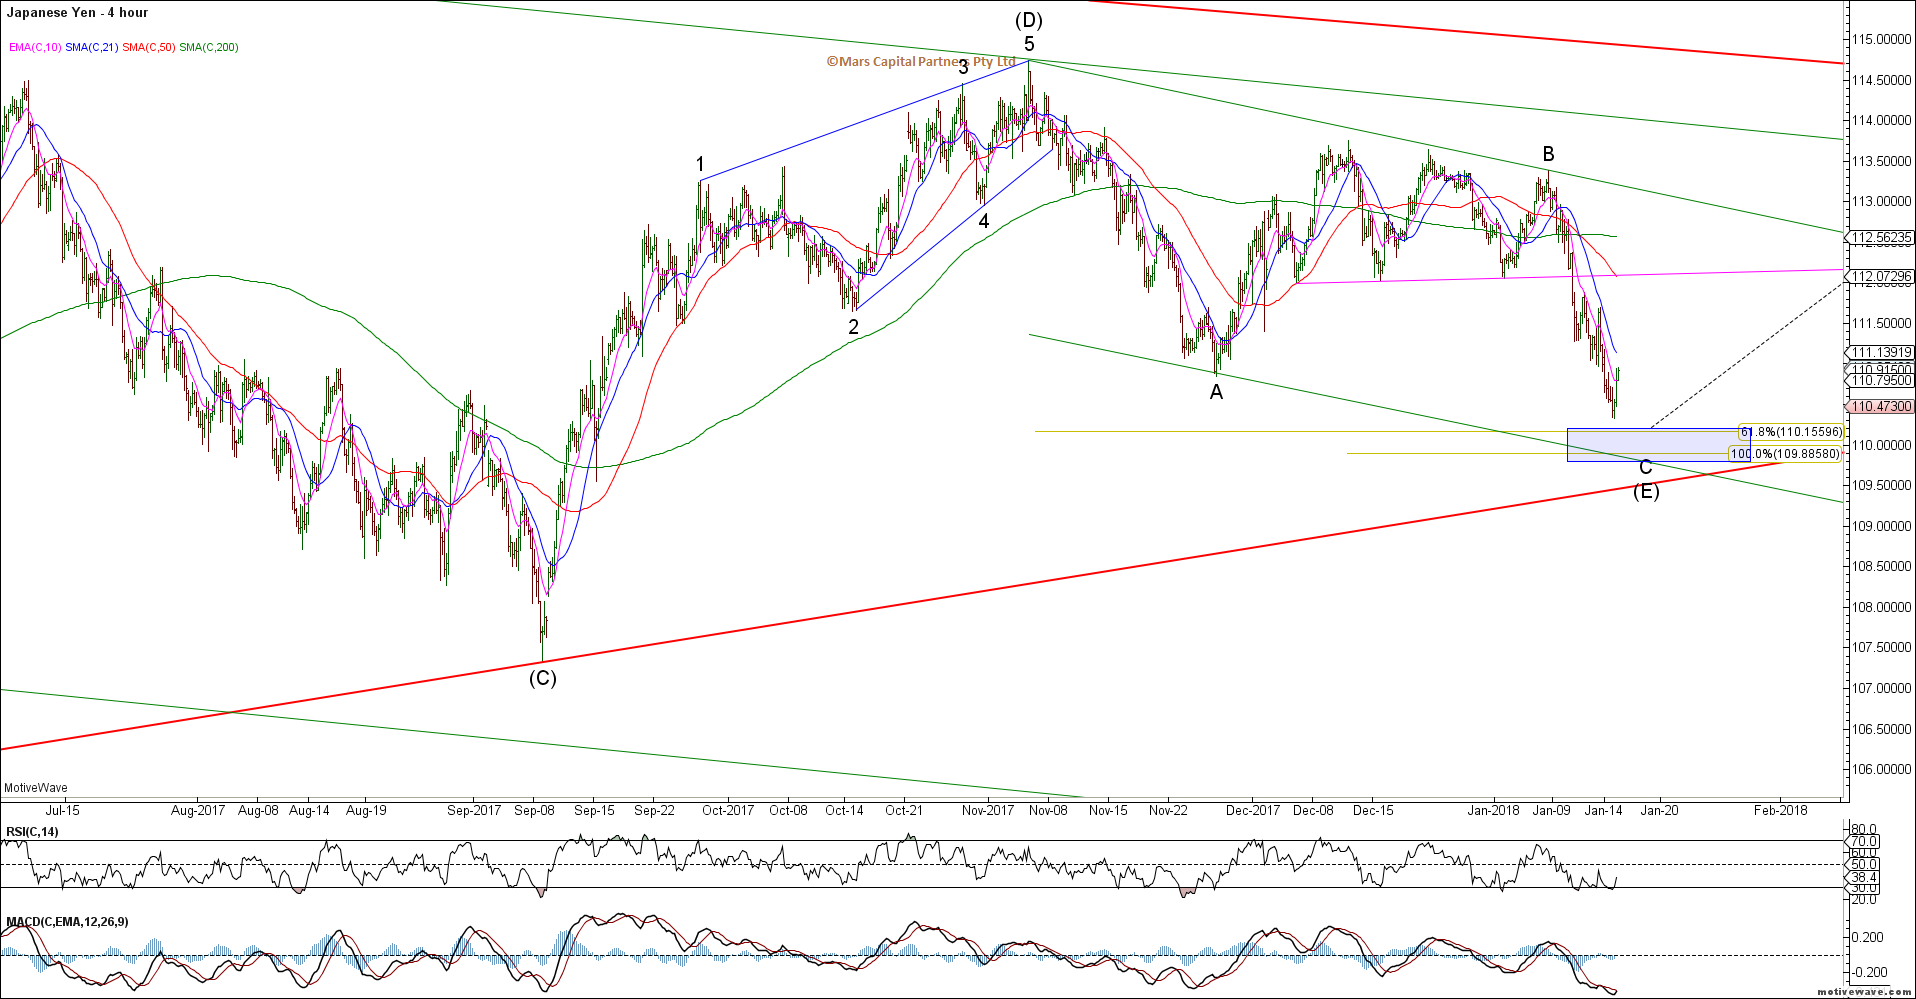
USDJPY H4
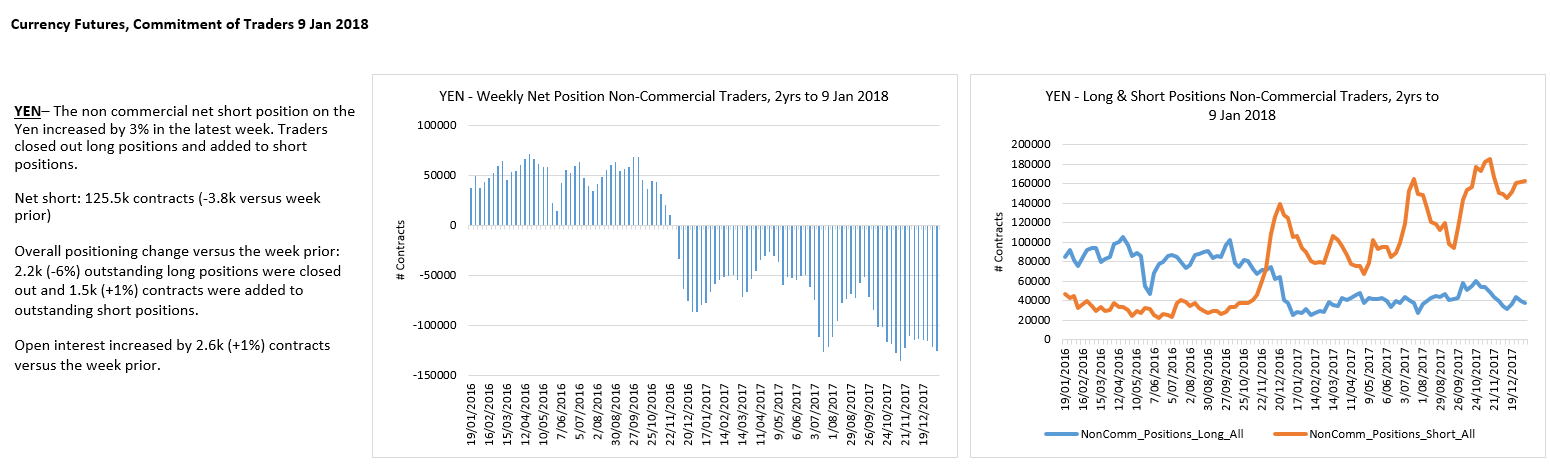
YEN traders remain strongly net short so there is a risk the USDJPY continues to decline as traders are caught short?
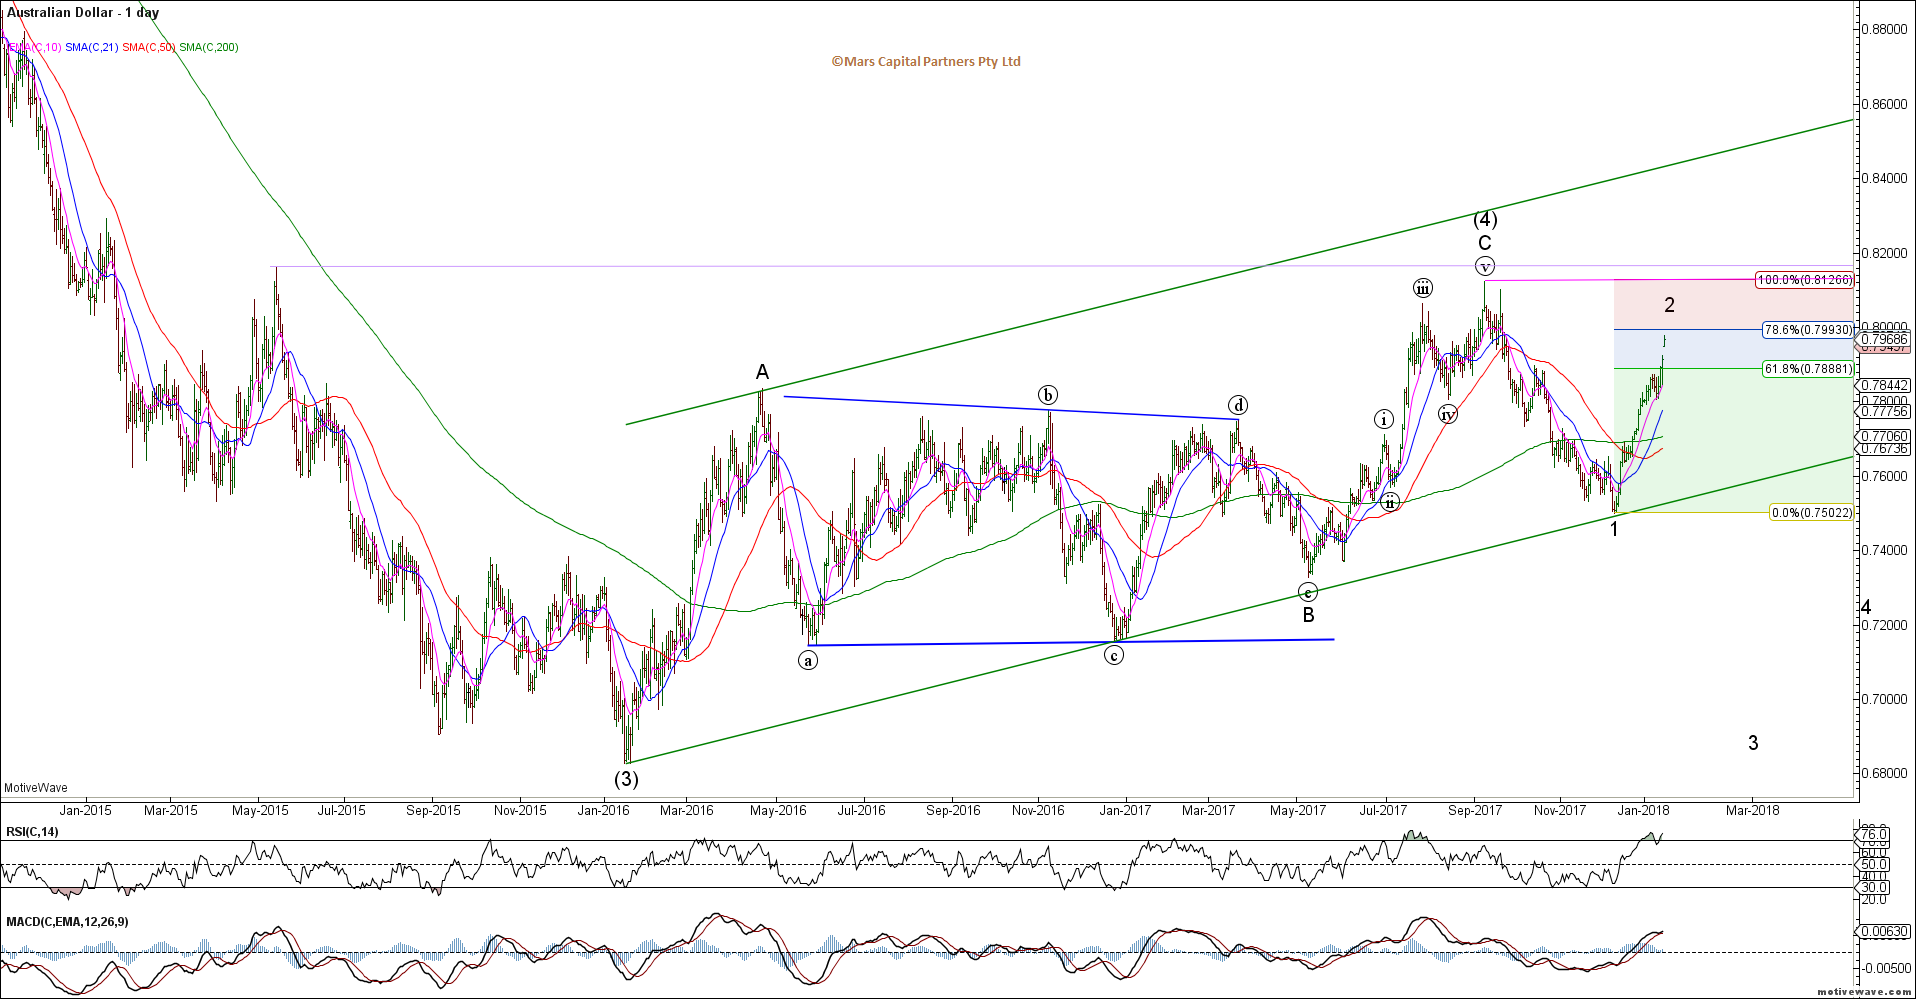
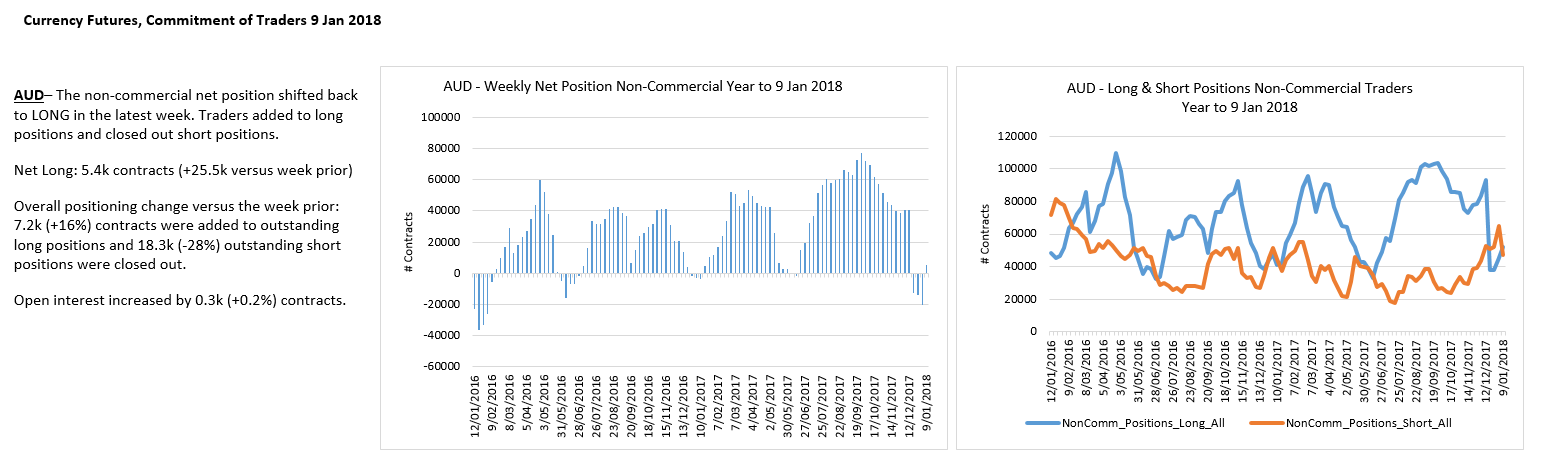
The Aussie$ tried to reverse lower from our 0.7900 resistance area but reversed higher on Friday. As mentioned last week, the short positioning of traders made me wary of joining them – the bear count is invalidated above the September cycle highs where we will have to reassess the bigger picture. The impulsive look of this rally has me on the sidelines until we get evidence of a reversal. Next resistance is in the 0.80 area but we’ll sit tight given the US$ downside risk.
AUDUSD Daily
Aussie shorts may finally be capitulating…
The USDCAD is approaching Fib 61.8% support once again but we don’t yet have buy signal so we will see how this retest of the lows evolves. Tough to get long the US$ until downside momentum moderates.
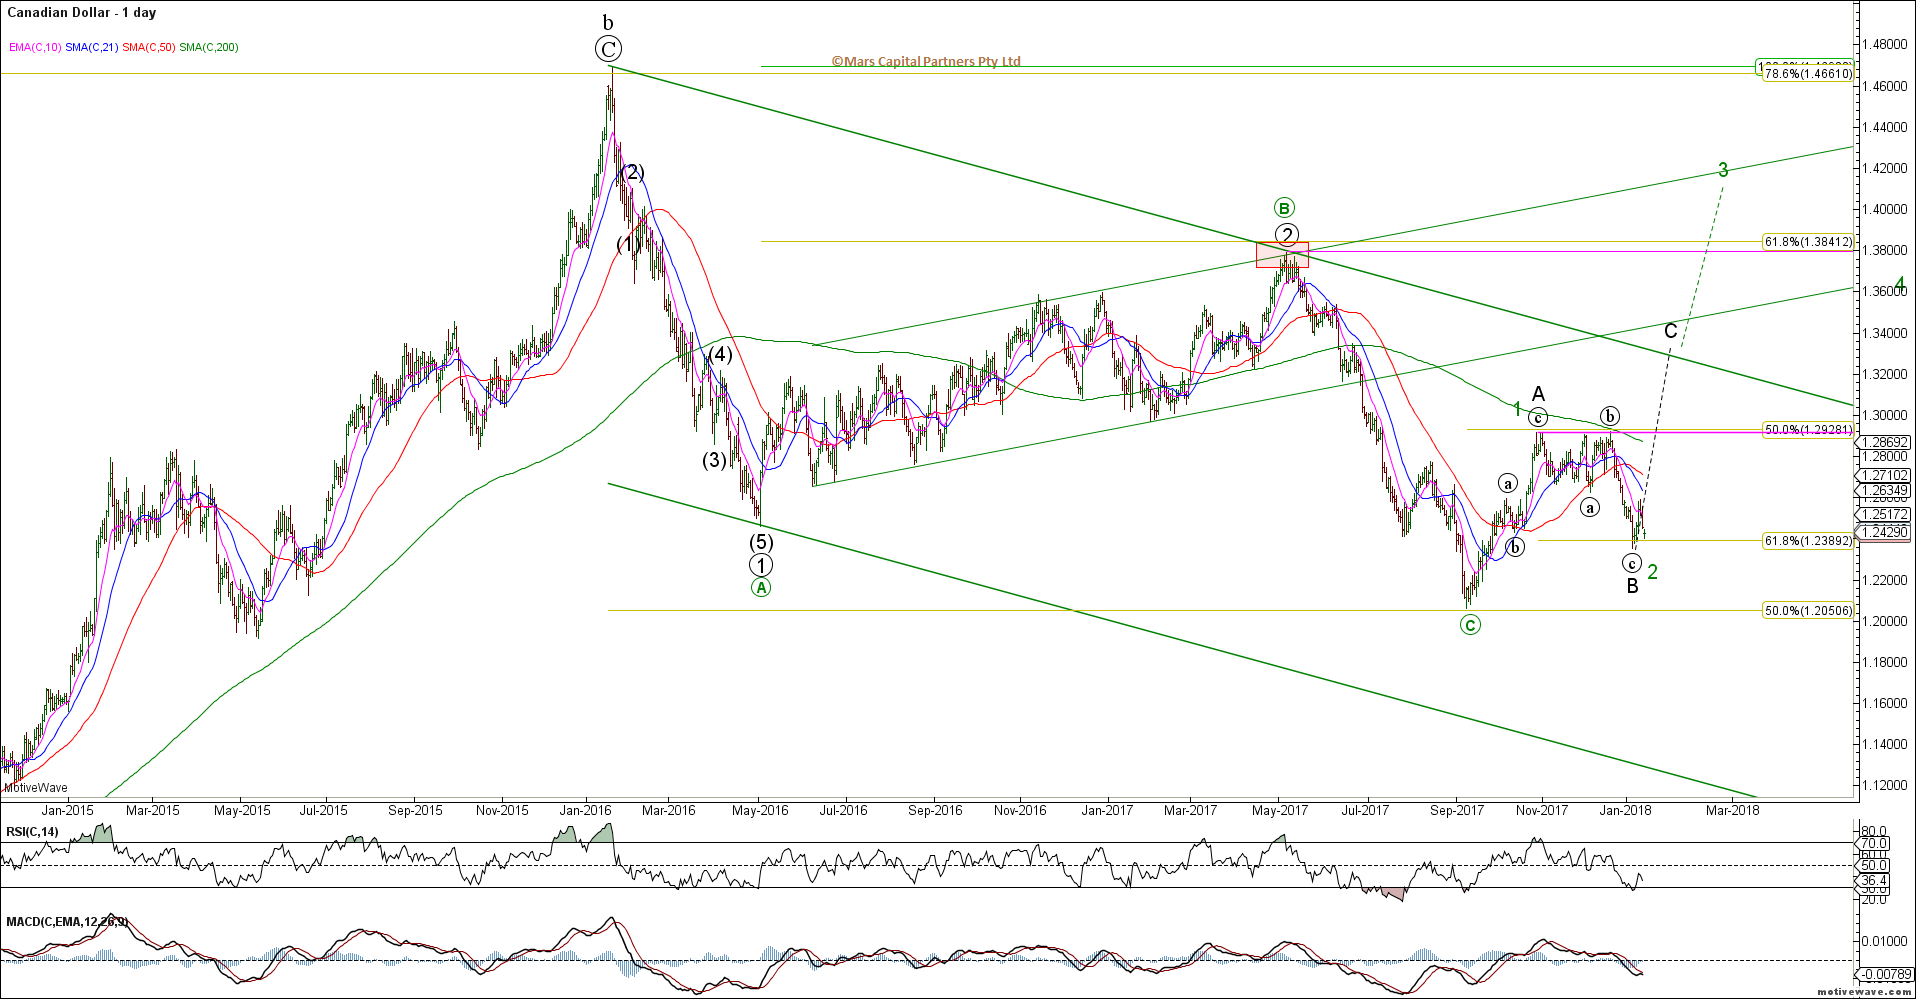
USDCAD Daily
The USDCNY failed to hold trend support but the Fib 61.8% resides in the 6.38 area – this decline looks impulsive but once again, I am interpreting this latest decline as a 5th and final wave where upon completion we should be looking for a bullish reversal. Until then I’m standing aside.
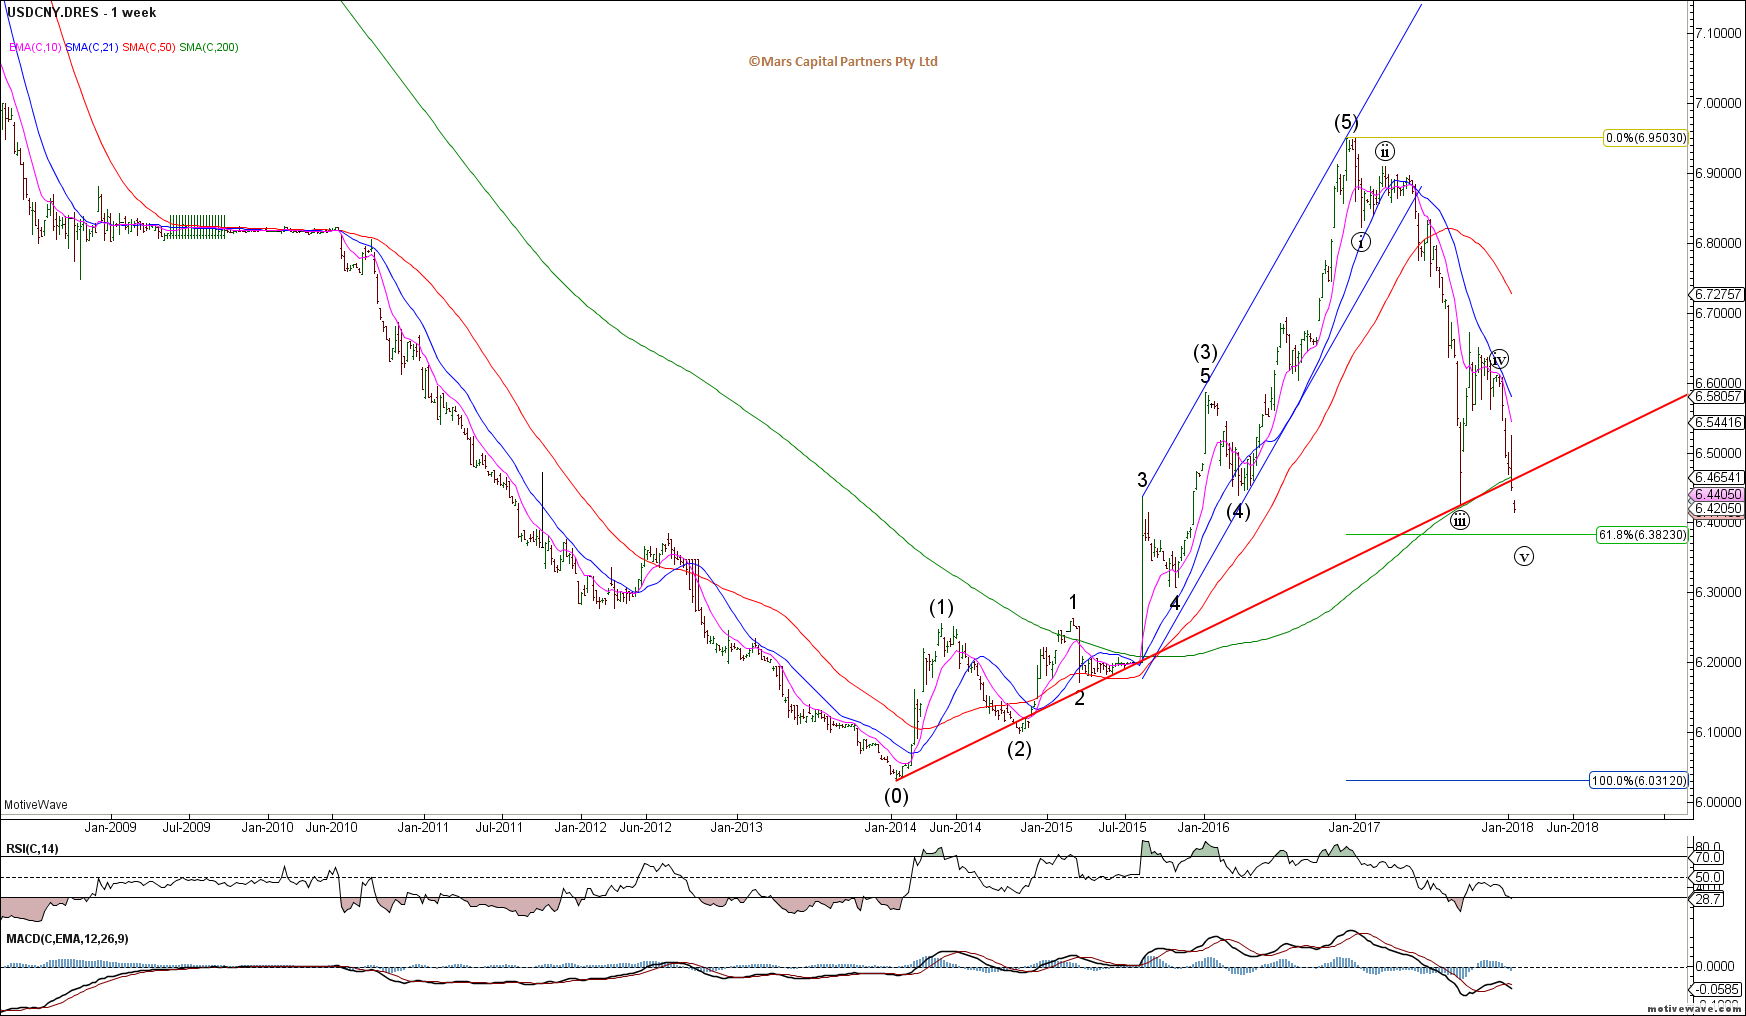
USDCNY Weekly
To the commodity markets and Crude Oil failed to break our $63 support (tweeted last week) and continued to extend its advance with new highs. As we’ve said previously, Crude is unlikely to turn until the US$ does so patience is required as we might take a few shots at a turn. I just like the R/R here for shorts as we look for this wave 5 of (C) to end.
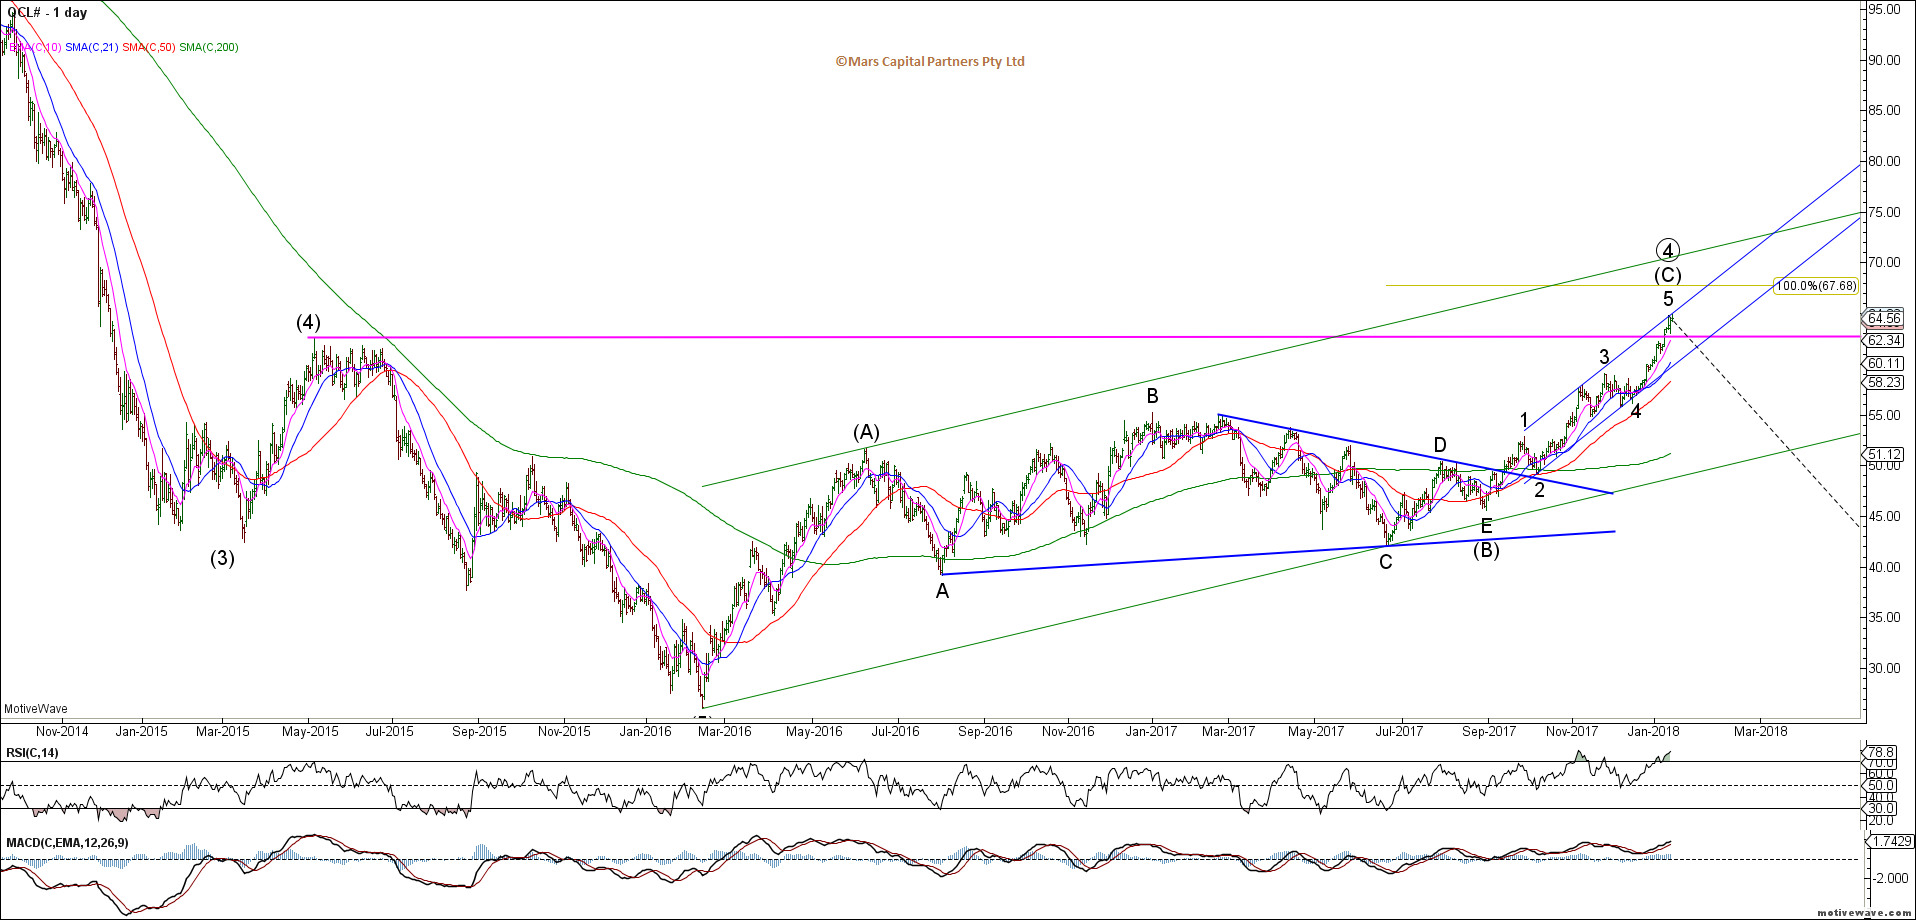
CL Daily
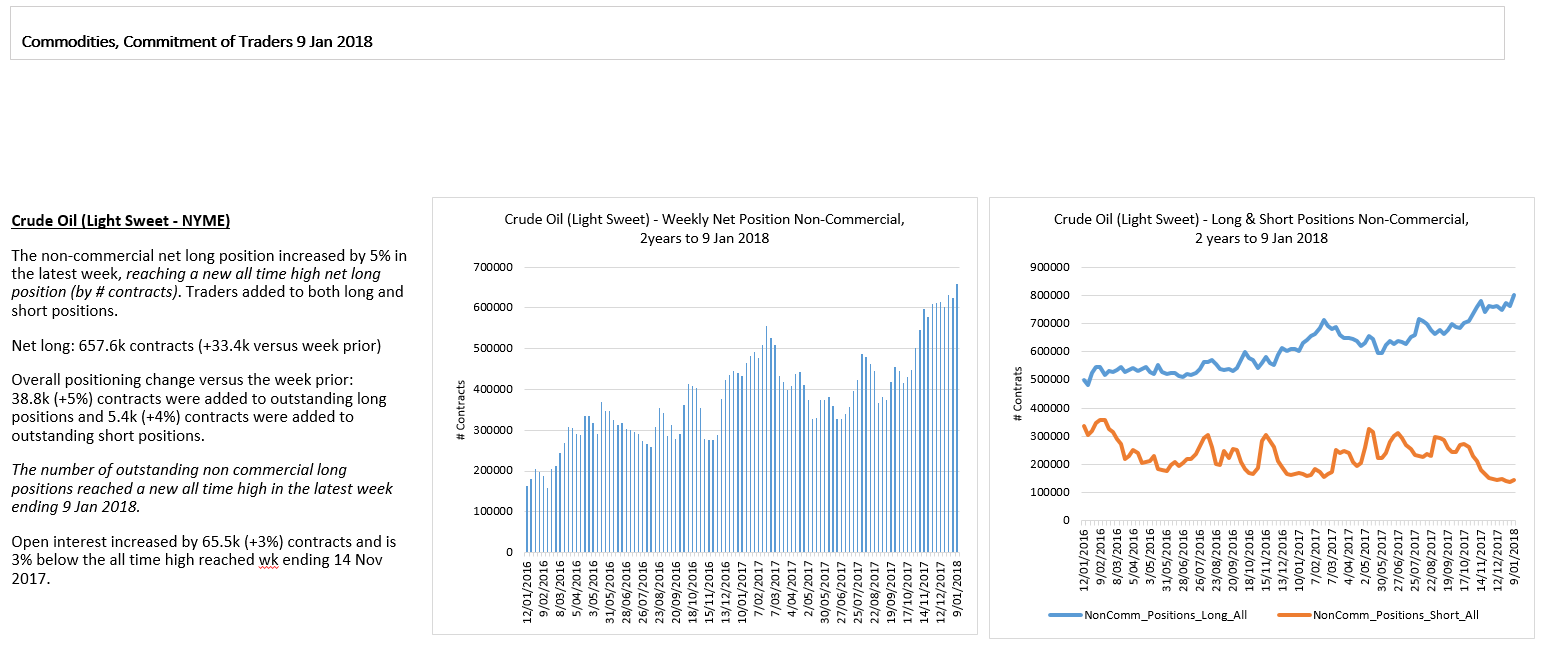
Crude traders extending historic long positions… when this market reverses, the door to get out will be very small.
Brent is in the same structural position as Crude. Looking for a turn lower now that $70 upside targets have been met.
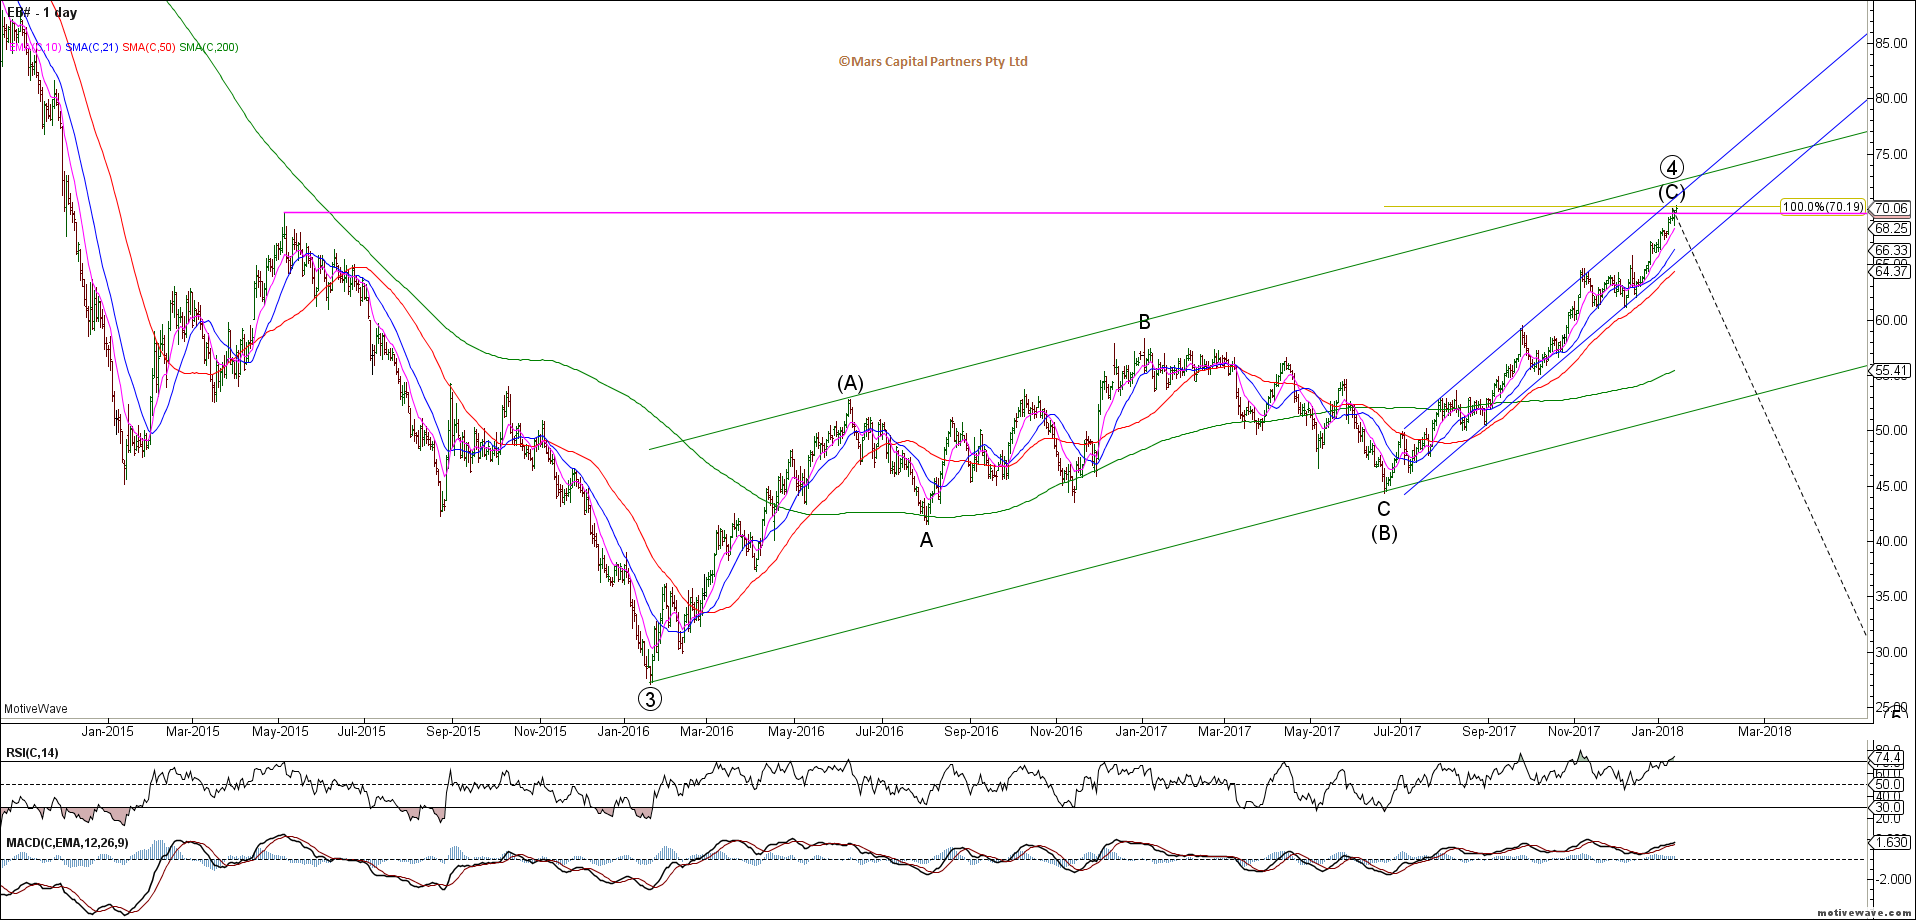
Brent Crude Daily
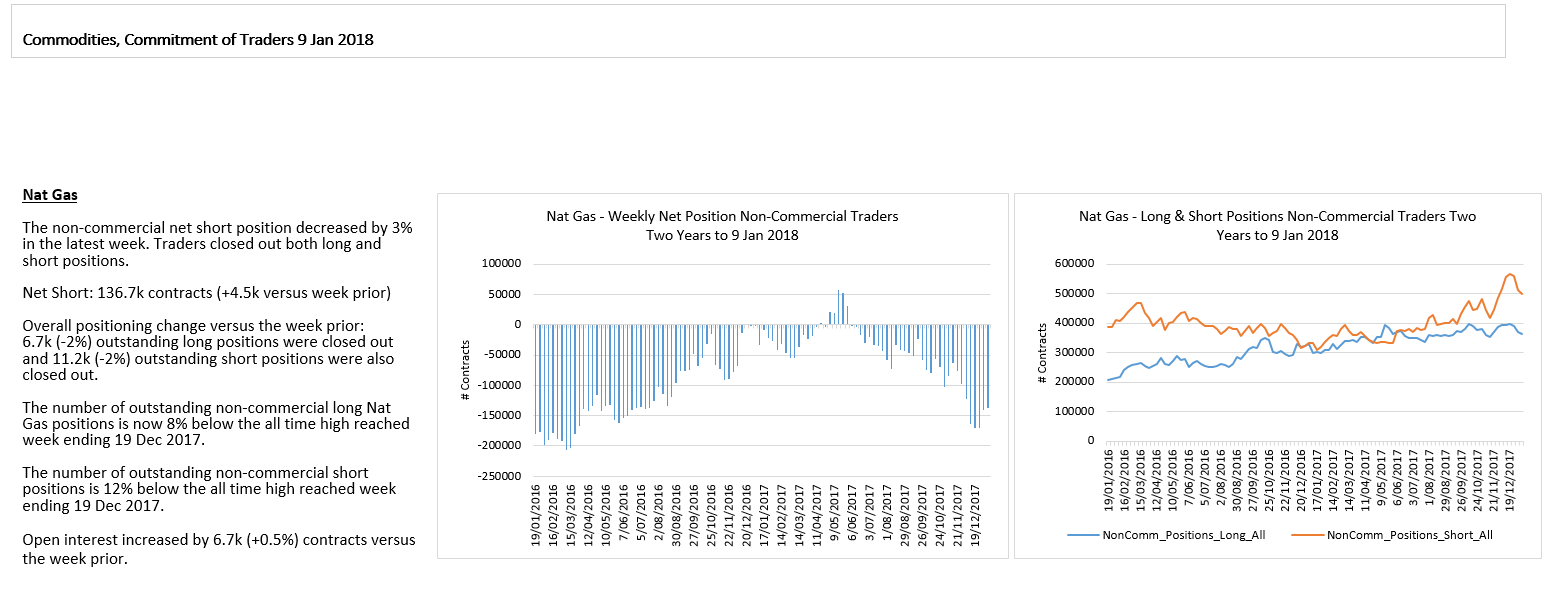
Natty Gas ripped higher as expected but the bigger picture structure remains unclear. Ideally we see a 5 wave rally towards 3.44 while 2.70 holds the downside. We are approaching the top of the range so buyer beware.
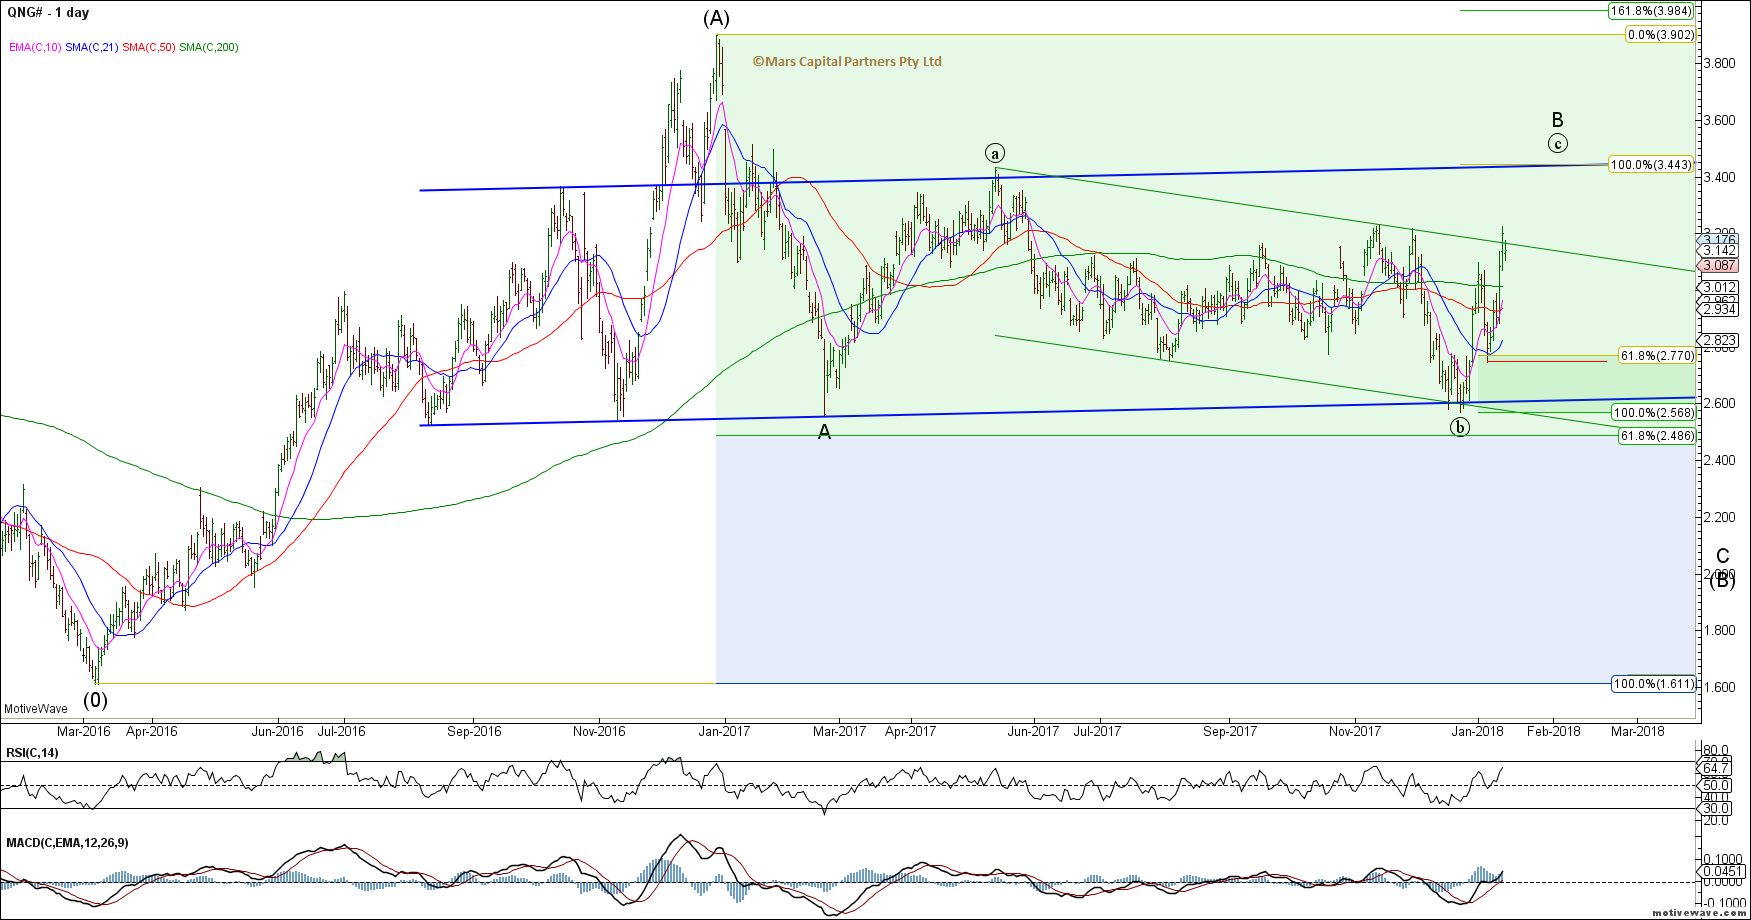
NG Daily
Natty traders remain short in the hole.
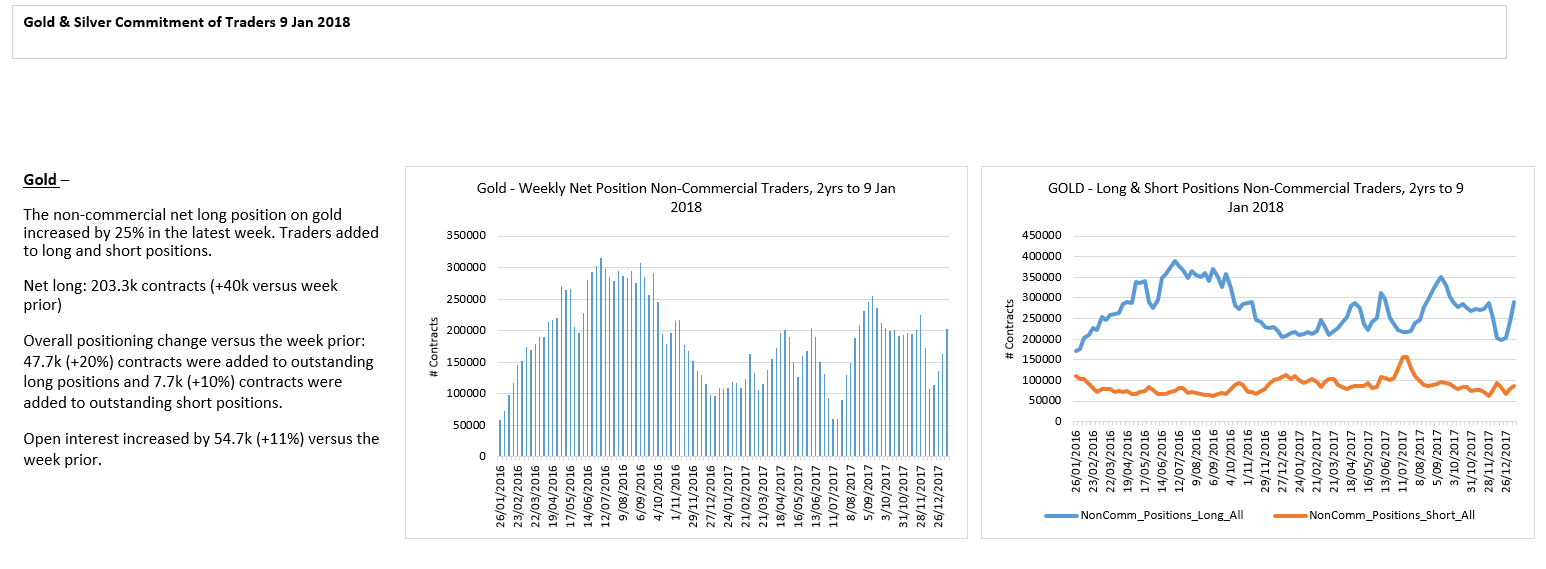
To the PM’s and Gold has continued to rally back towards the top of the range as we had been anticipating. The triangle structure is invalidated above 1380 where we will have to consider the potential for a break higher towards 1450. Approaching an important inflection point for the PM’s as bulls pile in.
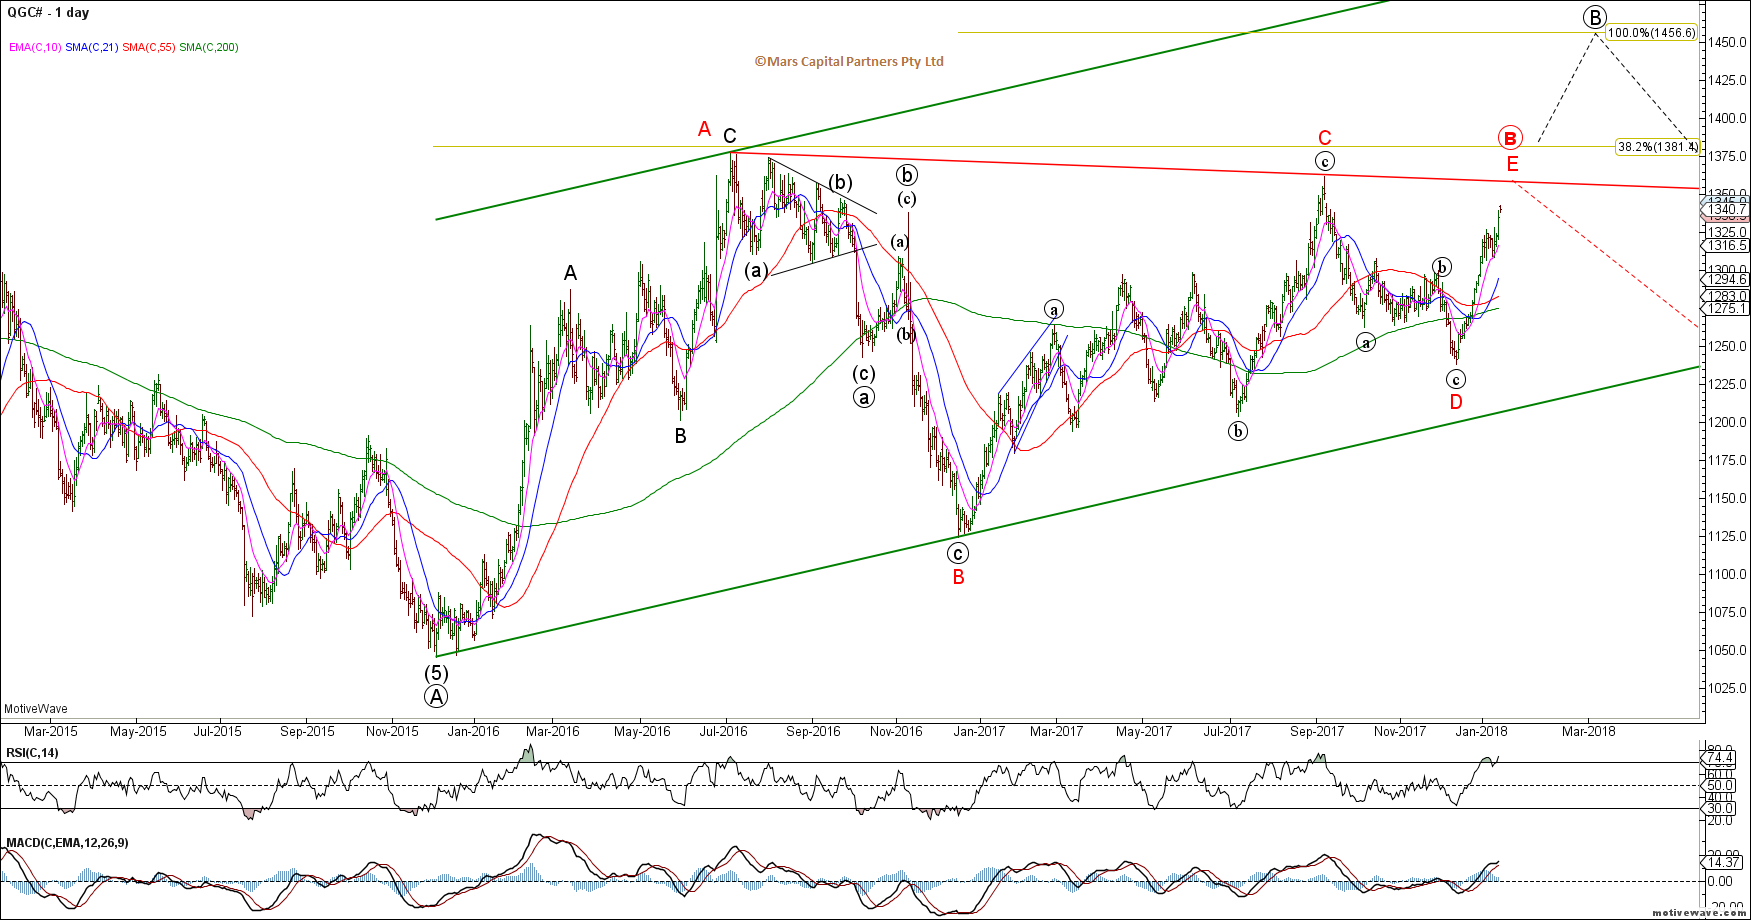
Gold Daily
Gold traders piling into longs once again…
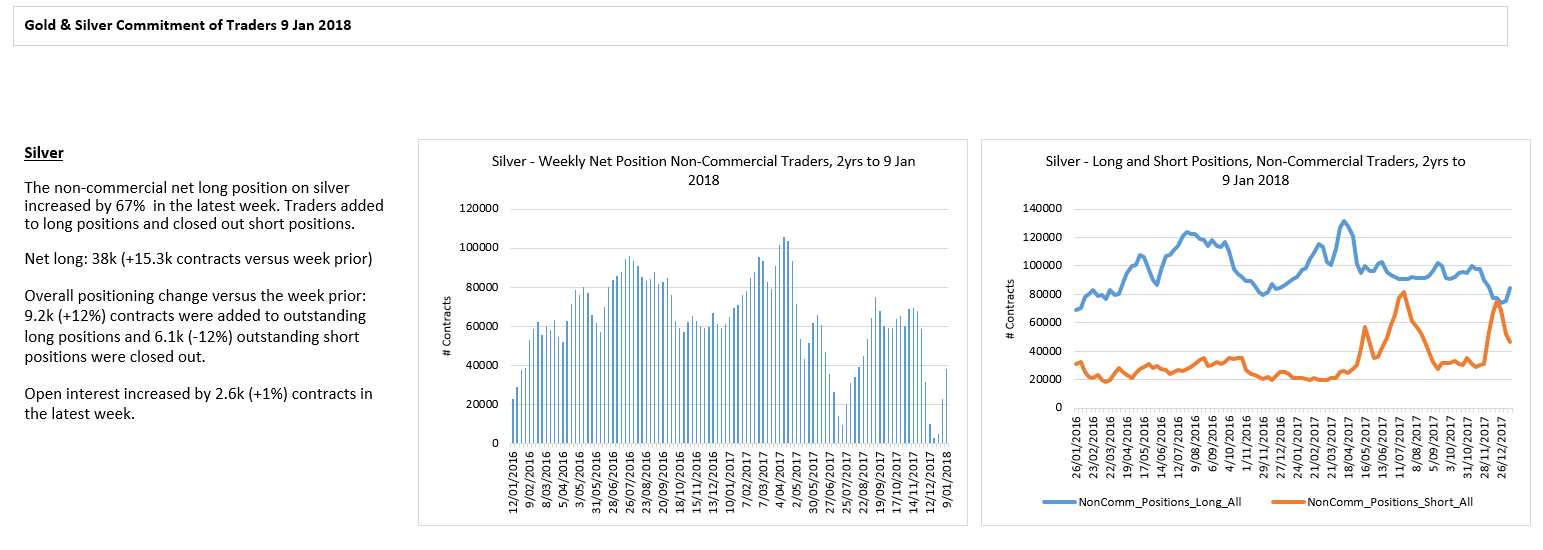
Silver is also now at trend resistance in the 17.50 area so it is also at a near term inflection point. No signs of a reversal yet but we are watching the US$ carefully.
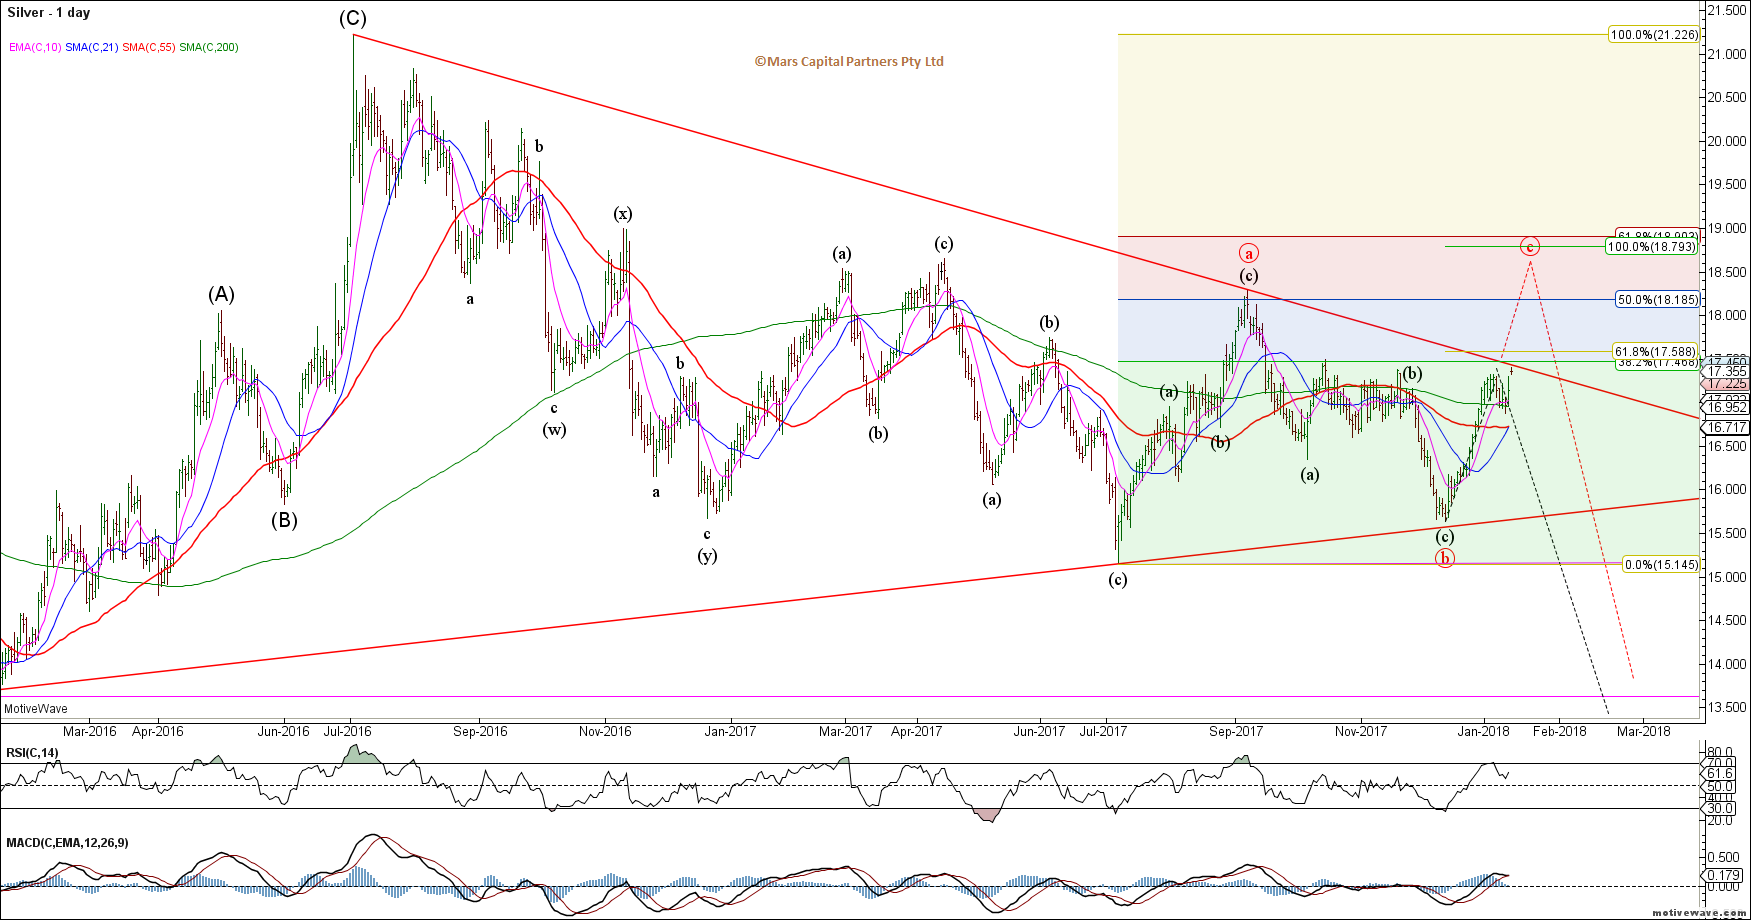
Silver Daily
Silver shorts capitulating once more.
That’s all for now folks. Have a great week 🙂
