
In 2018, we were looking for a topping equity market, rising rates and strengthening US dollar as central banks reduced liquidity. Global fundamentals of debt, deflation and slowing growth will continue to provide headwinds throughout 2019.
The question is how long can the CB’s kick the can down the road? At what point do global markets call their bluff as market maker in chief? One thing is clear, central banks are manufacturing a world of increased societal acrimony through financial repression – how long can they continue to support the banking hegemony with disregard for societal inequality?
Key Macro Themes for 2019:
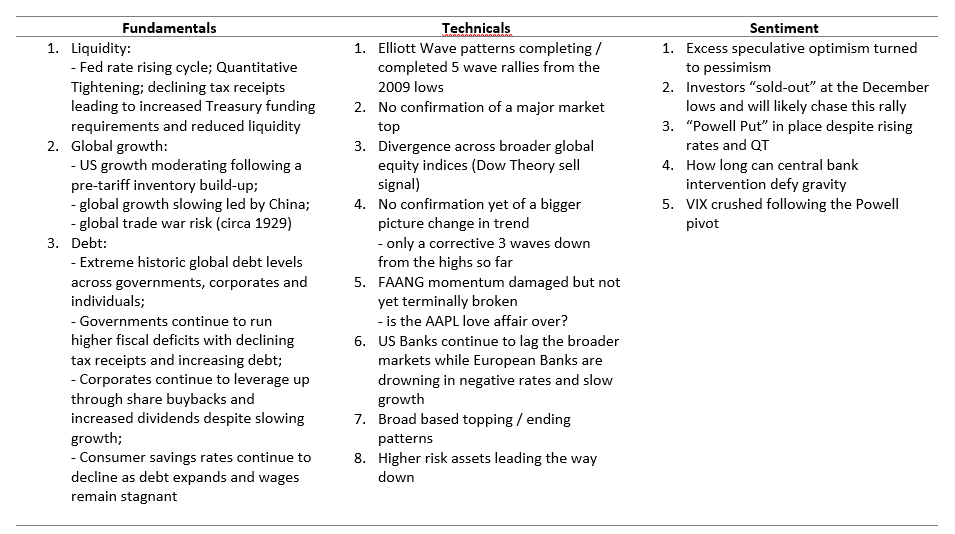
Global equity markets either topped in 2018 or are in the process of topping. We have a potentially complete 5 wave impulsive rally from the 2009 lows that terminated in September 2018. However, due to the corrective looking 3 wave pullback into major support, we cannot confirm with confidence that the bigger picture rally is over. We expect a year of increased volatility as investor hope and faith in central banks is tested by the headwinds of debt, deflation and slowing economic growth in a distorted market.
In summary, 2019 is likely to be a trader’s market with high volatility across macro asset classes.
– we remain defensive equities and swing trading tactically;
– bullish bonds in a deflationary environment;
– bullish the US dollar (except against the Yen);
– bearish the Swiss Franc;
– bearish commodities; and
– longer term bearish gold and silver
I’ll start with equities – namely the S&P. I’ll spend some detailing what I see as the key scenarios to watch. The Dow, Nasdaq and Russell are likely to follow similar patterns, so these scenarios will apply more broadly to equity markets.
Our long term outlook is that the entire post 2009 rally in equities will be fully retraced. While I am bearish the longer-term, at this time, a bull and a bear case both remain possible. Both cases and potential roadmaps are outlined below.
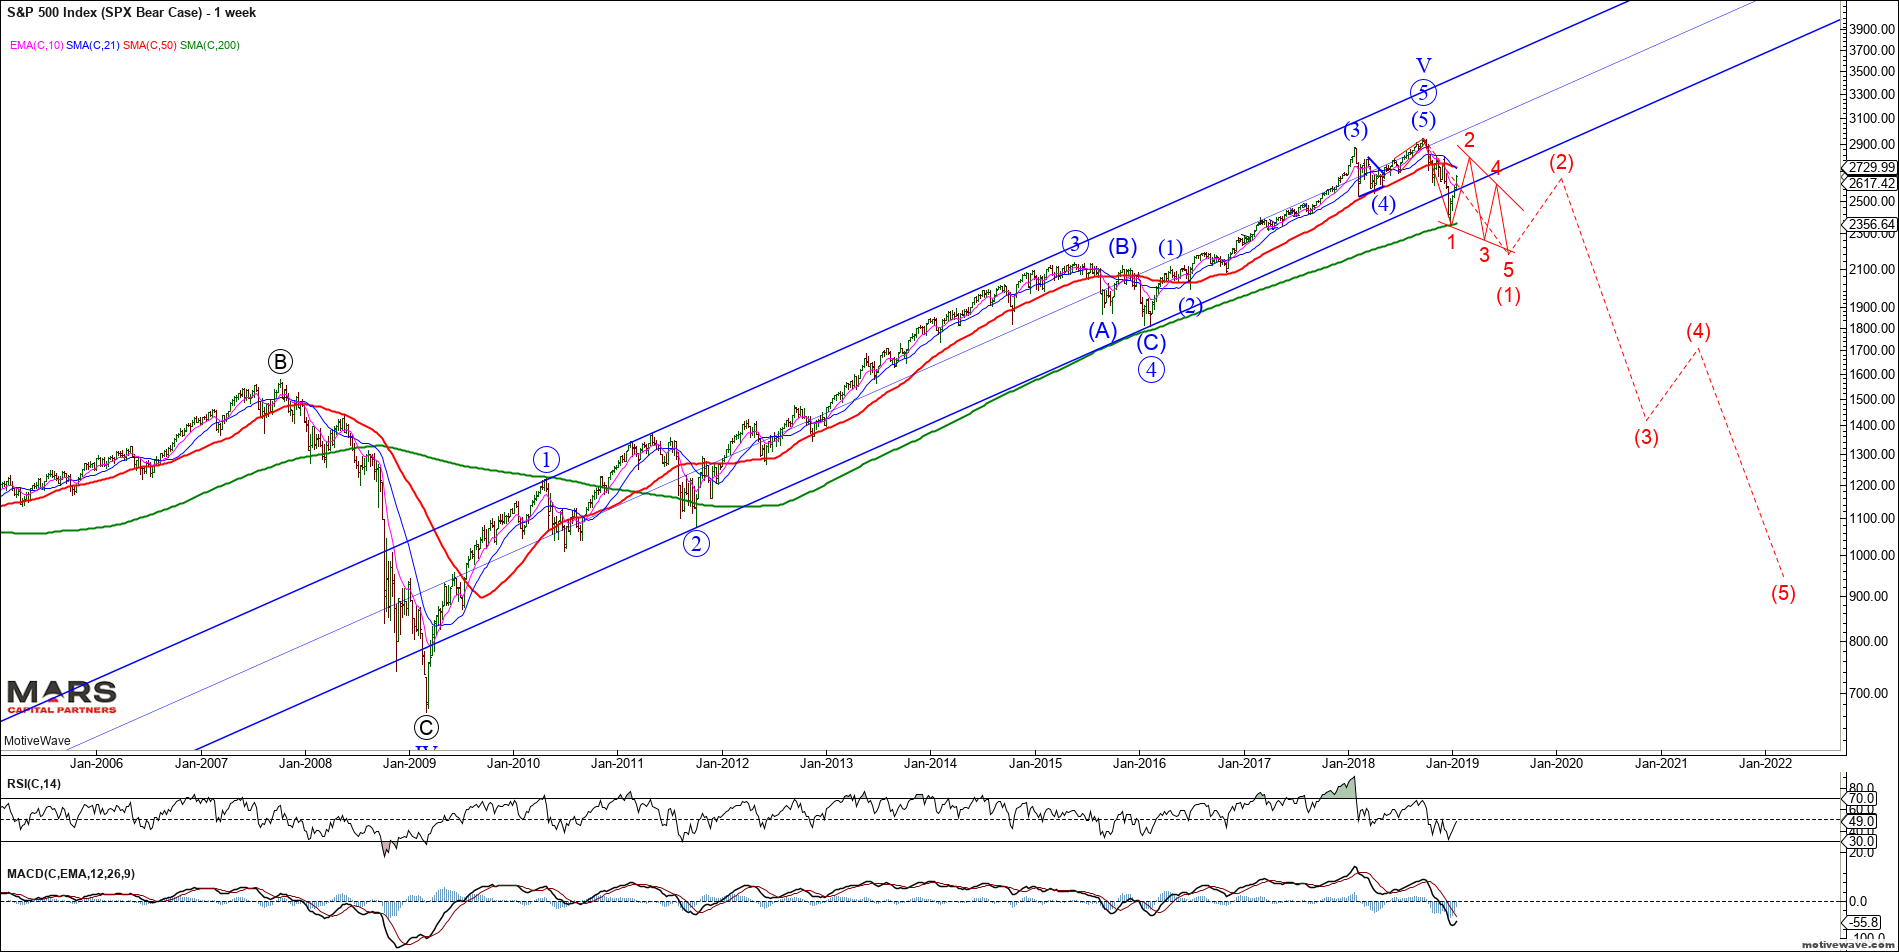
Firstly, the bull-case. This will likely be more of a traders’ market than an investors’ market with increasing volatility. Our benchmark SPX has a potentially completed 5 waves up from the 2009 lows. What we do NOT have is confirmation of a change in trend so the potential remains for new ATH’s as shown below. As previously stated, we need to see 5 waves down from the highs to confirm a change in trend to DOWN.
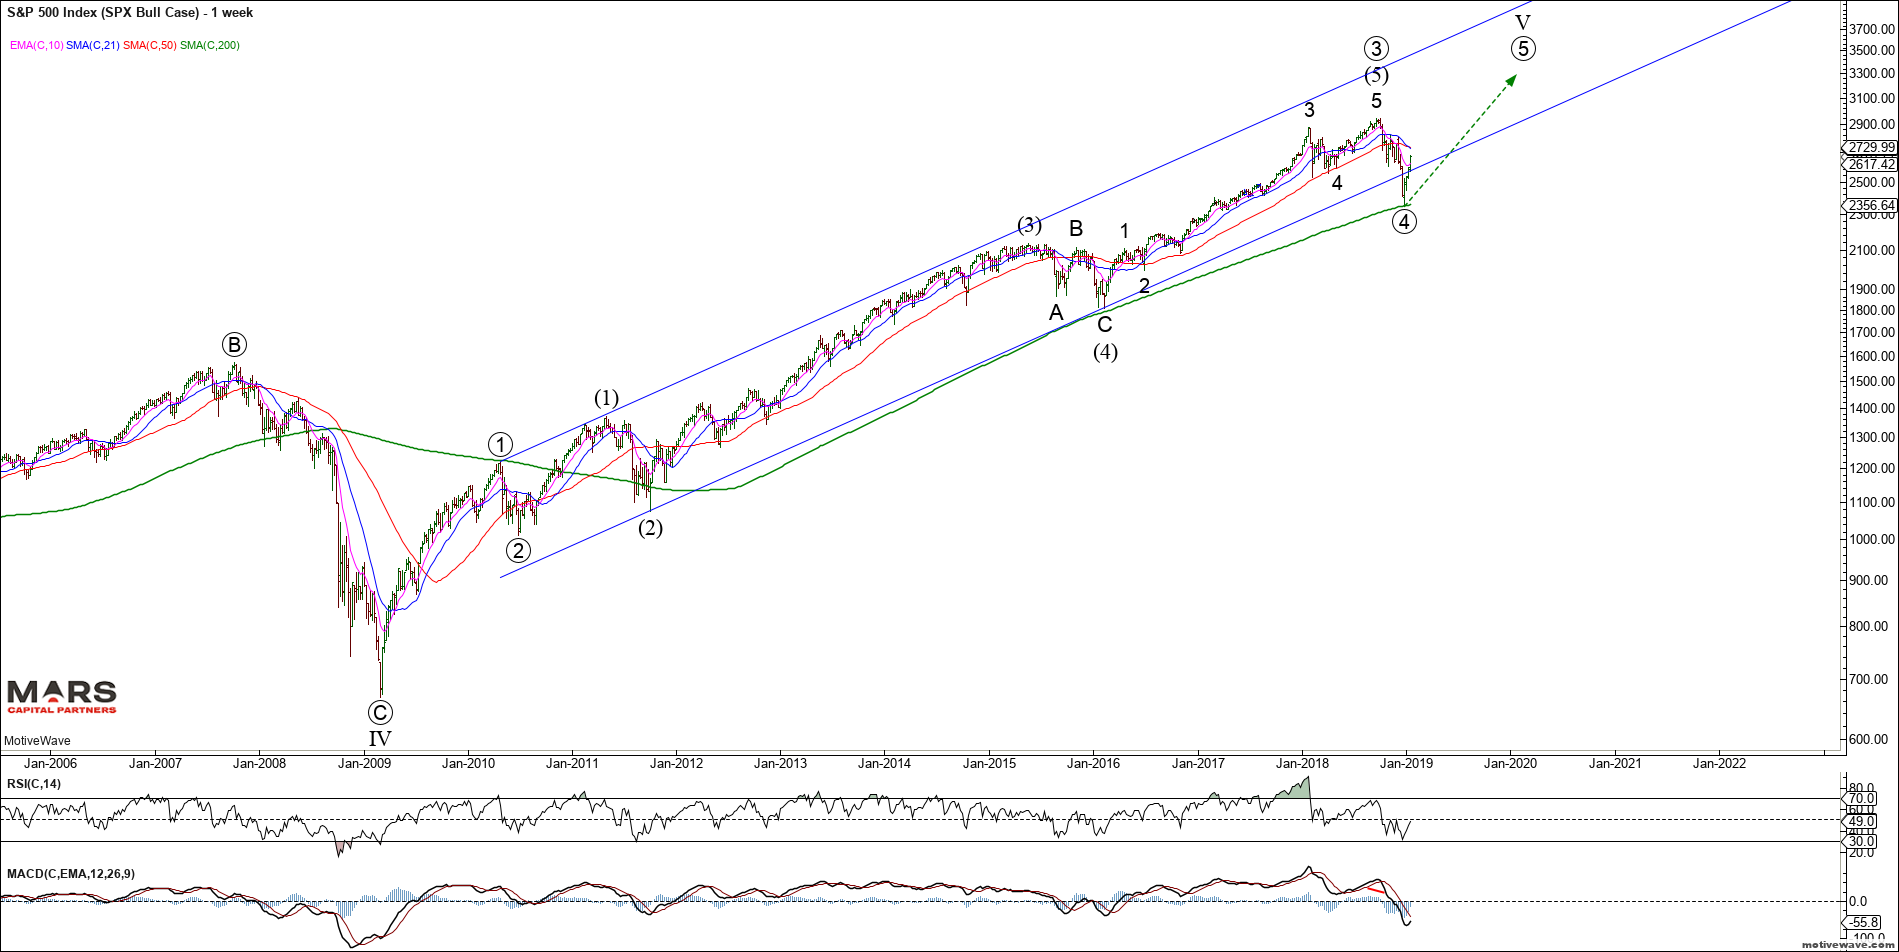
So far the SPX bull case has 3 waves down of equality into structural support and what appears to be an impulsive rally off the lows. This implies either a completed 3 wave corrective decline for ALL of wave 4 or “part” of a larger corrective decline in a bull market. So in the bull-case, there are three possible paths to new ATH’s. In Elliott Wave terms, a correction in 3 waves is either:
– Black count: a completed zigzag correction for all of wave 4 and we push directly to new ATH’s in wave 5; or
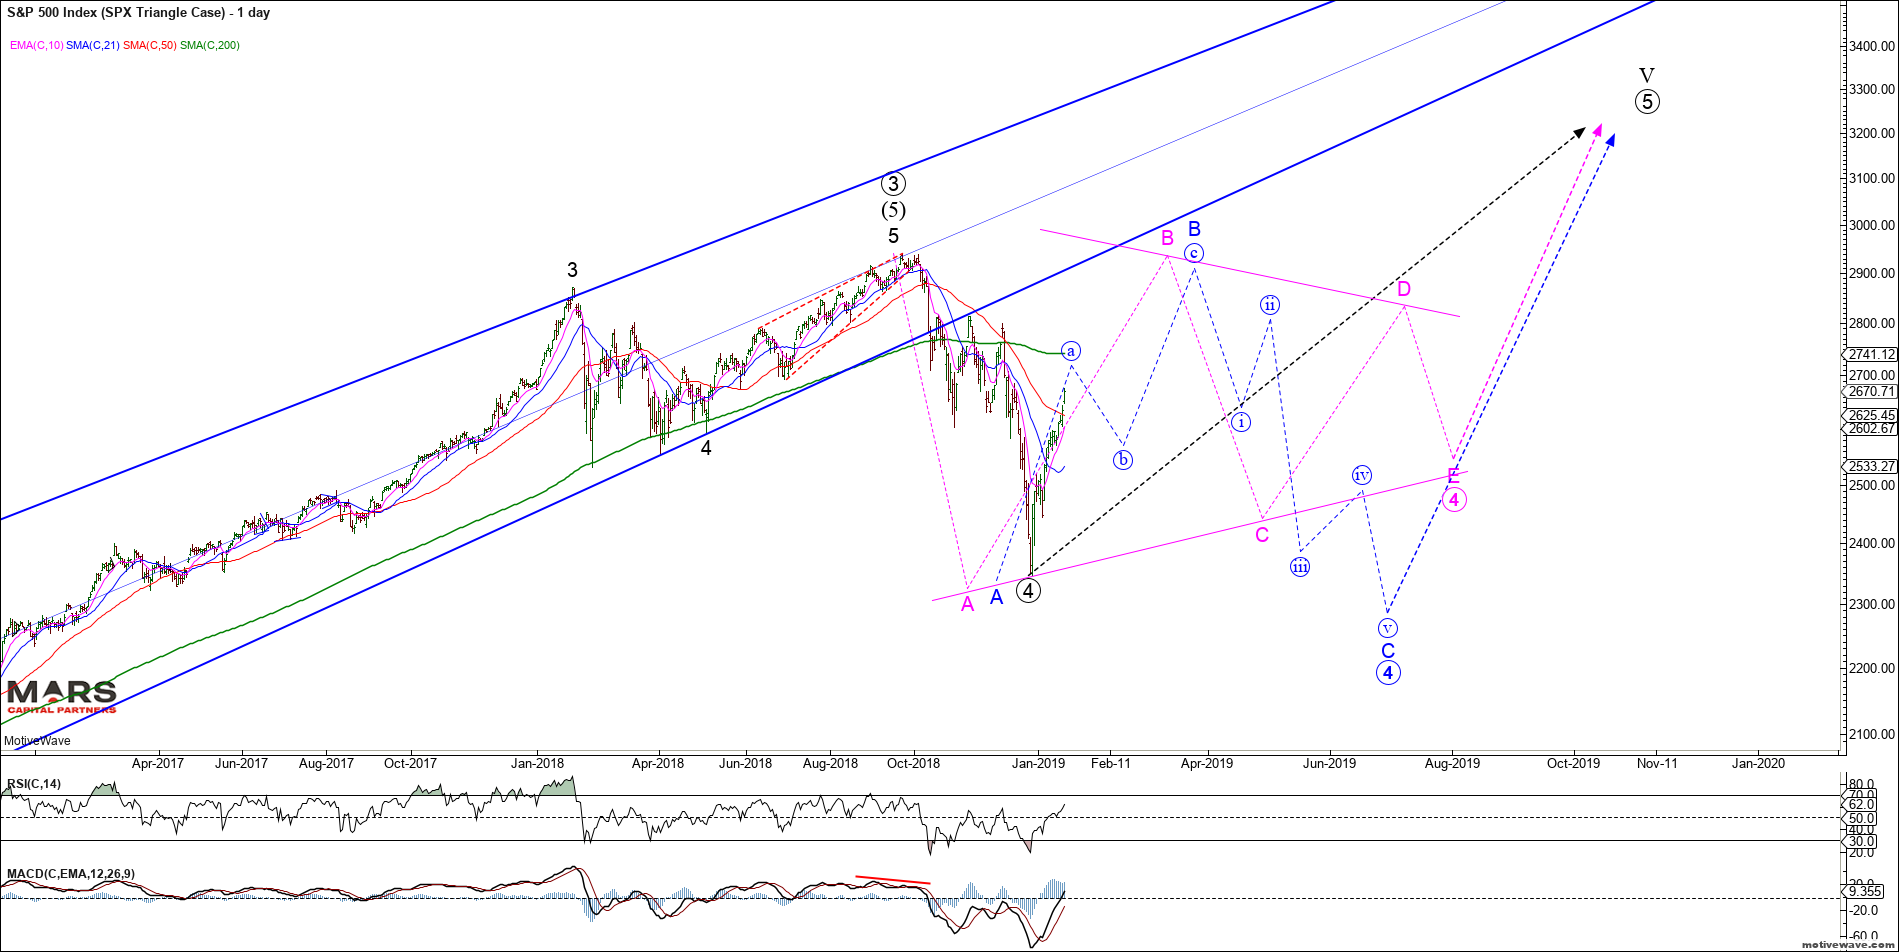
– Blue count: completed wave A of a 3-3-5 (A-B-C) corrective Flat where we are now in wave B to test the ATH’s; or
– Pink count: completed wave A of a multi week / month 3-3-3-3-3 (a-B-C-D-E) triangle before a final thrust to new ATH’s in wave 5
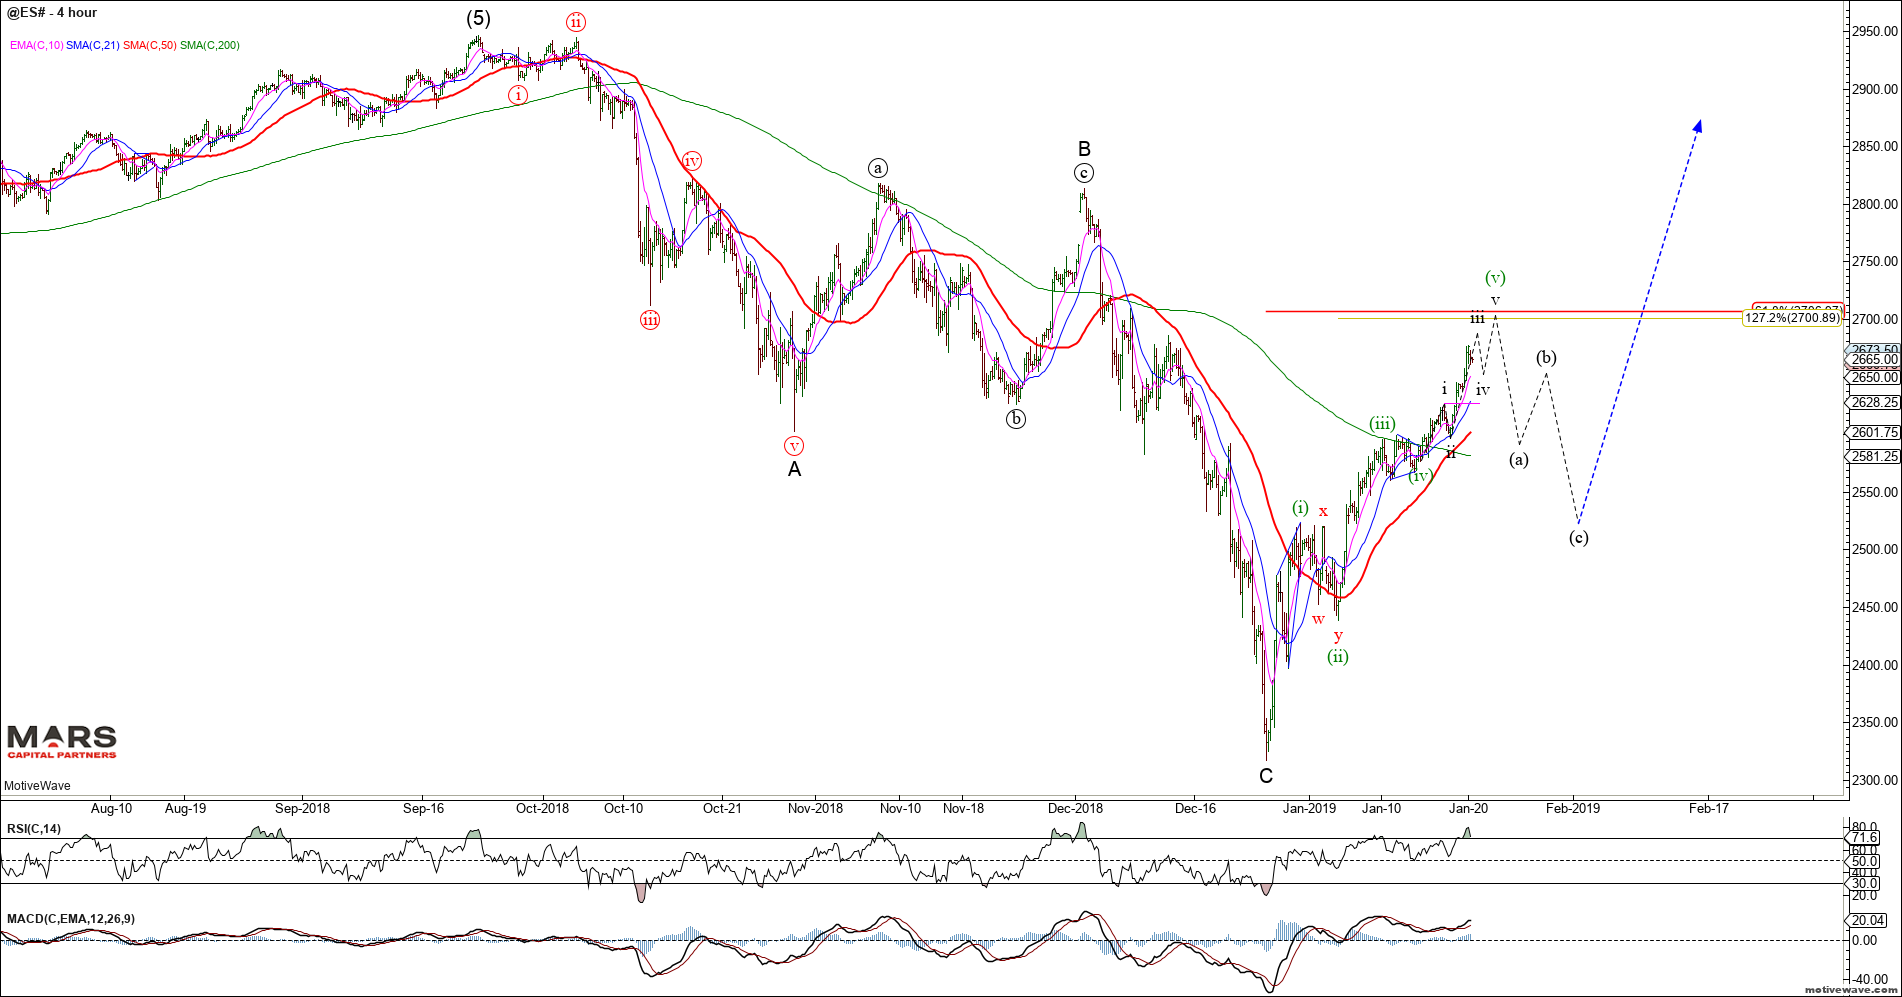
From a near term perspective, the ES appears to be in an extended 5th wave after breaking above our 2645 resistance last week with targets in the 2700-10 area. Once this impulse wave completes for wave 1 / A, we should expect a corrective 3 wave decline prior to the next move higher to retest ATH’s. We are not chasing this rally but rather looking for a turn, the nature of which (impulsive or corrective) will setup our next swing.
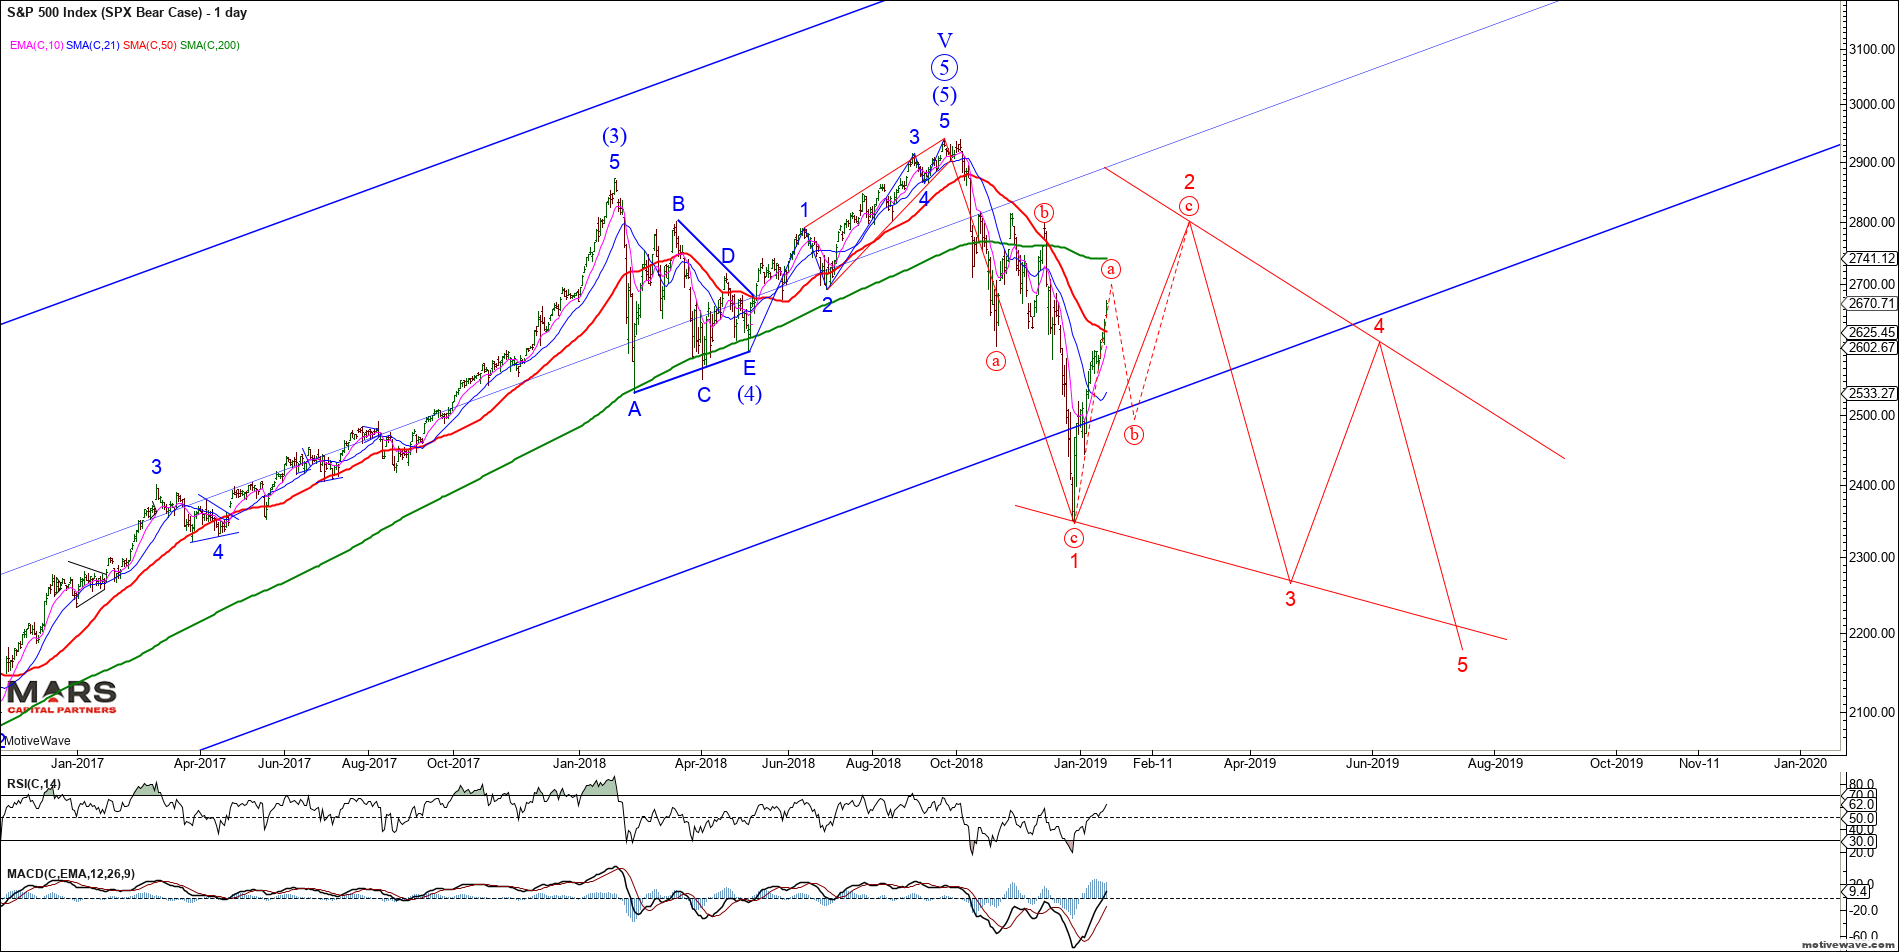
The SPX Bear Case assumes that the 5 wave rally from the 2009 lows is complete and we have begun a bear market. There is little evidence to support this structure unless markets trade back below the December lows.
Given the initial 3 wave decline, the most likely bearish structure is a “leading diagonal – falling wedge” as shown below. The lack of 3rd wave price action suggests even this decline would be highly volatile (read choppy whipsawing) and take months to play out – this potential structure is invalidated at new ATH’s.
Another potential bearish SPX / ES structure (lower probability) is a rare expanding leading diagonal which requires an immediate bearish turn from the 2700 resistance area.
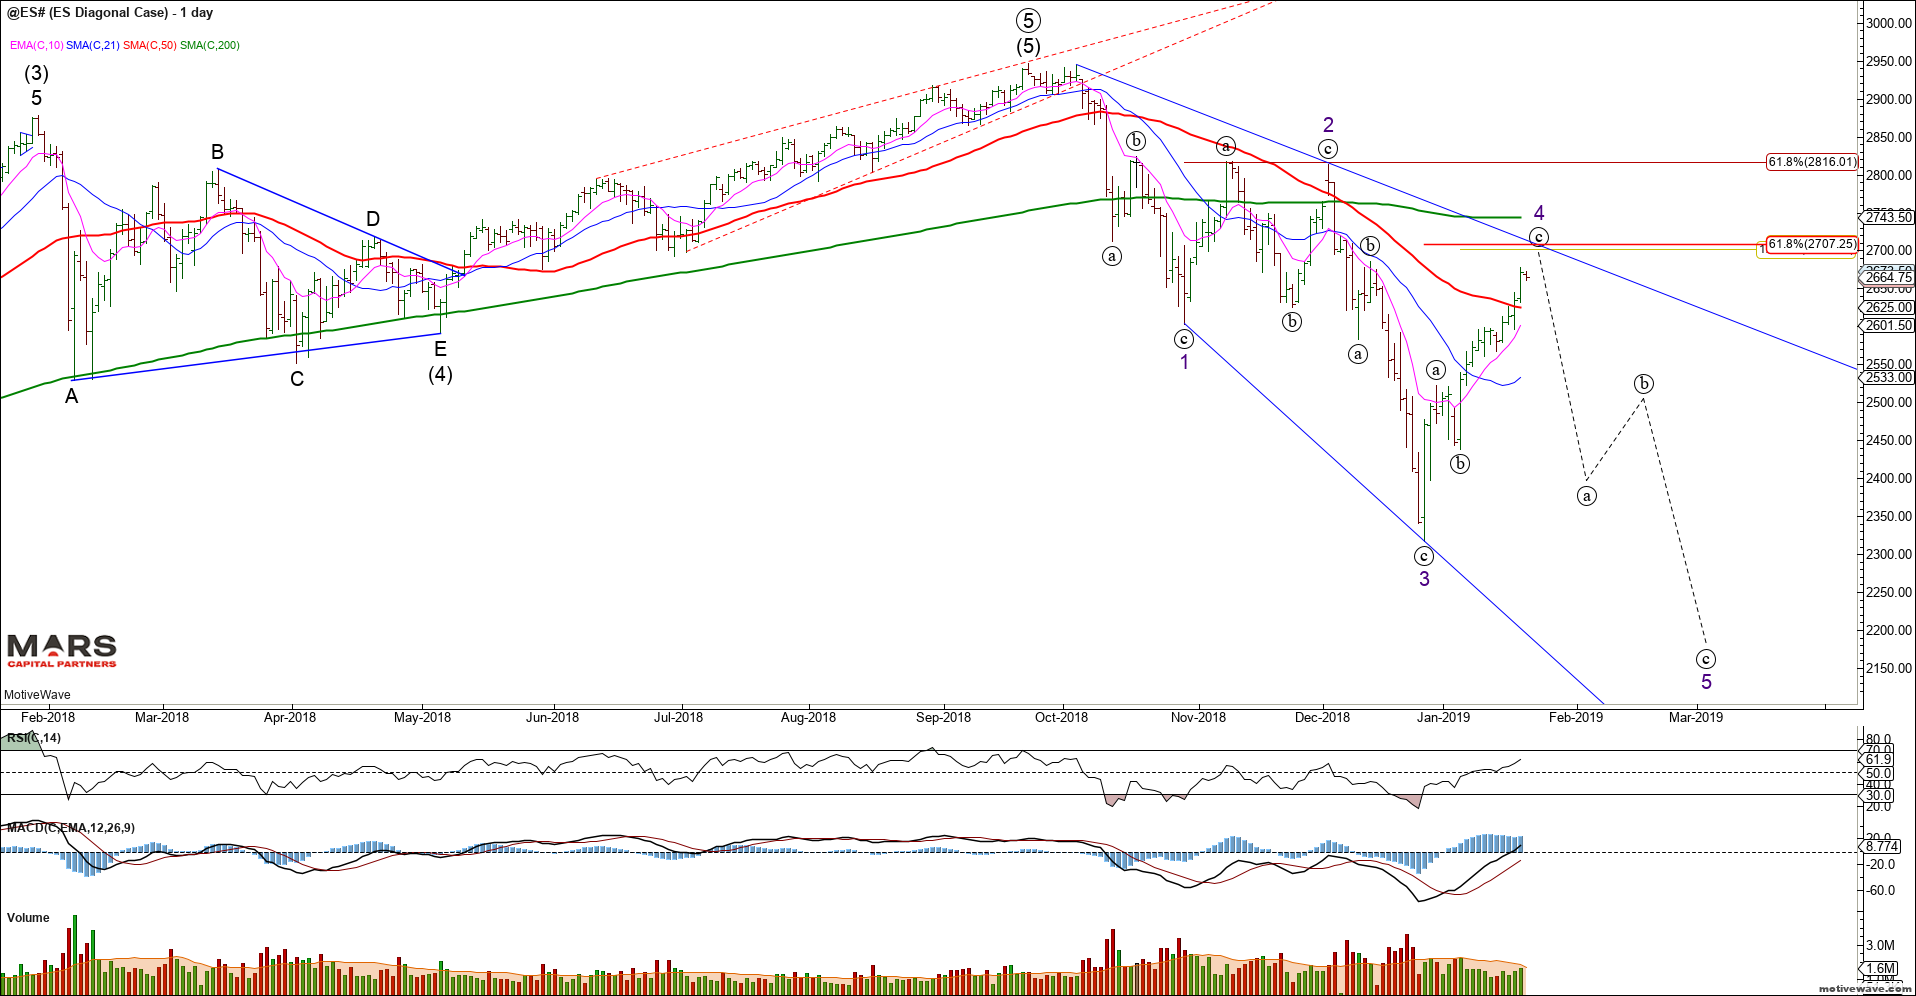
Given the number of price paths that are still valid/possible at this point in time, we expect volatility and traders should remain nimble and trade tactically.
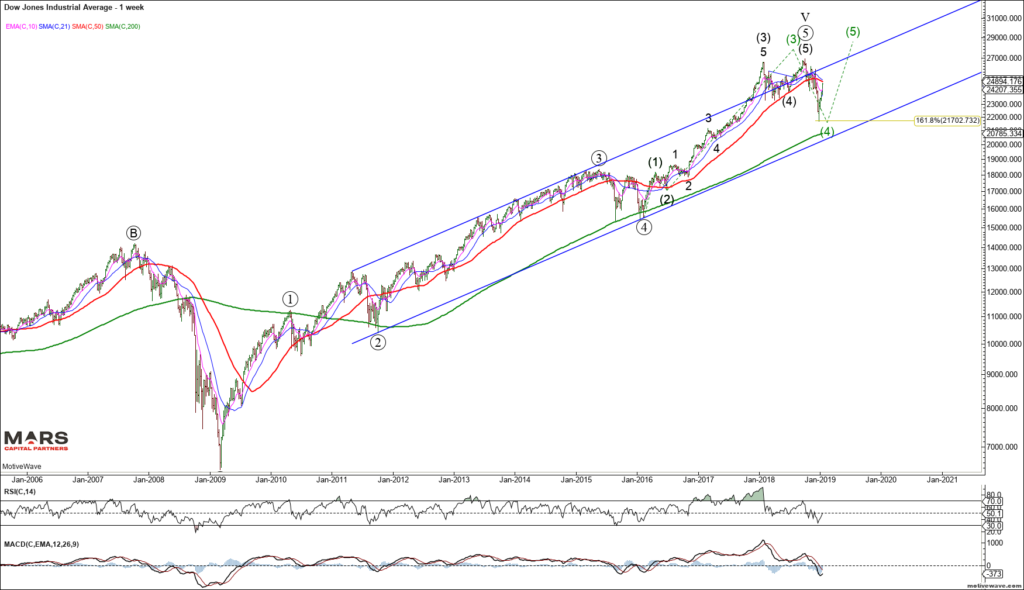
The Dow shows the same structure from a big picture perspective. With only 3 waves down from the highs, we must allow for a potential push to new ATH’s while December’s lows remain in place.
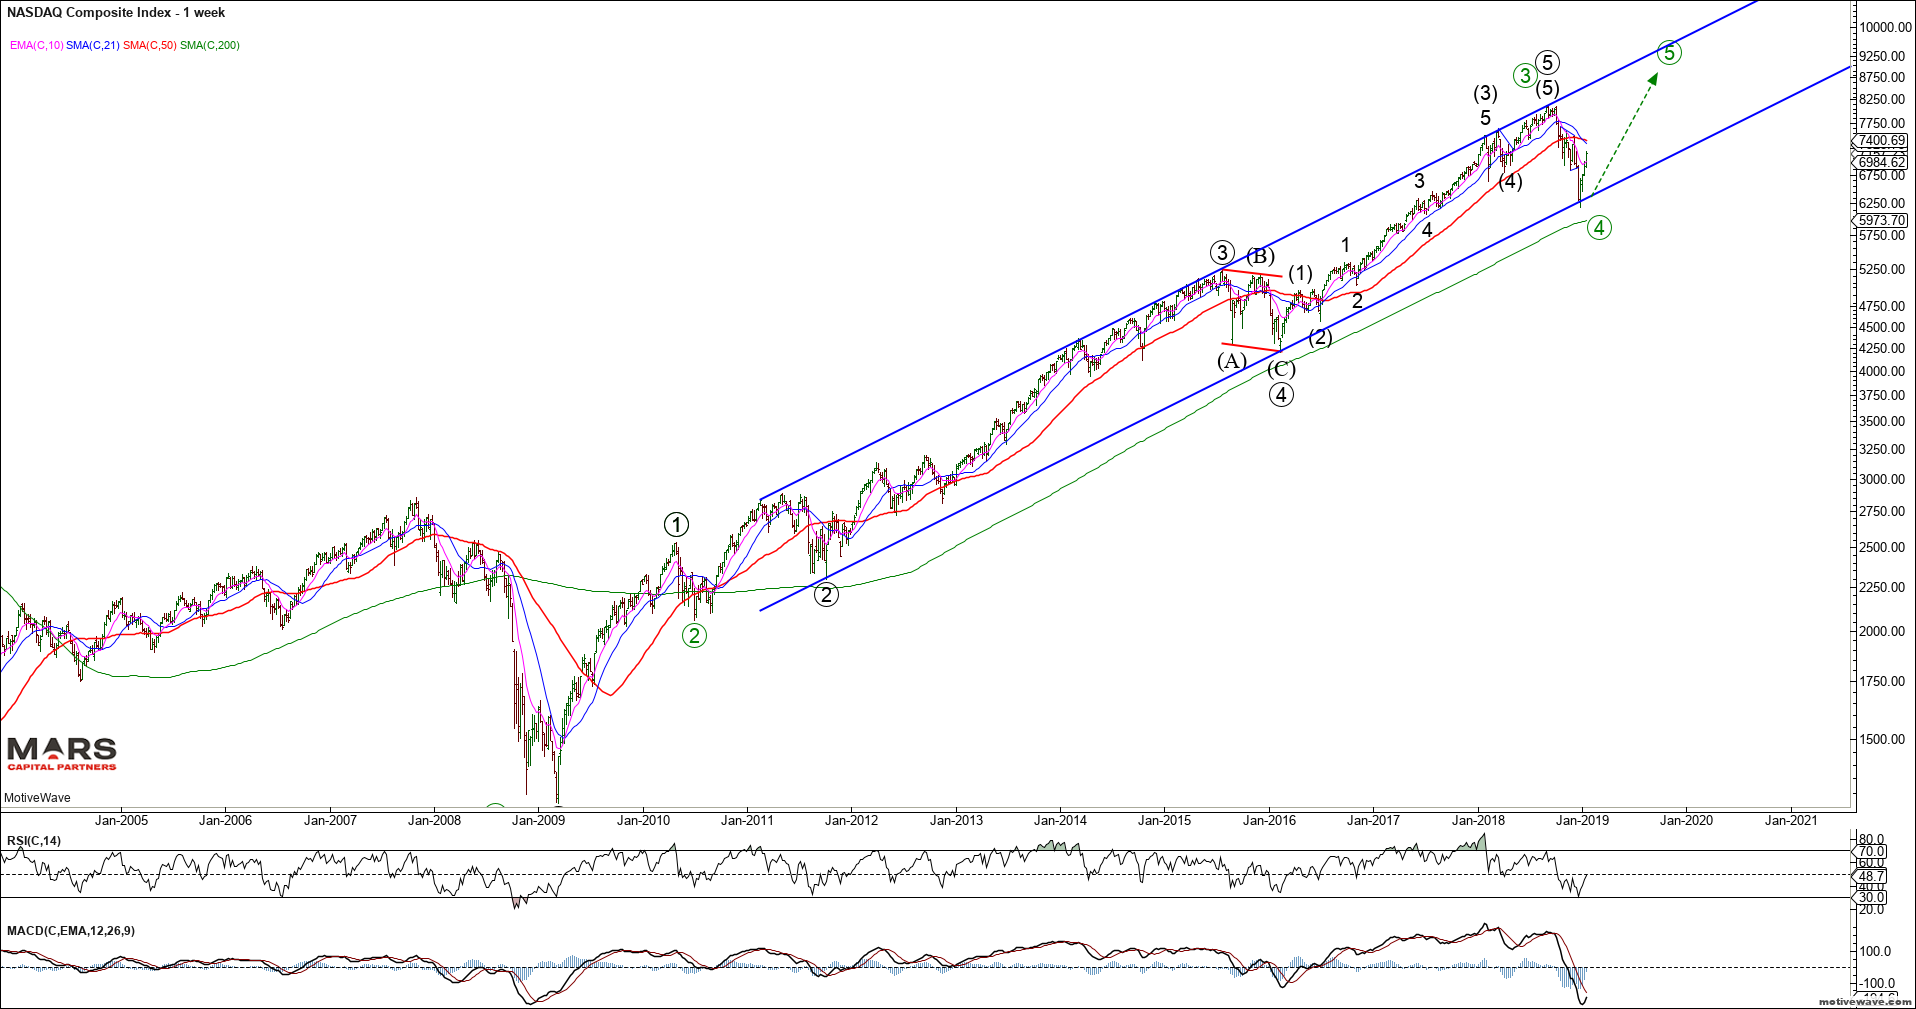
Similarly, the Nasdaq indices only declined in 3 waves of equality into structural support opening the door for an eventual push to new ATH’s. The rally from recent swing lows appears impulsive for a direct push to new ATH’s or part of a more complex correction for wave 4 as per the SPX.
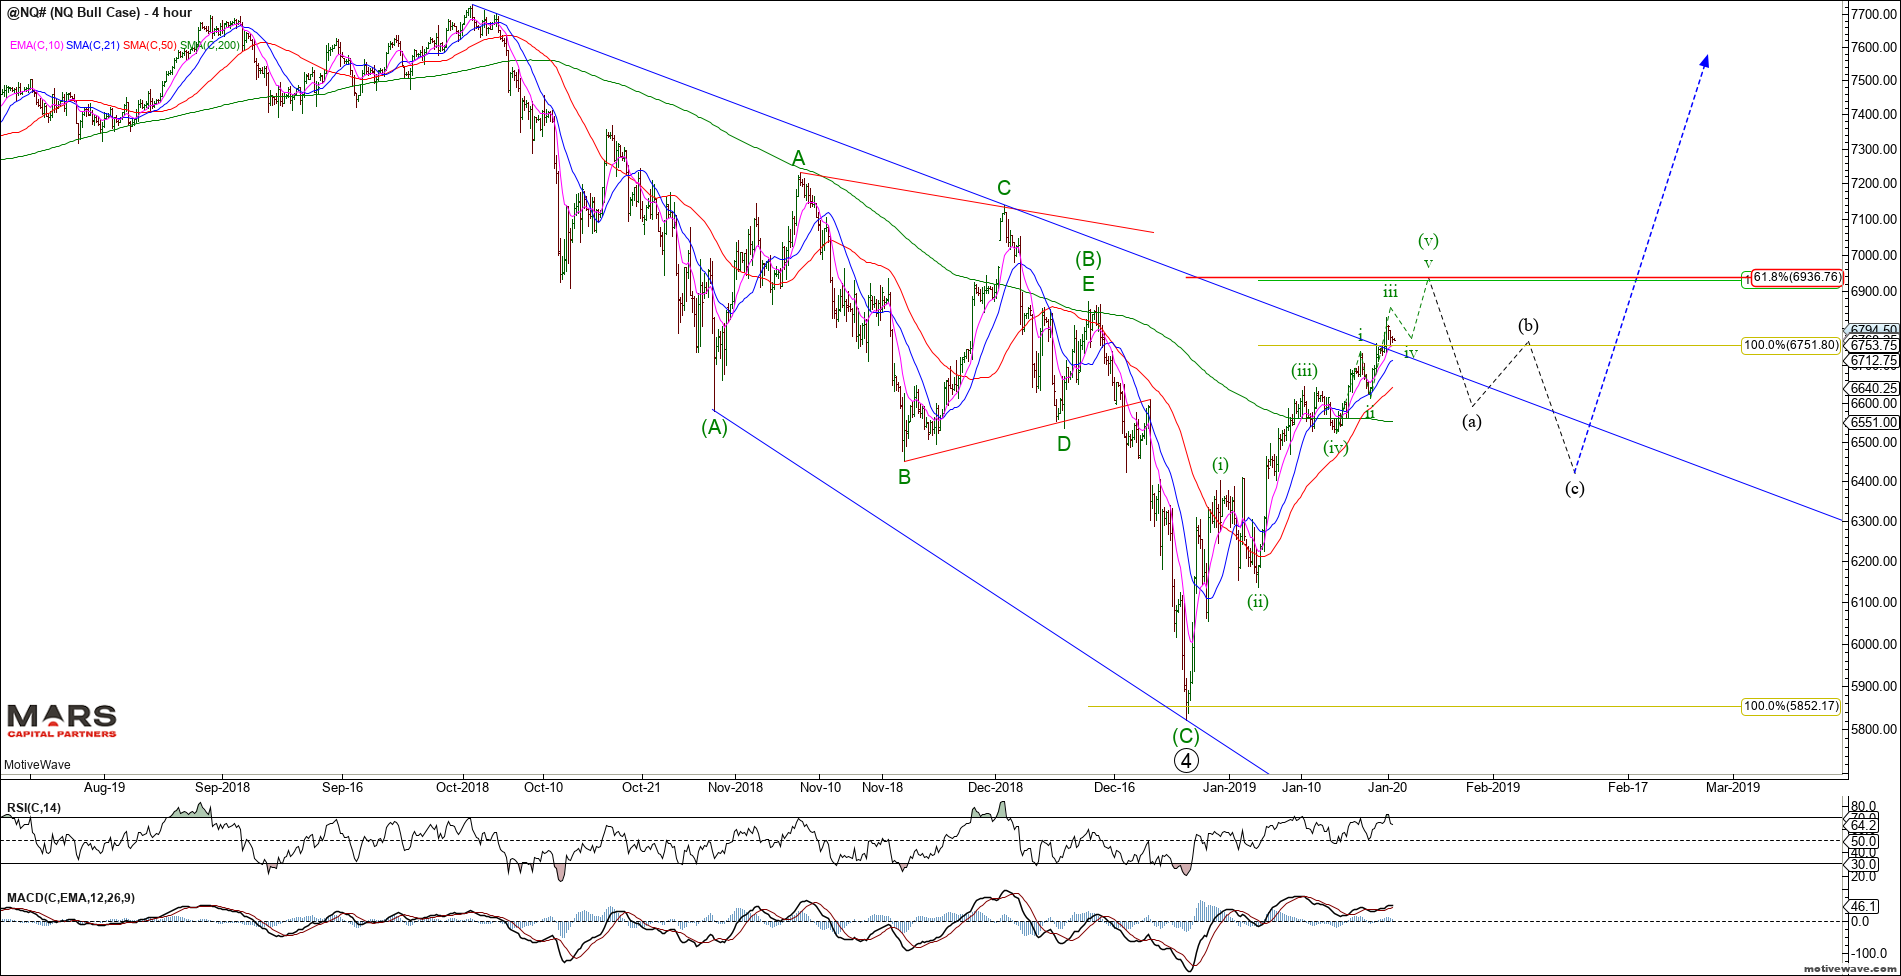
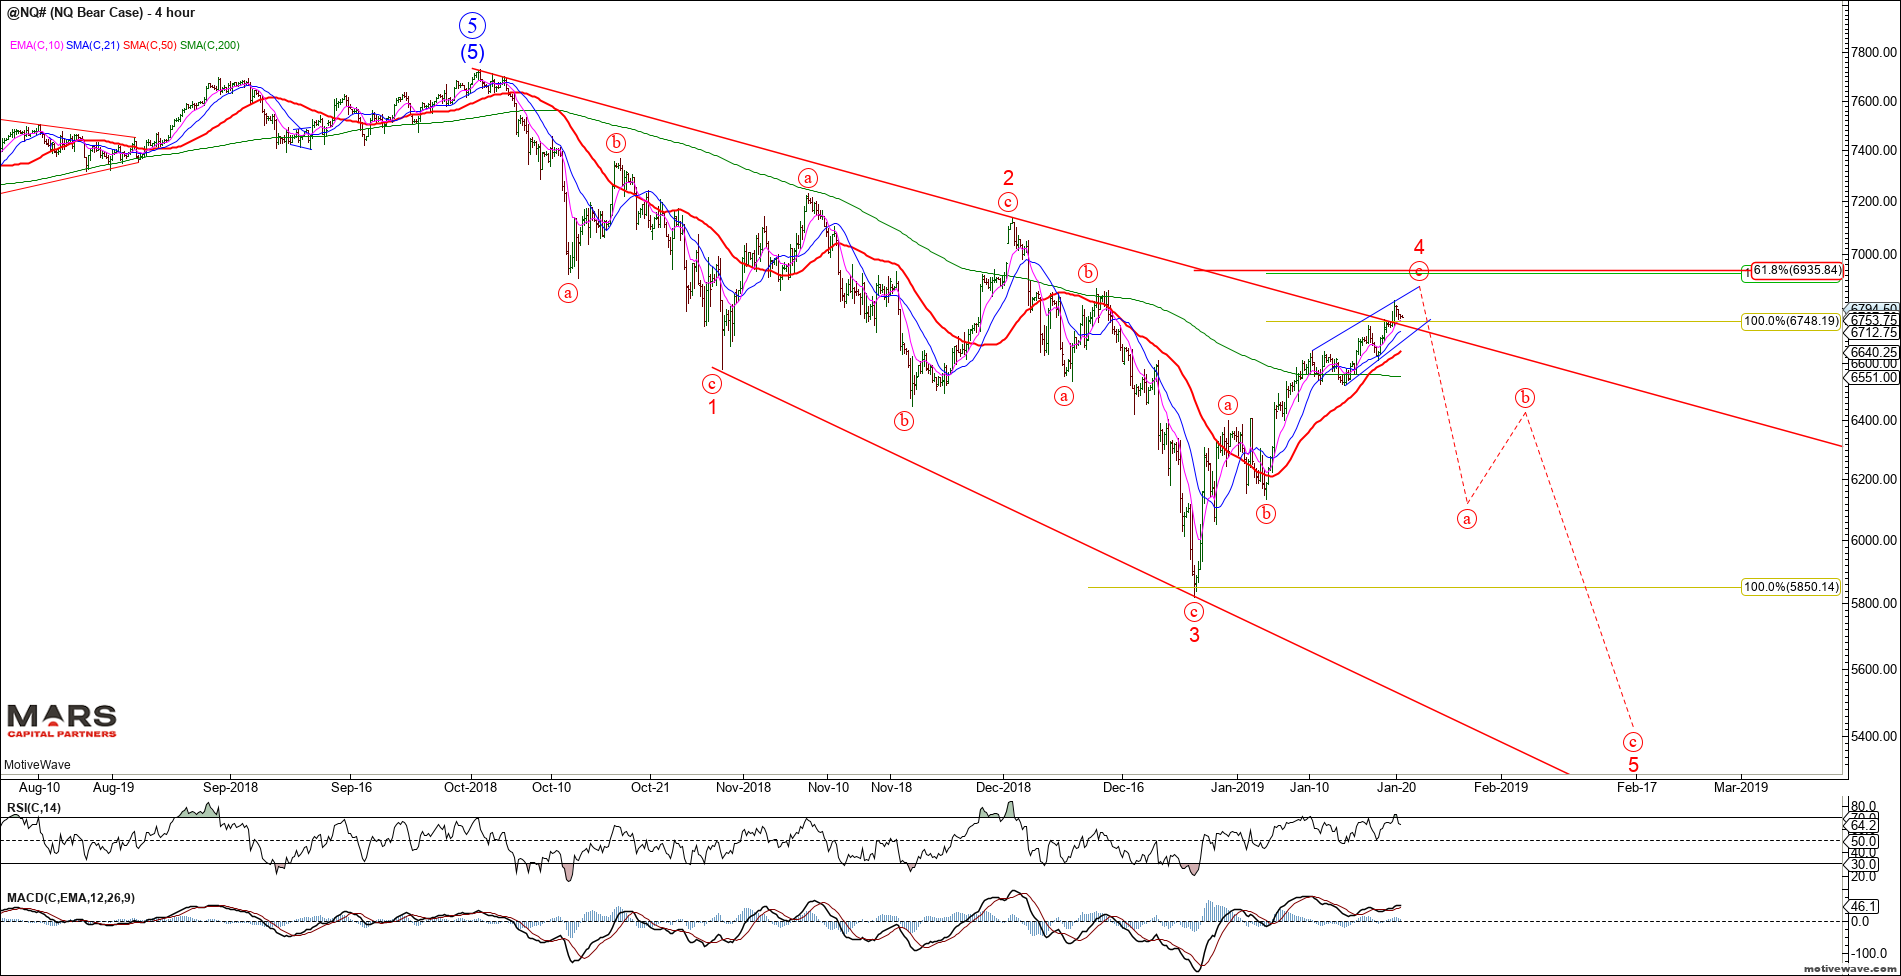
From a near term perspective, the NQ is tracing out what appears to be an extended 5th wave approaching resistance in the 6936 area (61.8% Fib retracement). The near term structure counts best as an impulse up from the lows as shown in the bull count. There is the potential for an extended wave (c) as shown in the red bear count but this appears lower probability. Either way, we should be fast approaching a near term correction so buyers beware.
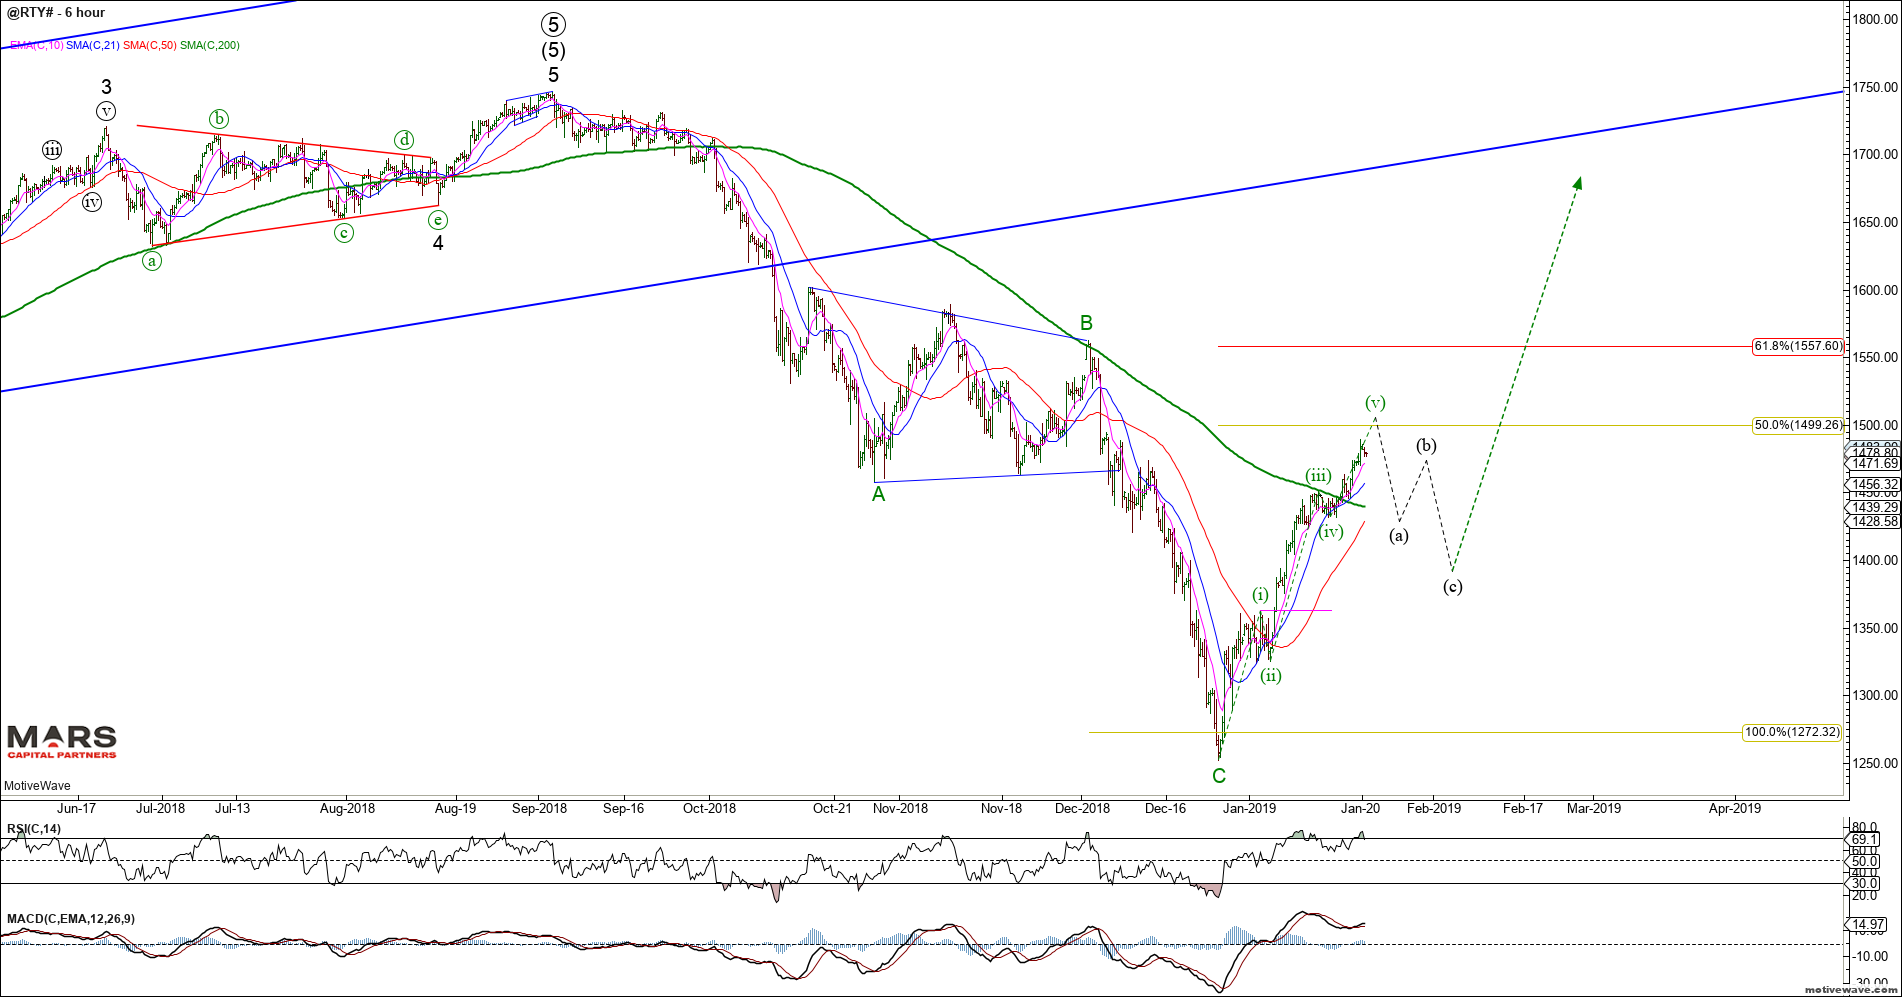
The Russell 2000 also declined in 3 waves of equality into structural support. While there are enough waves to complete the post 2009 impulsive rally, we must allow for the potential of another push towards new ATH’s (green count).
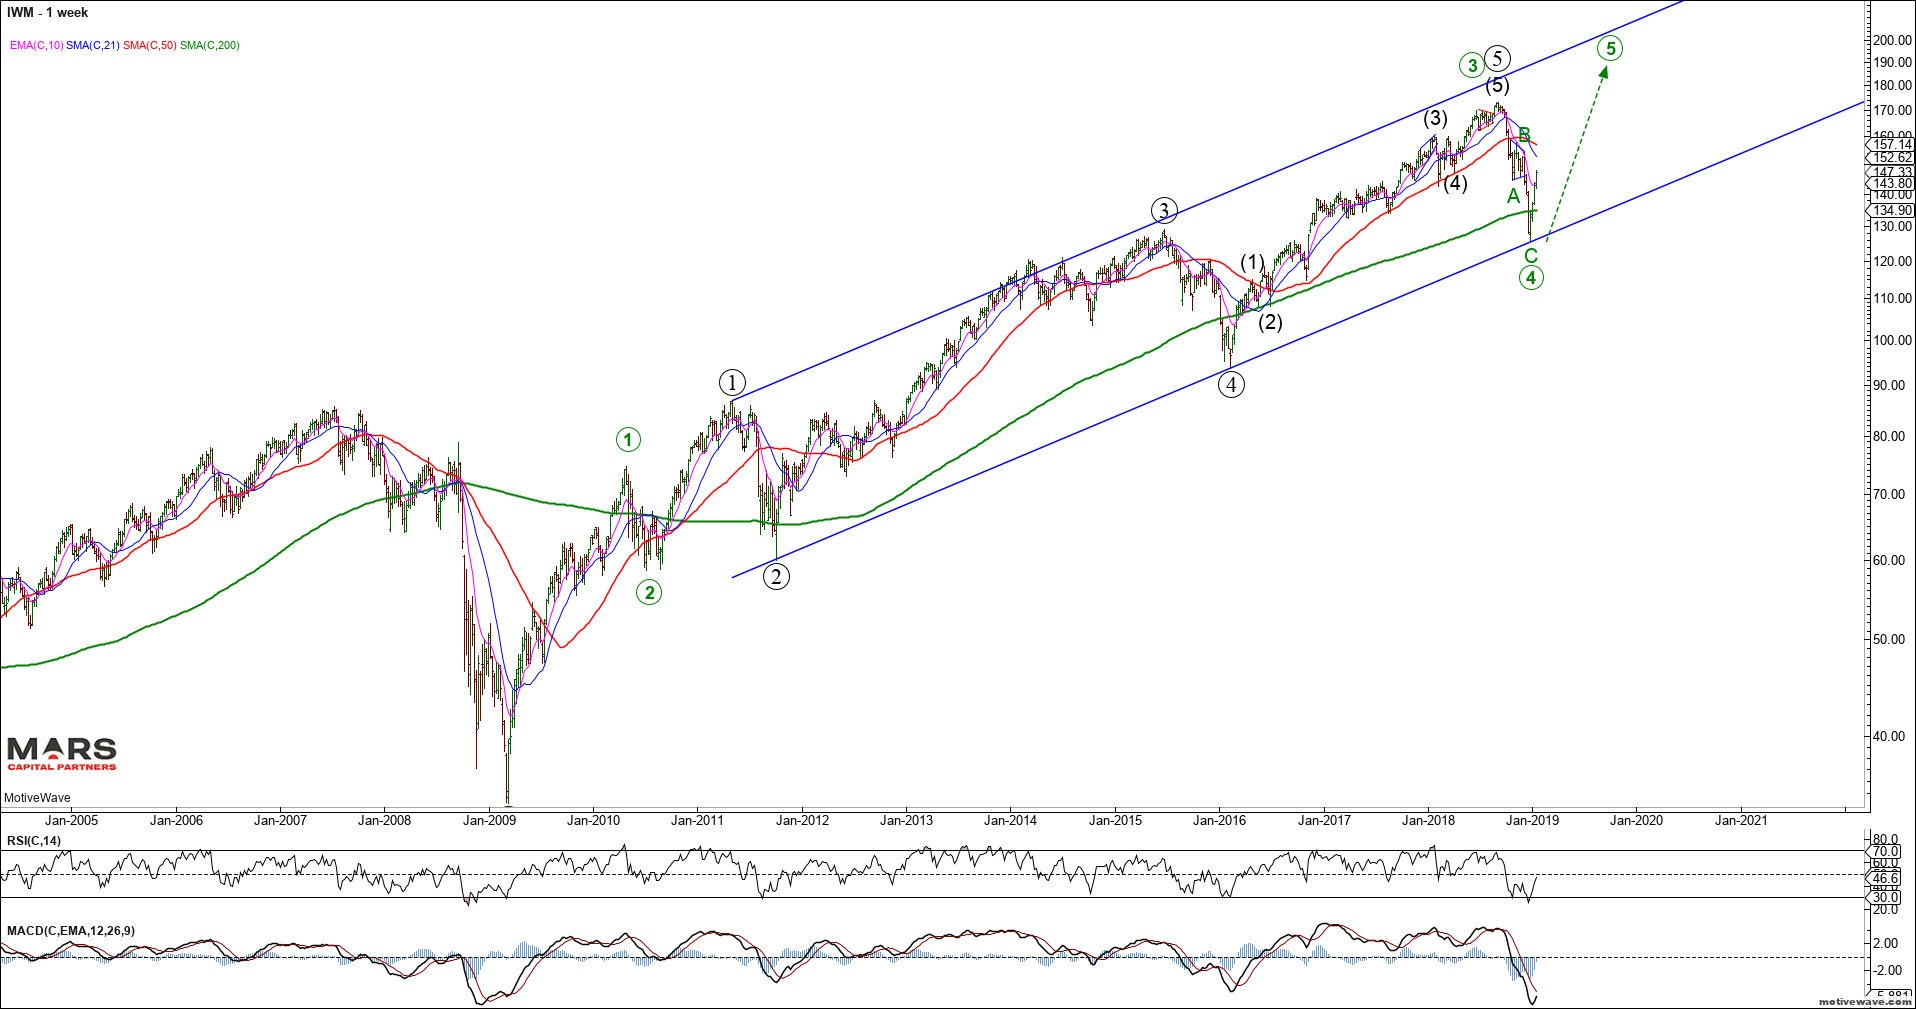
Near term, the RTY appears to be tracing out the final waves of an impulsive rally from the cycle lows. Near term resistance resides in the 1500 area. The impulsive nature of this rally suggests it is either wave 1 or A of a larger rally to retest the ATH’s once its corrective decline is complete.
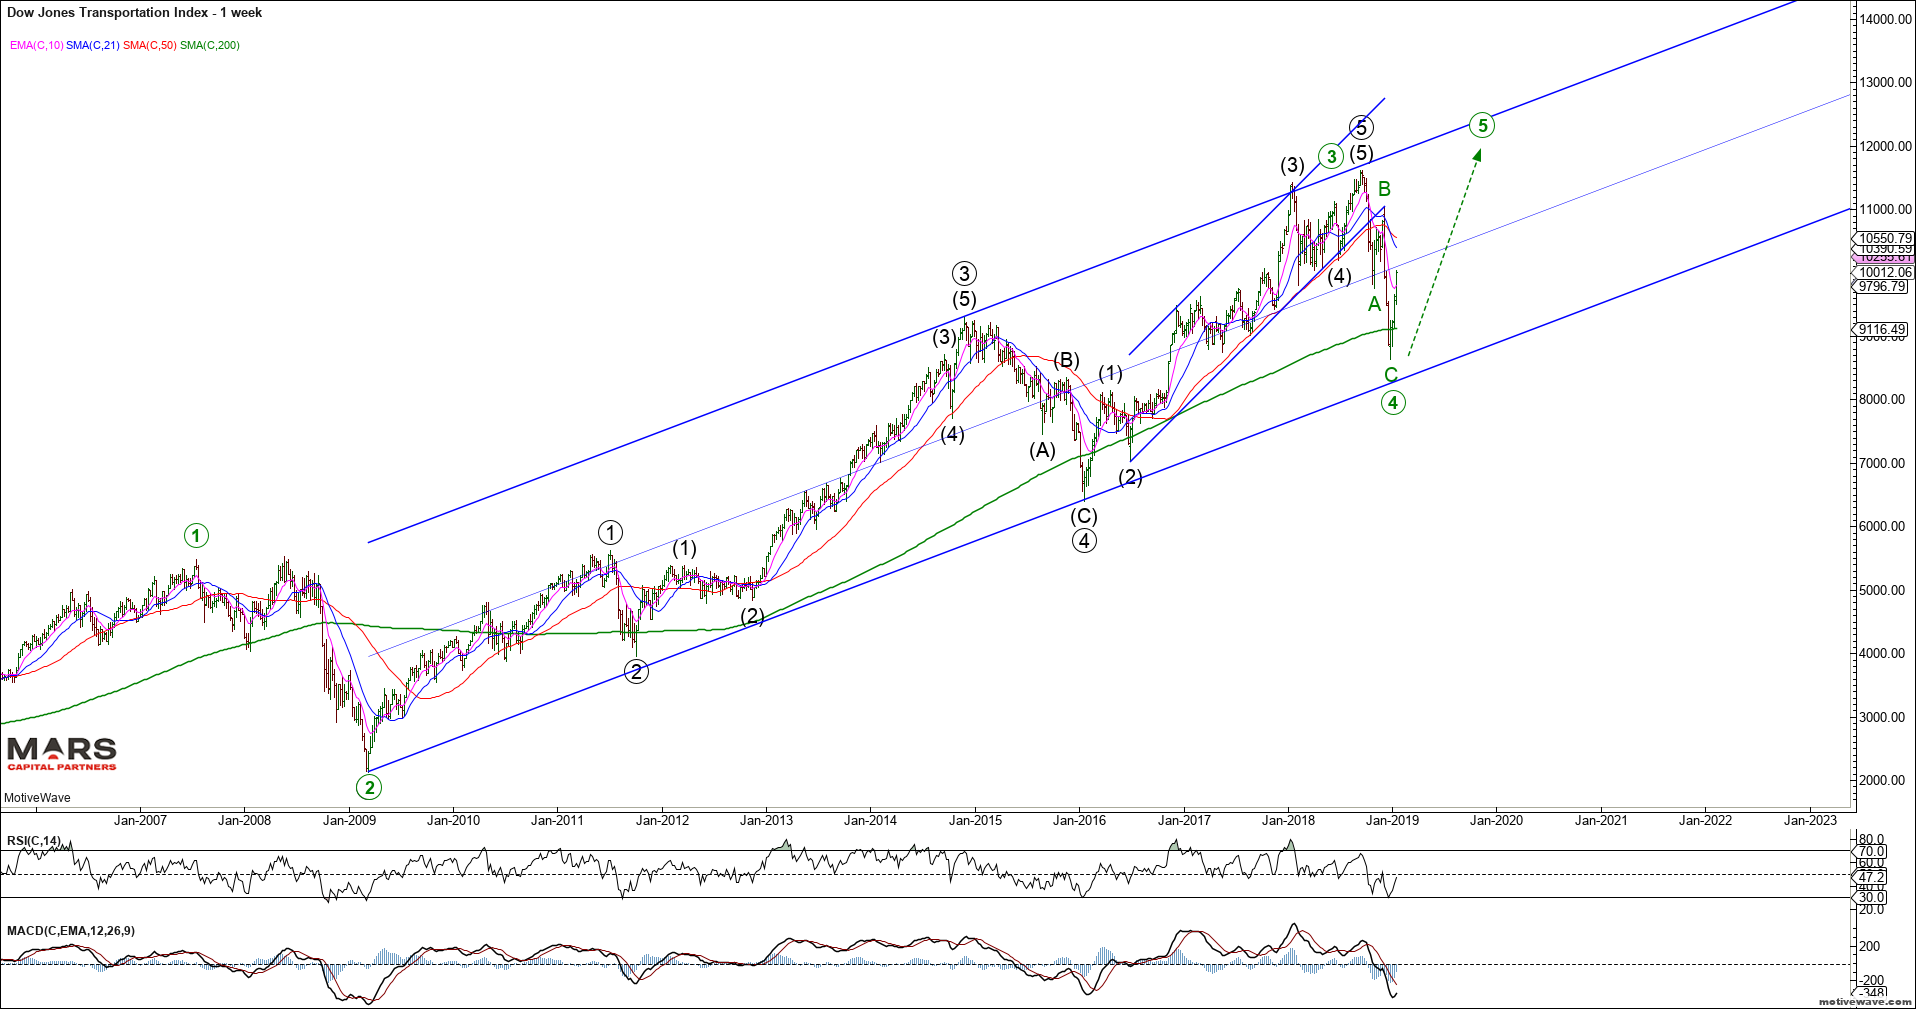
Another index we track closely is the Transports. It suffered a sharp 3 wave decline into structural support before rebounding strongly. Once again, given the corrective nature of the decline, we cannot discount the potential for new ATH’s as shown by the green count. This bullish count is likely invalidated below the December lows.
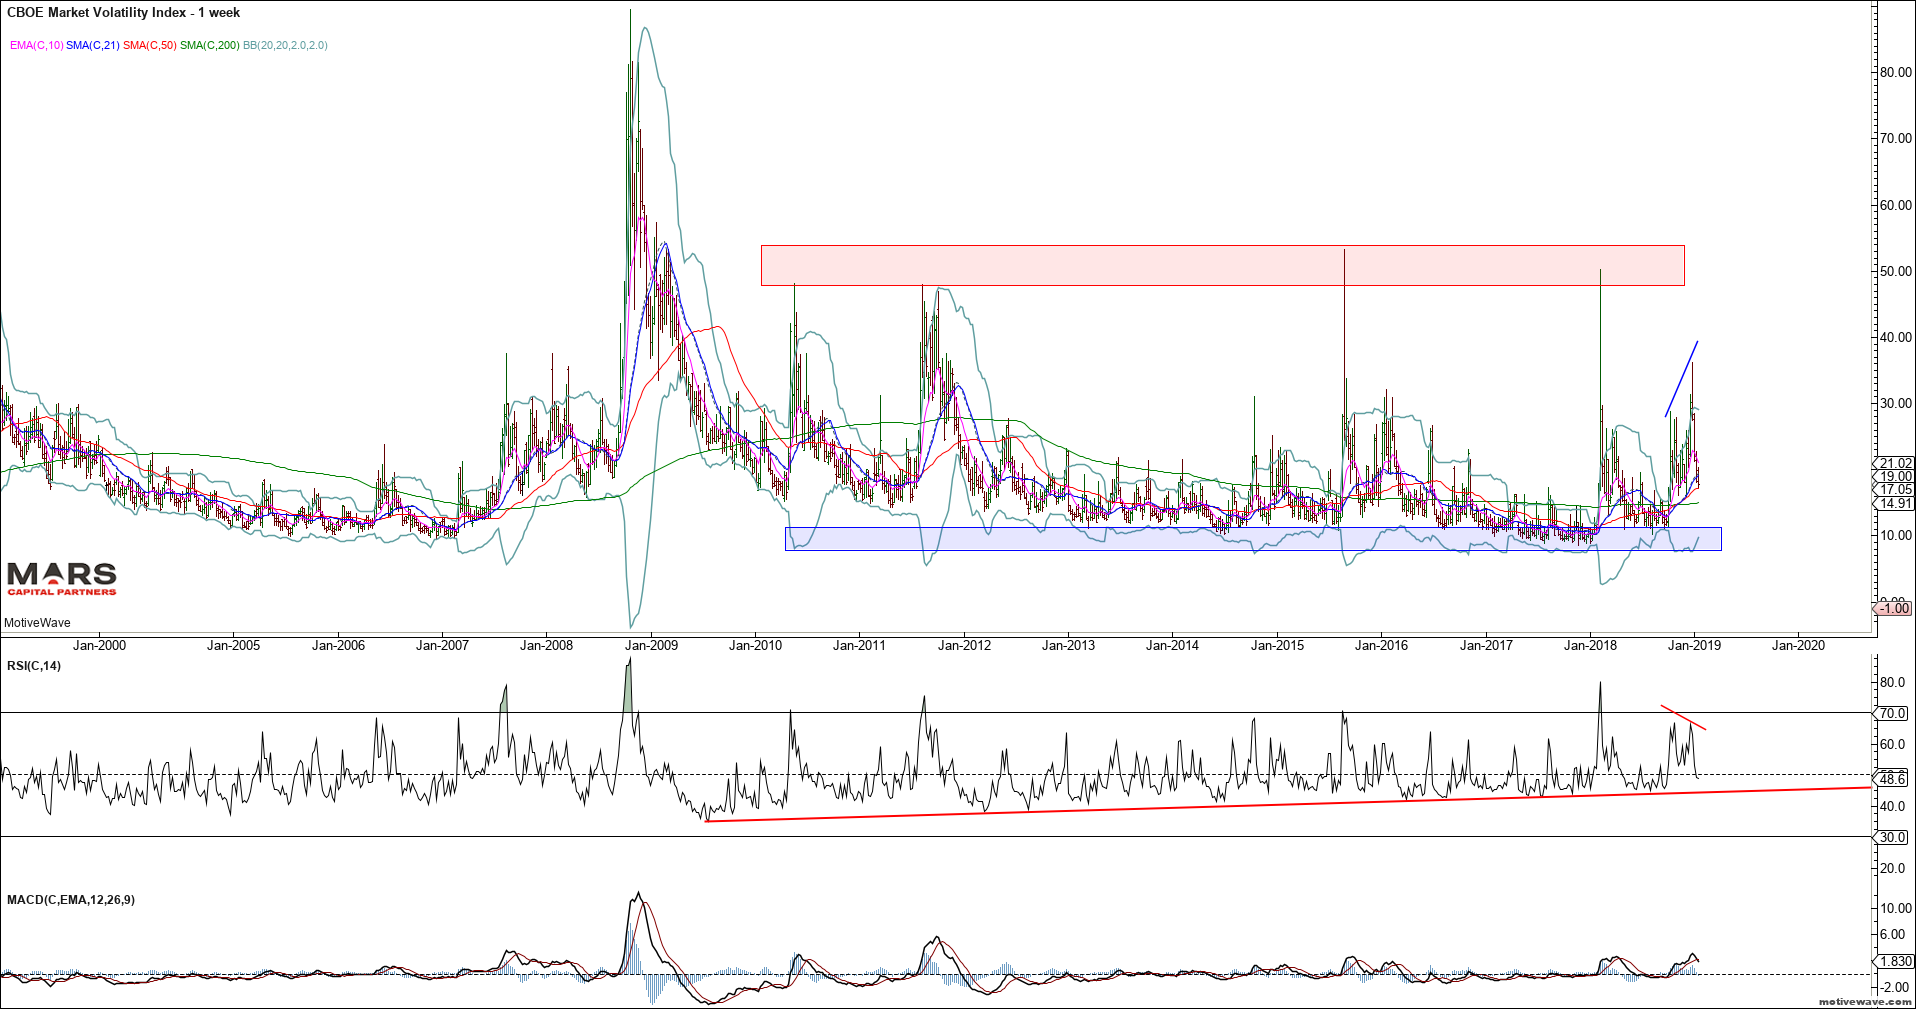
The VIX has been crushed since the Powell Pivot. Given the 3 wave nature of the most recent rally, it is likely that volatility continues to decline towards cycle lows.
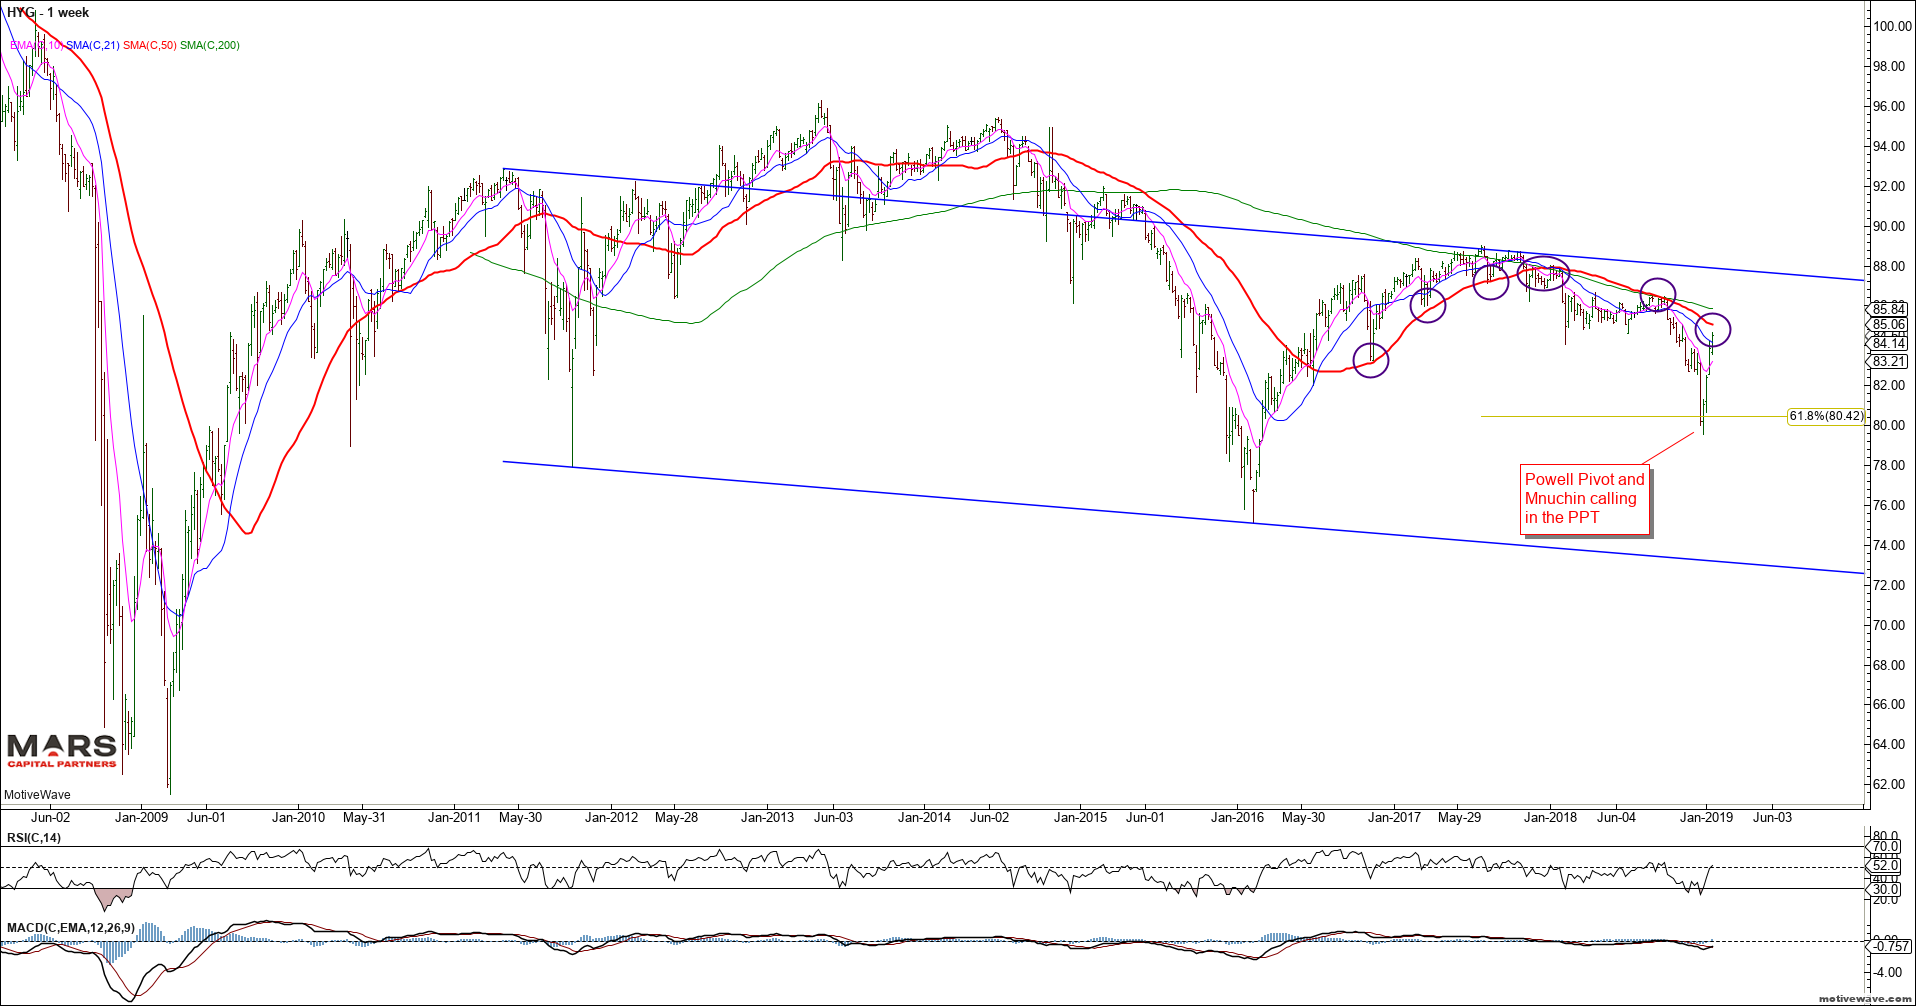
We have been tracking the HYG and JNK indices for risk sentiment. Note the sharp rally since the Powell Pivot – this warns us that investor’s “faith” in central banks remains undiminished. We are fast approaching the weekly 50 sma which has held all rally attempts – key near term inflection point but the rally off the lows appears impulsive (bullish).
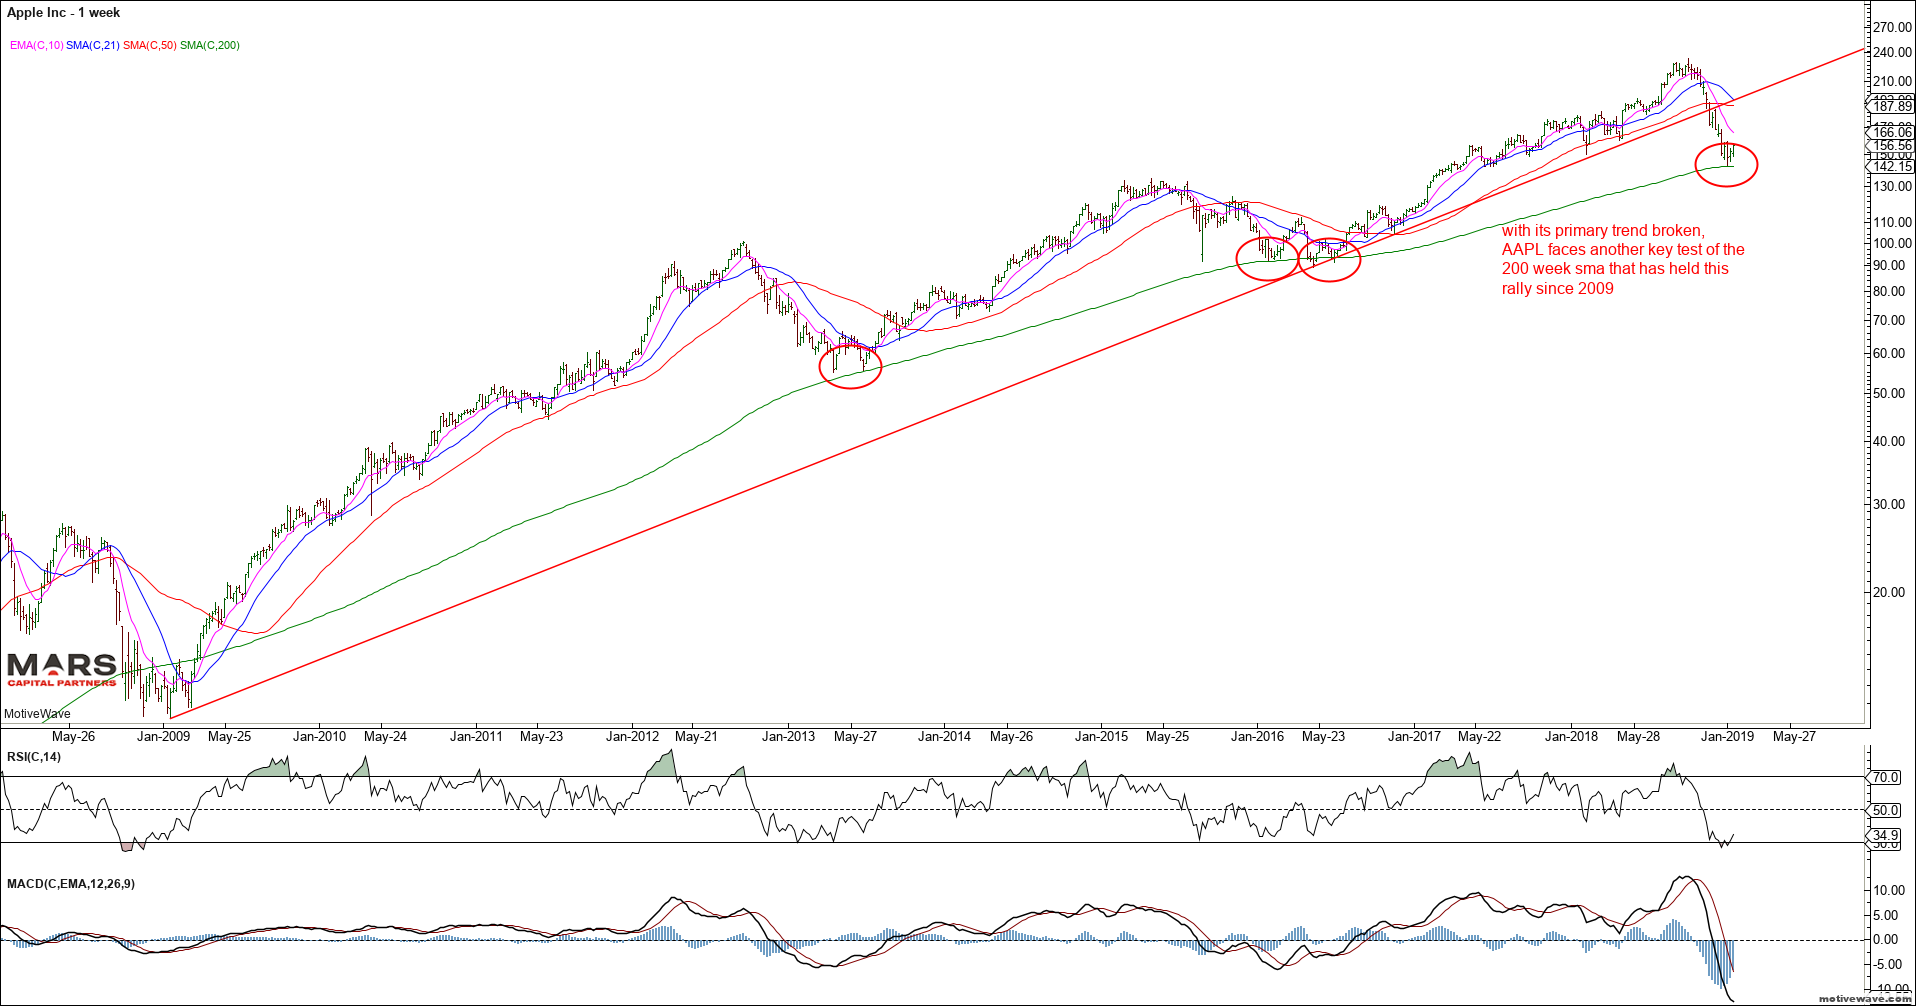
AAPL may provide an important tell for global growth – we have an impulsive (bearish) decline from the September highs that broke trend support but held its 200 week sma from where it is attempting to rotate higher. We should expect at least a counter-trend rally in AAPL here. A break below the December lows would be very bearish.
To the global equity markets and the ASX200 has two primary counts. Like the SPX, we have enough waves in place to complete 5 up from the 2009 lows and the decline appears impulsive into structural support. We are now entering the Fib retracement range from where the bears will need to make a stand. The bullish count is more complex and allows for a retest of the ATH’s before reversing sharply lower. This is not a time for complacency – the big picture risks far outweigh the upside potential for the Aussie stock market.
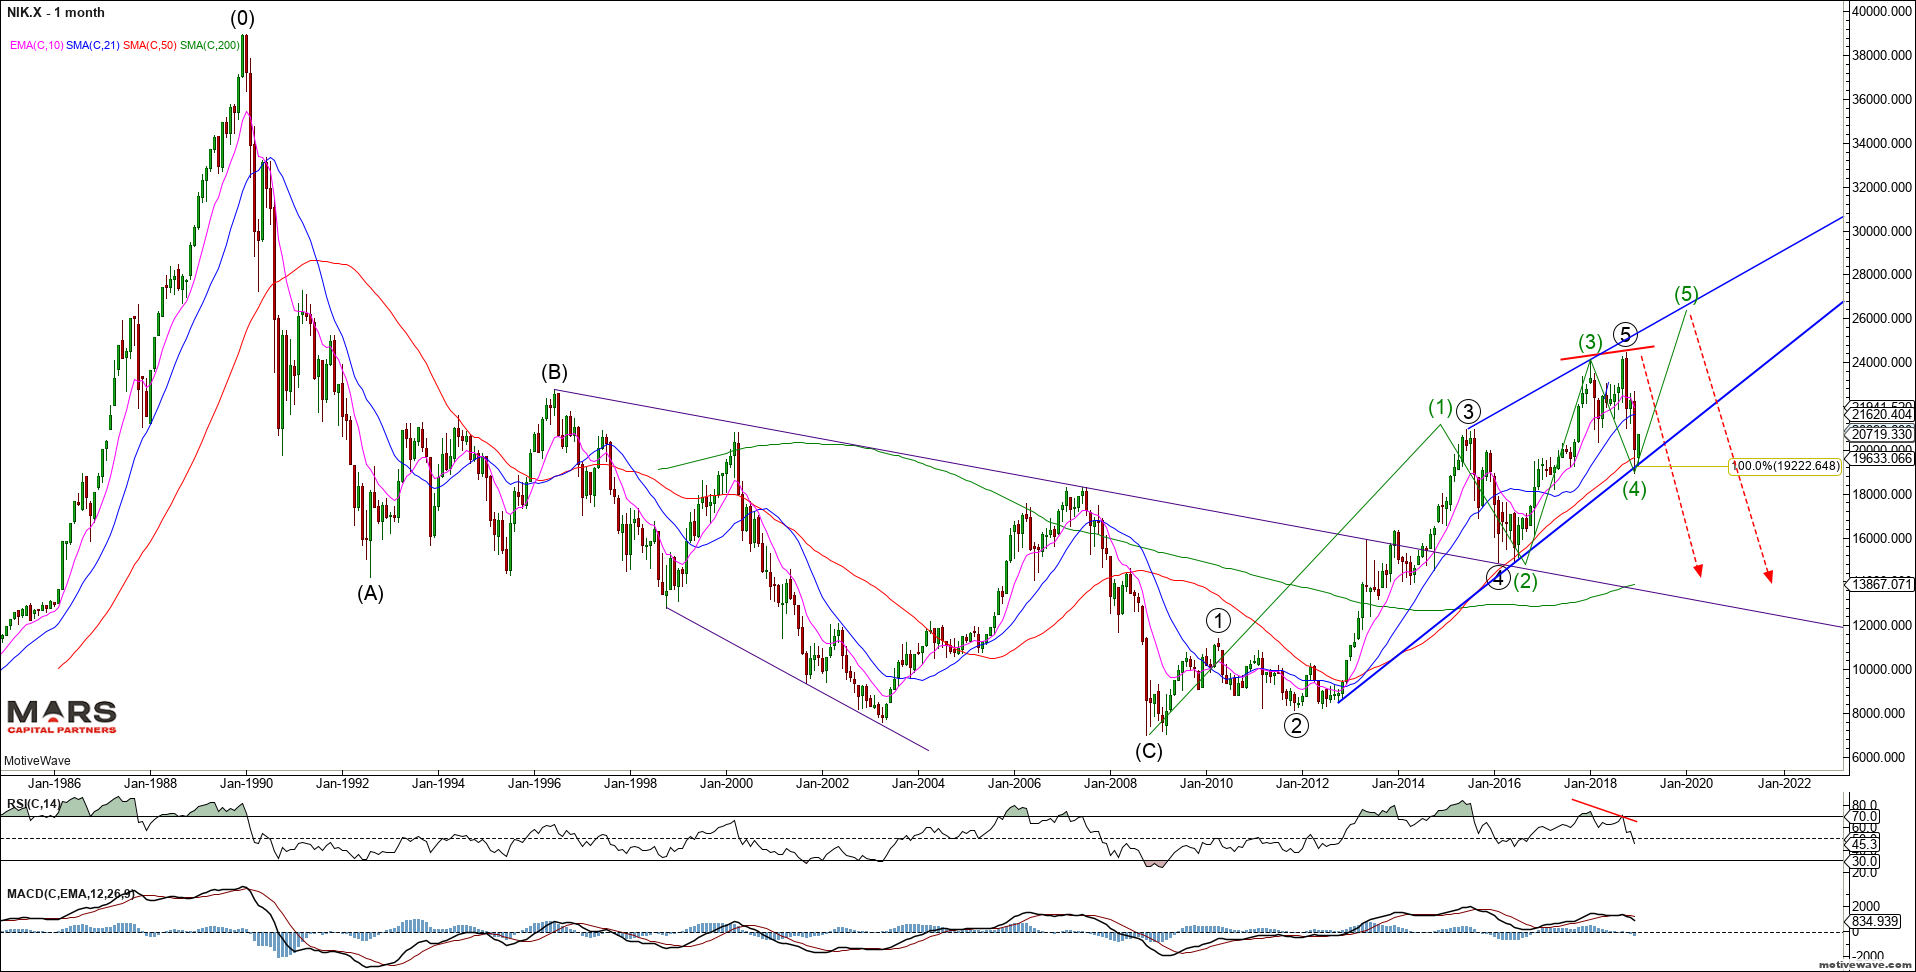
The Nikkei 225 appears to have completed 5 waves up from the 2009 lows. The decline from the highs is only in 3 waves of equality so far. While there is a small possibility of a push to marginal new highs, risks remain to the downside for the Japanese stock market.
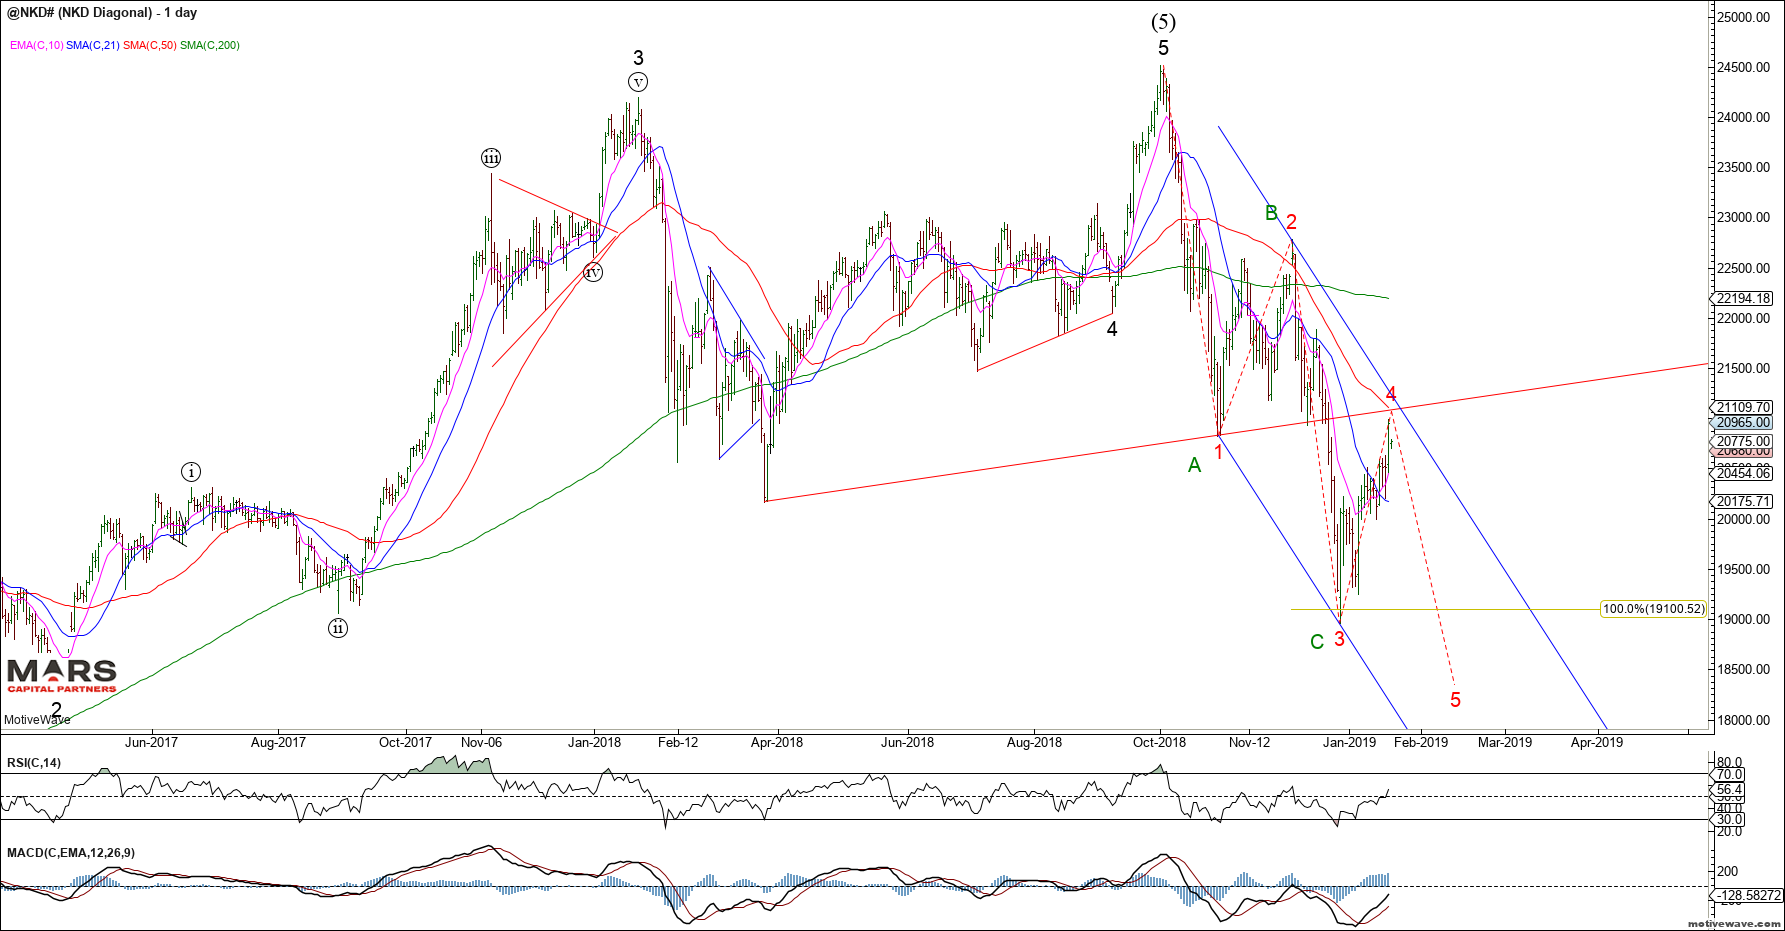
The NKD is currently backtesting its break of support and 50 day sma. So far the decline from the highs is a corrective 3 waves of equality and bears need to extend this down into 5 waves to avoid new highs. The price action is too choppy for clear near term direction.
The European markets also bounced off structural support. So far we only have 3 waves down from the highs and this needs to extend to 5 waves down for a bigger picture change in trend. The DAX has strong resistance in the 11400-500 area from where the bears will need to make a stand. Immediate trade back above 12000 would invalidate the impulsive bear count.
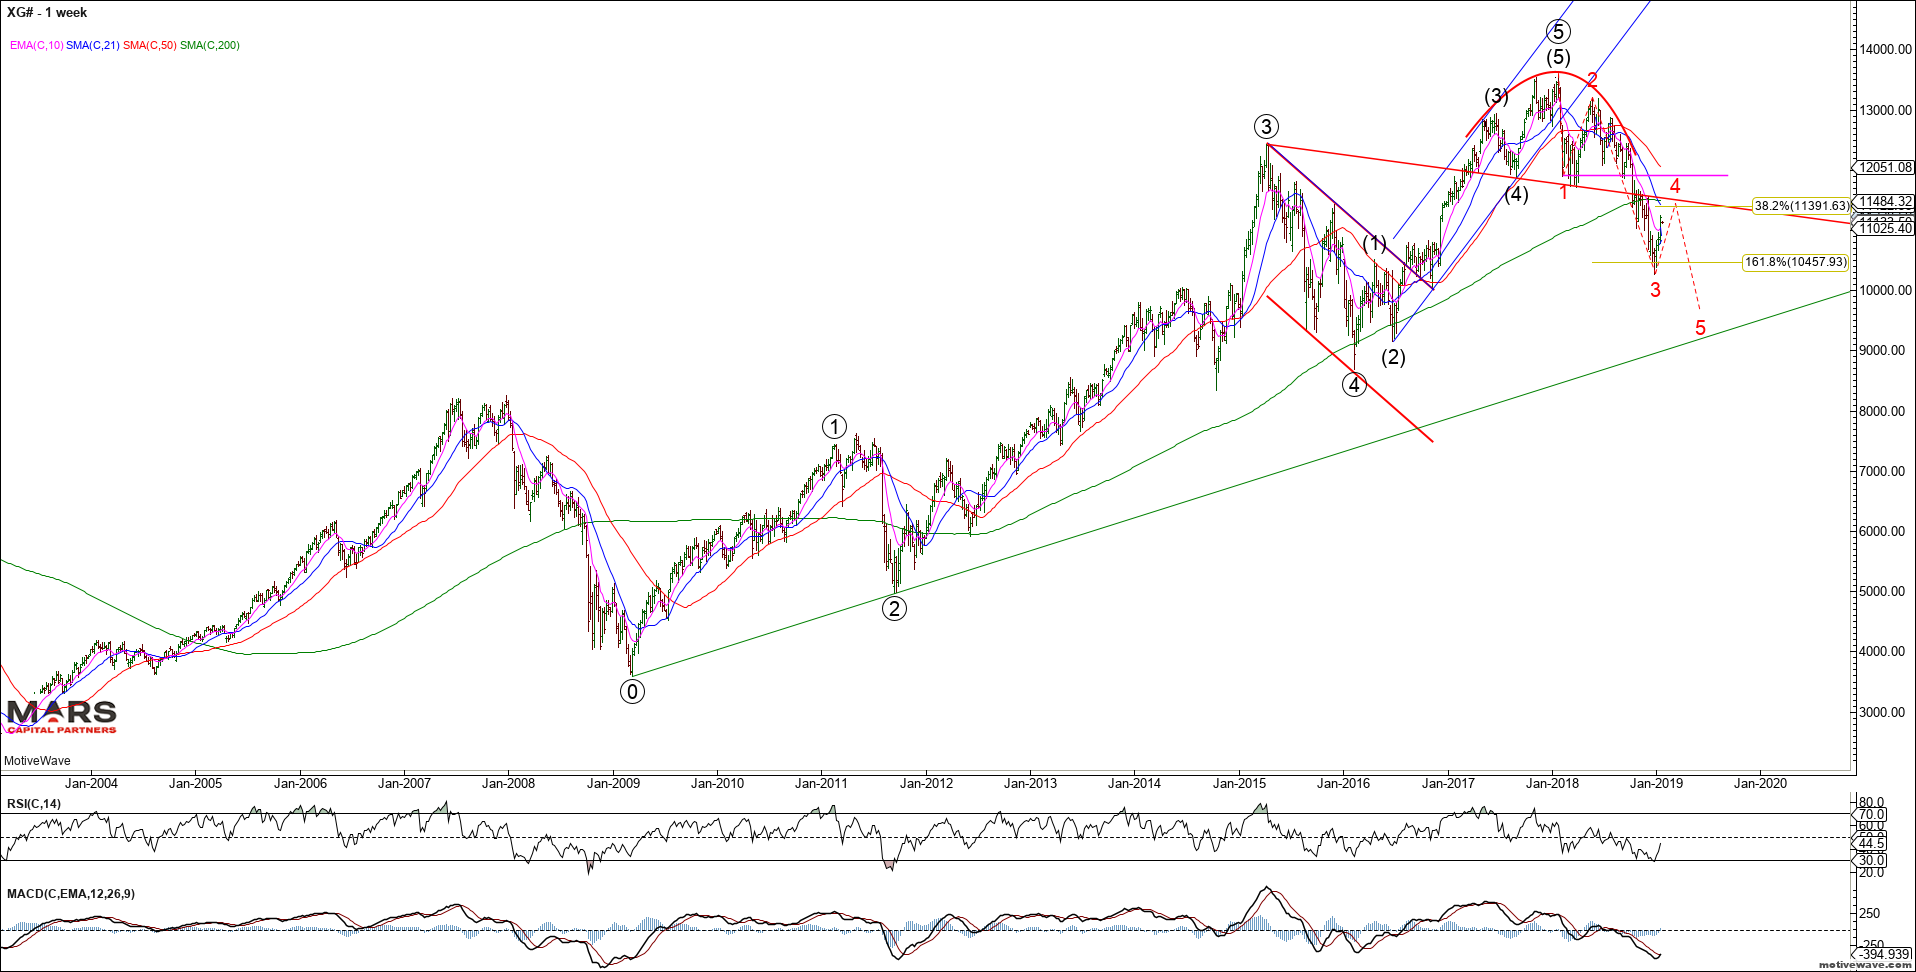
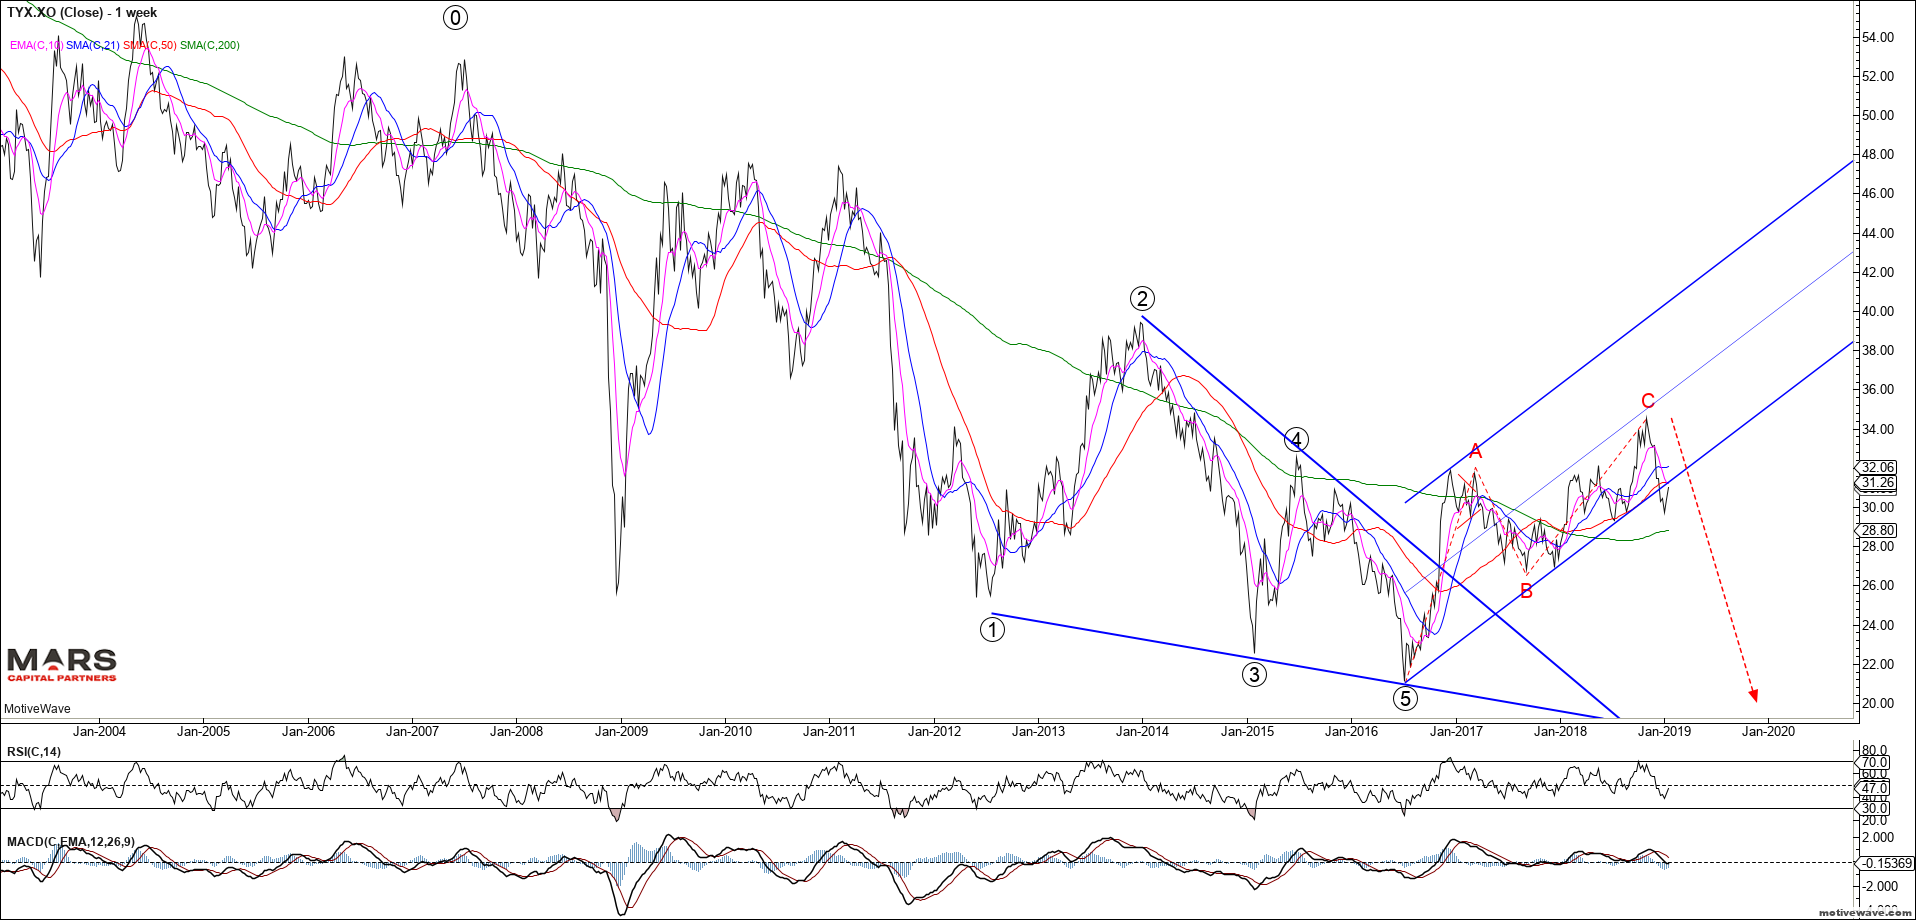
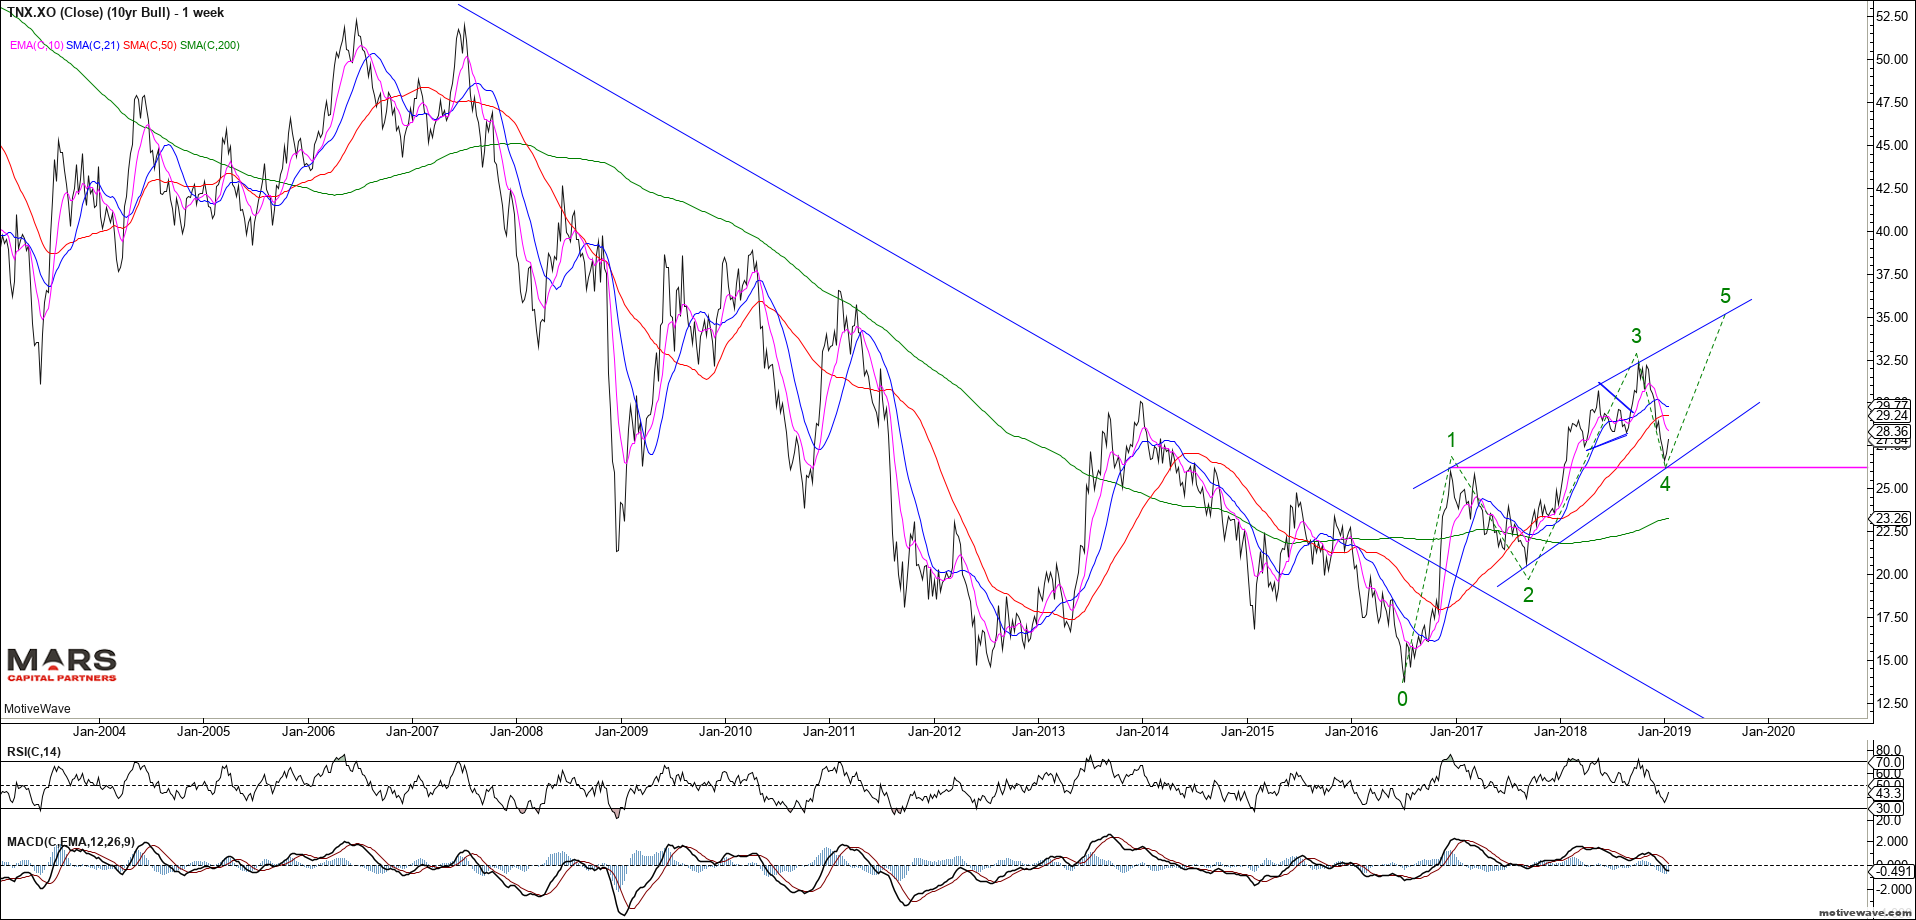
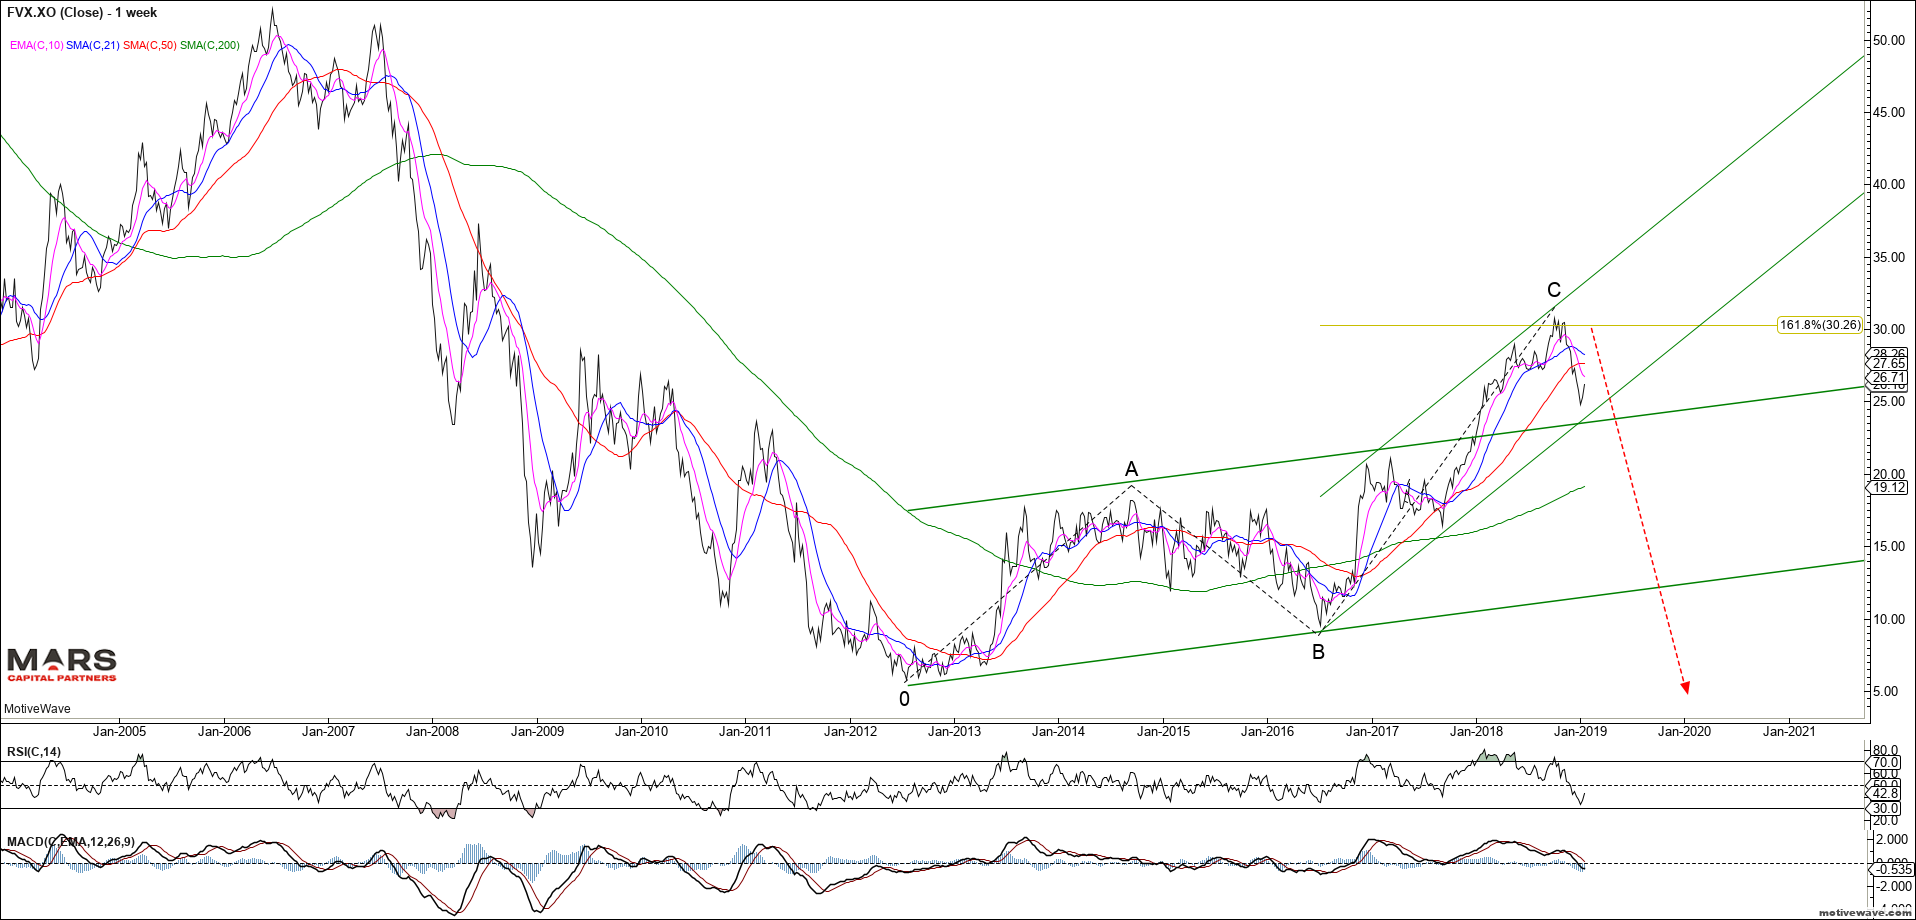
To the Bond markets and we are a very important inflection point. So far we have a corrective 3 wave rally in rates from the July 2016 lows across 10’s and 30’s. Rates need to extend higher immediately into 5 waves up above the November highs to invalidate the bearish potential. I have highlighted both bull and bear cases for reference. Due to the impulsive nature of the recent decline from the highs, the probability is that rates are likely going to new lows consistent with the deflationary outlook. We are bearish rates (bullish bonds) until proven otherwise by a rally above the November highs.
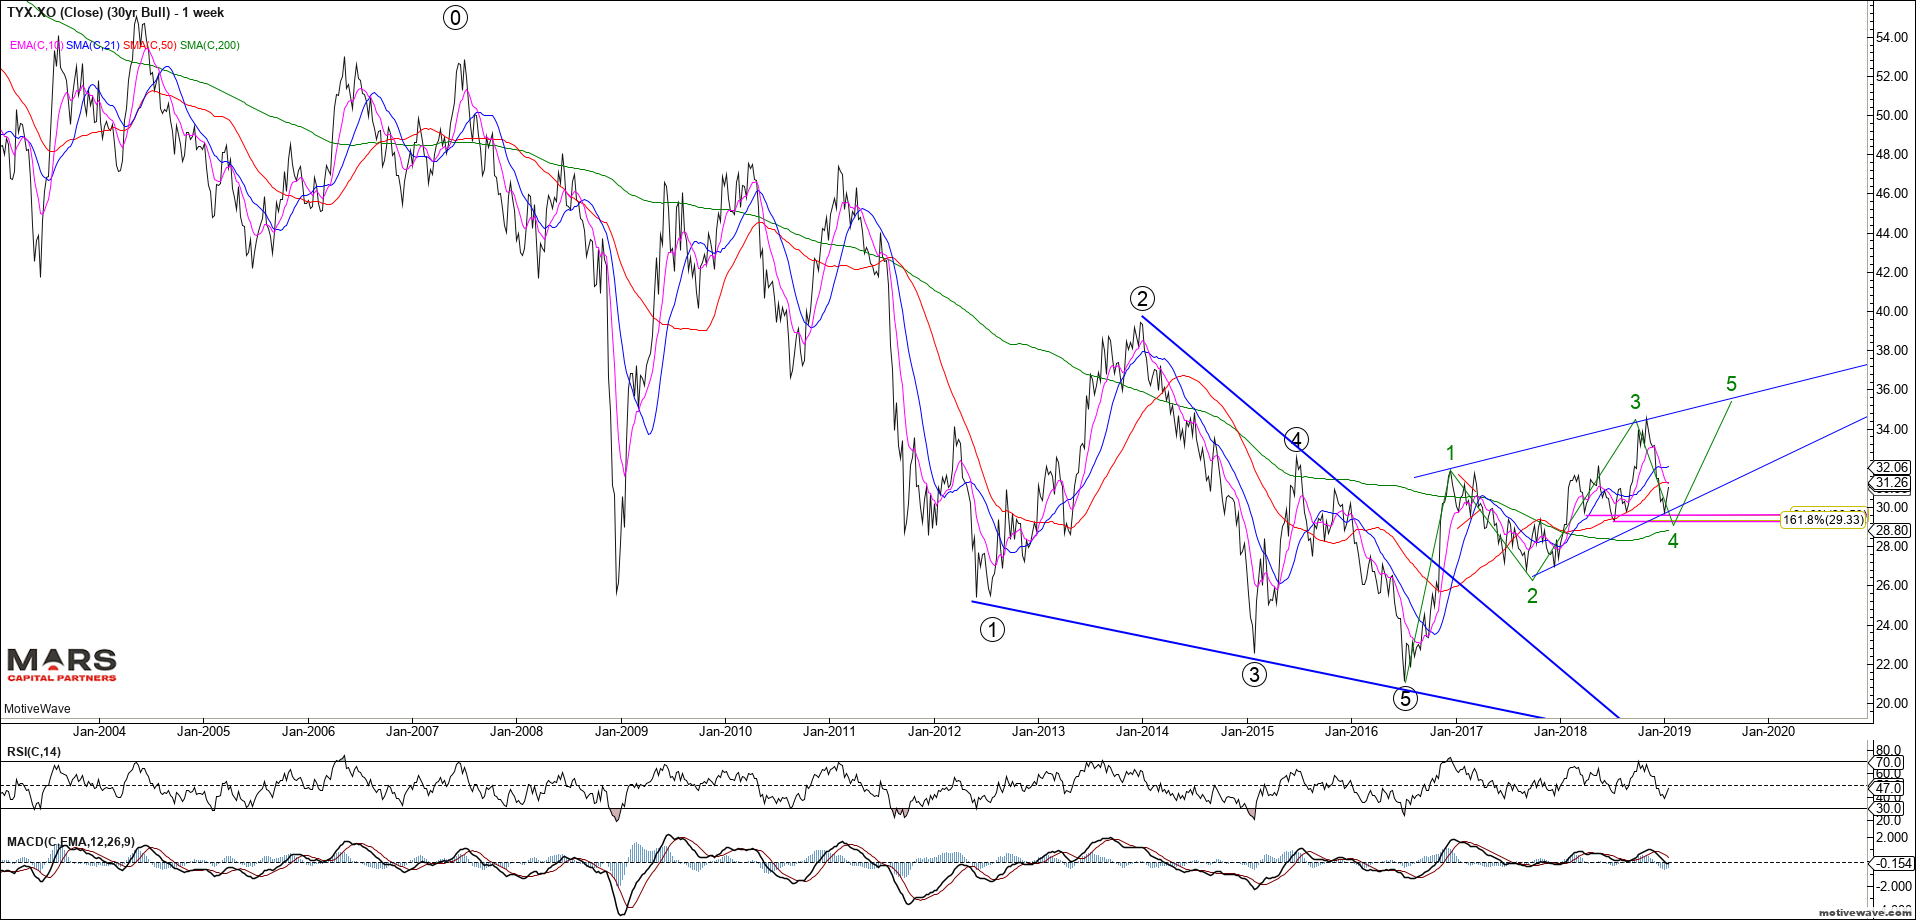
The 30yr highlights the muted rally from the September 2017 lows and impulsive decline from the wave C highs consistent with a more bearish outlook.
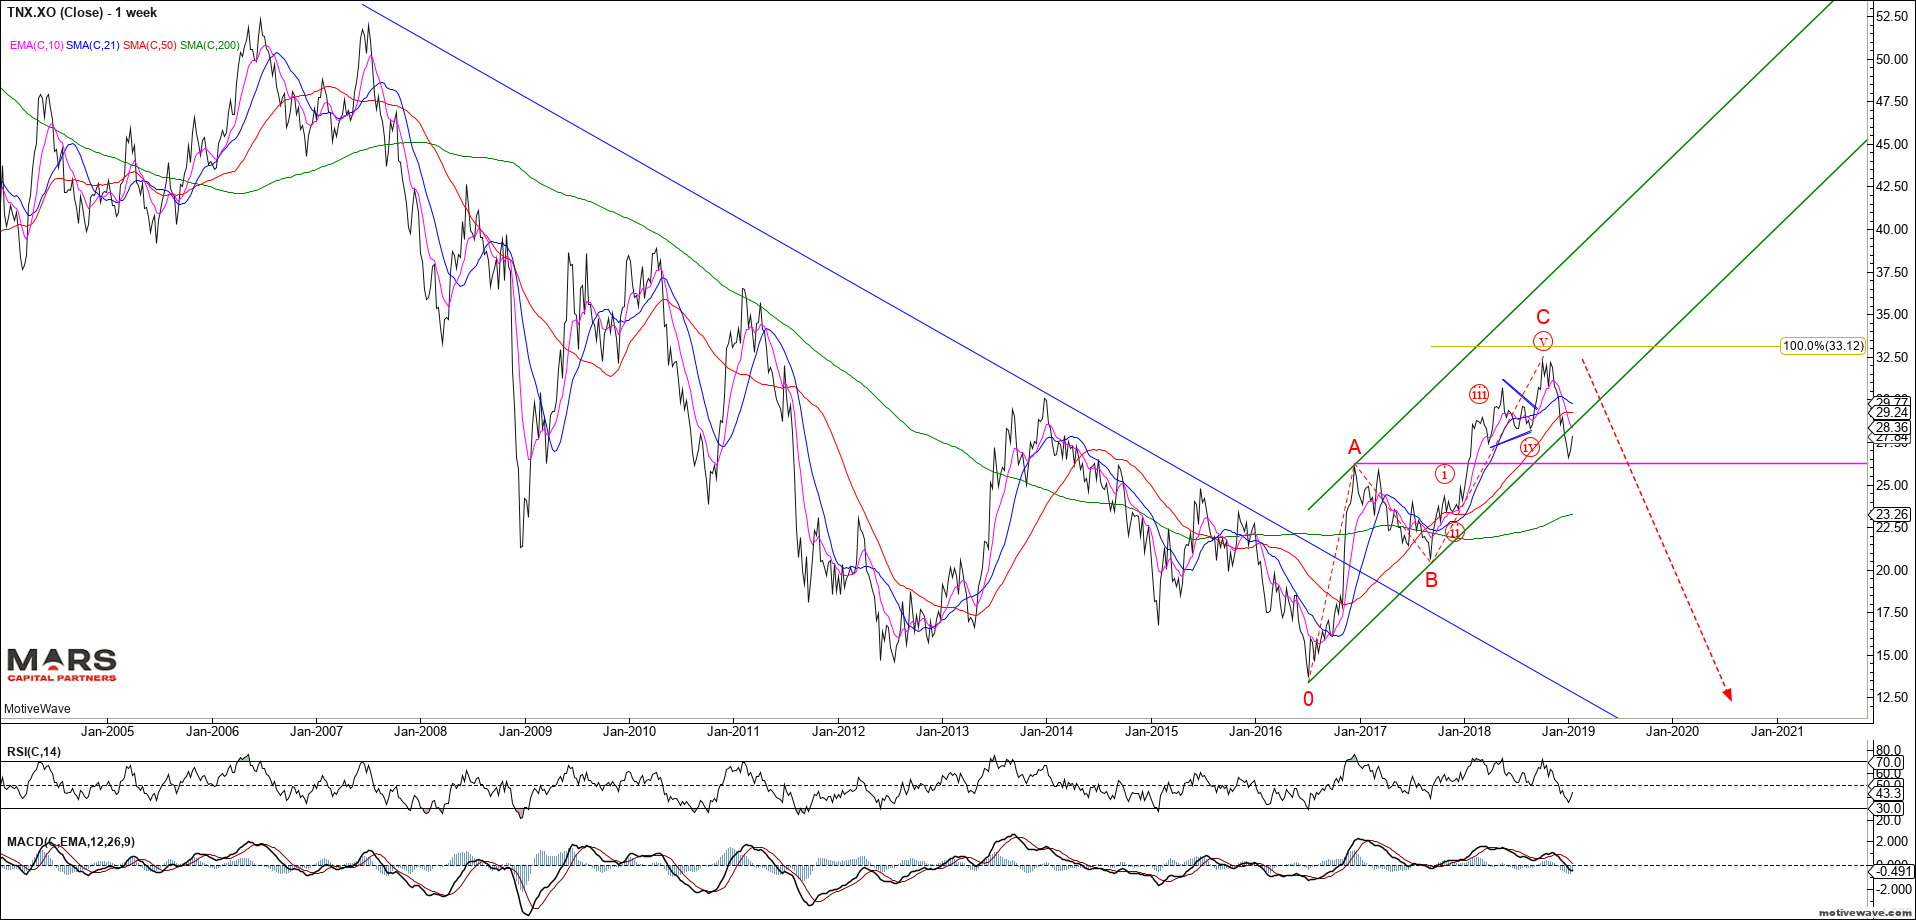
The 10yr shows the same potential wave counts with 3 waves up of equality from the July 2016 lows. A strong close below 2.60 would be consistent with the more bearish rates outlook. The bearish count is wrong at new cycle highs which would indicate the bigger picture trend had turned UP for the long term.
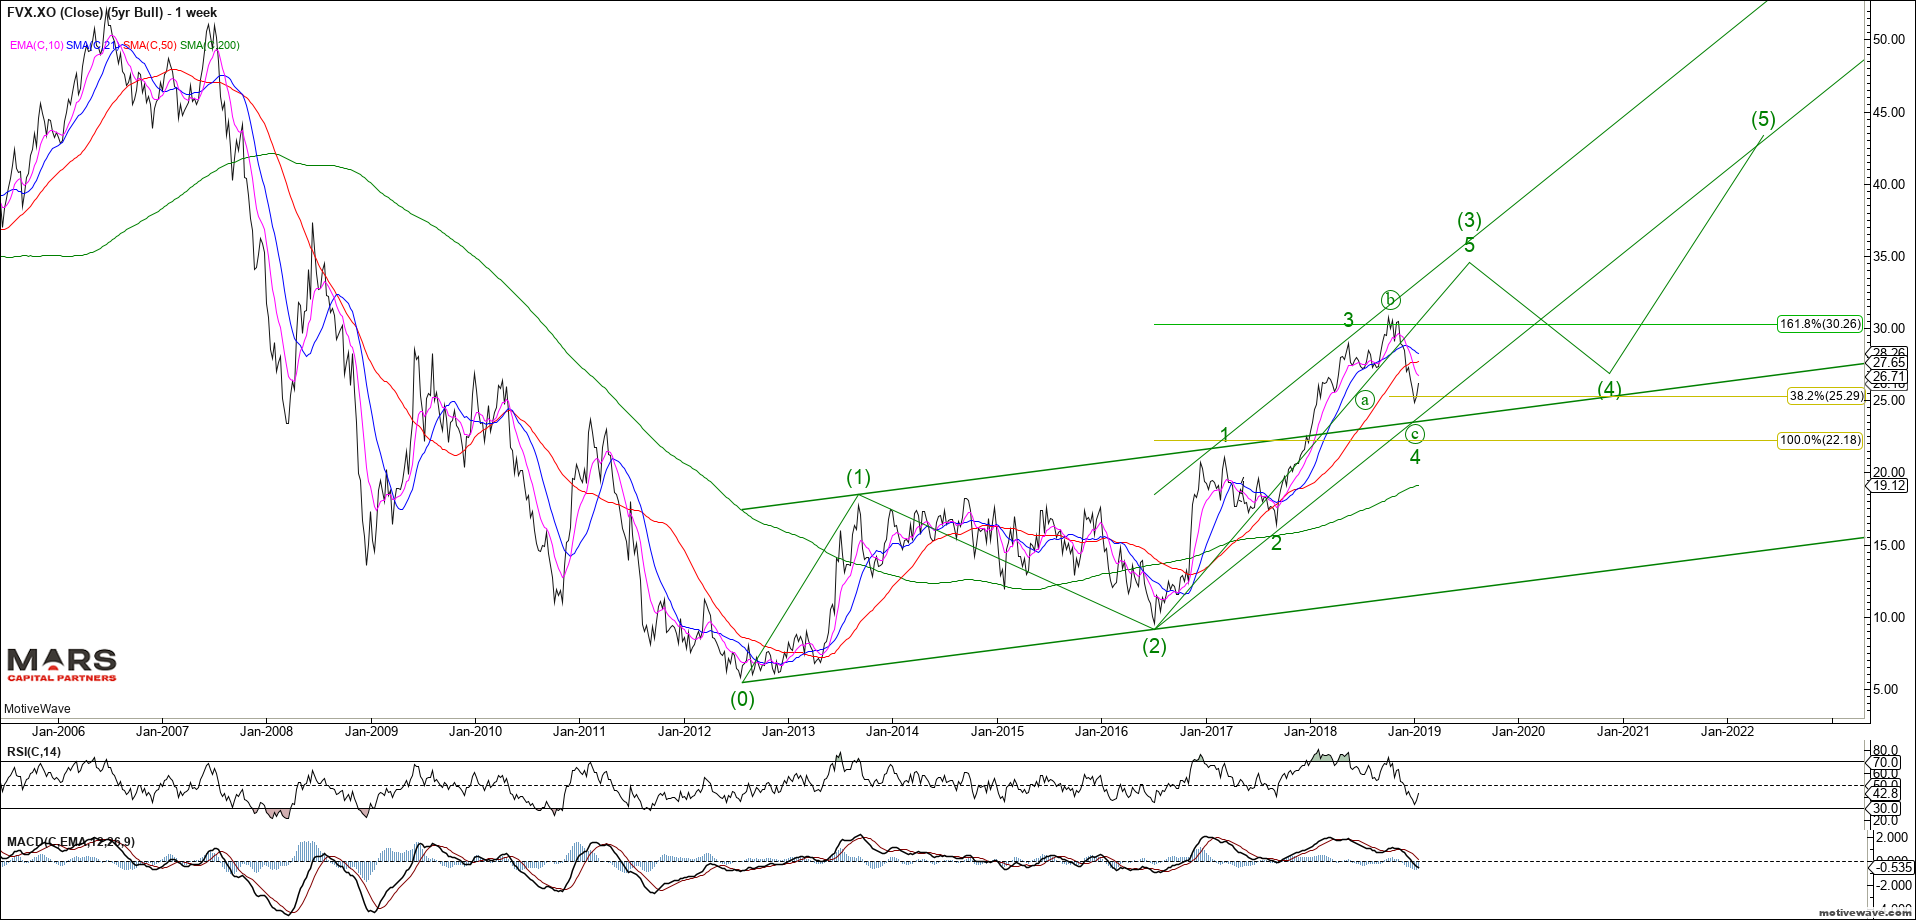
The 5yr is more complicated as the rally in rates failed at our 161.8% Fib extension followed by an impulsive decline. Rate Bears have control while we remain below the September highs.
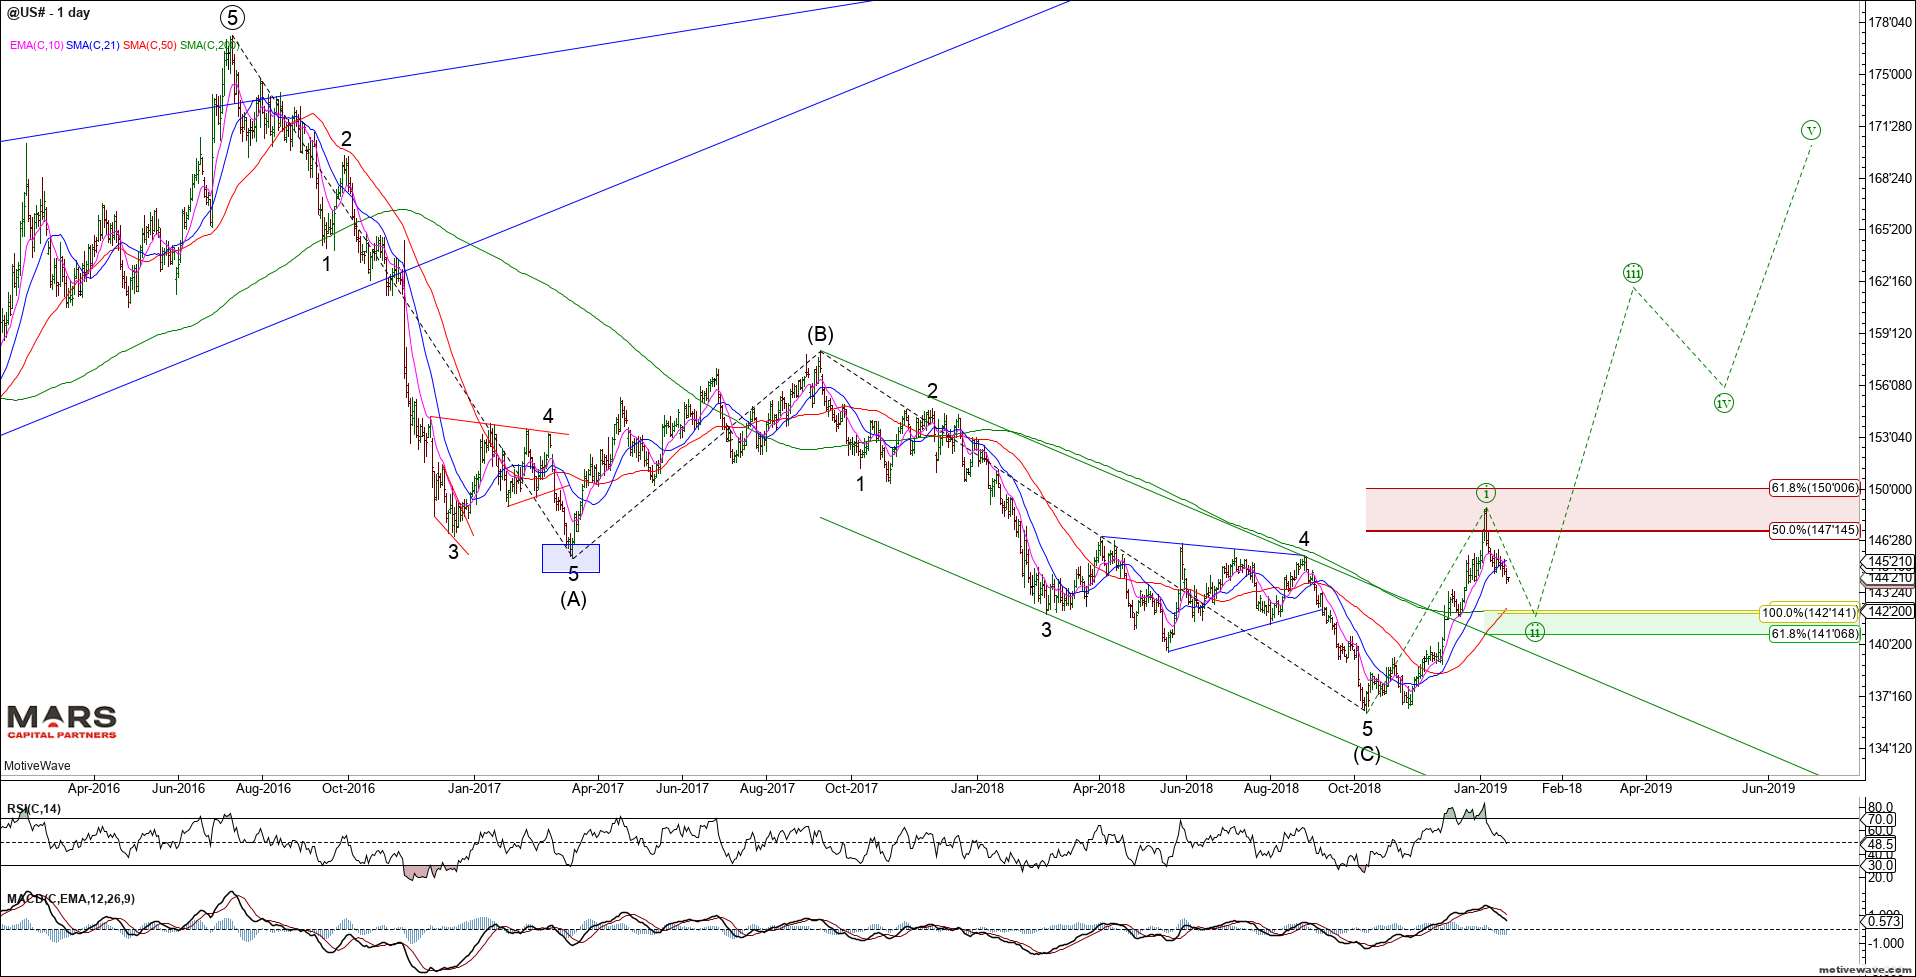
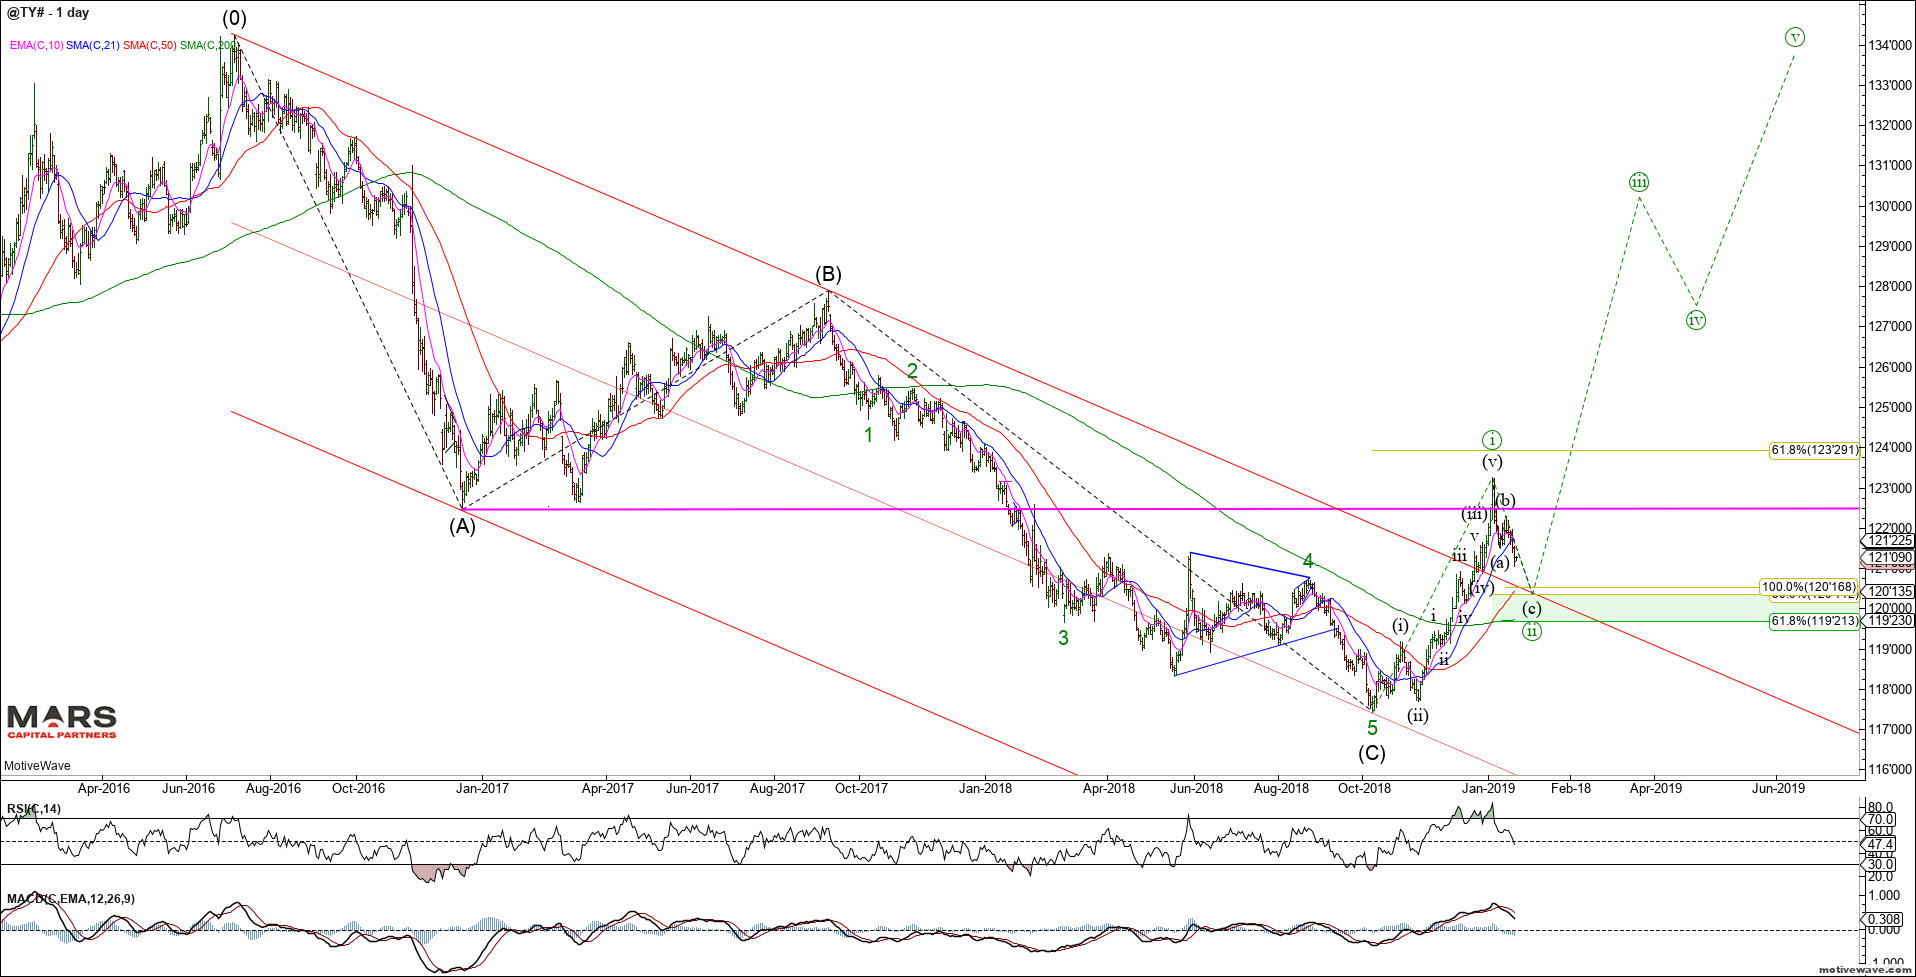
The bond futures tell the same story. The ZB shows a corrective 3 waves down from the ATH’s. This structure remains very bullish bonds while the October cycle lows hold. Ideal buying levels are closer towards 141-142’20 against cycle lows.
The ZN (TY) shows the same structure with 3 waves down from ATH’s and an impulsive rally from the lows. This implies that the bigger picture trend is up for bonds with support in the 119’23-120’15 area. Trade below the October lows would invalidate the bearish count.
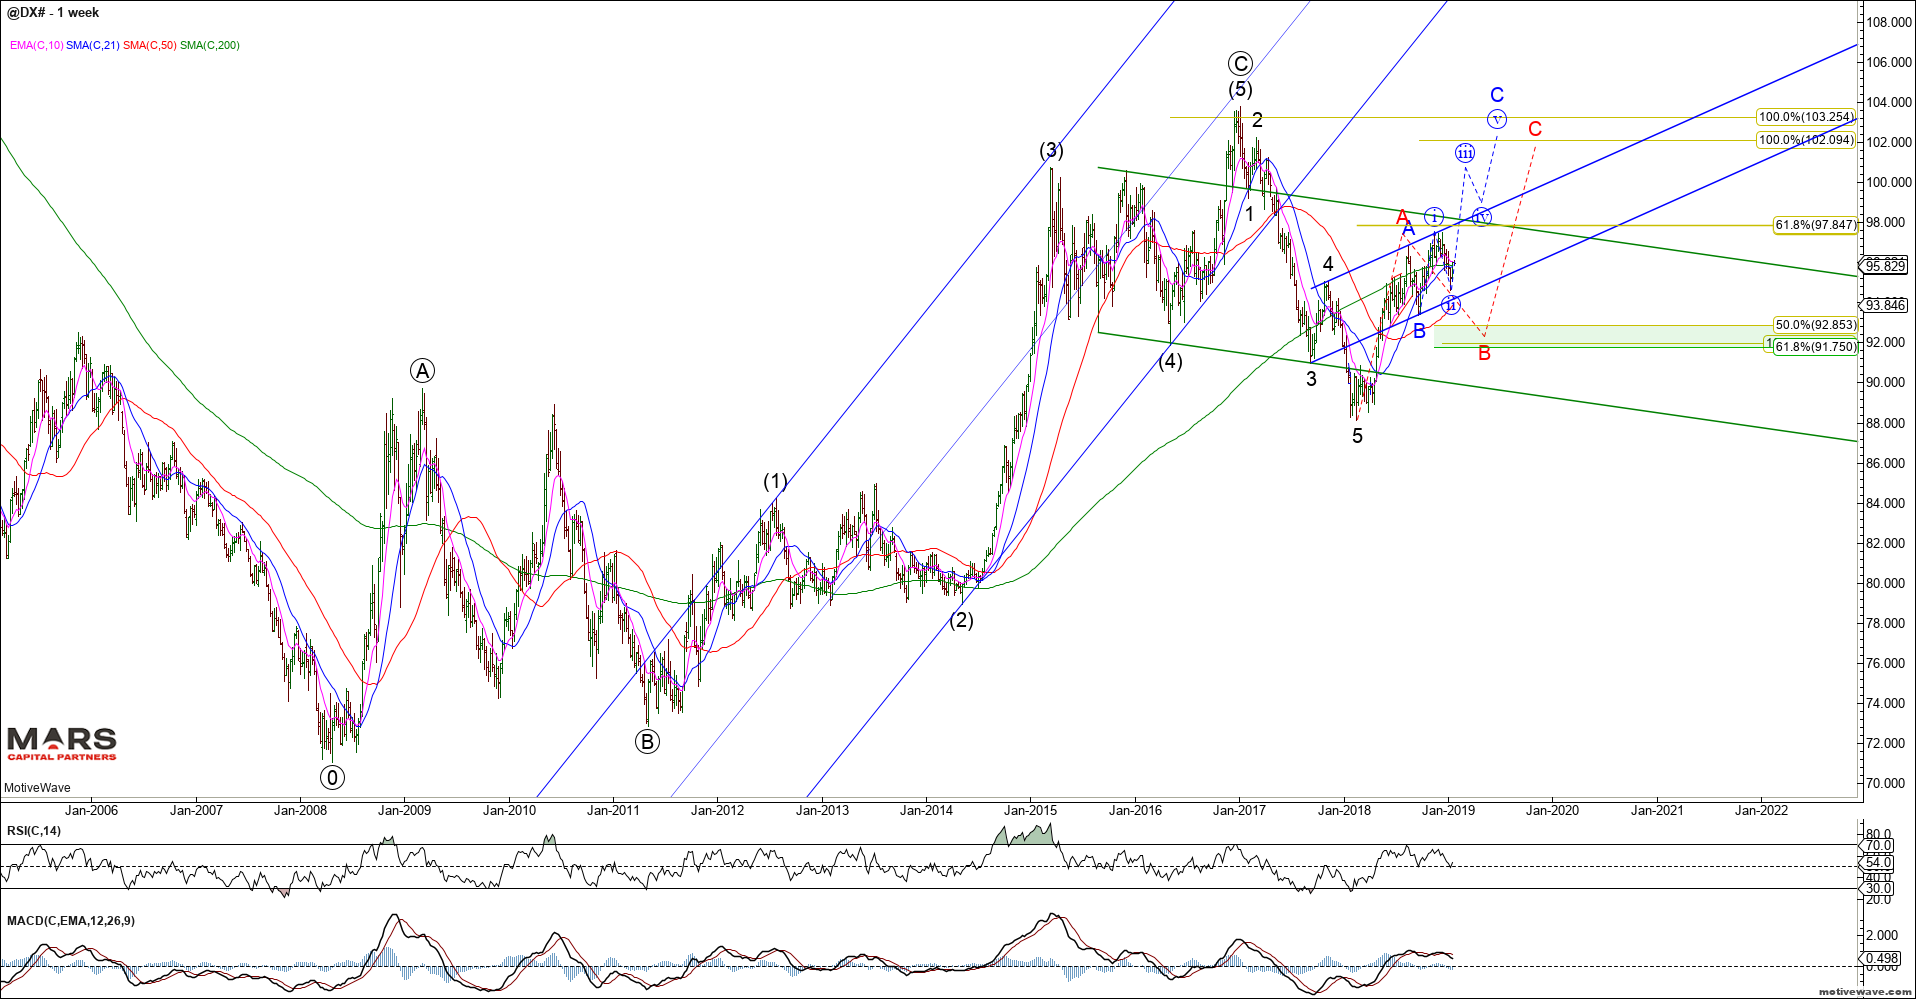
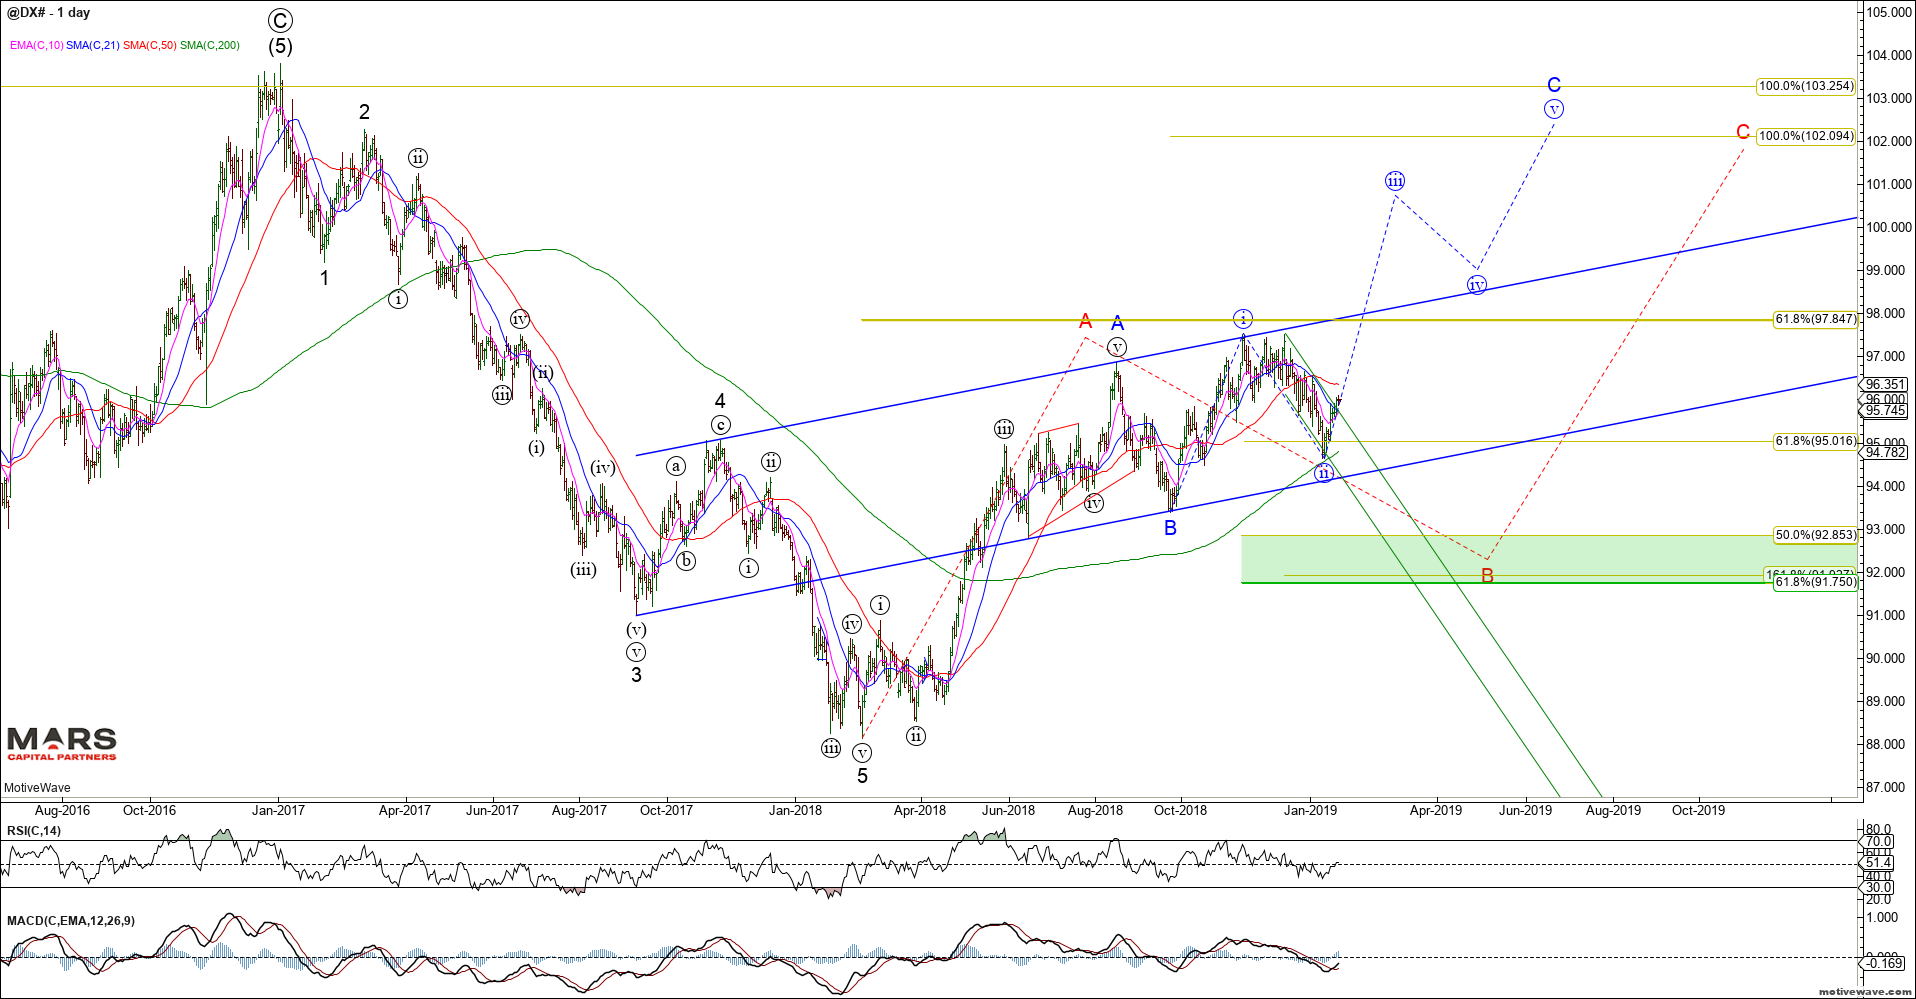
To the FX markets and the US dollar strength continues. We remain bullish the DXY looking for a retest of the 2017 highs. The question is whether we rally immediately while holding recent wave (ii) lows (blue count) or we need a deeper correction towards the 92-93 area (red count) before the wave C higher can reassert itself.
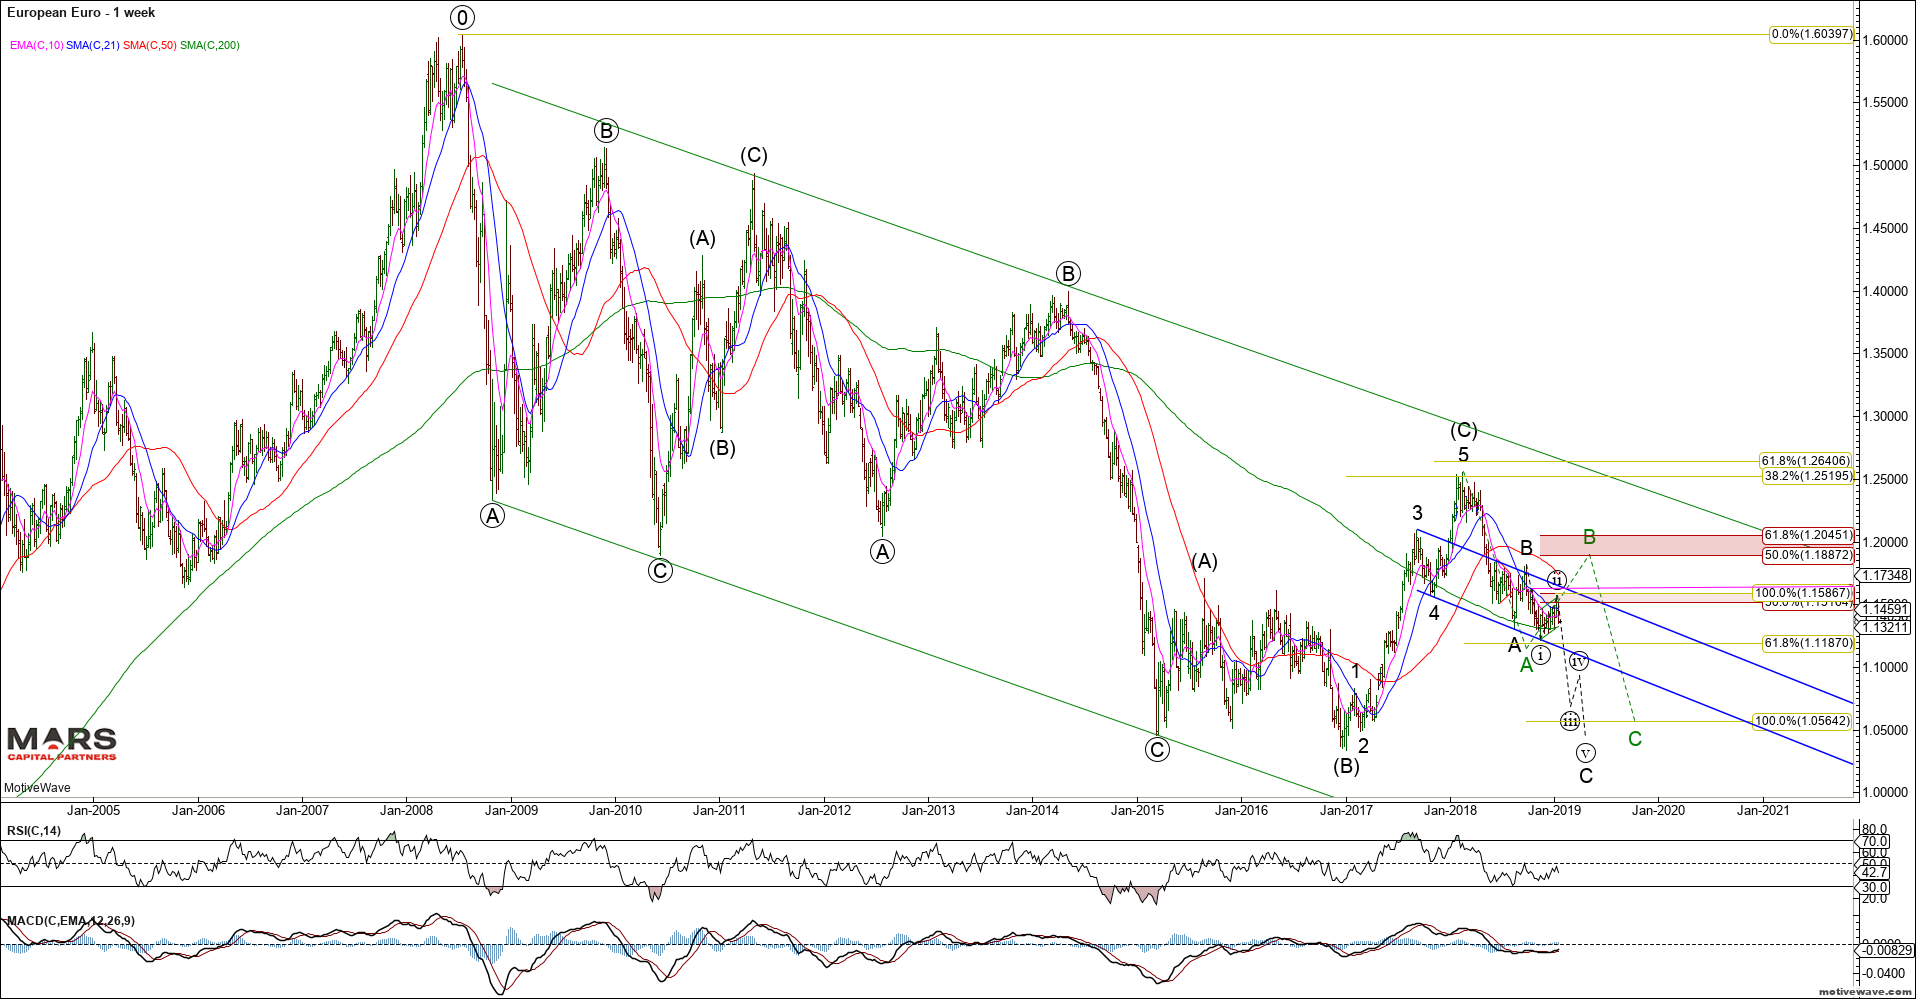
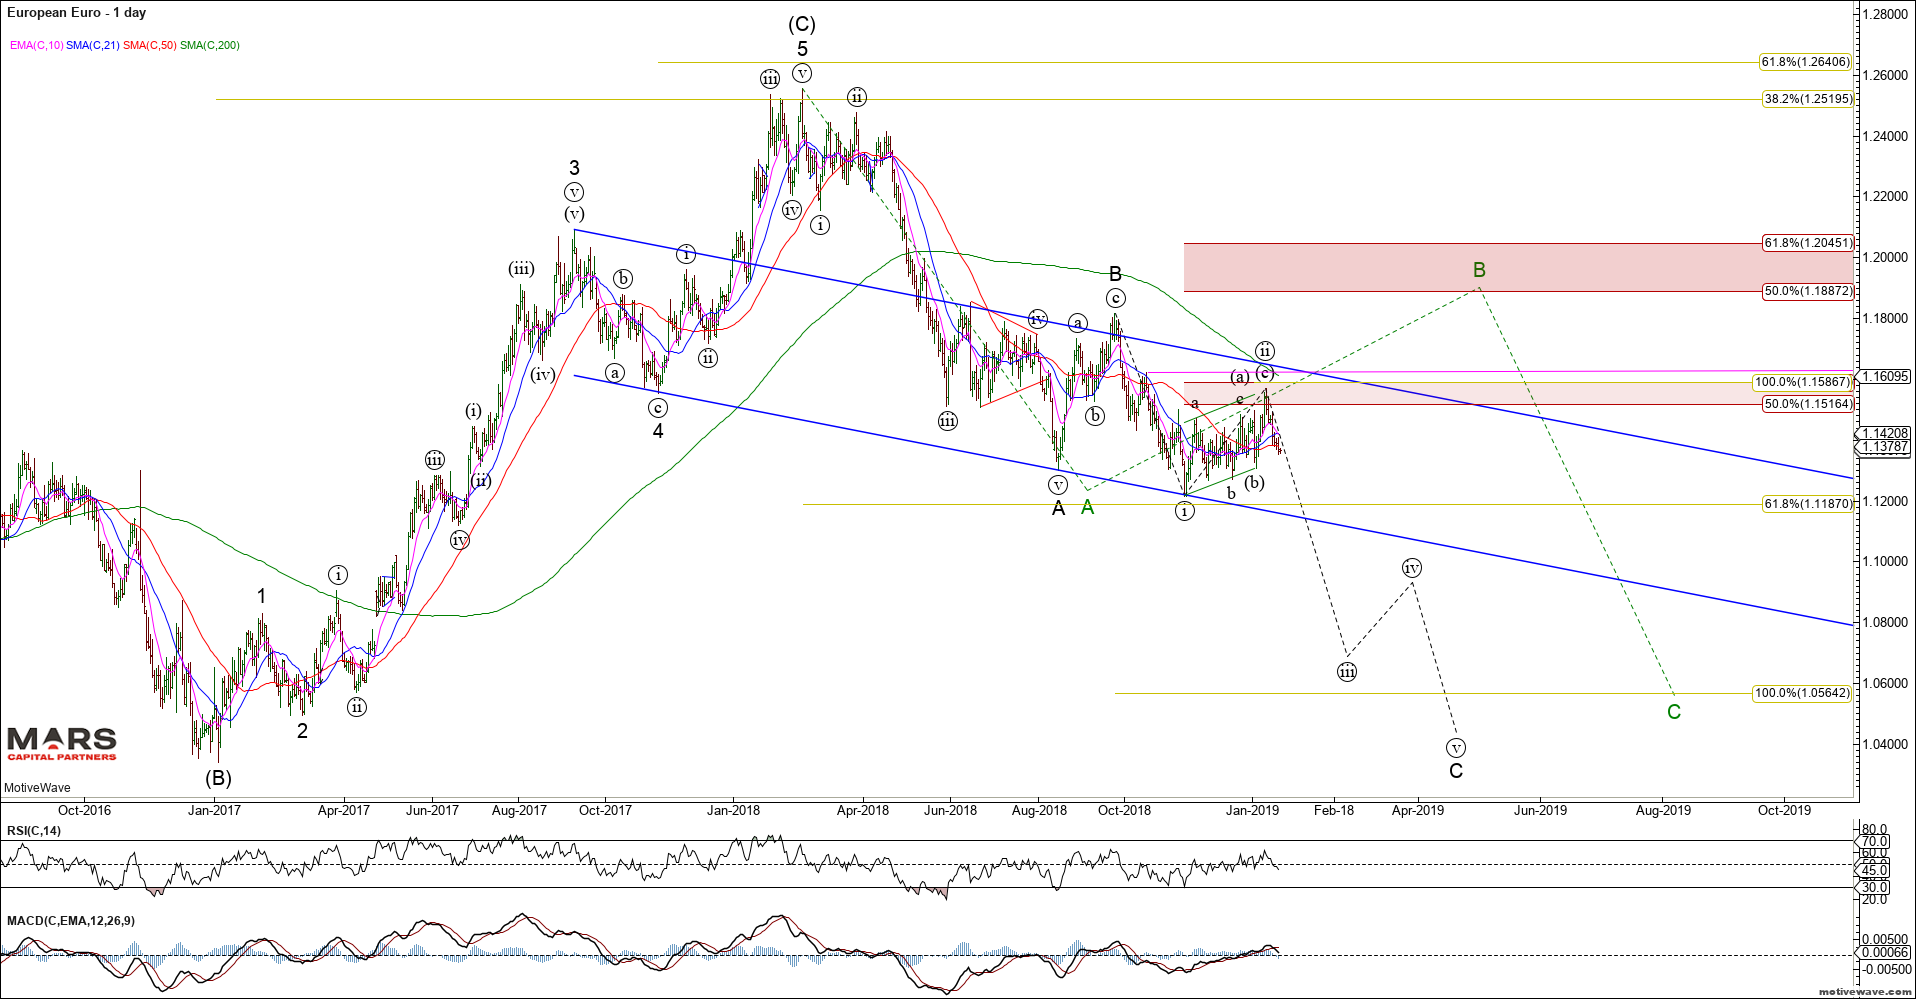
The Euro shows the same structure having turned down from our initial 1.16 resistance as we target a break of 1.12 that should lead to a retest of the 2017 lows. The alternate green count requires a push higher towards 1.19-1.20 before the bear trend can reassert itself. We remain bearish the Euro.
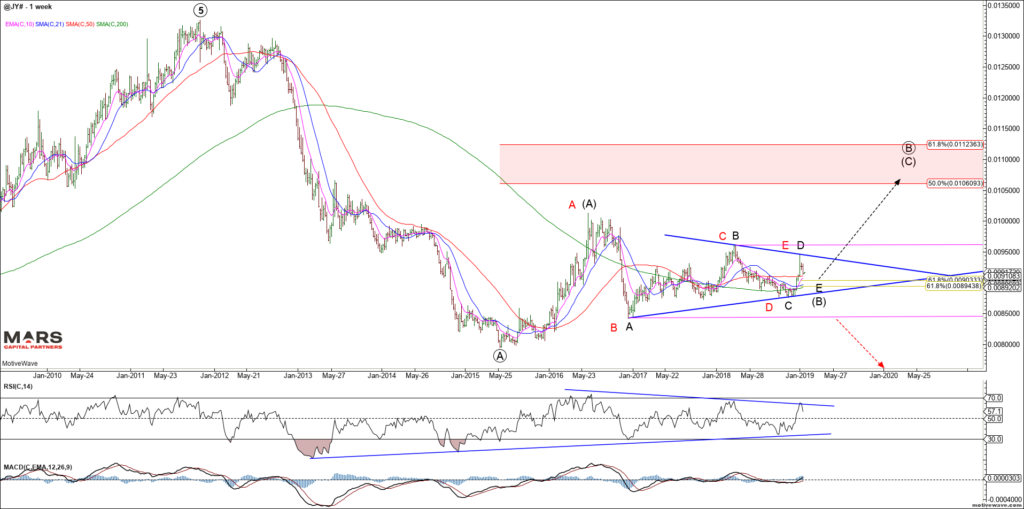
The Yen remains trapped within its triangle consolidation since its 2015 lows. Note the compression in the weekly RSI below. Despite historic levels of QE and asset purchases, the BOJ hasn’t been able to move the needle on the Yen. As we’ve seen many times in the past, volatility compression ultimately leads to volatility expansion. Ideal targets for black wave E of (B) are in the 89.50-90.50 area for the Yen. We expect this triangle to break (likely higher) in early 2019.
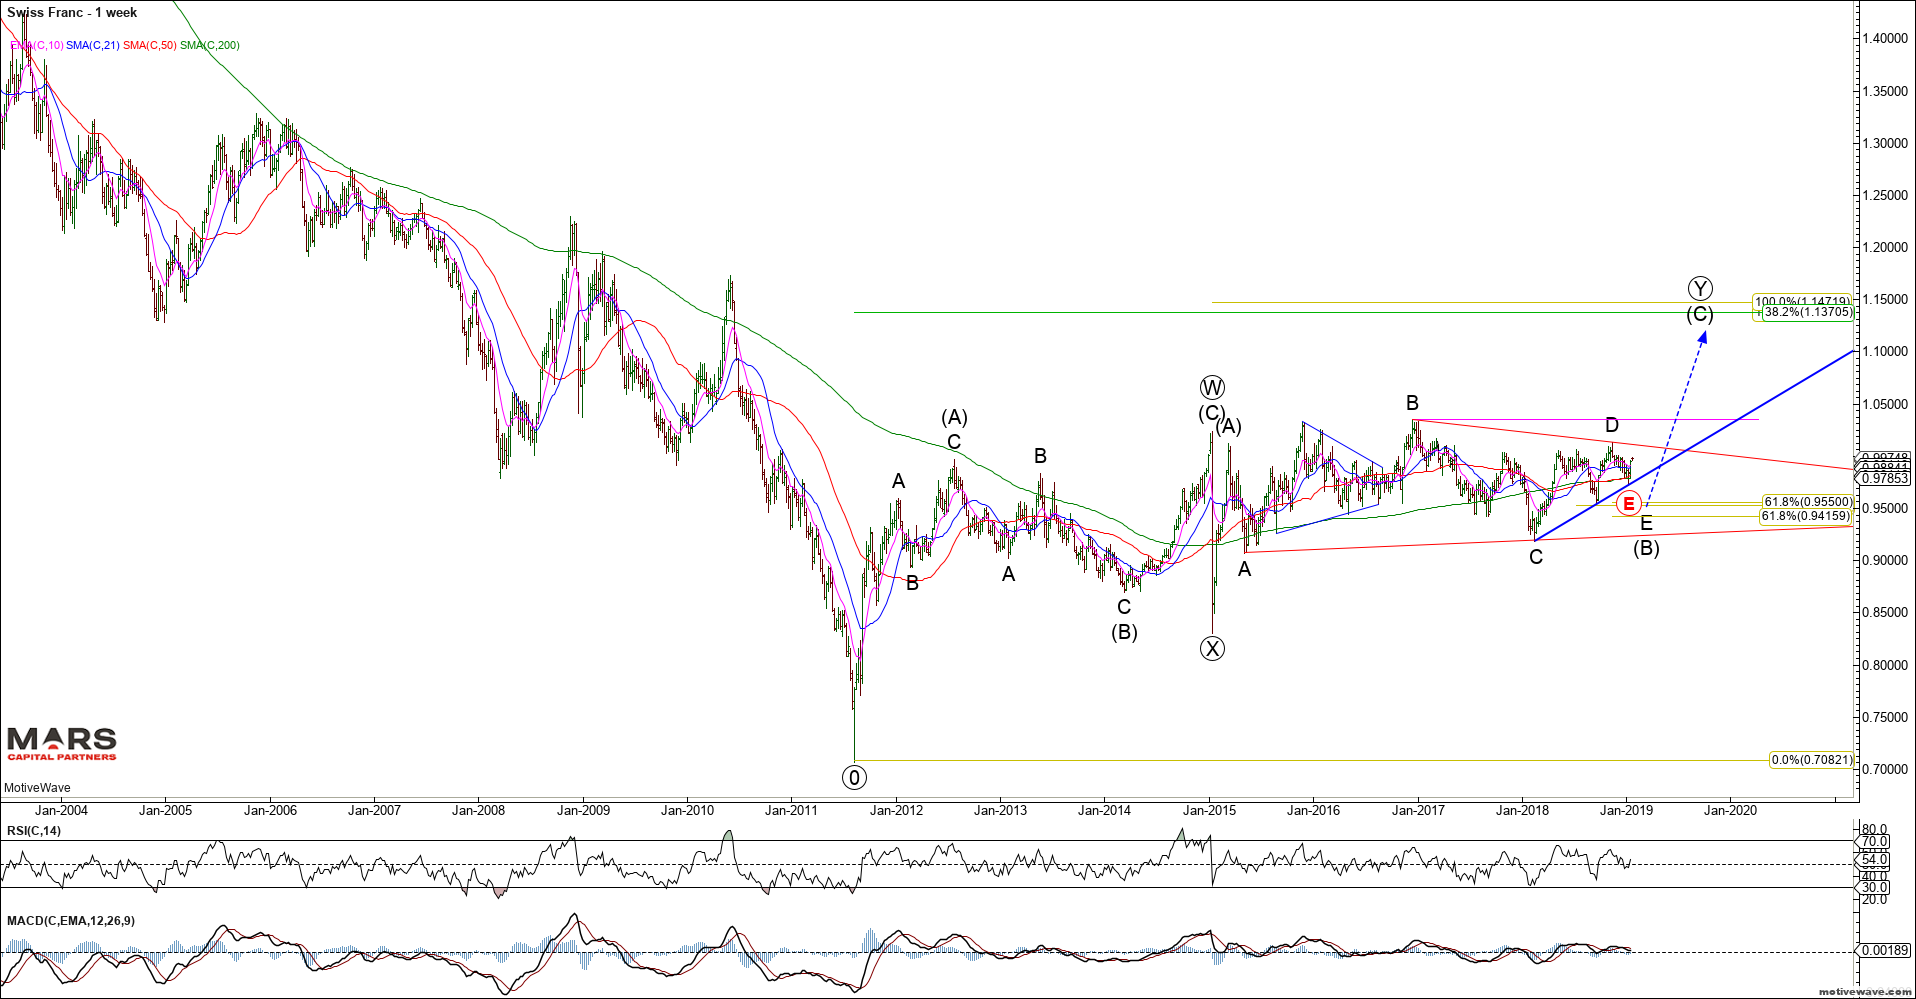
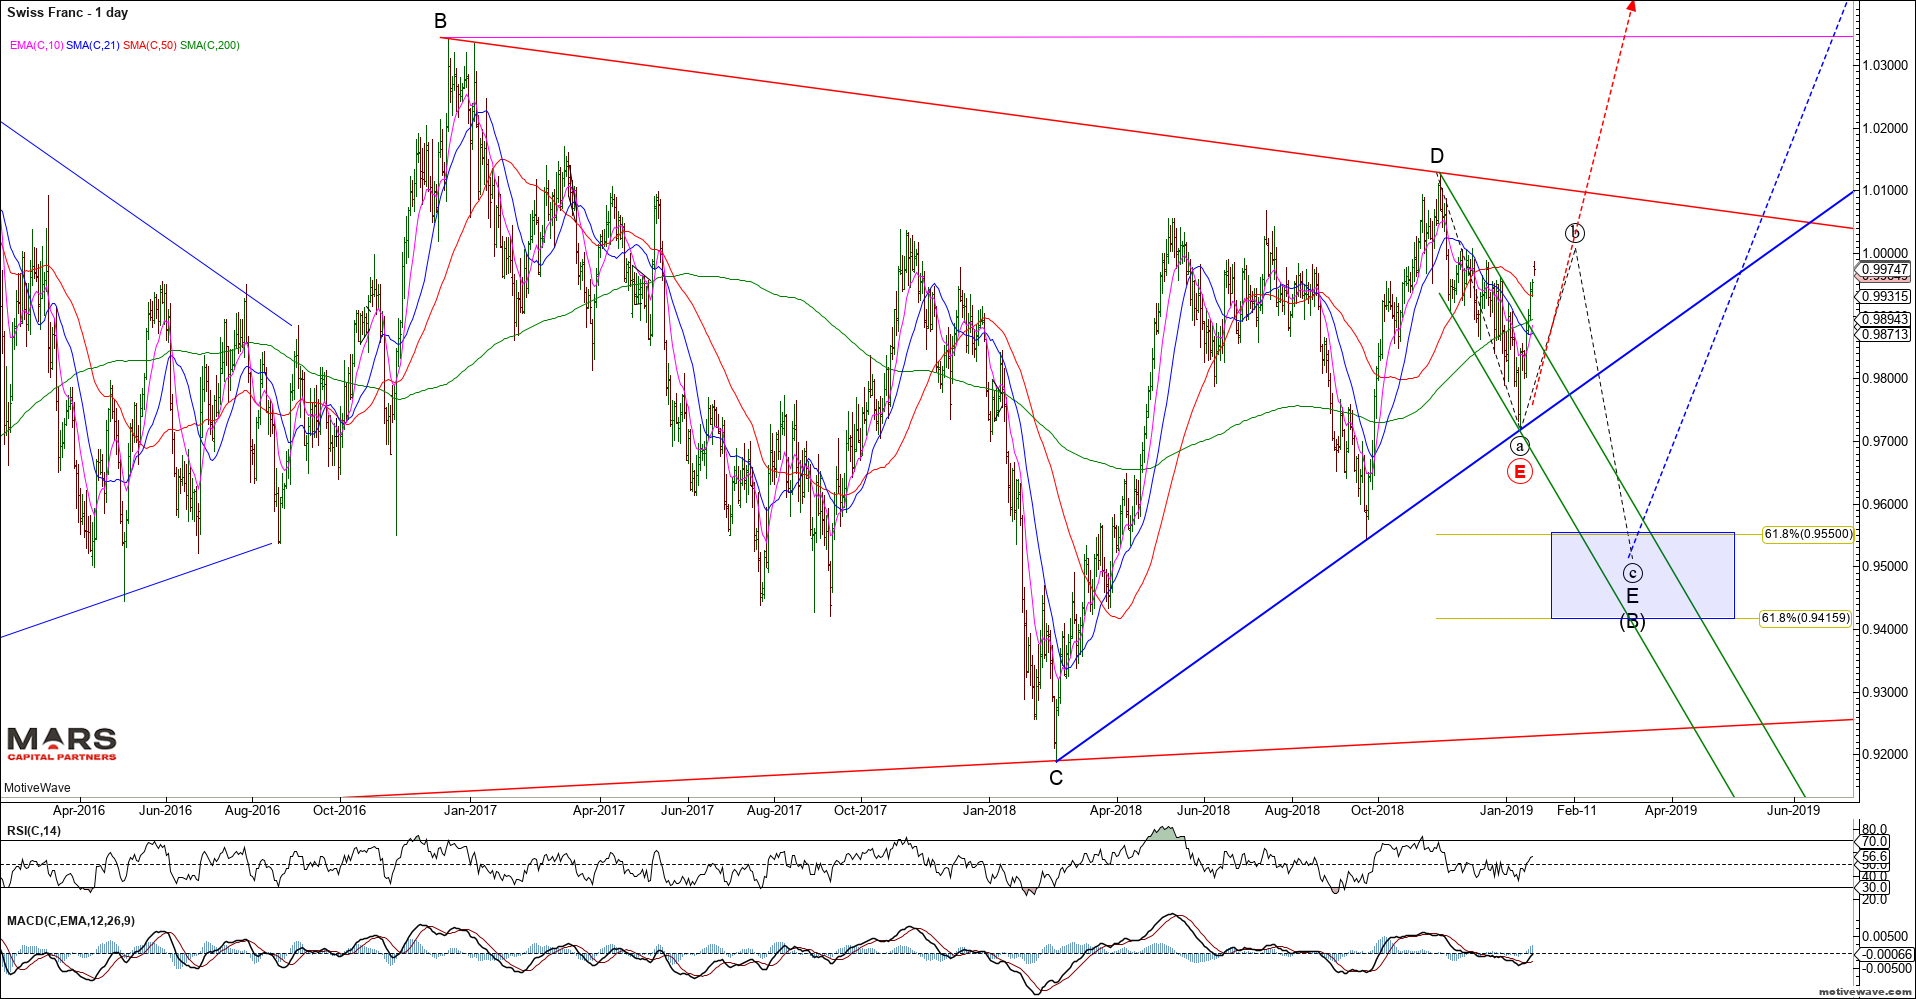
Similarly, we are very bearish the Swiss Franc as we look for a break out of its 8 year consolidation. We are bullish the USDCHF near term against recent swing lows (red E). A break of recent lows targets the 0.94-0.955 secondary support zone from where we would look to get bullish once again.
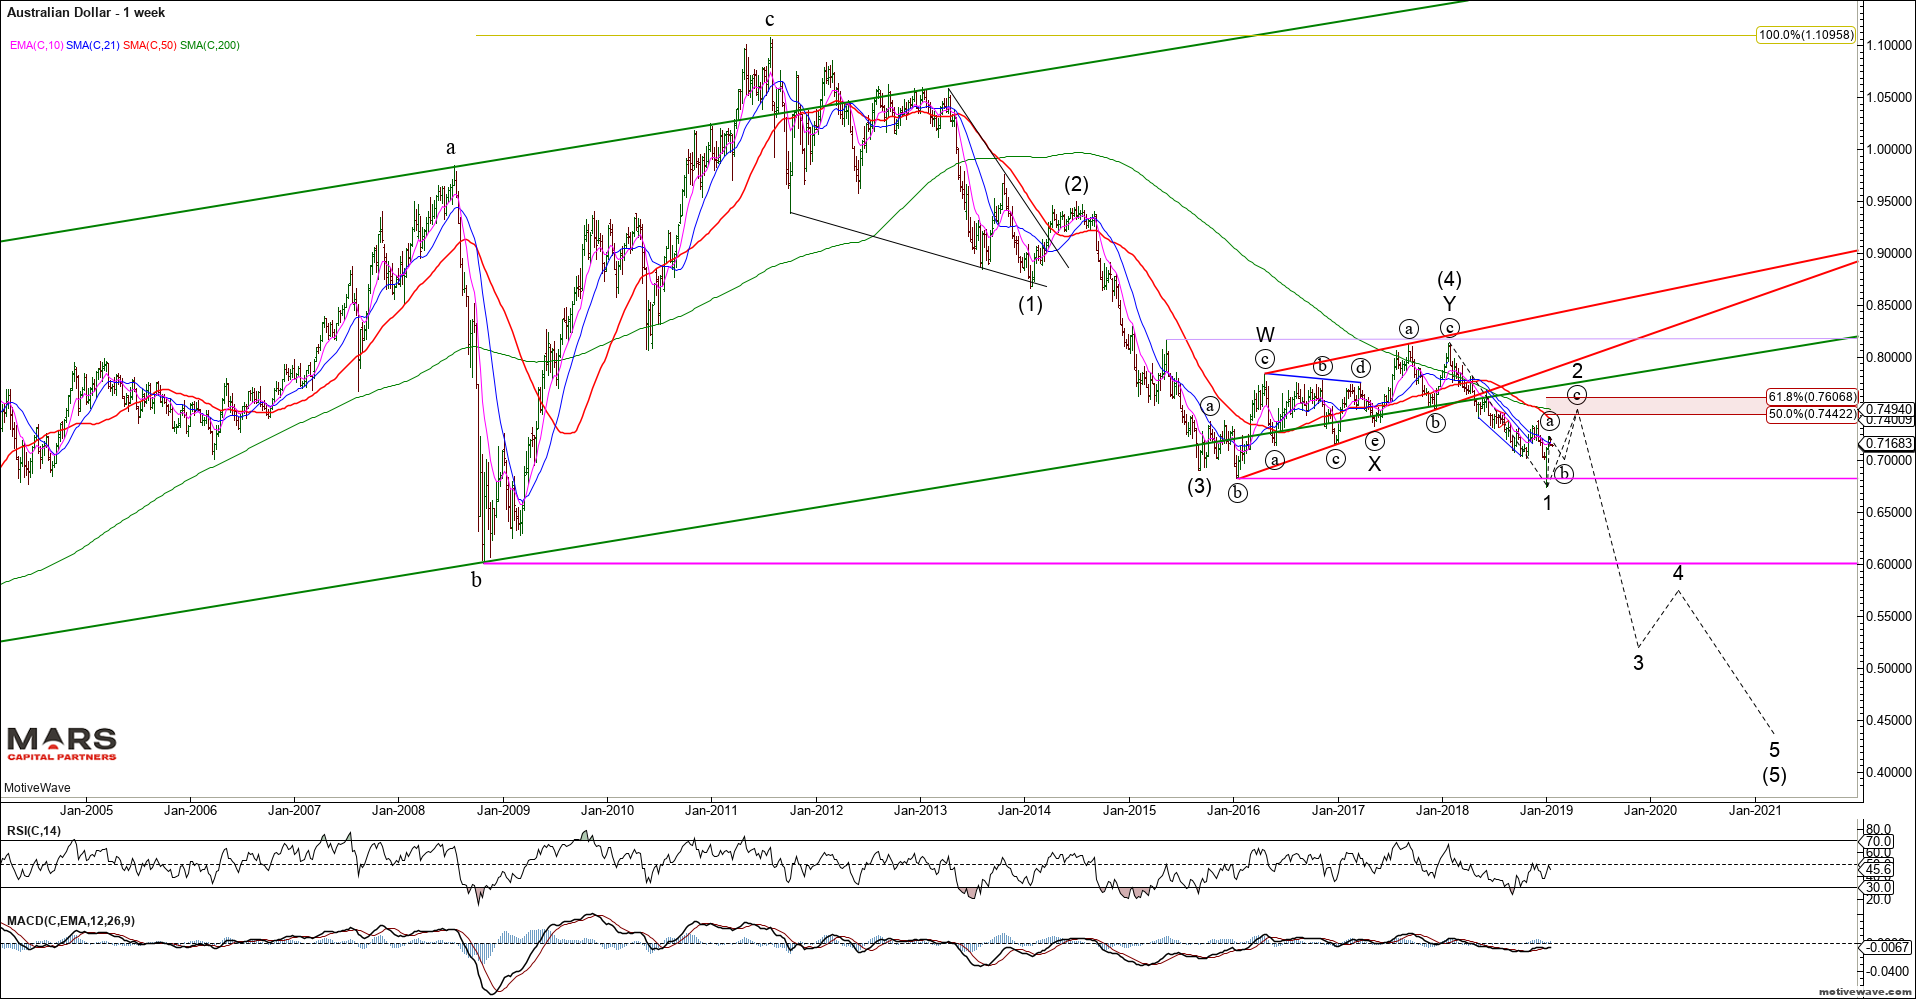
The Aussie dollar has rallied nicely since its flash crash lows. Our upside targets for this counter-trend rally remain higher towards 0.744-0.760 as we look for the bear market to reassert itself. The only thing that is likely to reverse this decline is China Stimulus and trade war resolution. Until these themes change the Aussie$ remains bearish from a big picture perspective.
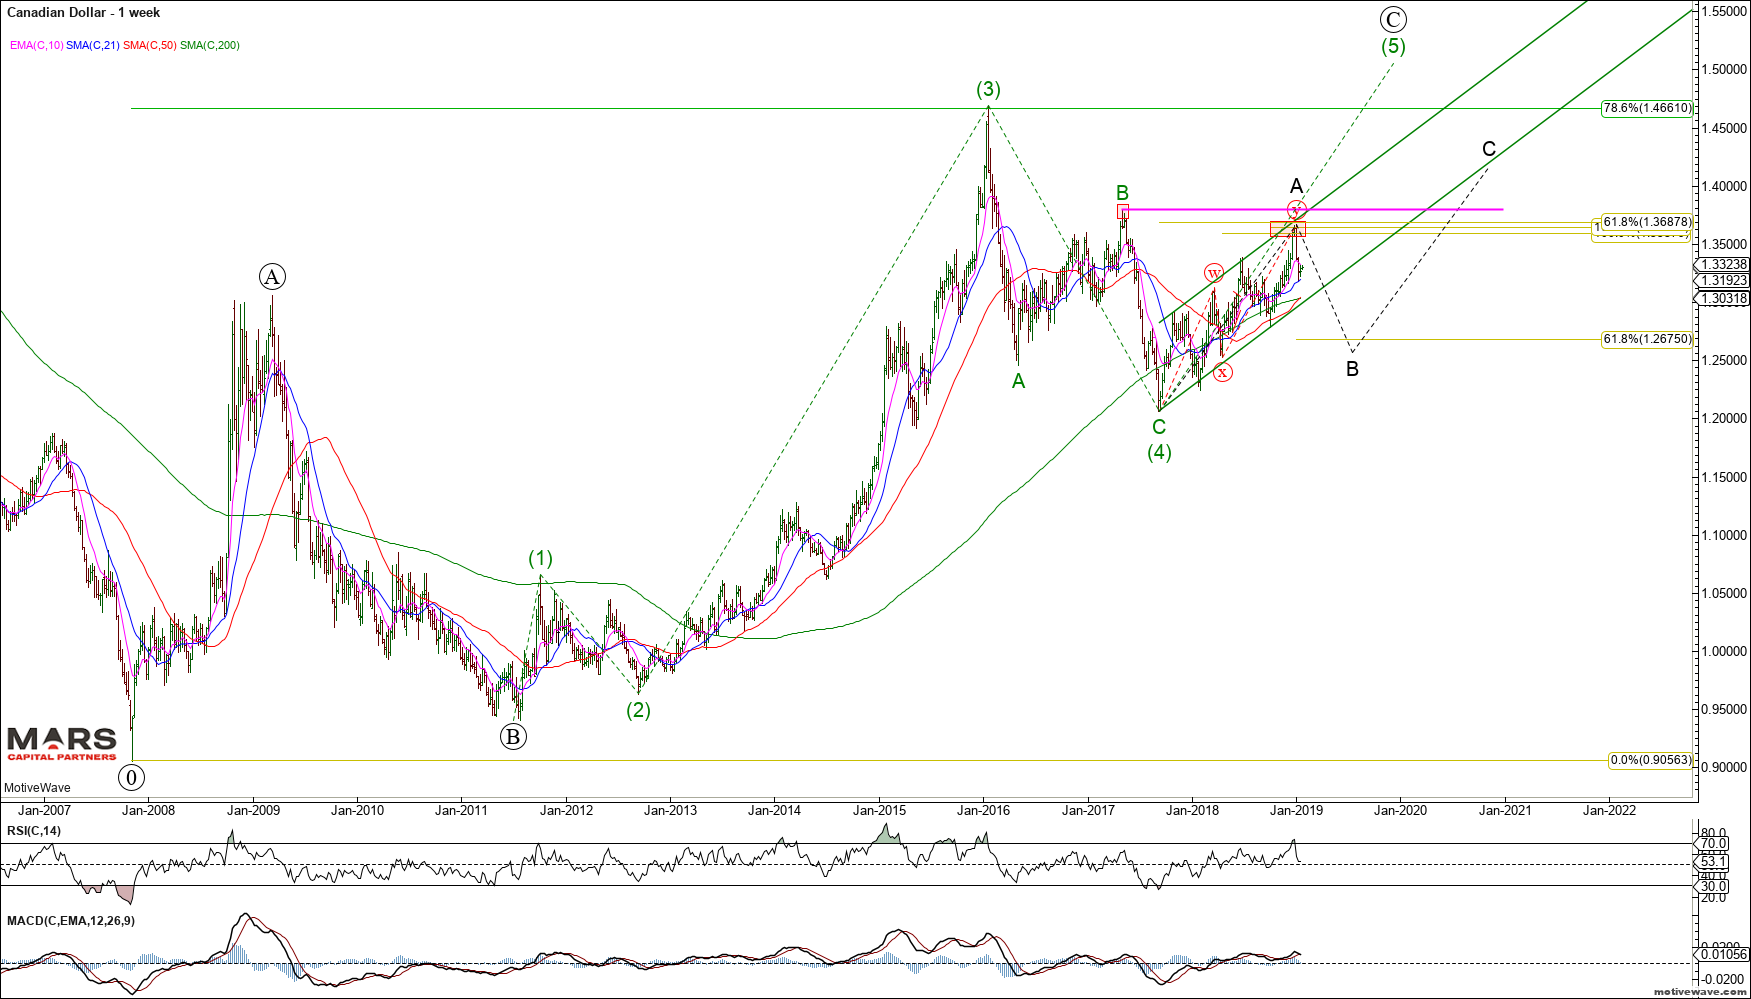
The USDCAD has rallied correctively from the wave C lows in what we expect to be wave A of an A-B-C advance. We are near term bearish against recent swing highs but not with a great deal of confidence. This pair has been range bound since the 2016 highs. With only 3 waves down from the 2016 highs we must assume the decline was corrective and new highs is likely (green count). Trade back above 1.38 will “lock-in” a corrective 3 wave decline implying a push to new multi-year highs.
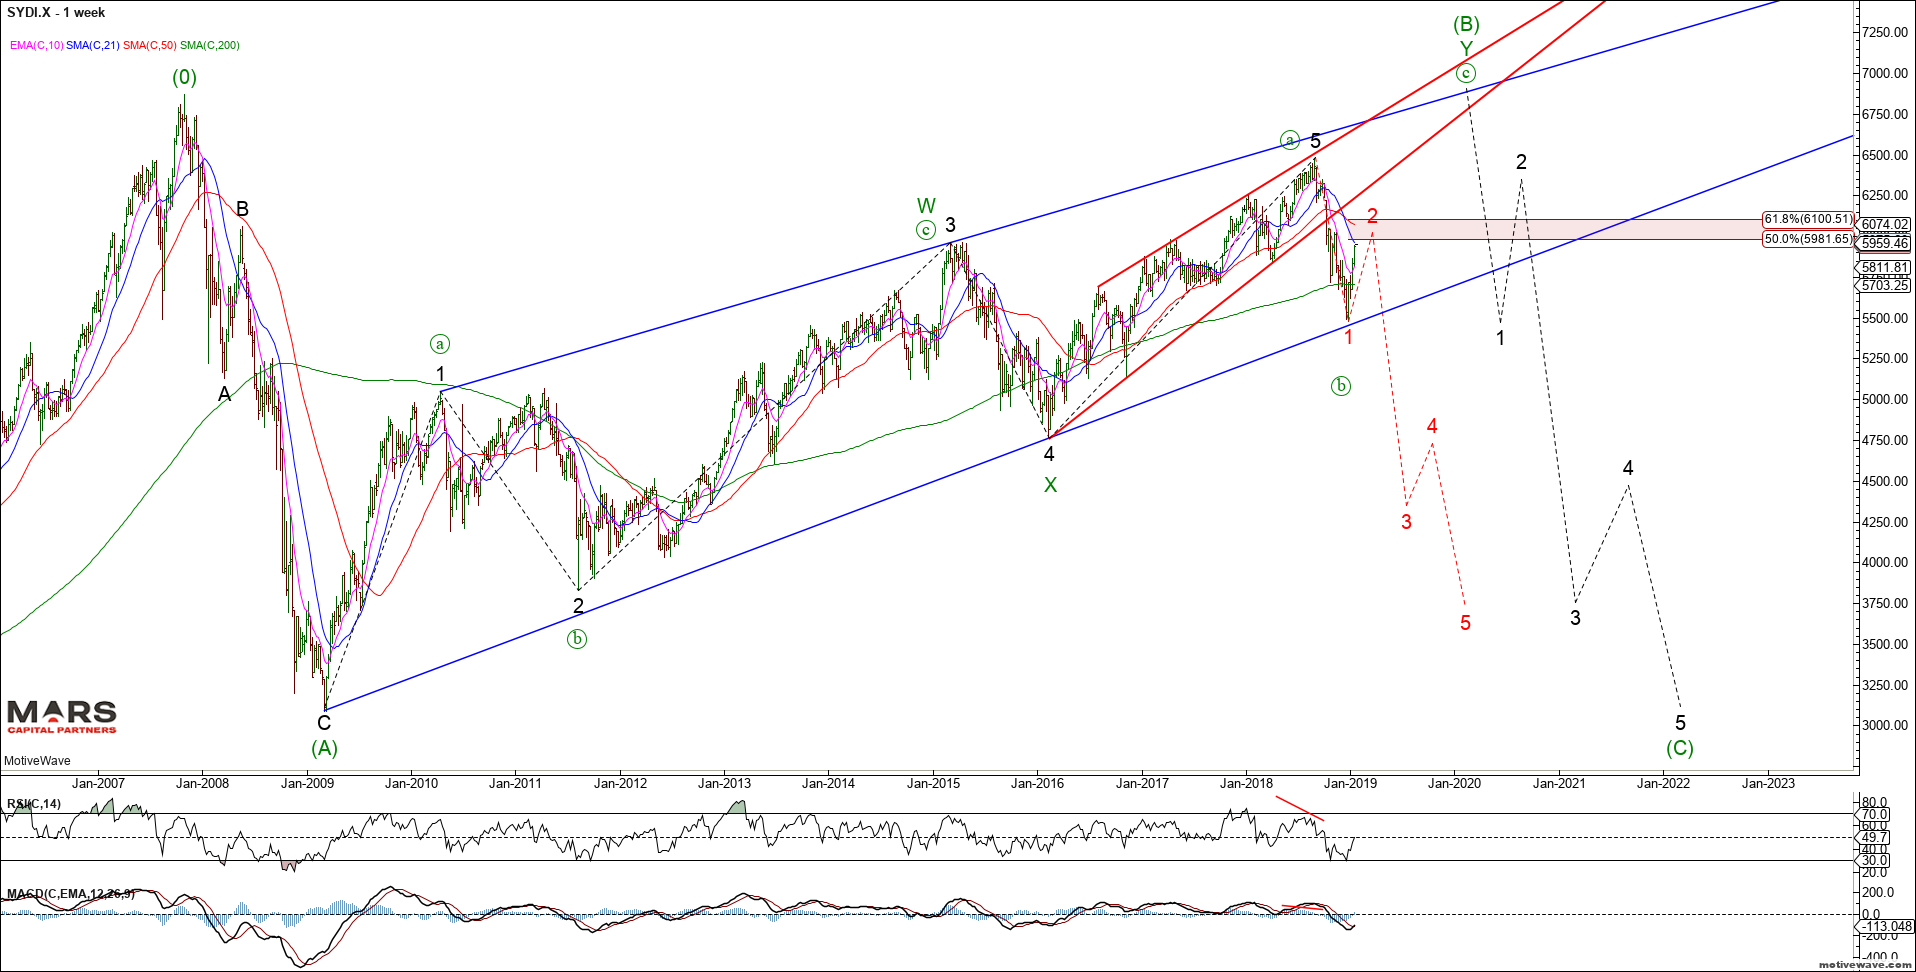
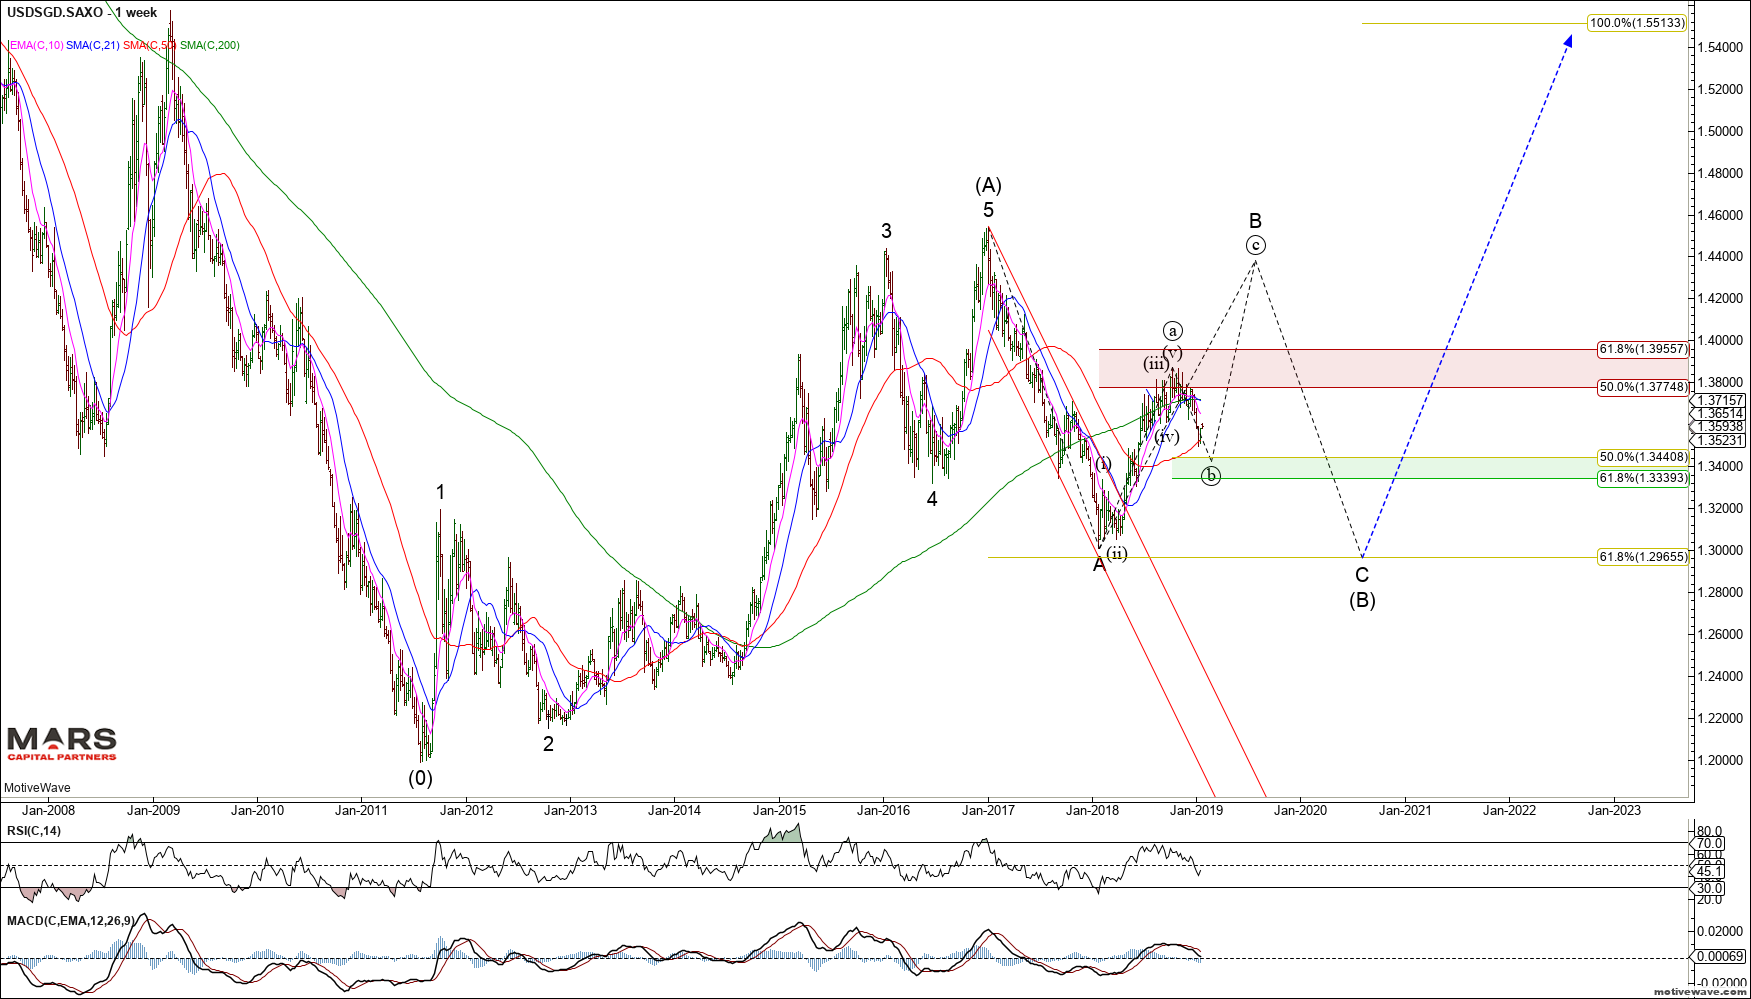
The Singapore Dollar provides the clearest Elliott Wave structure with 5 waves up from the 2011 lows terminating into the 2016 highs. We are looking for evidence of a bullish turn for the USDSGD for wave (c) of B up to retest the 2016 highs. Strong support resides in the 1.334-1.344 area for a turn.
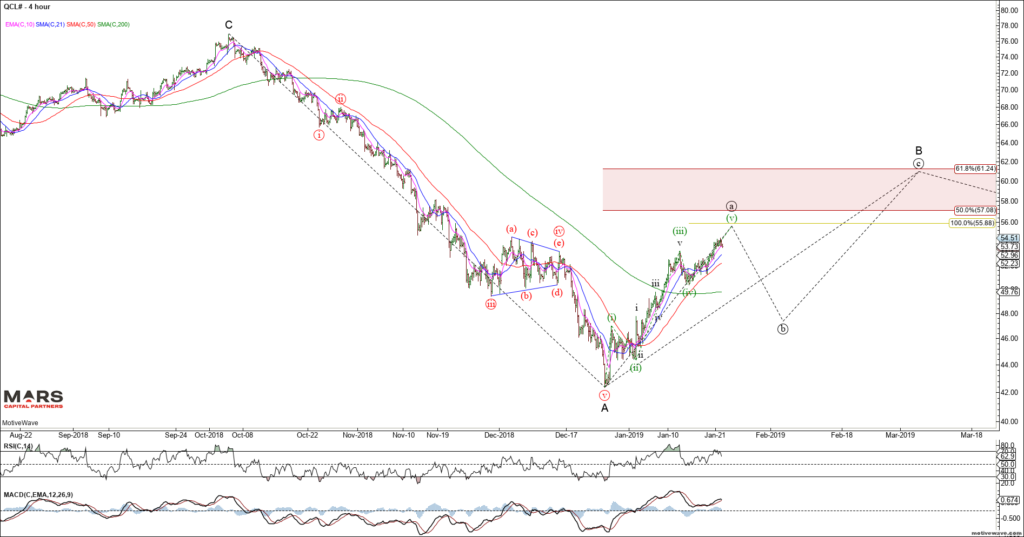
To the commodity markets and Crude Oil has pushed higher in wave (a) in what we expect to be part of a counter-trend rally. We expect this rally to be part of a larger wave B correction before wave C down. Ideal wave (c) of B targets remain in the $61 area. The rally off the 2016 lows is clearly corrective in 3 waves. The decline for the September 2018 highs is clearly impulsive so we would expect another wave lower of similar magnitude. We remain bearish CL from a bigger picture perspective.
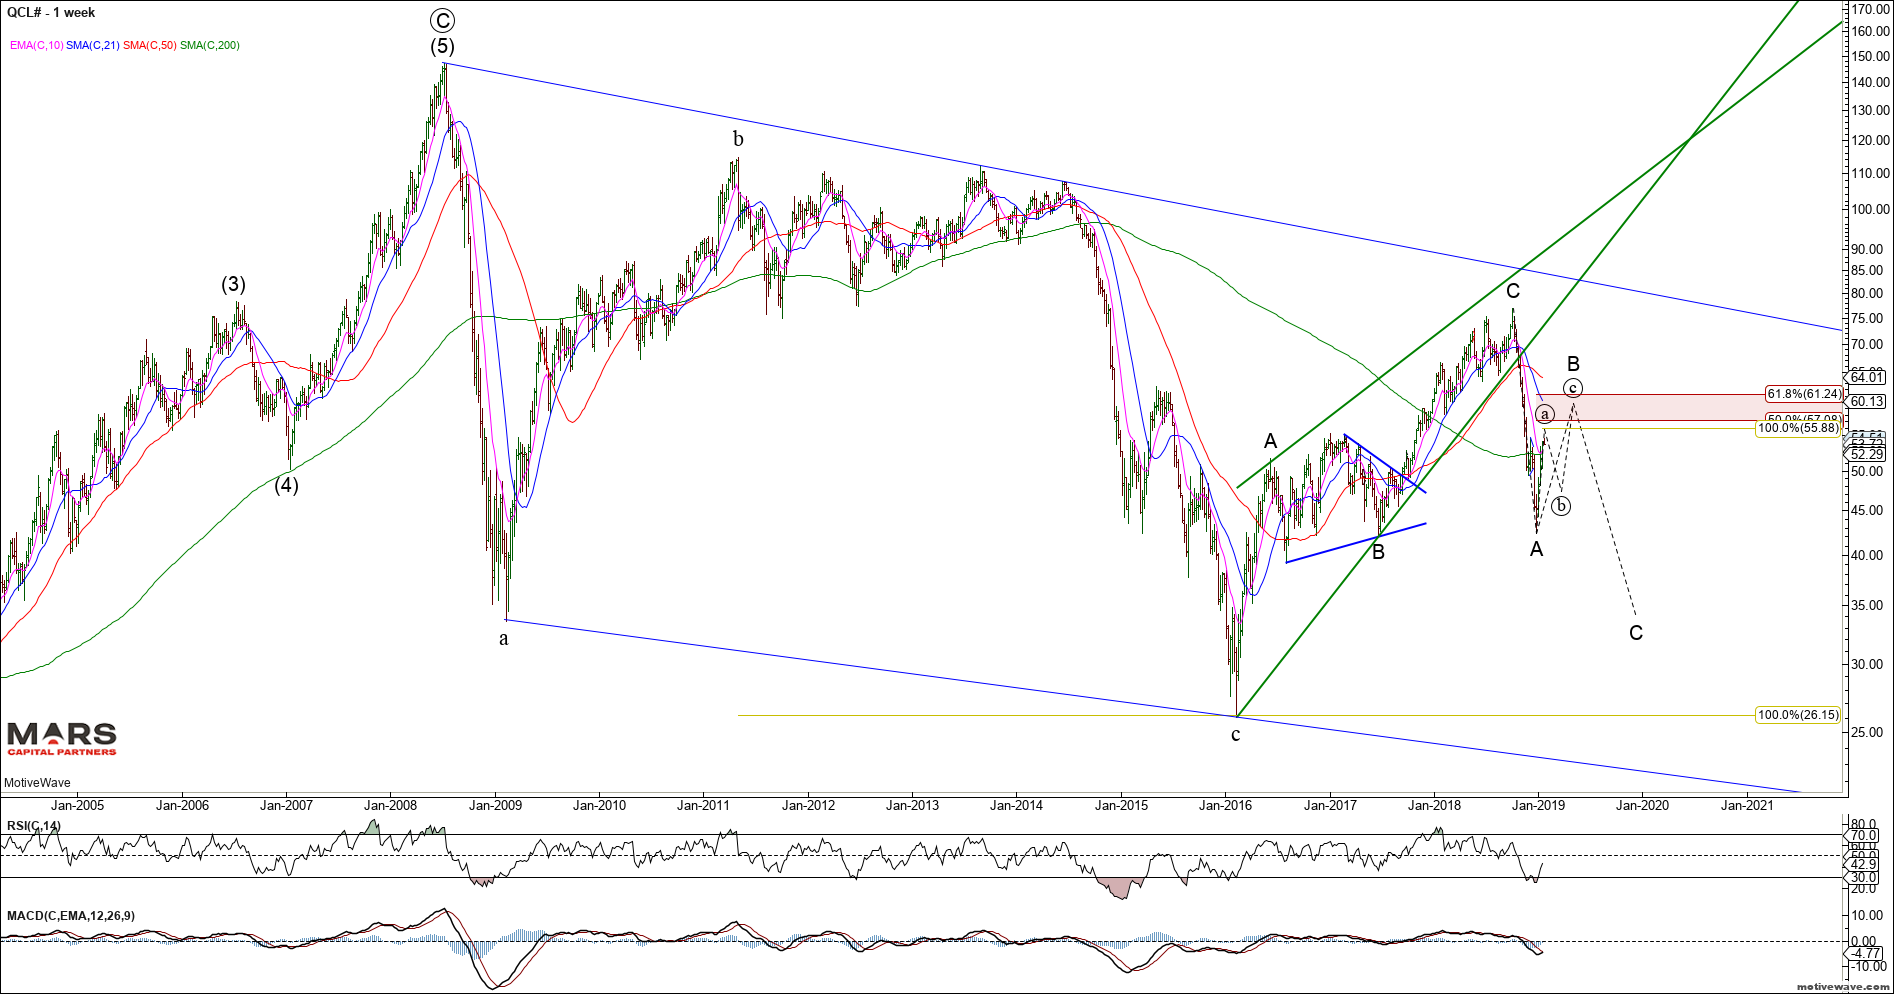
Near term, the recent CL rally from the low is clearly impulsive and likely only wave (a) of an a-b-c correction higher. Ideal upside targets for wave (a) are 56-57.
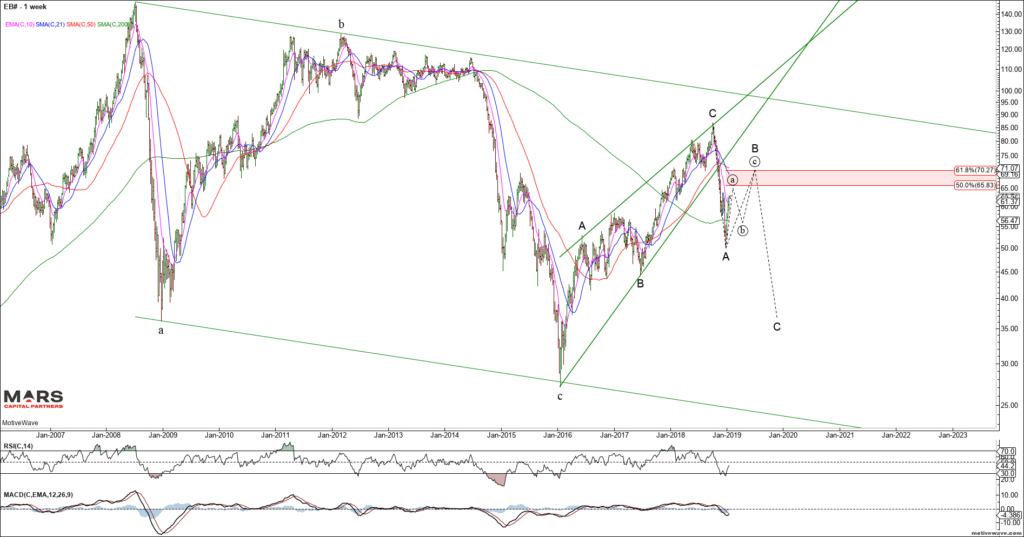
Brent Crude shows the same overall structure as we appear to be completing wave (a) of an a-b-c rally for B in the $70 area before wave C down commences.
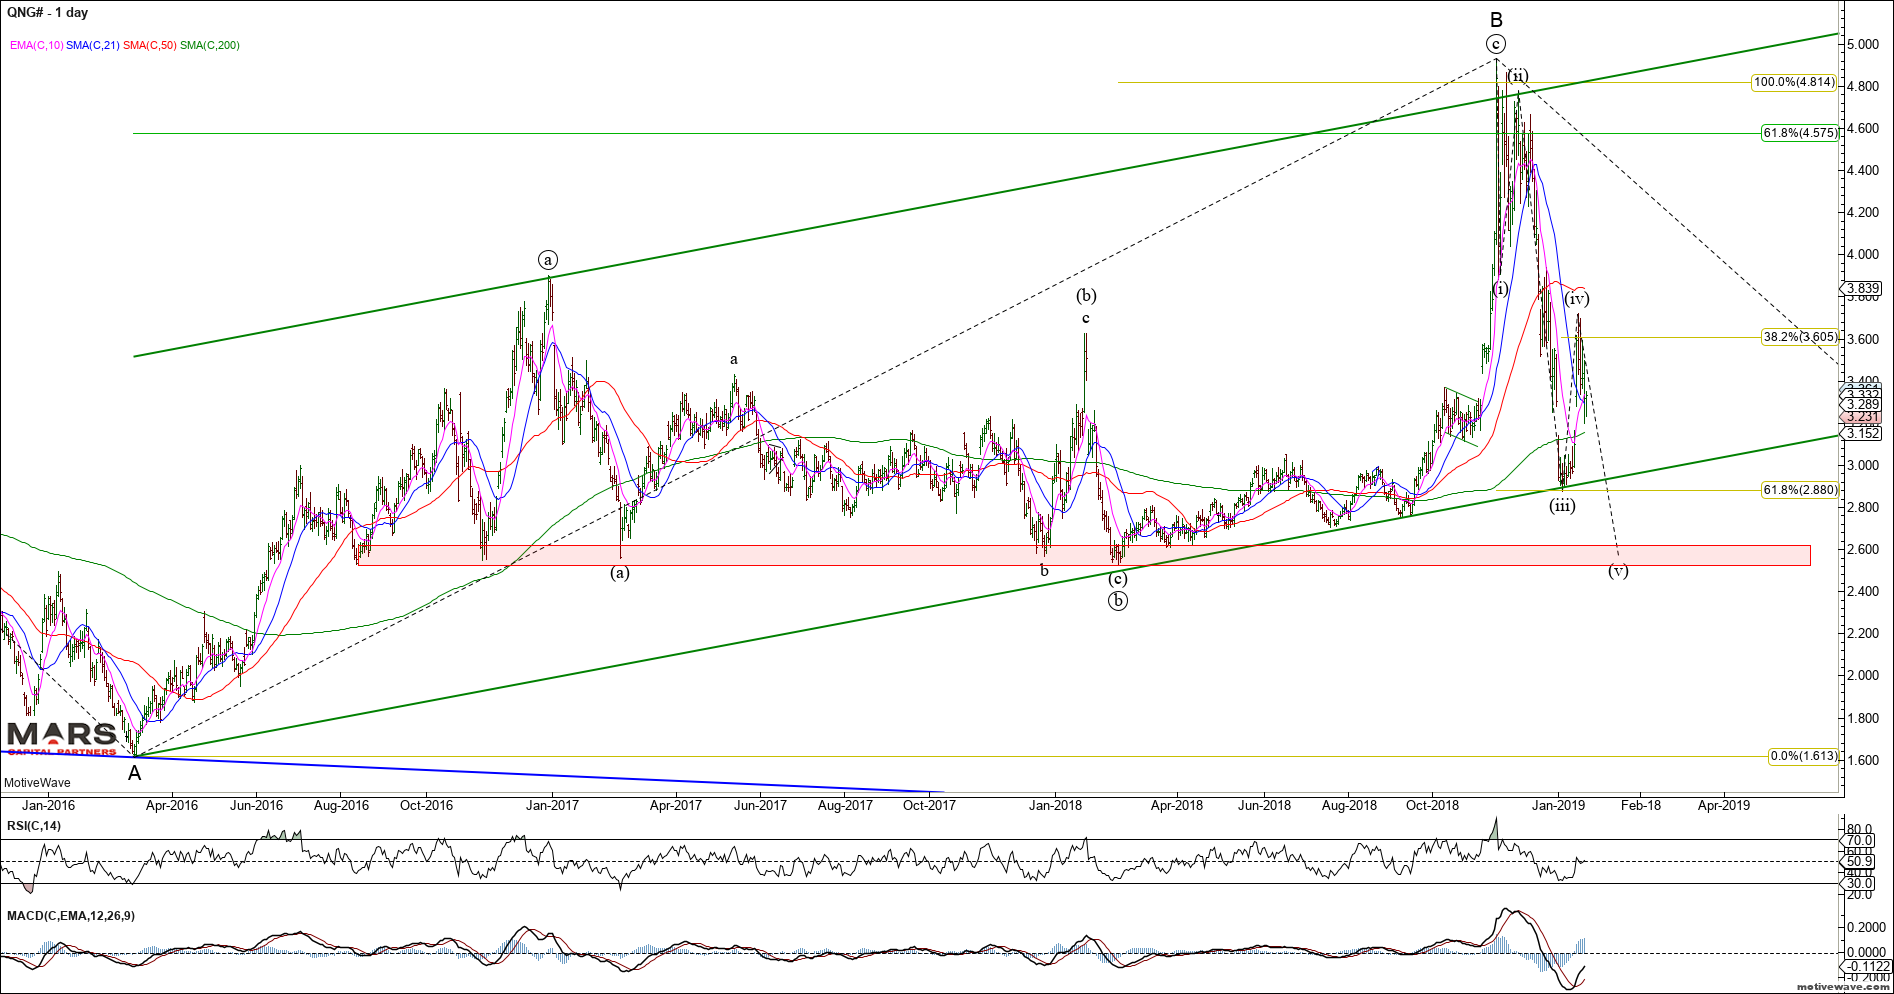
Natty Gas continues to trade within a larger decline with a corrective 3 waves up since the 2016 lows. We remain bearish from a bigger picture perspective and continue to look for new cycle lows in NG as long as the wave C highs hold to the upside. A break below 2.50 support would likely confirm our bearish view.
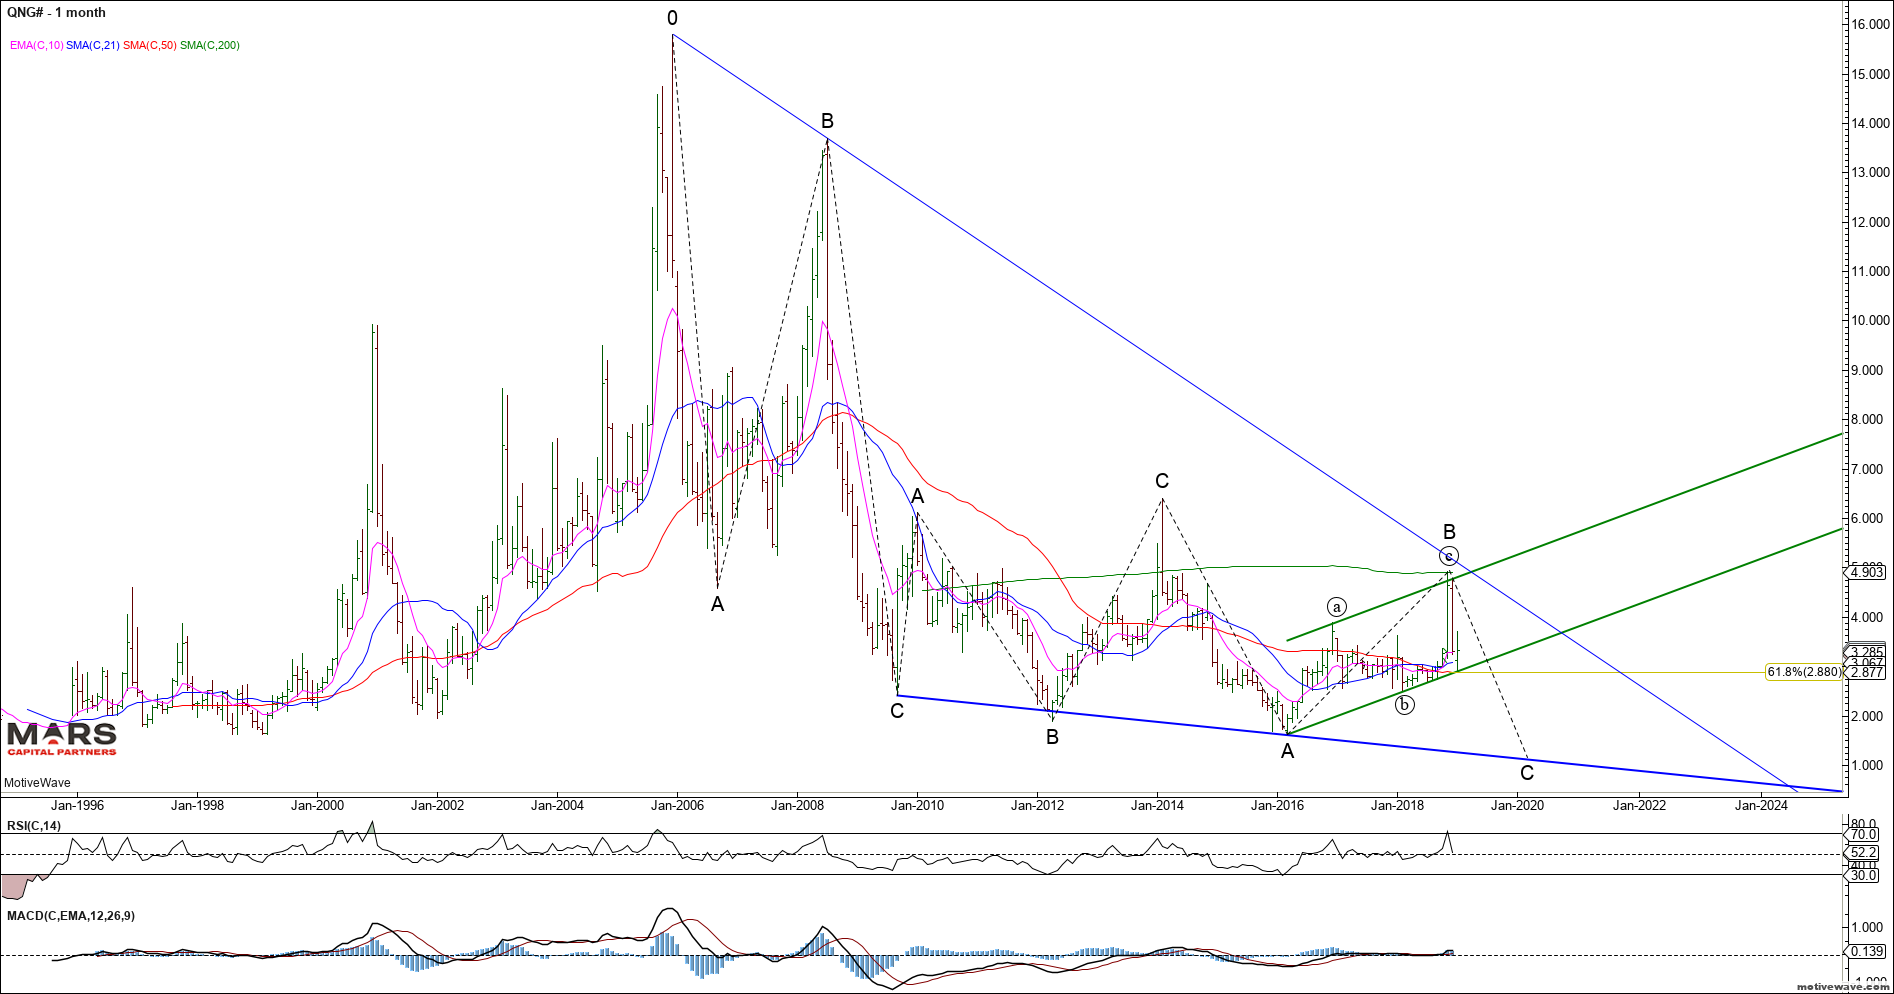
Near term, the NG bears need to break below the trend channel and ideally trade below 2.50 to confirm a change in trend to down.
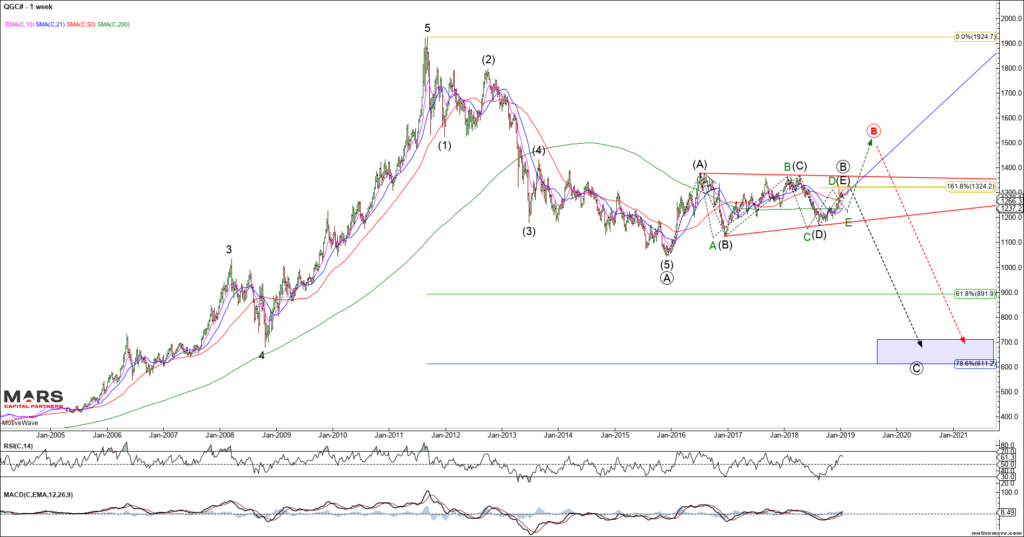
To the PM’s and Gold remains trapped in its multi-year triangle. Our long term price objective remains in the $600-700 area for Gold. The question is only whether we go directly down from our $1380 resistance (black count) or push higher first towards $1500 for red wave B.
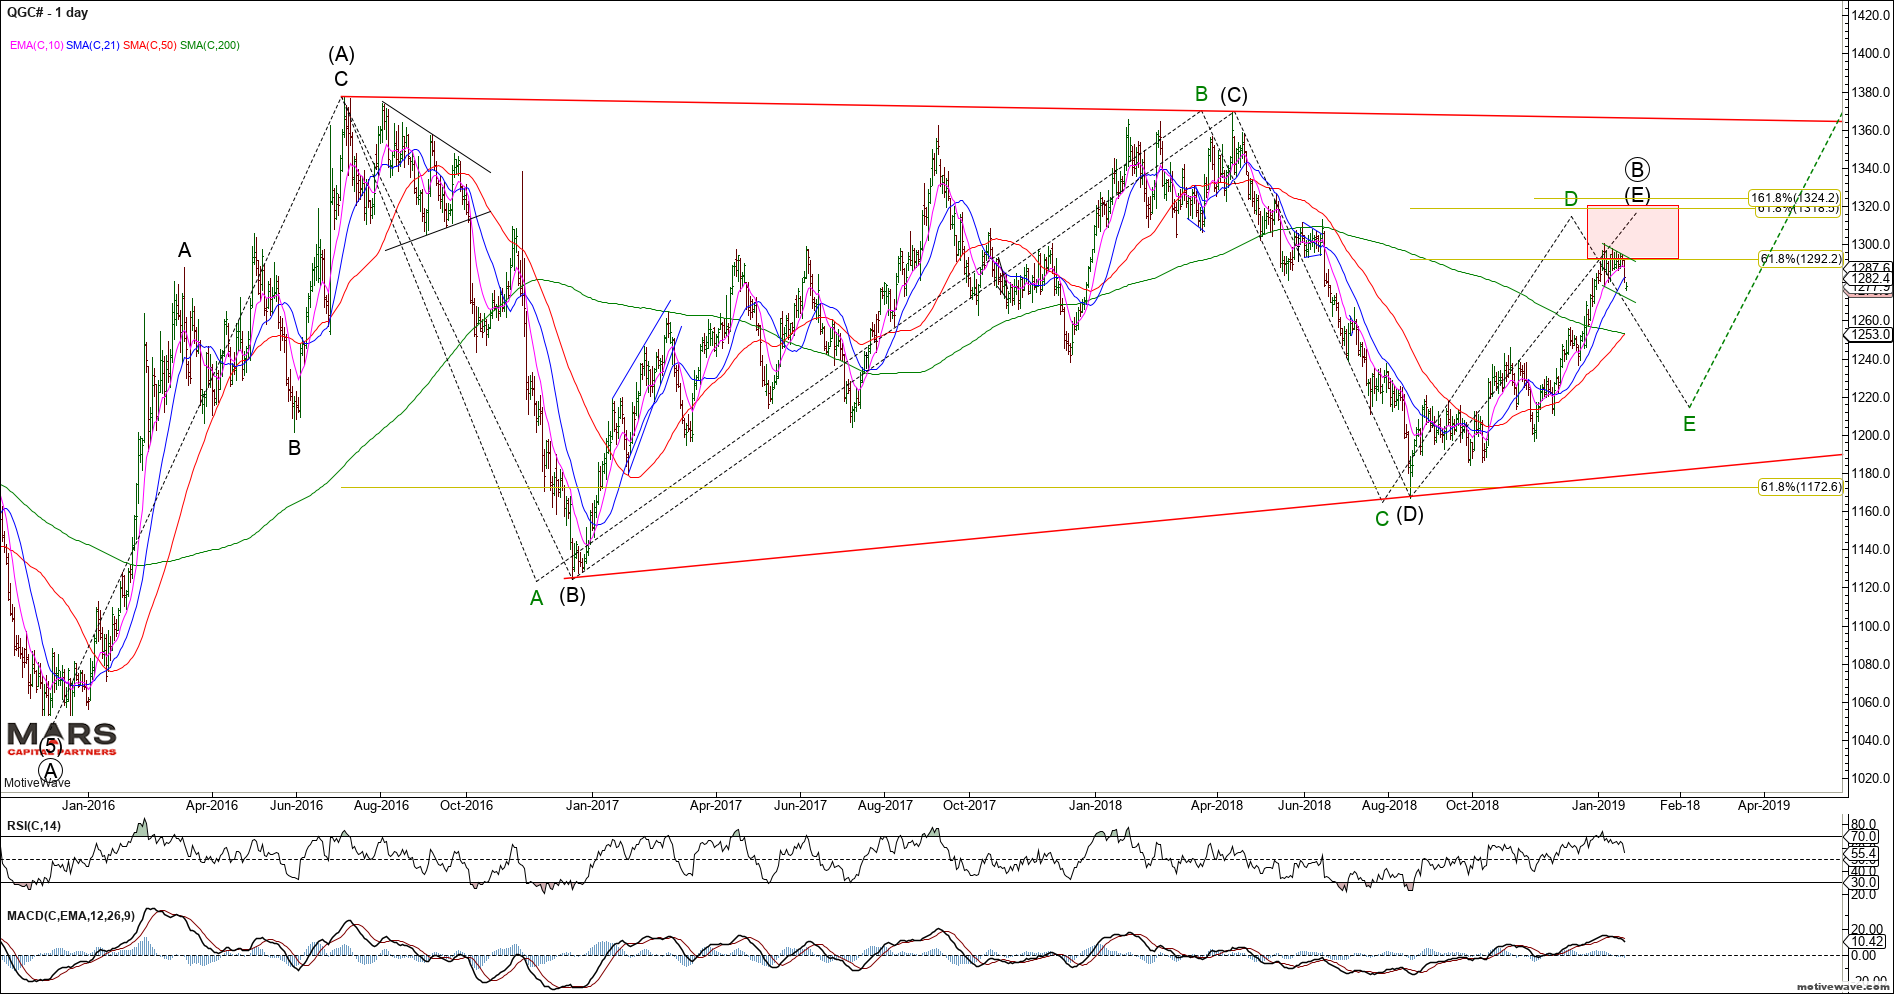
Near term, Gold turned down from the low end of our sell zone as it broke down from its triangle. It could still be a bull flag with ideal upside targets in the 1320-25 area. We do not yet have confirmation of a change in trend.
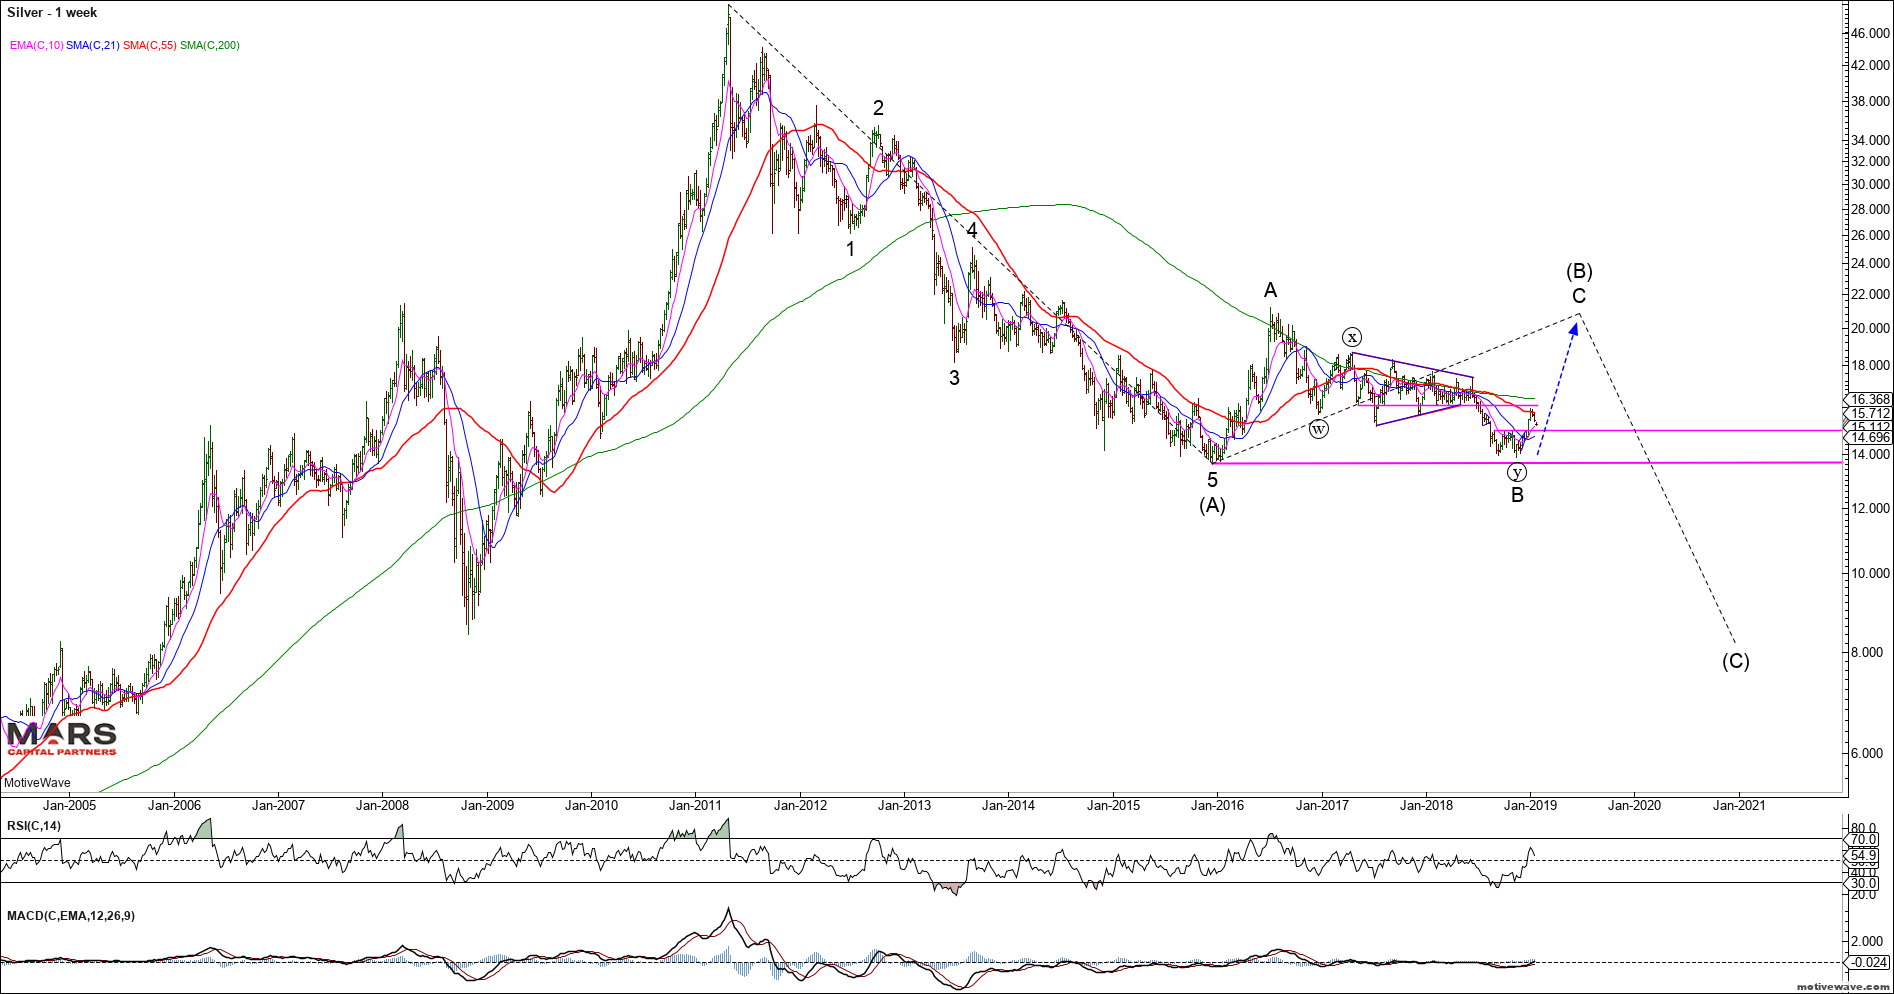
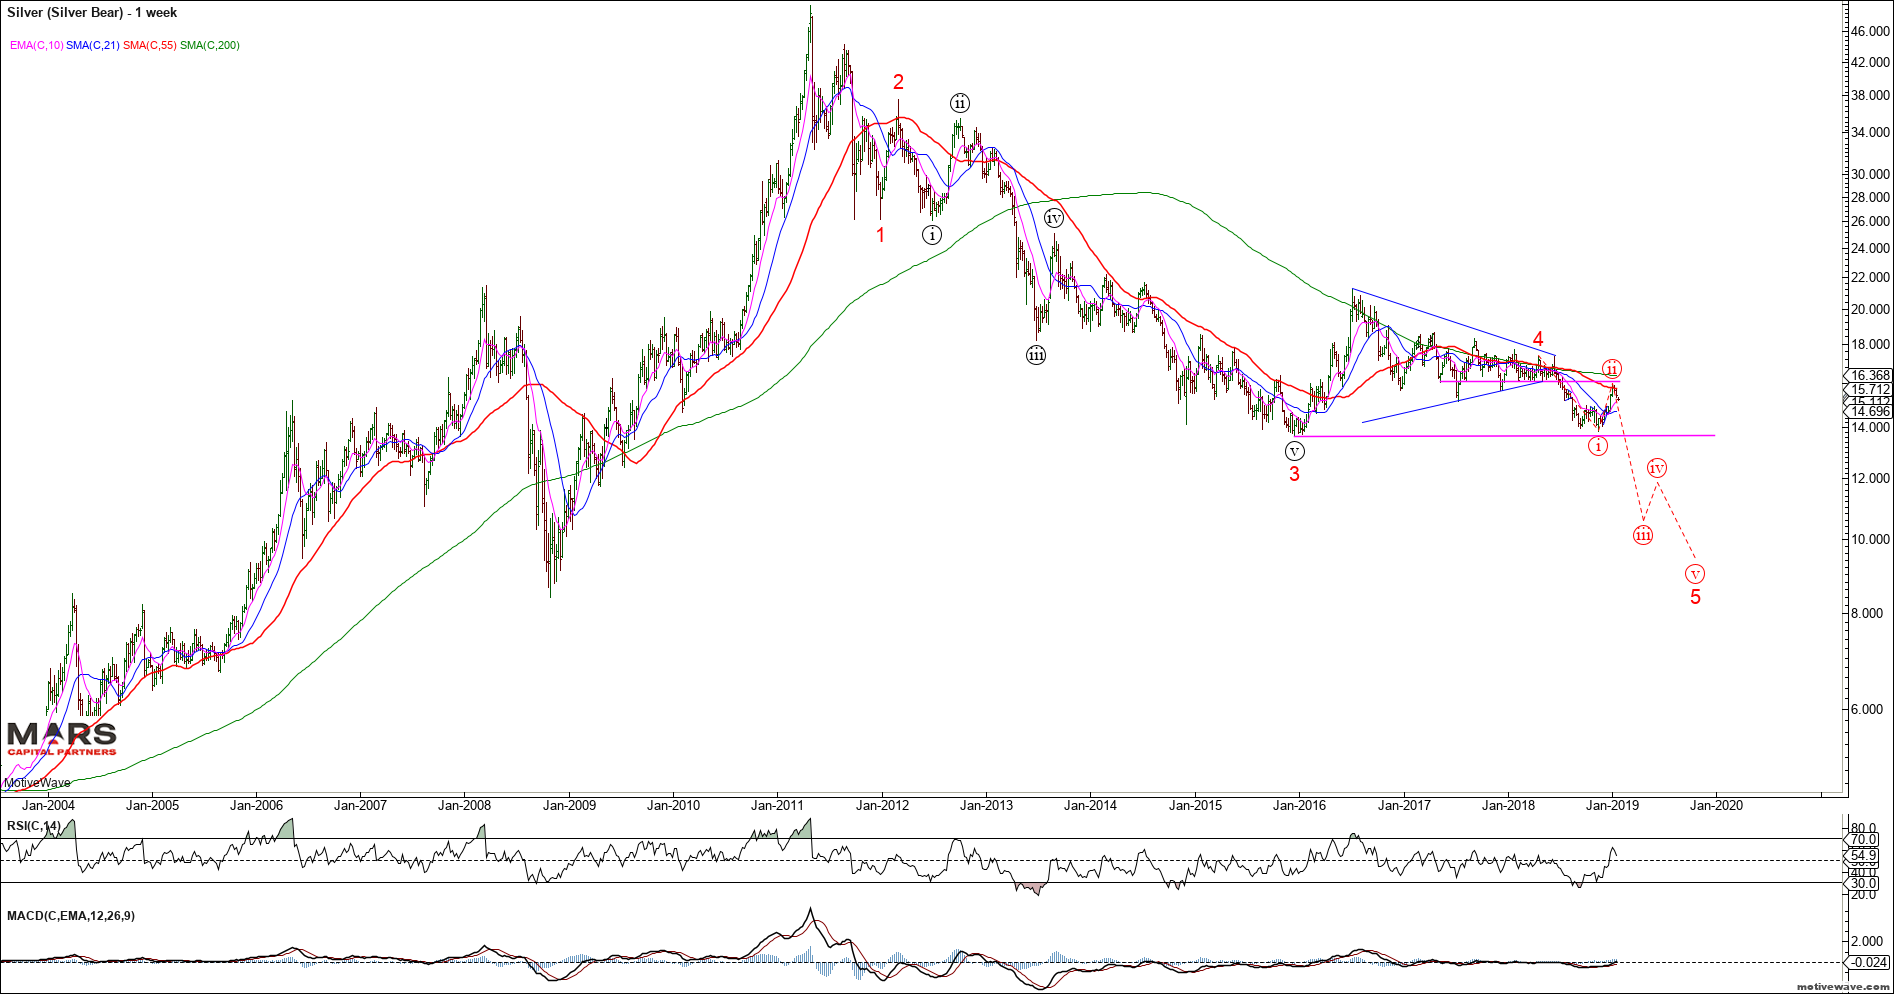
Silver also broke down from our 16.00 near term resistance and the rally is only in 3 waves so far. Trade back below 15.00 would imply the trend remains down with new lows on deck. Bulls need to hold the 13.60 support area or risk a breakdown towards the $8-10 area in an impulsive 5th wave decline. The bullish case is looking for a wave C higher towards the $20-22 area. Near term bulls need to reclaim $16 first.
Our bigger picture Silver buy zone targets remain in the $8-10 area.
In summary, 2019 is likely to be a trader’s market with high volatility across macro asset classes.
– we remain defensive equities and trade tactically;
– bullish bonds in a deflationary environment;
– bullish the US dollar (except against the Yen)
– bearish the Swiss Franc
– Longer term bearish gold and silver
