
Last week, equities saw a corrective decline in what is likely a continued bullish impulse wave C of (B). Bonds continued to rally to complete an impulse up from recent swing lows. The US dollar refuses to roll over, calling into question the bearish count.
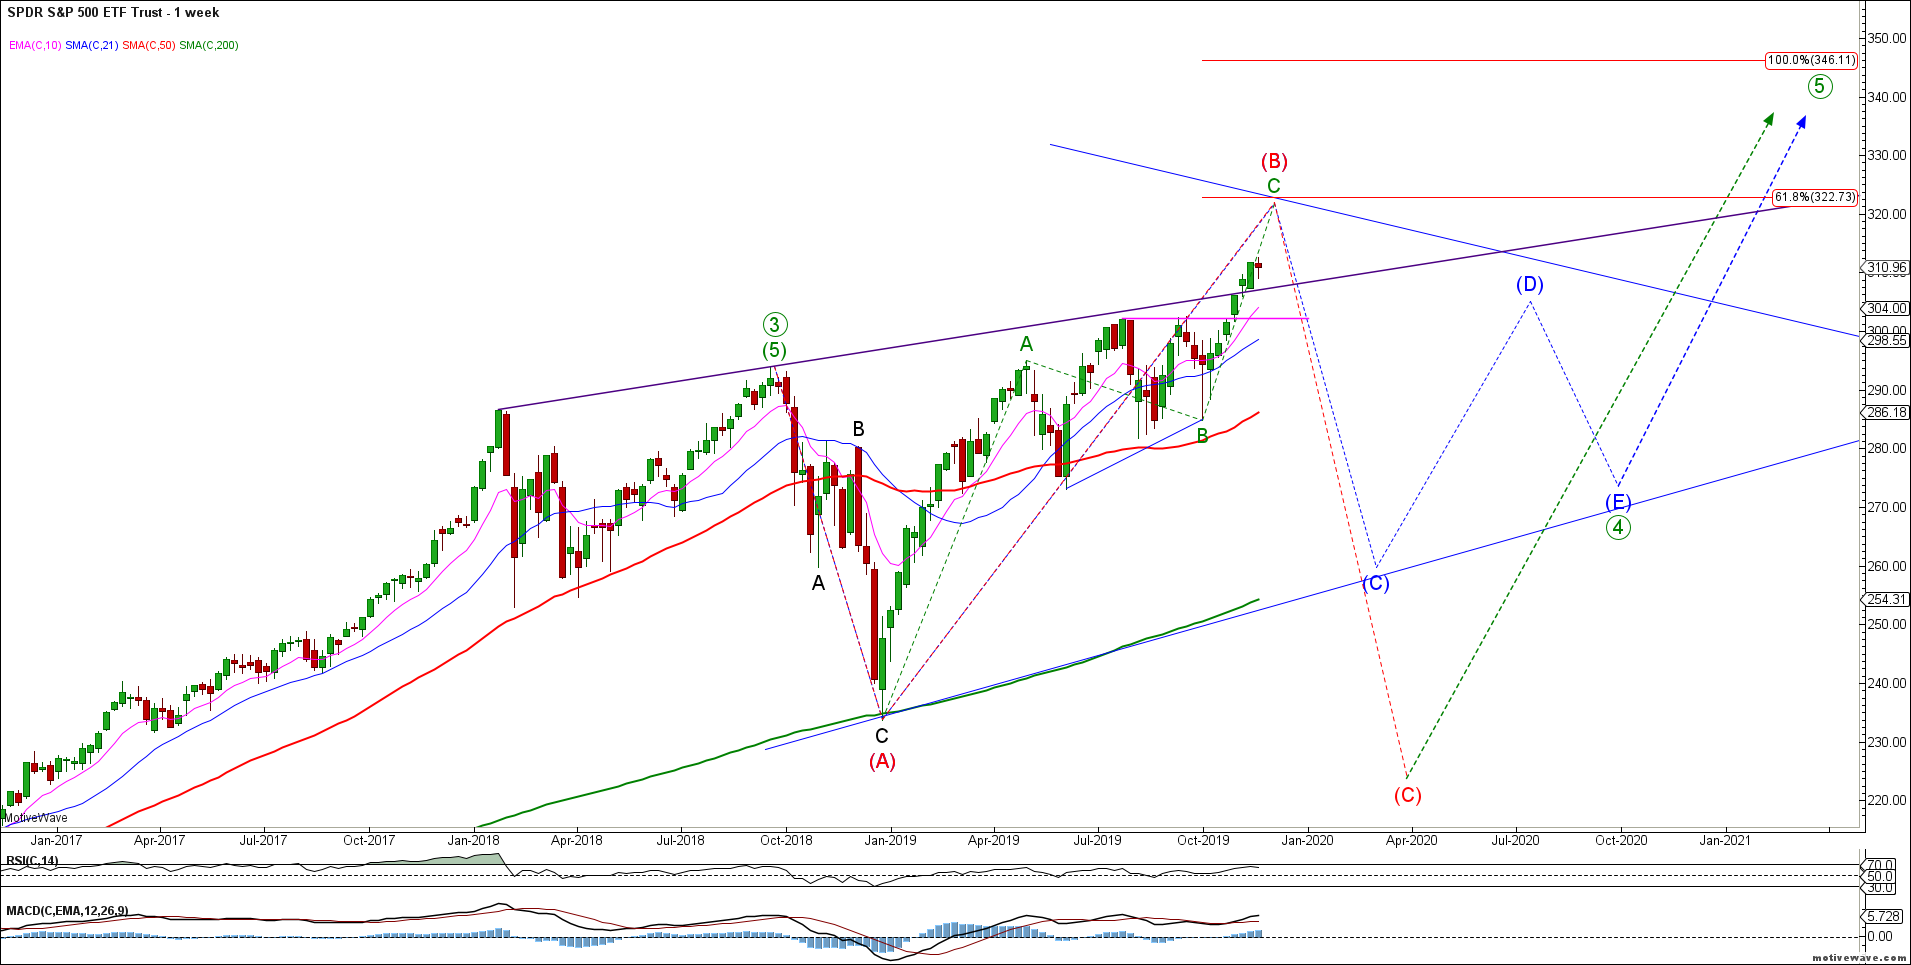
The big picture rally in SPX / ES appears in tact as wave C of (B) targets remain higher. Last week’s decline was corrective in this seasonally bullish period. We have no evidence of a tradable top in equities – the bulls remain in control.
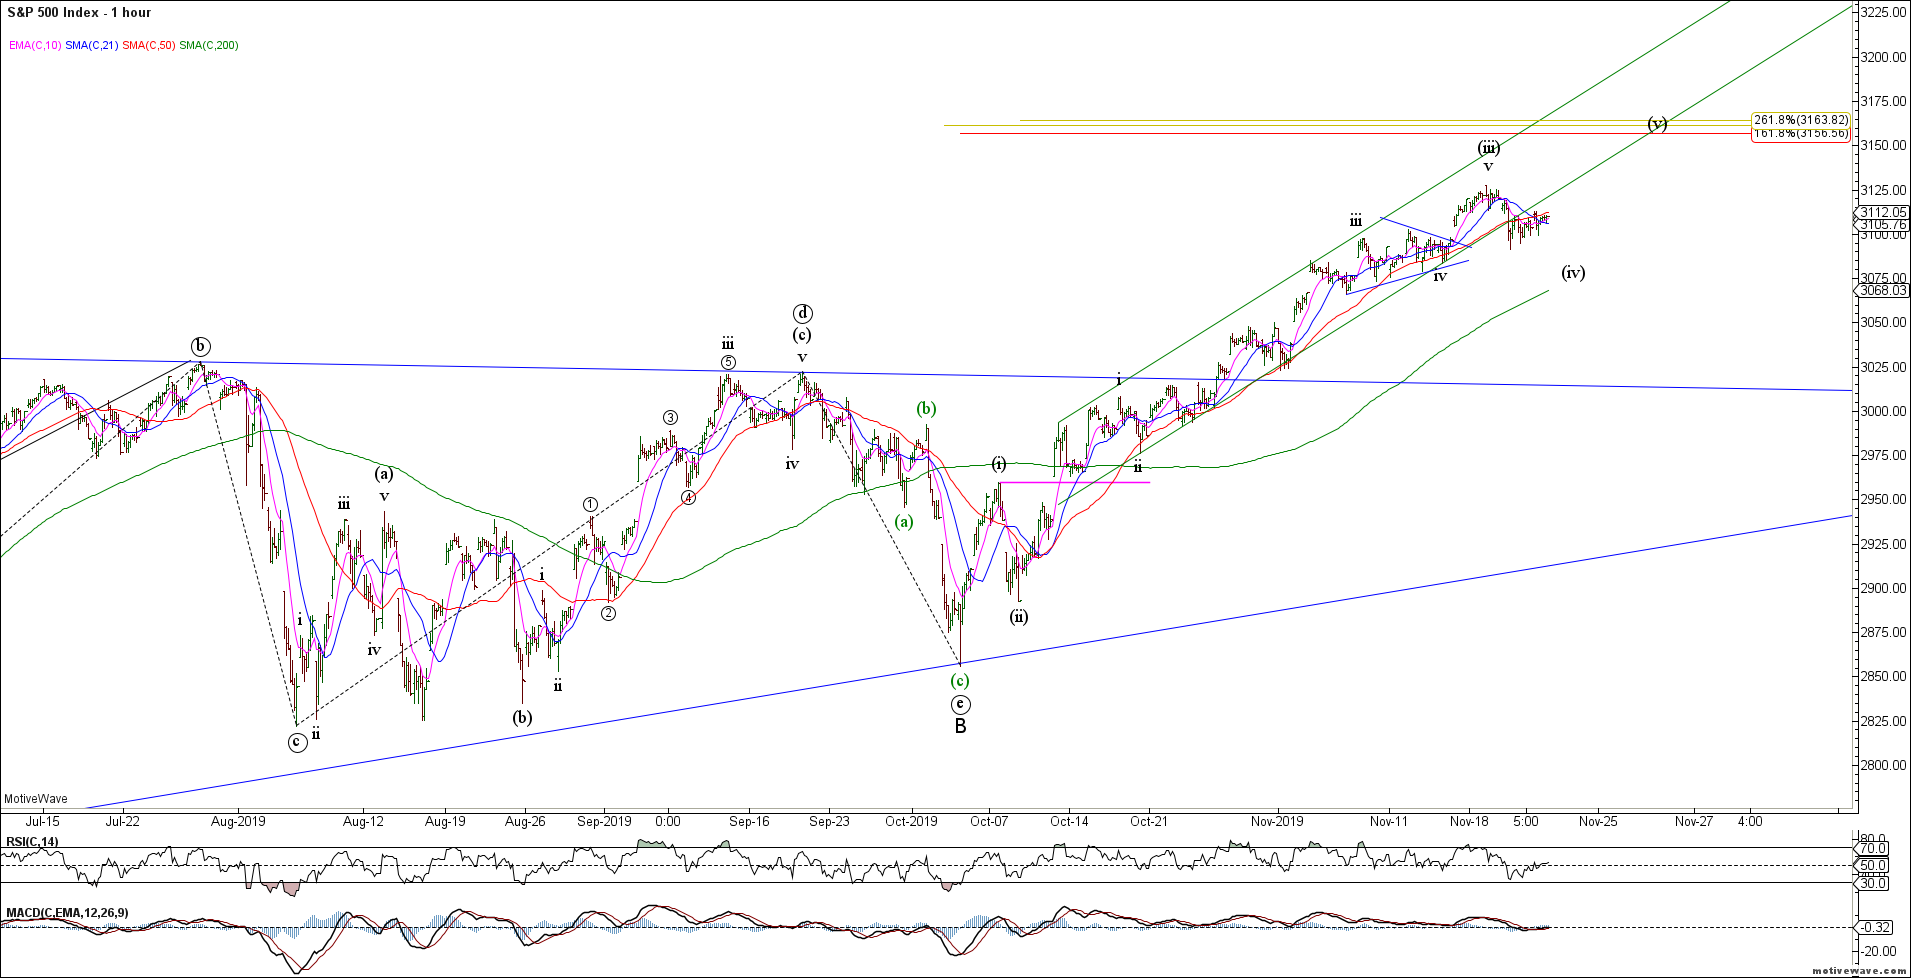
Last week’s decline in SPX / ES appears corrective for what is likely wave (iv) in an ongoing impulsive rally higher. Near term support resides in the 3075 area for the impulsive rally.
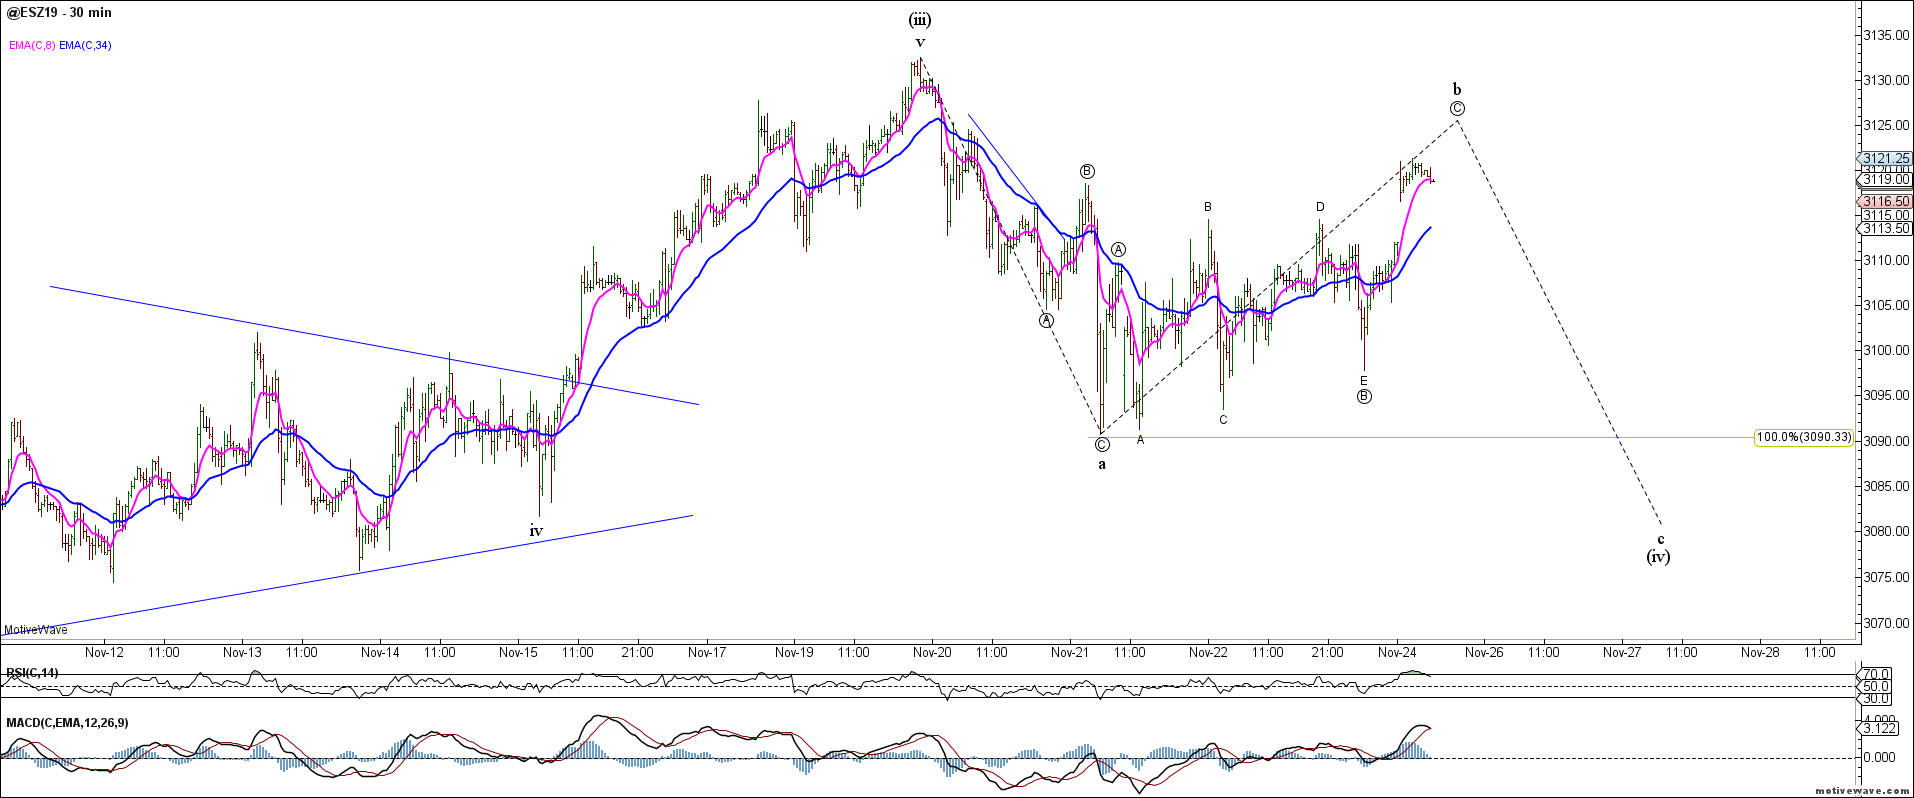
The very short term ES chart shows a corrective 3 waves down from recent swing highs. While the correction could be complete, it would look better with another wave c down to complete (iv).
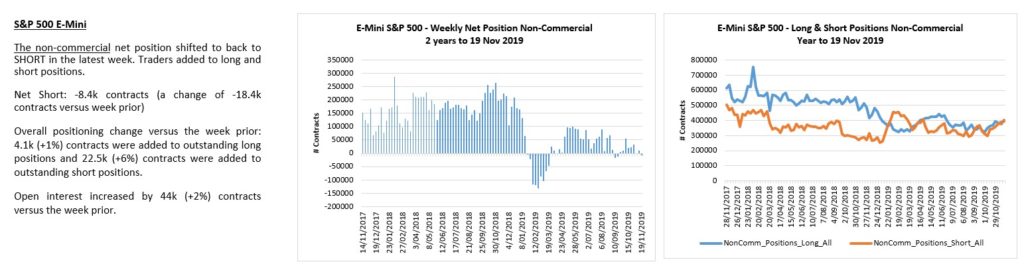
ES traders remain flat and disinterested.
The DJIA appears to have completed a small degree wave iii in this ongoing impulsive rally. Near term support resides in the 27500 area for wave iv of (iii). Trade back below 27100 invalidates this nested bull count.
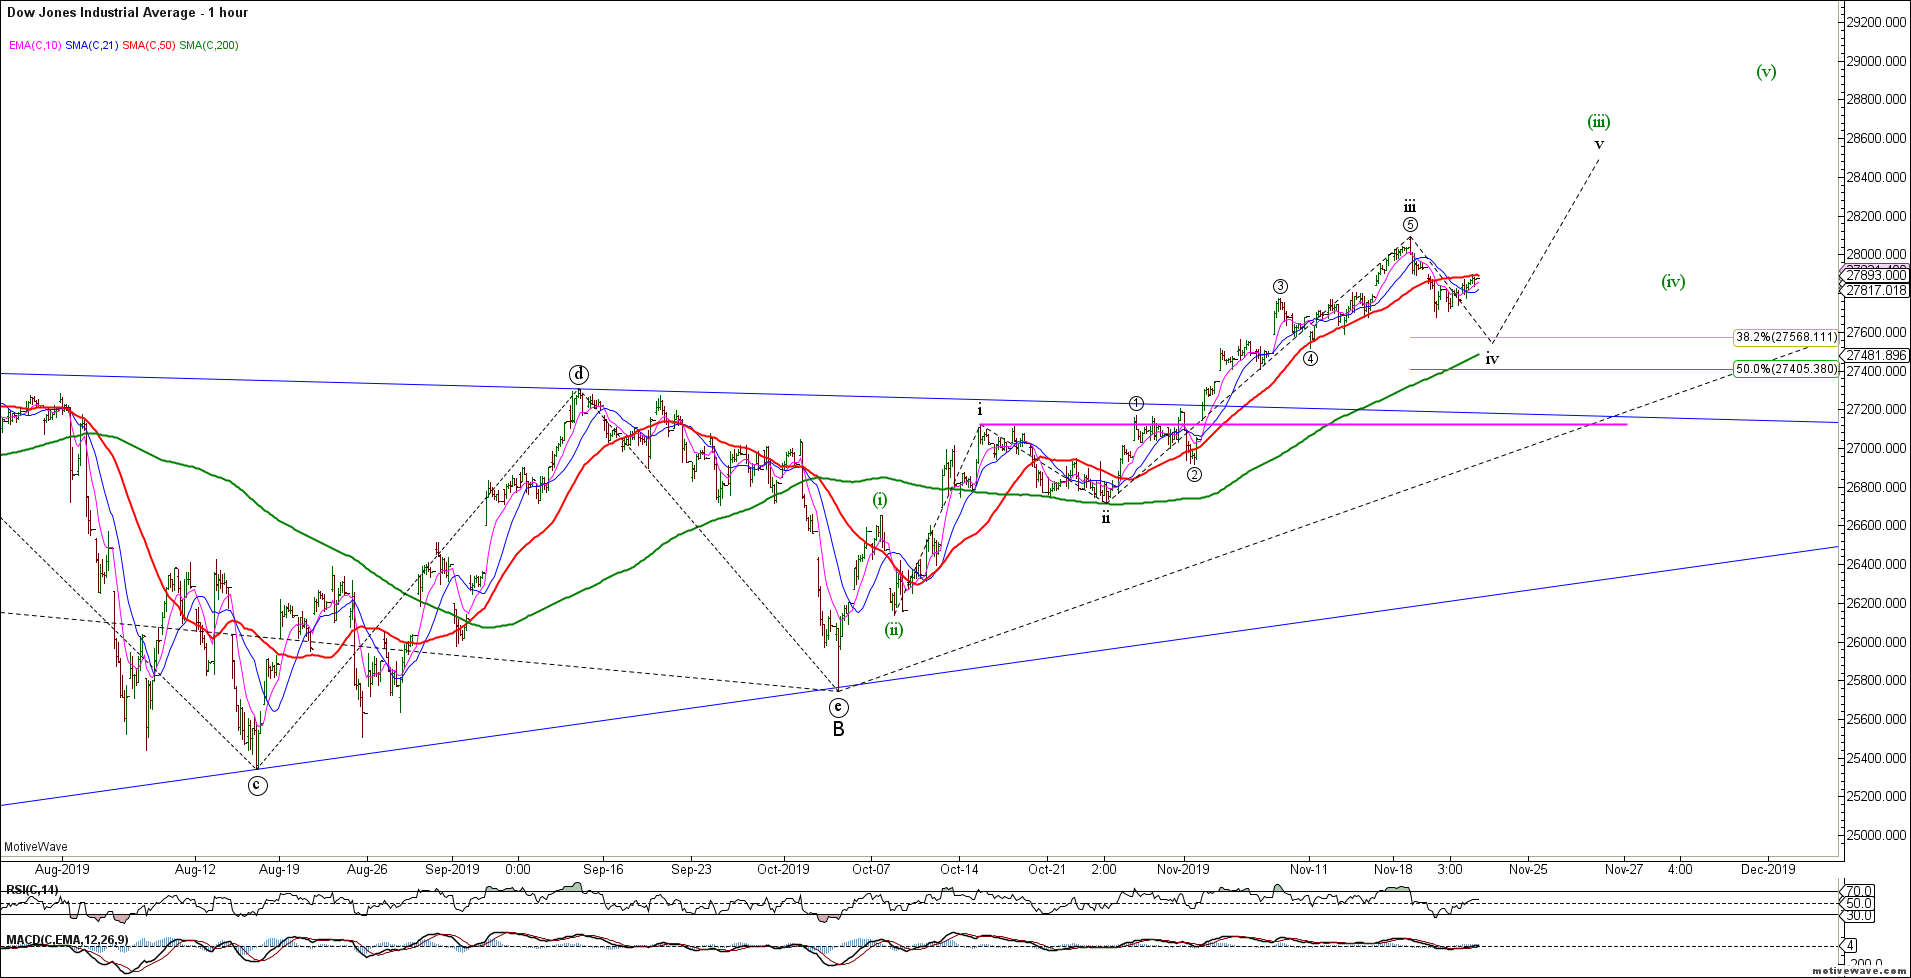
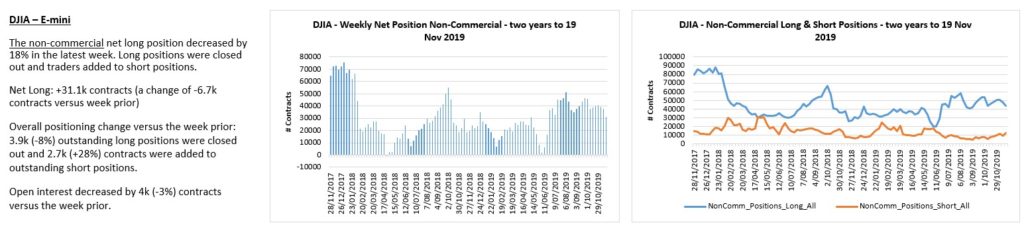
YM traders paring back longs and adding shorts.
The Nasdaq also shows the potential for a completed wave (v) (red count) but more likely a wave (iv) correction in an ongoing bullish trend (green count). No reason to fight this bullish trend until we see evidence of a bearish reversal – not just a pause within a bullish trend.
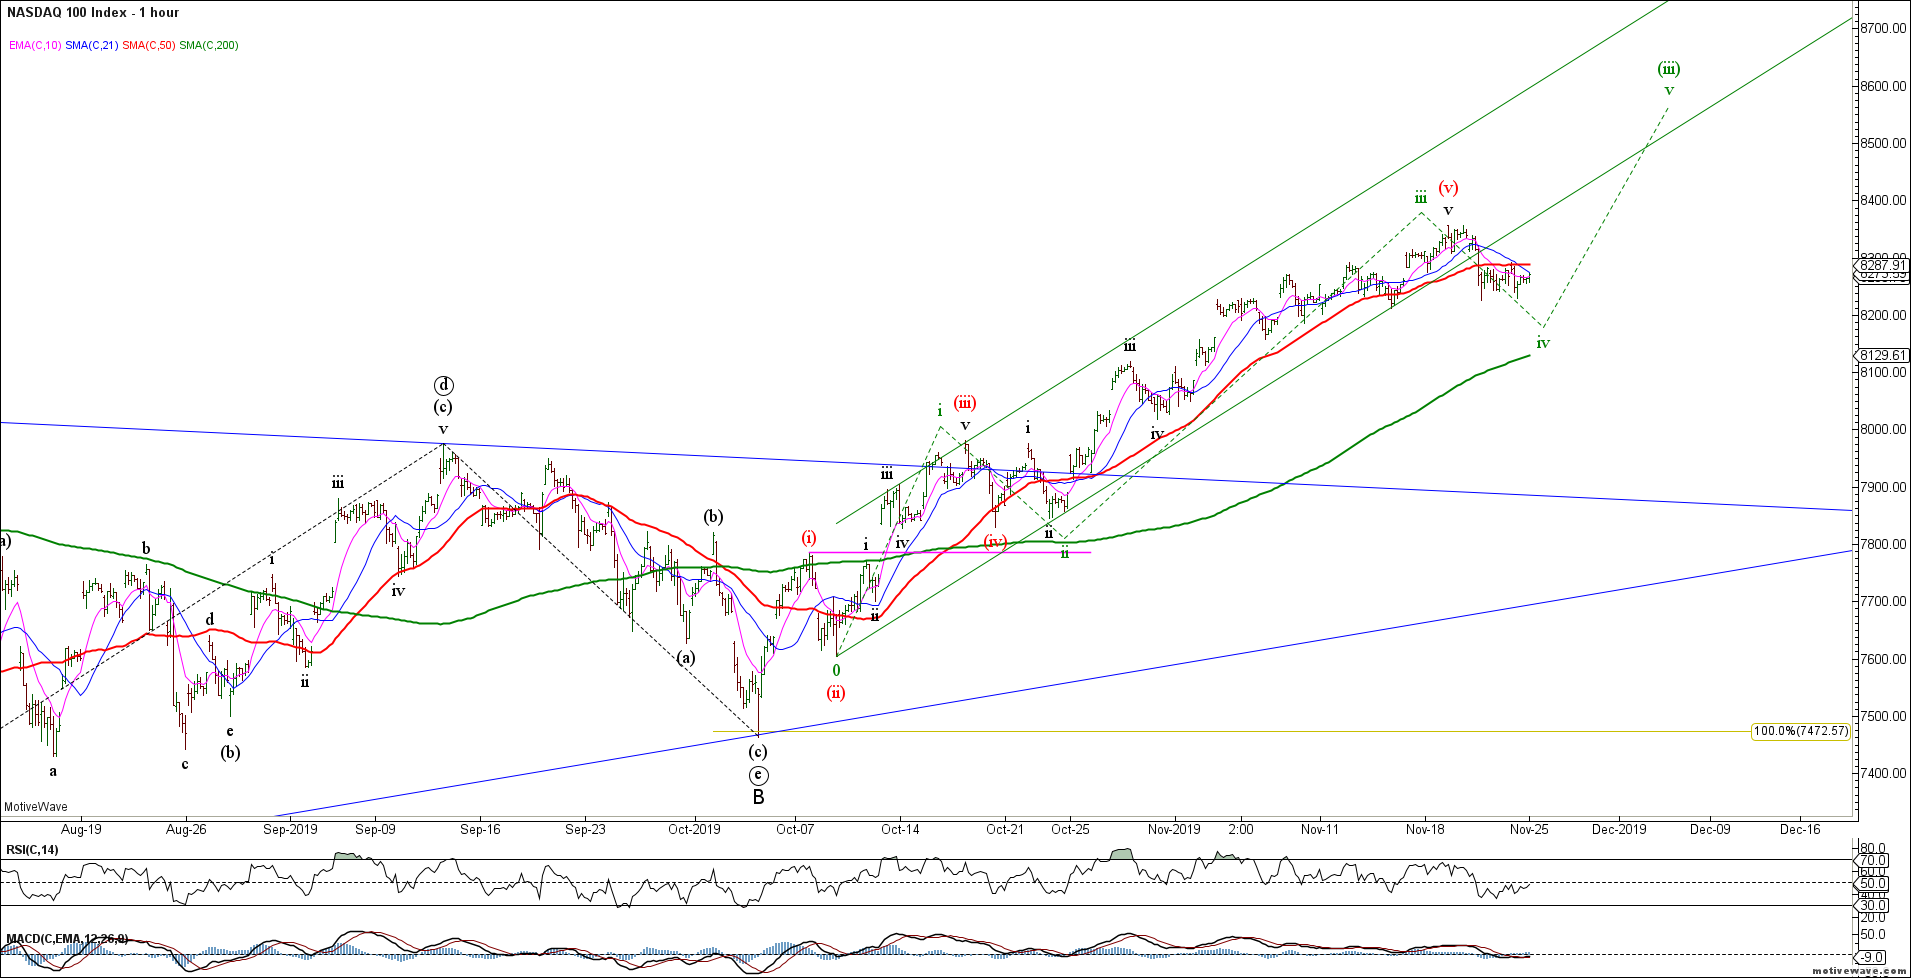
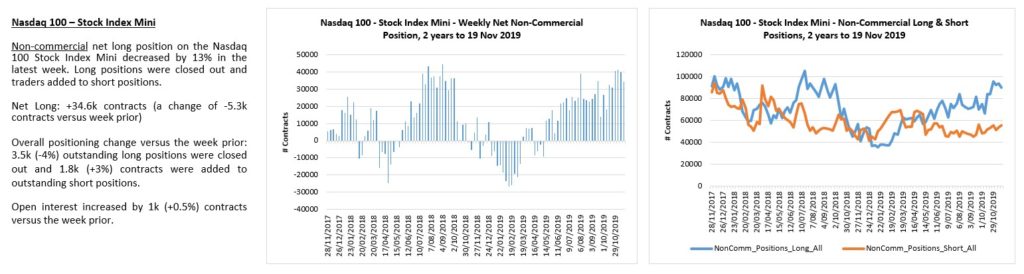
NQ traders paring back longs.
The Russell 2000 / RTY continues to trade sideways in what appears to be a bull flag prior to a range breakout. A strong close above 1616-25 resistance would likely trigger a chase higher for the small caps. In the meantime, resistance continues to hold.
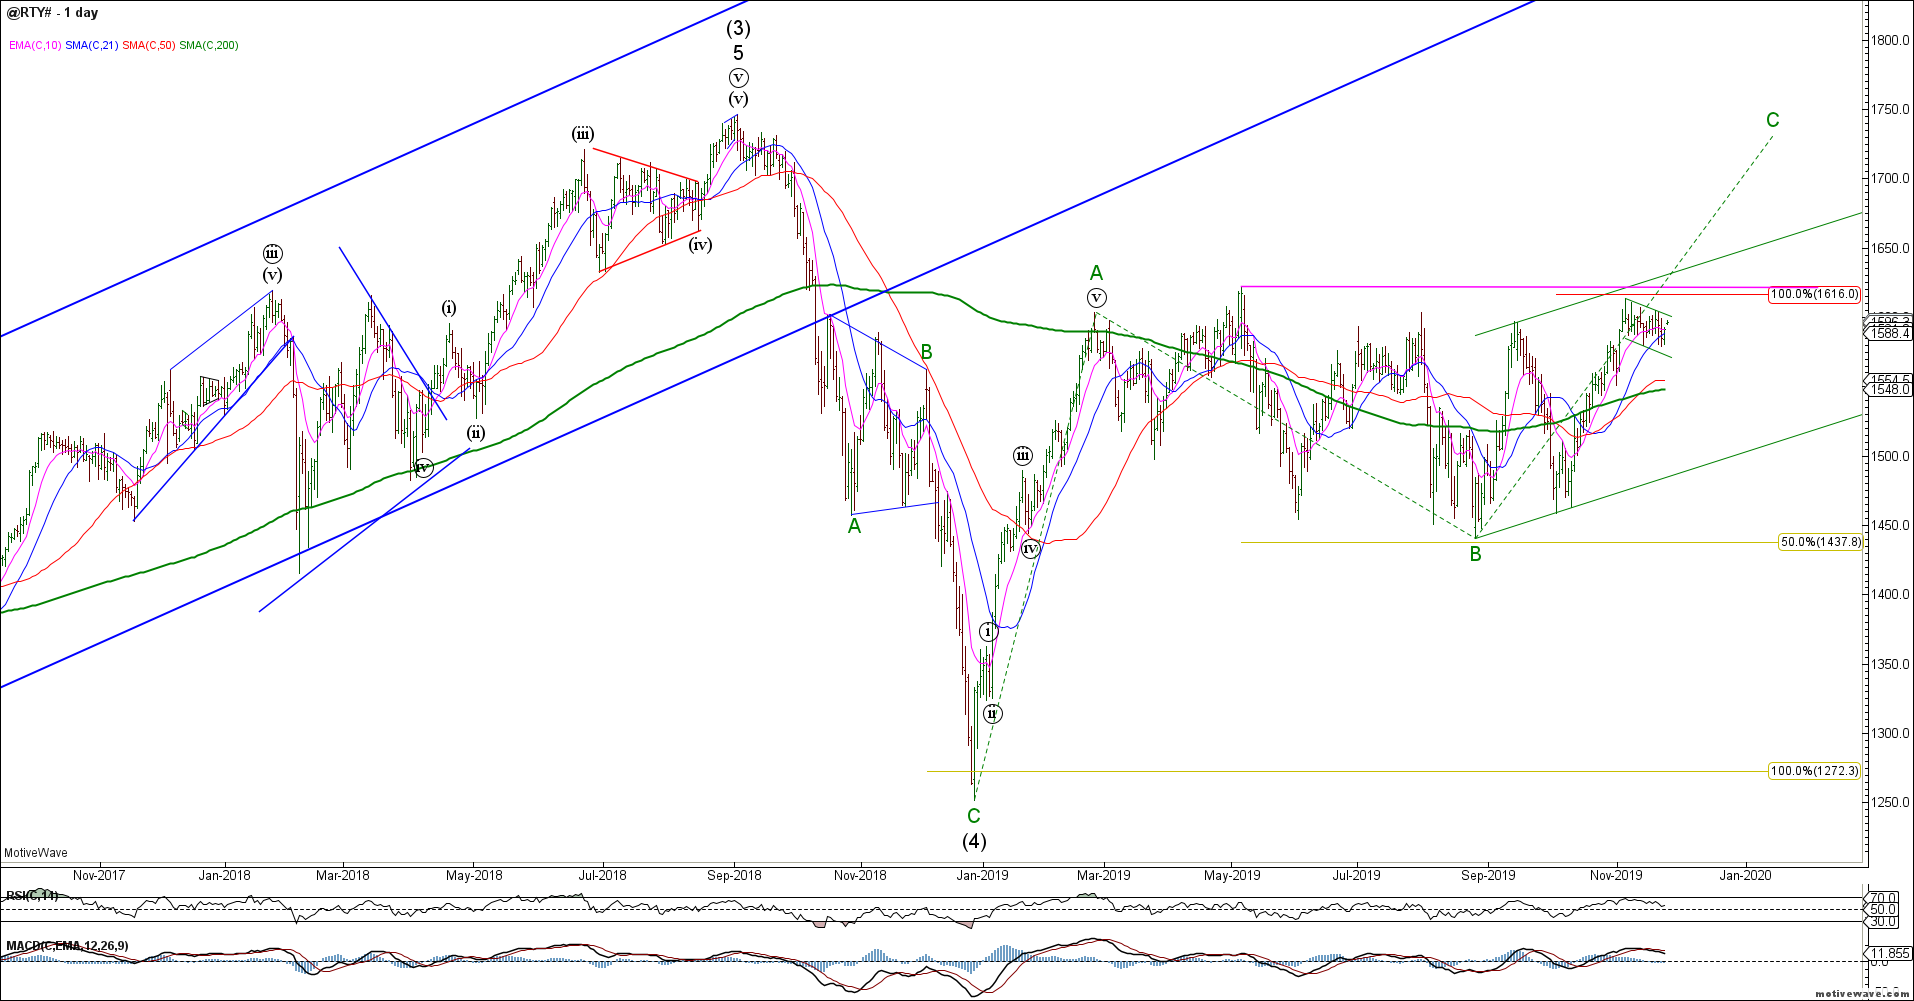
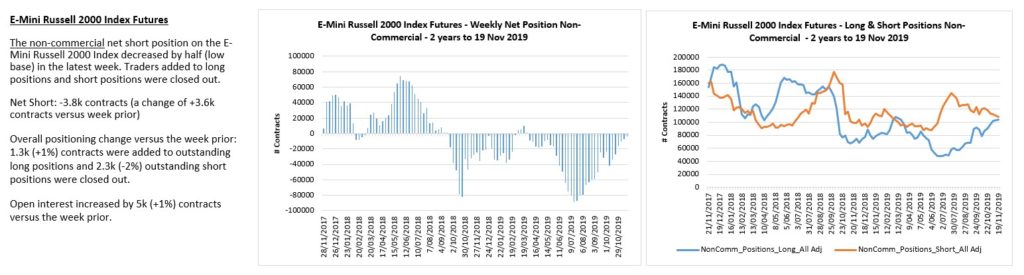
RTY traders are flat.
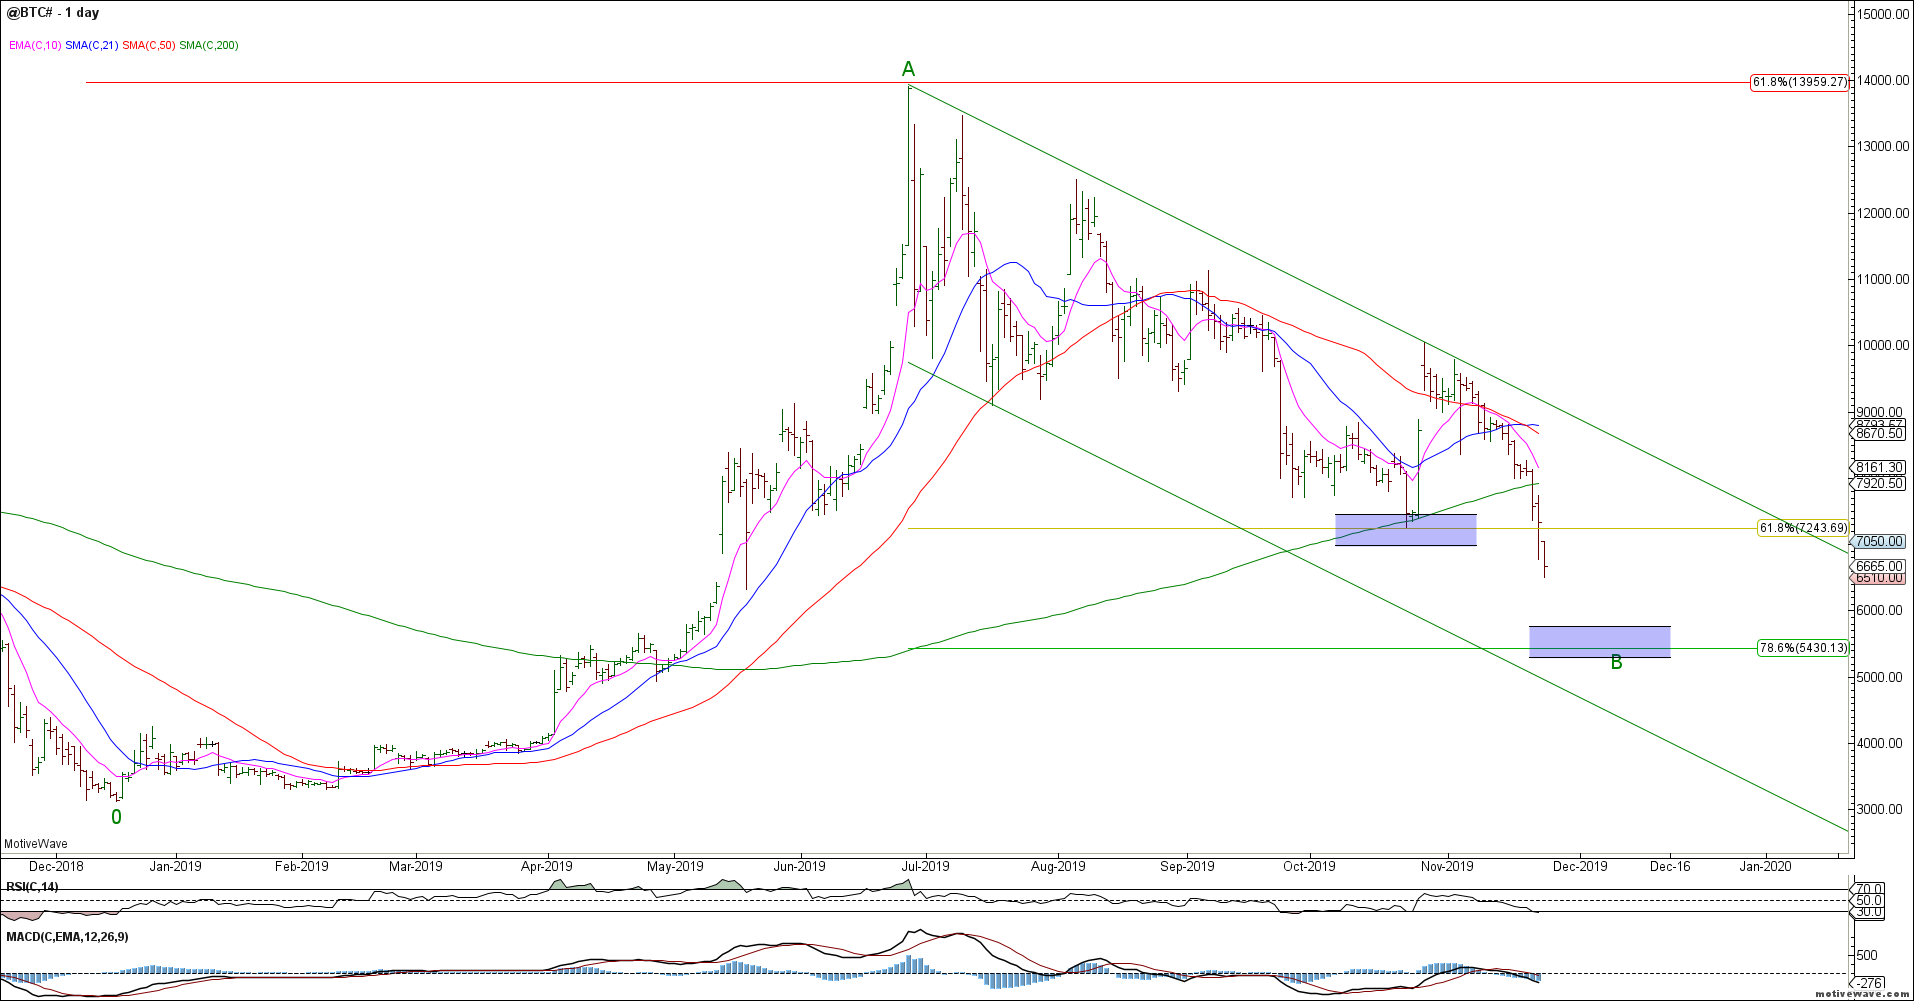
Bitcoin broke our Fib and 200 day sma support and puked lower. This decline invalidated our near term bullish count. We no longer have a clear corrective count for BTC but the next ideal downside support targets reside in the 5400 area.
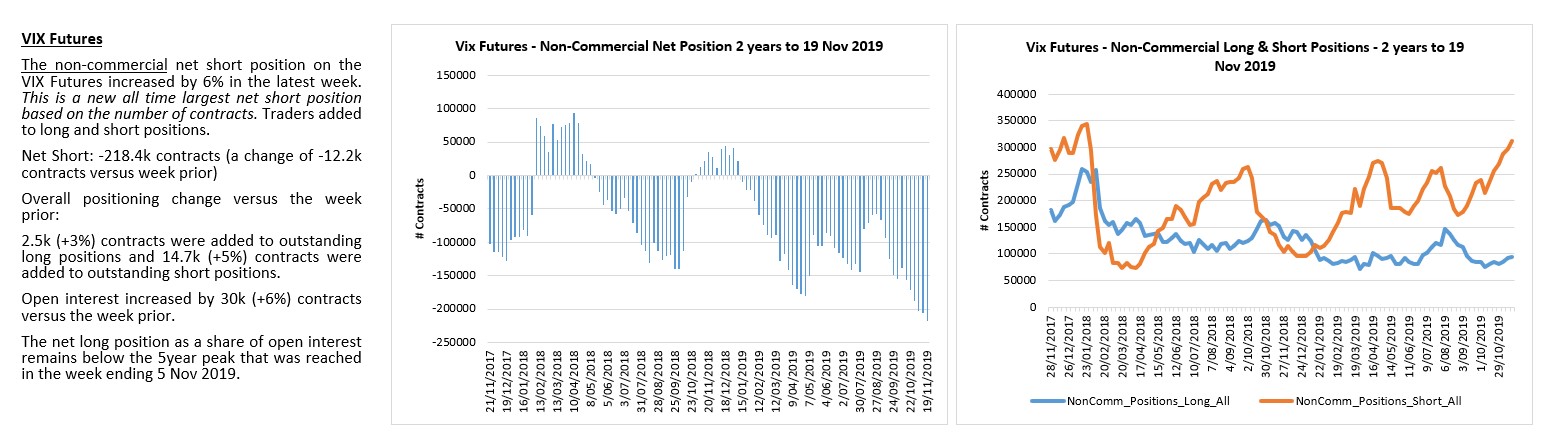
The VIX has shown no evidence of a bullish reversal and is threatening to break lower. With net short positioning at extremes the VIX is vulnerable to a short squeeze but the market has shown no evidence of trend exhaustion.
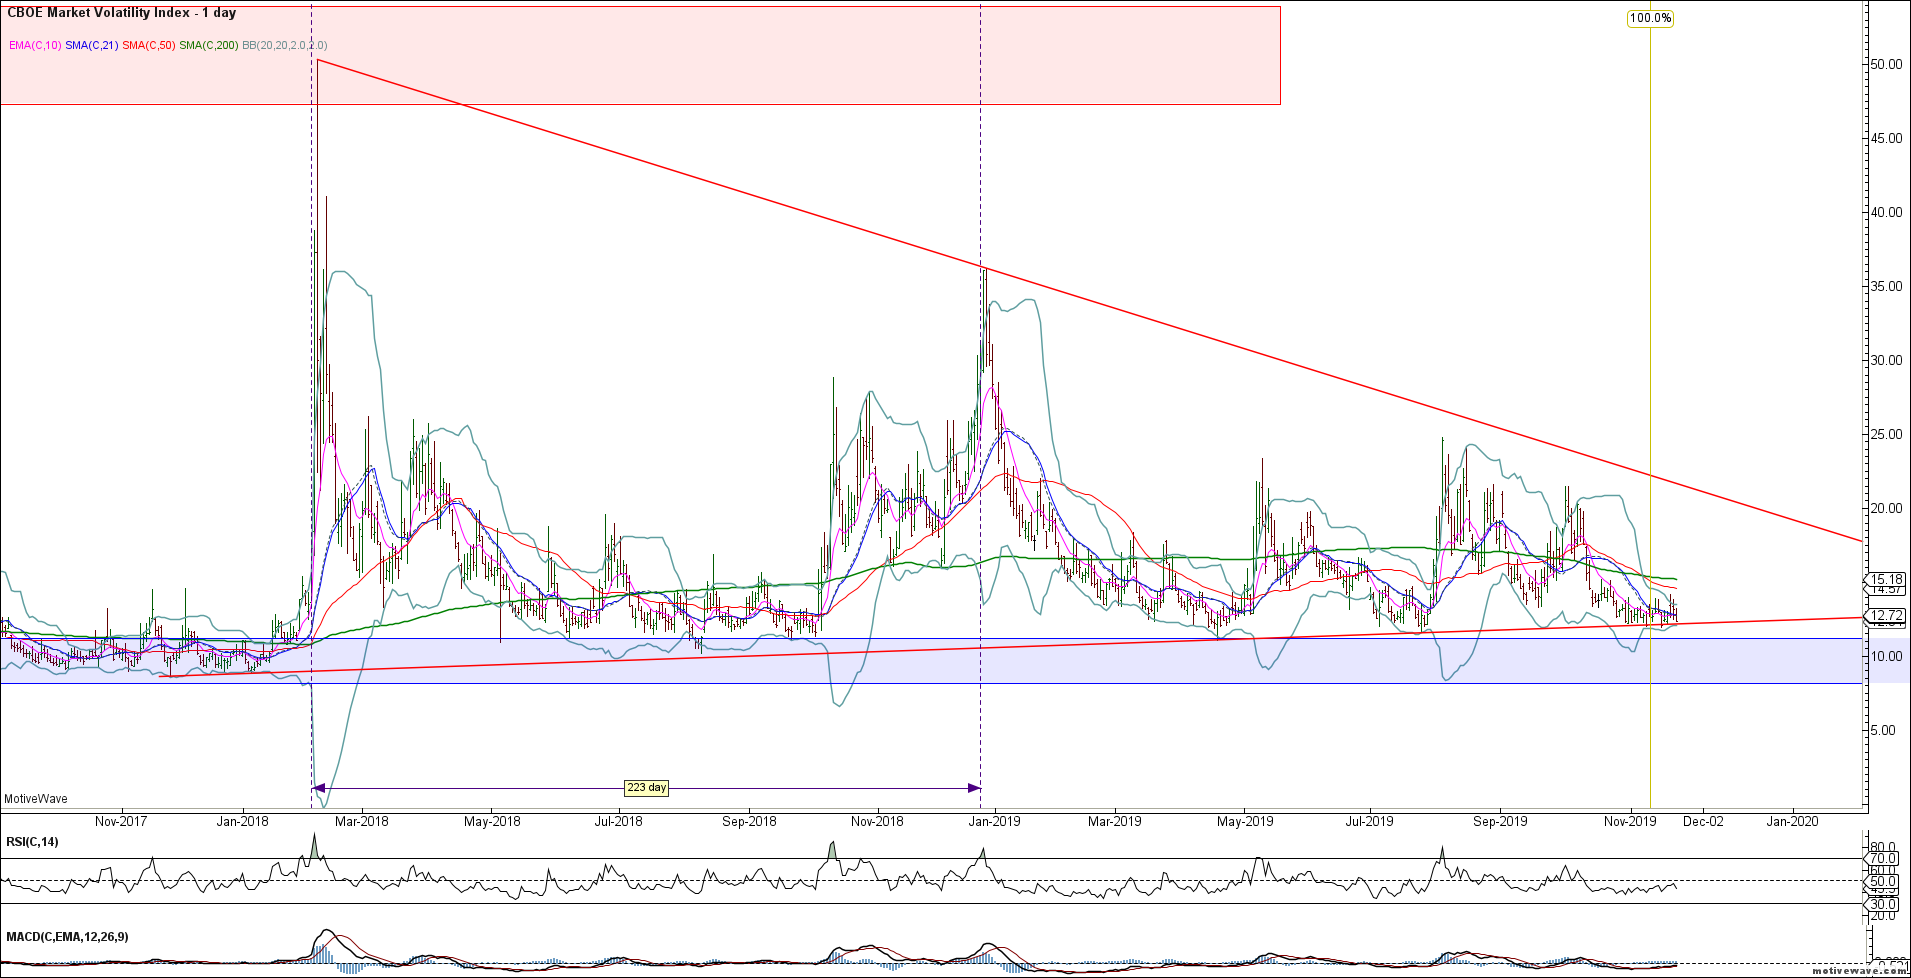
Net VIX shorts continue to press into extremes.
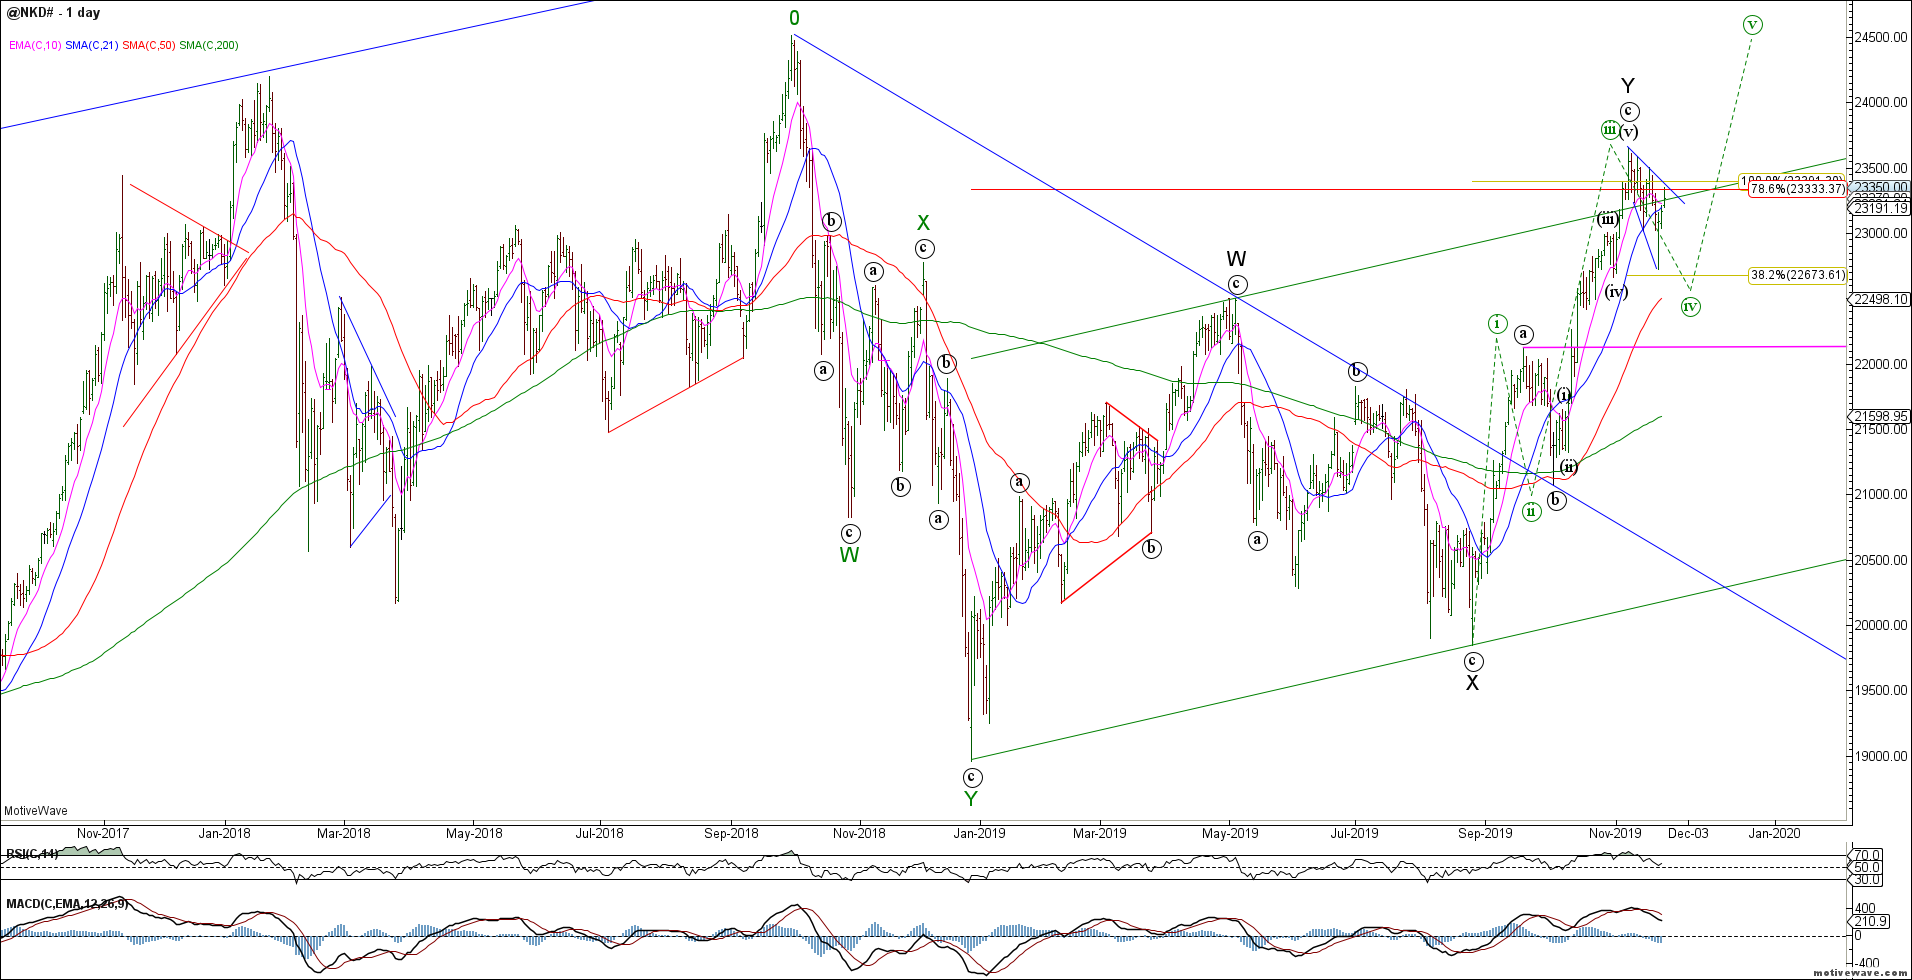
The global equity markets corrected lower last week but there is no strong evidence of a bearish reversal. The NKD declined into previous wave (iv) support then reversed higher. This opens the door to a more bullish interpretation of a wave (iv) correction before wave (v) pushes higher to retest swing highs.
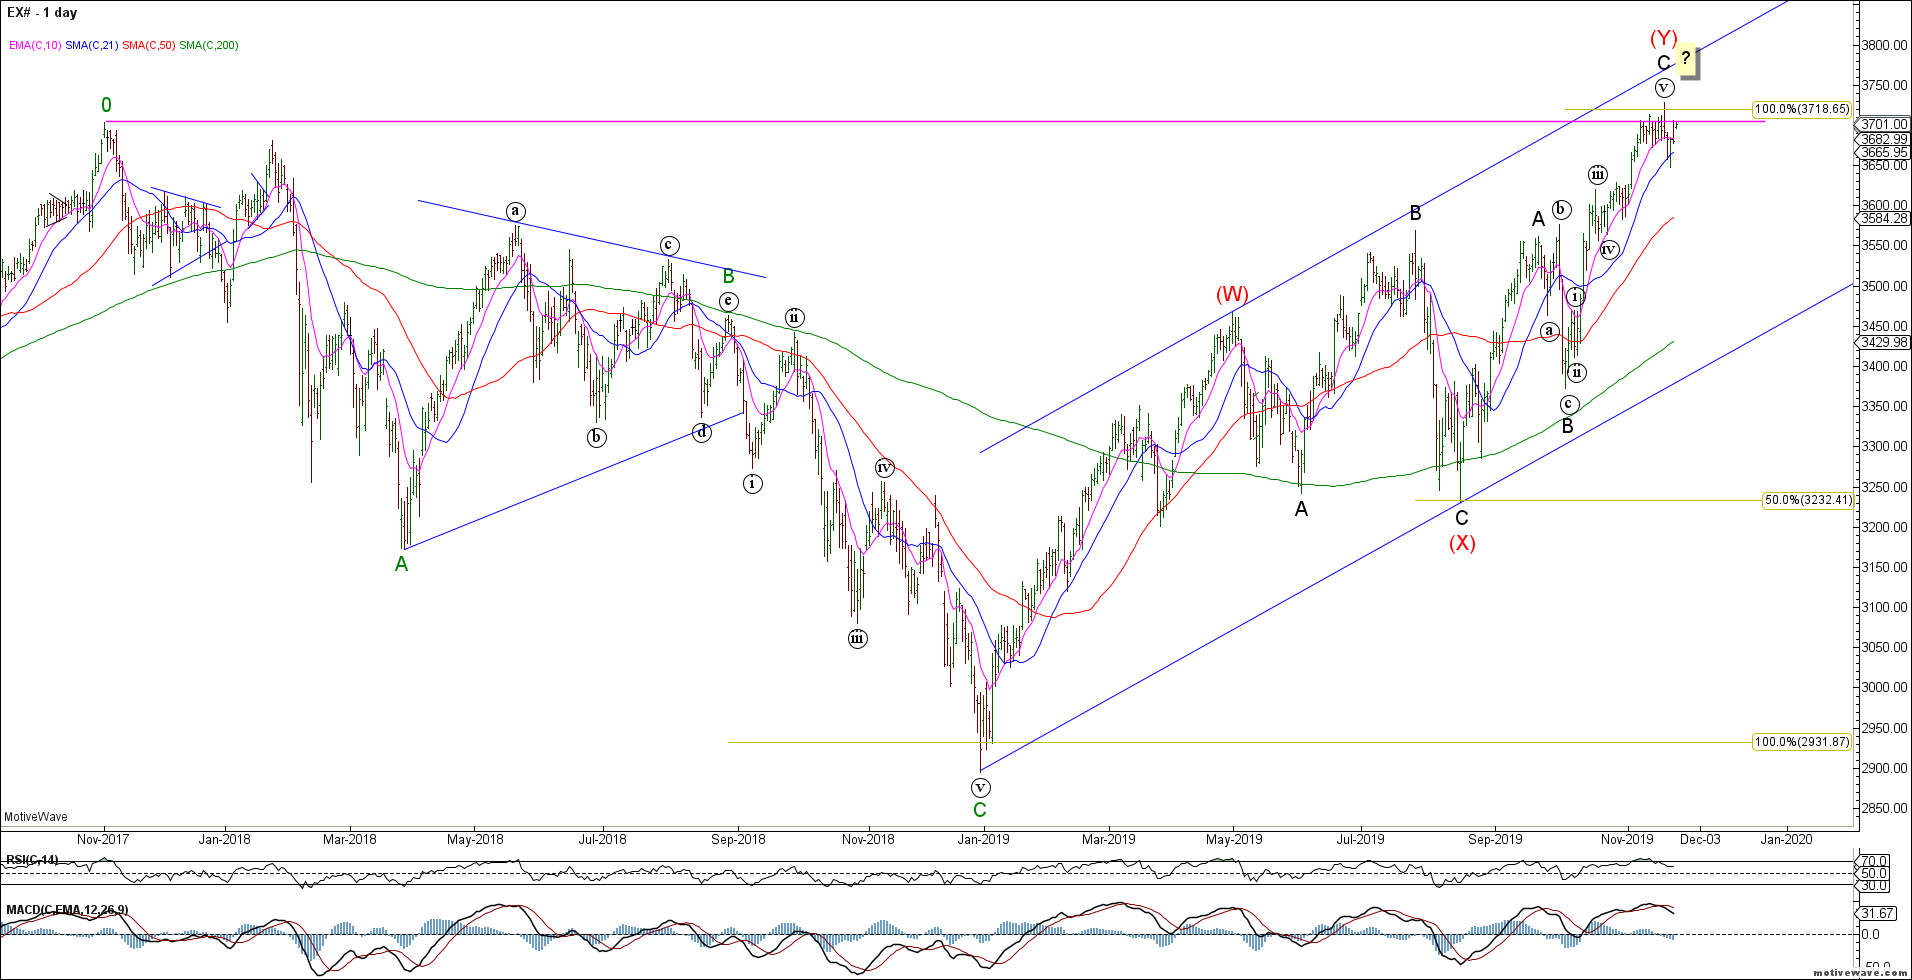
The ESTX achieved upside measured targets but failed to sustain a reversal lower. The bullish trend remains in tact until we see a clear impulsive 5 wave decline to reverse this trend. Either way, longs should be very cautious here because at best any new cycle high will likely be a final 5th wave.
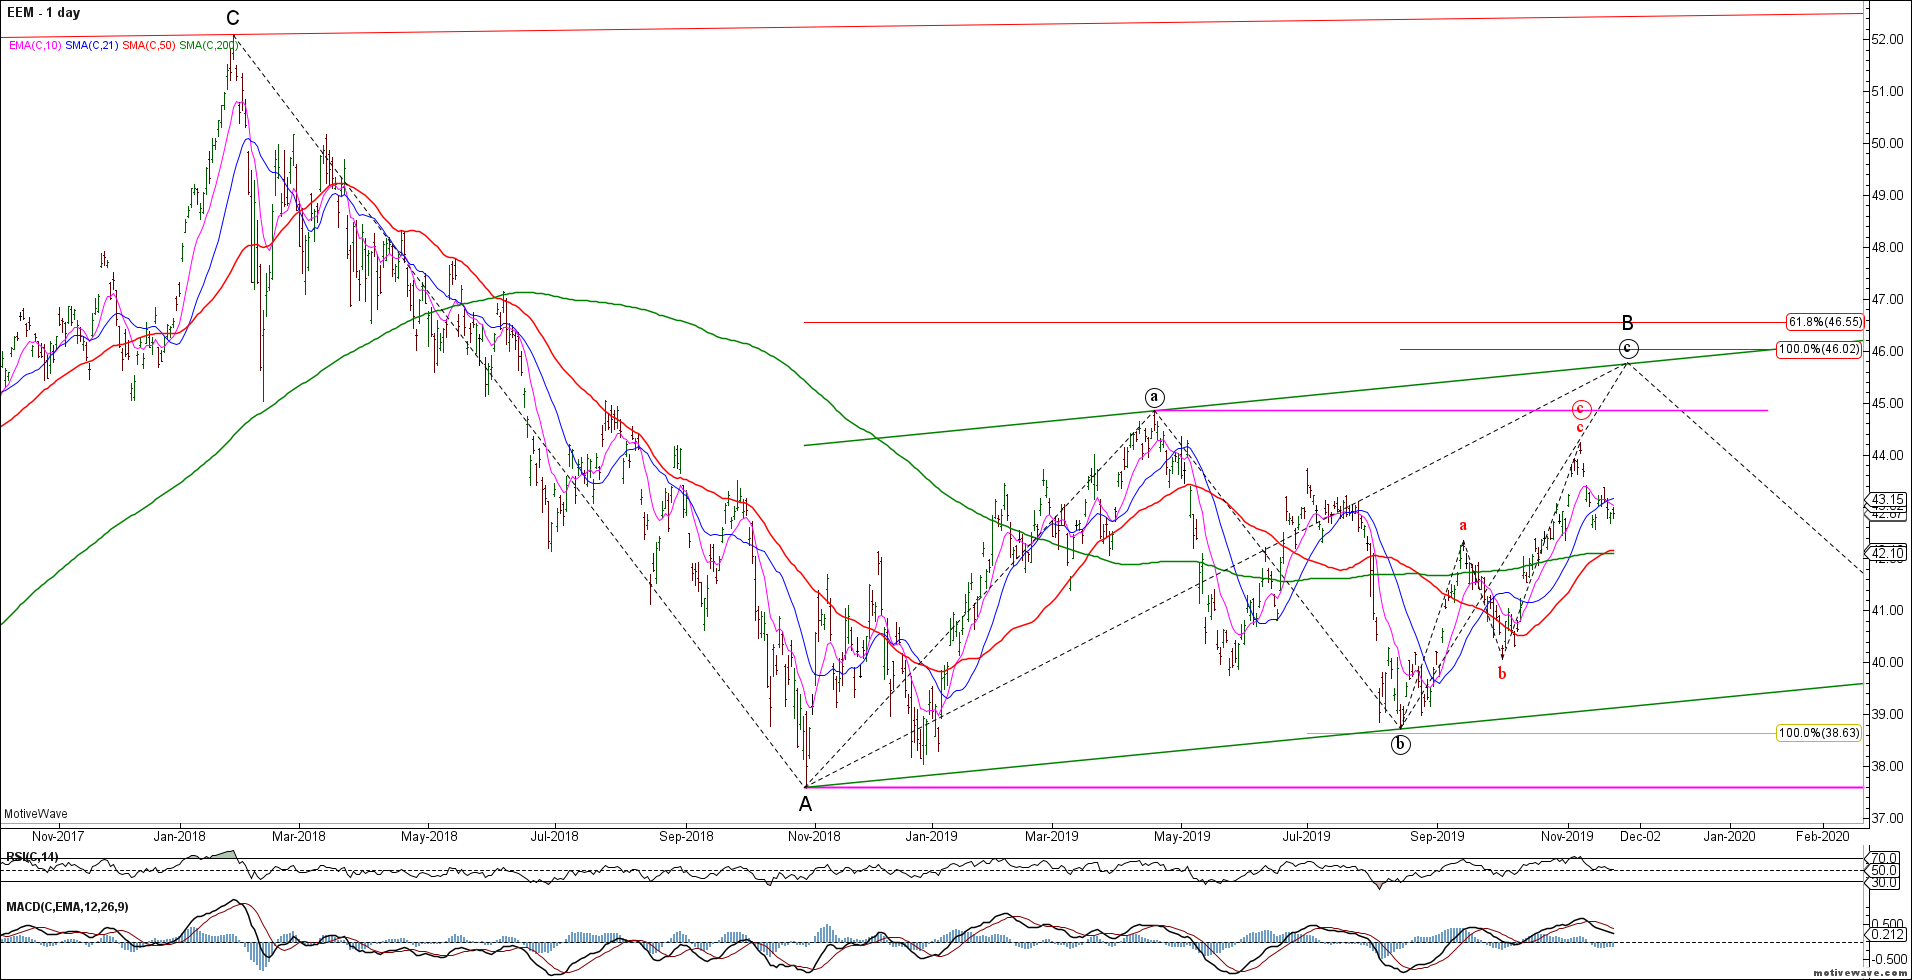
The Emerging Markets (EEM) continues to underperform and with only 3 waves up so far, it is unclear whether we get a final push higher towards ideal 46 targets. The EEM will continue to underperform while the US$ remains strong. Risks failure here given our bigger picture bearish outlook.
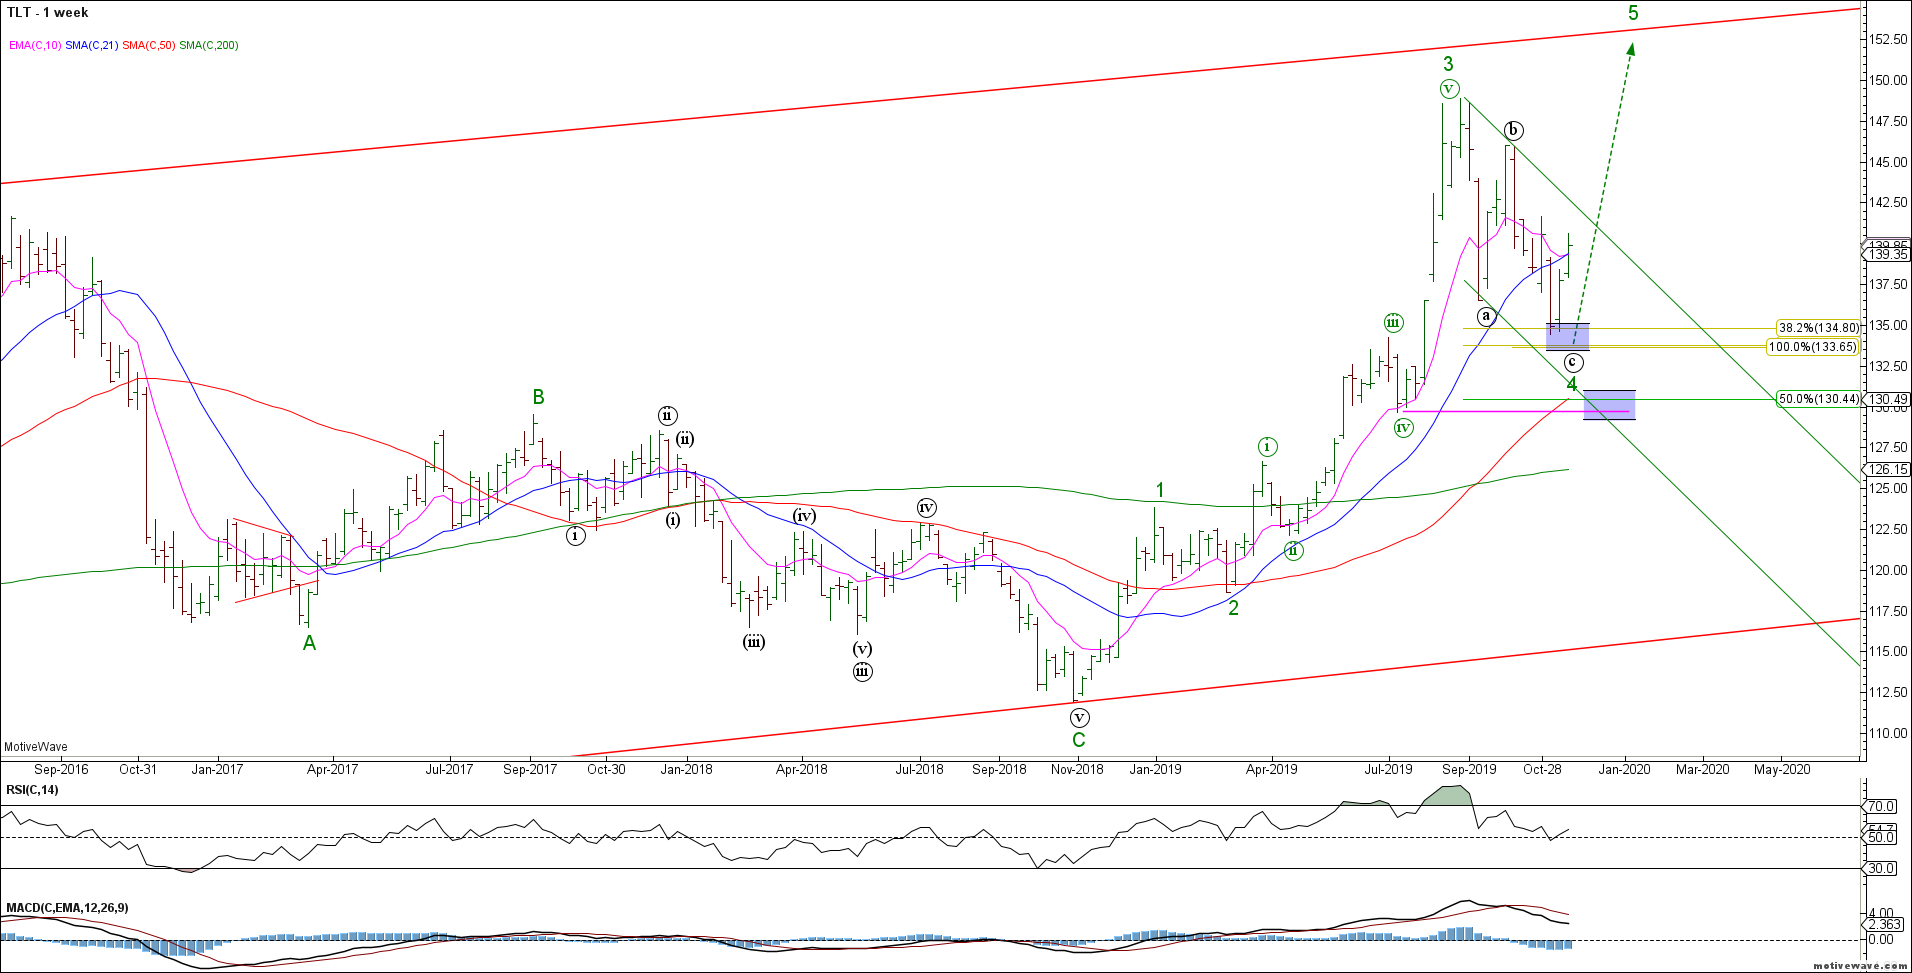
To the Bond markets and the TLT rally continued higher as expected from wave 4 support. Bulls remain in control while swing lows hold. Near term we should see evidence of a corrective decline this week.
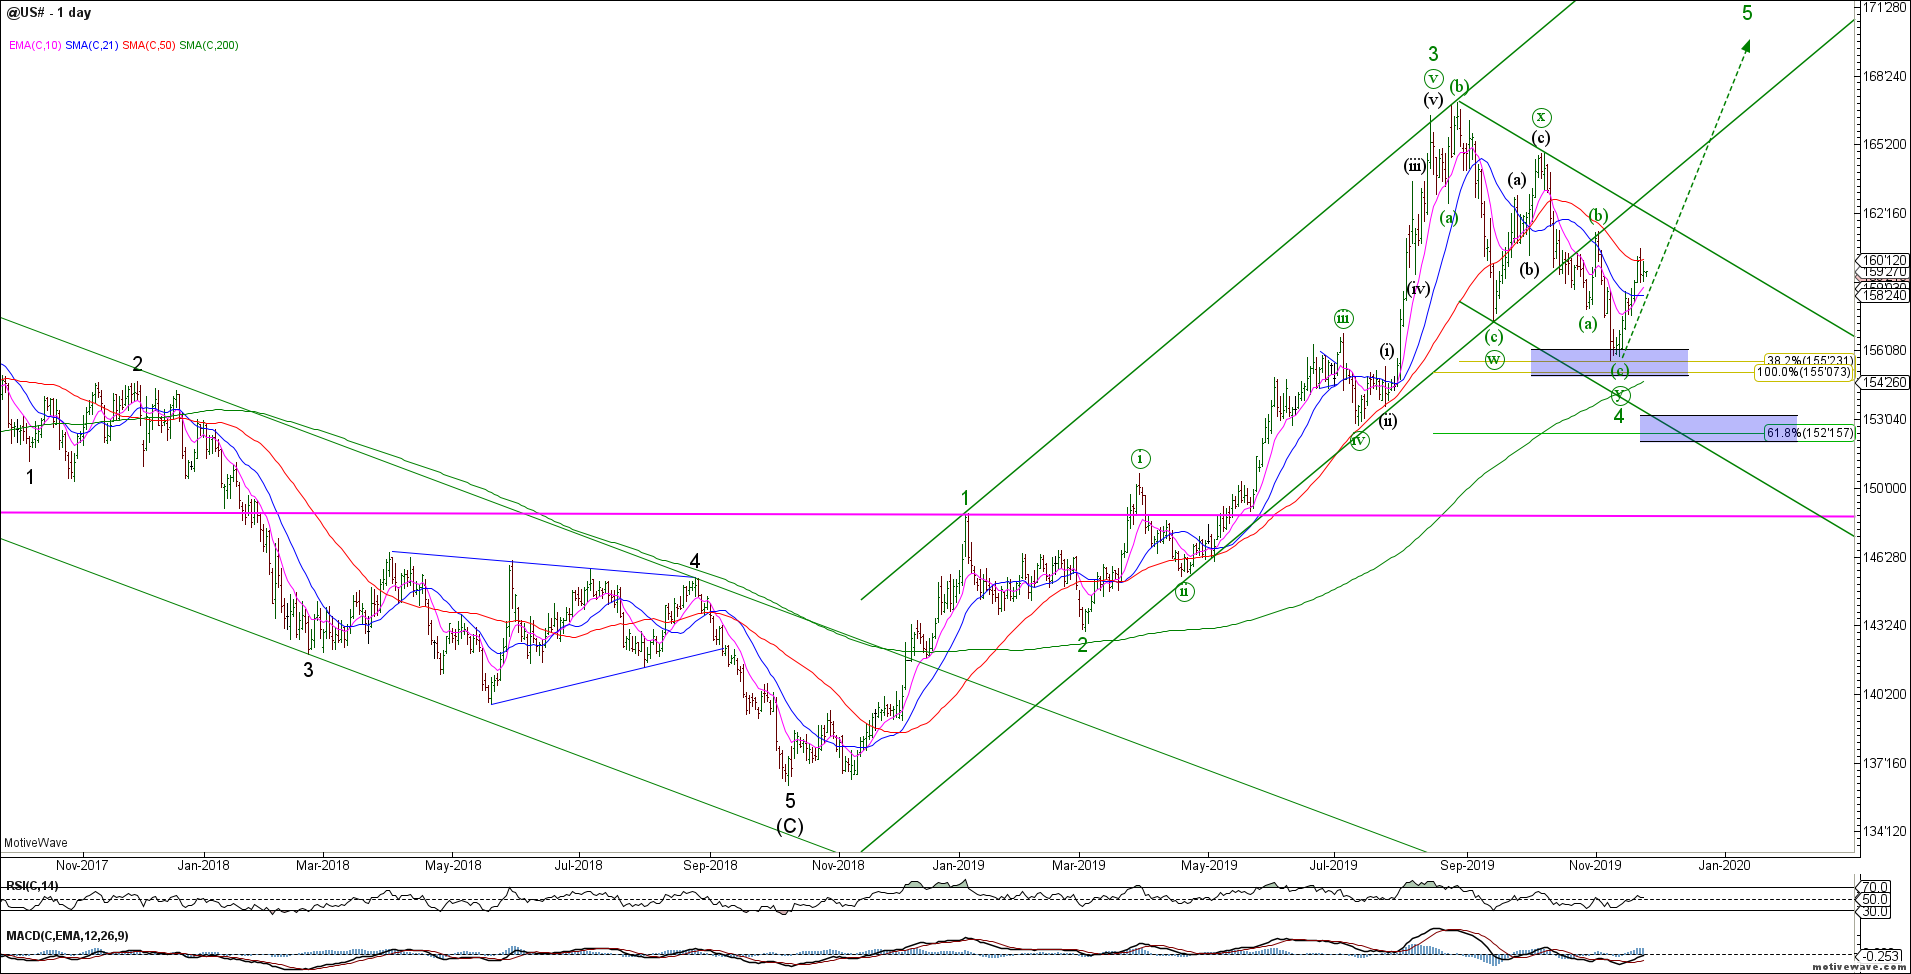
The 30yr ZB shows an impulsive rally from recent swing lows. We remain bullish from a big picture perspective looking for wave 5 to new cycle highs.
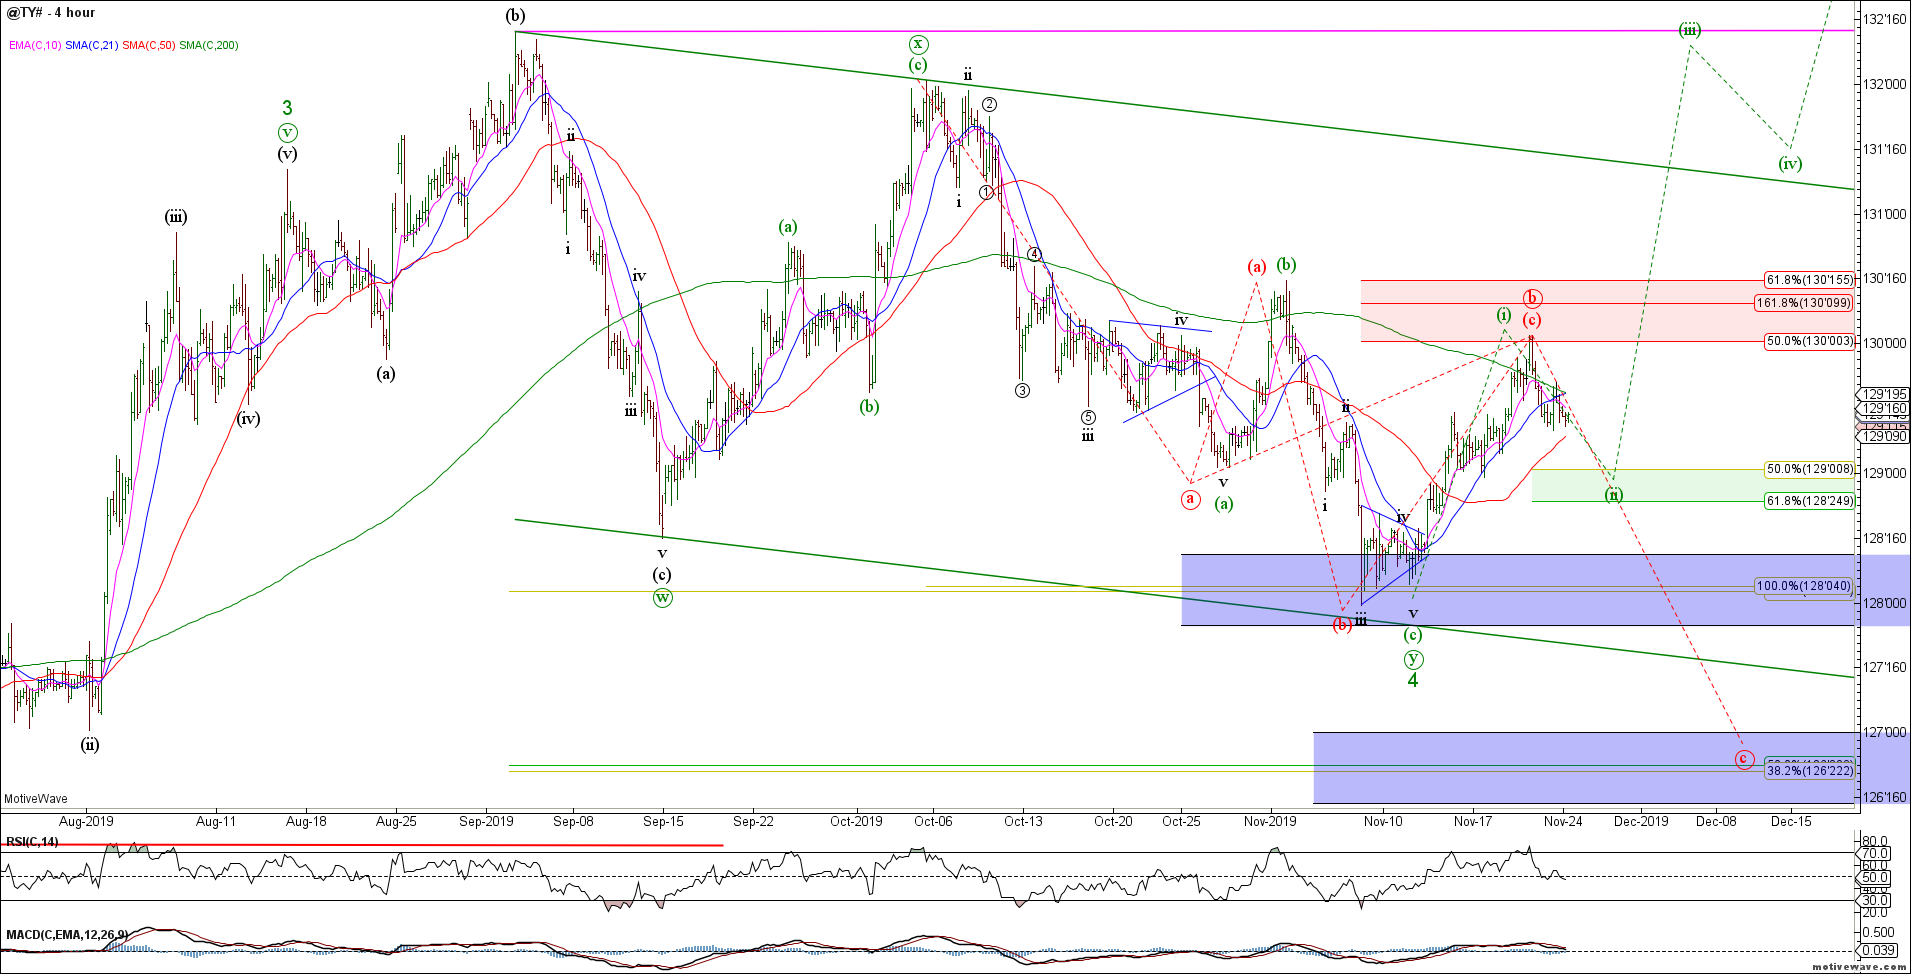
The TY shows the same bullish potential with a potentially complete 5 waves up from recent swing lows. Near term bulls should hold the 128’25-129’00 support zone for wave (ii) of the bull count.
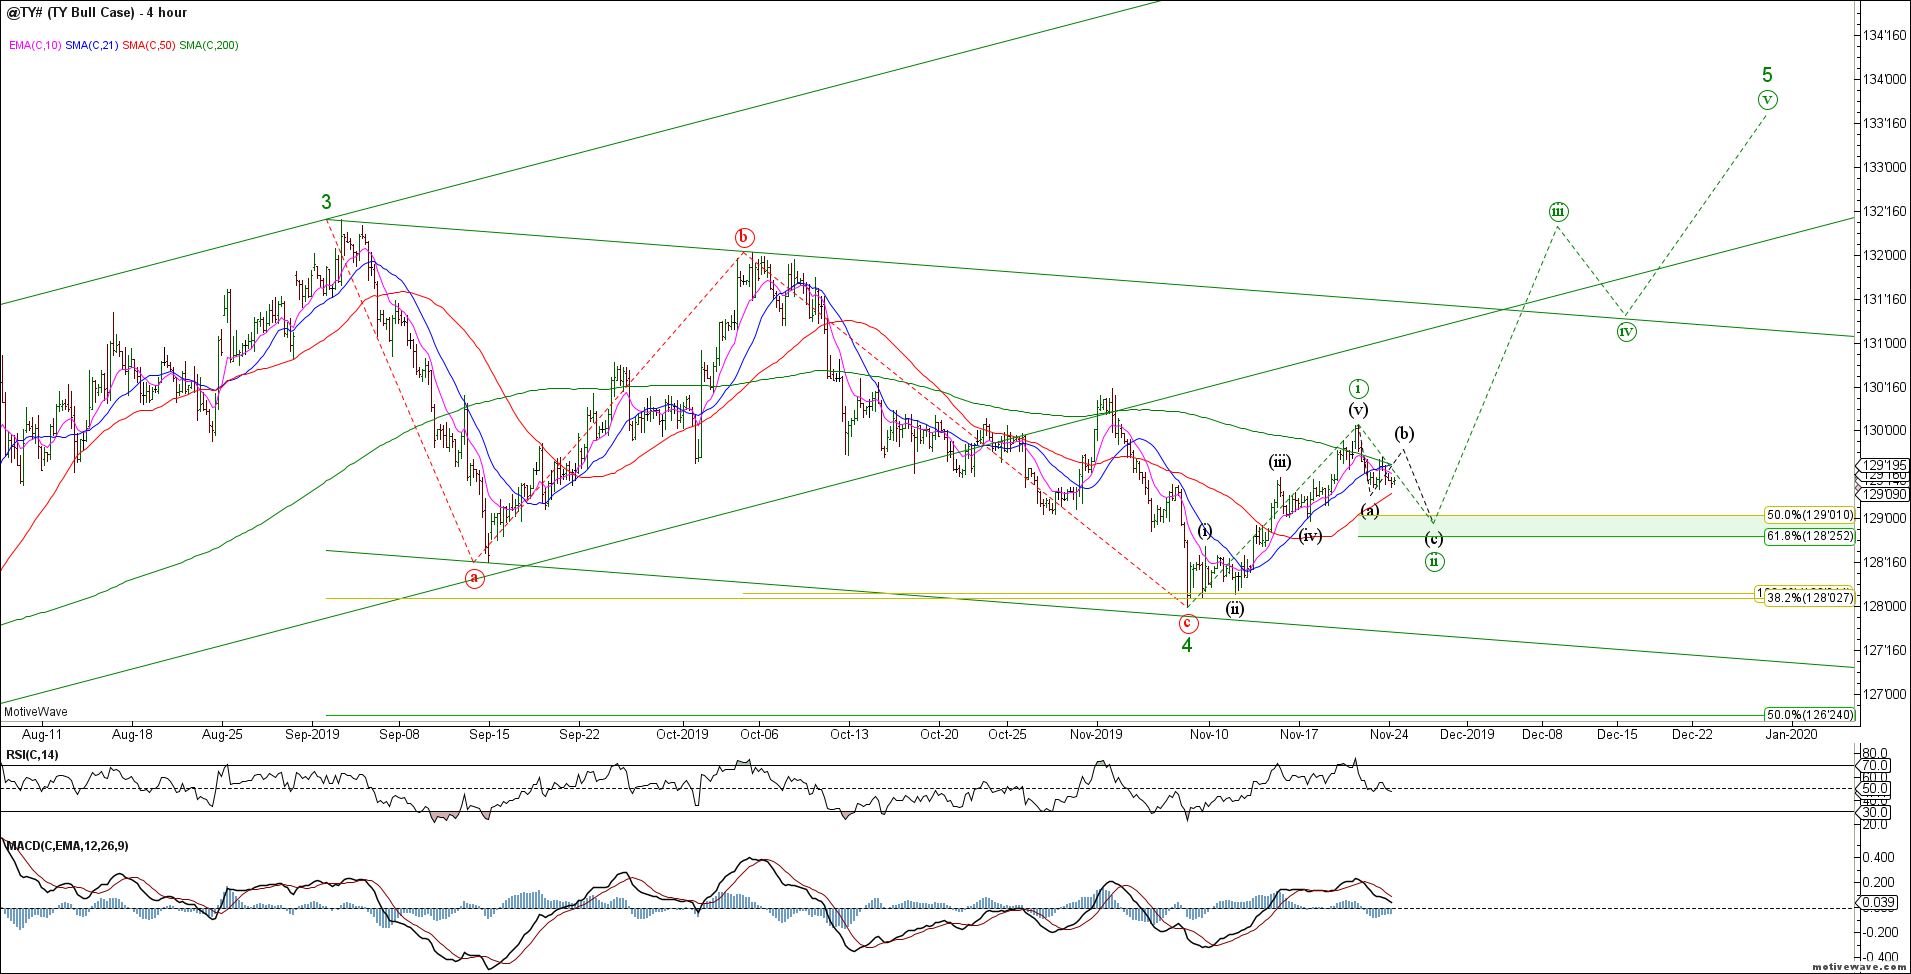
The TY also has a potentially bearish interpretation (red count) that while lower probability we should not ignore. That is because of the irregular swing low from an Elliott Wave perspective. Be aware of this potential if we see evidence of an accelerating decline.
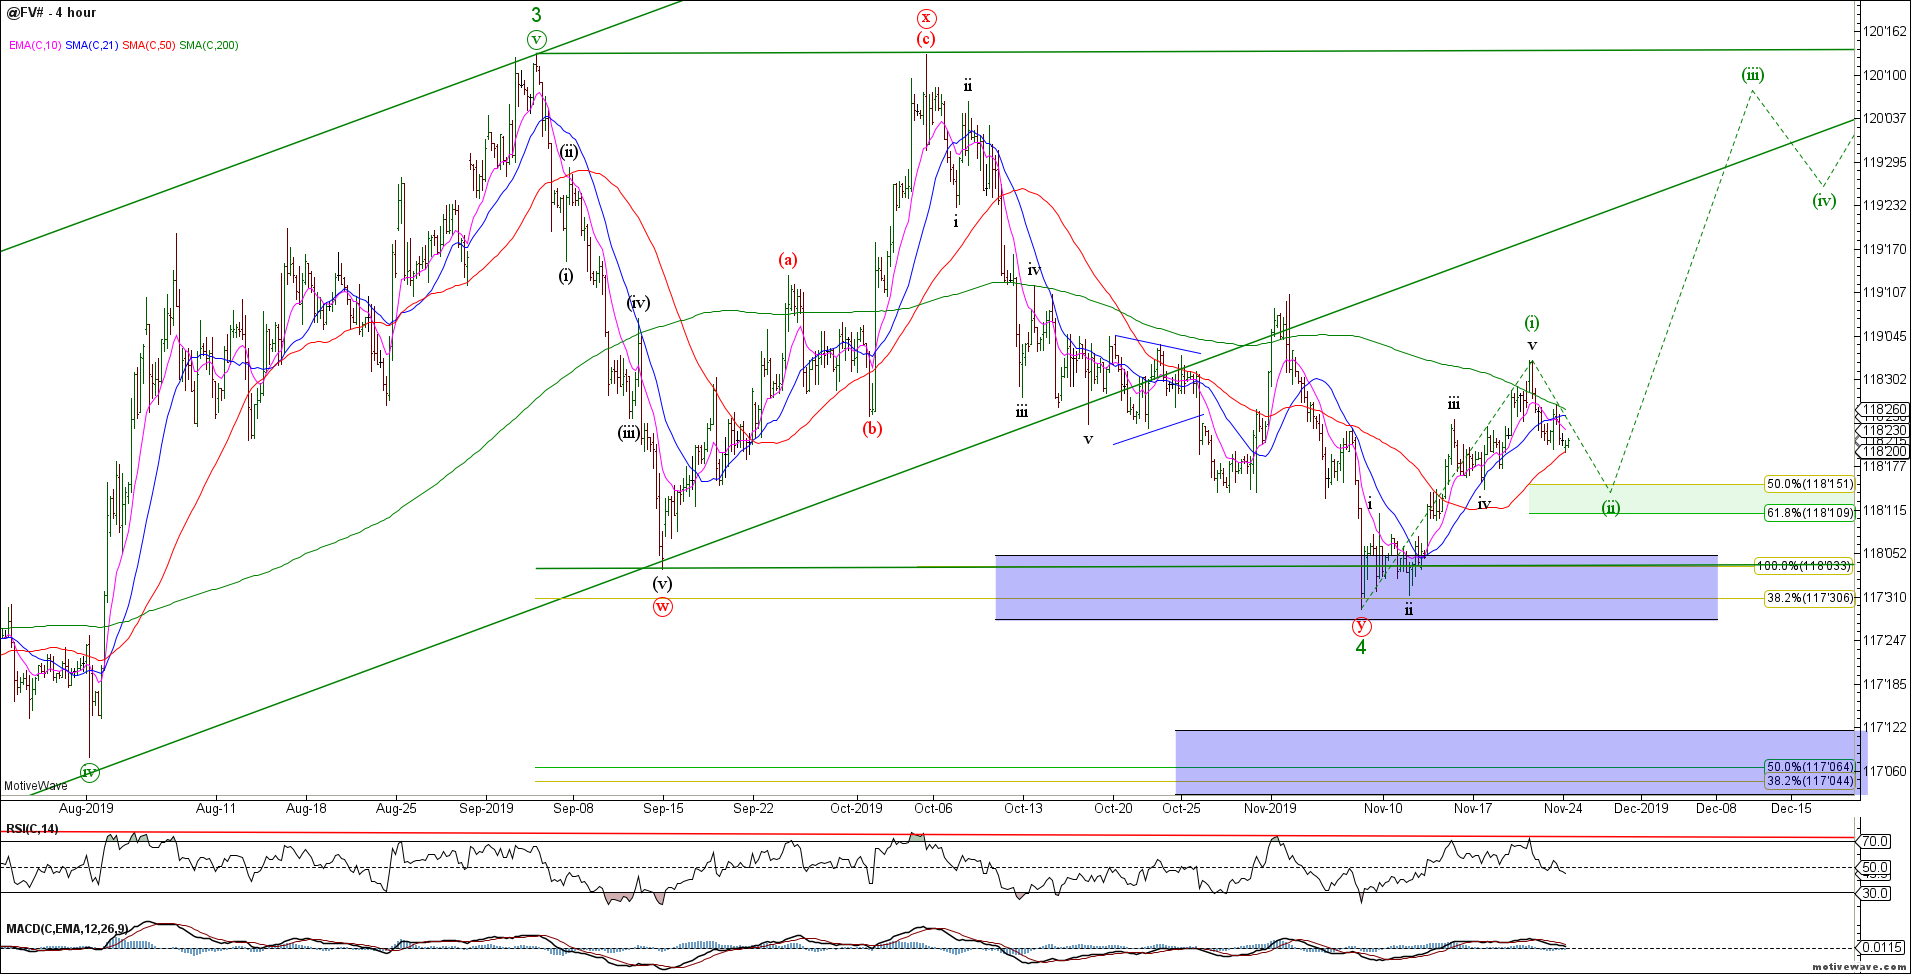
The 5yr FV shows an impulsive 5 wave rally from the recent swing lows. Bulls need to hold the 118’10 area for wave (ii) of the bull count.
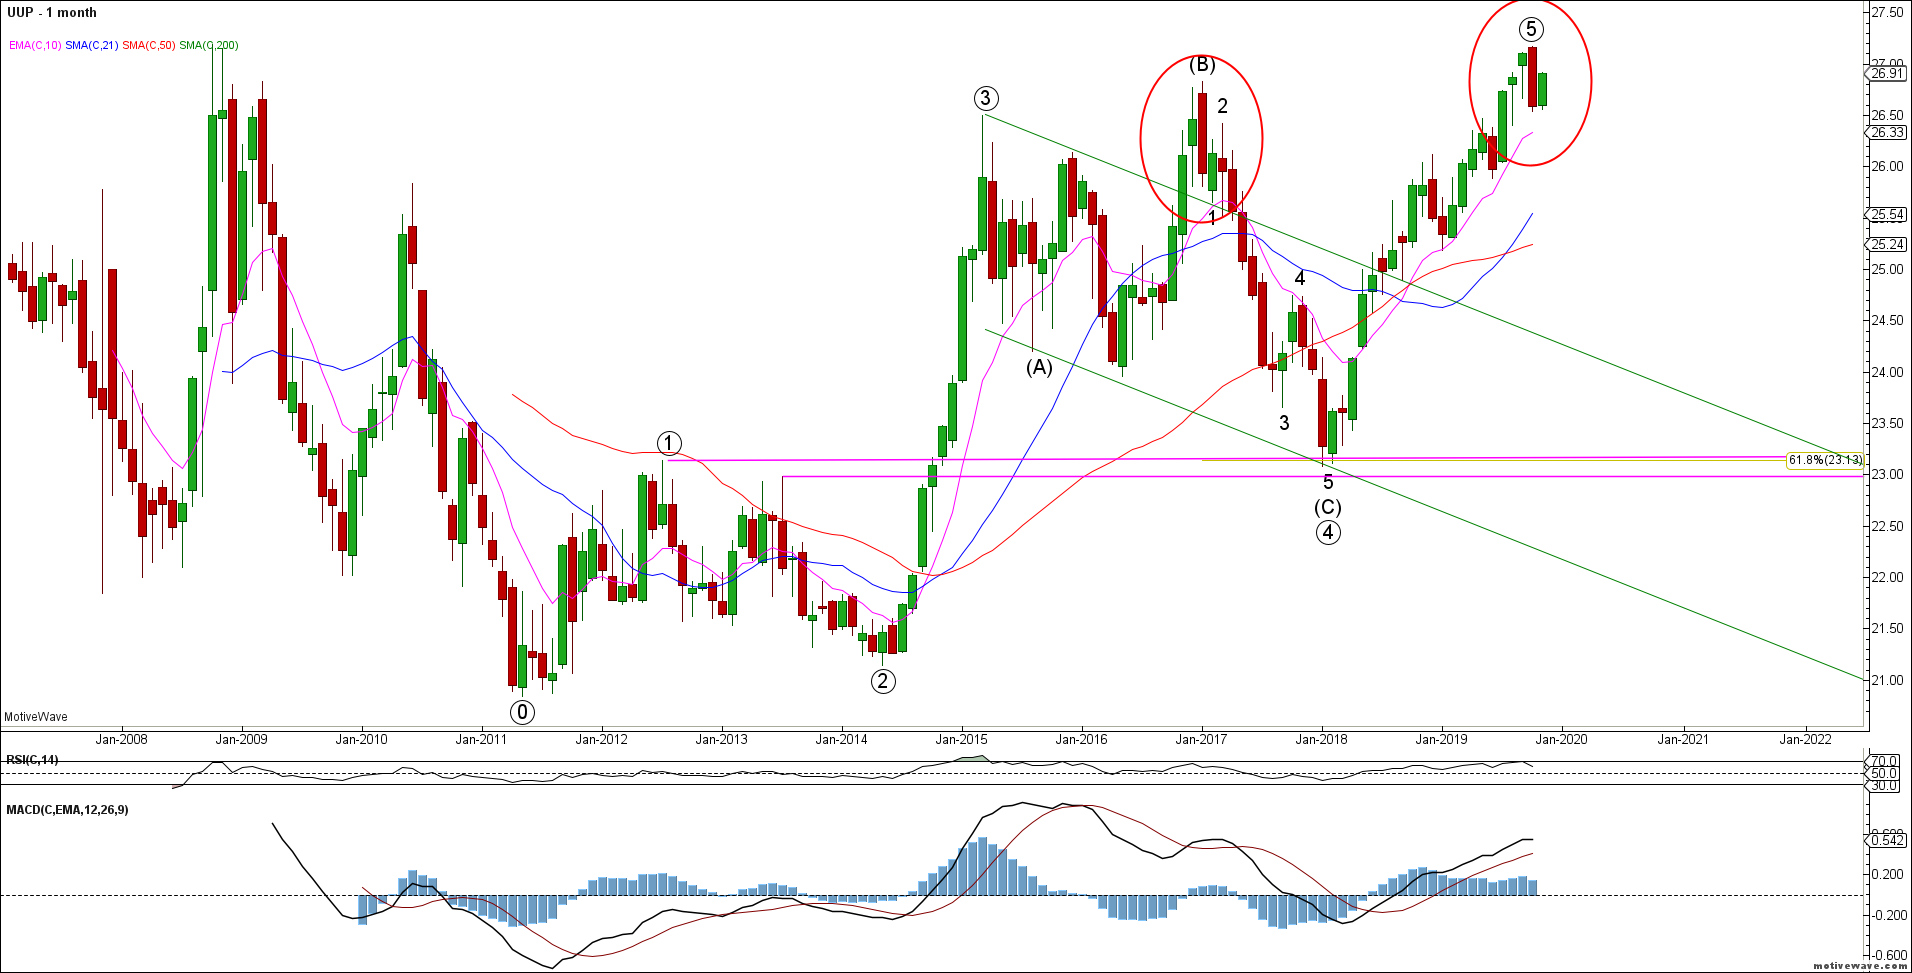
To the FX markets and the US dollar refuses to roll over. The monthly UUP chart is illustrative of the bigger picture field position of the dollar. October’s monthly bearish reversal is yet to see any downside follow through. We need to see a break of the October lows to gain any downside momentum.
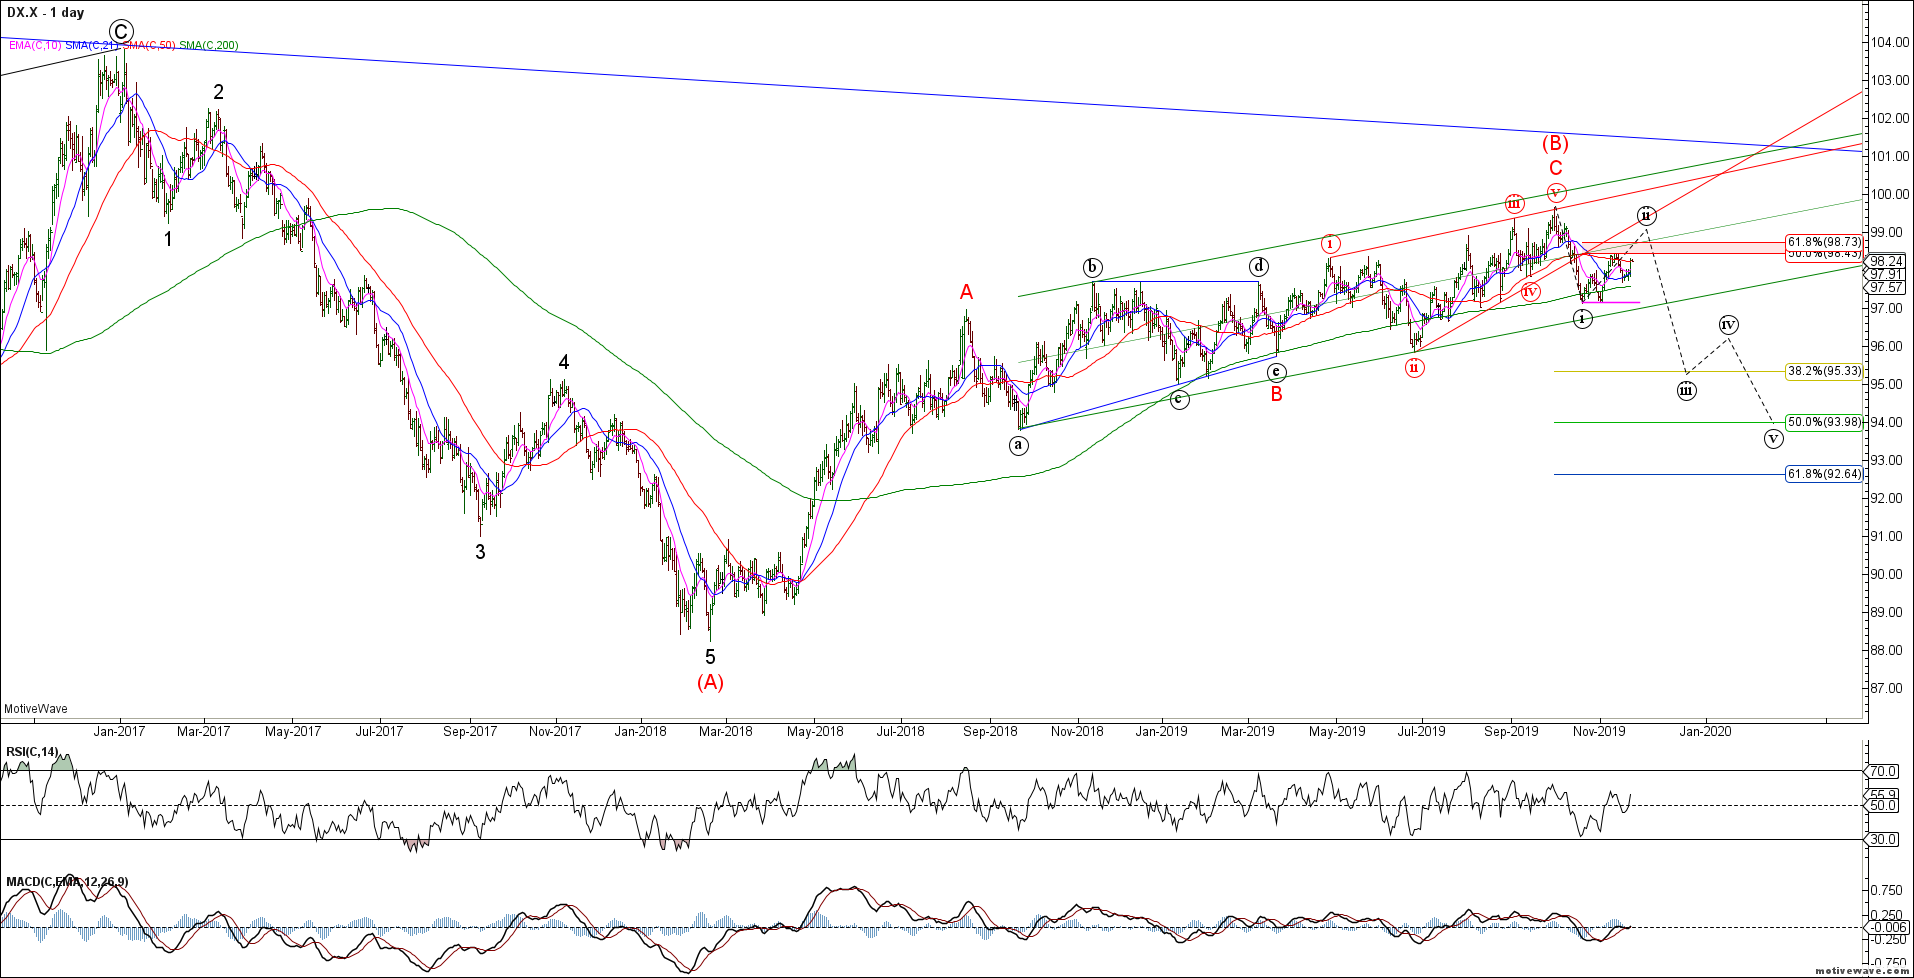
The DXY was unable to break lower last week and remains range bound. The near term structure is unclear and while we maintain a bearish bias against the October highs, our confidence level is low as no key support has been broken. Maybe another push higher to complete wave (ii)? Risky
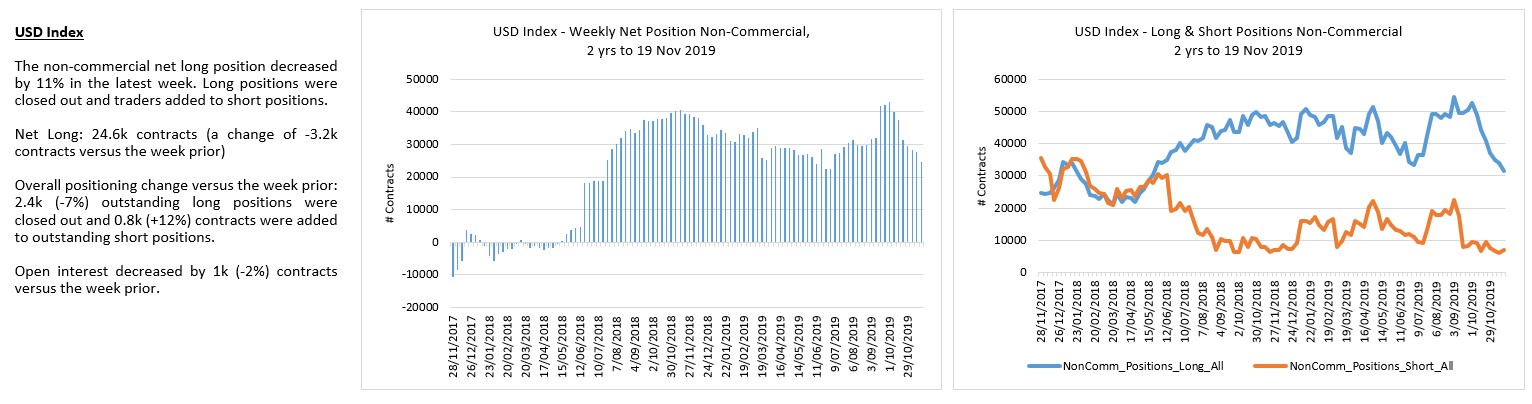
DXY longs have left the building.
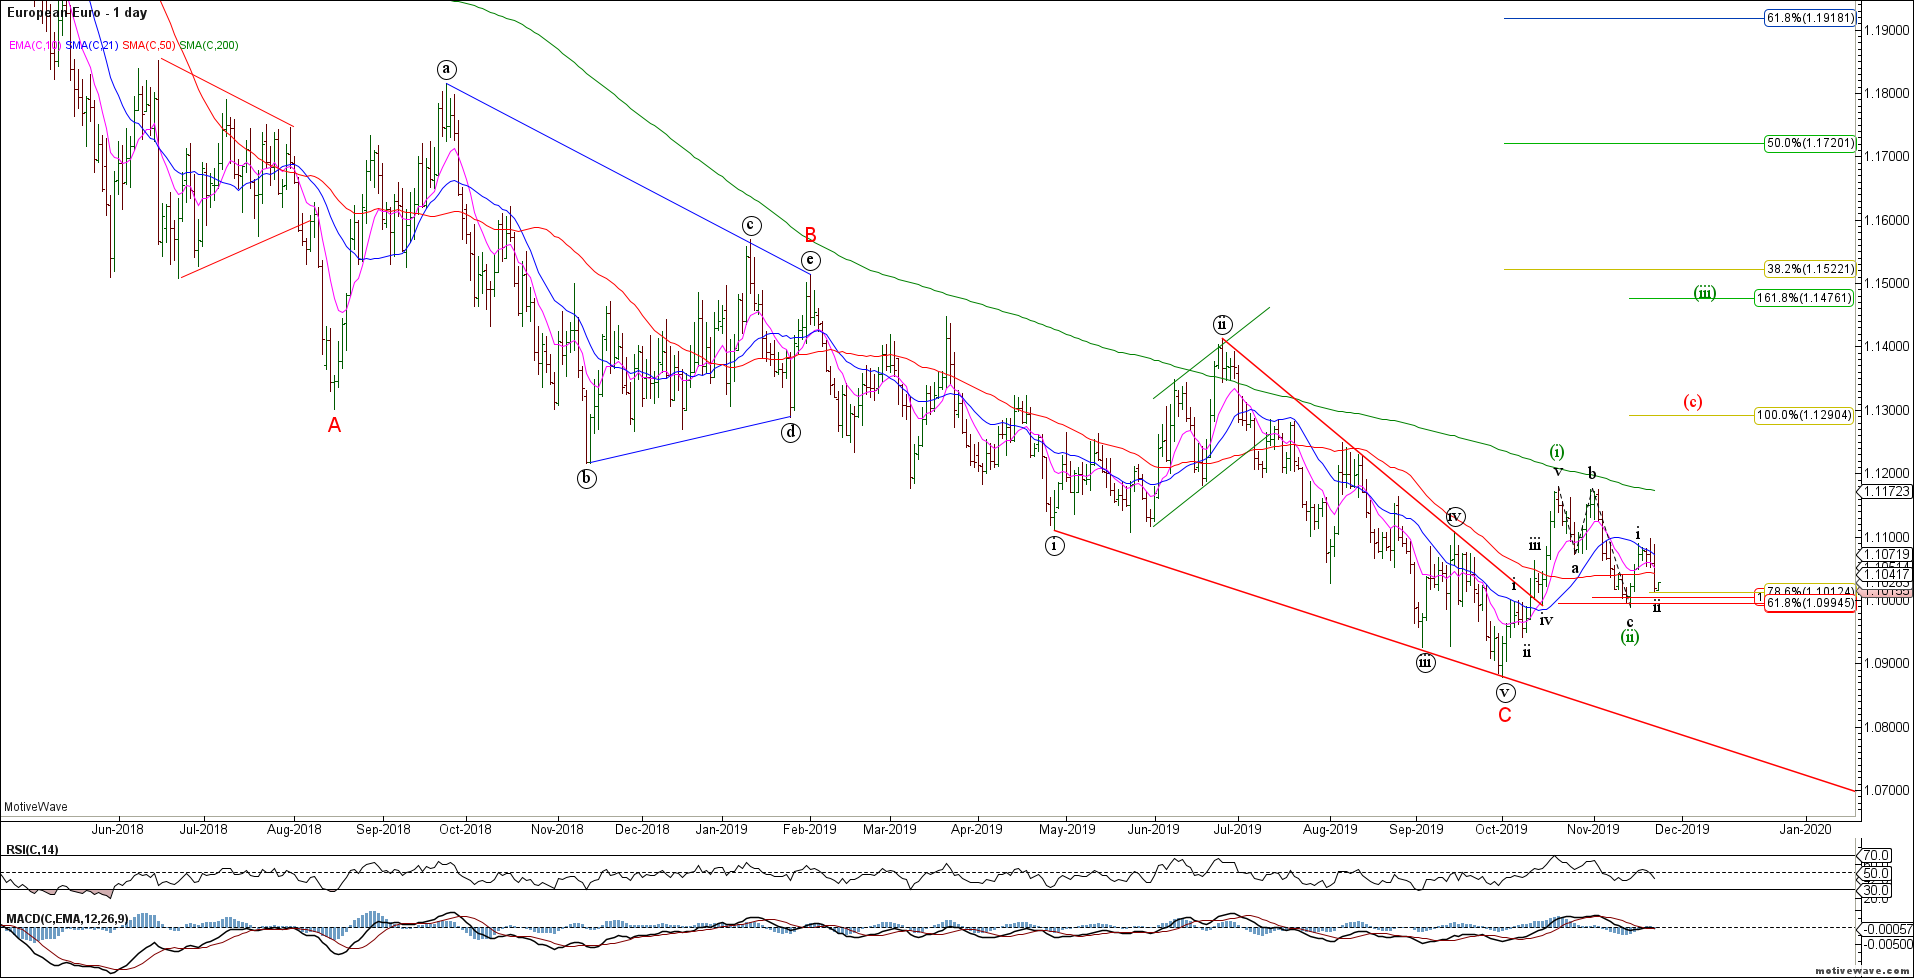
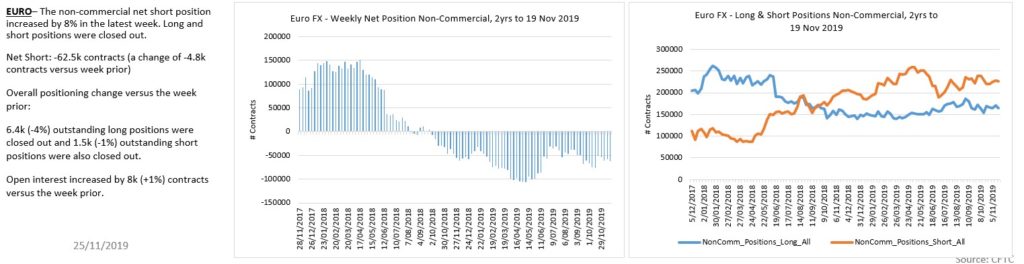
The Euro bullish potential remains in tact but the recent deep retracement calls this count into question. The Euro has not been able to maintain any of its bullish reversals as yet – risky as the bigger picture bear trend remains unbroken.
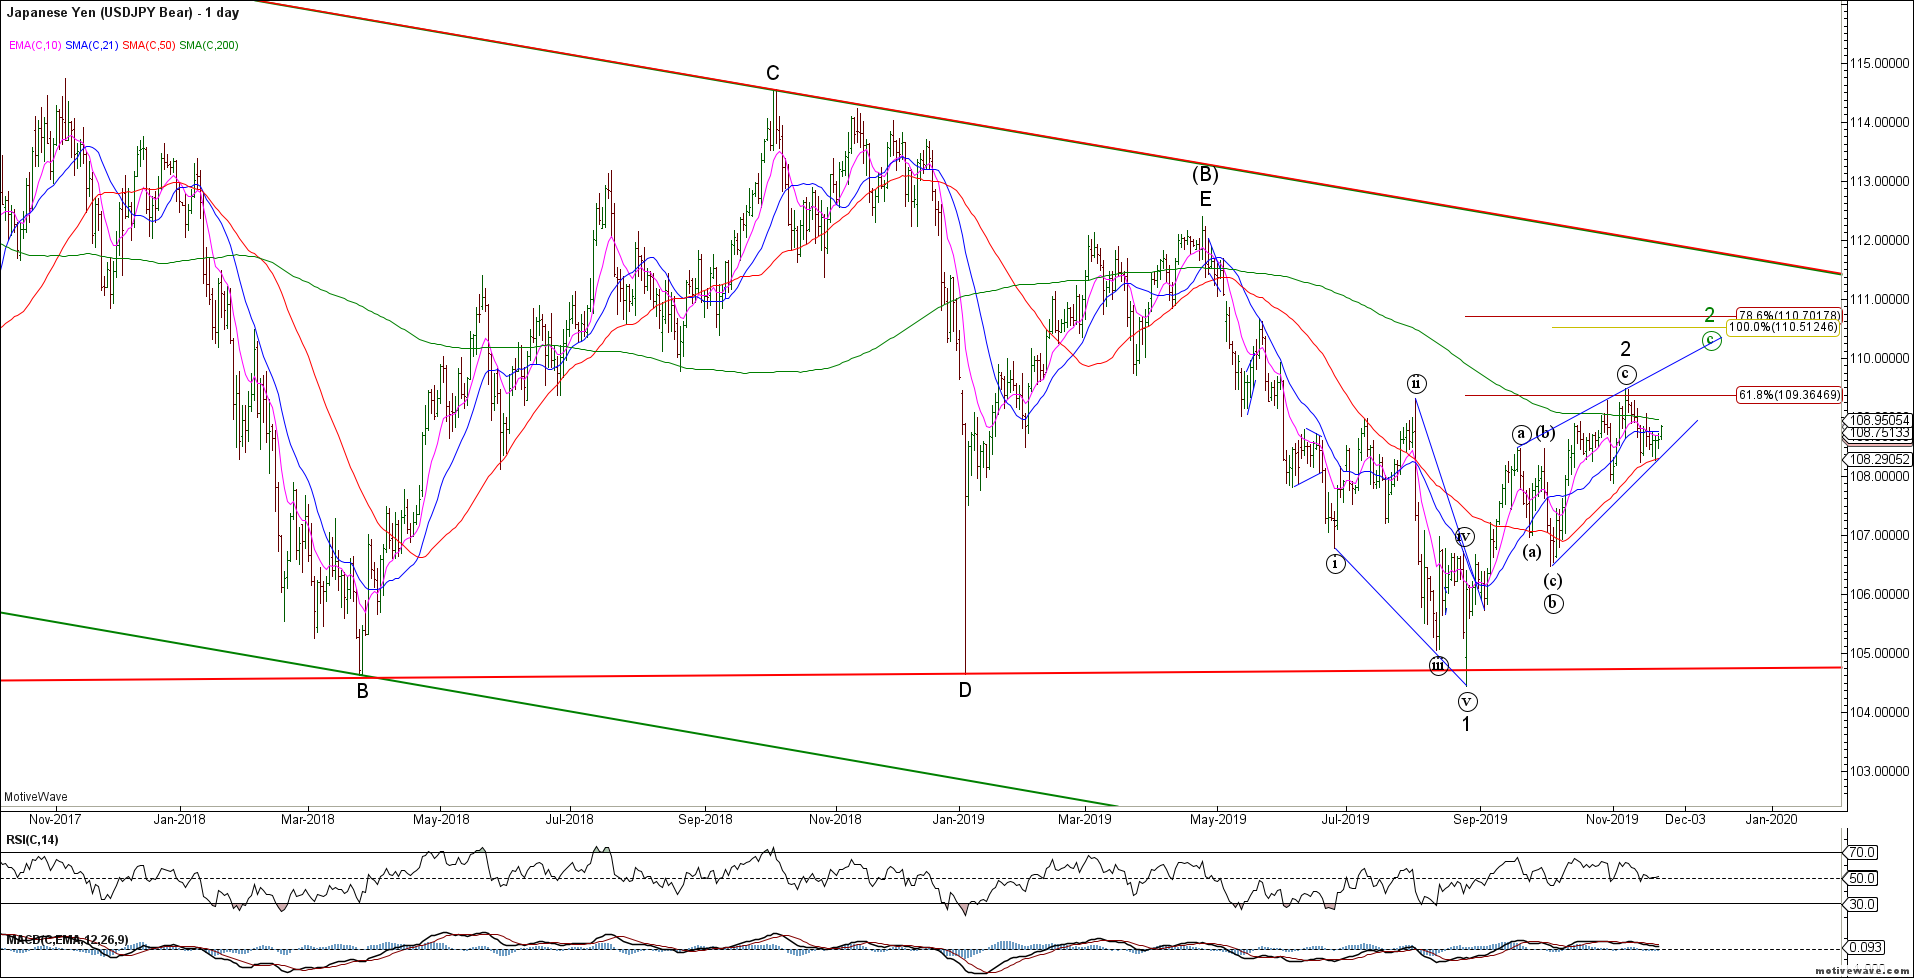
The USDJPY also refuses to break down and held its 50 day sma. We do not have confirmation of a bearish reversal so the risk is another wave higher in what appears to be a wedge / diagonal. If in doubt stay out.
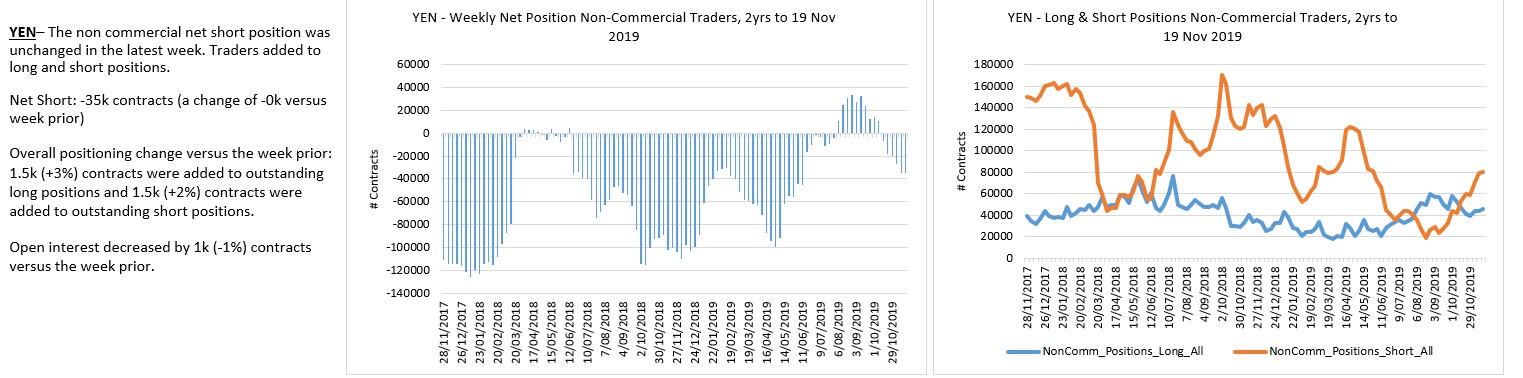
Yen traders only marginally short.
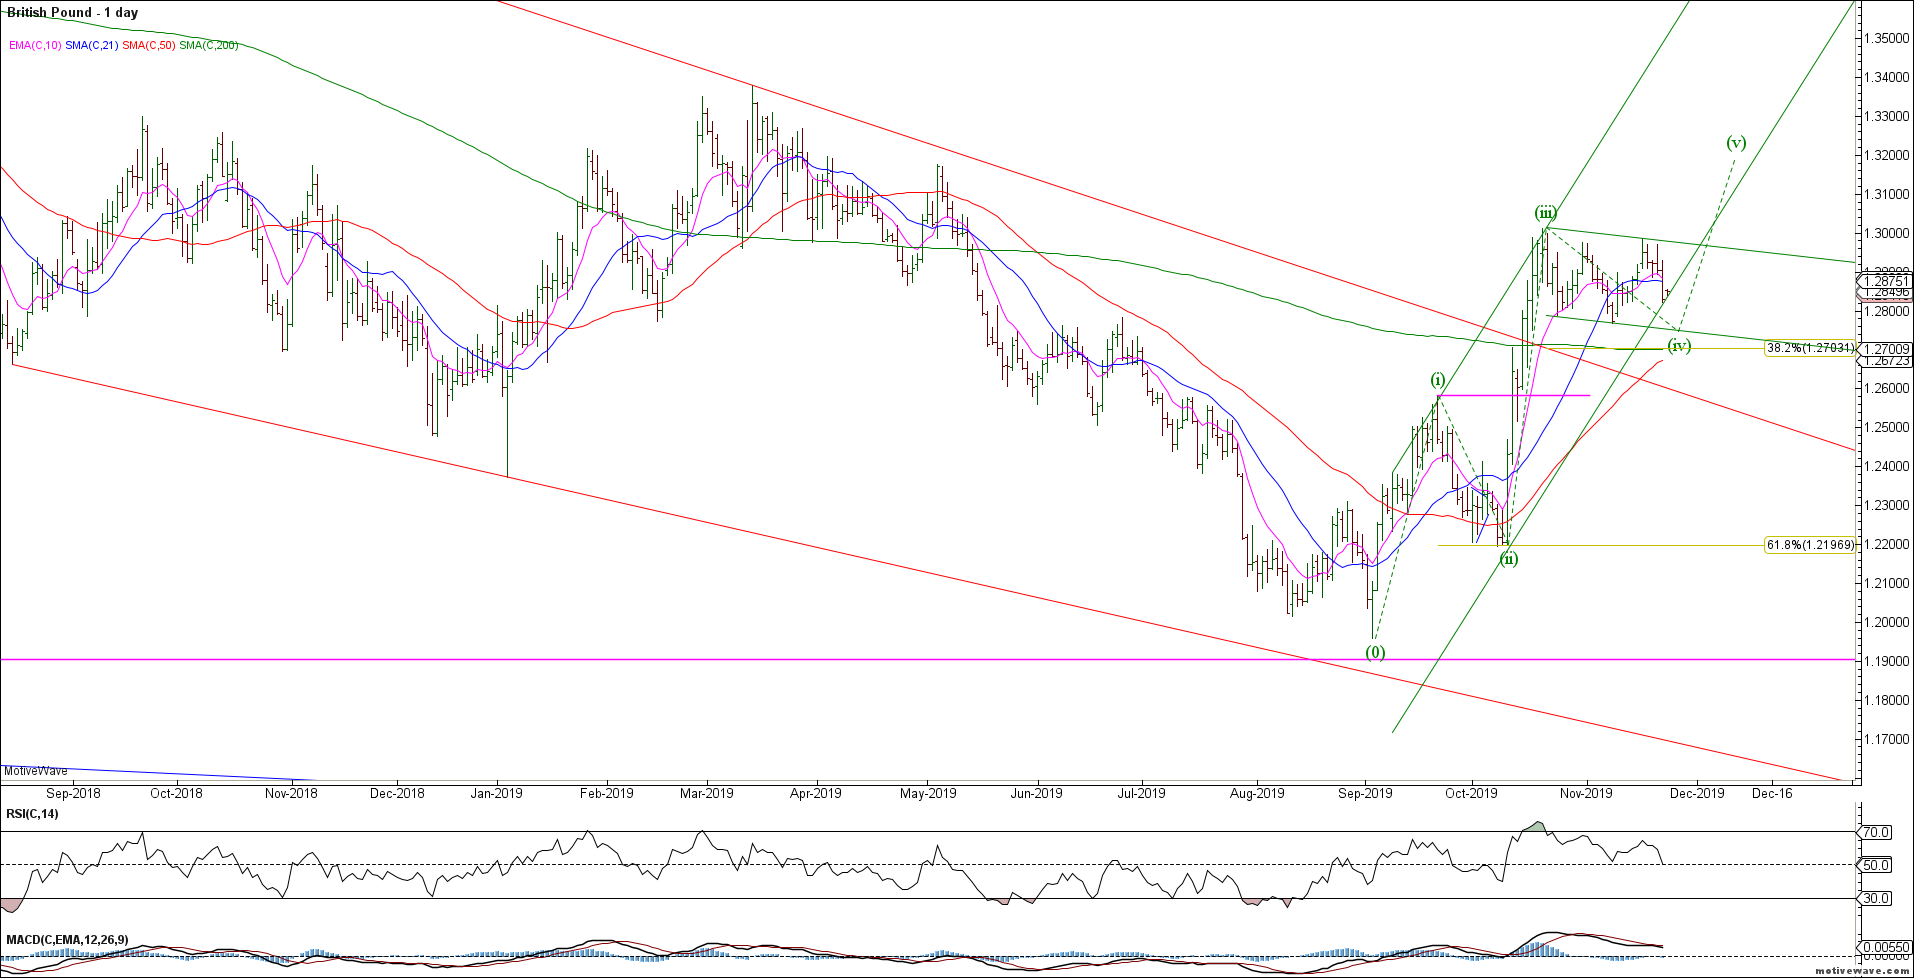
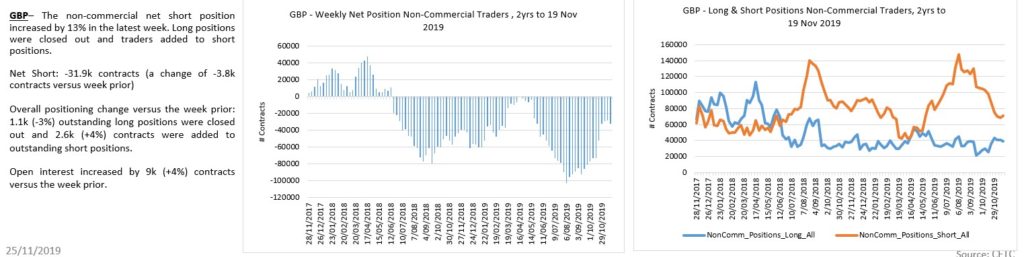
The GBPUSD failed to break out to new highs in wave (v) – bulls need to hold the 1.2700-50 area on any continued pullback and push higher to complete wave (v) for an impulsive rally. Remains bullish while above the 1.2580 wave (i) overlap.
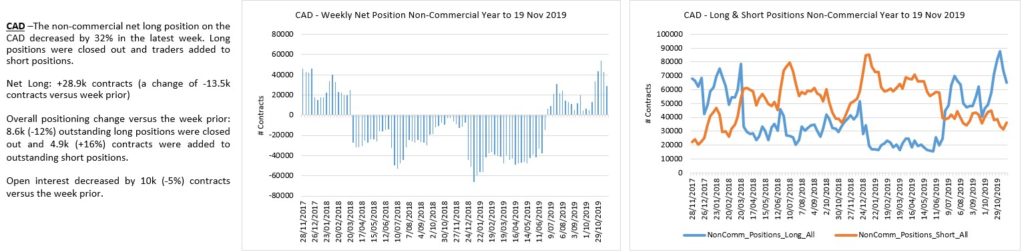
The rally in USDCAD remains constructive but remains range bound from a bigger picture perspective. Our near term target remains 1.3400 but it has been unable to break through overhead resistance so far. We’ll be patient.
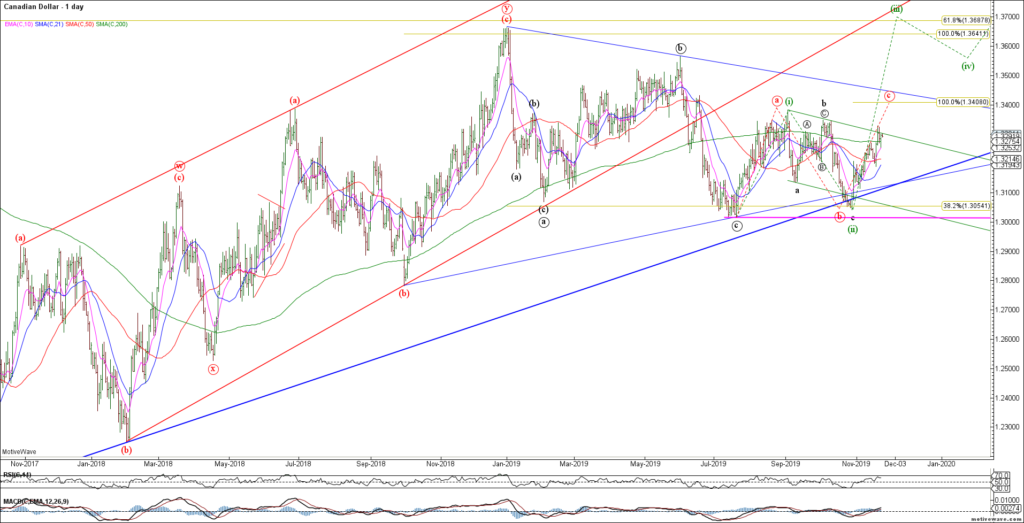
CAD longs getting nervous.
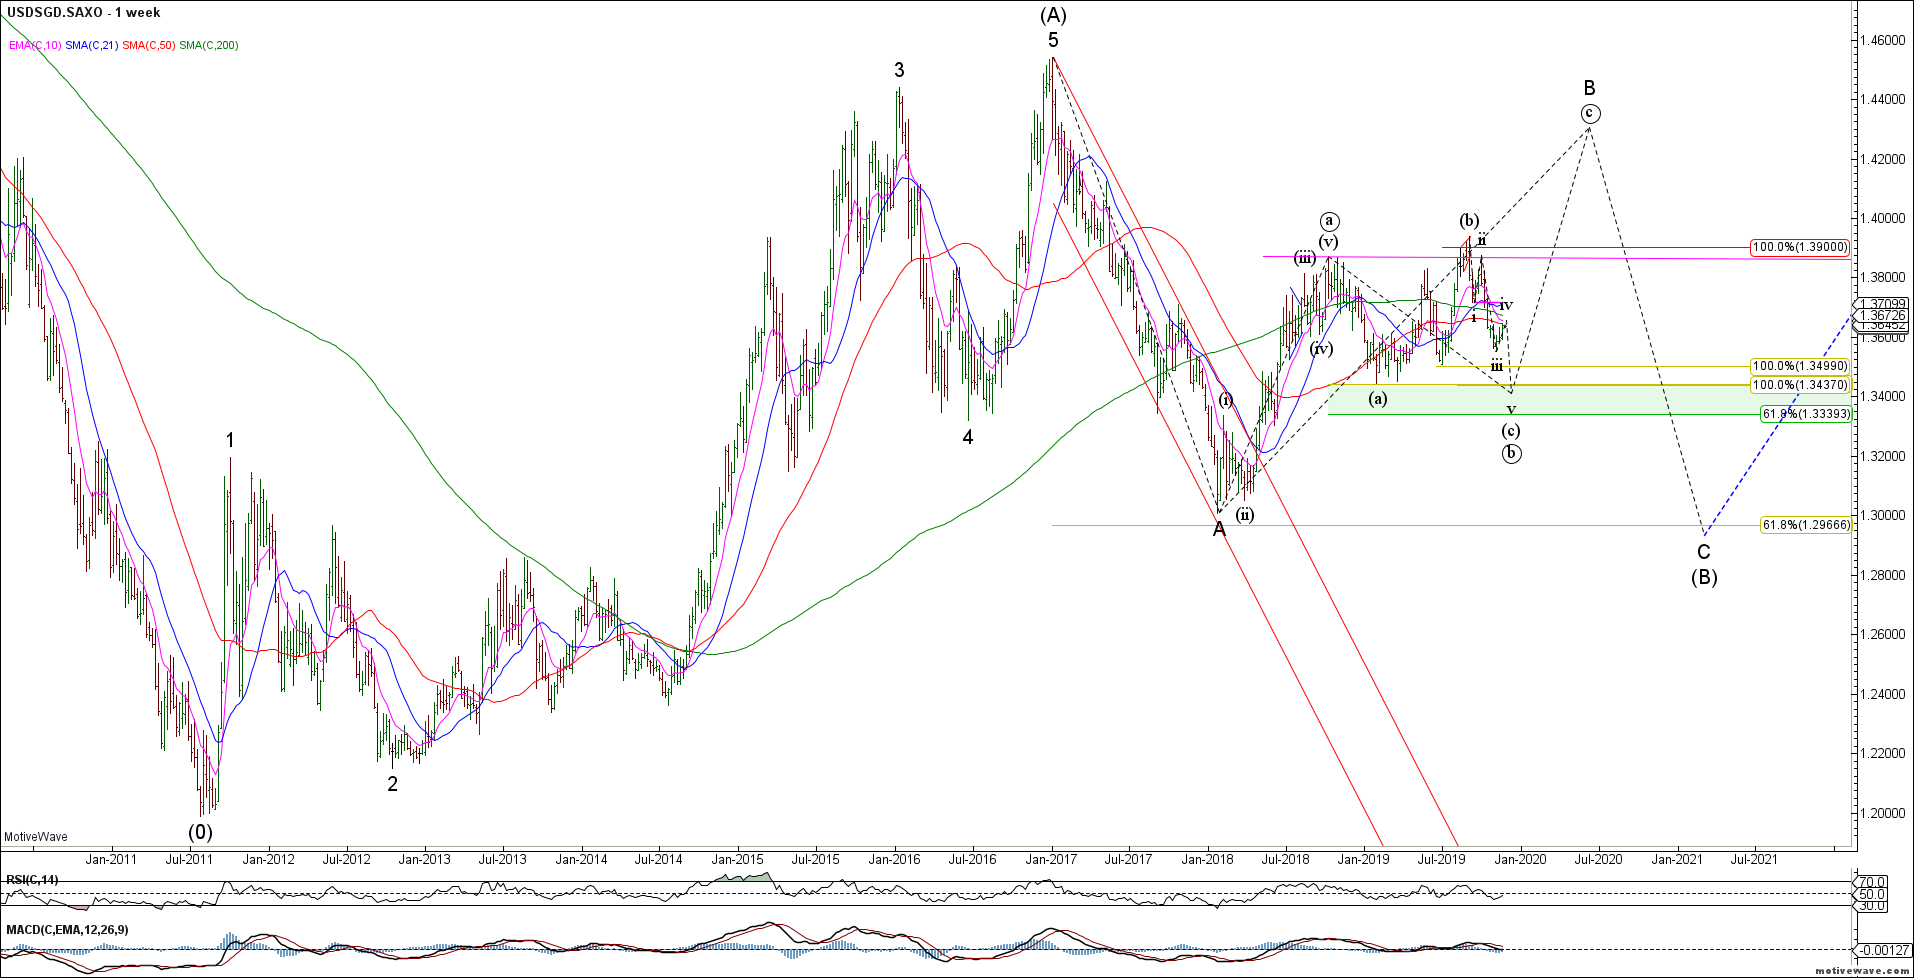
We continue to track the Singapore Dollar (USDSGD) as a proxy for the China trade deal. The structure would look best with another wave lower towards 1.34 to potentially set up a bullish trade.
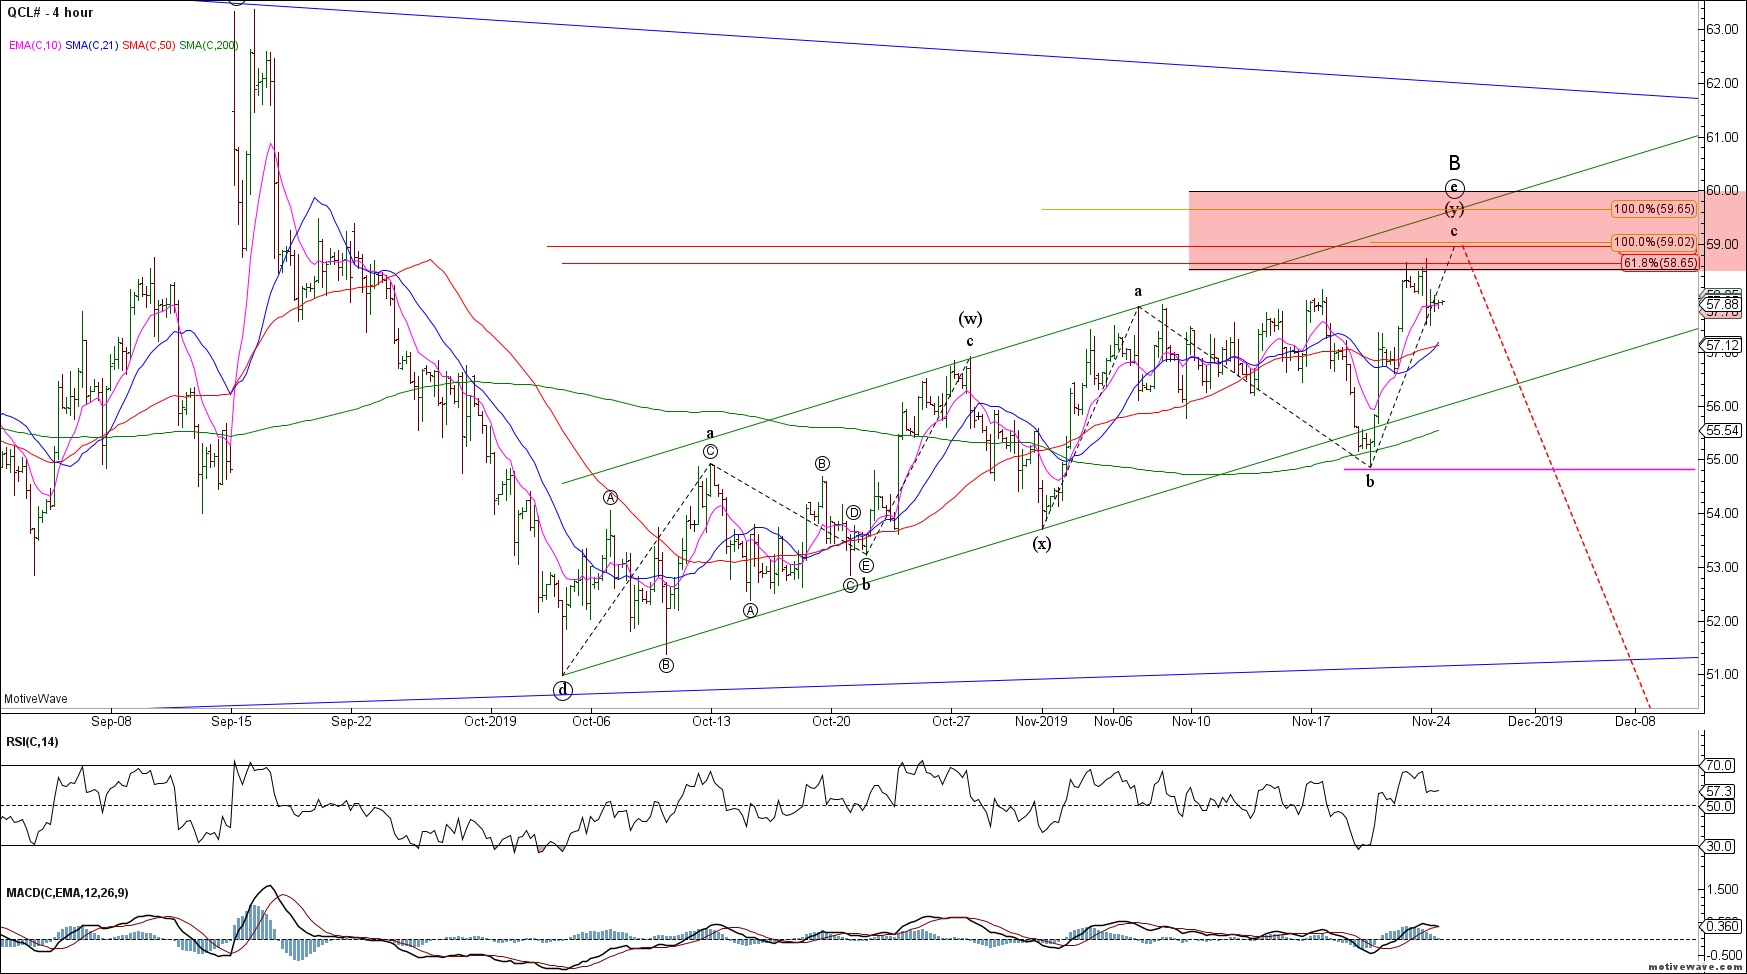
To the commodity markets and Crude Oil continues to rise correctively. Strong resistance remains in the 59-60 area as we look for evidence of a bearish reversal. Bears need to break the sequence of higher highs and higher lows with trade below last week’s low.
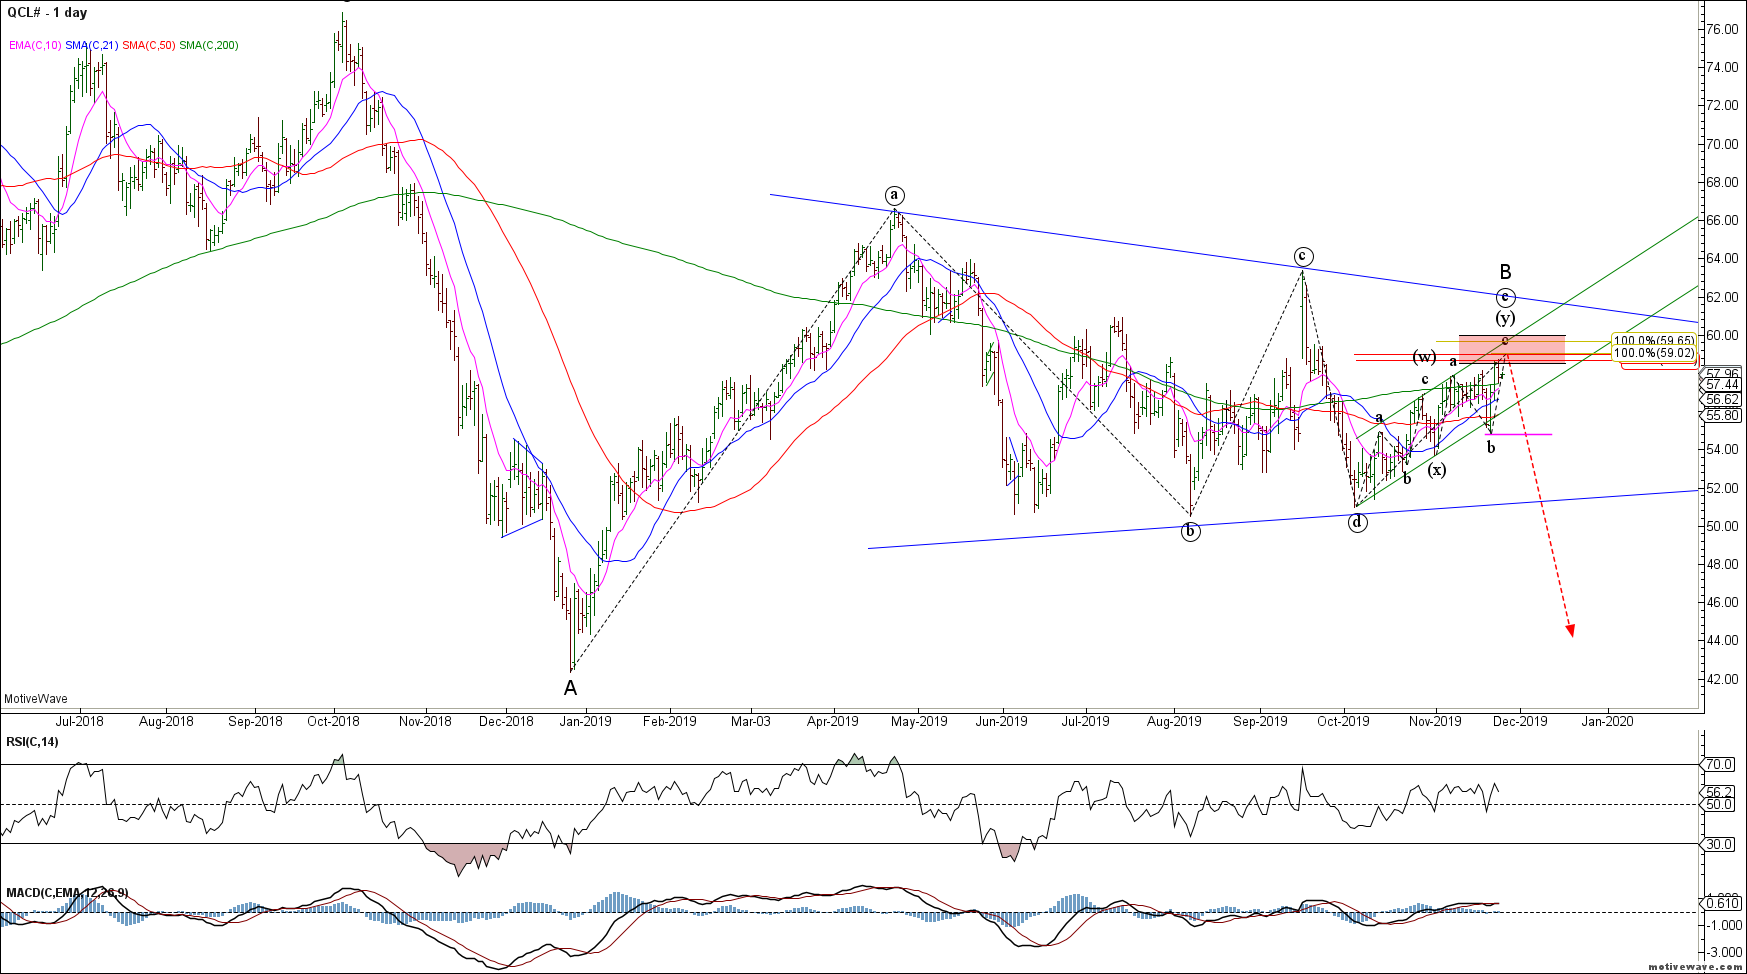
The near term CL count continues to look like a complex correction. No strong evidence yet of a bearish reversal.
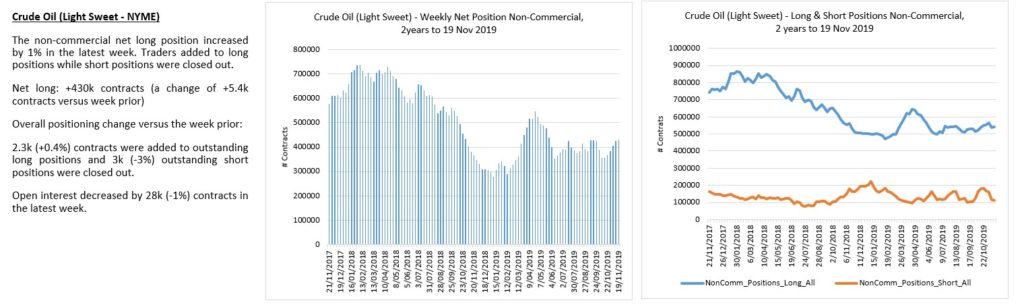
CL shorts squeezed.
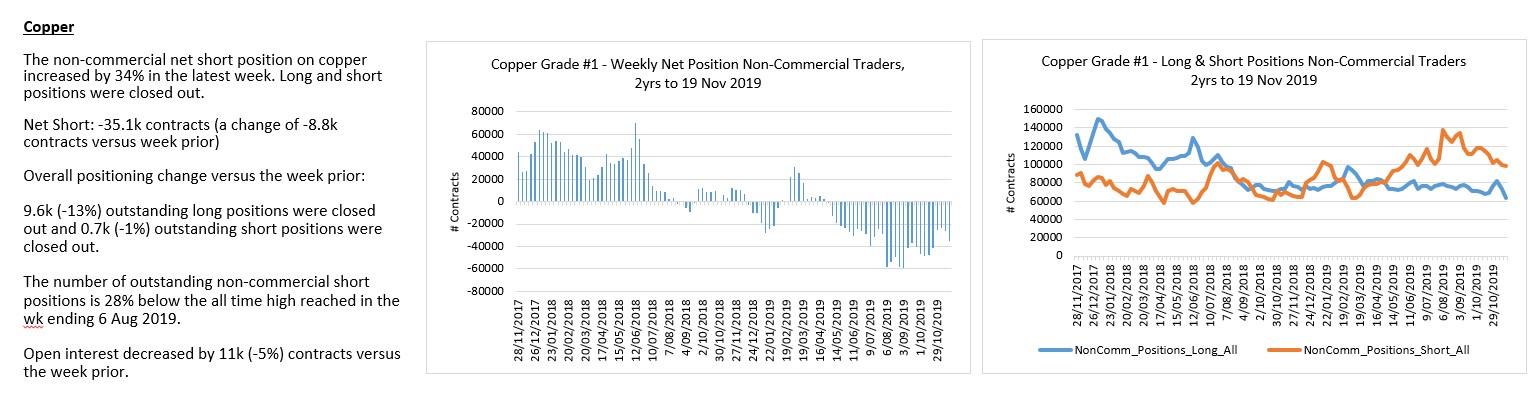
Dr Copper appears to be in a near term wave (ii) correction before the next impulse wave lower. We remain bearish.
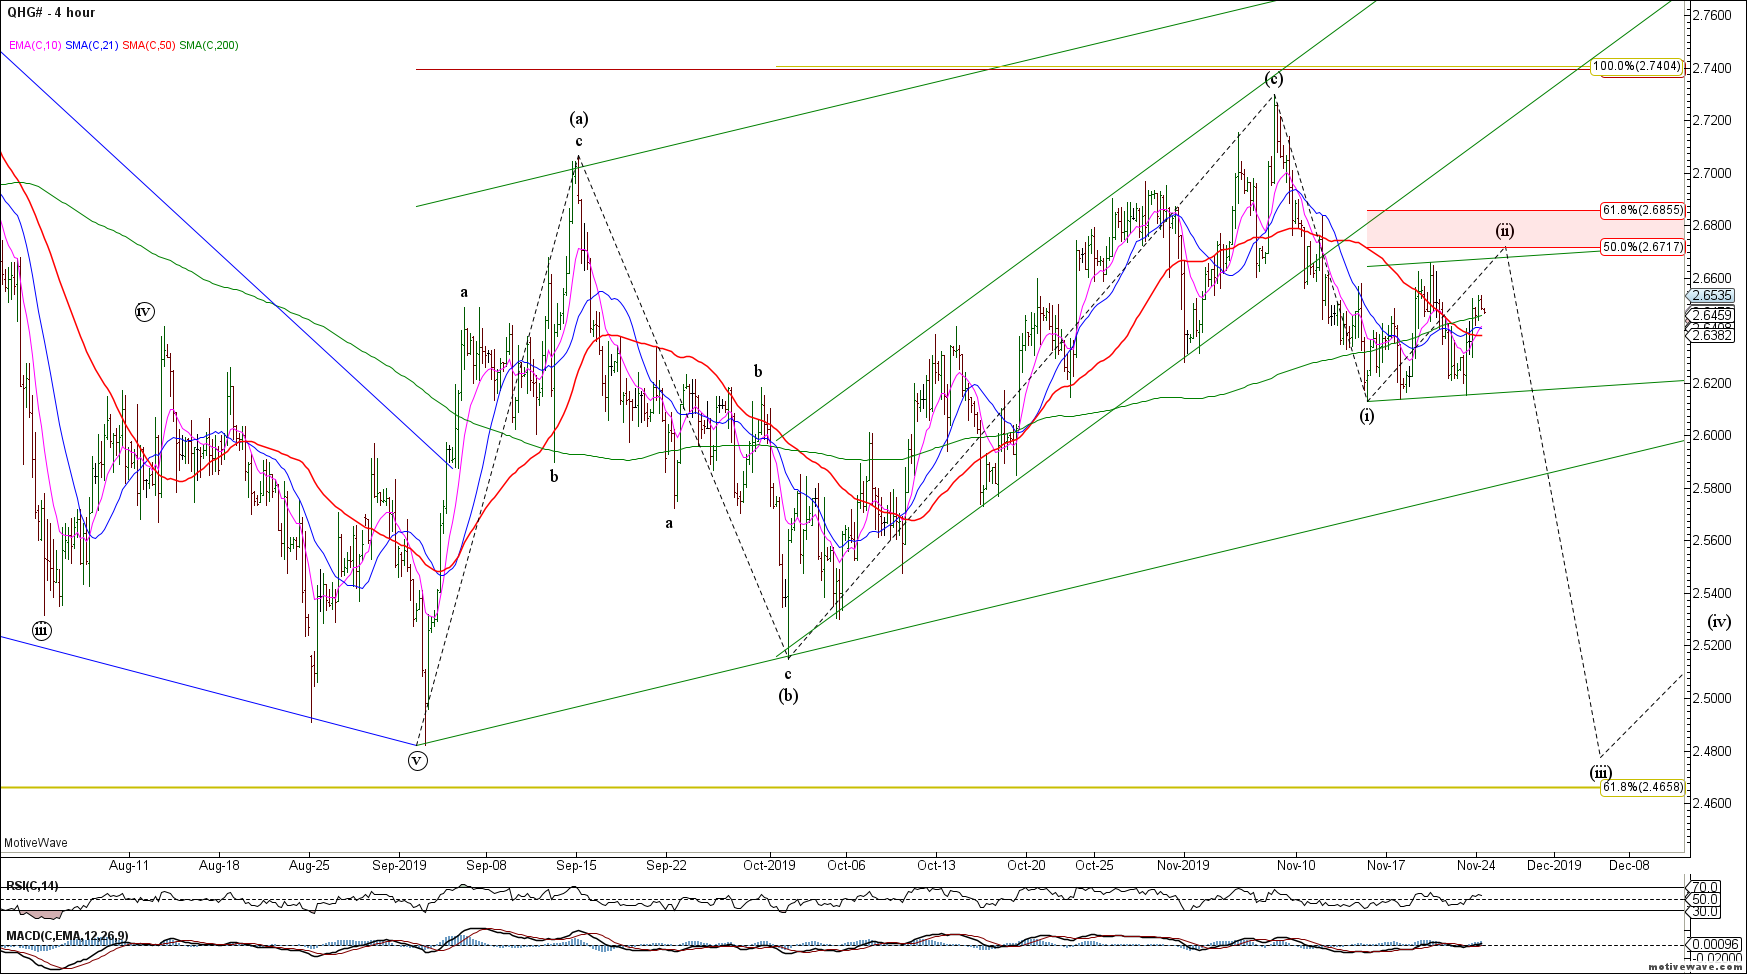
Copper traders closing shorts and longs.
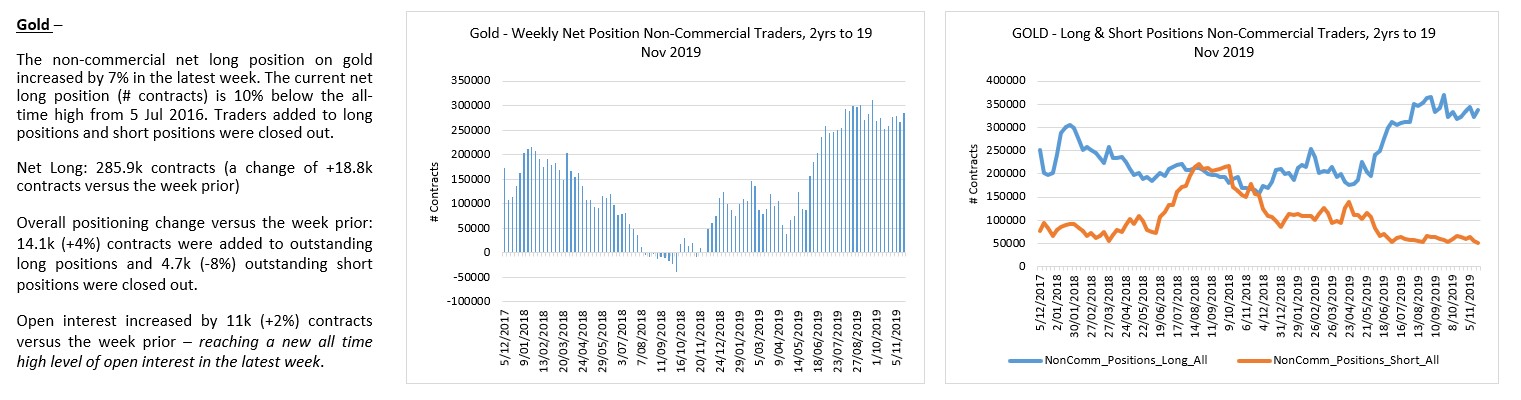
To the PM’s and the recent rally from swing lows appears corrective and likely to fail. Gold risks another wave lower towards 1418 (red count) to flush out more of the gold bugs.
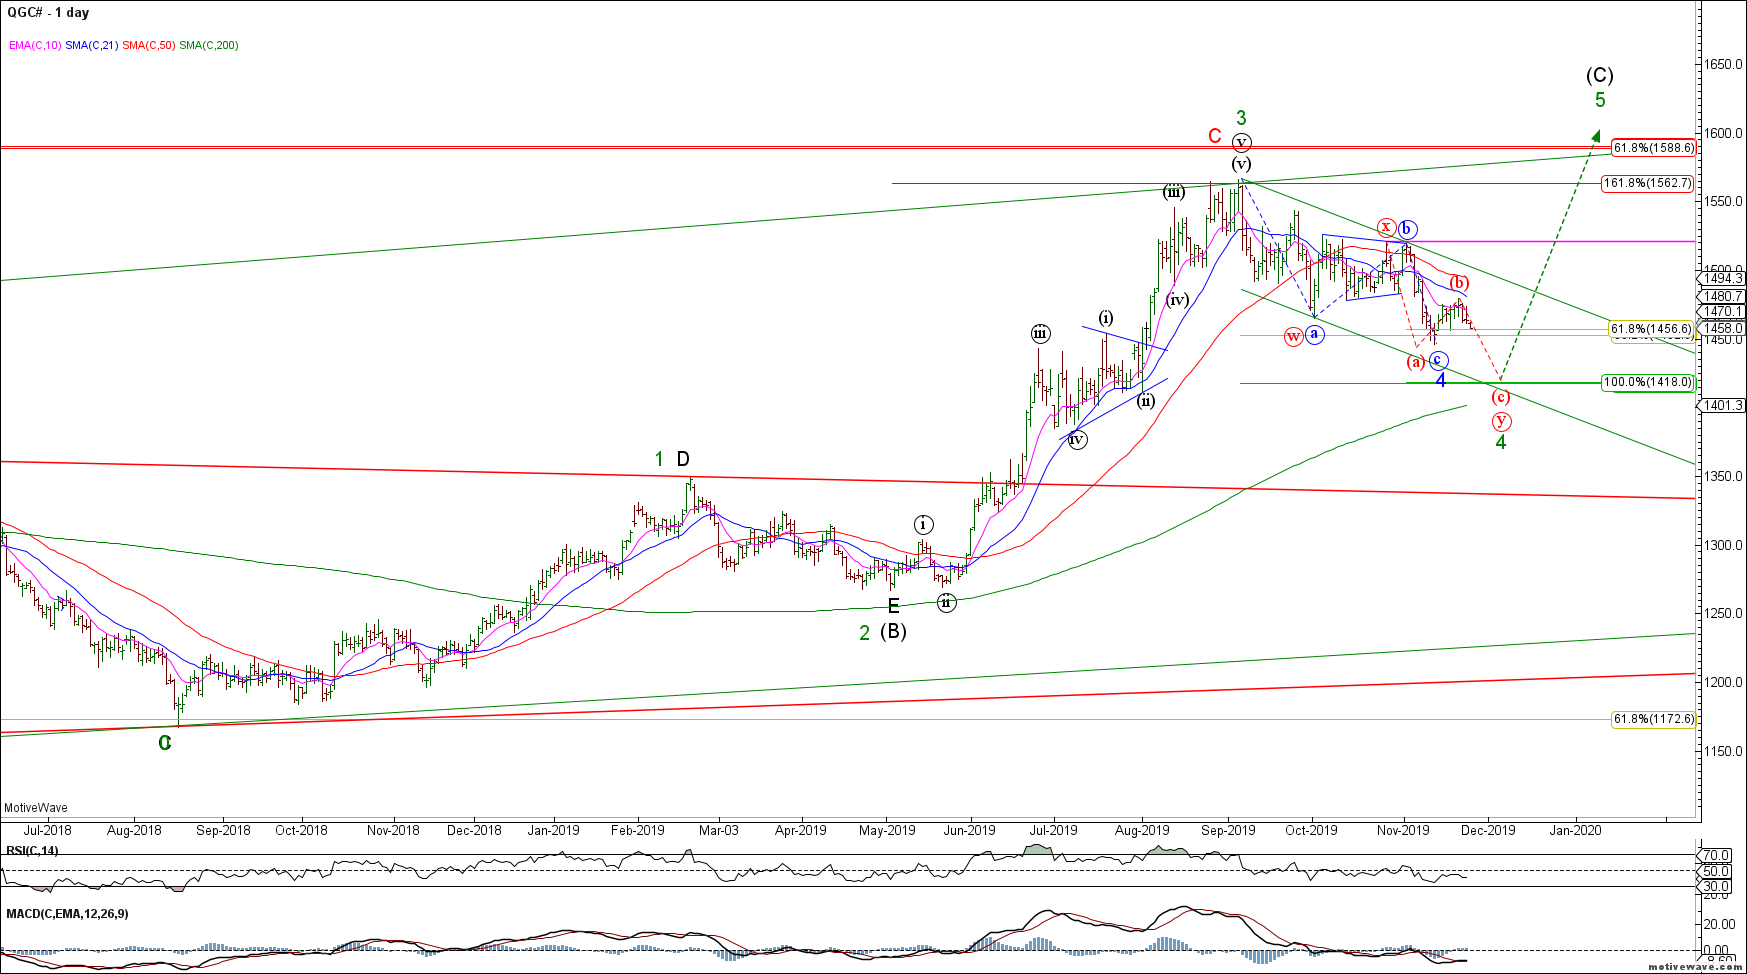
Gold traders remain too bullish for my liking – long side is crowded and risky.
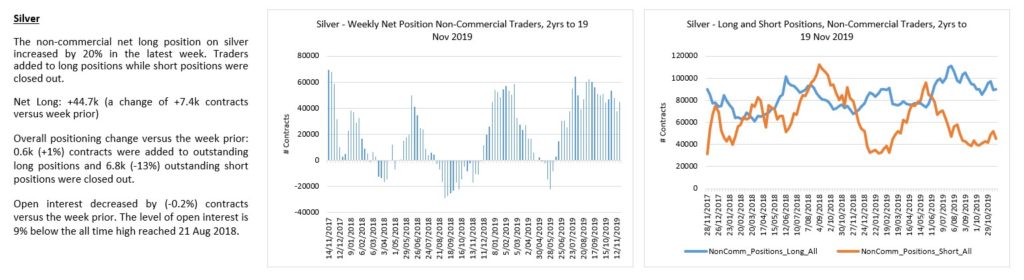
Silver continues to look bearish near term as we look for wave (v) of C lower towards the 16.30-50 area.
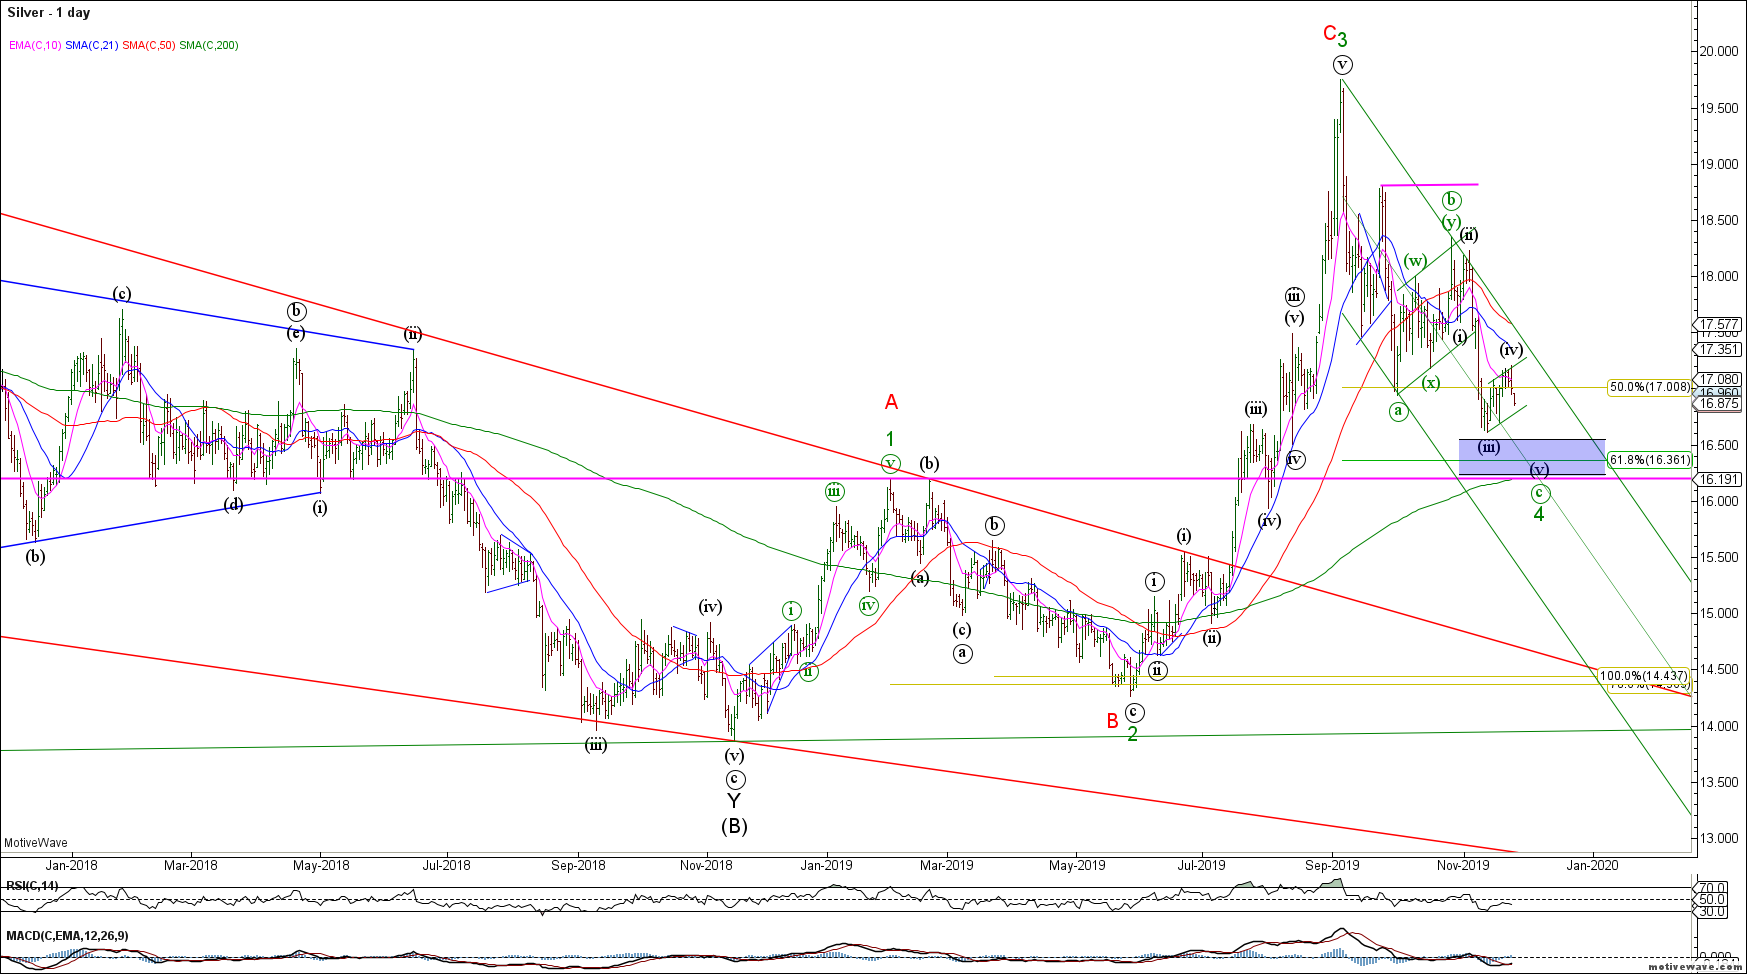
Silver traders also too bullish here.
That’s all for now. Wishing all a happy Thanksgiving 🙂
