Last week, global equity indices started to diverge as the Nasdaq leaders pushed to marginal new highs while the DJIA and Russell reversed sharply lower, potentially setting up trend reversals. The Nasdaq and SPX declined correctively while holding near term support, keeping the door open for a continuation of the bull market trend. The fragmented markets and declining relative strength are warning of trend exhaustion so caveat emptor. The primary macro market trends remain intact with a stronger US$ and higher rates.
NB: This is a data heavy week with key equity earnings, payrolls and PCE inflation. Expect increased volatility as we get closer to the US election.
Equity Markets – Fragmented Markets
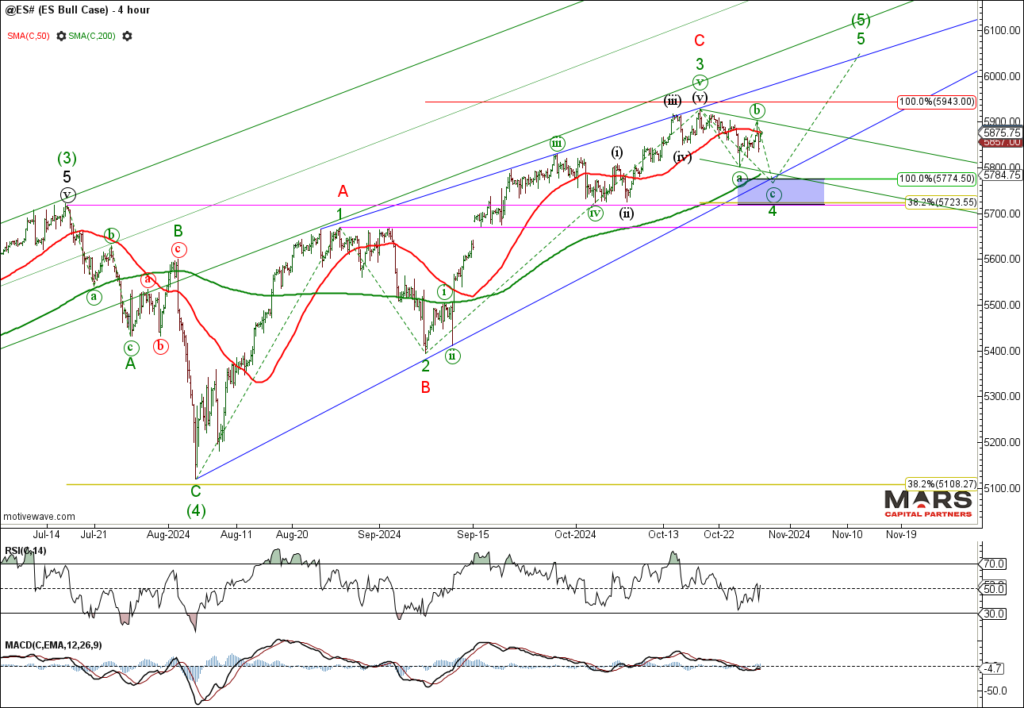
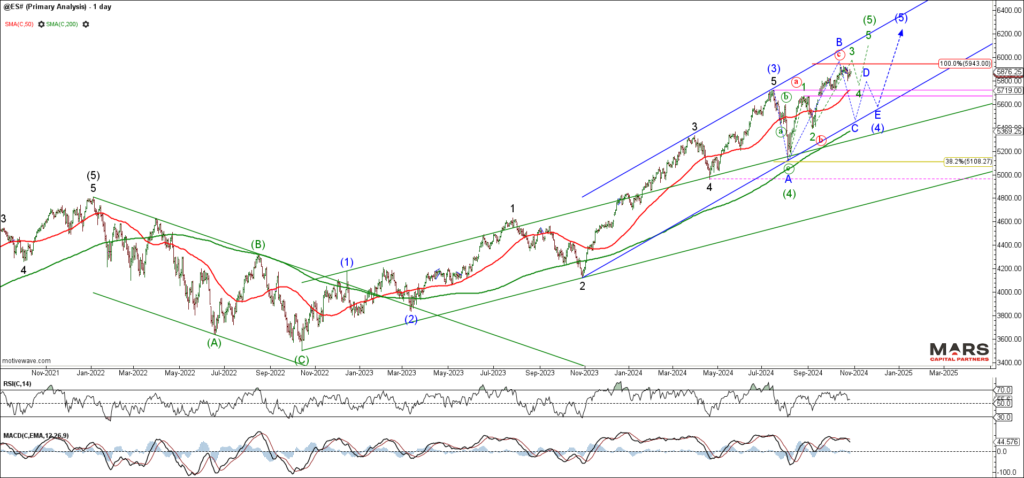
To the equity markets and the benchmark SPX / ES corrected lower last week but maintains a bullish bias while above breakout support in the 5723-5775 area. The decline from ATH’s appears corrective and likely a pause within the ongoing bull market rally while above the 50 day sma trend support. A strong break of near term support would warn of a break in the primary bull trend and threaten a larger decline.

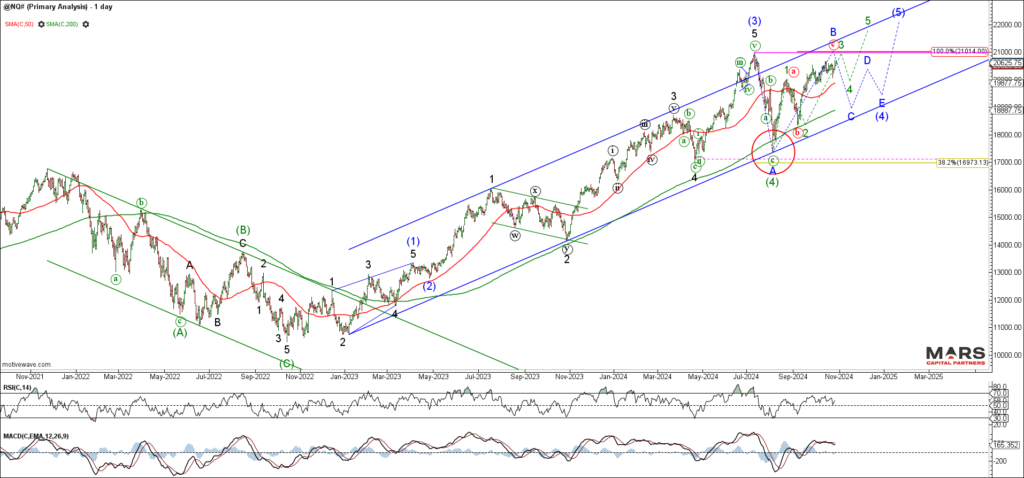
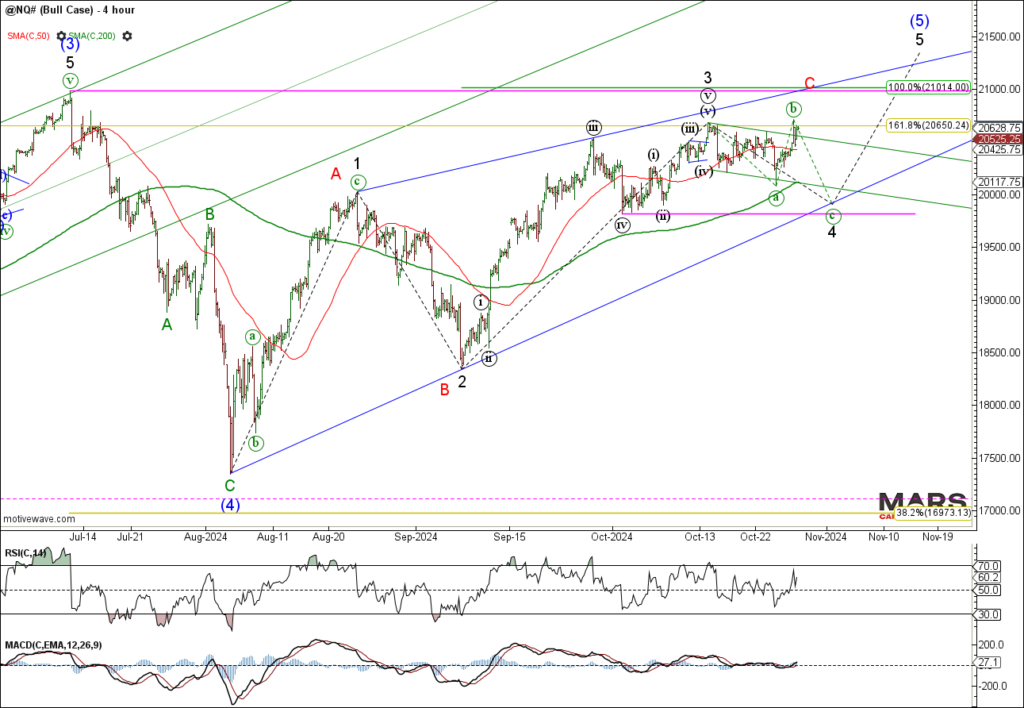
The Nasdaq / NQ pushed to marginal new highs as it edges towards strong overhead resistance in the 21000 area. This is a key week with MSFT, META and AMZN all reporting earnings. The bull trend remains intact while above key trend support at the 50 day sma. Be careful chasing this rally into ATH resistance as the overlapping nature of the rally and bearish momentum divergence is warning of potential trend exhaustion. Wedging into the highs?

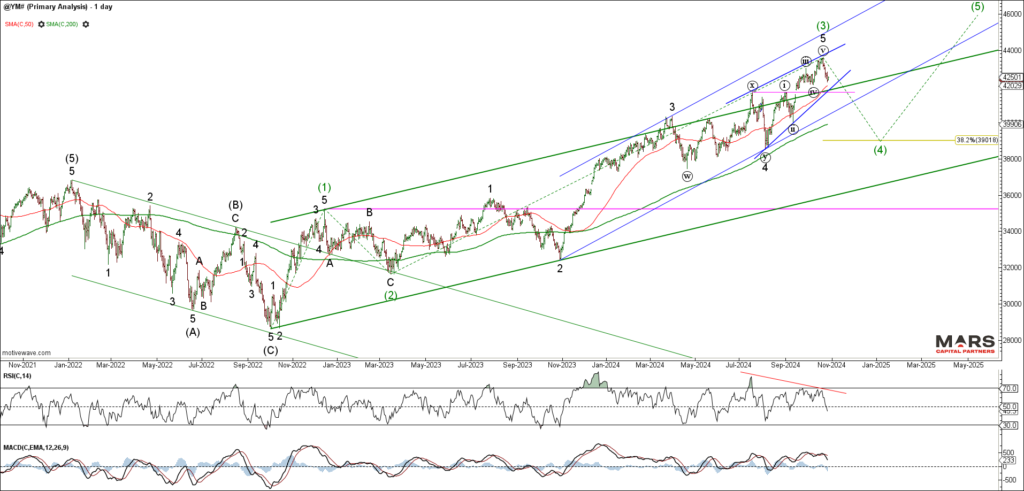
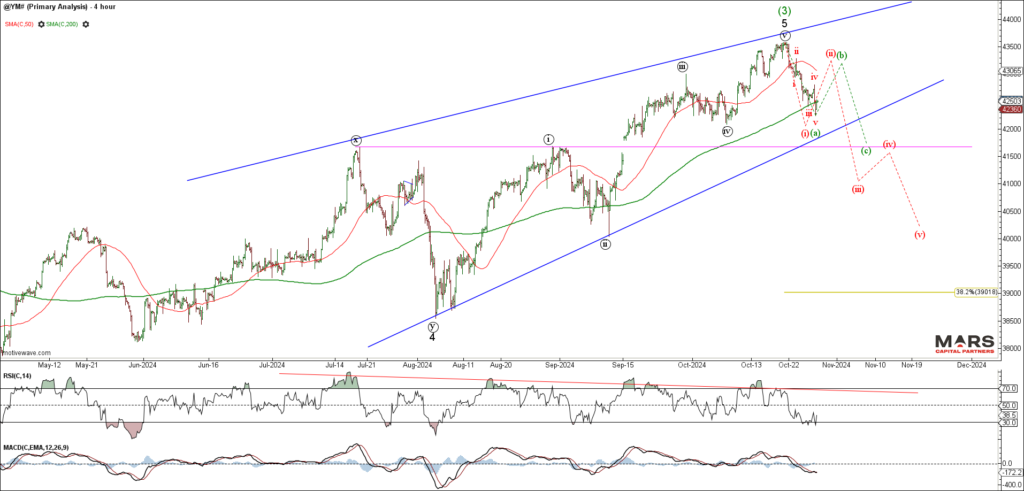
The DJIA / YM reversed sharply lower and is warning of a potential near term top. Bulls need to hold key near term support in the 41500-42000 area of the 50 day sma and recent breakout. A break of this support will open the door to further downside risk towards the 200 day sma. The impulsive nature of last week’s decline is a shot across the bow for equity risk.

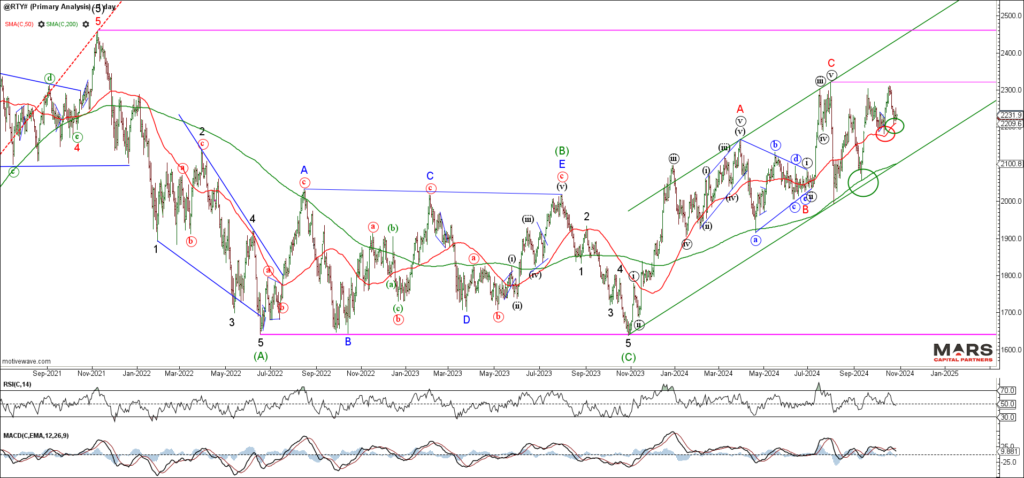
The Russell 2000 / RTY failed at overhead resistance and reversed sharply lower back towards the 50 day sma support. Last week’s bear reversal needs to break 50 day sma support to help confirm the potential for a larger decline. The RTY range remains bound by key overhead resistance at the 2320 highs and big picture trend support at the 200 day sma and trend support.
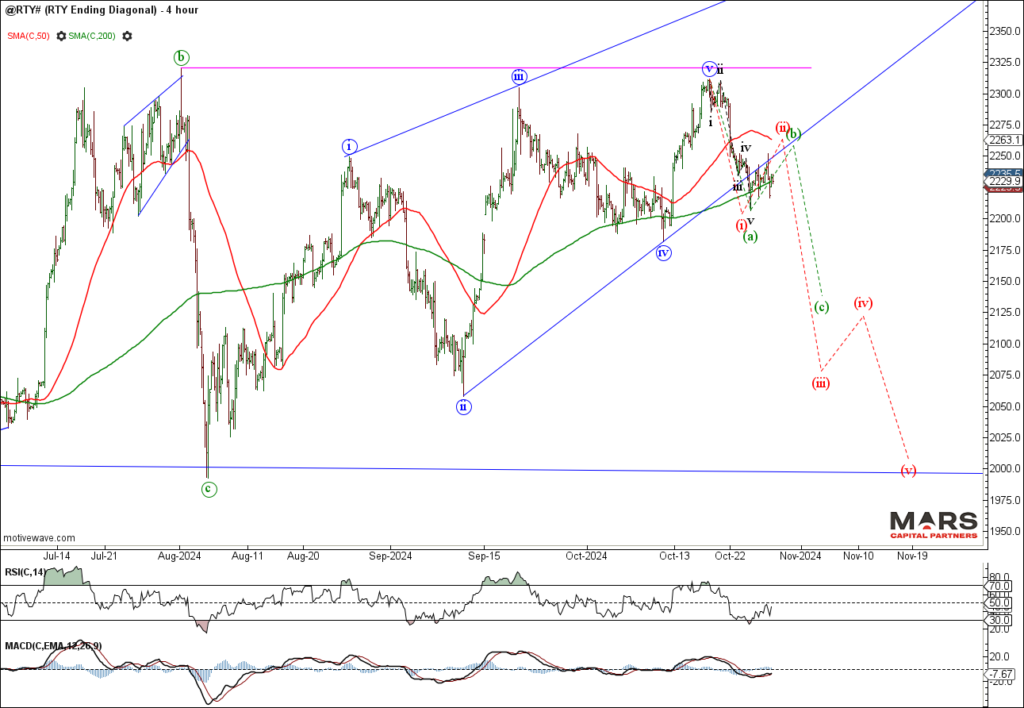
The near term Russell / RTY decline from recent highs appears impulsive and likely only part of a larger decline. Bears need to see downside follow through and break last week’s lows to set up a hard test of primary trend support at the 200 day sma.

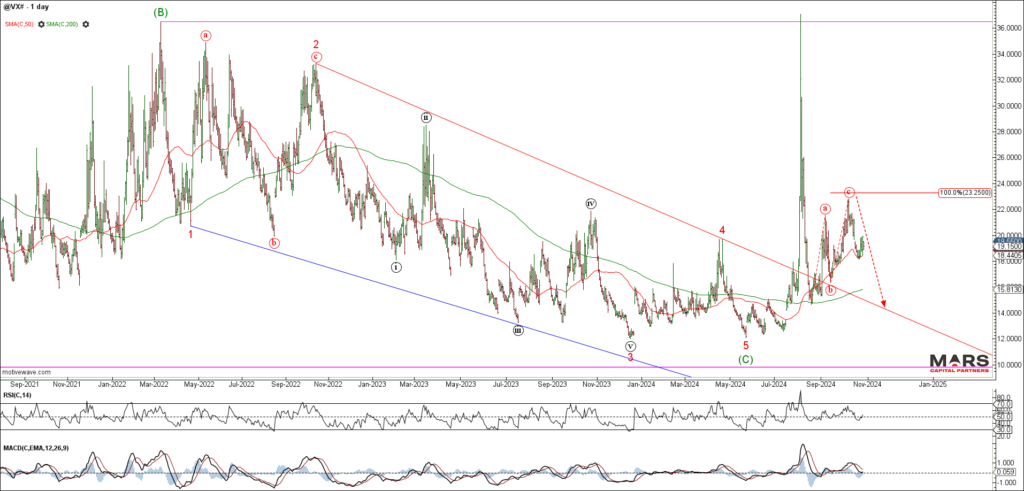
The VIX / VX remains elevated as the pull / push of fragmented markets warn of potential trend exhaustion leading into the US election. Ideally, we’d like to see a final push higher in the SPX and Nasdaq leading to a near term decline in the VIX. Given the data heavy week and impact of the US election the potential remains for the VIX to remain elevated.

Bond Markets – Rates continue to rise
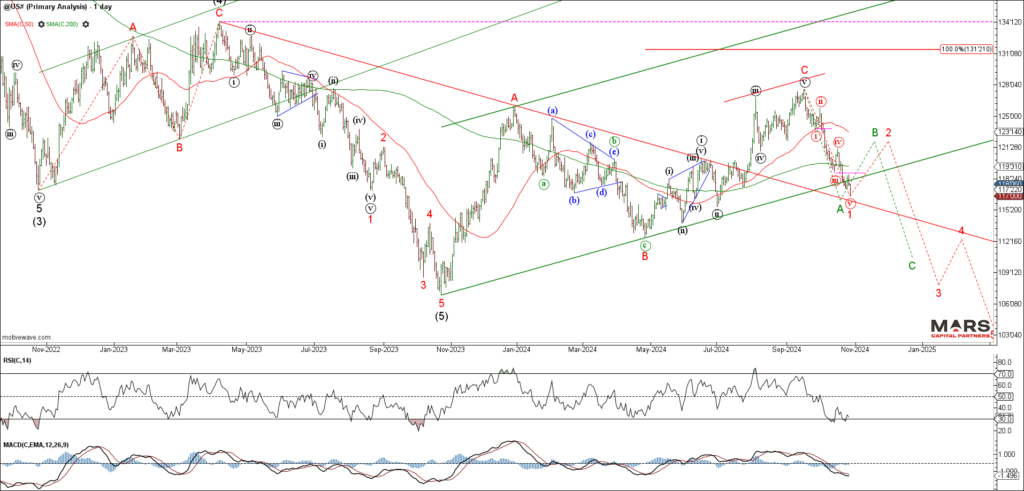
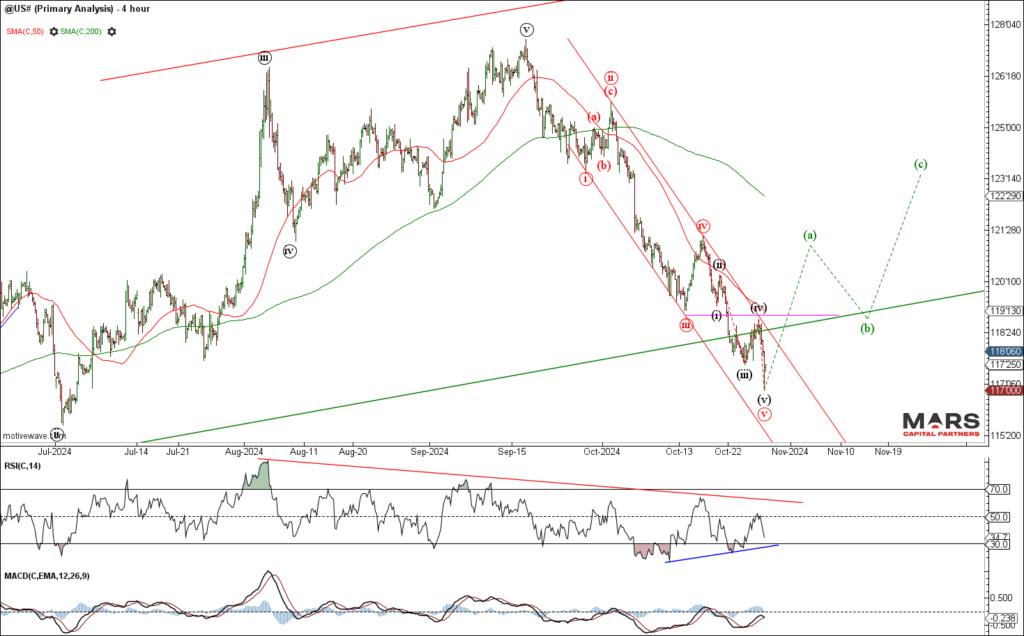
To the bond markets and the US30yr / ZB extended lower for a retest of trend support. While there is no confirmation of a tradable low, we are wary of the extended nature of this decline and bullish momentum divergence. Trade above last week’s high would warn of a near term low and counter-trend rally towards the 50 day sma resistance. Our big picture targets remain lower for at least a hard test of the 2023 lows.

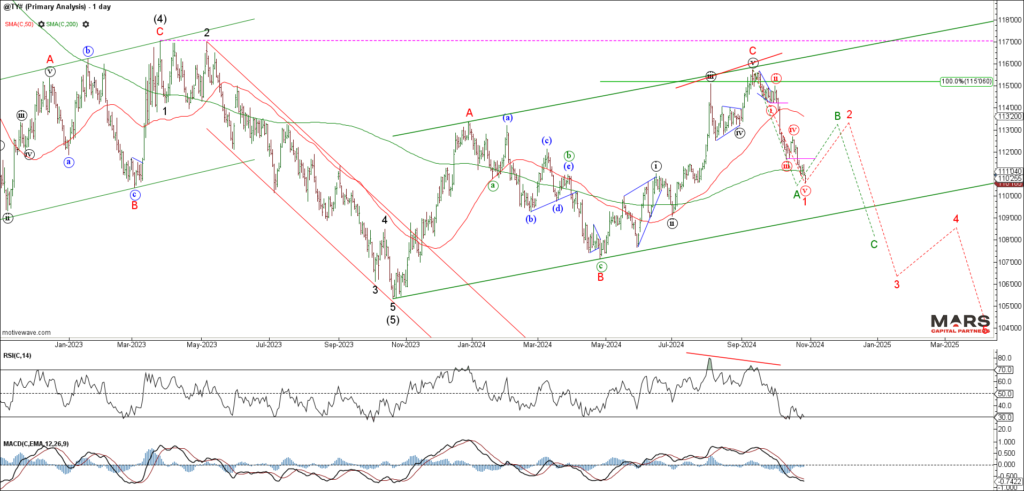
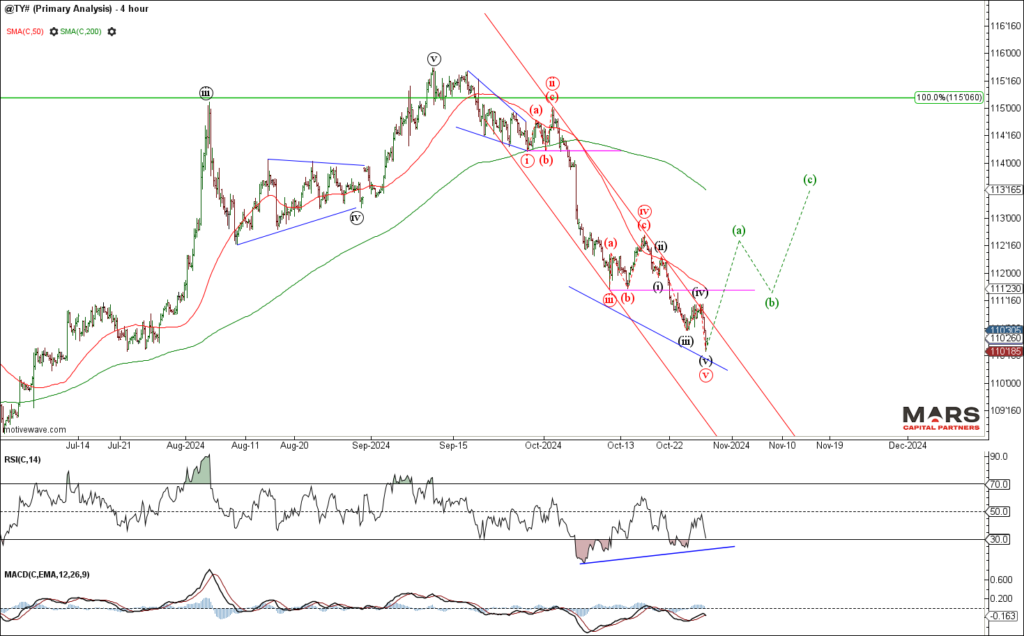
The US10yr / TY also extended lower as expected but the downside momentum is waning. While we remain bearish from a big picture perspective, there is increasing risk of a tradable low that sets up a counter-trend rally. Beware chasing bonds into the lows of this extended decline as bullish momentum divergence continues to build.

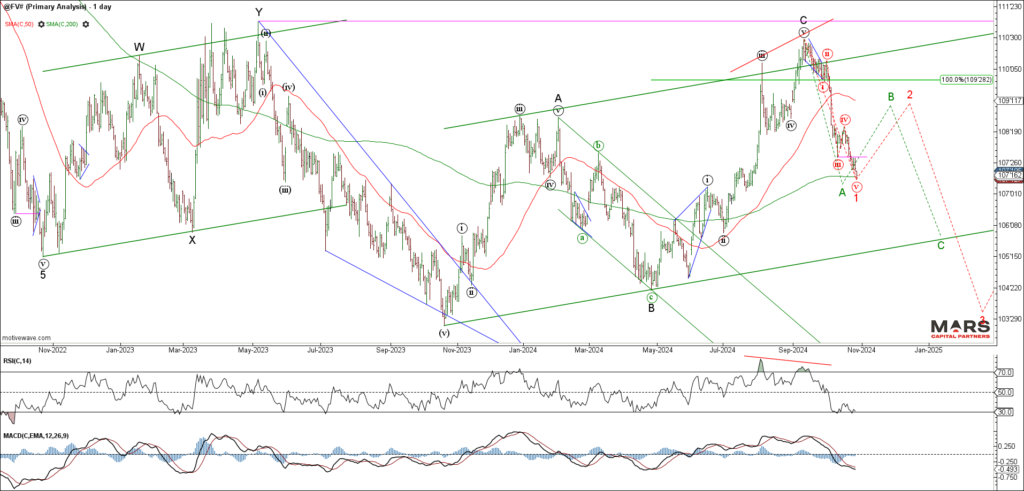
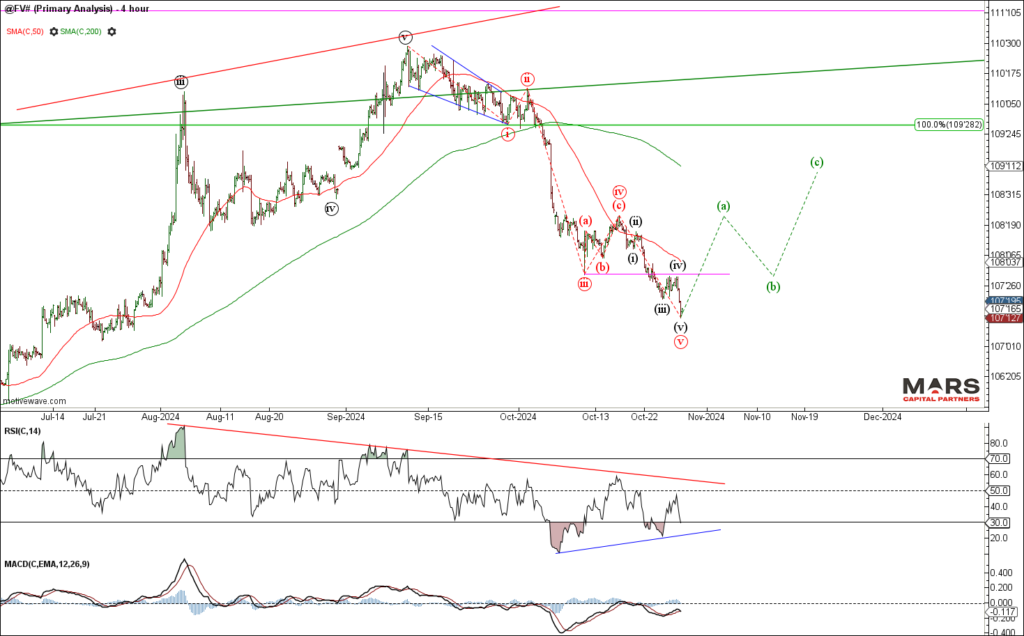
The US5yr / FV also extended lower as expected but bullish momentum divergence is starting to build at the recent lows. While there is no confirmation of a tradable low we are wary of chasing the near term decline into 200 day sma support. Trade above last week’s high likely triggers a counter-trend rally that targets the 50 day sma and sets up the next decline.

FX Markets – DXY rally extends
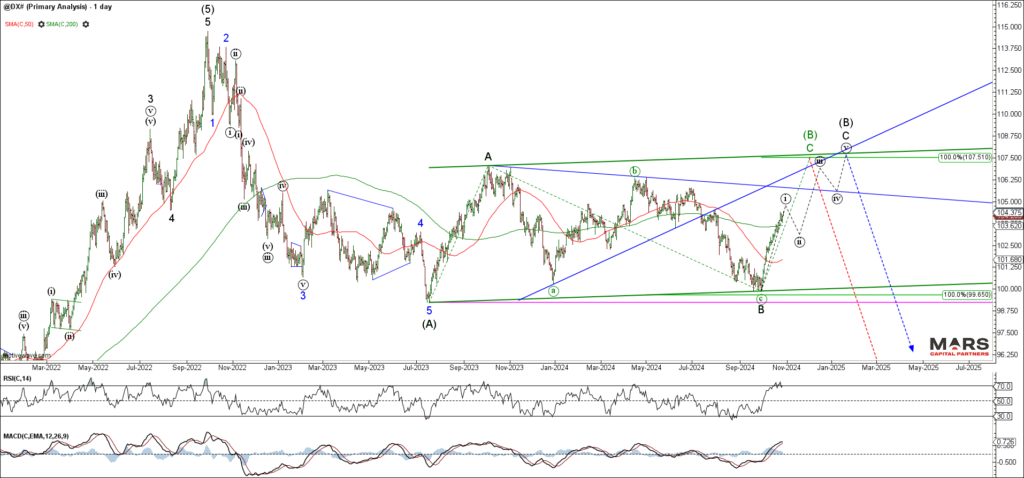
To the FX markets and the US$ continued to rally across the board. The DXY extended higher as it pressed towards upside targets in the 107.50 area. The question is whether it rallies directly towards upside targets or subdivides higher in 5 waves. We continue to see this rally as part of a counter-trend consolidation before the bigger picture bear trend reassirts itself.

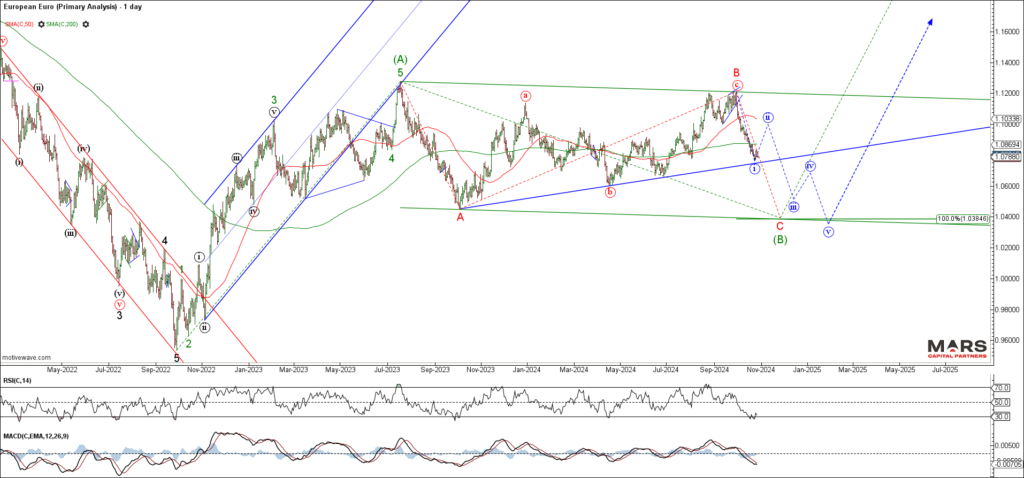
The Euro extended its decline for a hard test of trend support with no confirmation (yet) of a tradable low. Big picture downside targets remain lower towards the 1.04 area for this corrective decline. We continue to see the price action from the July 2023 highs as a consolidation before the next bull market rally in the Euro. The question is whether the decline extends immediately lower or subdivides into 5 waves down (blue count)?

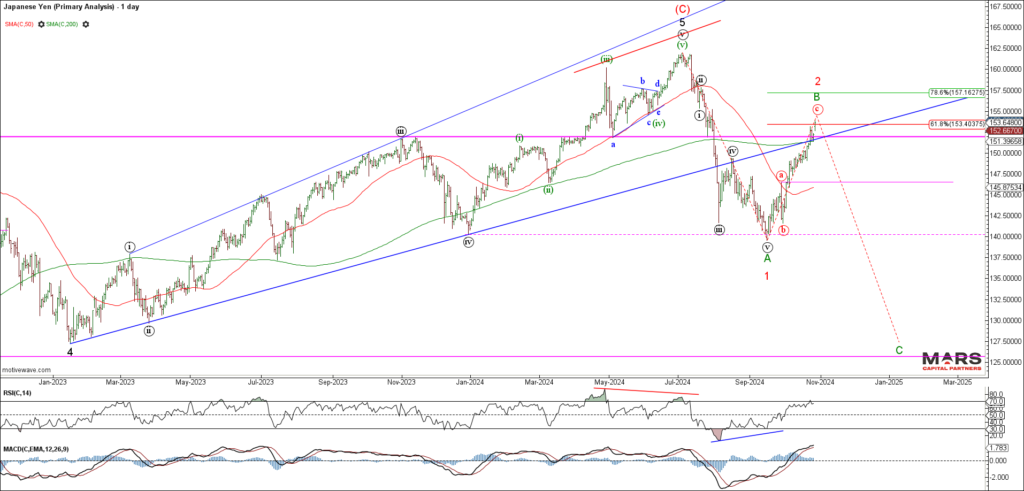
The USDJPY failed to reverse from our 151-53 resistance area and instead continued to rally strongly. The strength of the rally warns of a short squeeze and more potentially bullish outcomes. If in doubt stay out until we see confirmation of a bearish reversal (ideally back below the 200 day sma).

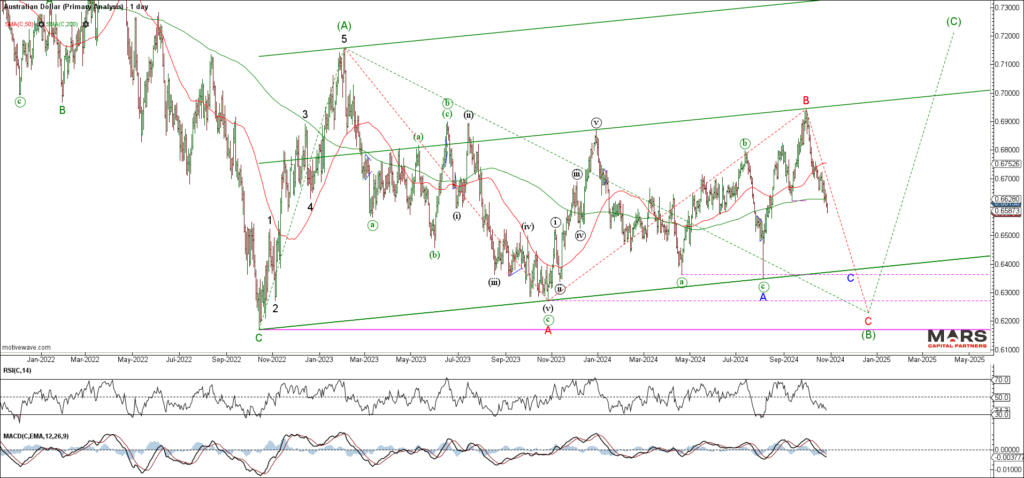
The Aussie$ continued to extend lower as we look for a hard test of trend support and potentially major swing lows in the 0.6170 area. No edge in the middle of the range here as we look for stronger support at lower levels. The bears remain in control until proven otherwise.

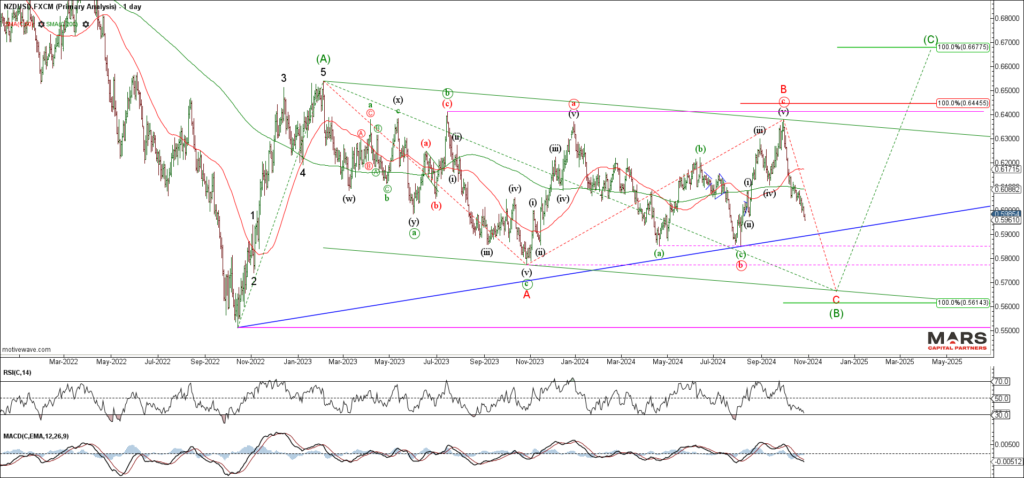
The Kiwi$ continued to extend lower as we look for a hard test of trend support and towards measured downside targets in the 0.56 area and potentially much lower. There is no evidence of a tradable low as it approaches layered support in the 0.58-0.5850 area.

Commodity Markets – PM’s exhausting?
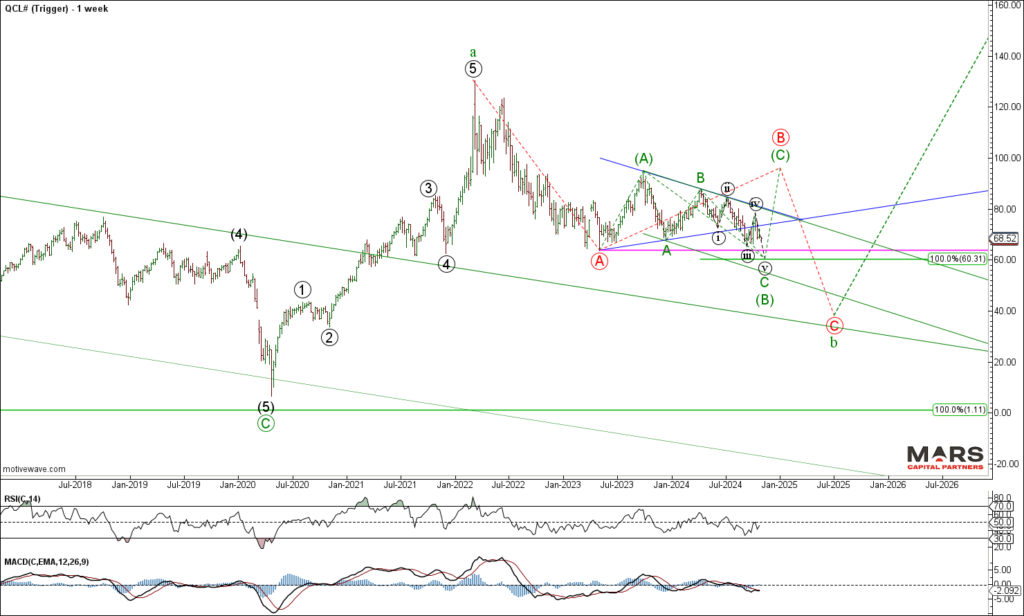
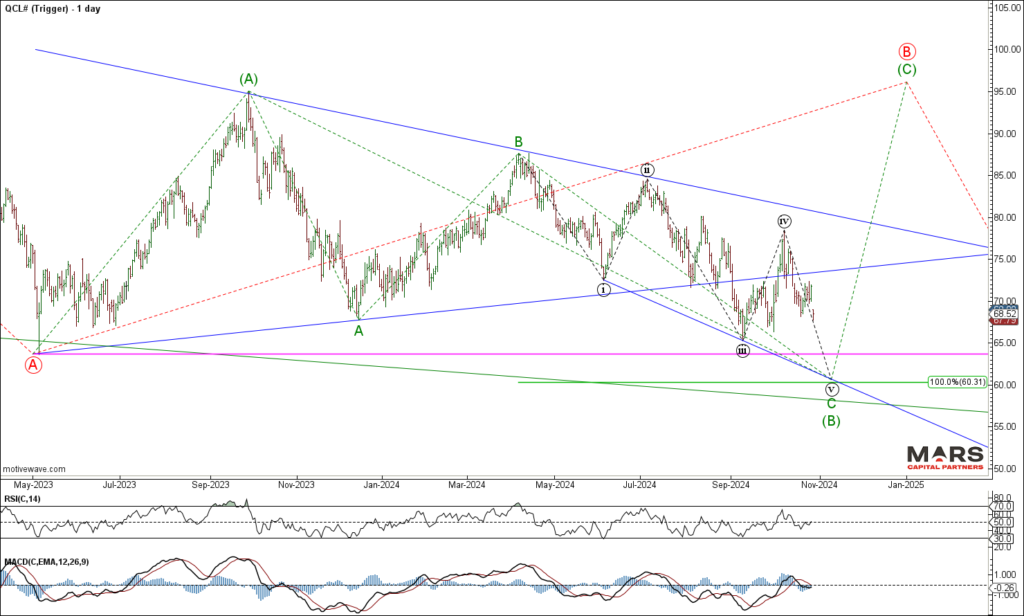
To the commodity markets and the indutrial commodities continue to lag as PM’s appear to be exhausting to the upside. Crude Oil continues to stair step lower after a counter-trend rally and is once again testing big picture support. We do not have a clear count for CL given the range racing but the inability to hold a rally warns of more downside risks. Bulls need to hold measured support in the 60-62 area or risk a much larger decline.

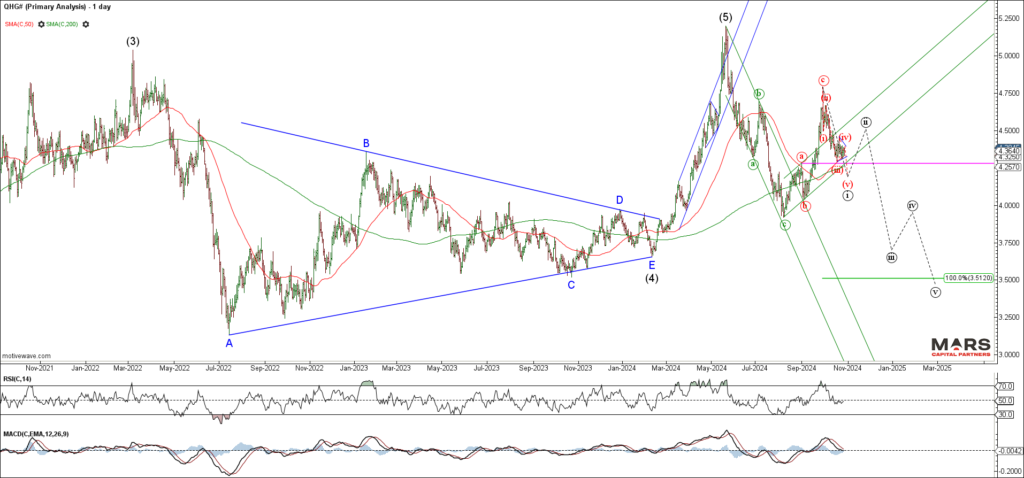
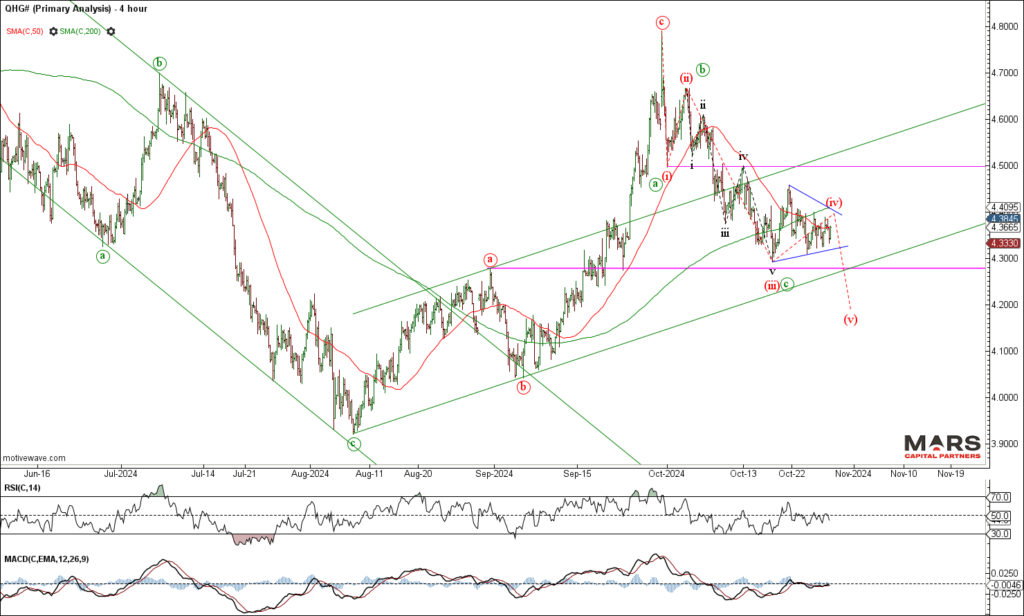
Dr Copper continues to hold near term support but would look best with a final thrust lower to help confirm the bigger picture bear trend. We continue to see corrective declines and corrective rallies in this range bound market. A push to marginal new lows below 4.28 support while below the 4.50 resistance would help set up a bigger picture decline over the next couple of weeks.

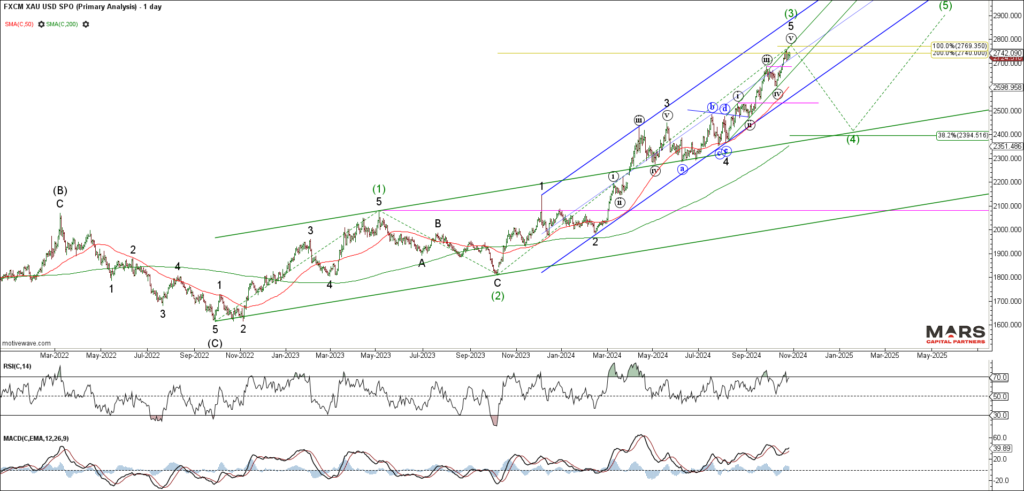
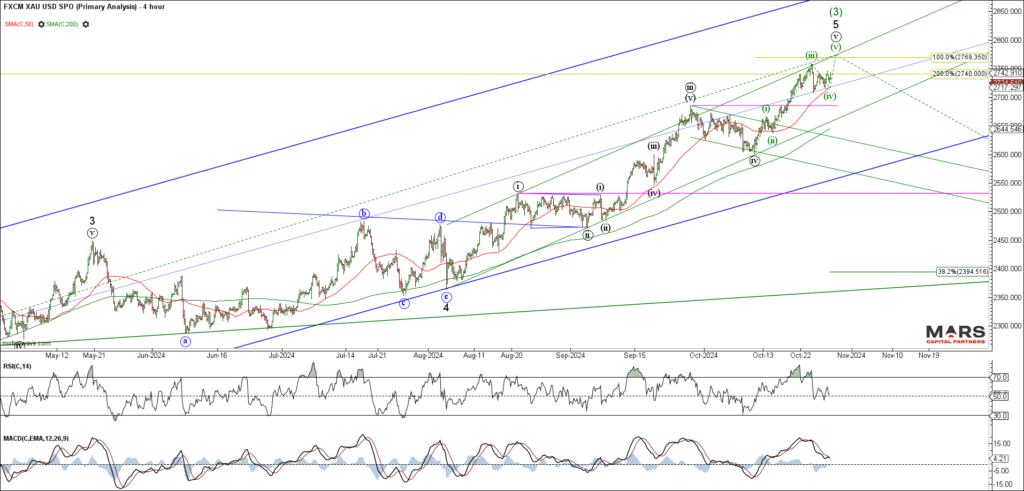
To the PM’s and Gold continues to subdivide higher with no confirmation of a tradable top as we look for upside trend exhaustion. We continue to respect the bigger picture bull market trend as the series of higher highs and higher lows continues. We are alert to the potential for a reversal as bearish momentum divergence continues to build.

Silver pushed to marginal new highs before fading later in the week. While there is no confirmation yet of a tradable top, there is a risk of trend exhaustion at overhead trend resistance. Bulls remain in control while breakout support holds in the 32.50 area.
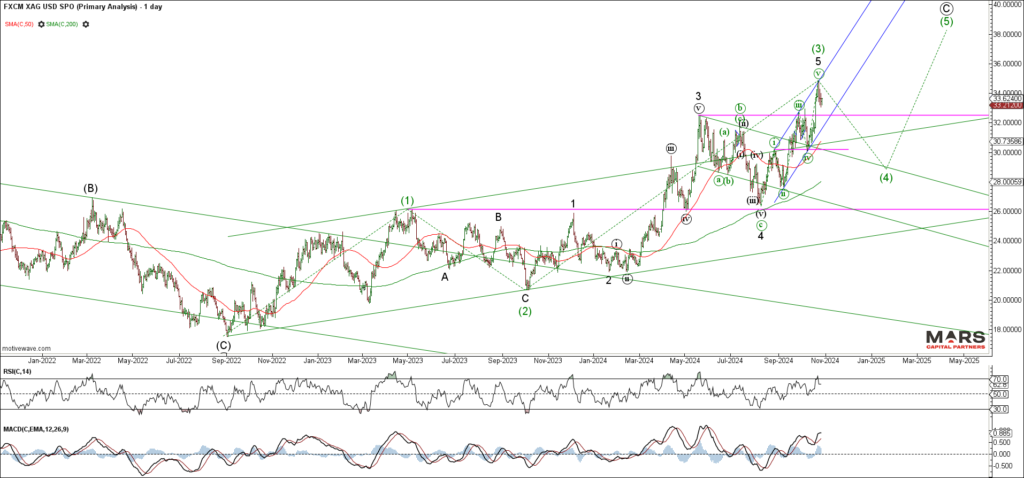
Silver bulls chasing the breakout.

Crypto Markets – Testing resistance
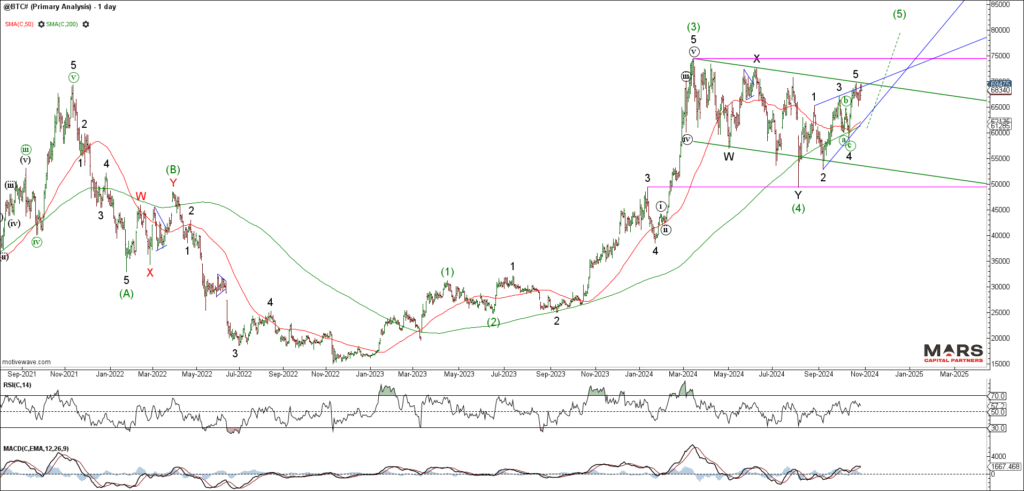
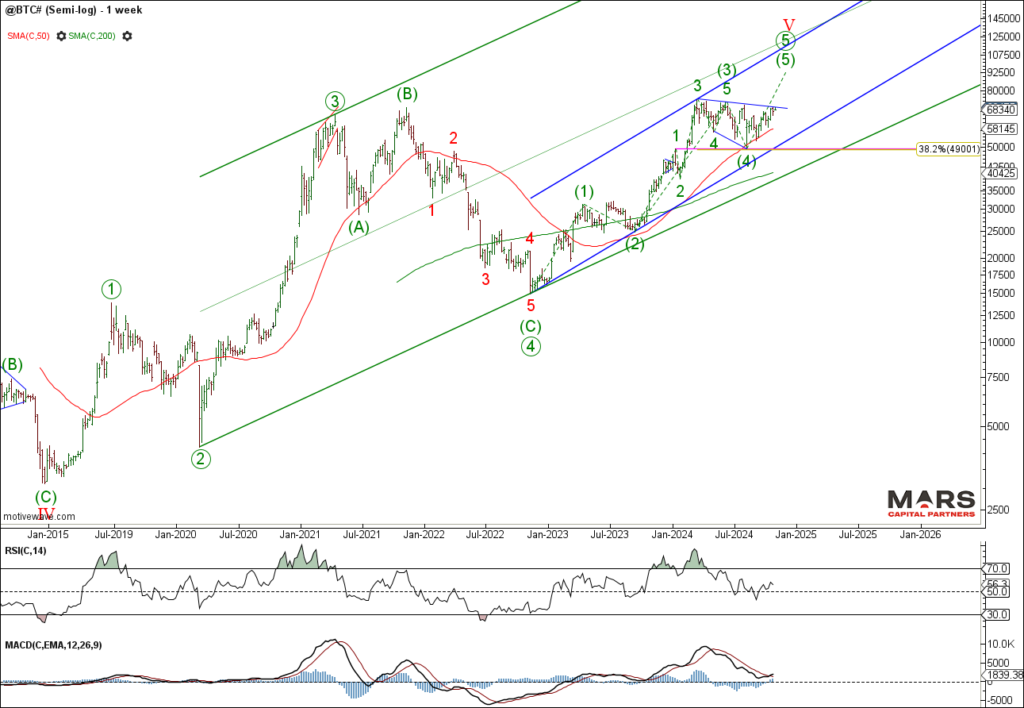
To the crypto markets and Bitcoin continues to test overhead trend resistance for what appears to be a bull flag. While the structure of the rally is unclear, the declines appear corrective within an ongoing bull market trend. Bulls need to break up and out of this trend resistance for a strong rally through new ATH’s. Near term trend support remains at the 50 / 200 day sma as we look for a break higher.
That’s all for now. Have a great week and trade safe 🙂

