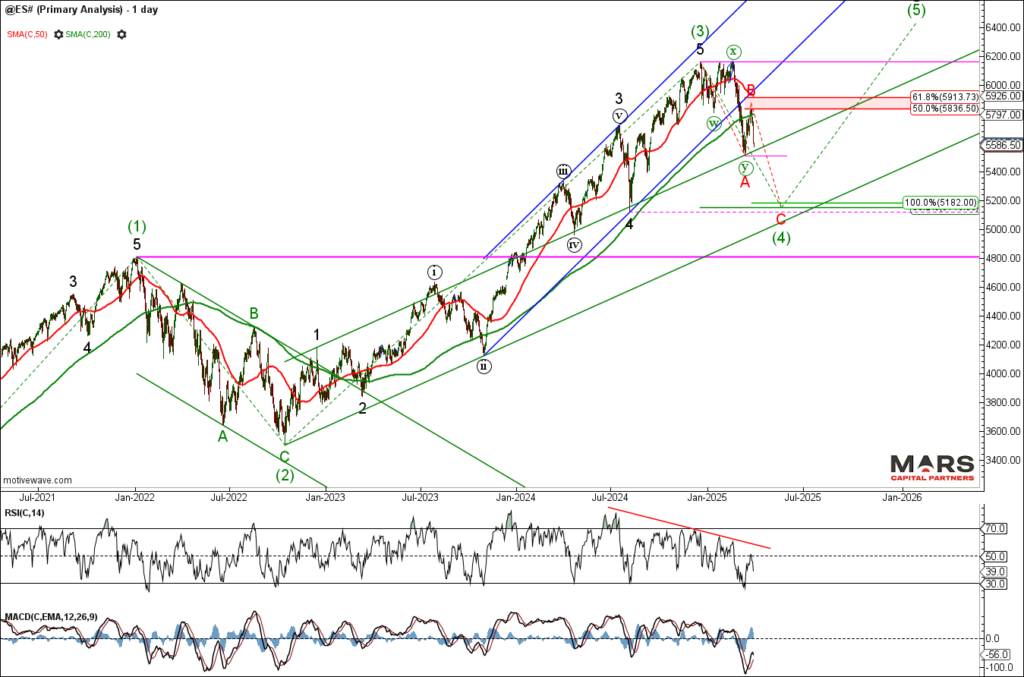
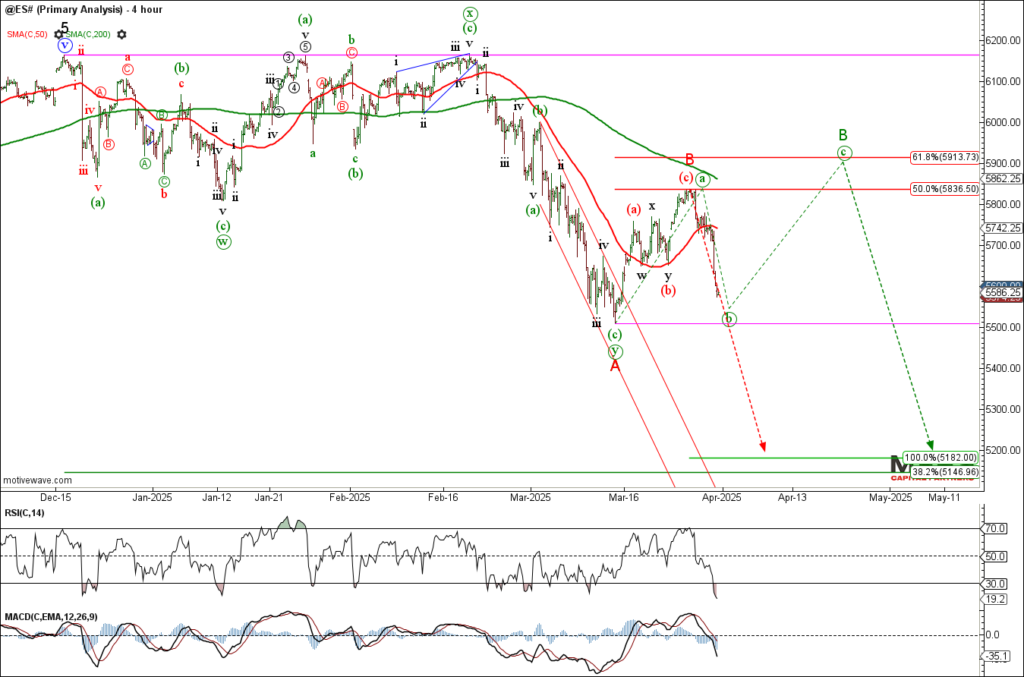
Last week, equities extended higher as expected in a counter-trend rally into overhead resistance before reversing sharply lower. The question is whether the rally was “all” or “part” of a wave B counter-trend rally. The impulsive nature of Friday’s decline warns of an immediate red wave C decline towards big picture targets. The alternate is a more complex green wave B if bulls can hold recent swing low support. The equity markets remain bearish from a big picture perspective until proven otherwise.
Rates and the US$ are attempting to reverse lower to help confirm our bearish outlook as this risk off environment takes hold. The shorter end of the bond market in particular appears bullish as we look for a 5th wave extension higher. The Euro held key support and is attempting to reverse higher to help maintain our bullish outlook. Gold pushed to new ATH’s as expected but the rally is very extended as we look for evidence of a tradable top. Trump’s tariffs continue to weigh on markets as the economic outlook remains uncertain.
Equity Markets – Bear reversal
To the equity markets and the benchmark SPX / ES extended higher for a counter-trend wave (c) rally before reversing sharply lower as expected. The impulsive nature of last week’s decline warns that red wave B is complete and a strong wave C decline is underway. The alternate is a more complex green wave B counter-trend rally if bulls can hold recent swing low support. Either way, the recent counter-trend rally helped confirm our bigger picture bearish outlook with wave (4) targets lower towards the 5150 area. Bearish now or bearish later…
ES traders flipped net short.

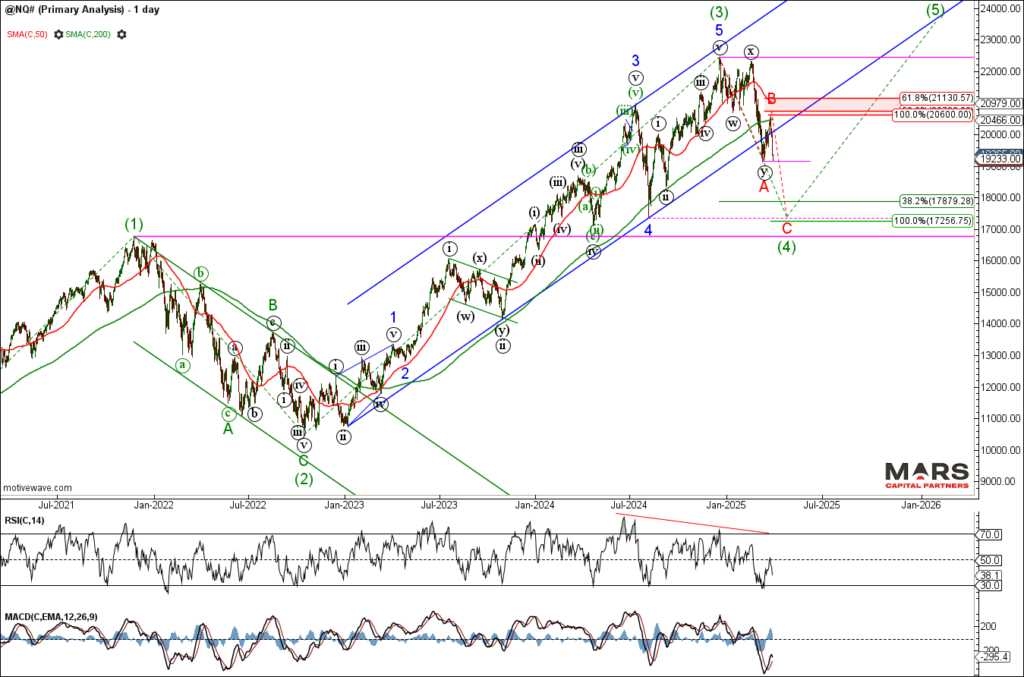
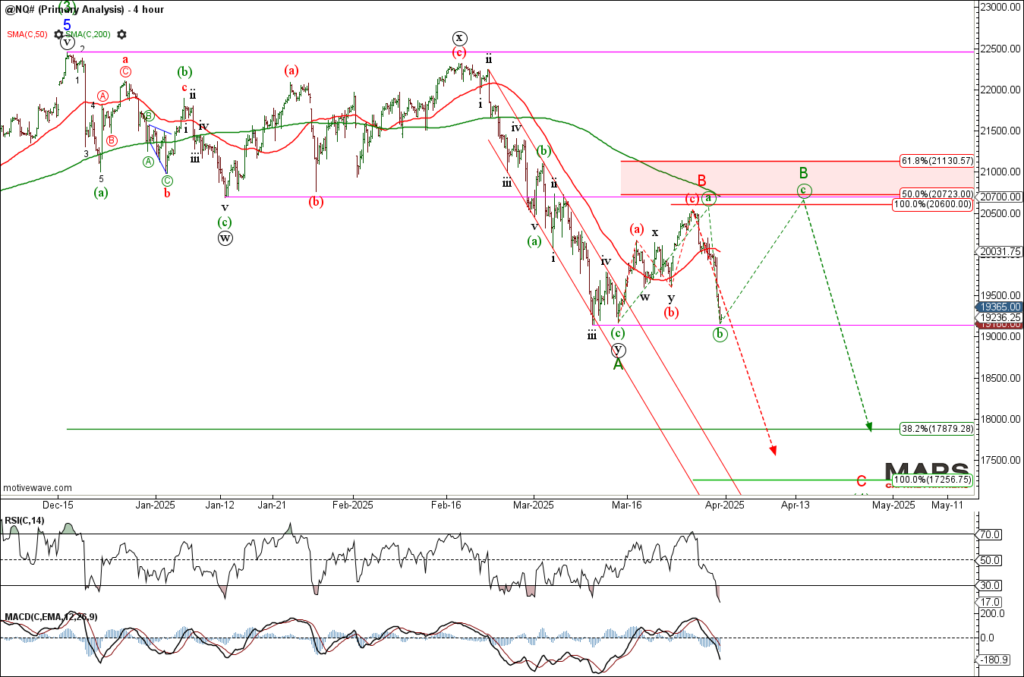
The Nasdaq / NQ also extended higher in a counter-trend rally before reversing sharply lower. While there are enough waves in place to complete red B, bears need to break recent swing lows and continue its impulsive decline to help confirm wave C down. The alternate is a more complex green wave B counter-trend rally if bulls can hold near term support. Either way, the bigger picture trend remains bearish until proven otherwise as we look for wave (4) down towards targets in the 17250 area.

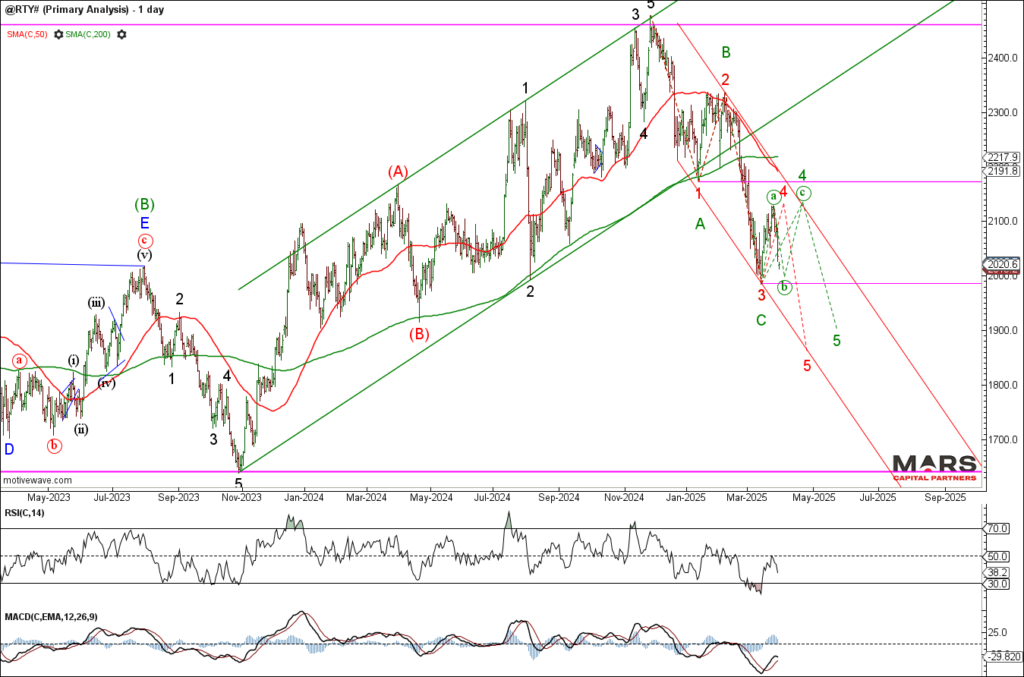
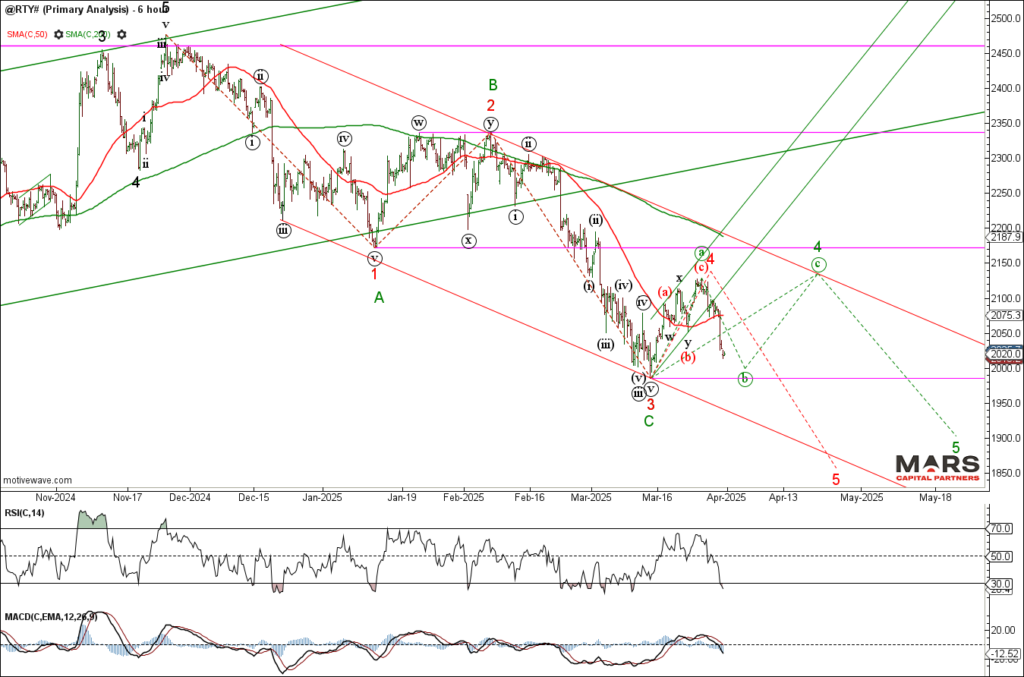
The Russell 2000 / RTY reversed sharply lower while below key overhead resistance as expected. The question is whether the rally completed green wave (a) or “all” of red 4 with wave 5 down on deck. The structure remains bearish while below the wave 1 overlap in the 2172 area as we look for confirmation of a bigger picture bearish decline.

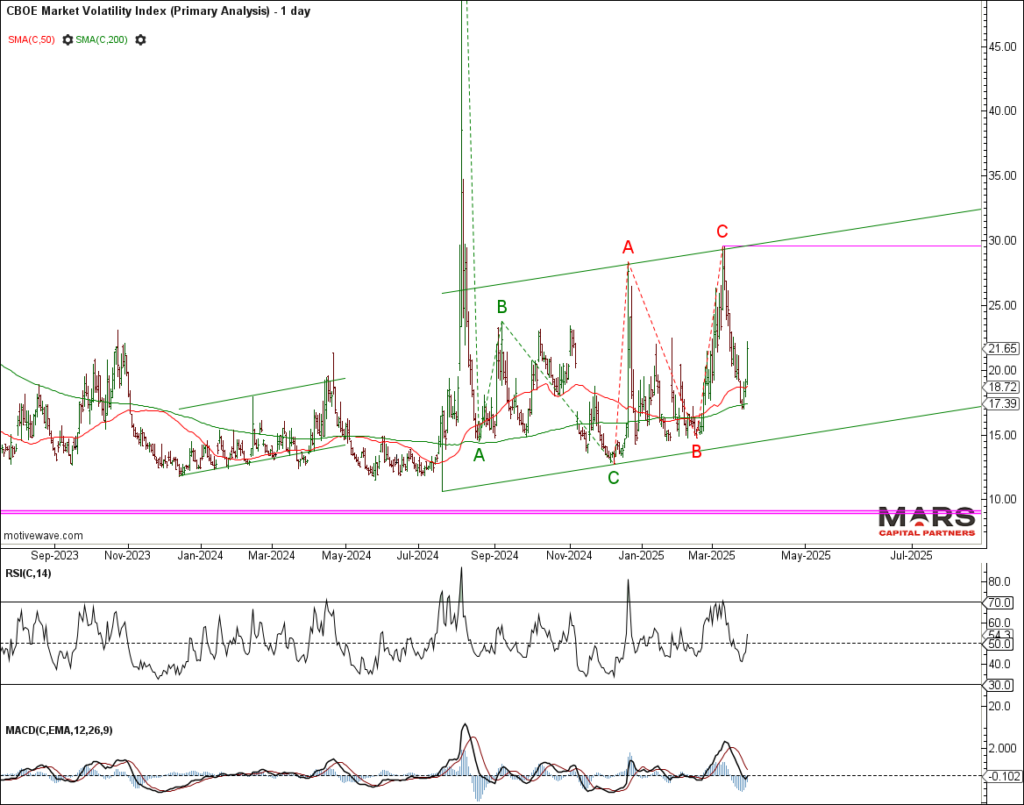
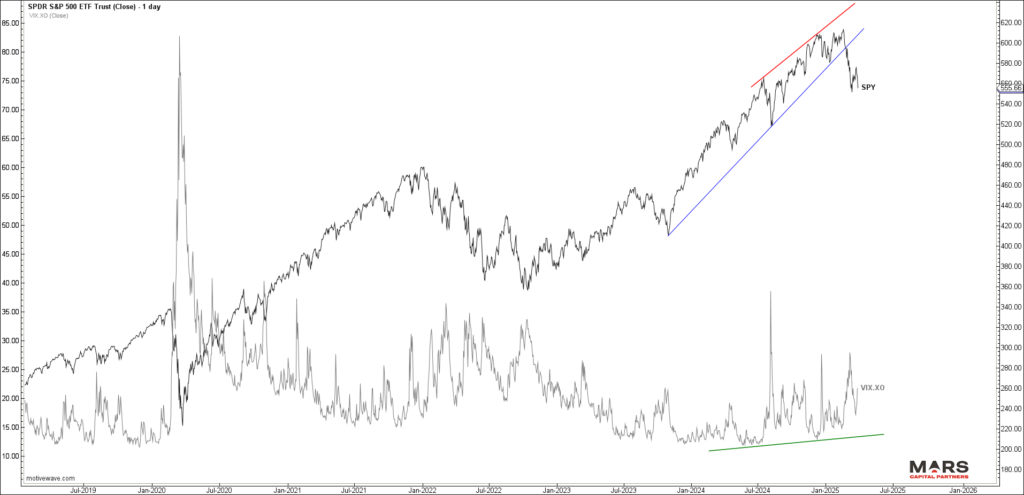
The VIX reversed sharply higher from 200 day sma support but it remains range bound from a big picture perspective. This consolidation is consistent with a bigger picture wave (4) correction in the equity markets. No edge here as the range racing continues and Trump threatens a trade war. The response in the VIX has been muted so far.

Bond Markets – Breaking higher?
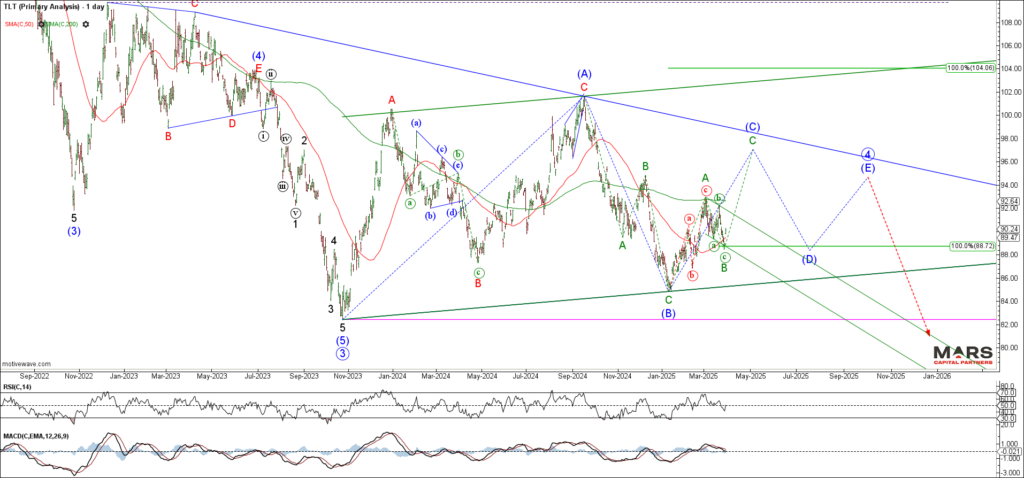
To the bond markets and the TLT declined in 3 waves of equality before reversing higher late last week. The TLT is likely trapped within a big picture triangle but bulls need to clear overhead resistance at the 200 day sma to help confirm more bullish potential. It remains range bound within a big picture consolidation until proven otherwise.
The 30yr / ZB only shows 3 waves up and 3 waves down so far but has the potential for a break higher in wave C of (C). Bulls need to clear 200 day sma resistance to open the door to a larger rally. Likely limited upside given the corrective nature of the initial rally within a big picture triangle.
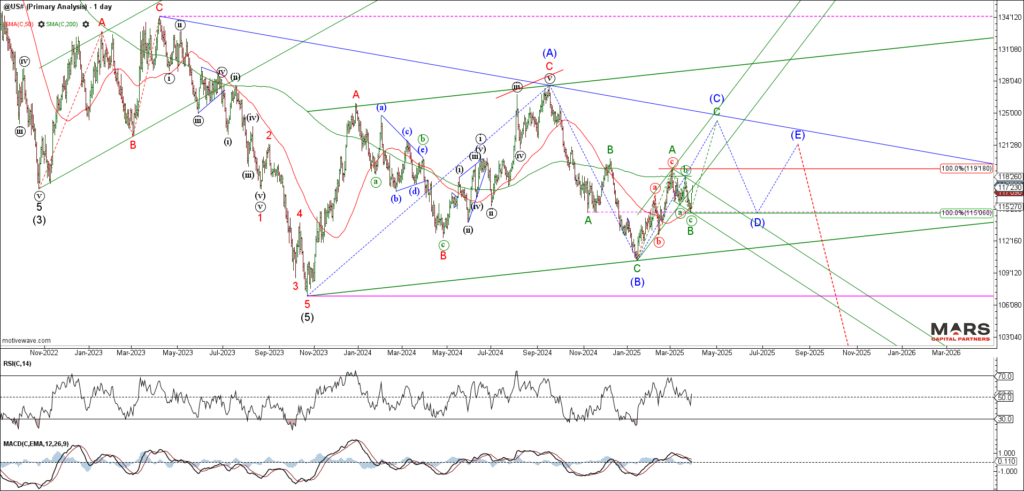
Bulls and bears are exiting long bonds en mass.

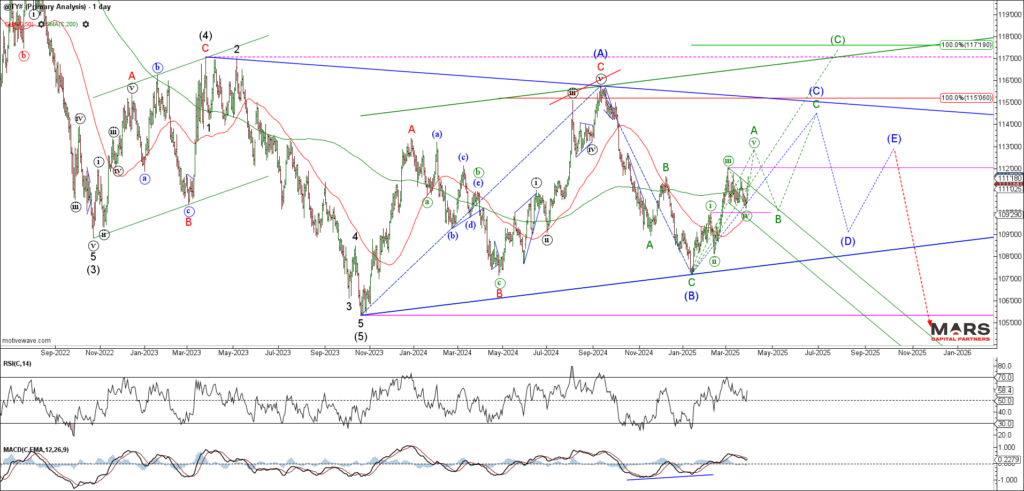
The US10yr / TY held overlap support and rallied strongly late last week to help set up a 5th wave rally. Bulls need to clear 112 overhead resistance to open the door to a bigger picture wave (C) higher. We continue to see this rally as part of a larger degree correction. Despite being range bound, the outlook remains higher for a bigger picture wave (C) rally.
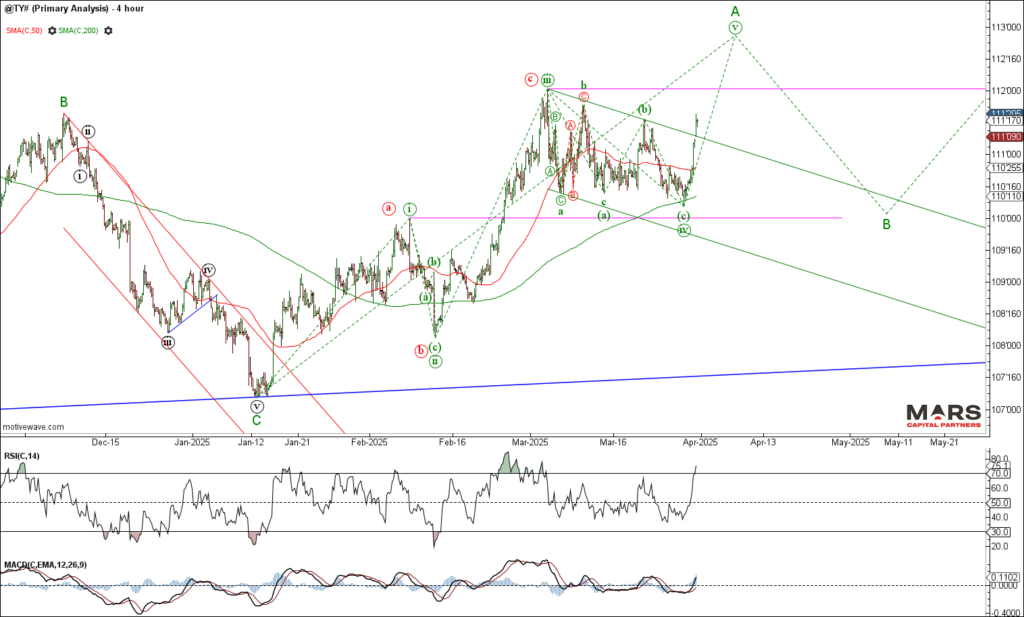

The US5yr / FV also held our near term support and rallied strongly late last week. Bulls need to clear overhead 118’20 resistance to help confirm 5 waves up from the lows and open the door to a bigger picture wave (C) rally. Bonds remain range bound from a big picture perspective with upside potential in the 112 area.
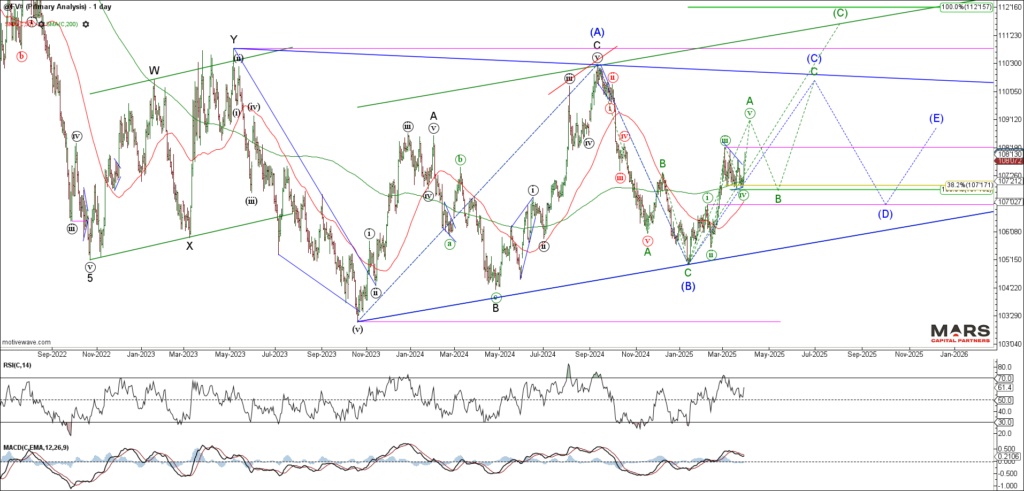
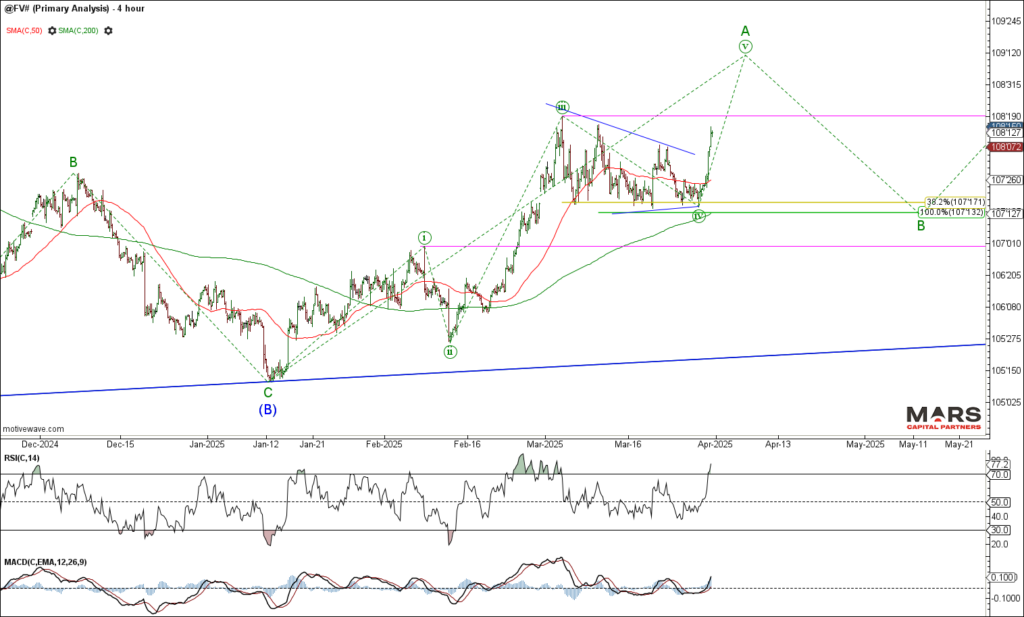

Both rates and the US$ would look better with downside extensions to keep the bear trends intact.
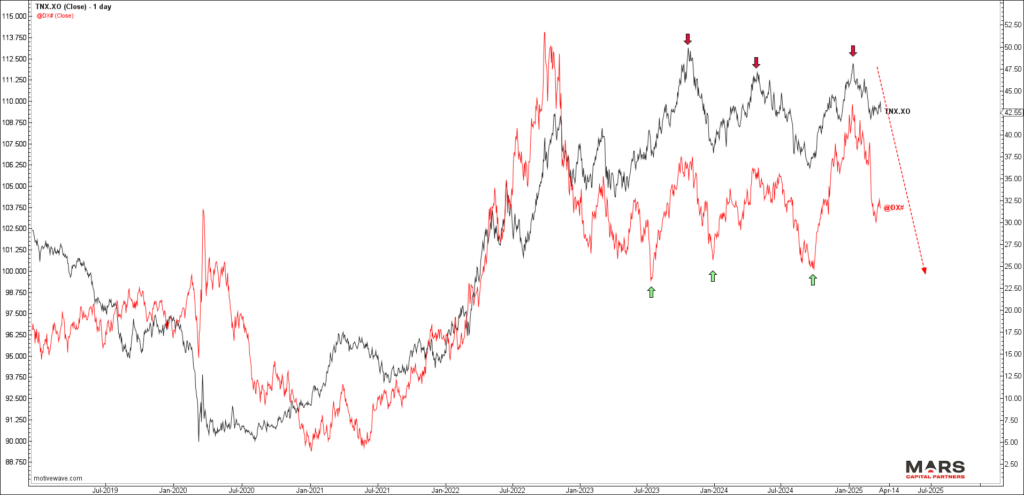
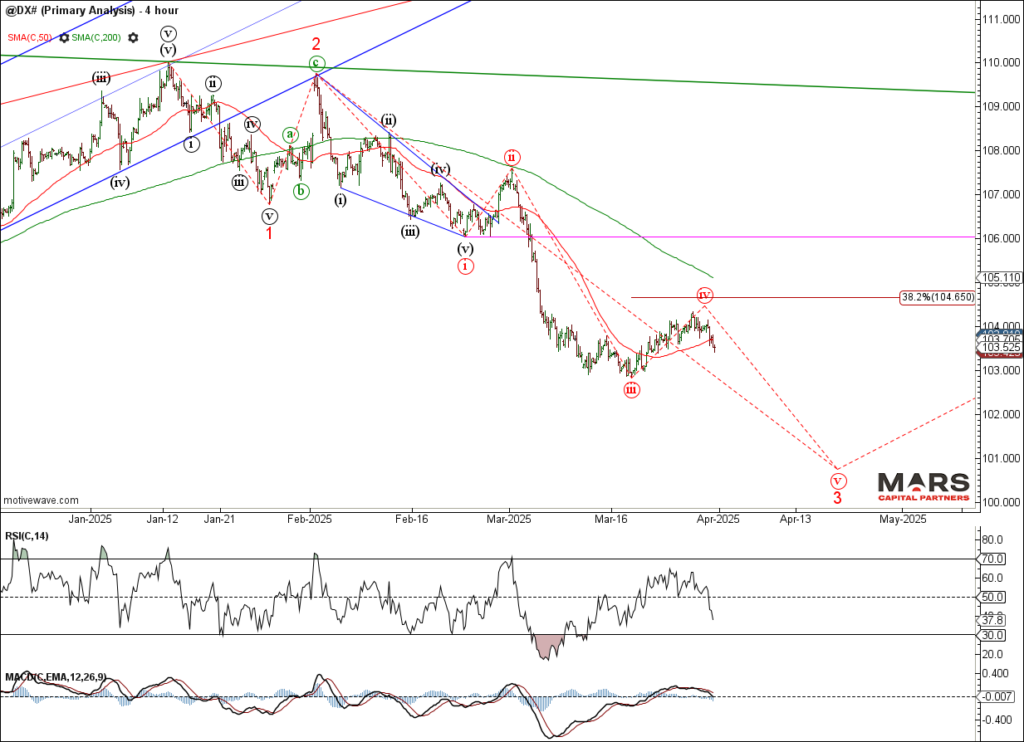
FX Markets – DXY turning lower?
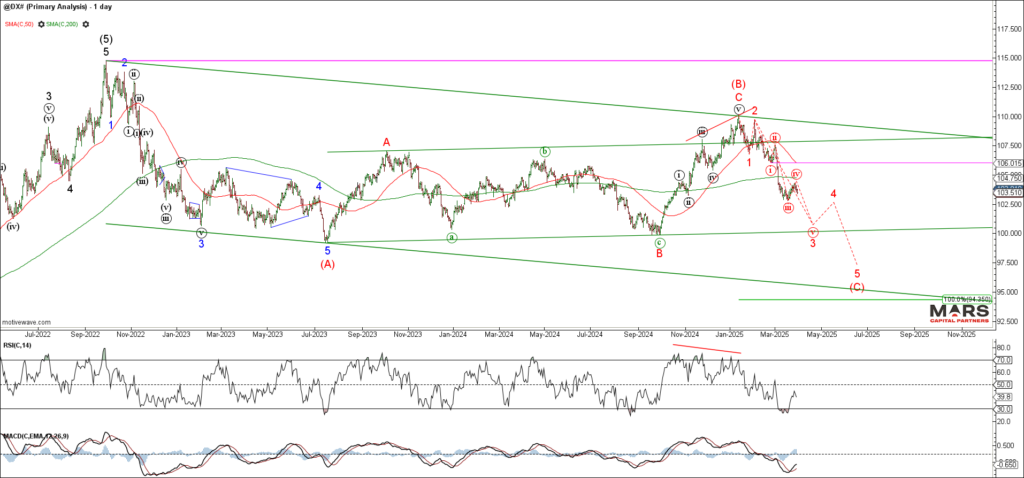
To the FX markets and the DXY is attempting to turn lower for what we expect to be part of a bearish wave (C) decline. The structure remains bearish while below the key 106 wave (i) overlap. Ideally, we’d like to see a downside continuation this week to help maintain the bear trend with bigger picture targets in the 95 area.

The Euro held near term support at the 200 day sma and is attempting to rally up off these lows. The near term rally is not yet clearly impulsive and needs to clear 1.0950 resistance to help confirm our bullish outlook. Bulls need to hold the line here. Trade back below the 1.0533 wave (i) overlap invalidates the bull case.
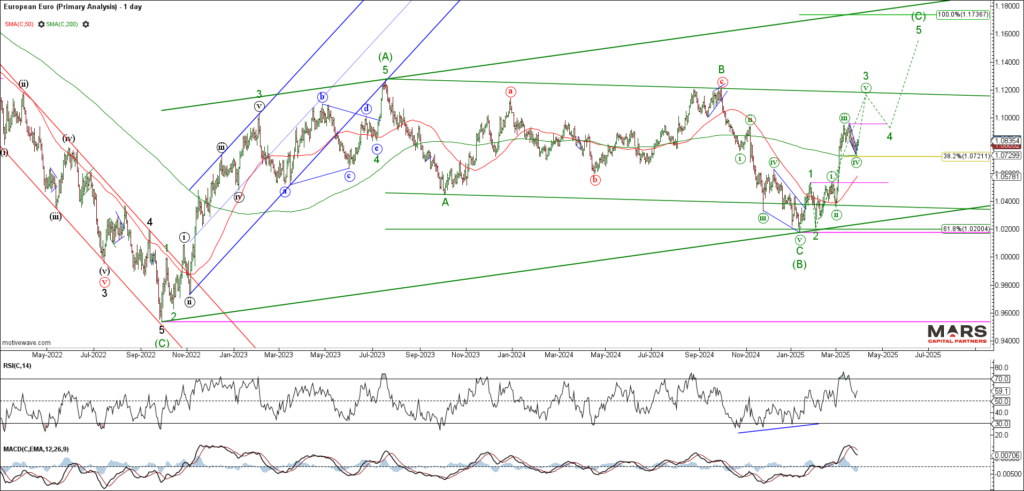
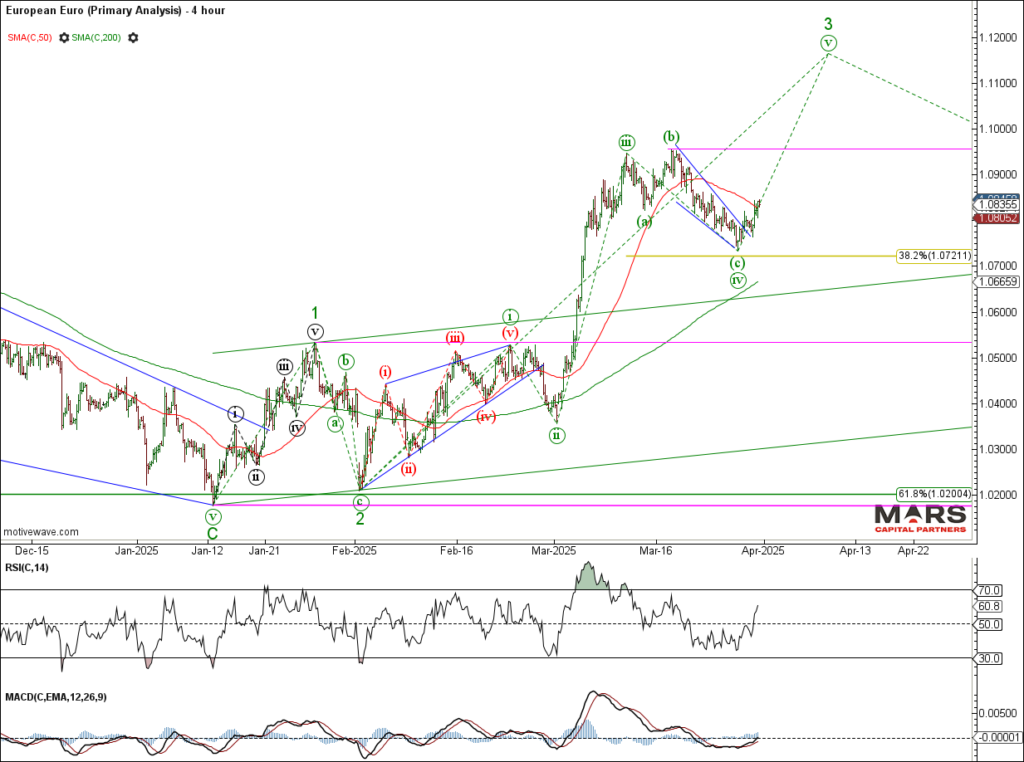
Euro traders have flipped net long.

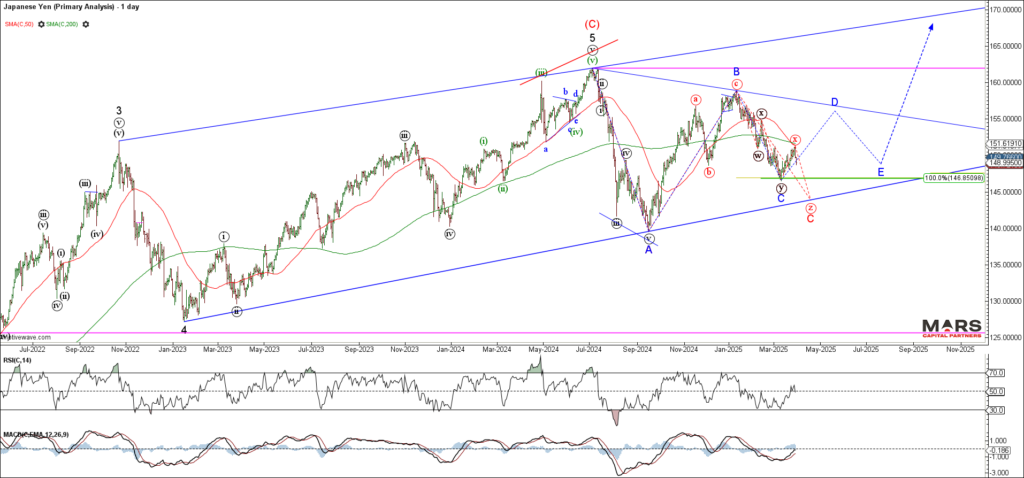
The USDJPY reversed sharply lower from the 50 / 200 day sma resistance but the decline appears corrective. While the potential remains for an extension lower towards trend support in the 144-145 area, there is no clear directional trend. Best to avoid until we see a clearly impulsive trend develop – range racing with no edge.

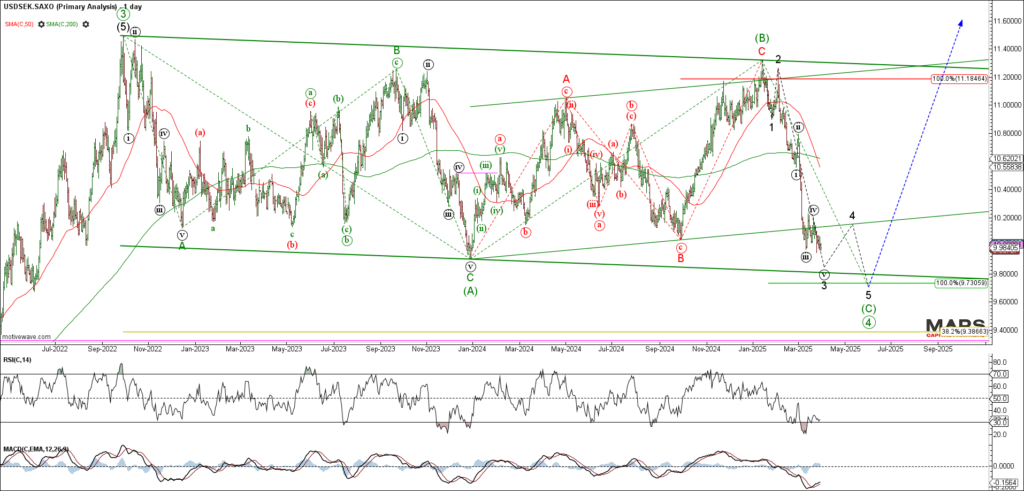
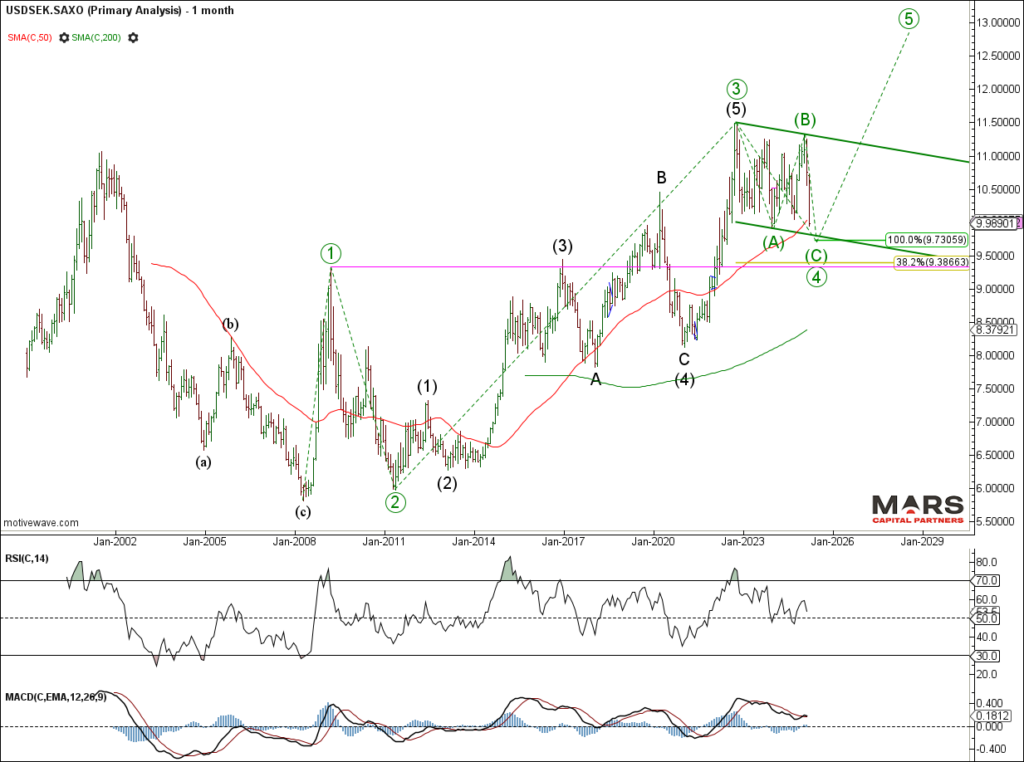
The USDSEK is fast approaching big picture support in the 9.73 area. The decline from the 2022 highs appears to be a 3-3-5 “Flat” correction within a larger bull trend. Ideally, we’d like to see a 5 wave decline that terminates in the 9.73 area before evidence of a bullish reversal. Given the bearish outlook for the US$ across the board, it’s best to await evidence of a bullish reversal before considering longs. Critical overlap support remains lower towards the 9.32 area.
Commodity Markets – Gold new ATH’s
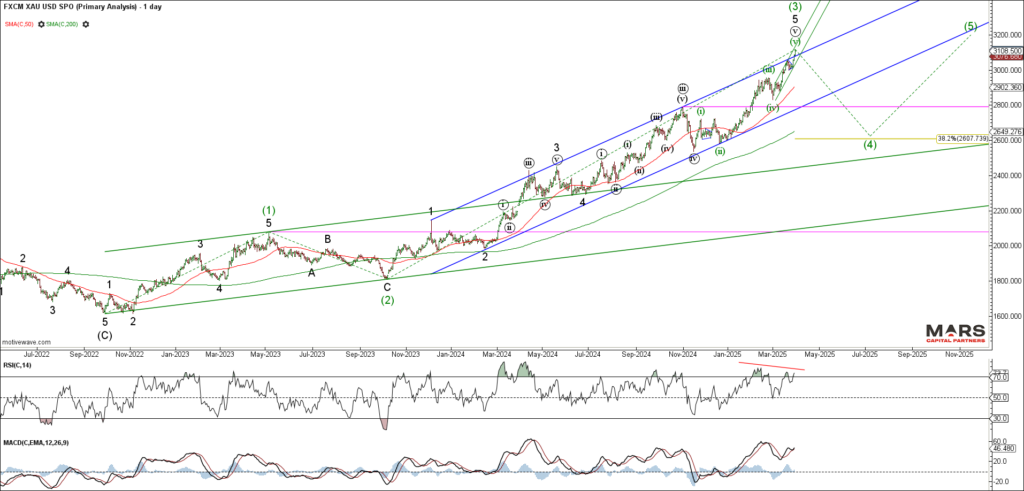
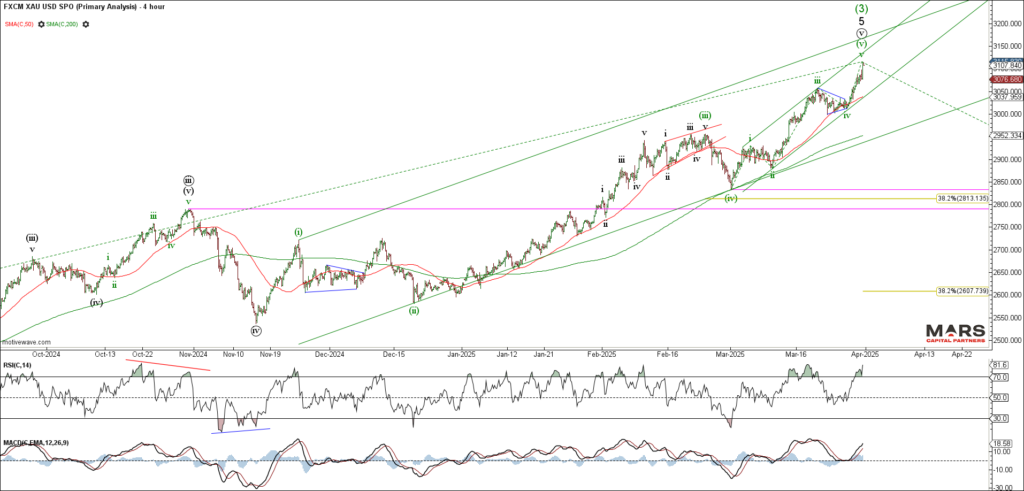
To the commodity markets and Gold pushed to new ATH’s in what appears to be a 5th wave blow-off top. While there are enough waves to complete wave (v) of 5 of (3) up, there is no evidence yet of a tradable top. Bears need to break the series of higher highs and higher lows to help confirm a change in trend. Too early to call.

Silver is testing major swing highs as we look for a final wave 5 rally. There is no evidence of a tradable top as it continues to wedge into the highs. We are wary that this latest rally is potentially an ending wave so buyer beware as it pushes to new cycle highs. The fake-out new ATH’s in Copper is a warning to all.
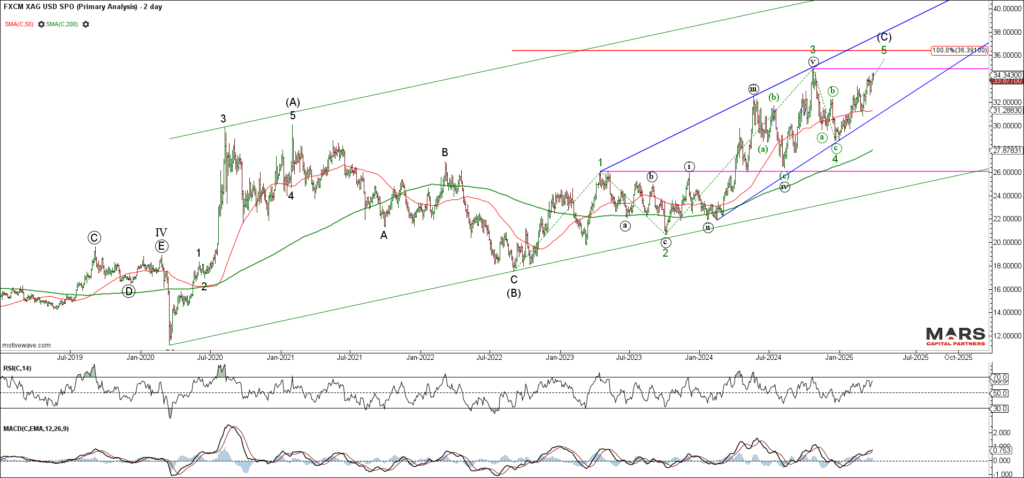
Silver bulls pressing into the highs.

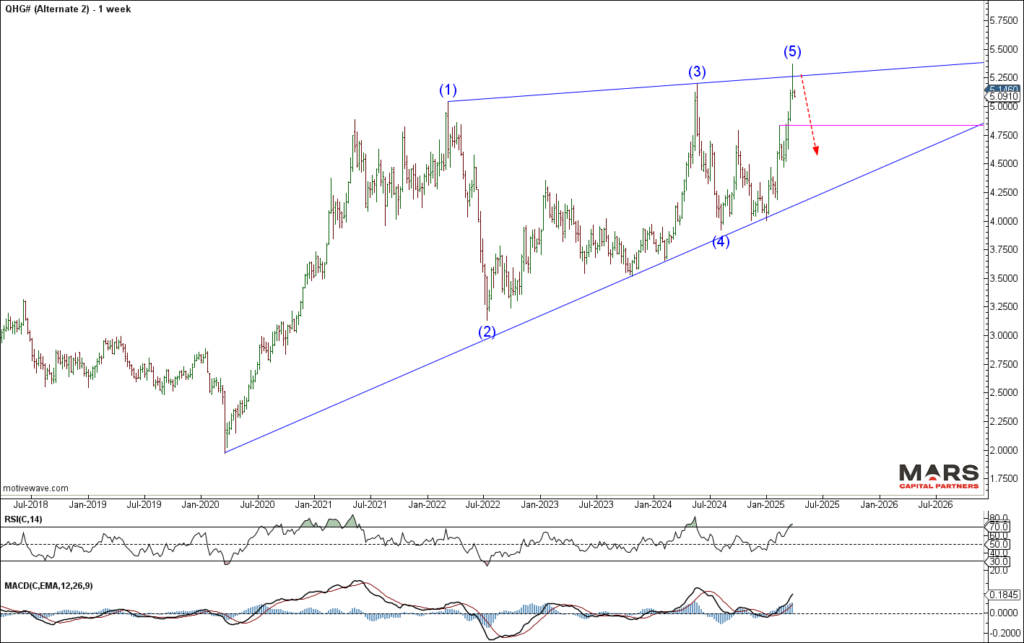
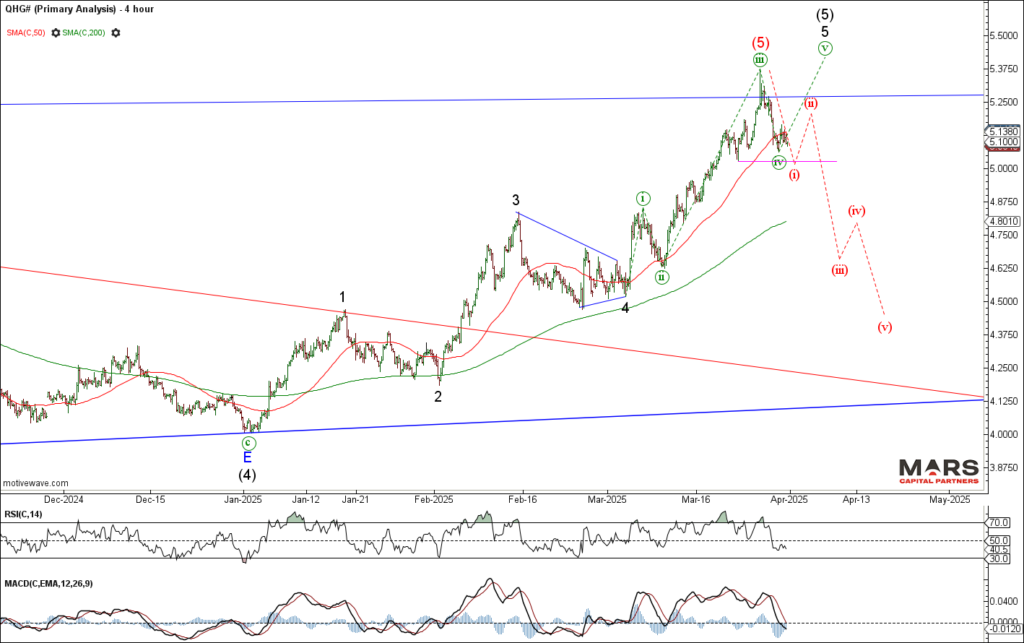
Dr Copper pushed to new ATH’s but reversed sharply lower as warned. Bears need to see downside follow through this week to help confirm a potential top. An impulsive decline that breaks overlap support in the 4.83 area would be the first indication of a potential change in trend. Trade above last week’s highs likely sees a 5th wave extension higher. Near term inflection.

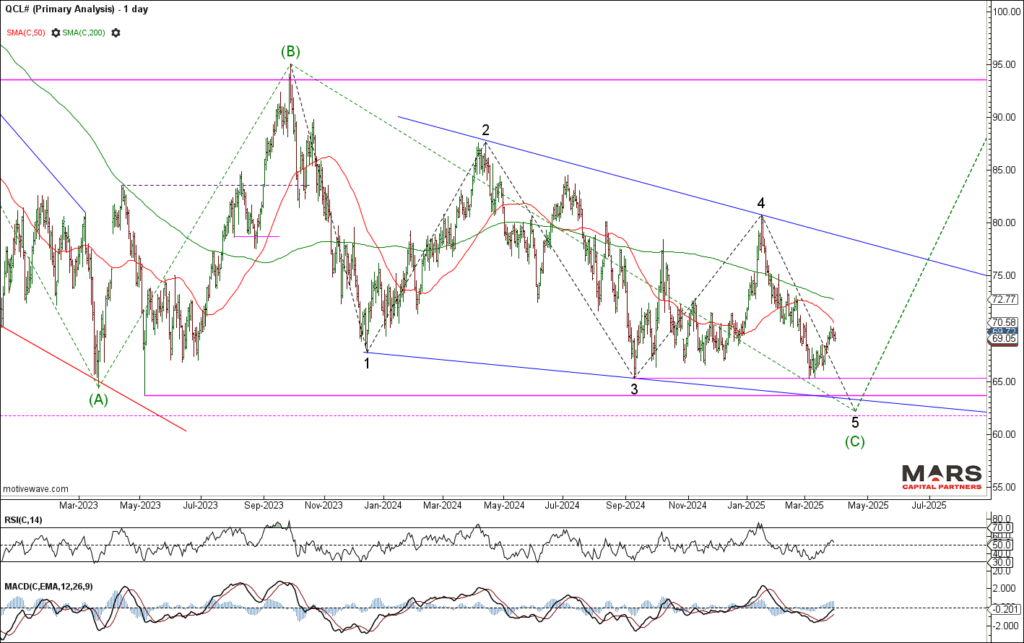
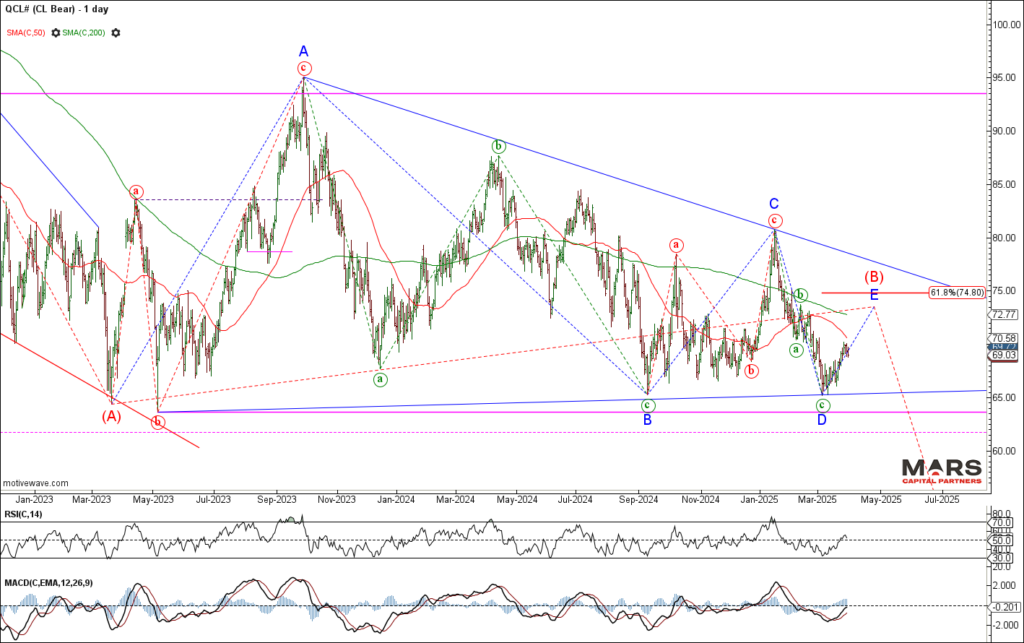
Crude Oil continues to hold shelf support but would still look best with a final push lower to potentially complete wave 5 of (C) down. The alternate continues to be a triangle wave (B) consolidation if bulls can break up from this support. Two-way risks remain with major support in the 62-64 area.

Crypto Markets – Counter-trend rally
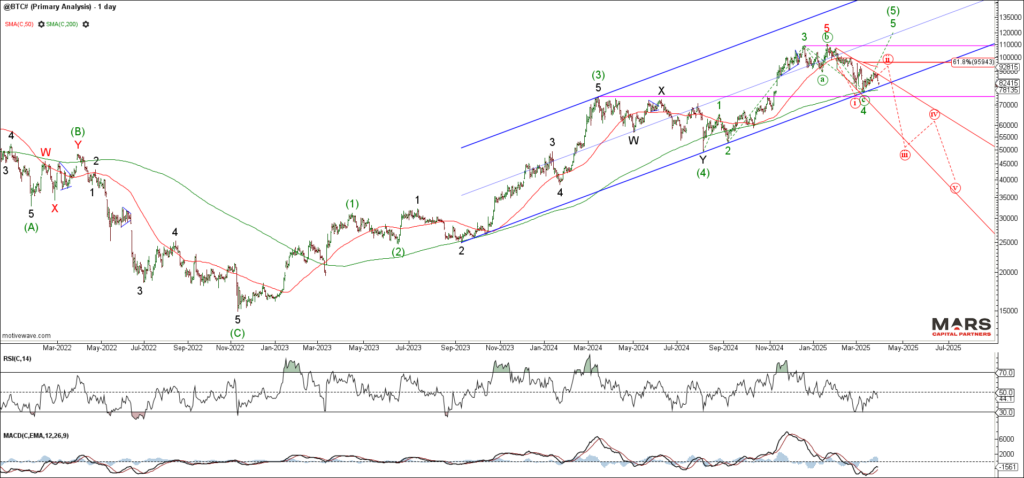
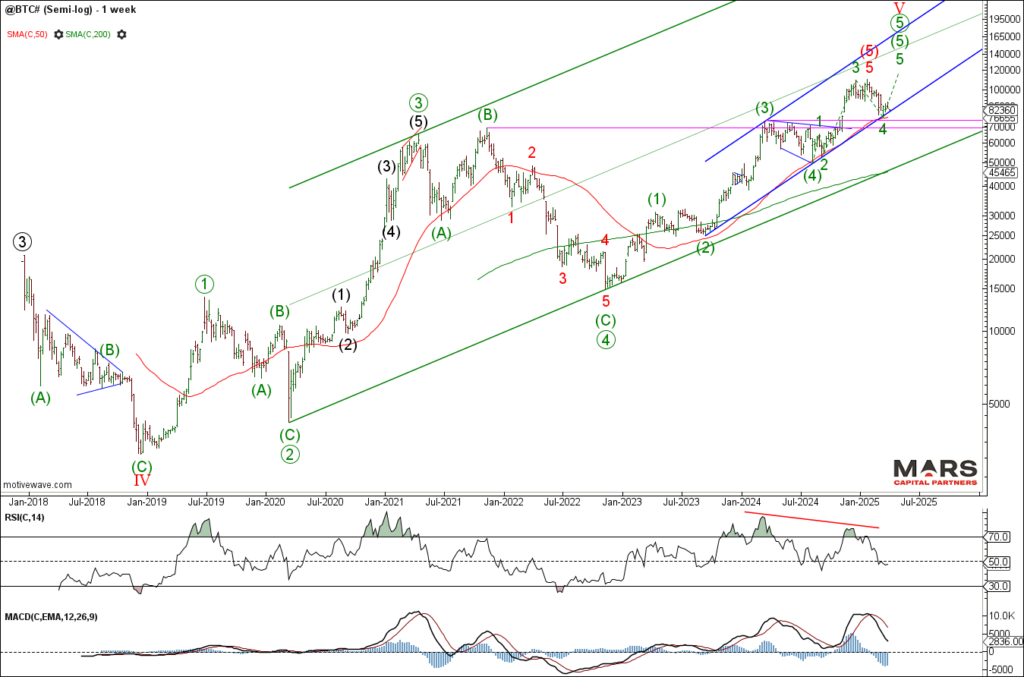
To the crypto markets and the Bitcoin rally appears corrective and reversed lower from near term trend resistance. A break back below 74400-75000 support opens the door to a much larger decline. Near term inflection as it remains trapped between near term support and resistance. The risk is that the long term rally is complete.
That’s all for now. Have a great week and trade safe 🙂

