
Last week’s market update highlighted the need for a final 5th wave to marginal new lows across the broad equity market indices. With downside targets met and enough waves in place for a completed structure we are now long against last week’s lows. What we need to see now is an impulsive rally from the lows. So far so good.
Now that we appear to have a completed pattern to the downside, the next big question is whether or not the correction is complete and we head to new ATH’s for a large degree 5th and FINAL wave “or” the cyclical equity market rally is already complete and this decline was the first wave of a larger bear market correction.
My job isn’t to make predictions, it IS to make money. My live tweets of an #ES_F wave (iii) low of 1807, then wave (iv) high of 1940 and wave (v) retest of 1800 all nailed key turns. There’s not much more I can do.
Last week’s lows are critical for the near term bull case. I will remain long while those lows hold and let this rally structure play out. If we see an impulsive rally and subsequent corrective decline, Mr Market will tell us whether we are still in a bull market or not.
Below I have highlighted the bull and bear cases for the #ES_F. My primary count across all markets presume the “lows are in” and we head to new ATH’s (blue count) in a risk-on environment. The key feature of the following charts is that we have 3 waves down from the highs contained within CORRECTIVE channels.
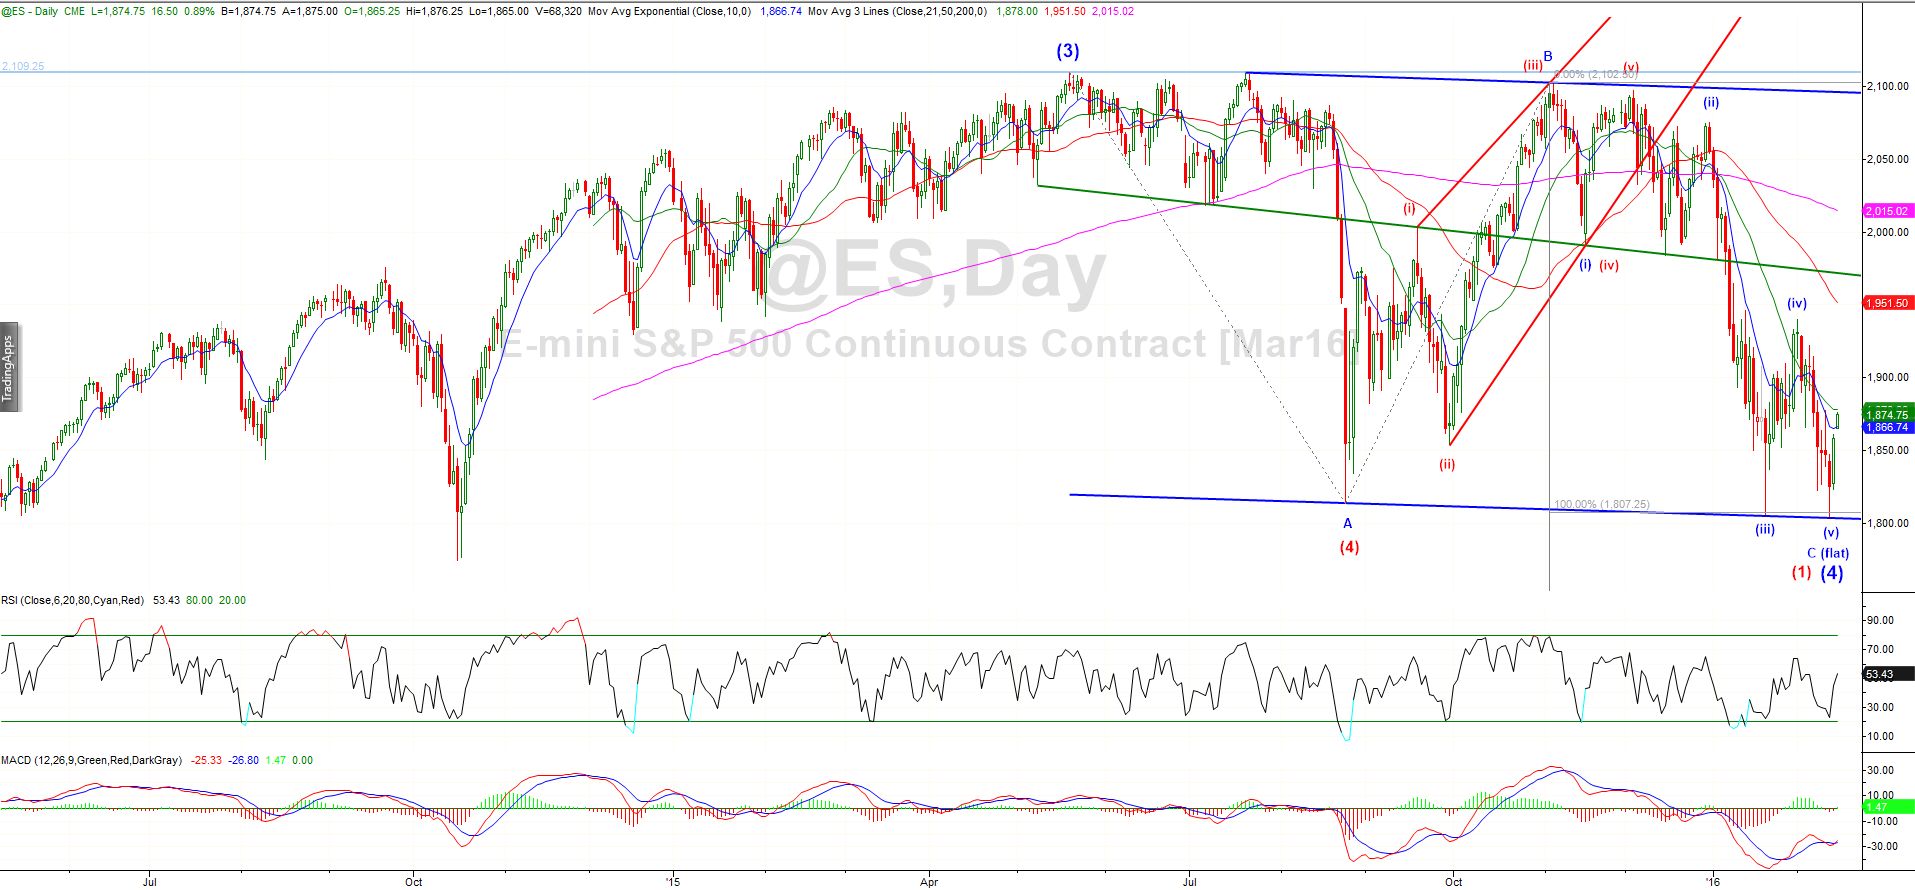
ES_F Daily
The following equity index charts all show the same structure of 3 intermediate waves down from the highs and are supportive of my bullish outlook…

DJIA Daily

TF_F Daily (Russell 2000)
While the DAX fell just short of my measured downside targets (8300-8600), the structure now has enough waves in place to be complete to the downside. So far the decline from ATH’s is in 3 clear waves contained within a corrective channel. Risk is not dead yet.
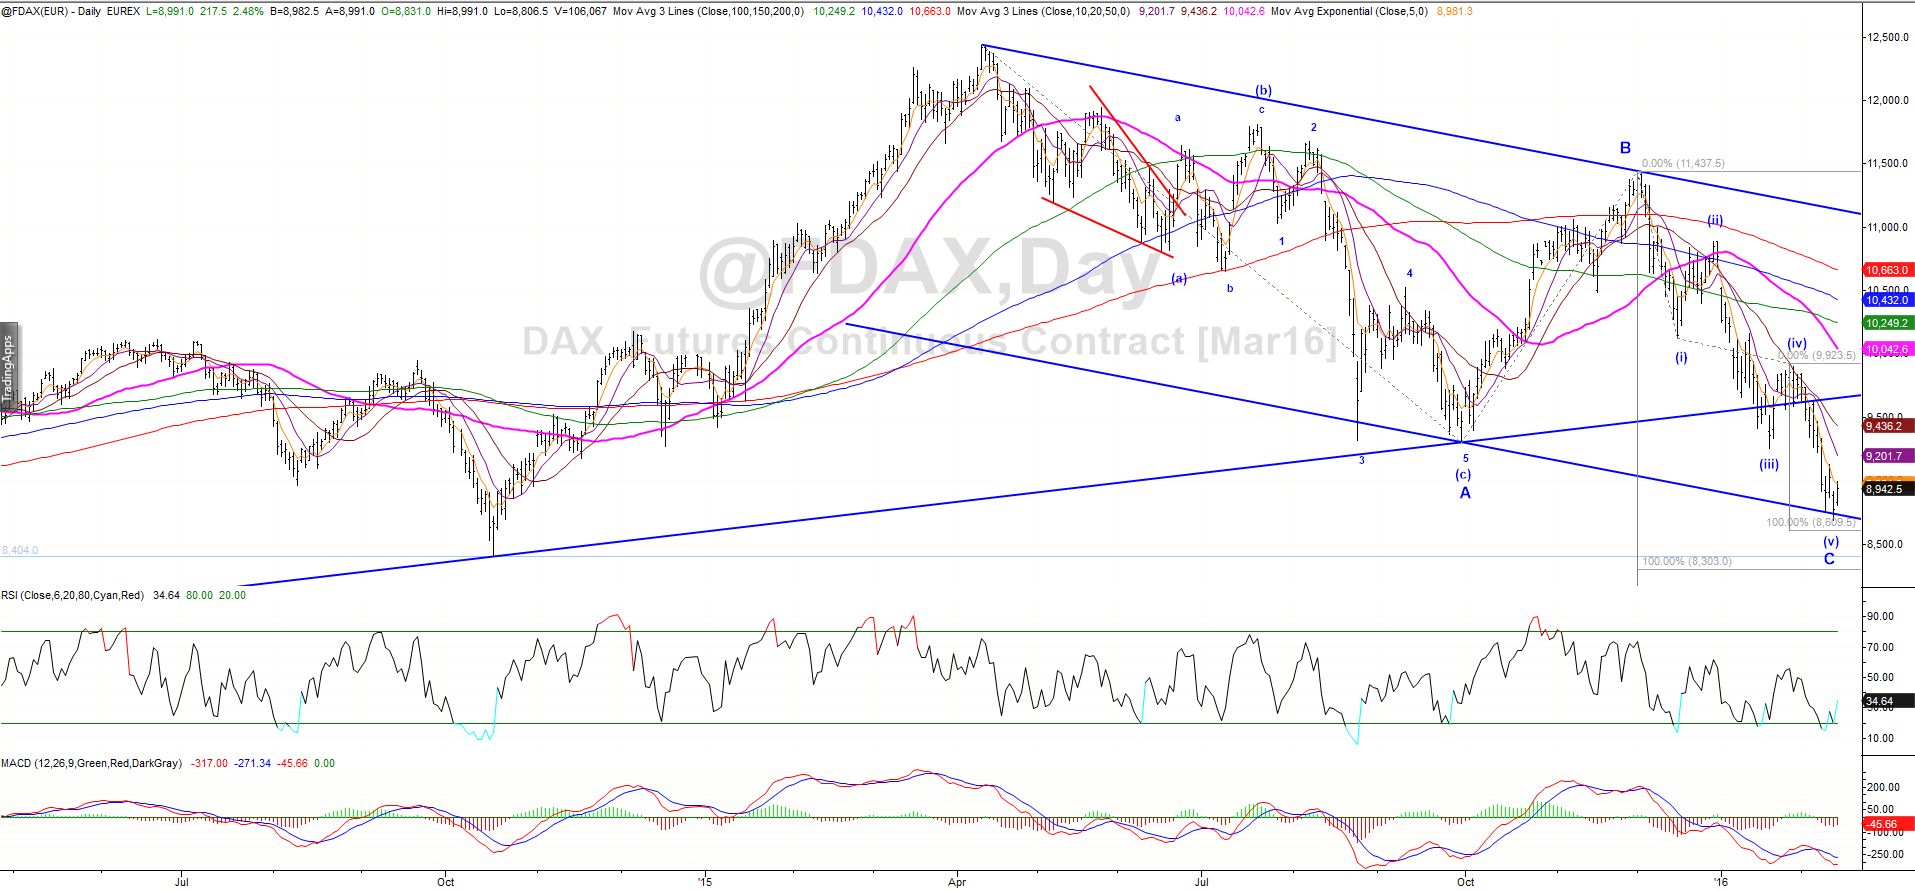
FDAX Daily
The following chart is more illustrative of the potential that the “top is in” bearish case with 5 waves complete into the highs and an impulsive decline. Specifically the #NDX / #NQ_F shows a clear 5 waves down from the cycle highs. This is the chart that concerns me most about the potential for a significant decline after a wave (2) bounce higher towards 4300-4400 (previous 4th wave and Fib retracement). Either way, we should continue to expect higher prices in the near term.
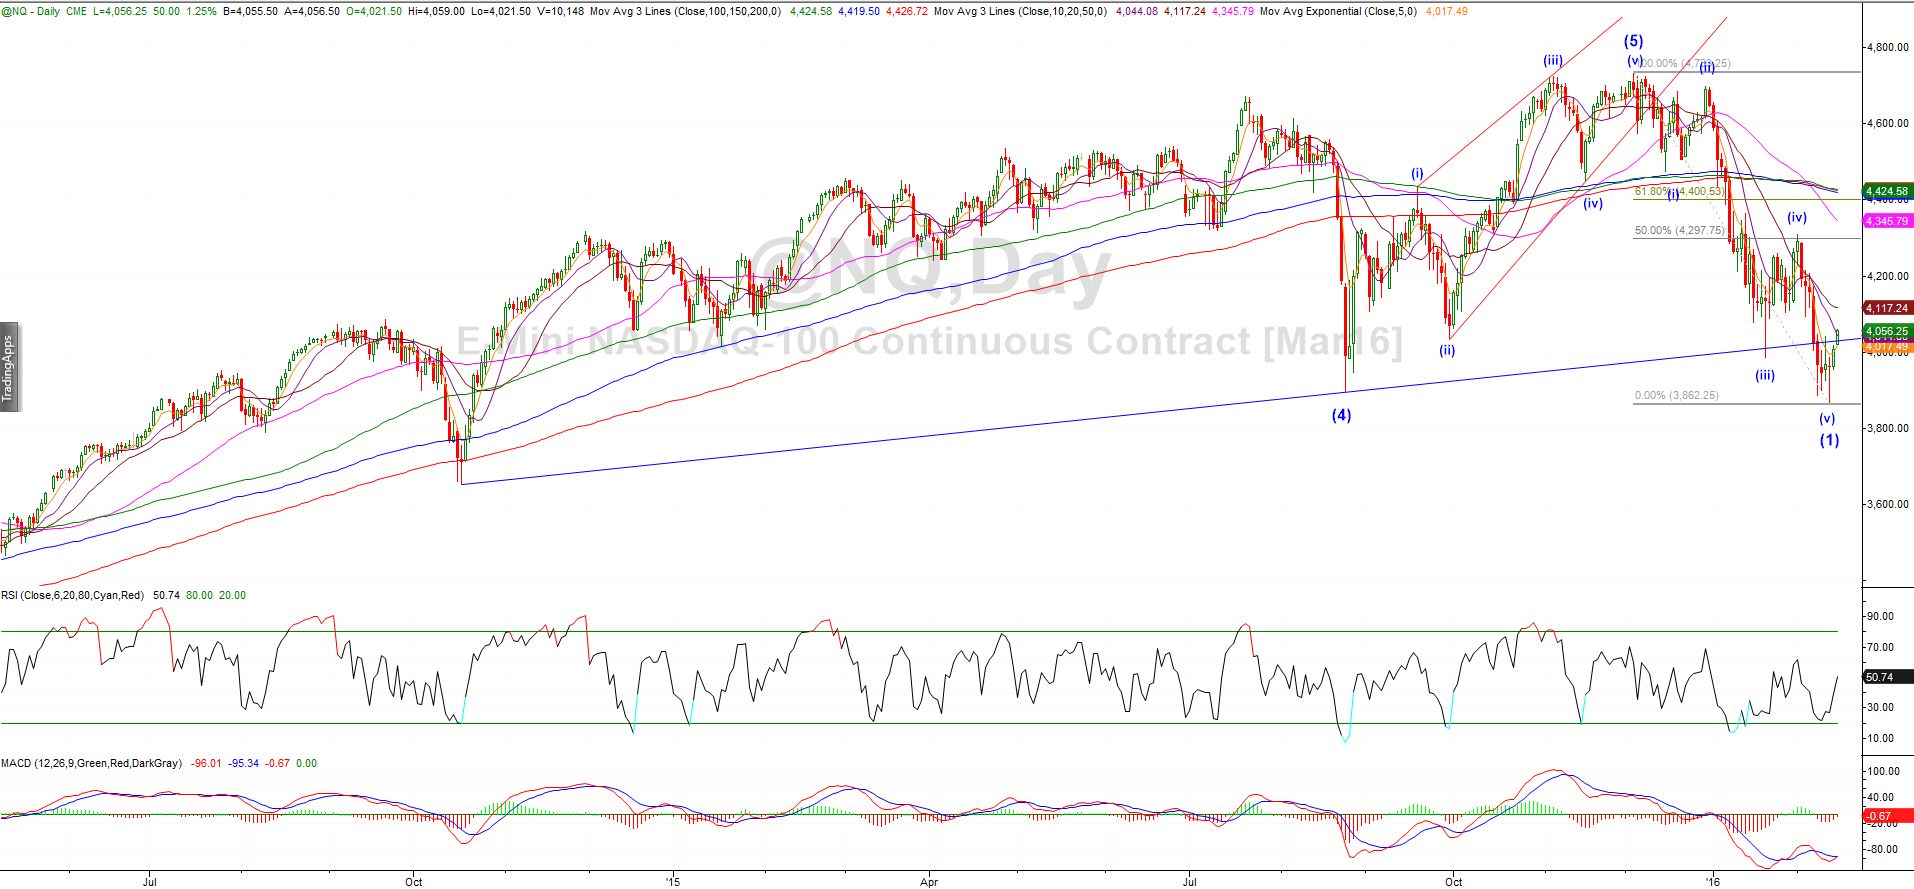
NQ_F Daily
The heavy net-short positioning of #ES_F traders in the COT report also provides further fuel for a strong short covering squeeze at a minimum…

The US30 yr Treasury spiked higher above 170 before reversing hard with a daily shooting star. Remember this is an Ending wave! Shorts are strongly now favored here in line with my risk-on thesis.

#ZB_F Daily
To the FX markets and the biggest mover was the Yen with some wild post-BOJ swings which triggered the H&S I spoke of last week. The bullish equities case requires the USDJPY to rally from here. I have updated my count with an expanded diagonal (very rare) wave C of (4) for the bullish case which falls short of the H&S downside targets. This count requires the USDJPY to recapture and close above the H&S neckline at 116. Should the 116 resistance hold the market to the upside and new lows are subsequently made, I would have to concede that the H&S is indeed in force putting more pressure on risk assets.
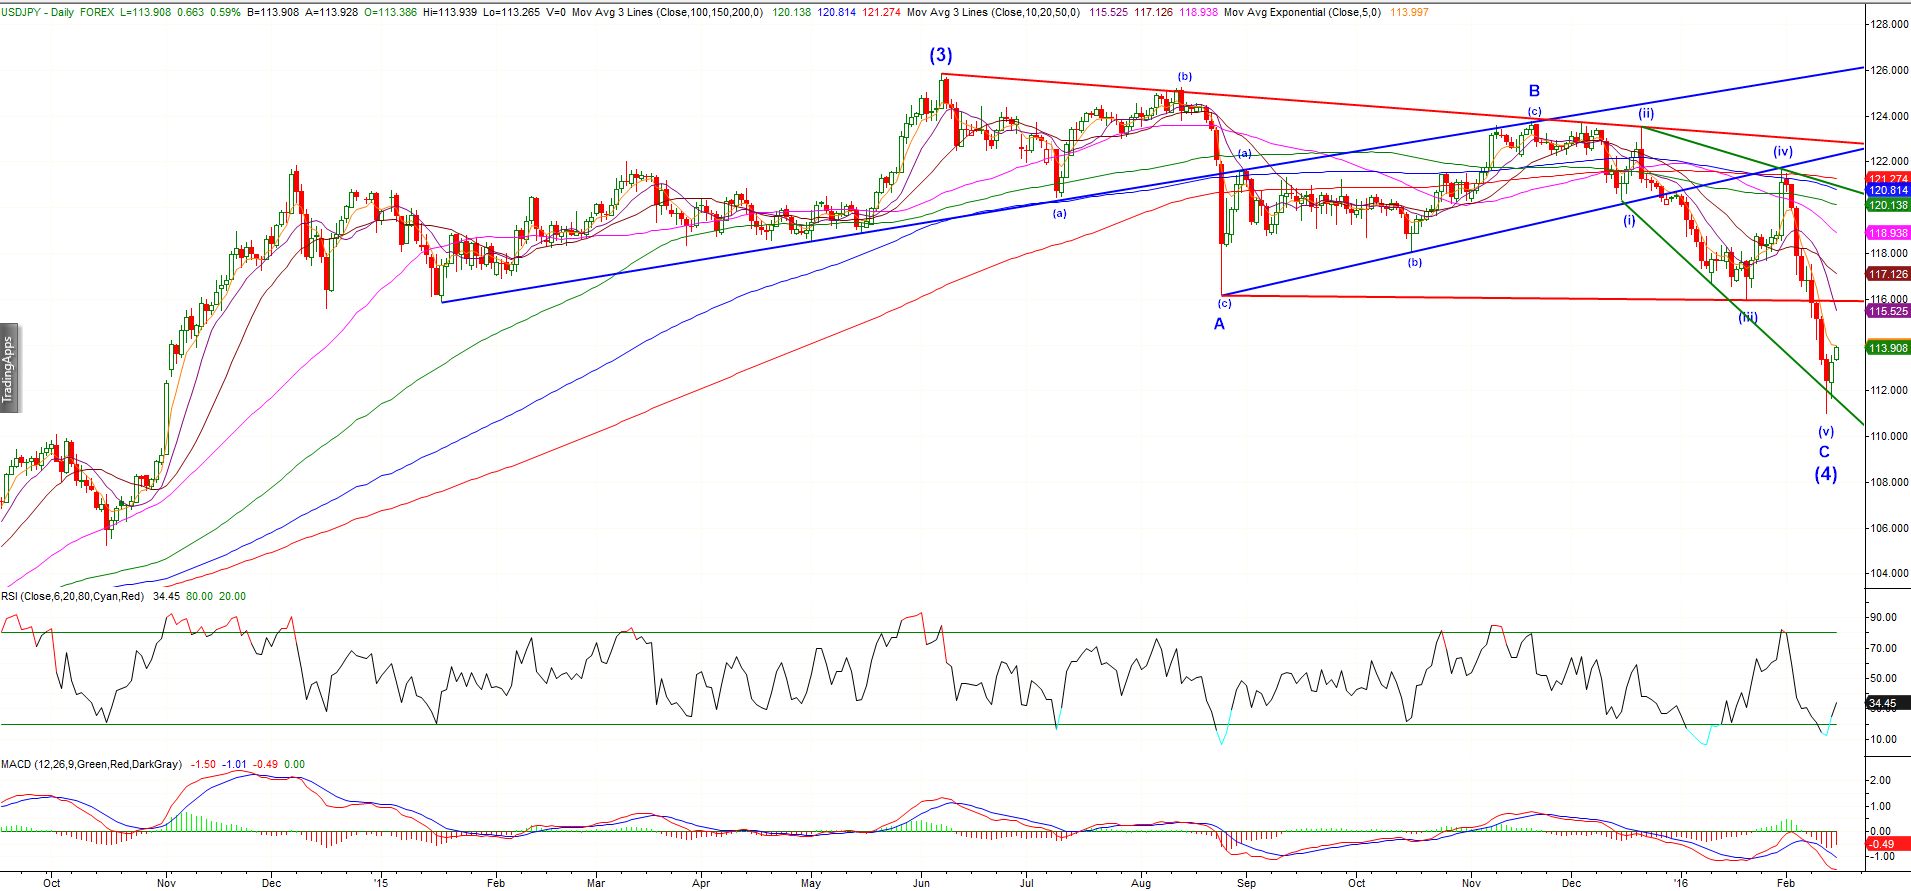
USDJPY Daily
The Euro found strong resistance on the backtest of the red trendline as suggested last week. I remain bearish the Euro but the pattern is tricky so my conviction is low at this point.
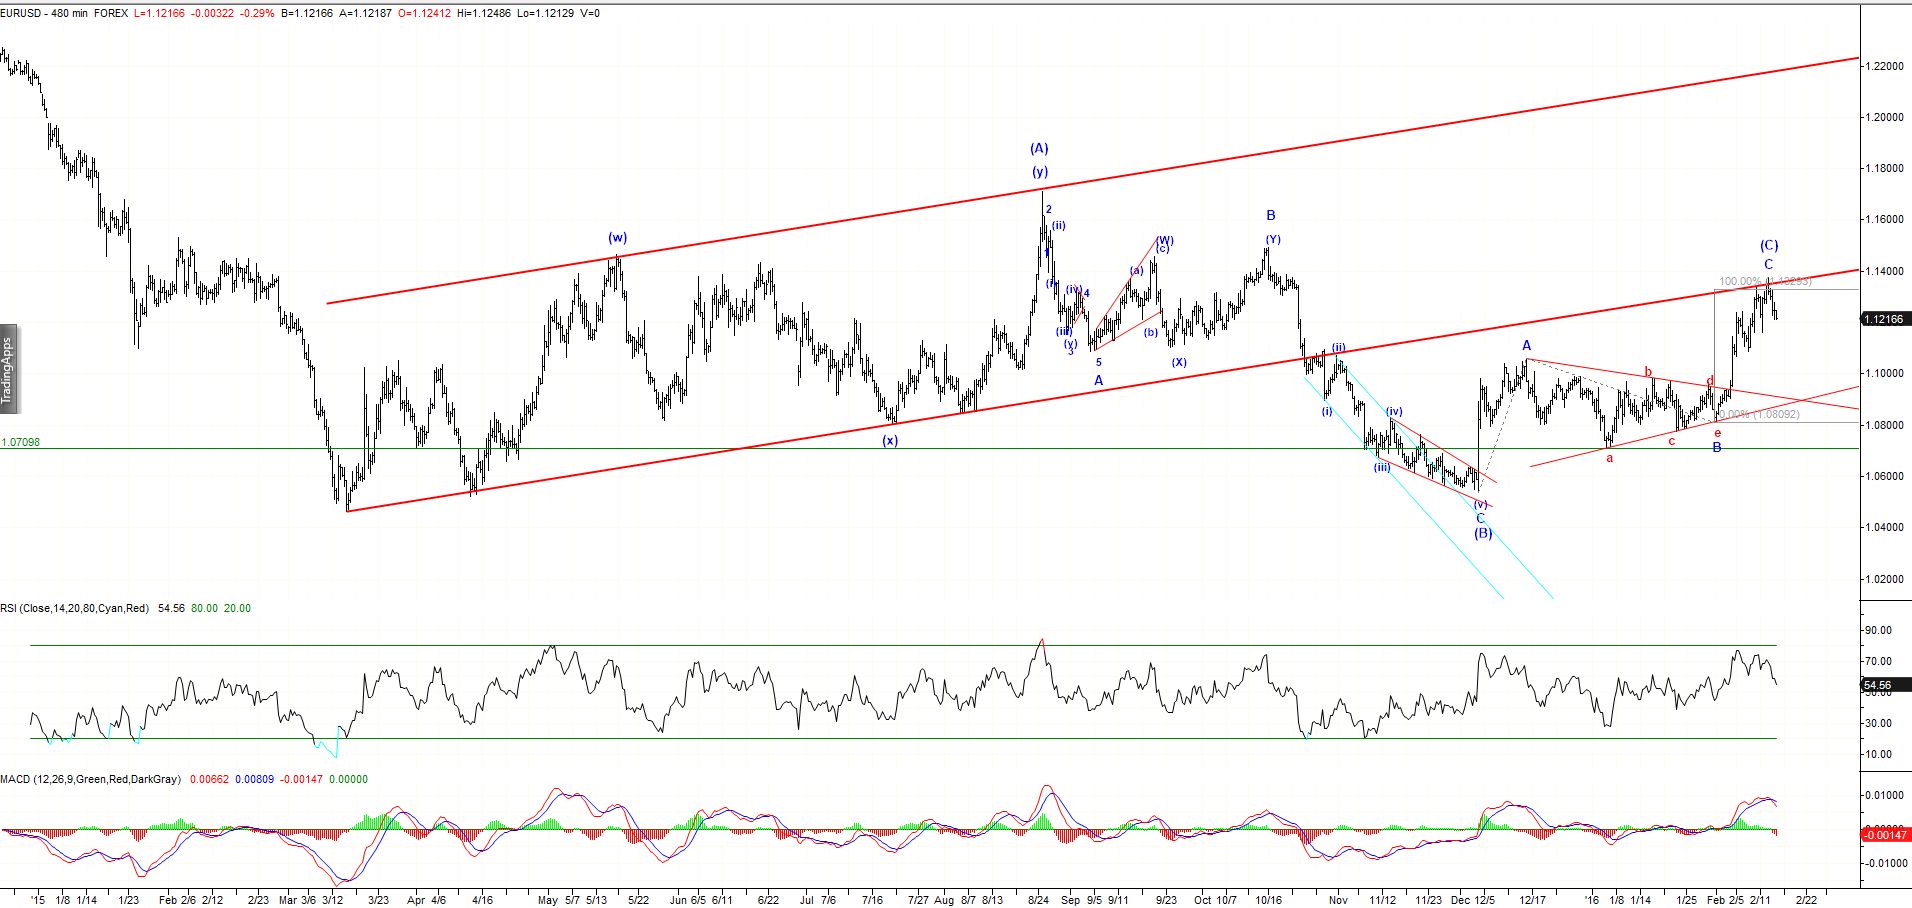
EURUSD 8hr
The commodity chart of note is #CL_F. My downside target of $26.00 was achieved last week (LOD $26.05). While I’m not a big fan of the 3 wave structure into the lows, we must respect the fact that downside targets have been reached and Crude has been declining for a LONG time. A close back above $30 would certainly help the bullish case and align with equities. I am bullish #CL_F especially if we can make a marginal new low not confirmed by equities.
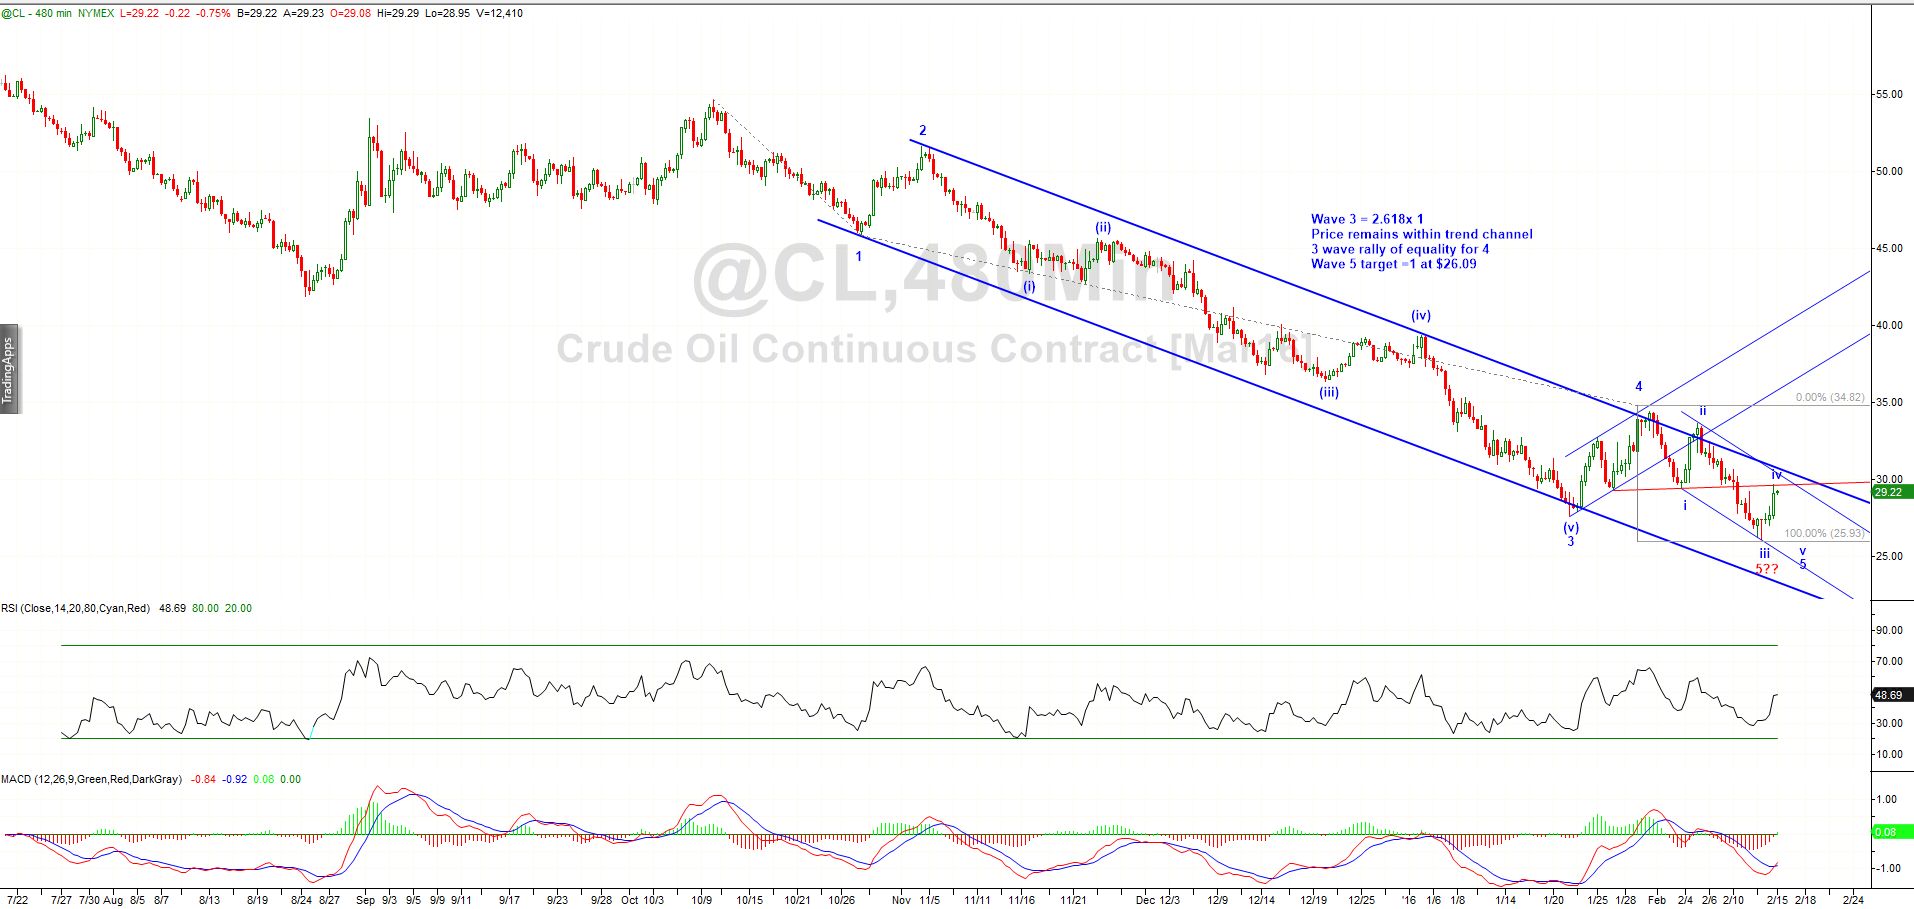
CL_F 8hr
Gold has rallied straight to Fib 23.6% resistance in a large short covering rally. We should expect some pullback here while traders digest the near term risk-on environment.
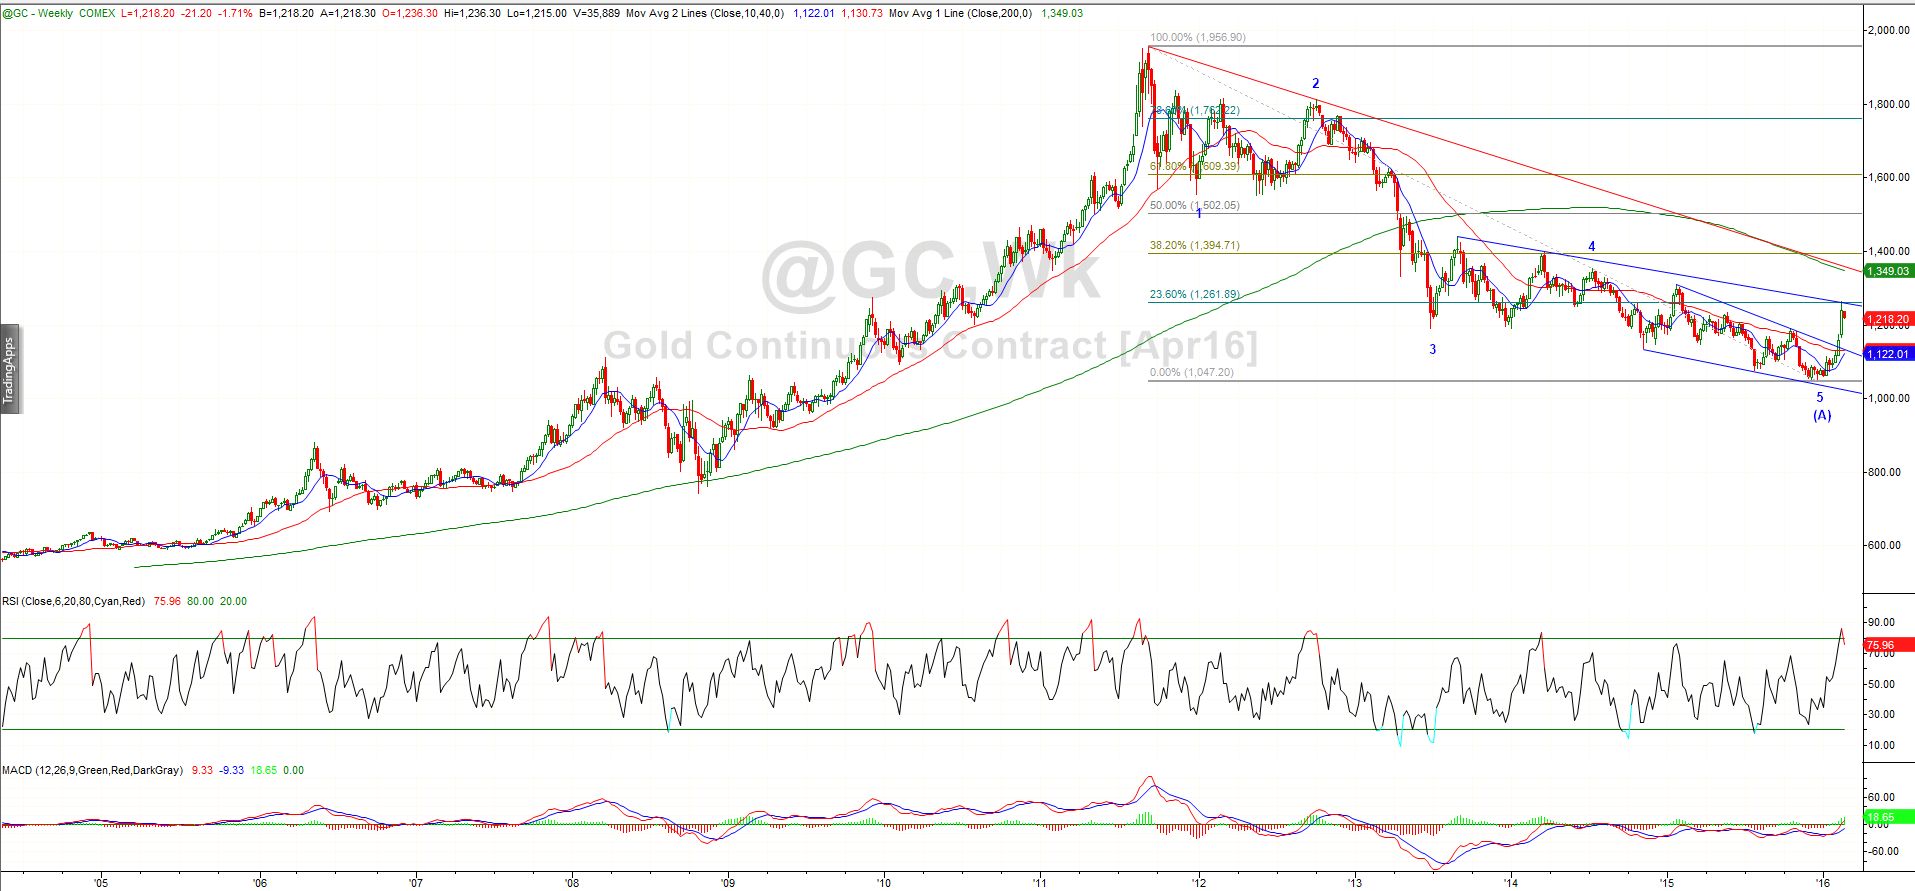
Gold Weekly
The recent Gold COT report highlights the short squeeze in real time.

That’s all for now folks 🙂
