Dear Traders,
After 3 years of publishing my research in the public domain for free, I have decided to move my work behind a paywall. I would like to thank everyone that has followed and supported me over the years. My new website should be up and running within the next 2 weeks…
- The MCP Market Update will now only be available via subscription
- A Private Twitter feed has been established for subscribers
- The format and timing of my updates will remain the same
- My website domain will remain marscapitalpartners.com
- I will not be spamming or spruiking to my followers on @Trader_Mars
I hope you will join my subscriber community as we navigate these markets in the future. If not, then thank you for all your support as it has been greatly appreciated. This will be my final public MCP Market Update.
Yours sincerely,
Dario Mofardin
To the Market Update…
A number of commodity and FX markets are coiled within triangles (like TLT was) and set for fast moves.
Suppressed volatility inevitably leads to expanded volatility and that’s what we saw last Friday. Importantly, we were on the right side of the trade as clearly outlined last week. Forewarned is forearmed 😉
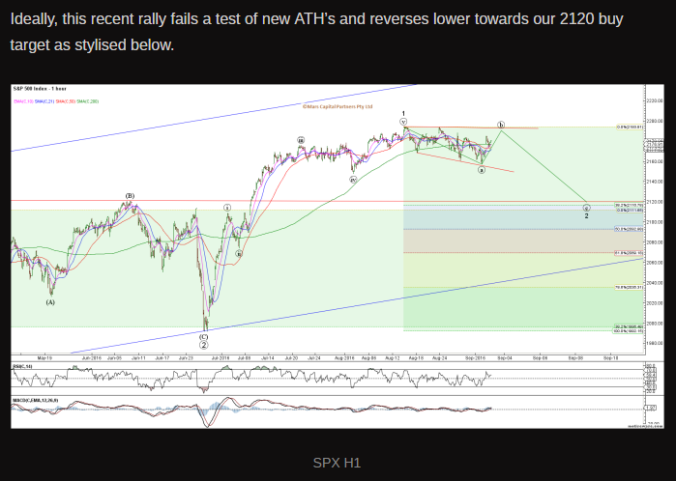
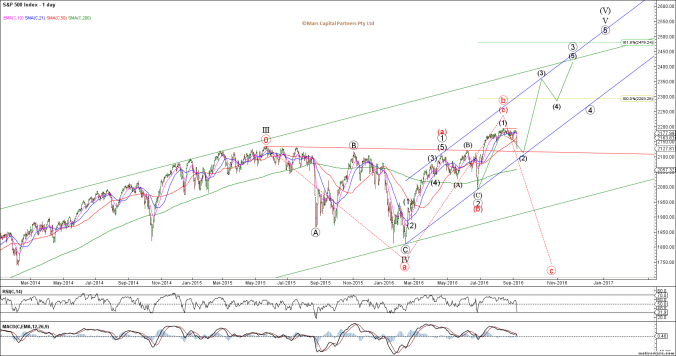
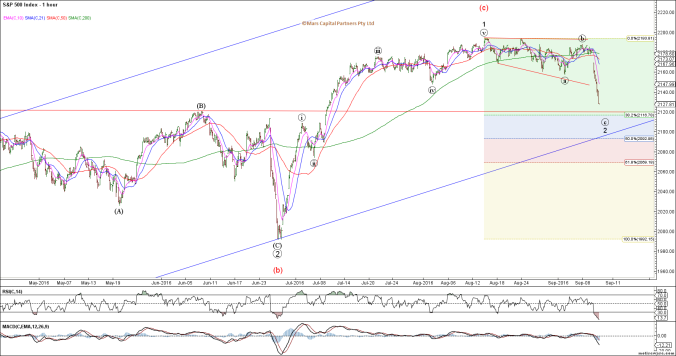
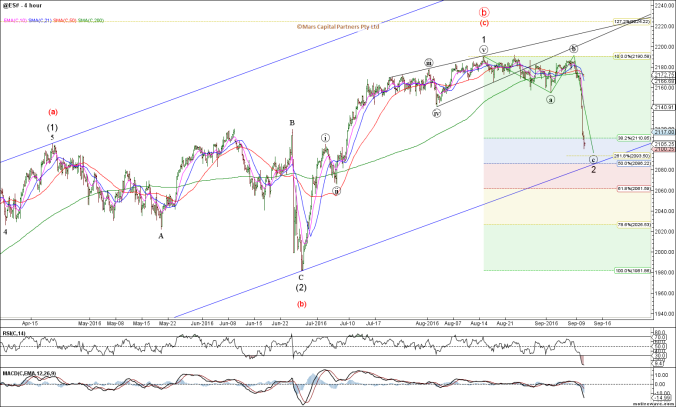
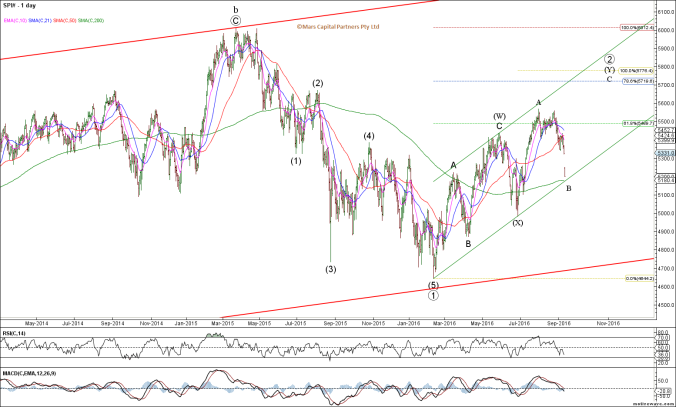
The ES is now 80 pts lower than where it was a couple of days ago. Now that our initial downside target of 2120 has been met, the question now is whether this decline was all of wave (c) down of 2 and a strong rally is about to kick-off or is the red bearish alternate count raising its head? The bulls need to stand up now! The bear case that I highlighted in my August 15th update could lead to a strong decline back below 1800. We are at a critical juncture here…
From a near term perspective, support for the SPX comes in at 2116-20 and then 2092-2100. Below that and the wheels may fall off. Ideally, the market gaps down on Monday and reverses higher impulsively to hammer out a low.
The ES has already seen some Sunday night follow-through selling below the 0.382 retracement and likely now targets 2086-93
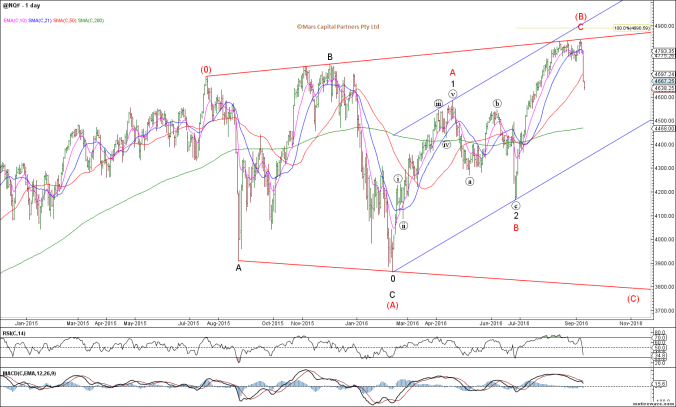
What concerns me about the bull case are the number of broadening formation top failures in other indices like the NDX / NQ – Last week’s high is now critical resistance for the bears.
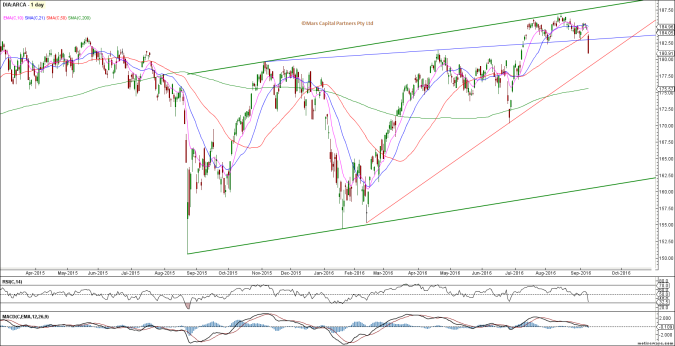
This DIA chart I posted some time back was illustrative of my “topping” concerns for the near term bull case and highlighted the green trend channel rejection and gap below the 50 day sma and small blue H&S break on Friday.
The SPI (ASX200) is fast approaching its 200 day sma and green channel support – Bulls need to stand up here.
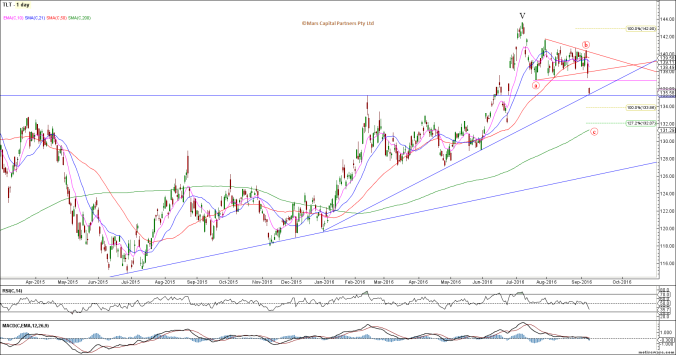
We have been bearish the bond markets since the end of July and yields “finally” spiked higher across the board late last week. Unfortunately, the structure of the market made it difficult for me to really participate (but at least we weren’t long bonds). The TLT broke out and down from its triangle and closed at near term trend support. Remain bearish until proven otherwise.
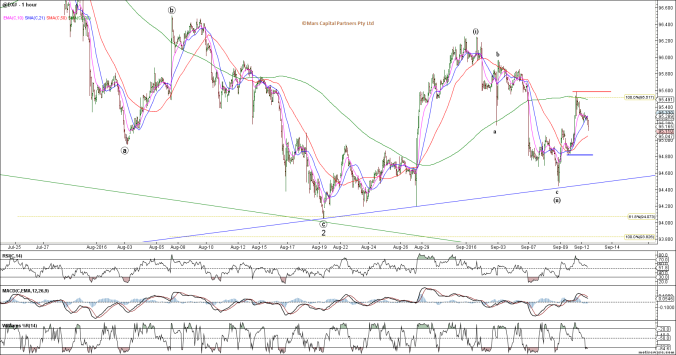
To the FX markets and the US$ has only rallied in 3 waves of equality from the lows, calling into question our near term bullish thesis. There is now risk of a breakdown back towards 94.00 on trade below 94.80 – Trade back above 95.60 would be bullish. I am neutral here. I have drawn the red and blue lines in the sand on the chart below.
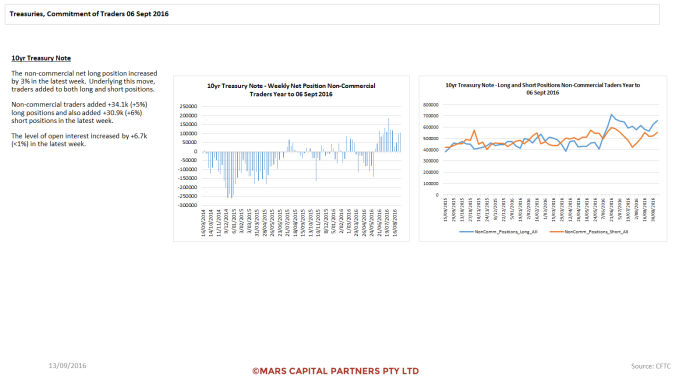
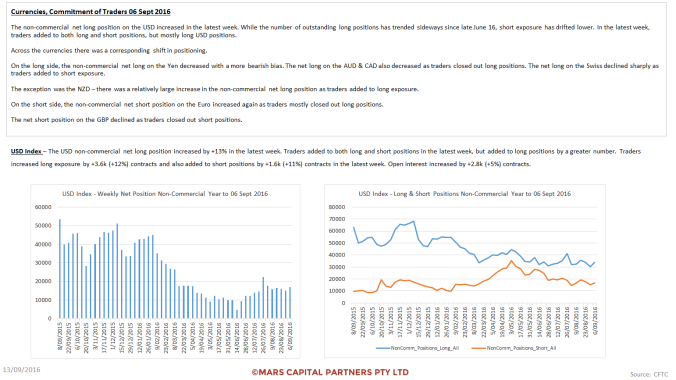
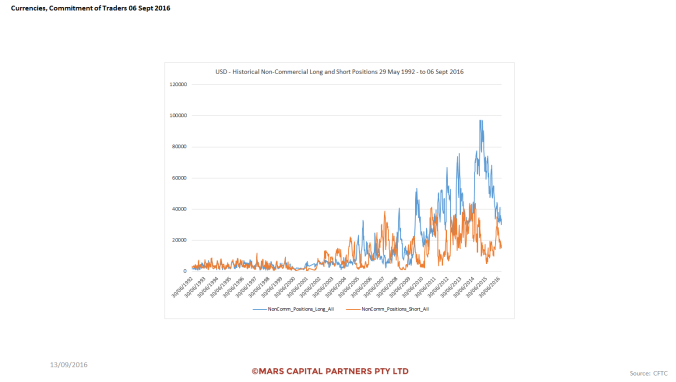
The calm before the storm as open interest plunges…
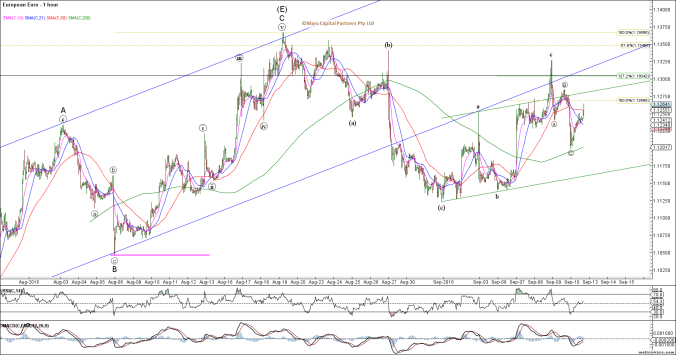
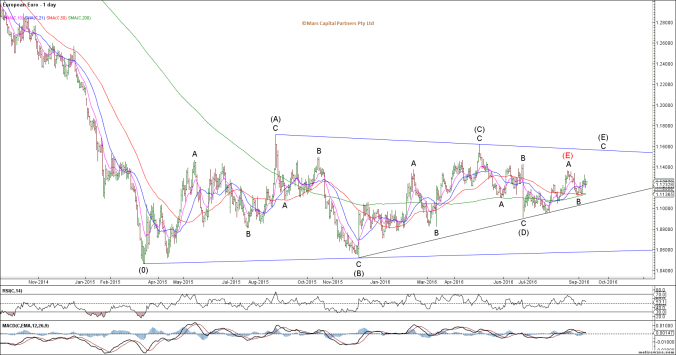
The equivalent 3 wave (corrective) structures can be seen on the Euro chart below.
Trade immediately back above 1.1285 opens the door towards 1.150 as the triangle expands. Critical juncture here…
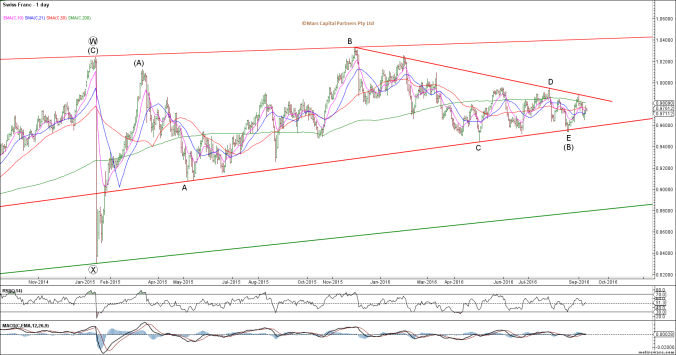
The USDCHF continues to compress within its triangle – Compressed volatility leads to expanded volatility. I am now less confidant on which way it will break so I will likely go with the break and not pre-empt.
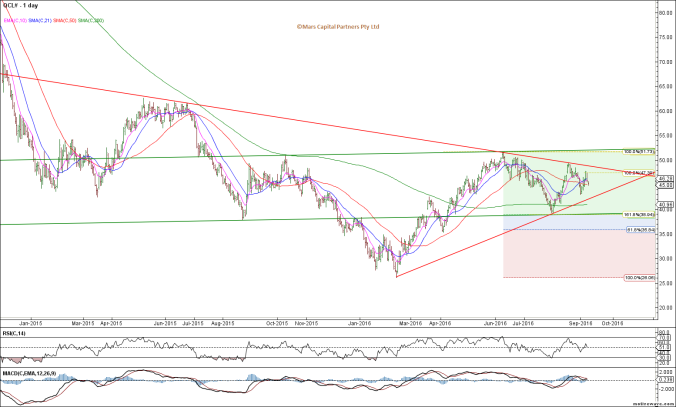
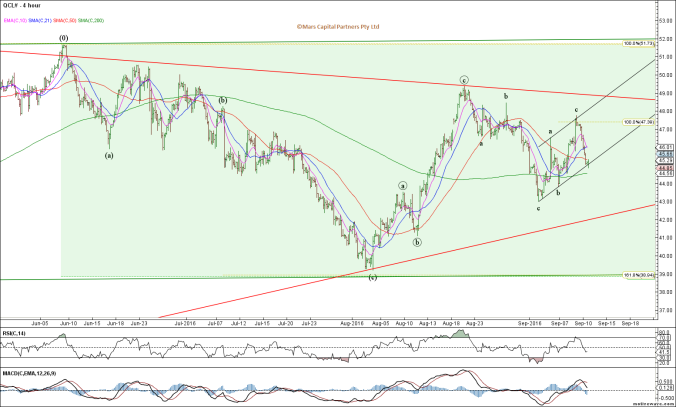
To the commodity markets and they have been sold off despite a neutral US$. The constant 3 wave structures in Crude Oil suggest we are in the middle of a corrective movement which is likely another triangle (more compression). I still think it breaks down but I will not pre-empt here .
The internal corrective structure can best be seen on the H4 chart below – 3 waves up and down repeatedly (all corrective).
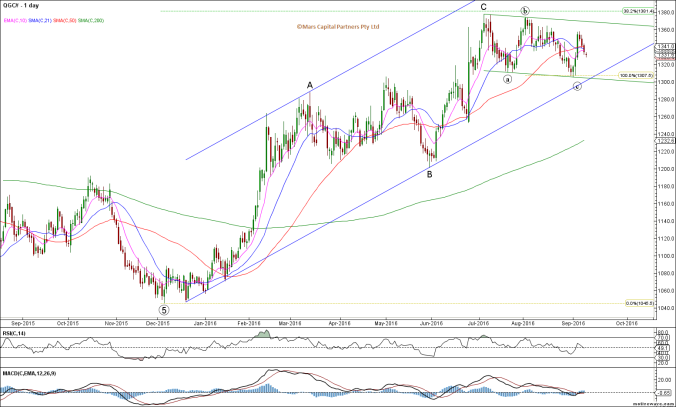
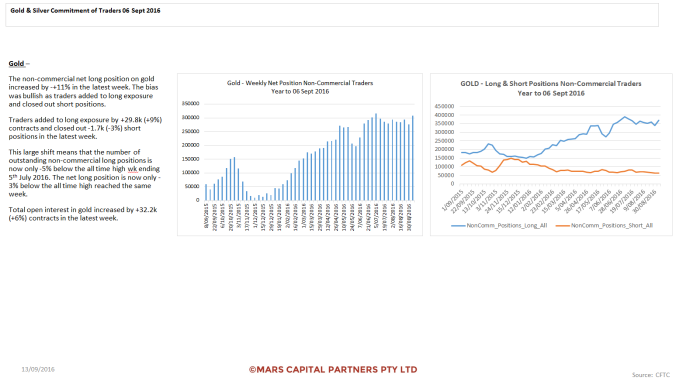
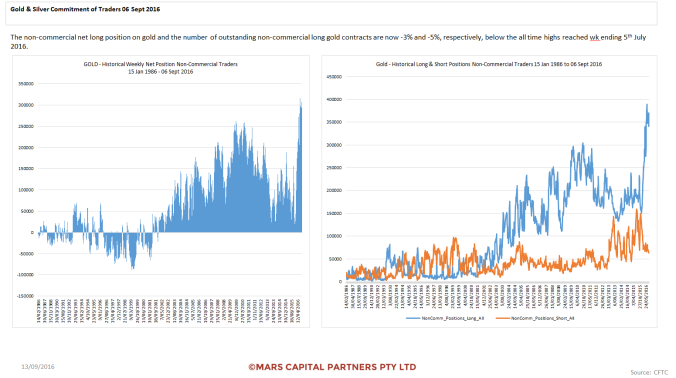
The decline in Gold was in 3 corrective waves and will continue to look more bullish while 1305 holds to the downside (low conviction given how over-owned it is).
Excessive optimism continues in the precious metals complex. Everyone is on the same side of the boat…
That’s all for now folks. Have a great week 🙂

