
Elliott Wave Triangles usually occur in 4th waves. They occur when a market has rallied too far too fast and the market needs to correct time and price in a primary trend. The exponential SPX rally from August 2017 through to end January highlighted below is a perfect example of this structure. At this point we should explore more bearish potential structures in case we lose the February lows. It is concerning that good earnings are not being rewarded by the market – they are more often than not being sold and the 50 day sma continues to cap attempted rallies. The first step for the bulls is to reclaim the 50 day sma and push through higher levels of resistance highlighted in the charts below.
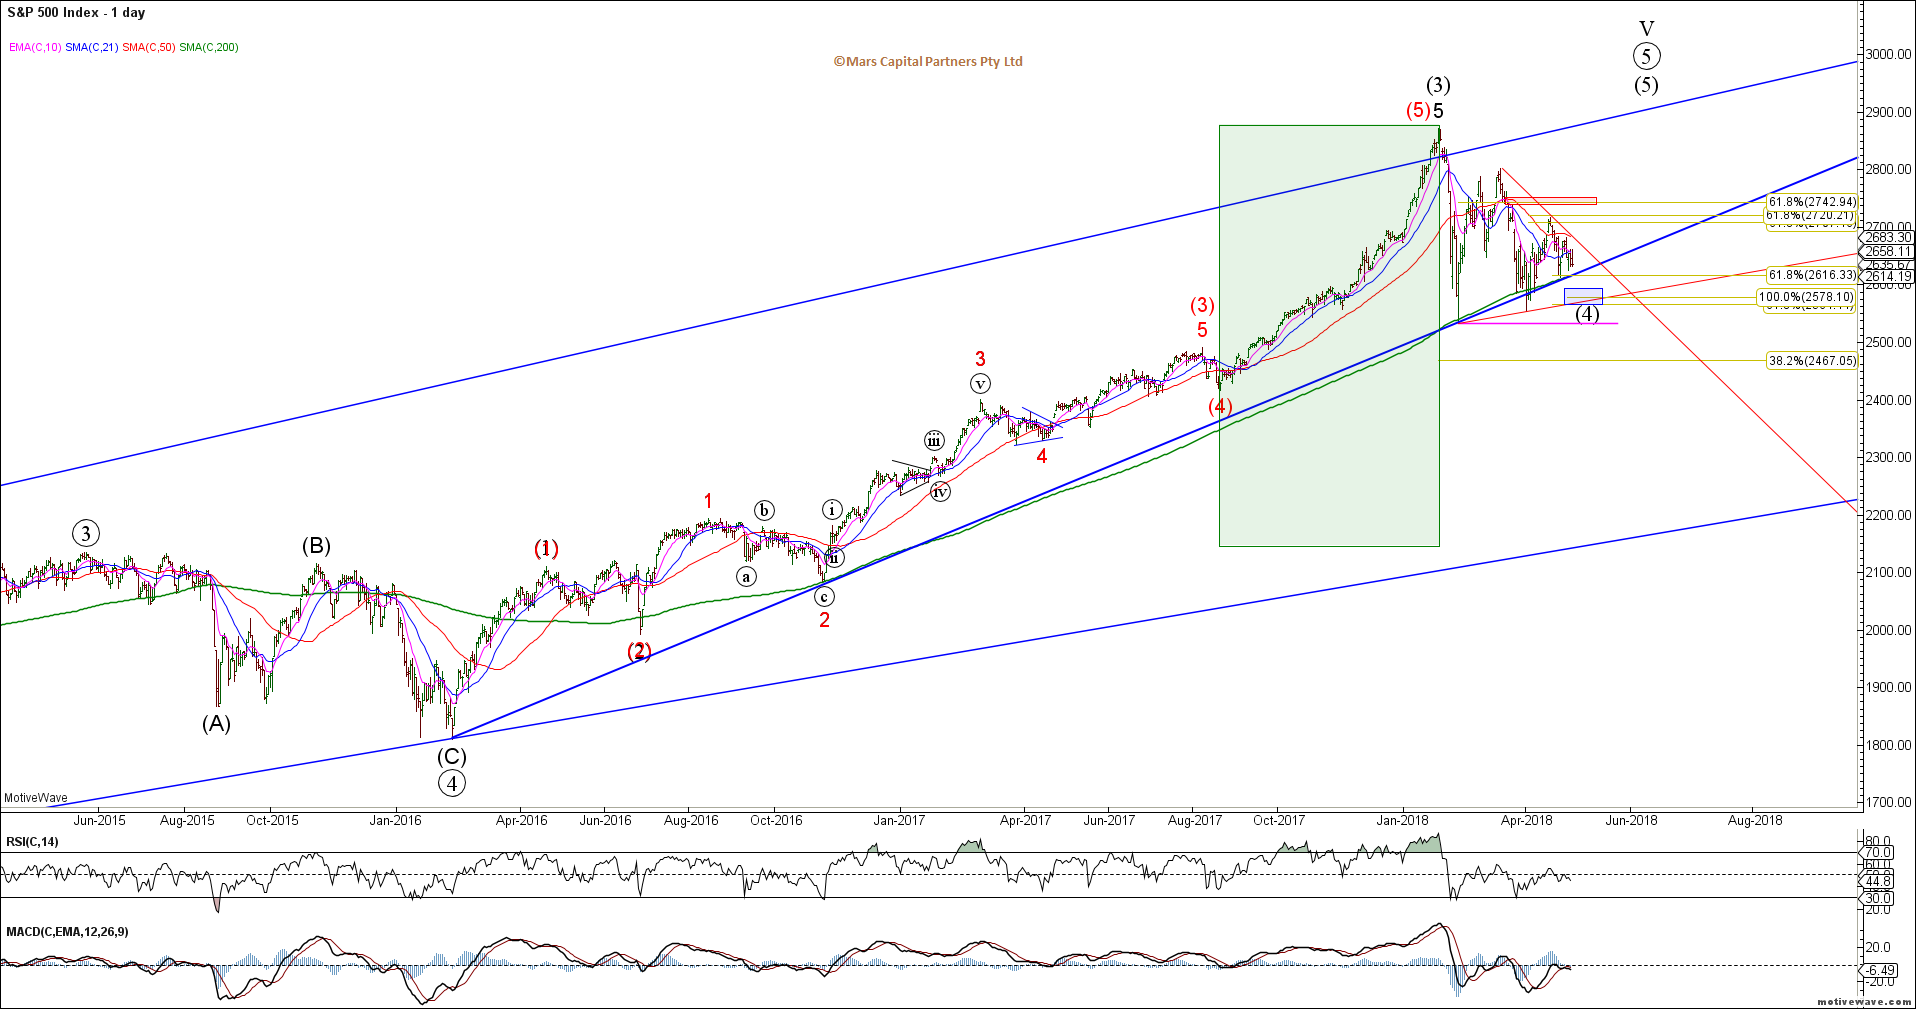
SPX Daily
While the SPX has met the minimum conditions for a complete Triangle where wave E terminated at last week’s lows, the recent price action opens the door for lower targets in the 2565-85 area and hard test of the April lows. This potential is highlighted by the green count. This will be make or break for the bullish triangle! Trade below the April lows weakens the structure and trade below the February lows opens the door to MUCH lower prices.
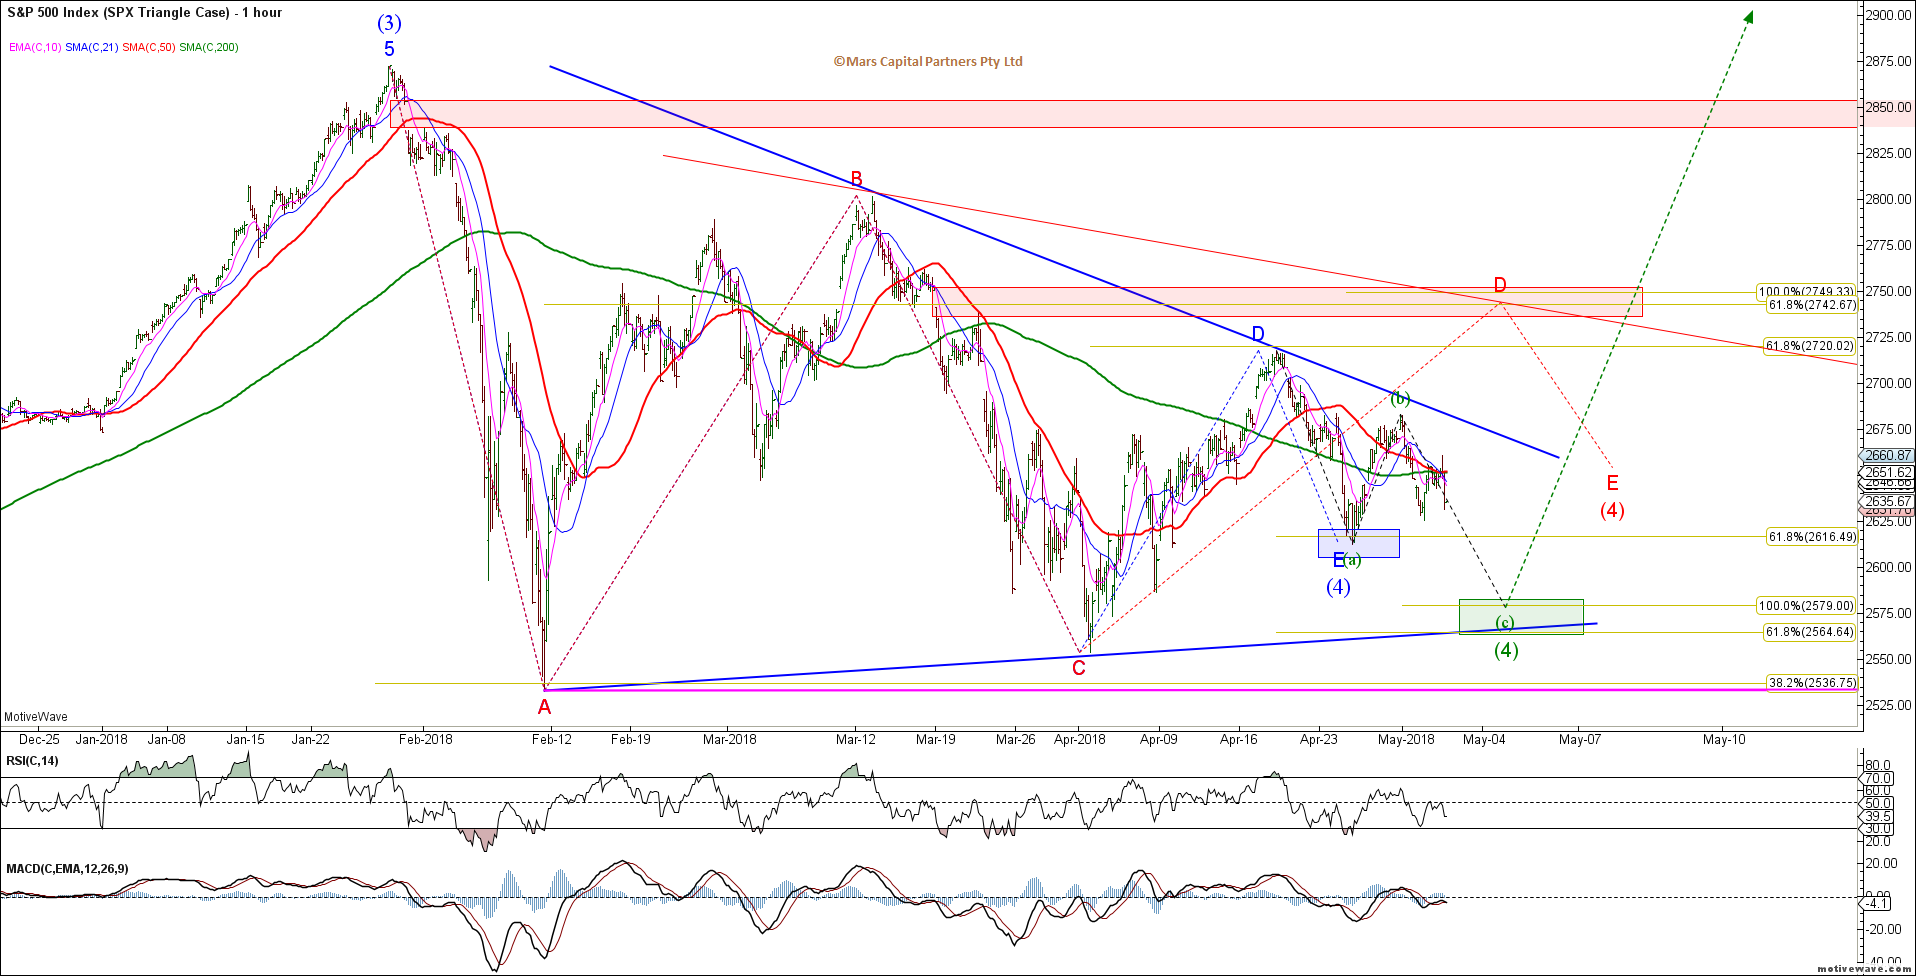
SPX H1 Bullish Triangle
The other place you are likely to see a Triangle is in wave B of a correction (A-B-C). Trade below the February lows will likely trigger this extended decline and intermediate bearish pattern. Given the nature of Triangles, that is, the ability to whipsaw within the larger wave A range, there is NO certainty that wave B has ended. It could always become more complex / expanded if it finds support in the 2565-85 area – Triangles can be difficult to trade outside of bigger picture support / resistance levels.
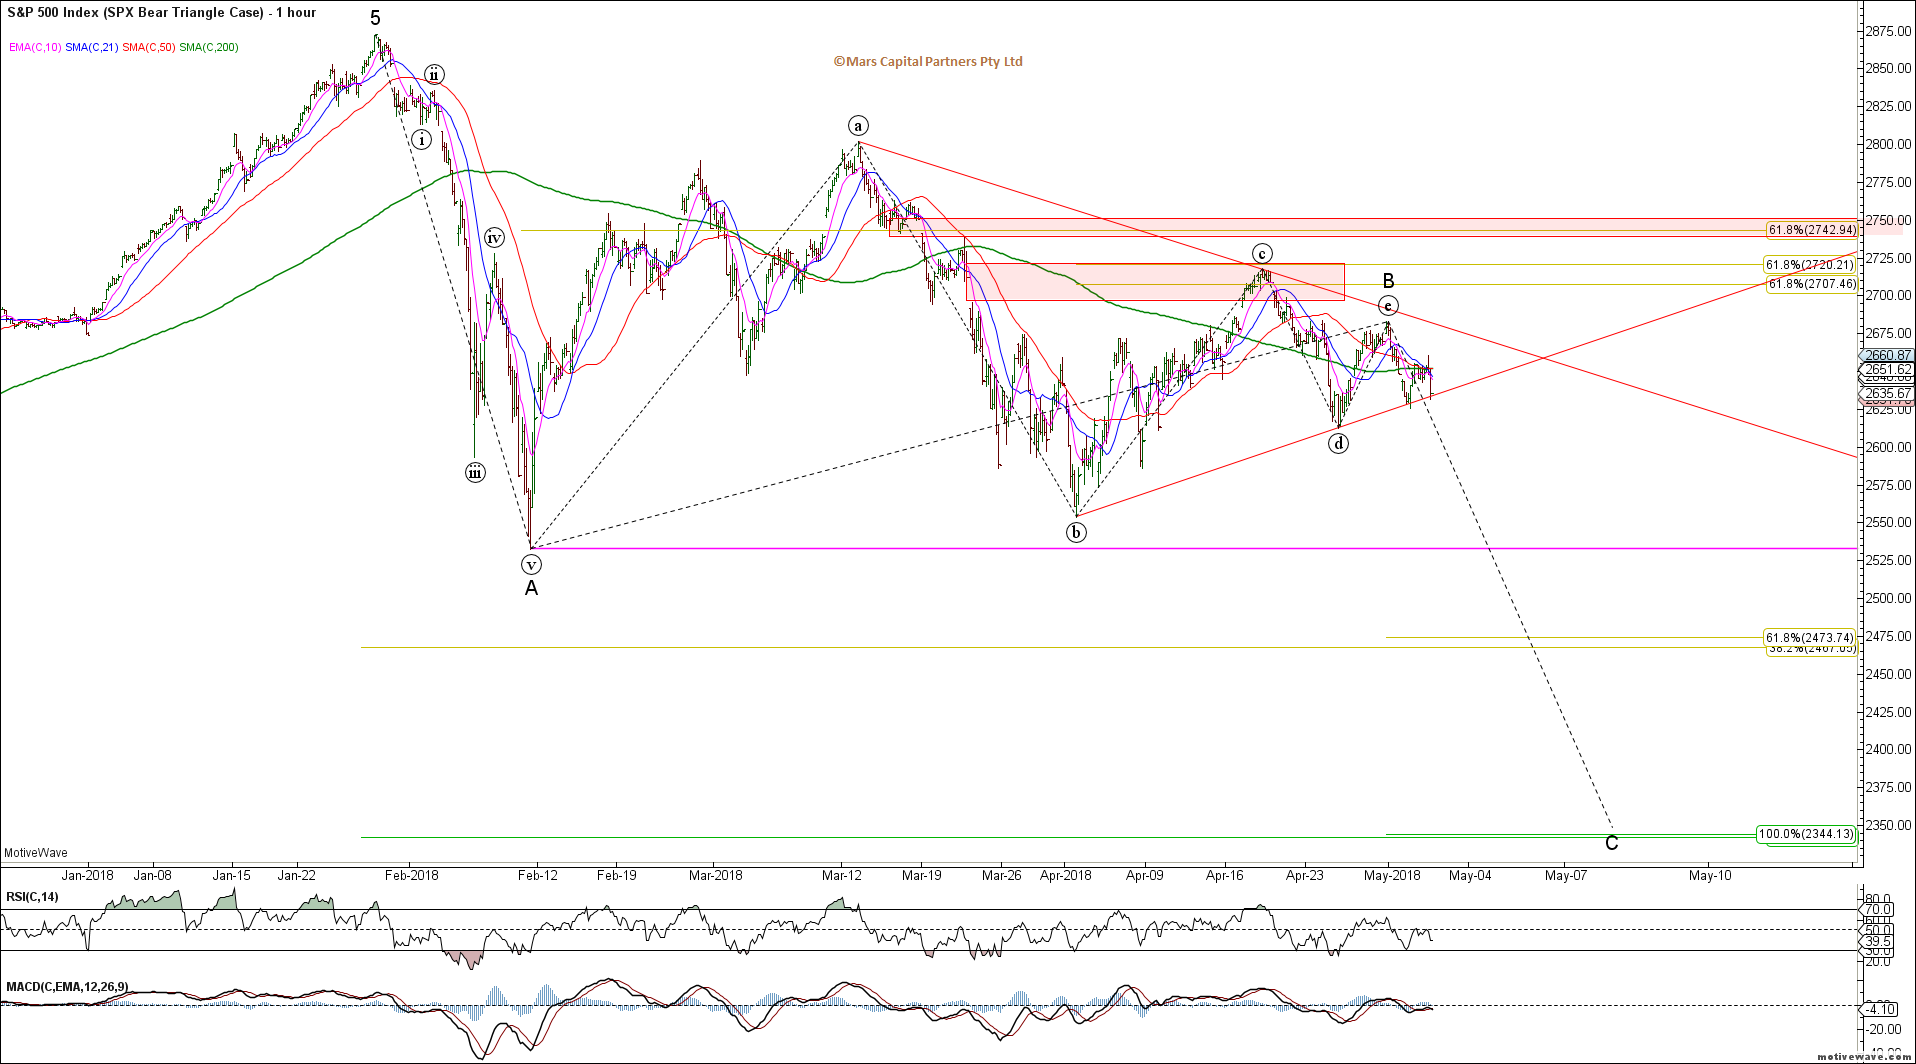
SPX H1 Bear Triangle
The bigger picture Bear Case remains unchanged. At the moment it looks like a waterfall decline with a series of lower highs and is only triggered on trade below the February lows. Downside targets in this case are much lower as we will assume the rally from the the 2009 lows is over and we are entering a bigger picture bear market.
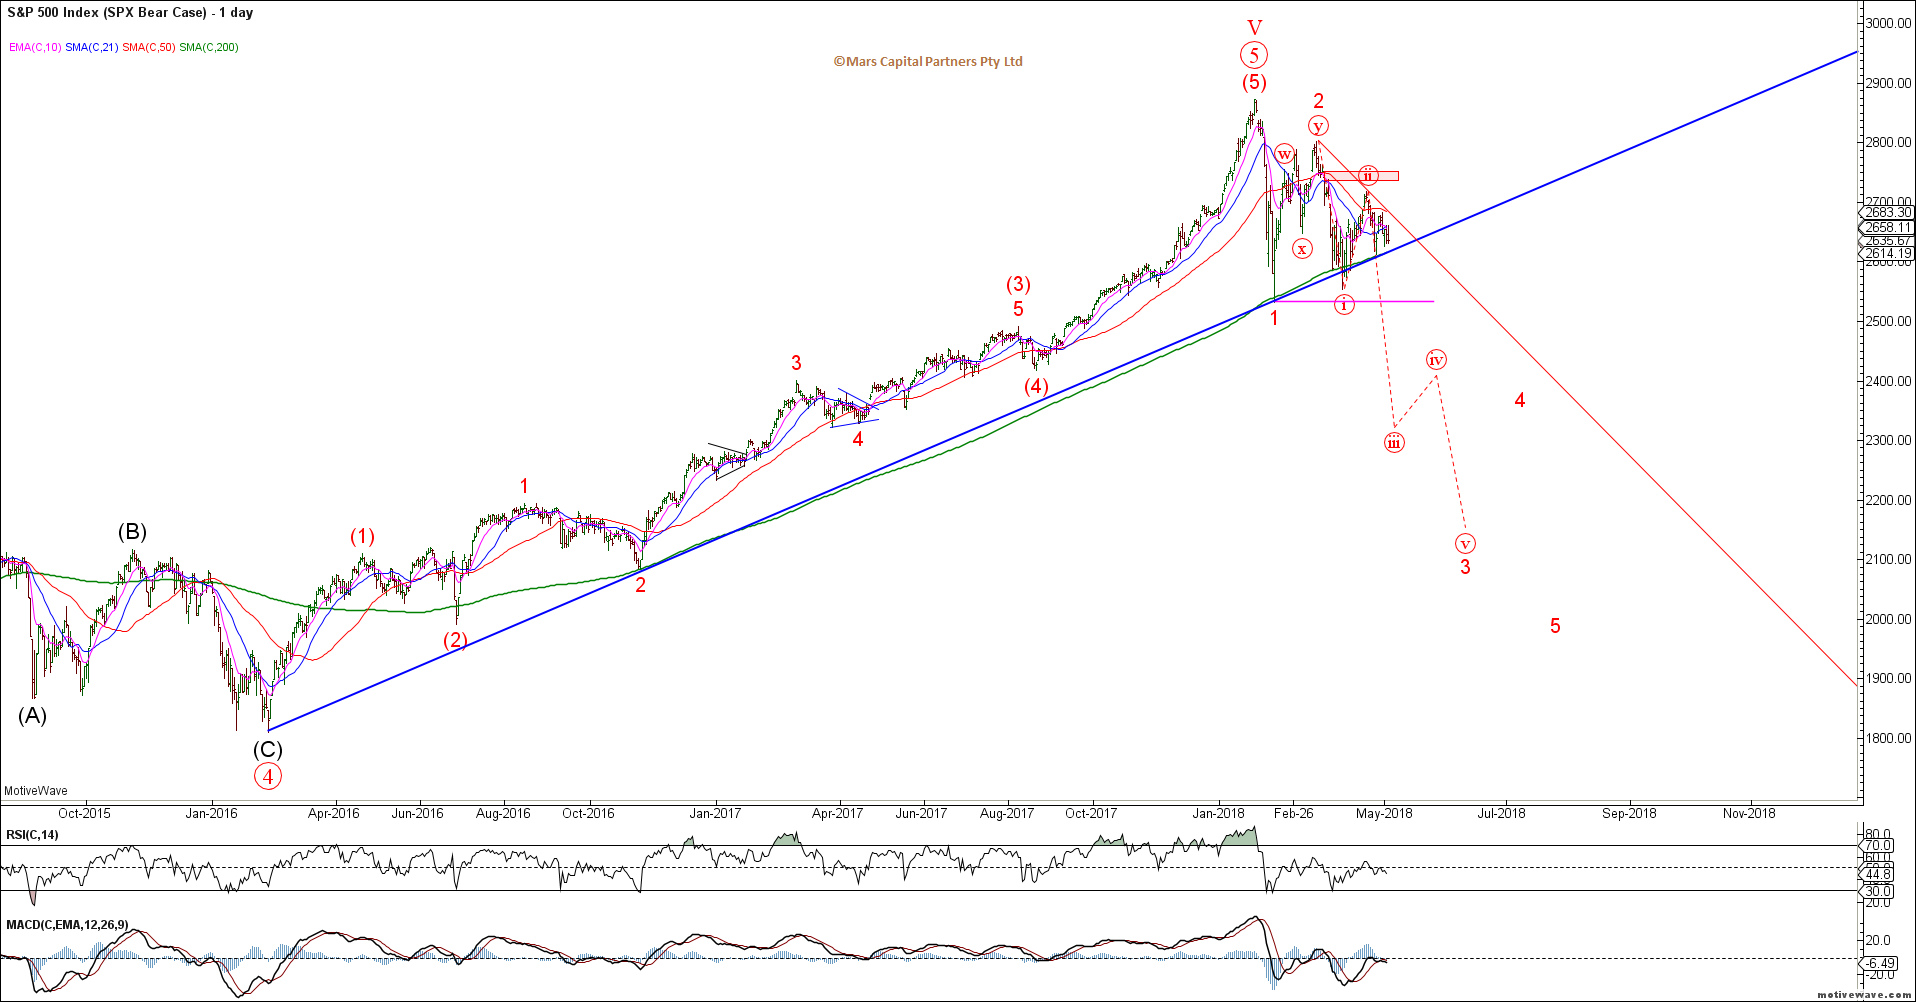
SPX Daily Bear Case
The SPY chart below just highlights key sma and trendline support and resistance areas so we don’t lose sight of the forest from the trees.
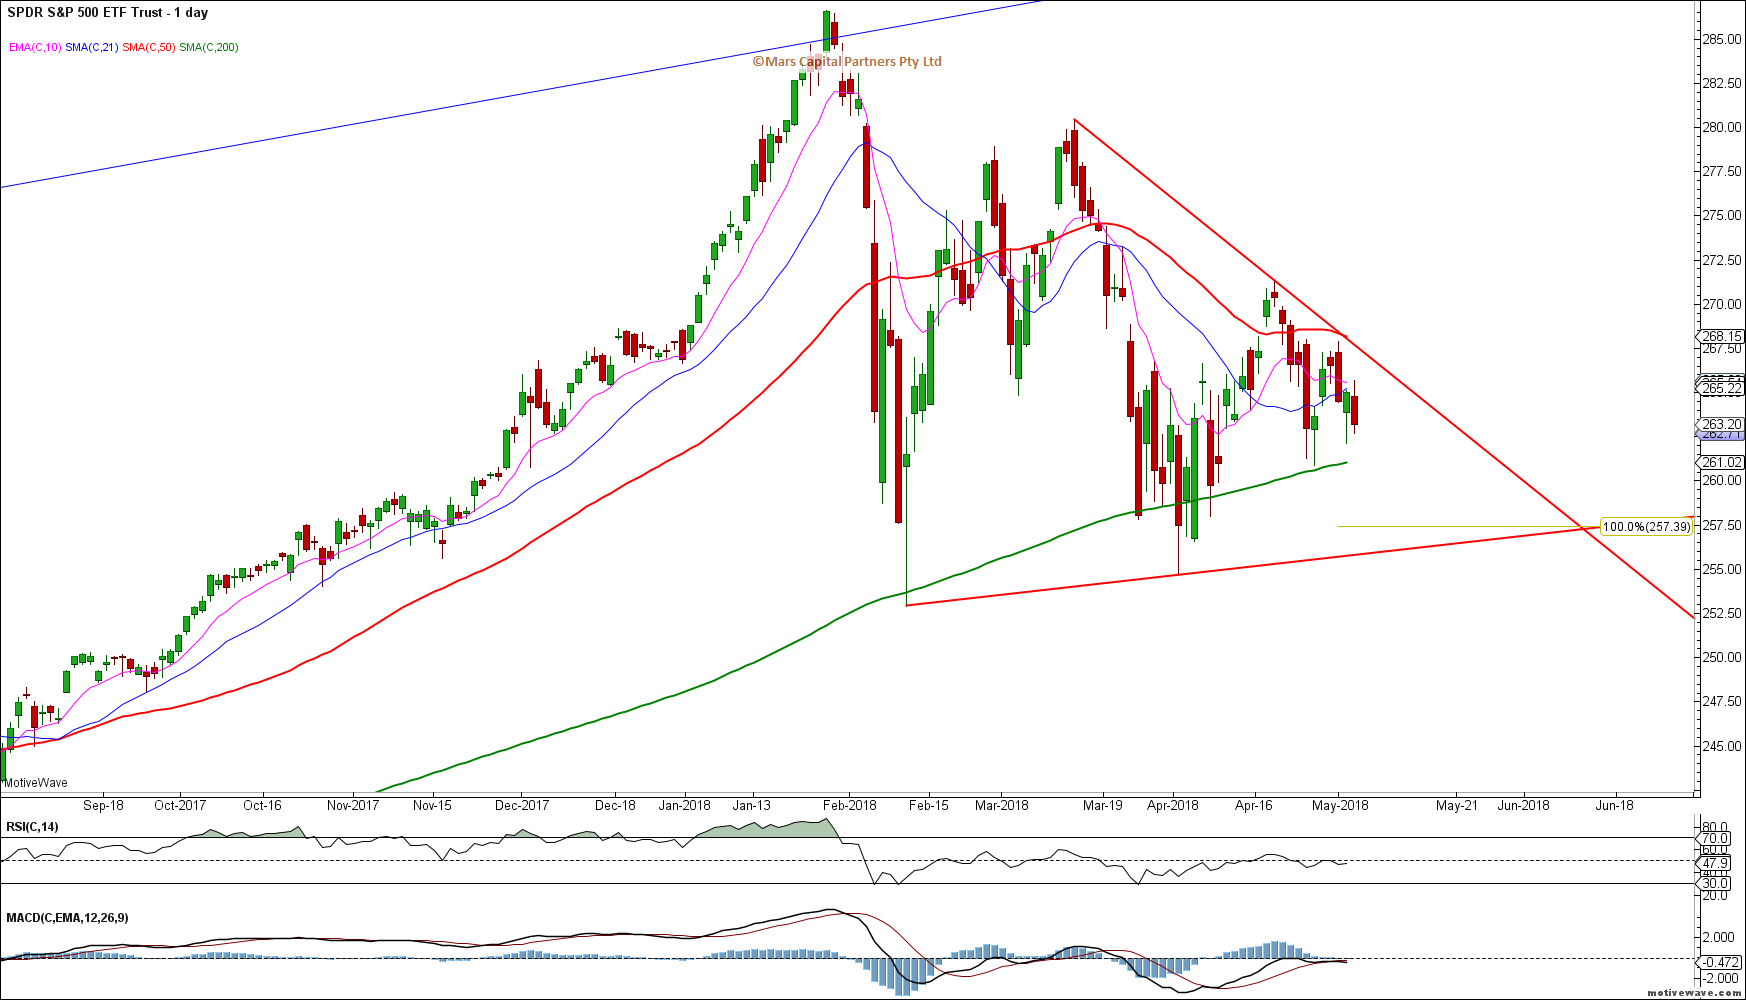
SPY Daily
To the other primary indices and the Dow looks like it wants a test of the April lows – as long as these lows hold, the bull case remains in tact. It is important to note that a strong break of the February lows opens the door to more significant waterfall declines highlighted above.
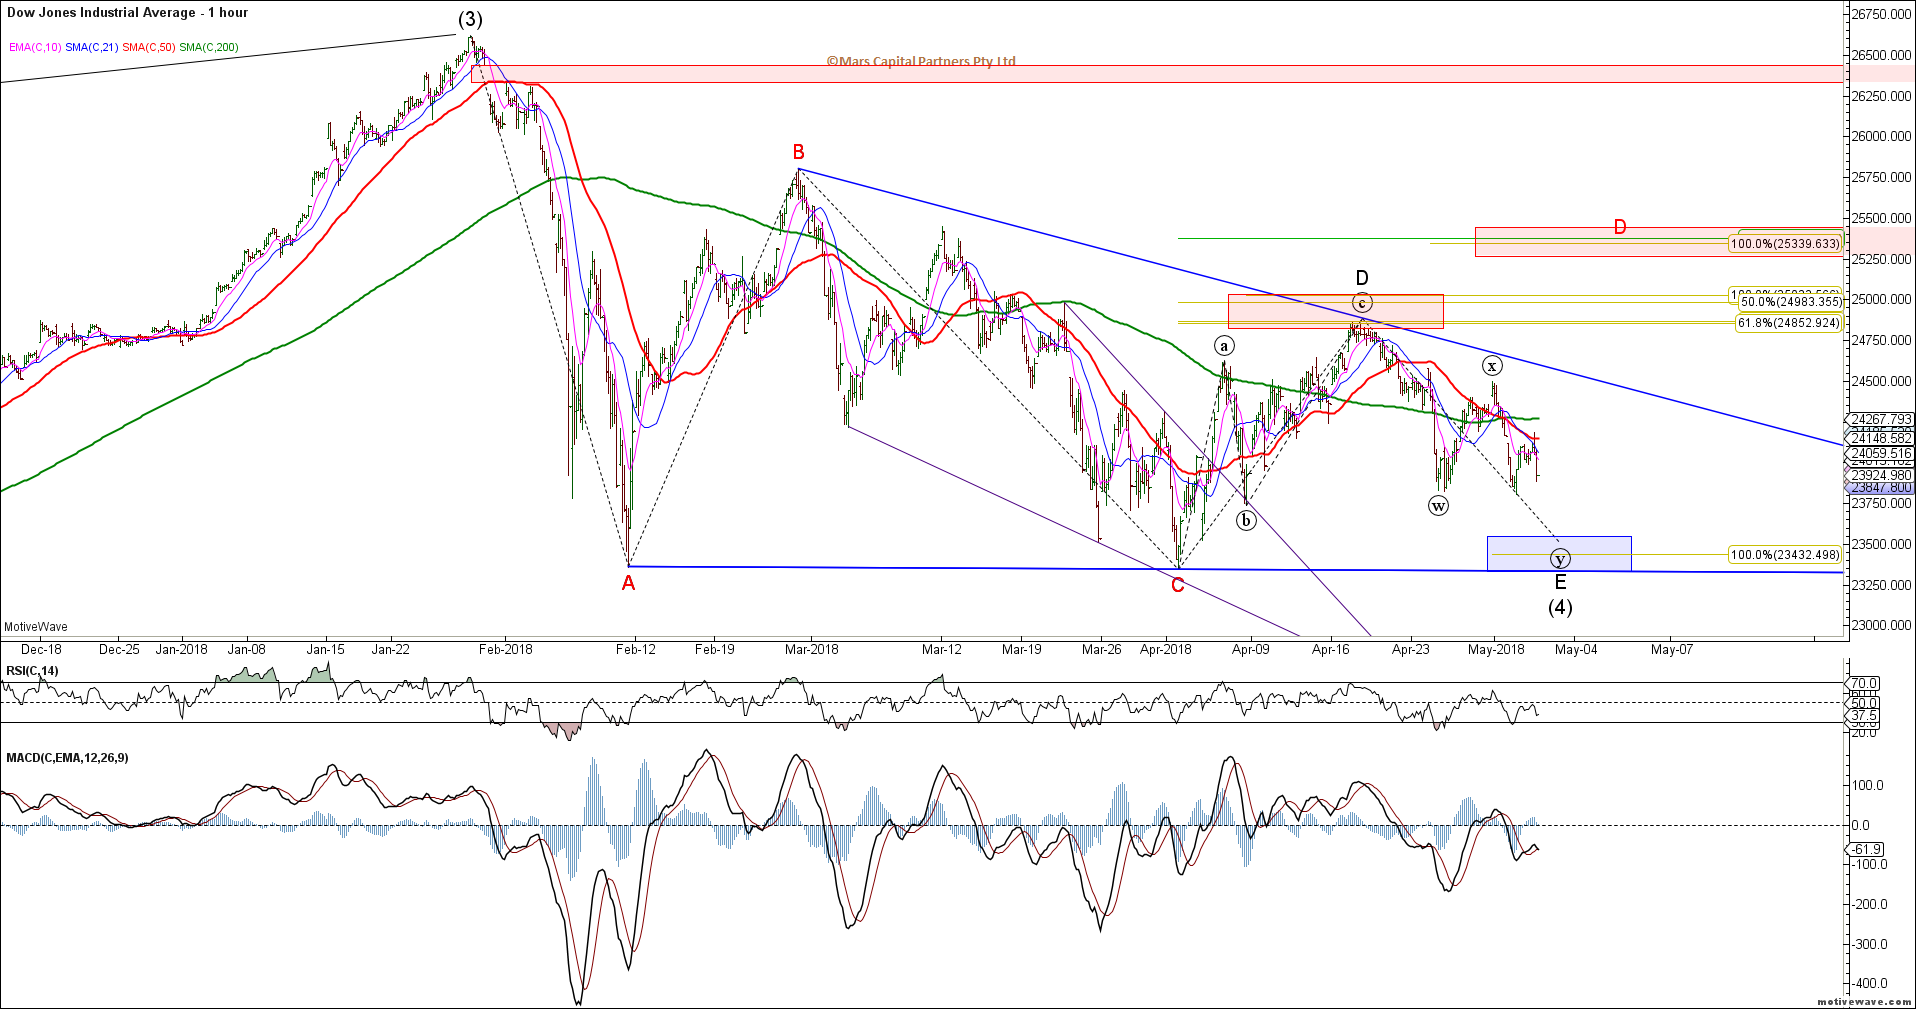
DJIA H1 Triangle Case
The DIA simplified chart below focuses on the 50 day sma and trend resistance and the 200 day sma and trend support.
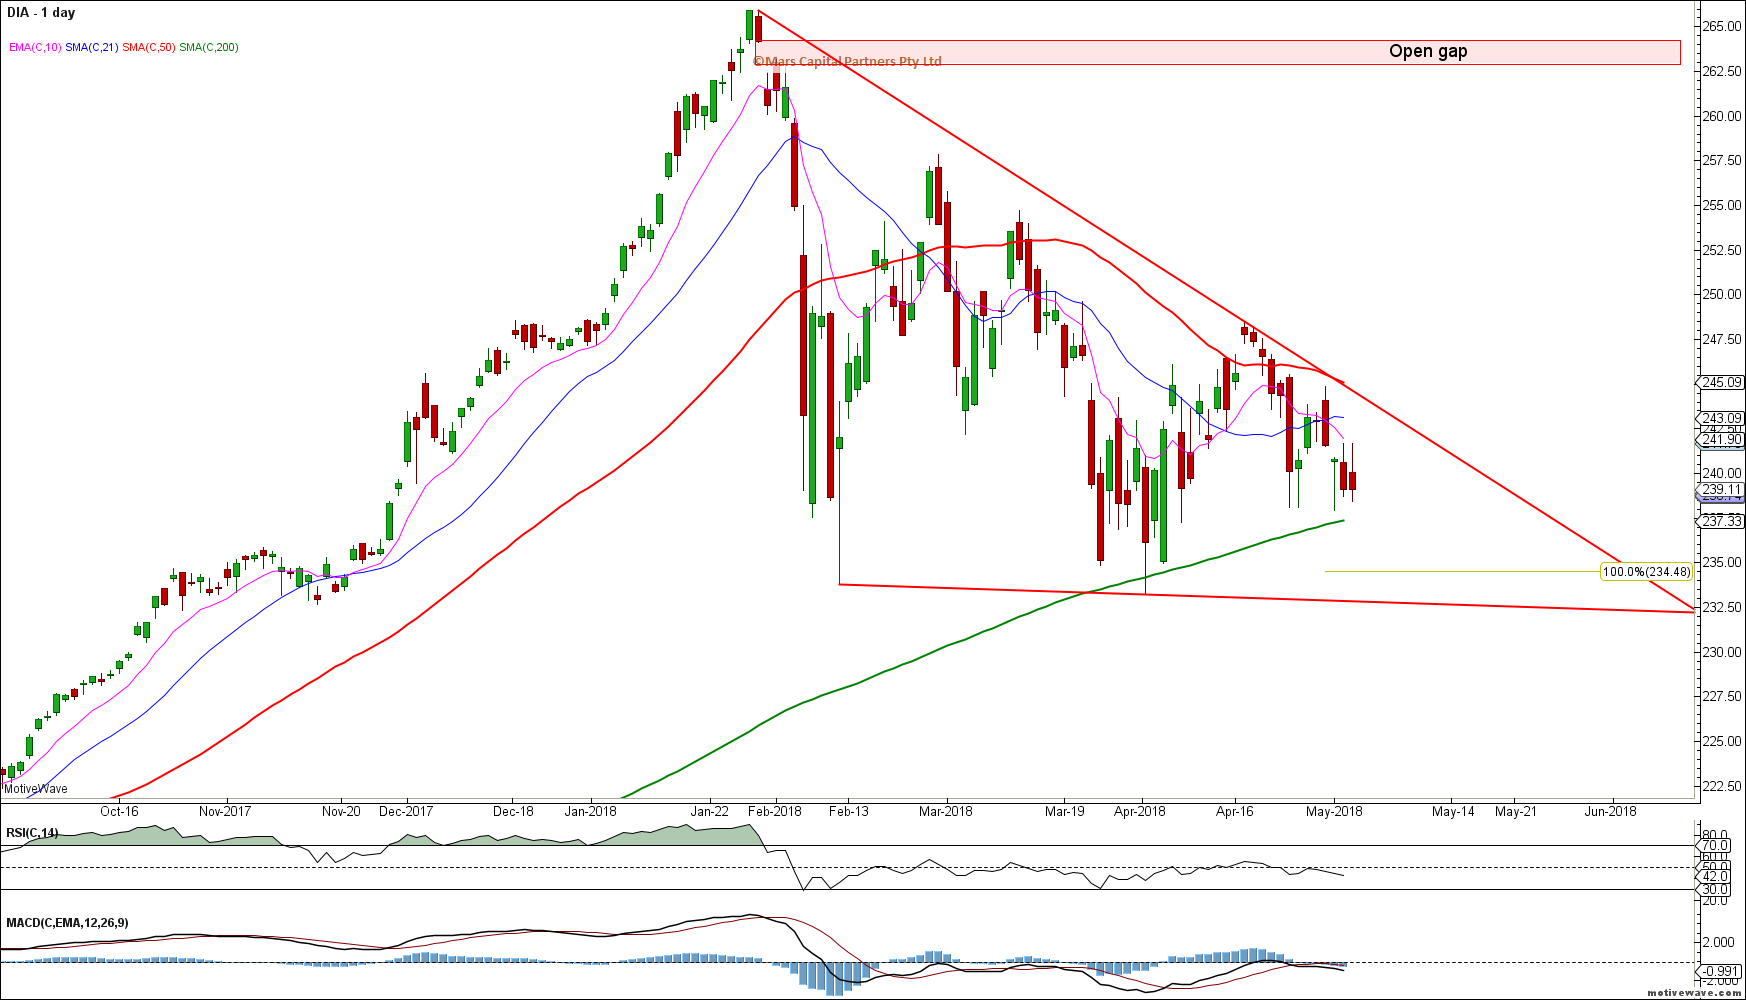
DIA Daily
The Nasdaq / NQ continues to be capped by the declining trend line and 50 day sma – while we have covered these structural options previously, I think it is important to revisit them here. The primary blue bull case remains in tact with strong near term support in the 6550-60 area. Clearing the blue upper trendline and 50 day sma will likely see a push through to our next resistance zone at 7000. A decline below the April 6300 lows will likely trigger a larger wave C decline for the Bear Triangle shown in red. The expanded / prolonged Triangle is shown in green.
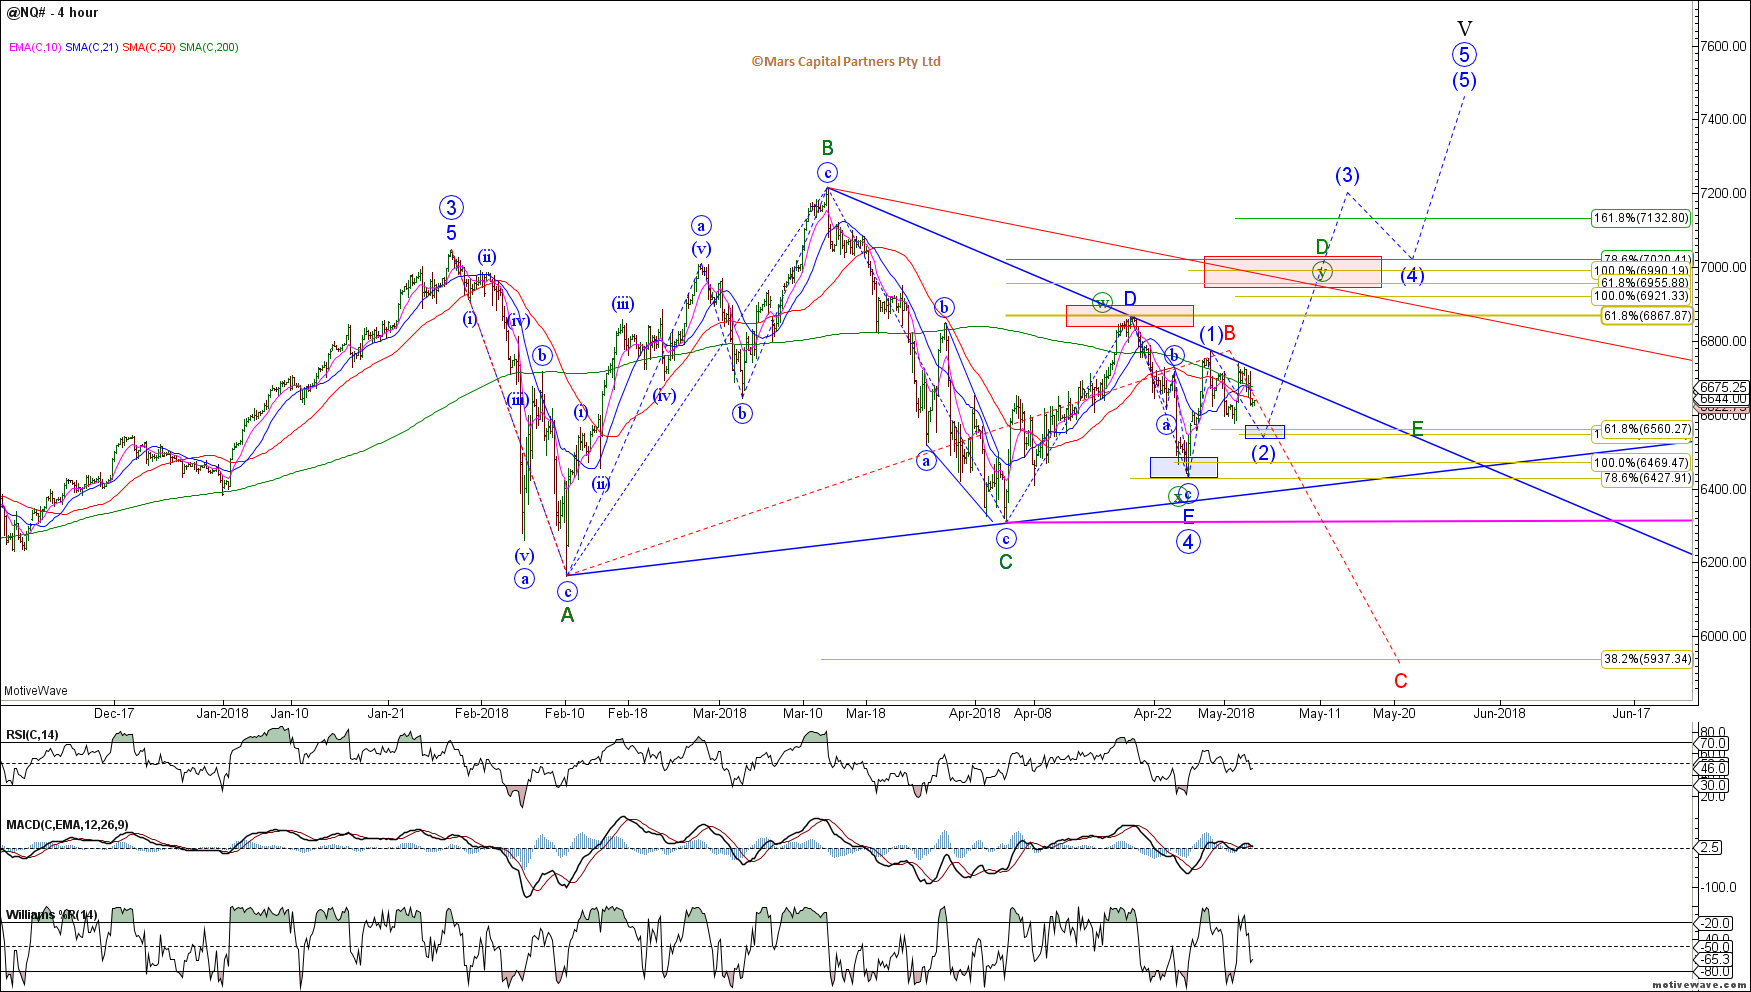
NQ H4 Triangle
The QQQ clearly shows trend resistance and the important 50 day sma resistance and 200 day sma support – I have also highlighted the open gaps above and below which are natural attraction points and are often filled.
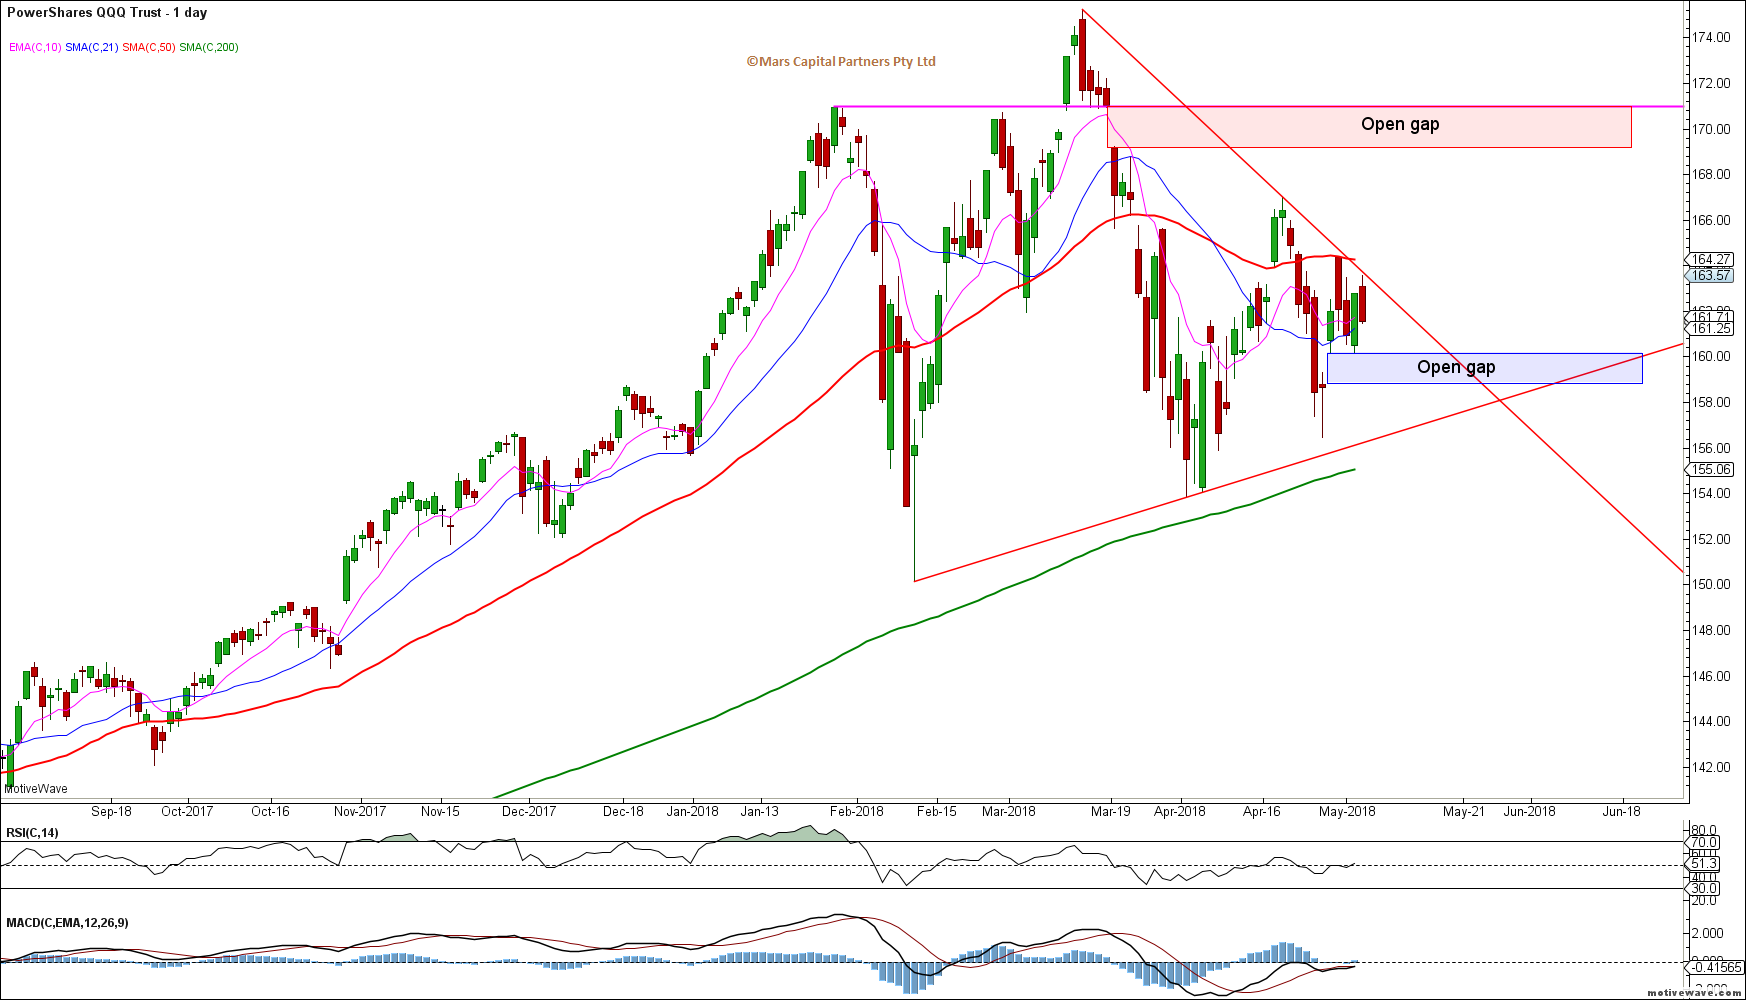
QQQ Daily
The Russell 2000 should have completed wave (c) of E for the bullish Triangle earlier this week and remains bullish while this week’s lows hold. Once again, a wave B bearish Triangle can also be counted as per the other indices. The Russell remains the most bullish with least impact of rising rates, strong $ and impending trade wars. It also hasn’t rallied as far or as fast as the other indices so it is less overbought. However, should the other indices break down, we would expect the Russell to follow suit.
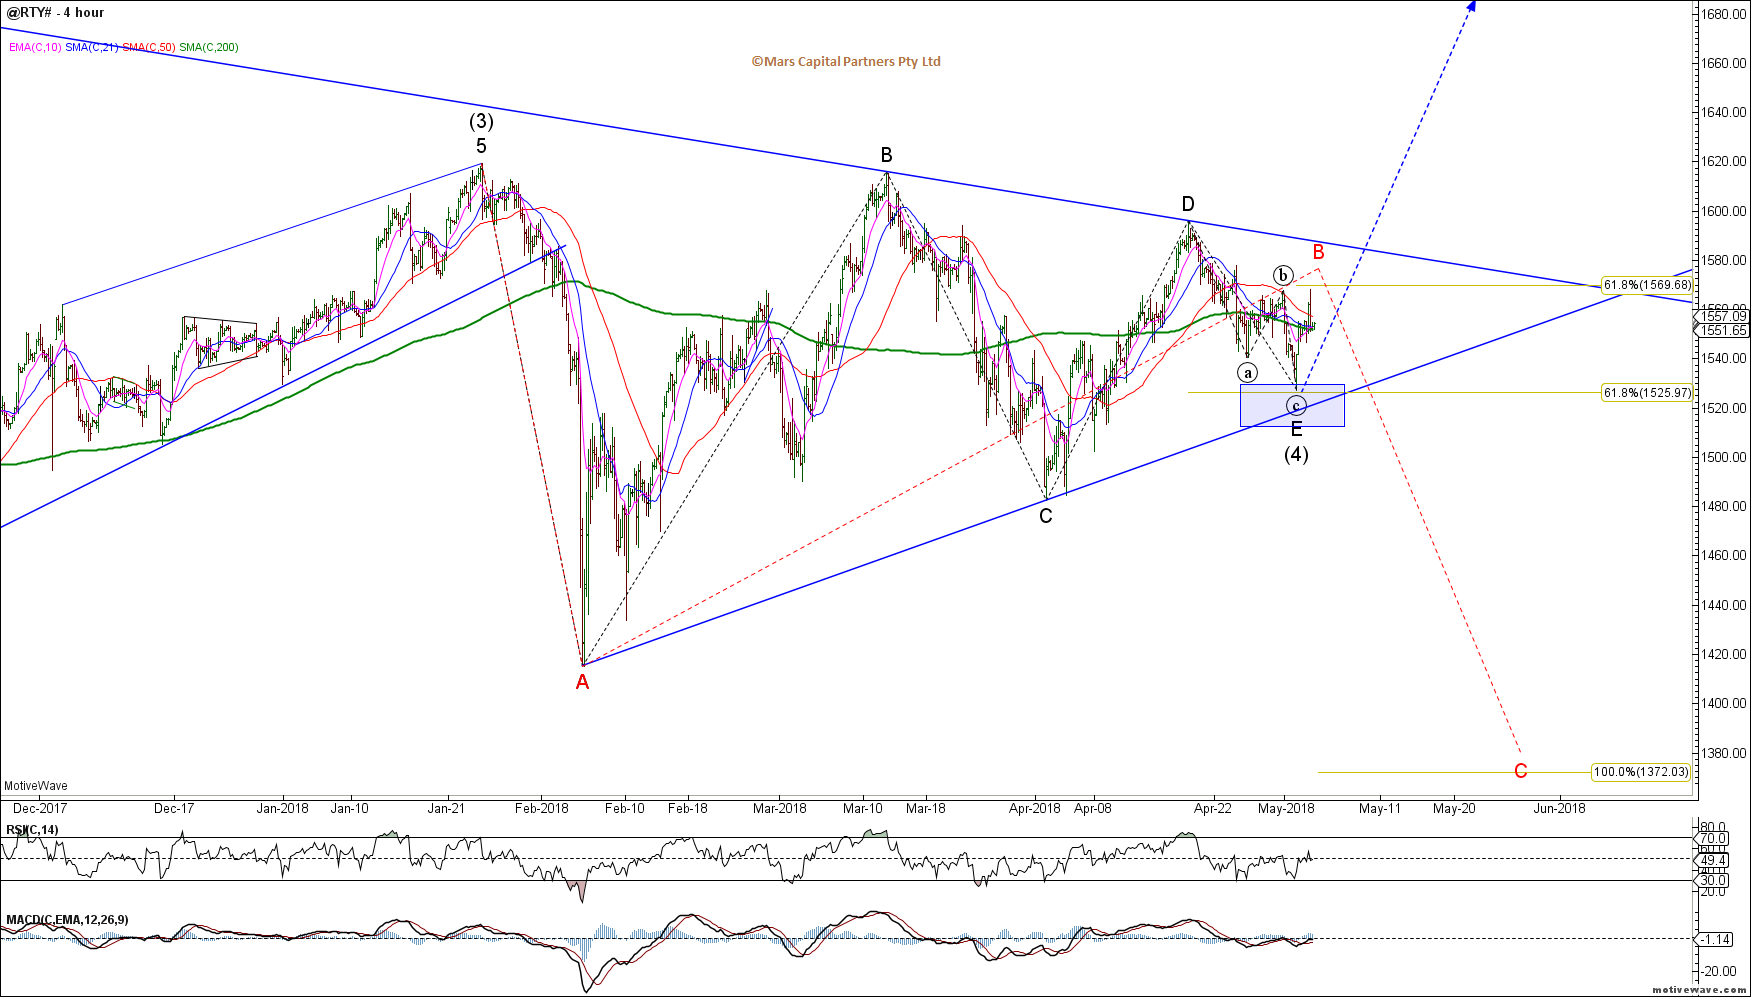
RTY H4 Triangle
The IWM below also highlights key sma and trend support resistance areas we are focused on with particular attention on the 200 day sma in this case.
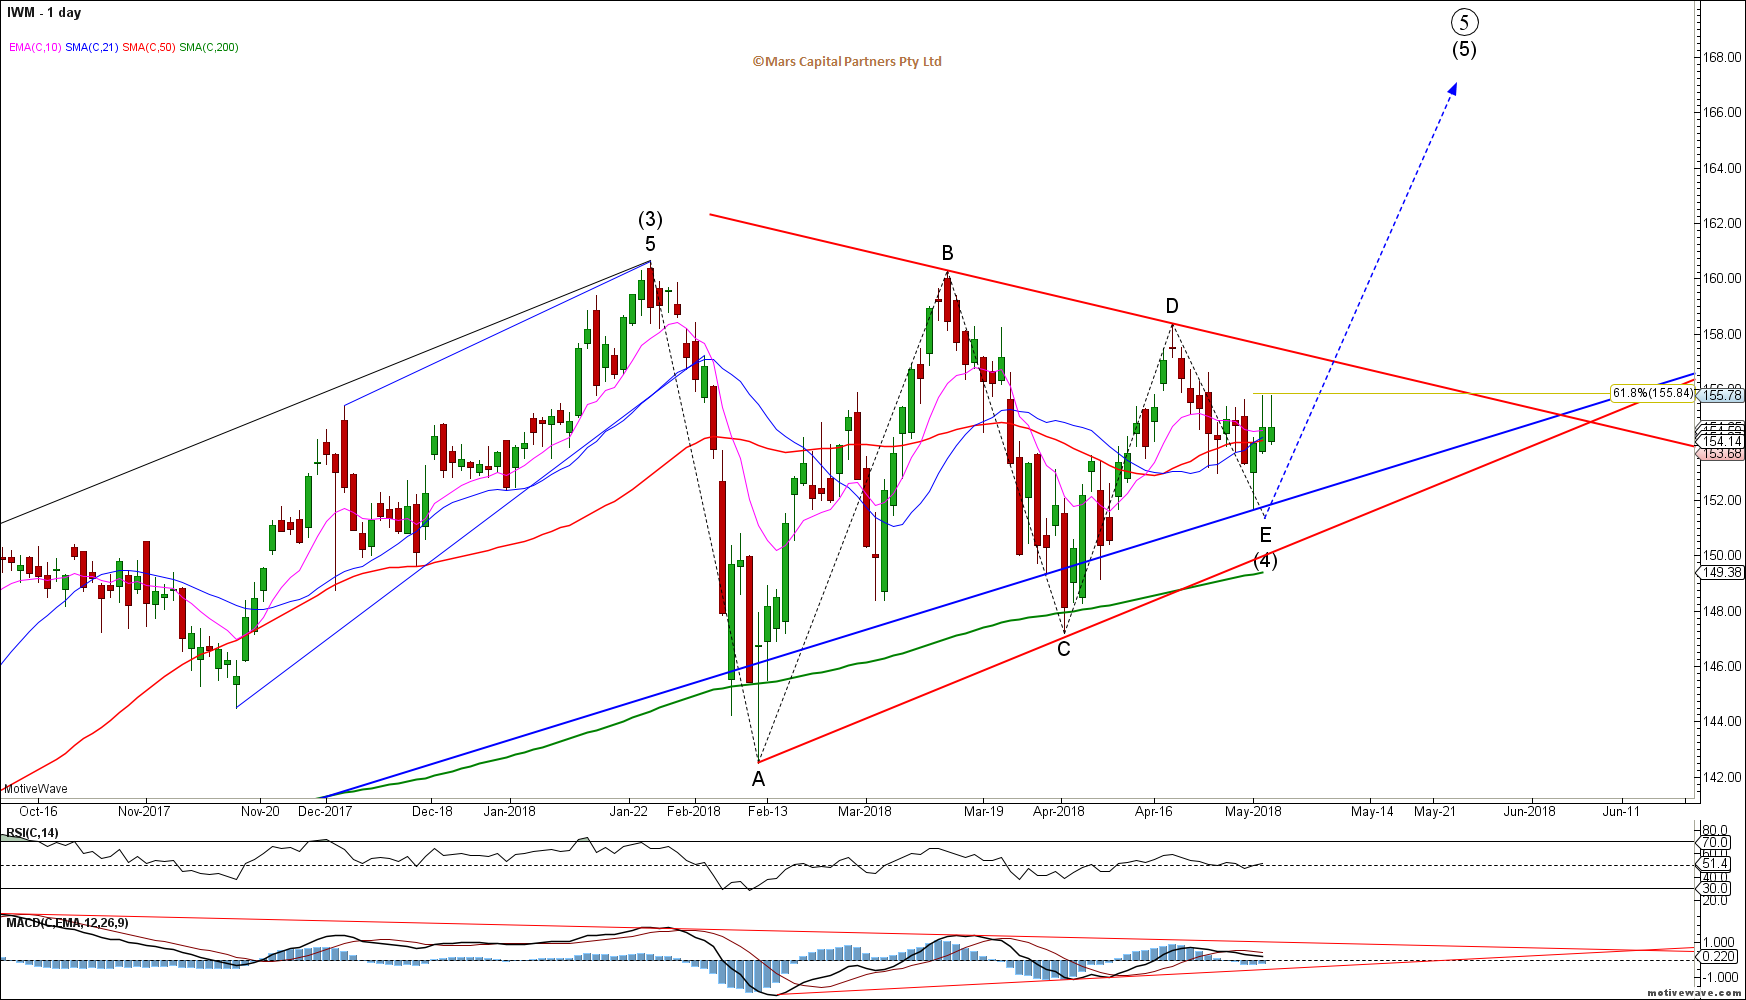
IWM Daily
That’s all for now folks. I hope that helps in identifying key levels and potential structures when considering Triangles. Cheers 🙂
