
Macro Review and Outlook for w/c 9 July 2018
Macro review for w/c 2 July 2018 – The key highlights;
Tariffs on US and Chinese imports went into effect late last week with some heated language around “igniting the largest trade war in economic history”. “International trade policy” featured in central bank speeches/minutes/interest rate decisions last week – highlighting concerns about escalation and the impact of uncertainty on sentiment and investment/capex decisions.
BoE scenarios for monetary policy contingent on trade protectionism, Brexit uncertainty and ‘tighter global financial conditions”.
US FOMC minutes – risks to the outlook are balanced, gradual rate rises appropriate, FFR likely to be above neutral by next year.
Aus RBA rates kept on hold – slightly less positive language around trade policy, global growth and local employment growth. Likely tighter lending standards to come in Australia.
PMI’s offered a first glimpse at June activity. PMI’s covered here followed a similar pattern – slowing/no expansion in manufacturing (US, Japan, Eurozone, UK, and China) and slightly stronger expansion in services. Continued to highlight impact of trade policies on business uncertainty, prices and availability of certain commodities (so far). Several PMI reports highlighted issues around slowing export sales (US, Asia, Europe).
US data remains positive; the ISM reports (manufacturing and non-manufacturing) showed expansion continued to accelerate versus the Markit PMI’s showing manufacturing and services still expanding, but not accelerating. Headline manufacturers new orders for May increased, driven by non-durable goods. Continued improvement in US non-farm payroll growth. Job cut announcements low compared to recent history but hiring announcements lagging.
Europe; unemployment continued to fall, retail sales growth in Eu28 was steady (flat in the EA19)
UK; announcement of Brexit plans late Friday now under some uncertainty after the key Brexit Minister resigns, citing disagreement with the Cabinet plans. PMI’s suggest stronger services, improved construction and weaker manufacturing activity in June.
More detail is provided in the full review – download it here (hit the back button to return to the site);
The outlook for w/c 9 July 2018 – The major themes for this week include;
Liquidity – relatively light supply in treasuries this week with the US Treasury auctioning/settling $125b in bills with no paydown or new money raised (4wk bill TBA). Several speeches from FOMC members, Fed Monetary Policy report, BoE and BoC rates decision this week.
With US and Chinese tariffs now in effect, waiting for the next level of escalation. Hearings for the next round of US tariffs not until 24 July. Also awaiting the outcome of US investigations on auto imports – impacts on Europe and Asia.
Brexit likely to feature this week after the key minister for Brexit resigns amid disagreement on the direction of UK-EU Brexit deal.
US CPI for June and JOLTS data
Further detail is provided in the full brief – download it here (hit the back button on your browser to return to the site);
Comments and feedback are welcome. Please email me at kim.mofardin@marscapitalpartners.net
MCP Market Update: July 9th, 2018 – Bears Fumble
Macro Review and Outlook for w/c 2 July 2018
Macro review for w/c 25 June 2018 – Trade and tariffs, central banks and the latest reading on growth and inflation all featured last week. Key highlights:
Trade and tariffs ;
- The US decided not to invoke a National emergency law to block Chinese investment in US tech companies
- China announced that it had reduced the number of industries where foreign investment was restricted
- Canada reaffirmed its $12.6b in tariffs on US imports going live on 1 July 2018
- Auto tariffs will likely be a focus, especially for Europe, as President Trump stated that he was close to finalising his study on tariffs on car and truck imports from Europe
Central banks voiced some concerns;
- RBNZ kept rates on hold – expansionary level for a considerable period, citing excess capacity and trade tensions
- Fed President Bullard would prefer to see more gradual increases in rates and is concerned about the possibility of yield curve inverting
- BoE Governor Carney – Conditions could crystalize long standing risks of a ‘snapback’ in interest rates and tightening of global financial conditions – trade tensions, tighter US funding markets
- BoJ – Meeting for July will include further analysis of the weaker price growth in Japan
- ECB – reaffirmed plans to reinvest principal payments from its bond buying program once net asset purchases end in 2019
US growth – data offered mixed insights. Signs of slowing from Chicago Fed, Dallas Fed, US Durable Goods and Q1 GDP revised lower. Underlying price growth in PCE price index showing signs of acceleration. More positive results from Richmond Fed, Kansas Fed and Chicago PMI.
Eurozone CPI was higher on the back of accelerating annual growth in energy prices. Similar for German CPI. German employment was stable, but German Retail Sales declined in the provisional results released for May.
The UK was told to get a move on from the EC this week with regard to detail around Brexit. The UK government will meet on 6 July to agree and outline in more detail the future UK-EU partnership. The third release for Q1 GDP improved slightly – the previous large decline in Construction was revised to a smaller decline.
Download the full macro review for more detail – then hit the back button on your browser to return to the site;
The outlook for w/c 2 July 2018;
Liquidity – relatively heavy supply in treasuries this week with the US Treasury auctioning/settling $225b in notes and bills and $25b in new money to be raised.
A relatively quiet week for central banks – RBA rates decision, BoE Carney speech and FOMC minutes out this week.
Trade – US tariffs on Chinese imports go into effect 6 July. Canadian tariffs on US imports went into effect 1 July.
Another important week for the latest readings on global growth;
- Manufacturing and services PMI’s for June released across a range of countries
- US non-farm payrolls & factory orders
- Europe employment, retail sales, German industrial production
Download the full brief for this week – then hit the back button on your browser to return to the site;
Comments and feedback are welcome. Please email me at kim.mofardin@marscapitalpartners.net
MCP Market Update: July 1st, 2018 – Calm before the Storm
Last week we discussed our thesis for a potential market top in risk assets in “Has the Music Stopped?”. In Part 2 – “Calm before the storm” we examine in more detail the potential market structures unfolding in global equity markets. We remain tactically bearish equities as we start to see more evidence of a potential change in trend.
Last week, equity markets declined as expected with the market leaders (Nasdaq / Russell 2000) declining impulsively from new ATH’s providing further evidence of a tradable top in these markets. Bond markets continue to be range bound (within a larger bear market) while the US$ appears to be topping near term. This should provide near term support for the commodity complex within the context of a larger bear market.
From last week’s update…
“We now have a number of warning signs of a potential market top but we DO NOT yet have price confirmation of a change in trend (decline below the critical February low support). Our primary thesis remains that the bullish macro tailwinds that supported this post-GFC rally are turning into headwinds as liquidity is drained from the system, global debt is peaking while global growth is slowing. All the while, the Trump administration has engaged in a trade war with both its Allies (Europe / NAFTA) and Enemies (China / Russia). We see evidence of reduced liquidity as higher risk assets are being sold off (eg. Emerging Markets) and remaining liquidity being concentrated in the last bastion of “hope” of FAANG and the Russell 2000 – the problem is that technically, these “market leaders” are actually tracing out ENDING waves of the post-GFC equity market rally.”
We are now seeing increased evidence of a major market top where fundamentals, technicals and sentiment align… this is an important week for risk assets as tariffs on Chinese imports are expected to start July 6th – where Trump (the immovable) meets Xi (the unstoppable).
What we have:

What we do not yet have: Confirmed evidence of a change in trend – as defined by a broad based market decline (5 wave impulsive decline) that breaks the February lows.
From a big picture perspective the SPX continues to trace out the final waves of this rally from the 2009 lows which we expect to be fully retraced in the years ahead. The question is whether this market topped In January 2018 (red count) or requires a marginal new high to complete the rally (black count) – either way, our contention is that this market is in the process of topping and downside risks abound.
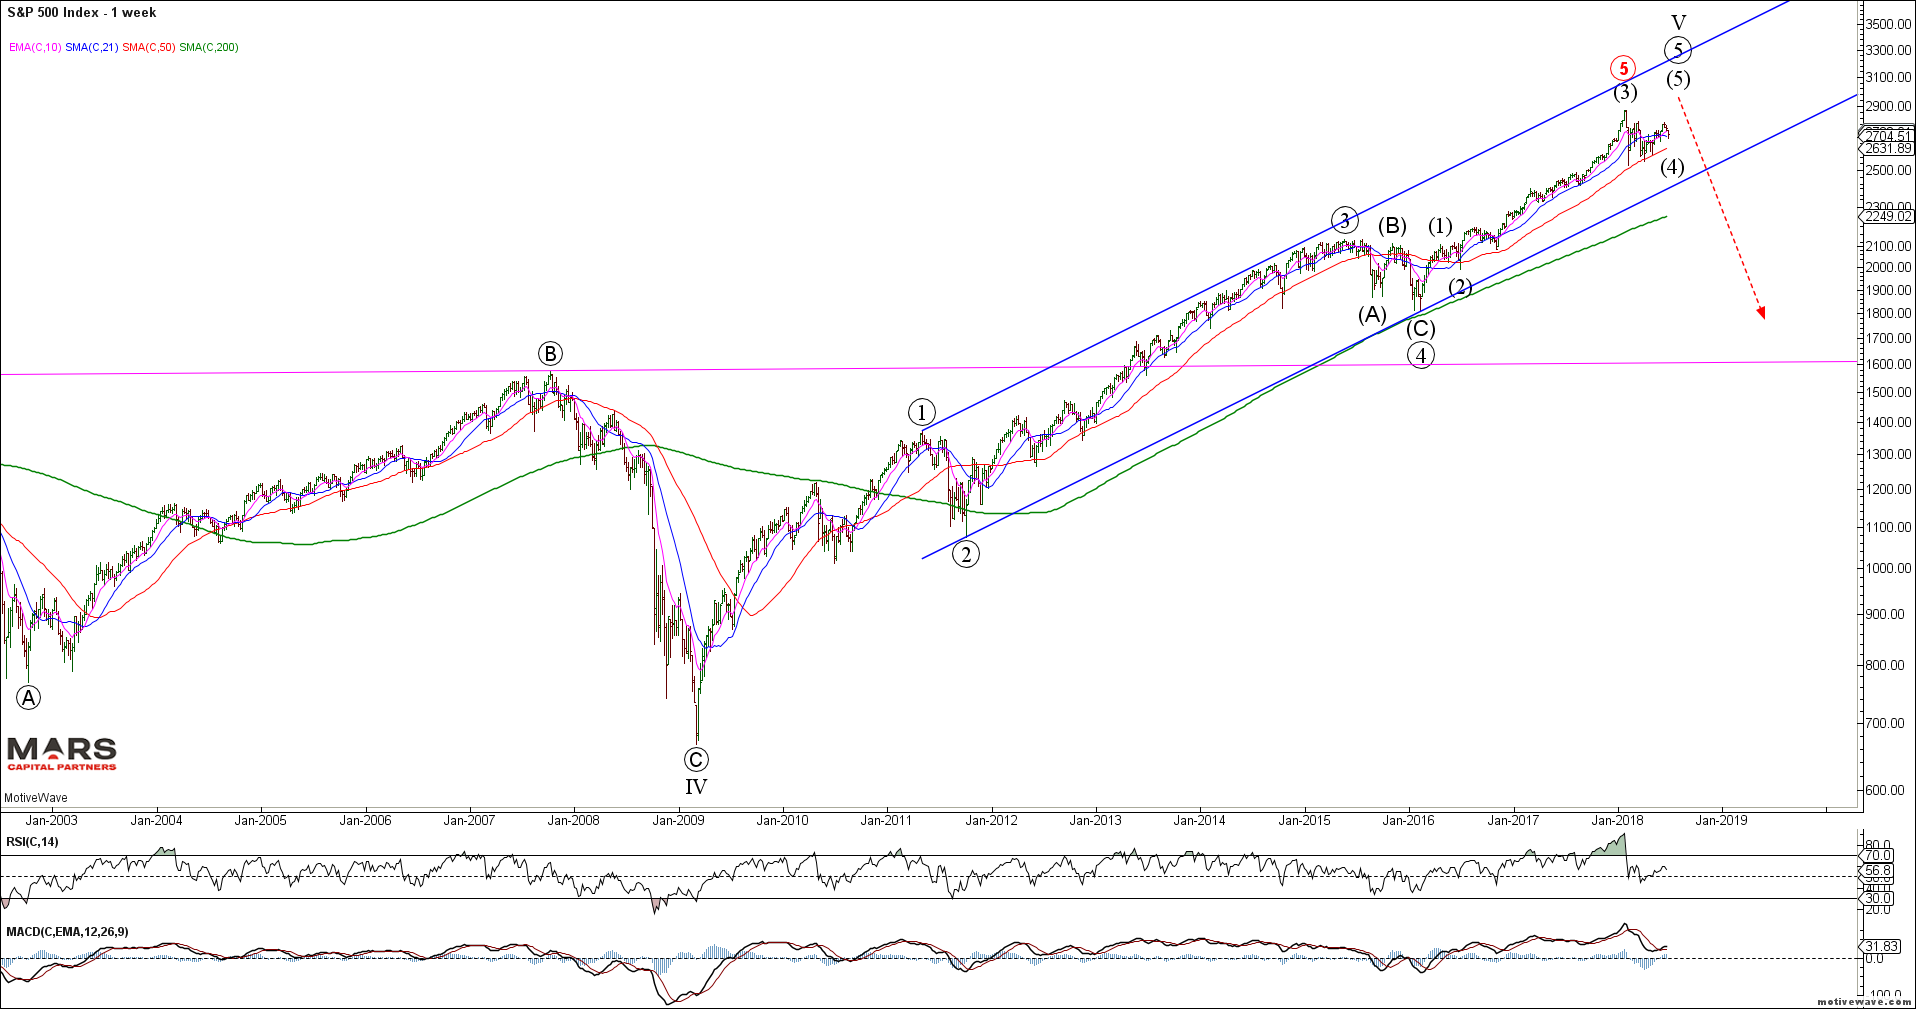
SPX Semi-log Weekly
Our preferred SPX case is that the market topped in January 2018. The counter-trend rally likely topped in June and we should now see an accelerated decline through the February lows towards our 2250 measured downside target. This immediate bear case is wrong on a push to new ATH’s.
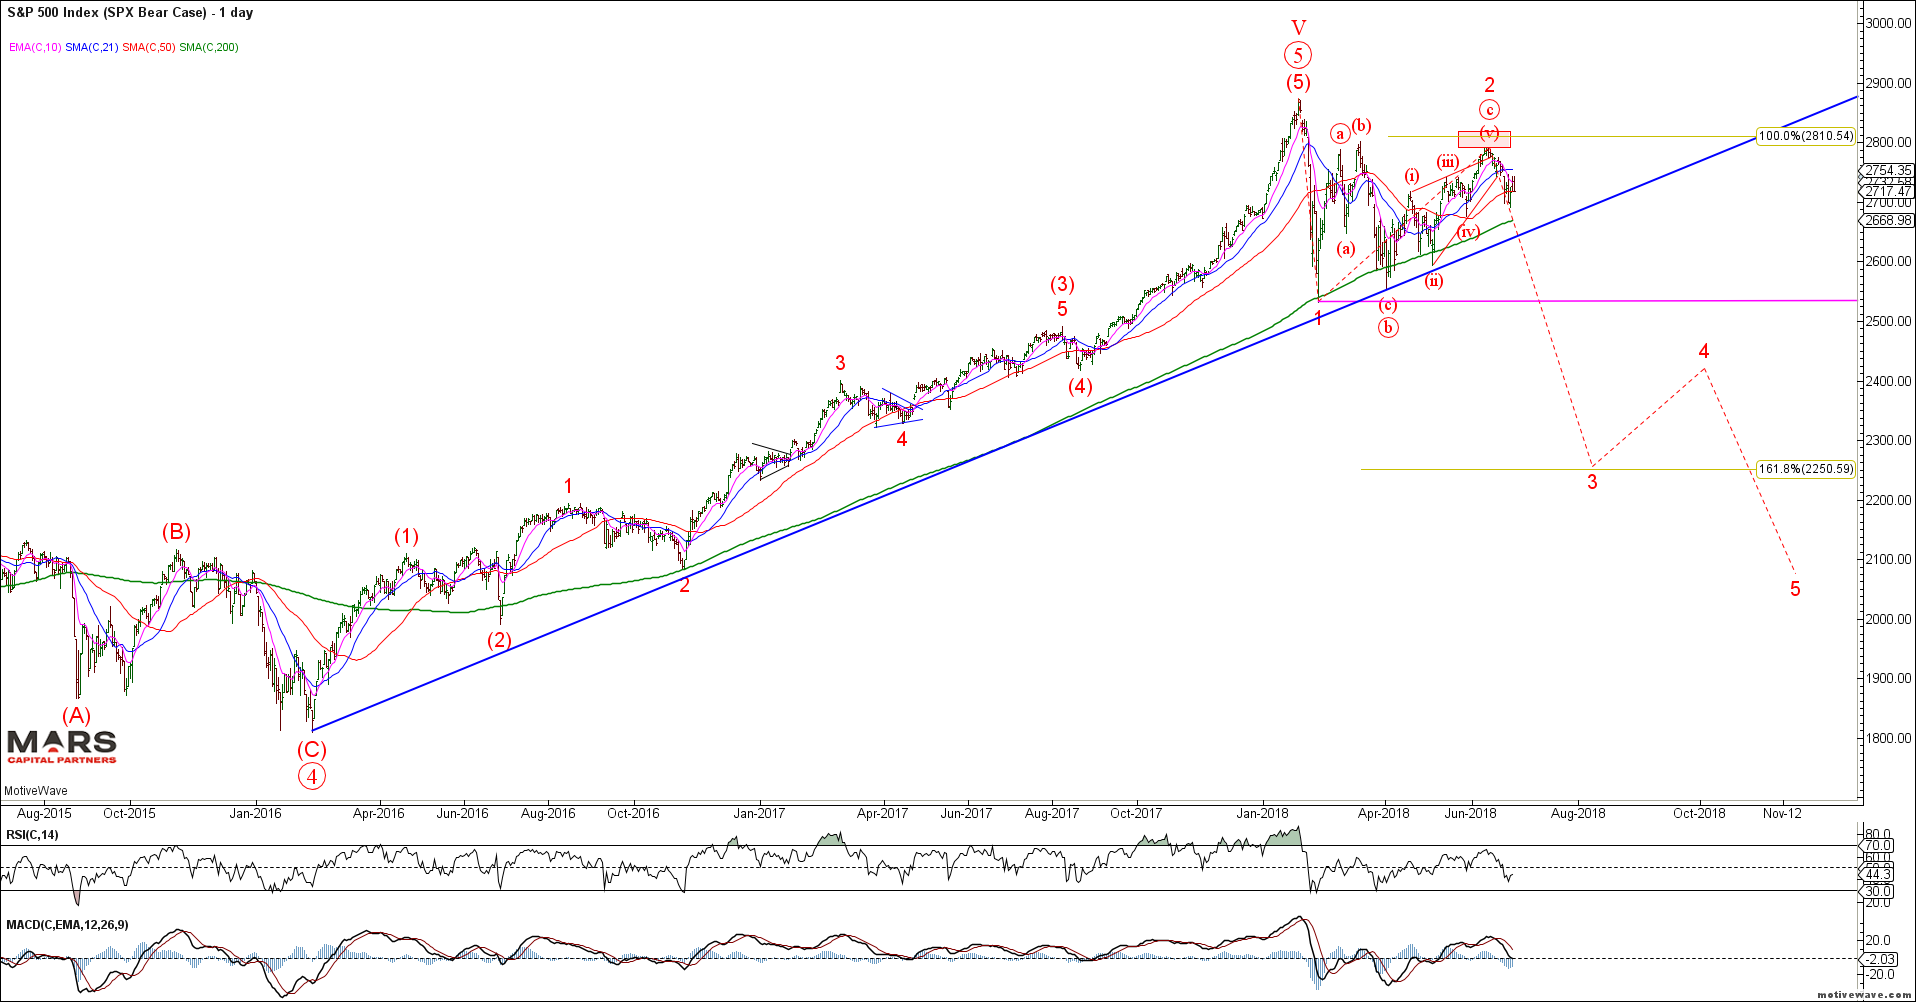
SPX Bear Case Daily
The alternate SPX case is that we are completing a wave (4) counter-trend decline prior to a FINAL push to new marginal highs. This structure assumes we are completing a wave (4) symmetrical Triangle prior to a final wave (5) push to new marginal ATH’s (blue case) or a false break of the February lows towards 2450-70 Fib support before a bullish reversal higher (green count). While not our preferred options, they remain possible so we must be aware of the potential. Either way, we remain bearish from a bigger picture perspective.

SPX Bull Case Daily
We continue to be tactically bearish ES looking for key resistance in the 2800-30 area to hold. We do NOT expect the SPX / Dow to confirm the Nasdaq / IWM rally to new ATH’s.
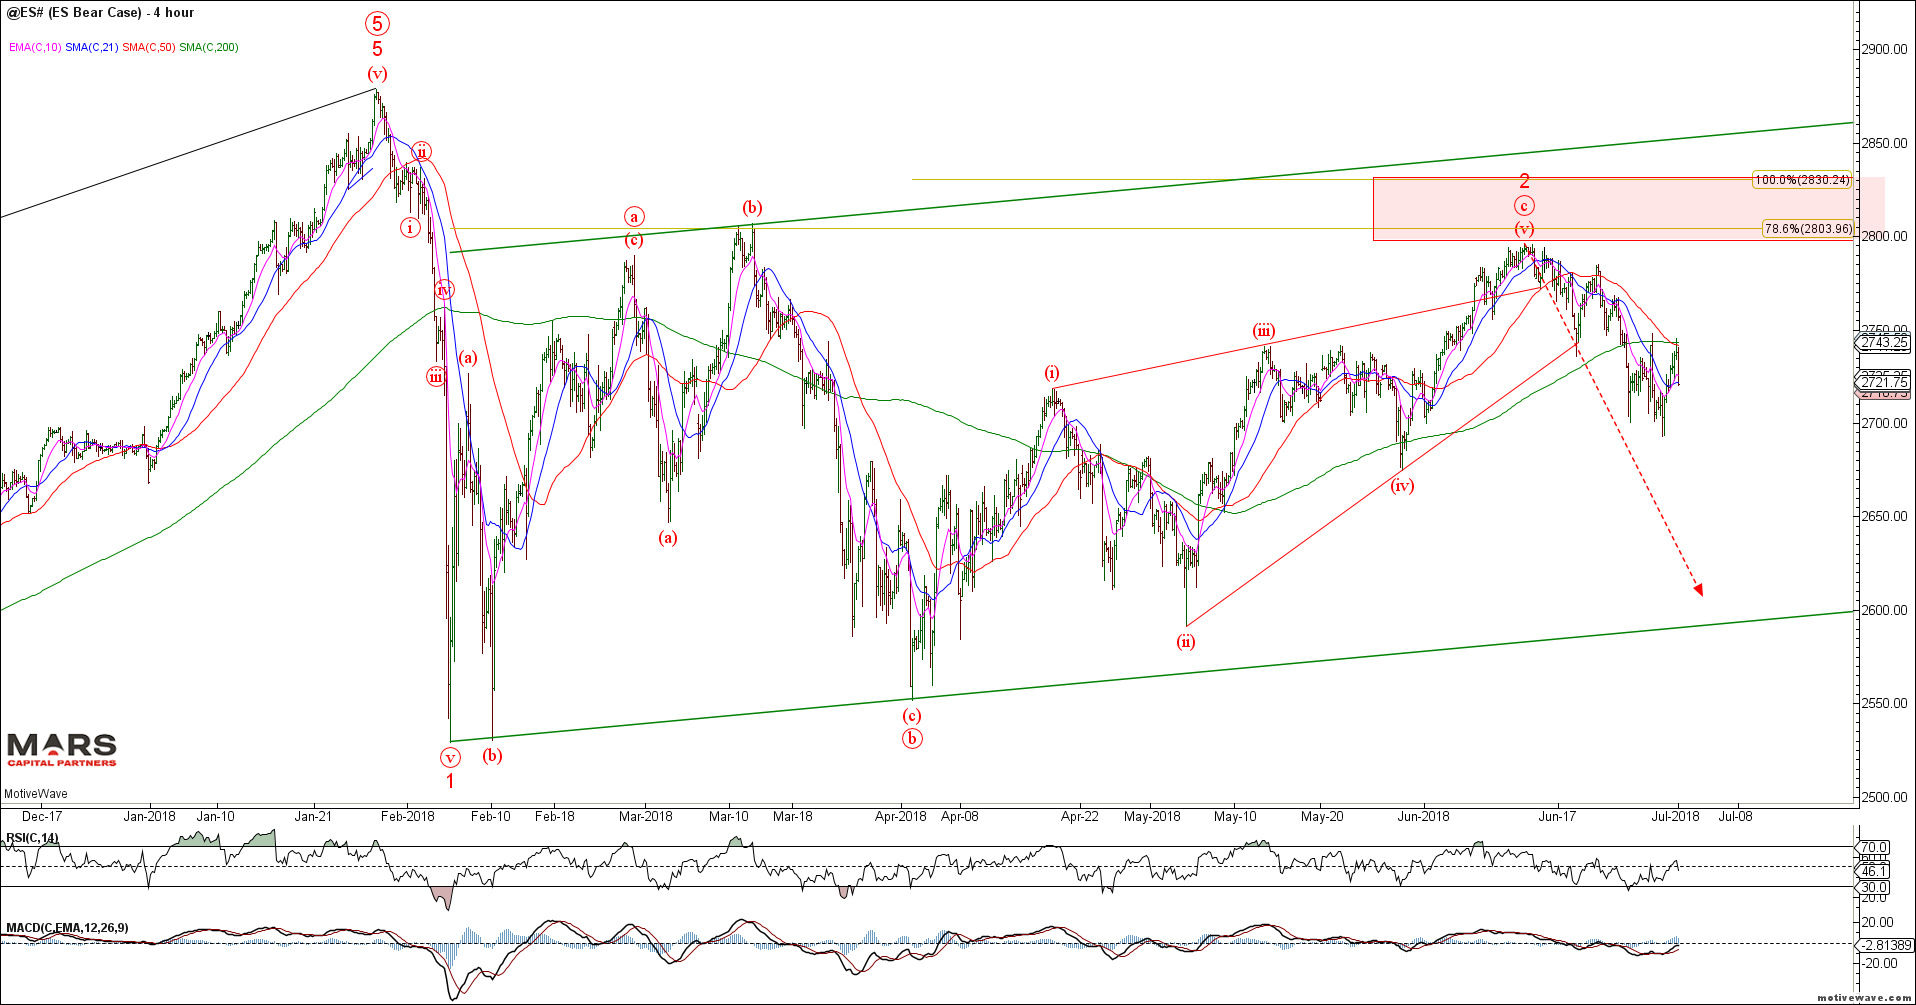
ES H4
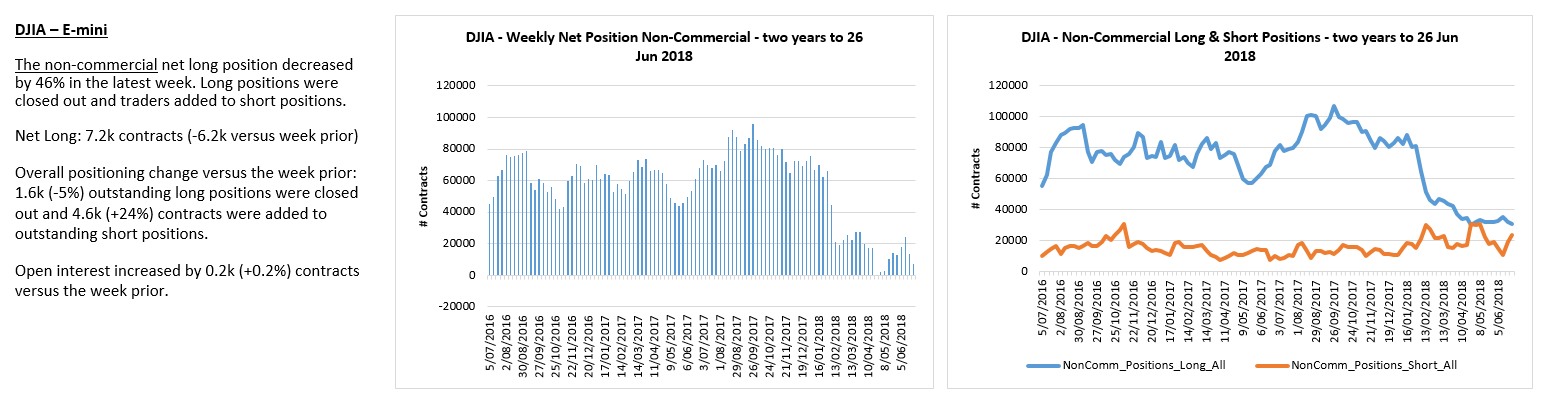
Traders remain net long but shorts are increasing.

The Dow shows the same bull/bear structure potentials as the SPX but relatively weaker given its exposure to potential trade wars and rising US$.
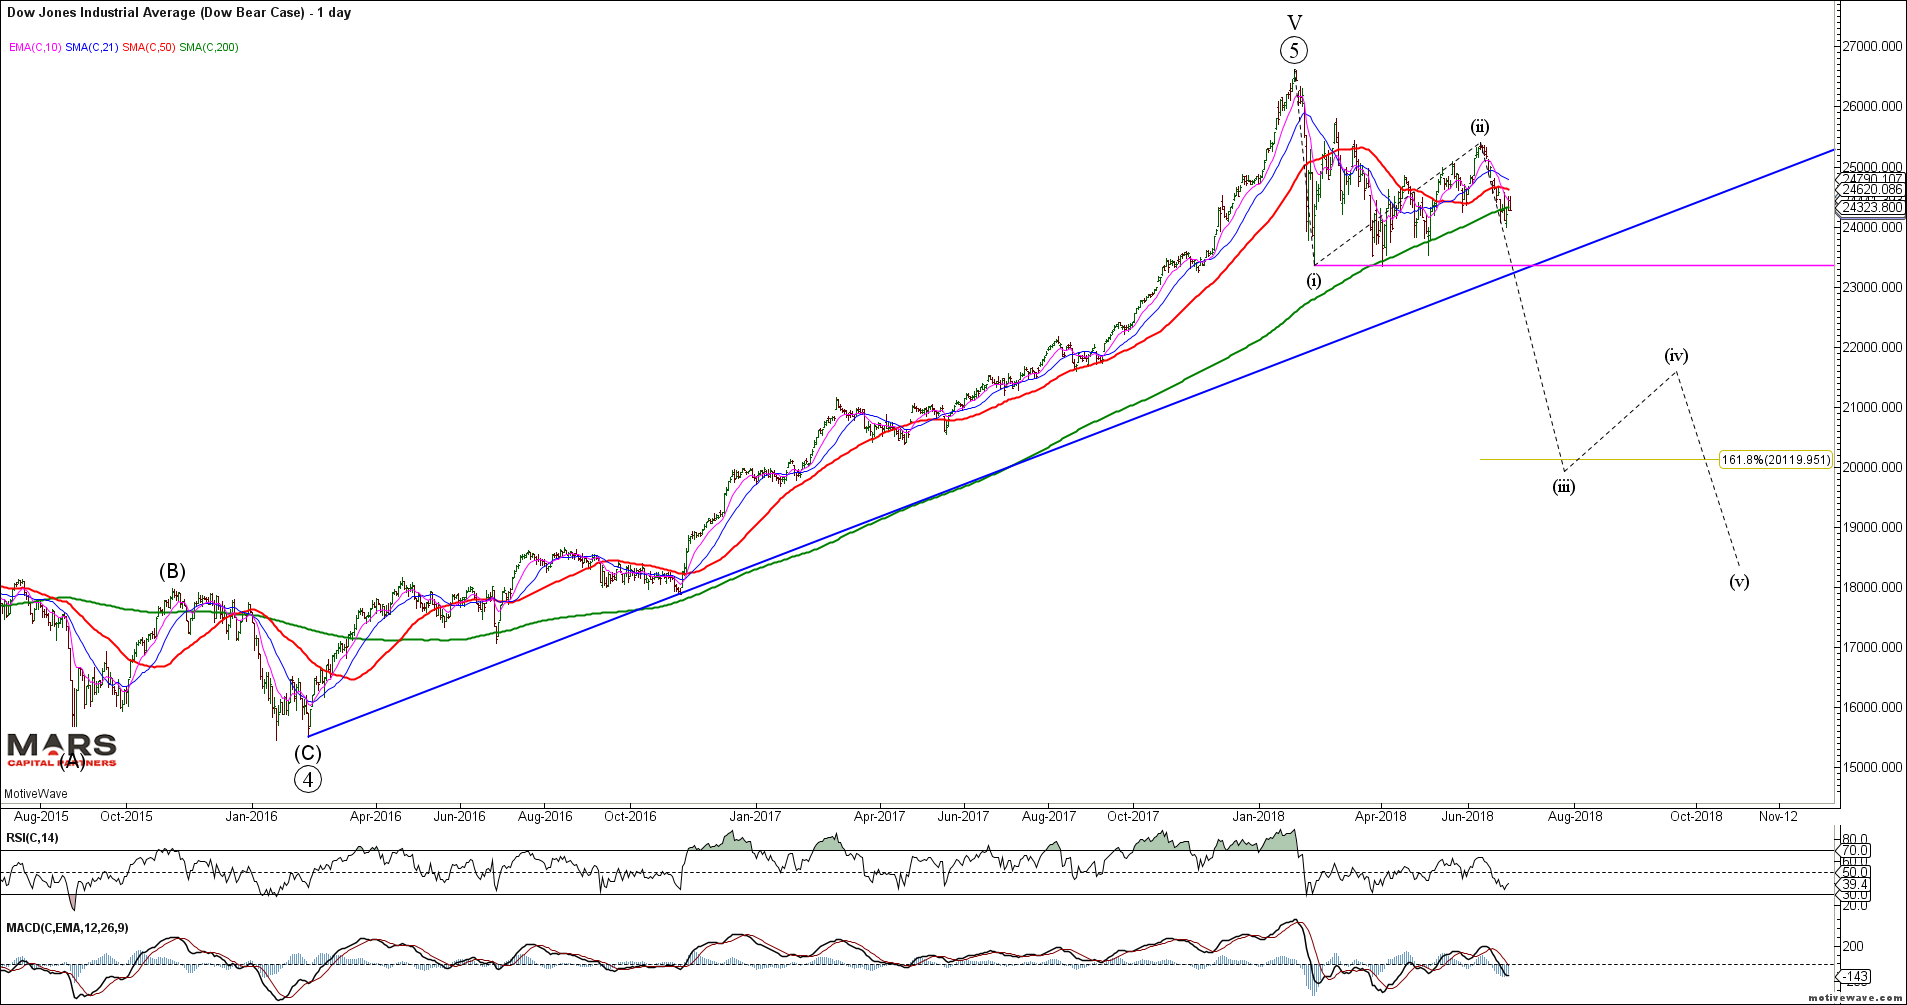
Dow Bear Case Daily
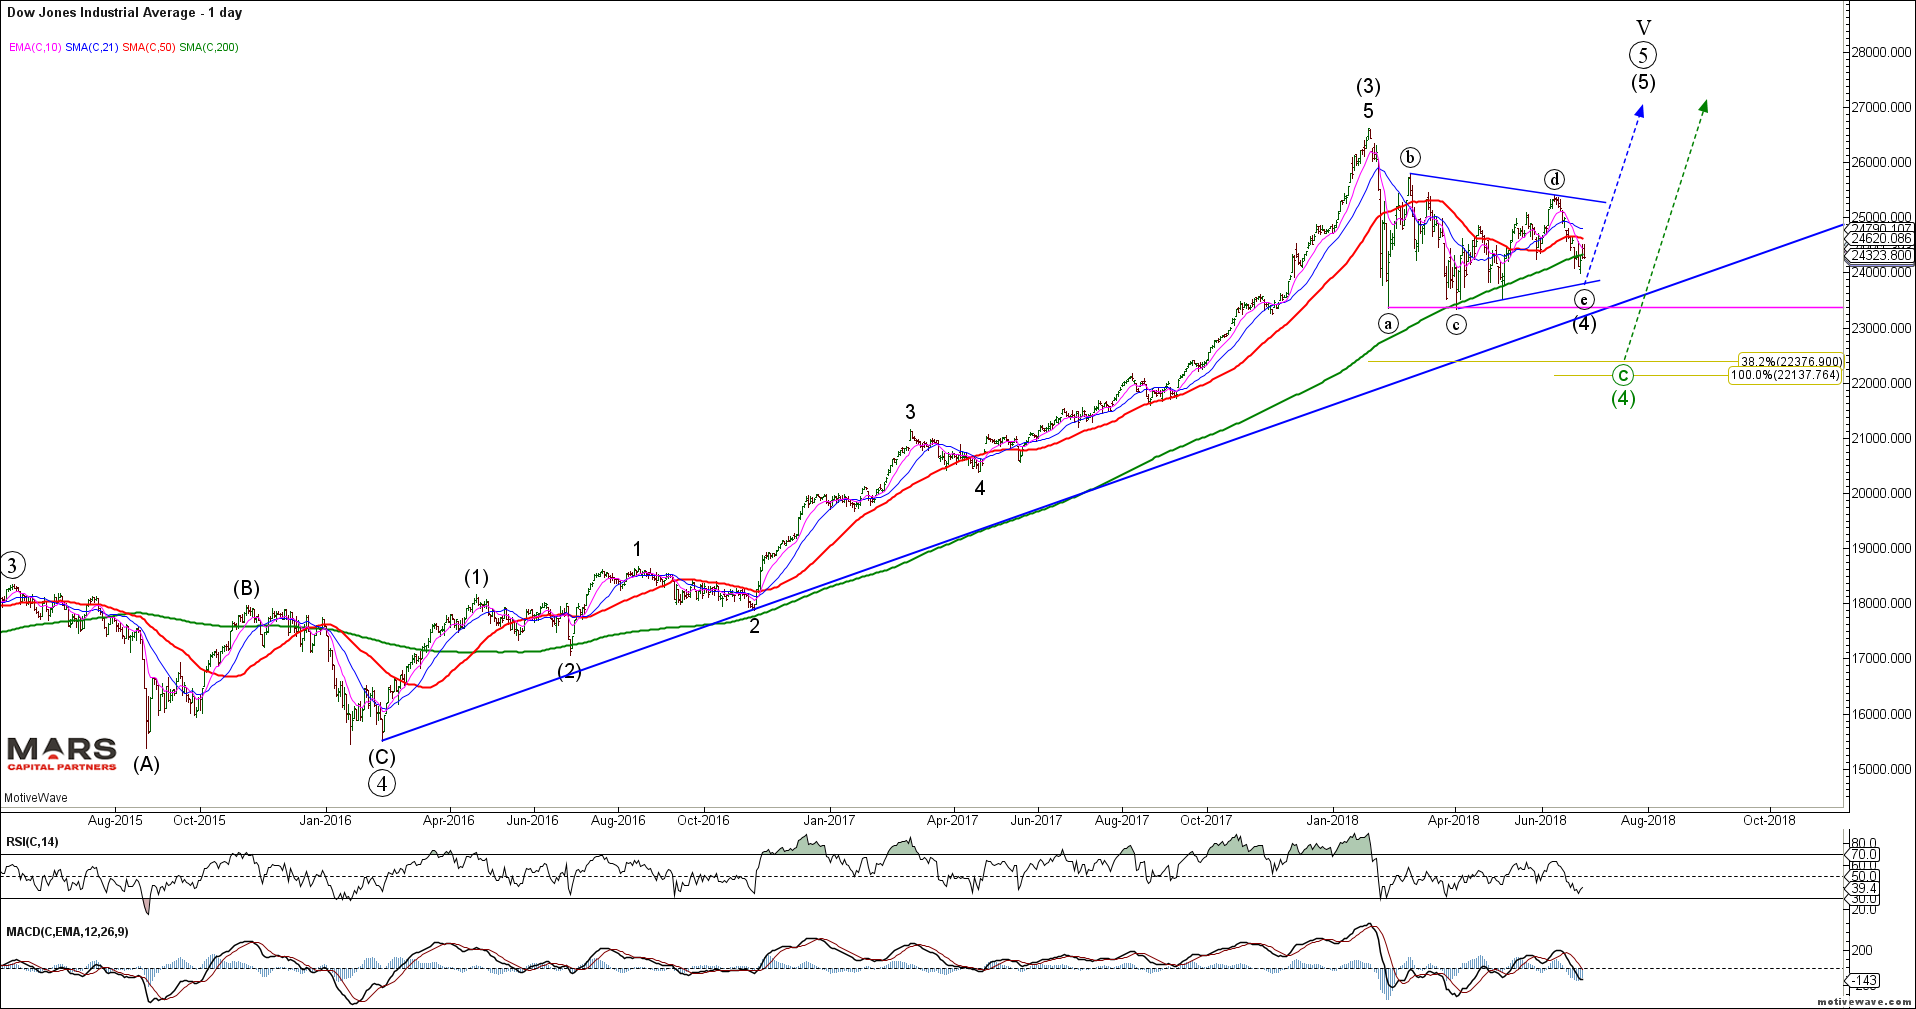
DJIA Bull Case Daily
The Dow futures (YM) remain range bound within a contracting triangle. While we could see a near term counter-trend rally towards 24500-868, we remain bearish looking for a break of the February lows. Trade back above the June highs invalidates this bearish count and likely sees a test of the ATH’s.
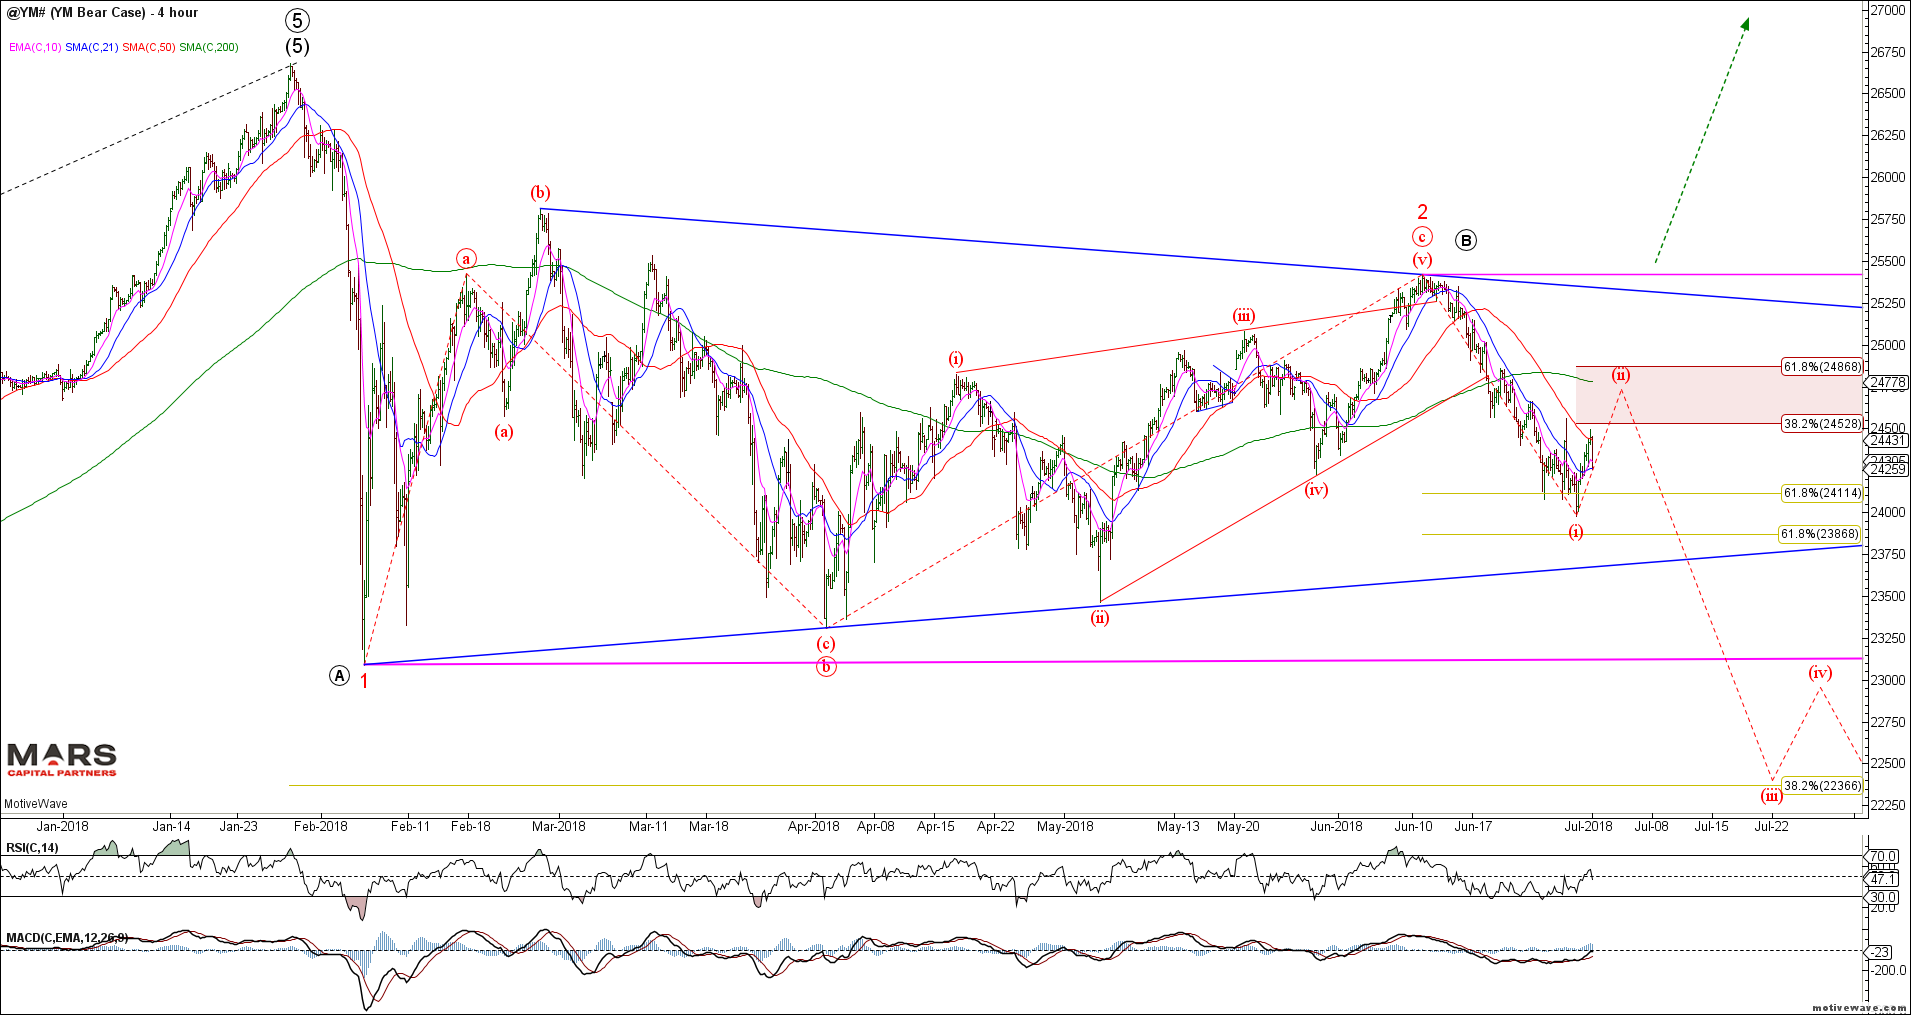
YM H4
Shorts increasing at the low end of the trading range.
Importantly, as highlighted last week, the Nasdaq indices (NDX/Comp) now have enough waves in place to complete its rally from the 2016 lows – new ATH’s have not been confirmed by momentum and we now have a small degree impulsive decline signalling a change in trend to down. Wave 5 thrusts from wave 4 Triangles are ENDING moves. We are now bearish the Nasdaq Indices against recent swing highs. Bears need to break strong support at the rising trend line and 200 day sma around 6600.
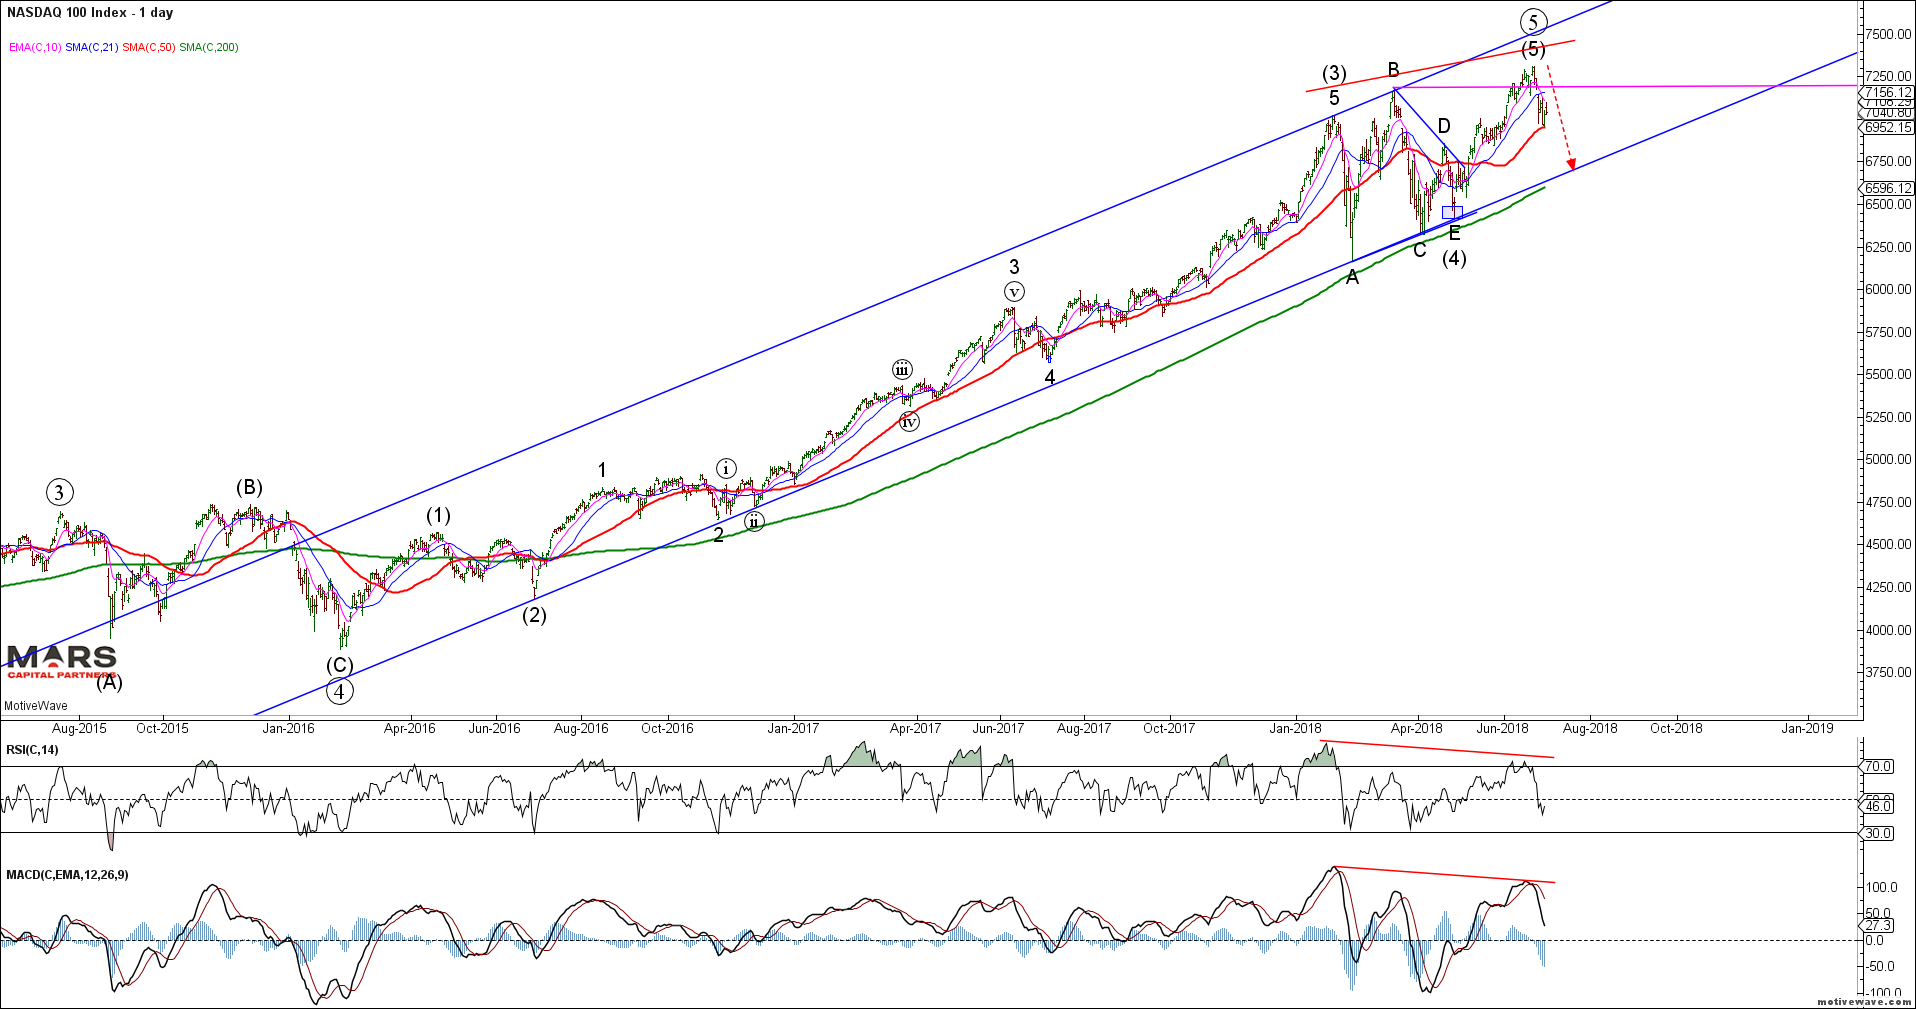
NDX Daily
The near term NDX count now shows an impulsive 5 wave decline from recent highs (signifying a near term change in trend to down) followed by a bounce off the 50 day sma. We would expect any counter-trend rally to terminate in the 7130-7200 resistance area before turning lower once again to break the 50 day sma (6950). The bears then need to break strong support that resides in the 6600 area of the 200 day sma to continue its impulsive 5 wave decline shown below. The near term bear case is wrong above the June highs.

NDX H2
NQ shorts increasing off cycle lows.
Like the Nasdaq, the Russell 2000 (IWM) looks to have completed its 5th wave triangle thrust to new ATH’s potentially ending the rally since 2016. Last week’s decline into the 50 day sma appears impulsive so we should expect further downside next week that targets the 200 day sma as strong support. Note that momentum peaked back in October 2017. We need to see a strong impulsive decline that breaks trend support to signify a bigger picture change in trend.
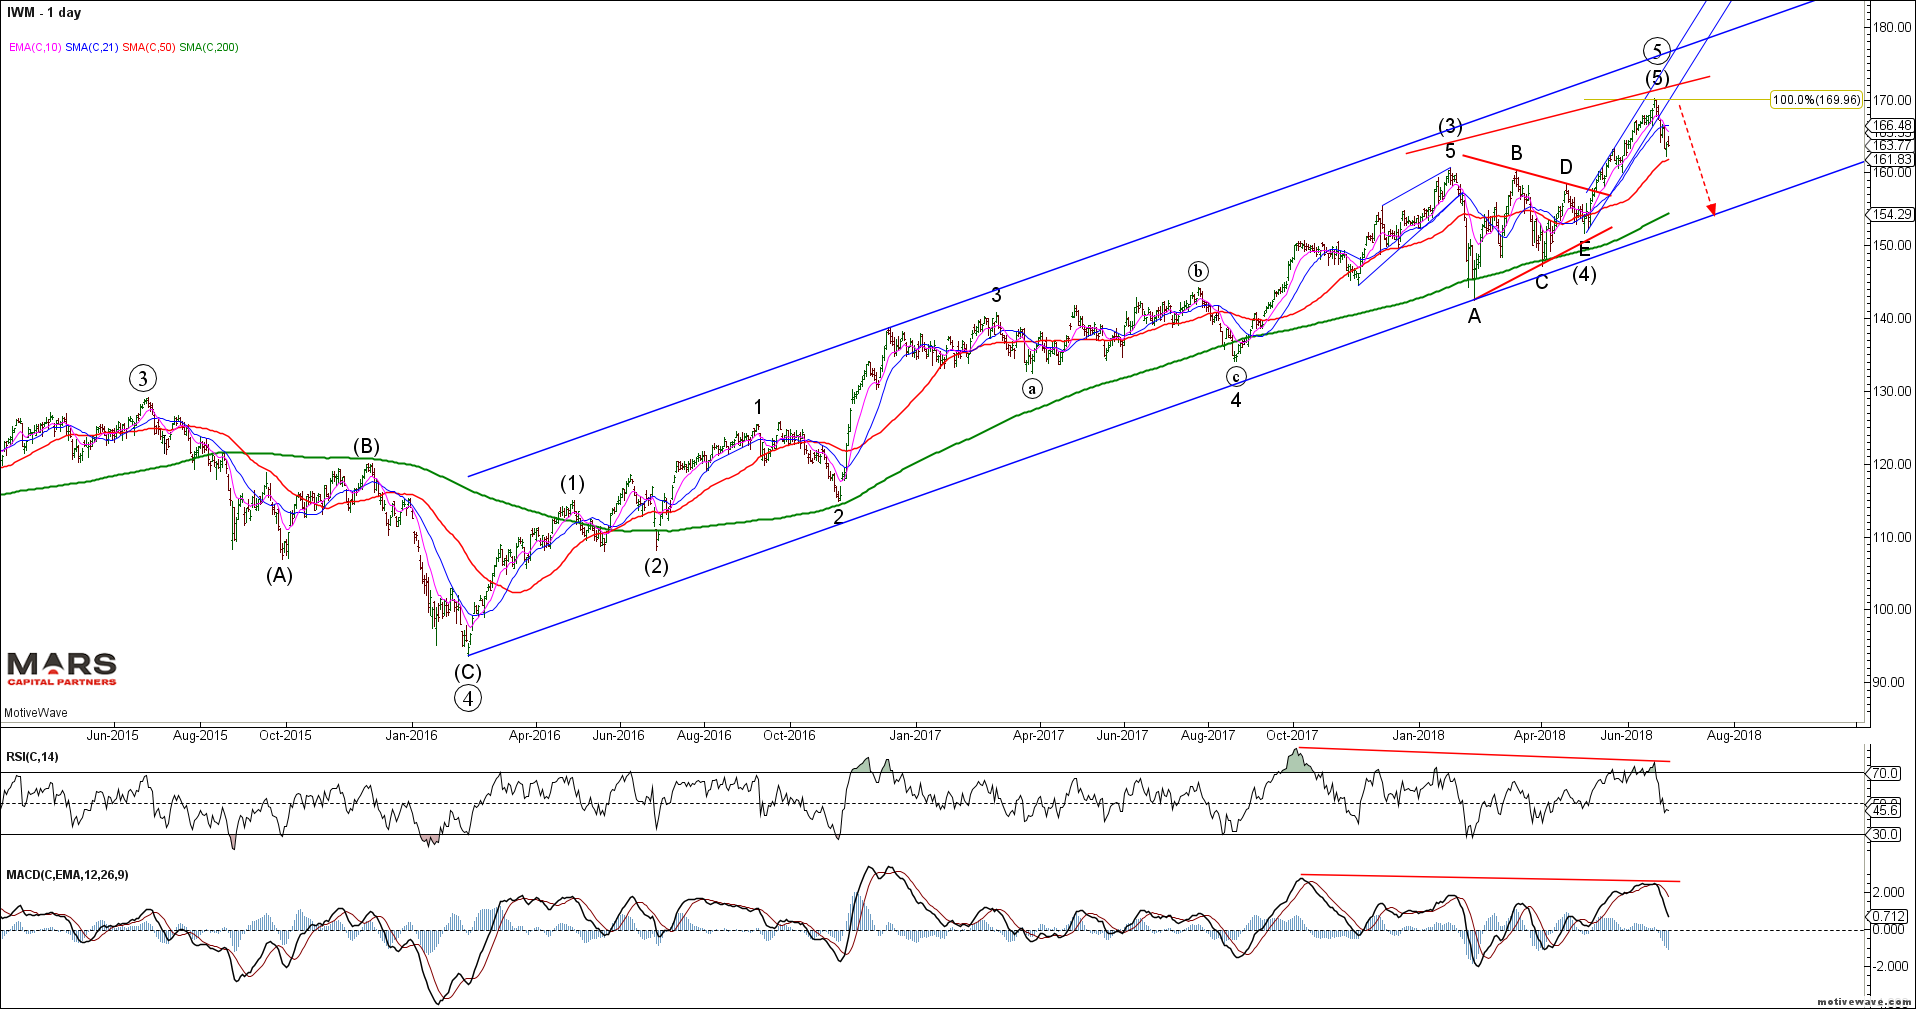
IWM Daily
Interestingly, the IWM formed a monthly “shooting star” candle that requires downside follow-through next week to confirm the potential top… the Russell formed the same top in June 2015 as highlighted below.
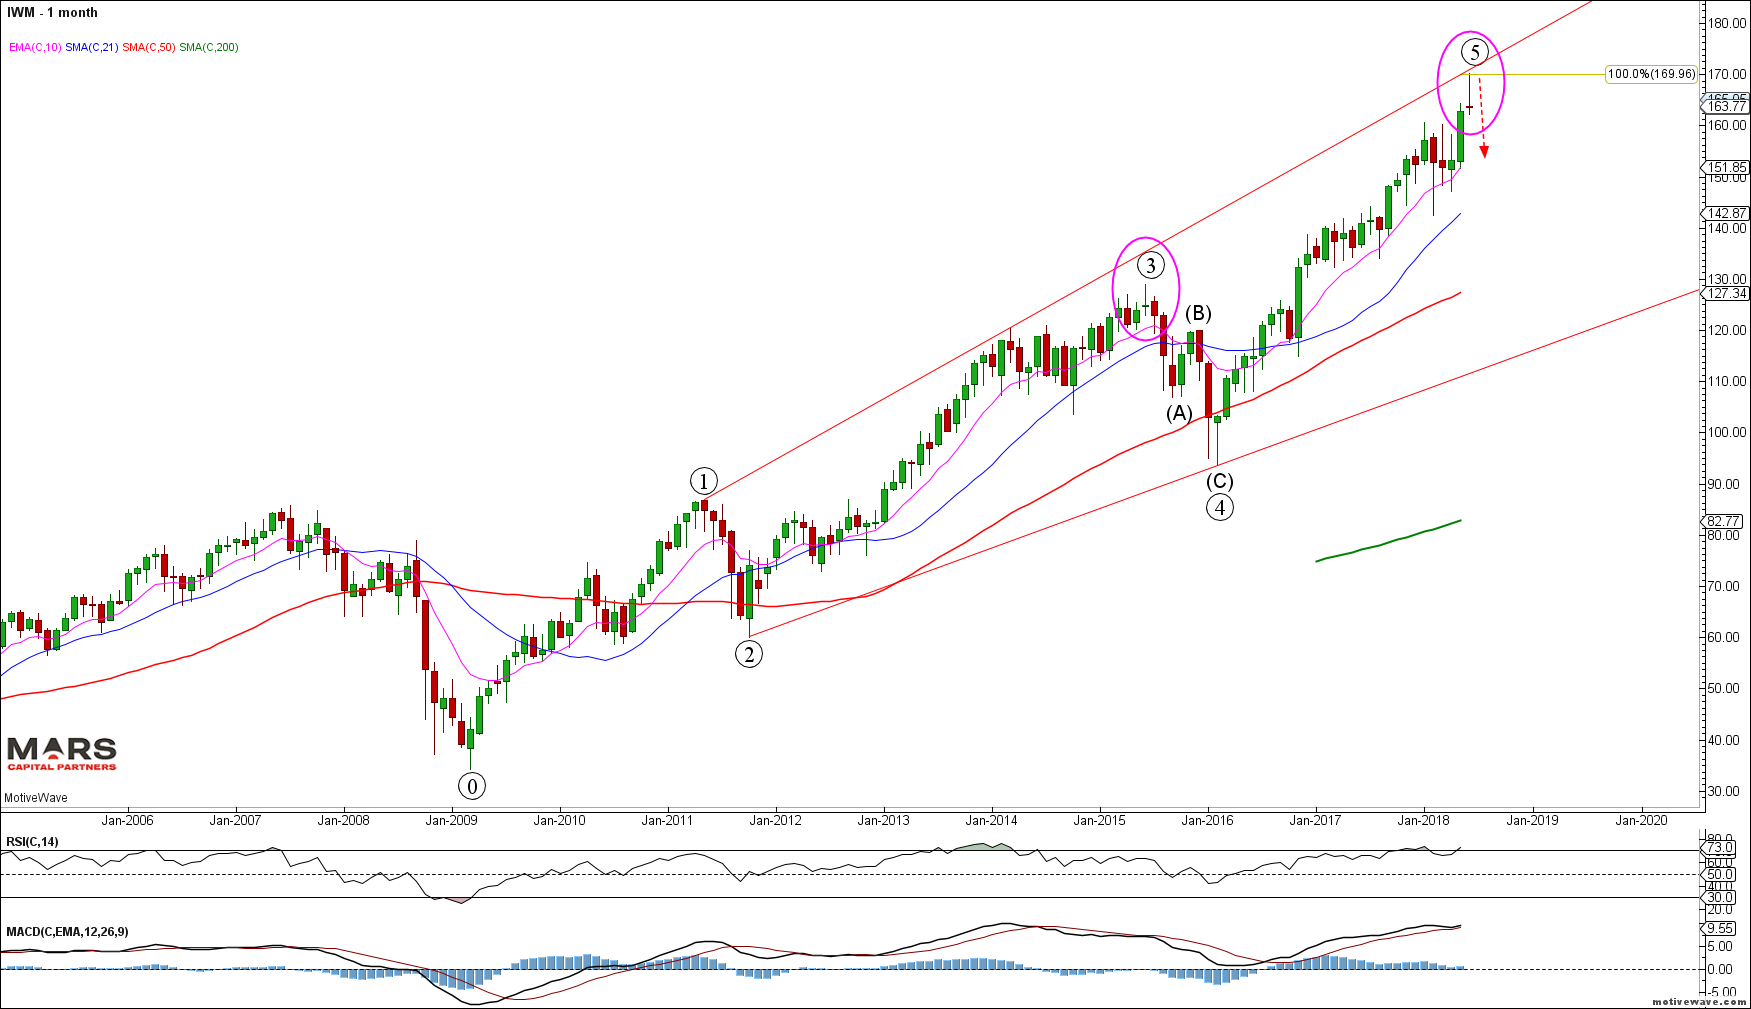
IWM Monthly
The near term RTY count shows a completed 5 wave rally into new ATH’s followed by a small degree 5 wave decline into the 50 day sma support. Expect any counter-trend rally to find strong resistance in the 1675-90 area as we look for this market to turn down next week. The near term bear case is wrong above the June highs.
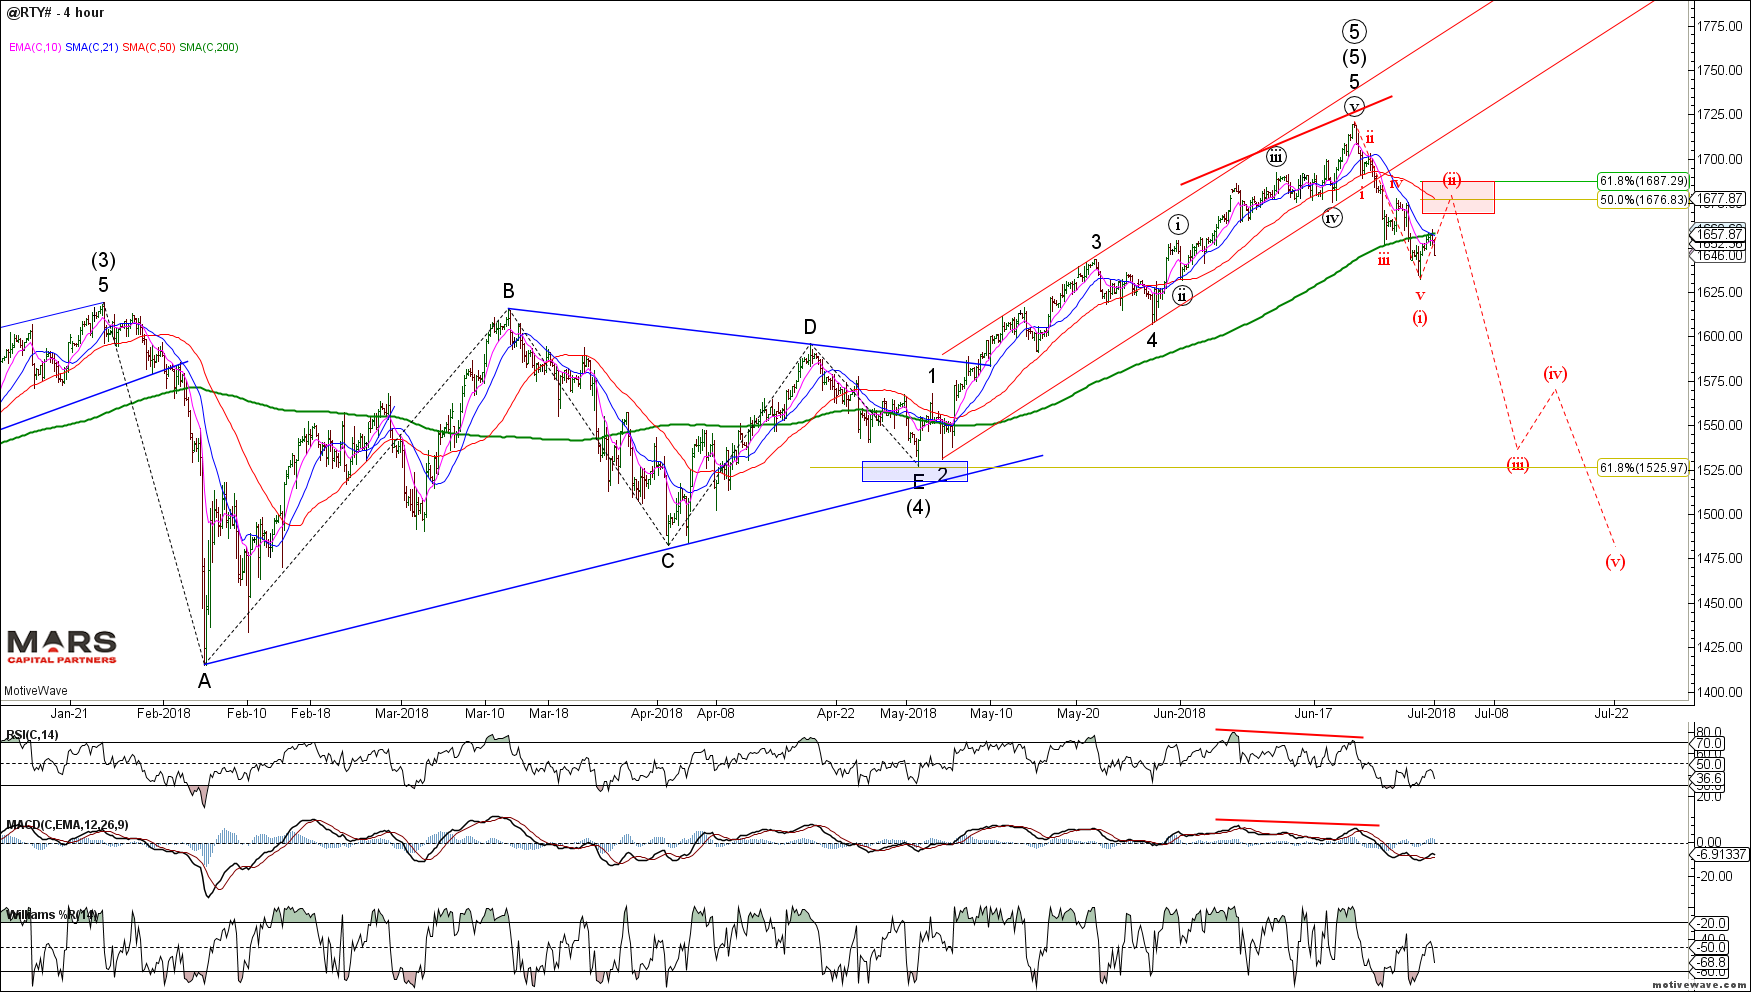
RTY H4
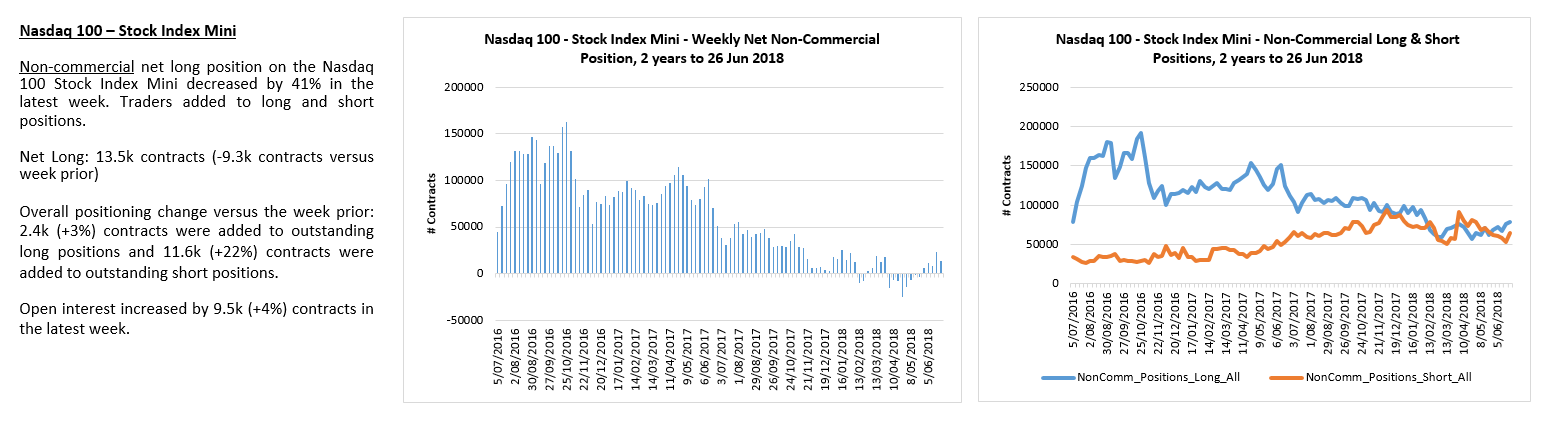
RTY traders remain very long at the highs – no shorts to be found

The DJ Transports continued to decline from our upside targets as expected. A break below 10000 likely targets 9500 (for green wave (c)) or potentially much lower towards 8500-8750 for wave (iii).
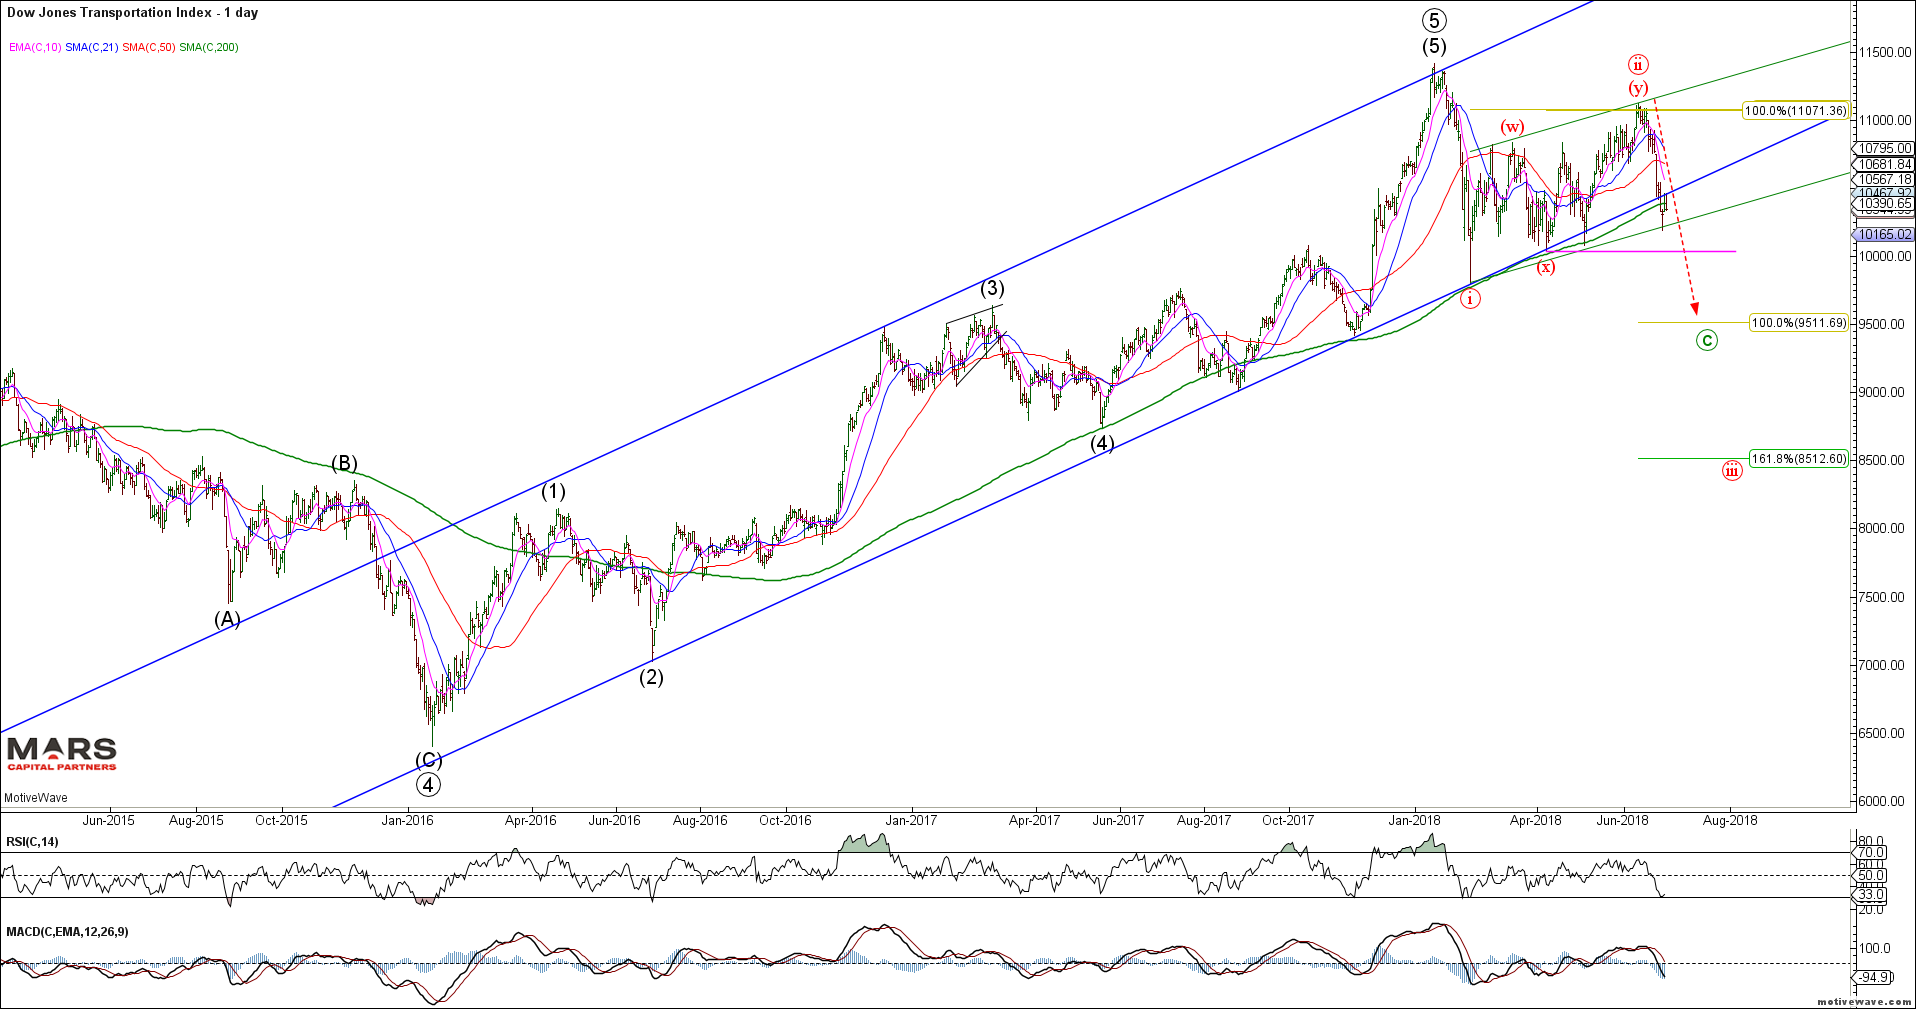
DJ Transports Daily
The Banks (BKX) continue to hold shelf support but are threatening to break down – still trading heavily (now below the 200 day sma) and warning of further downside to come.
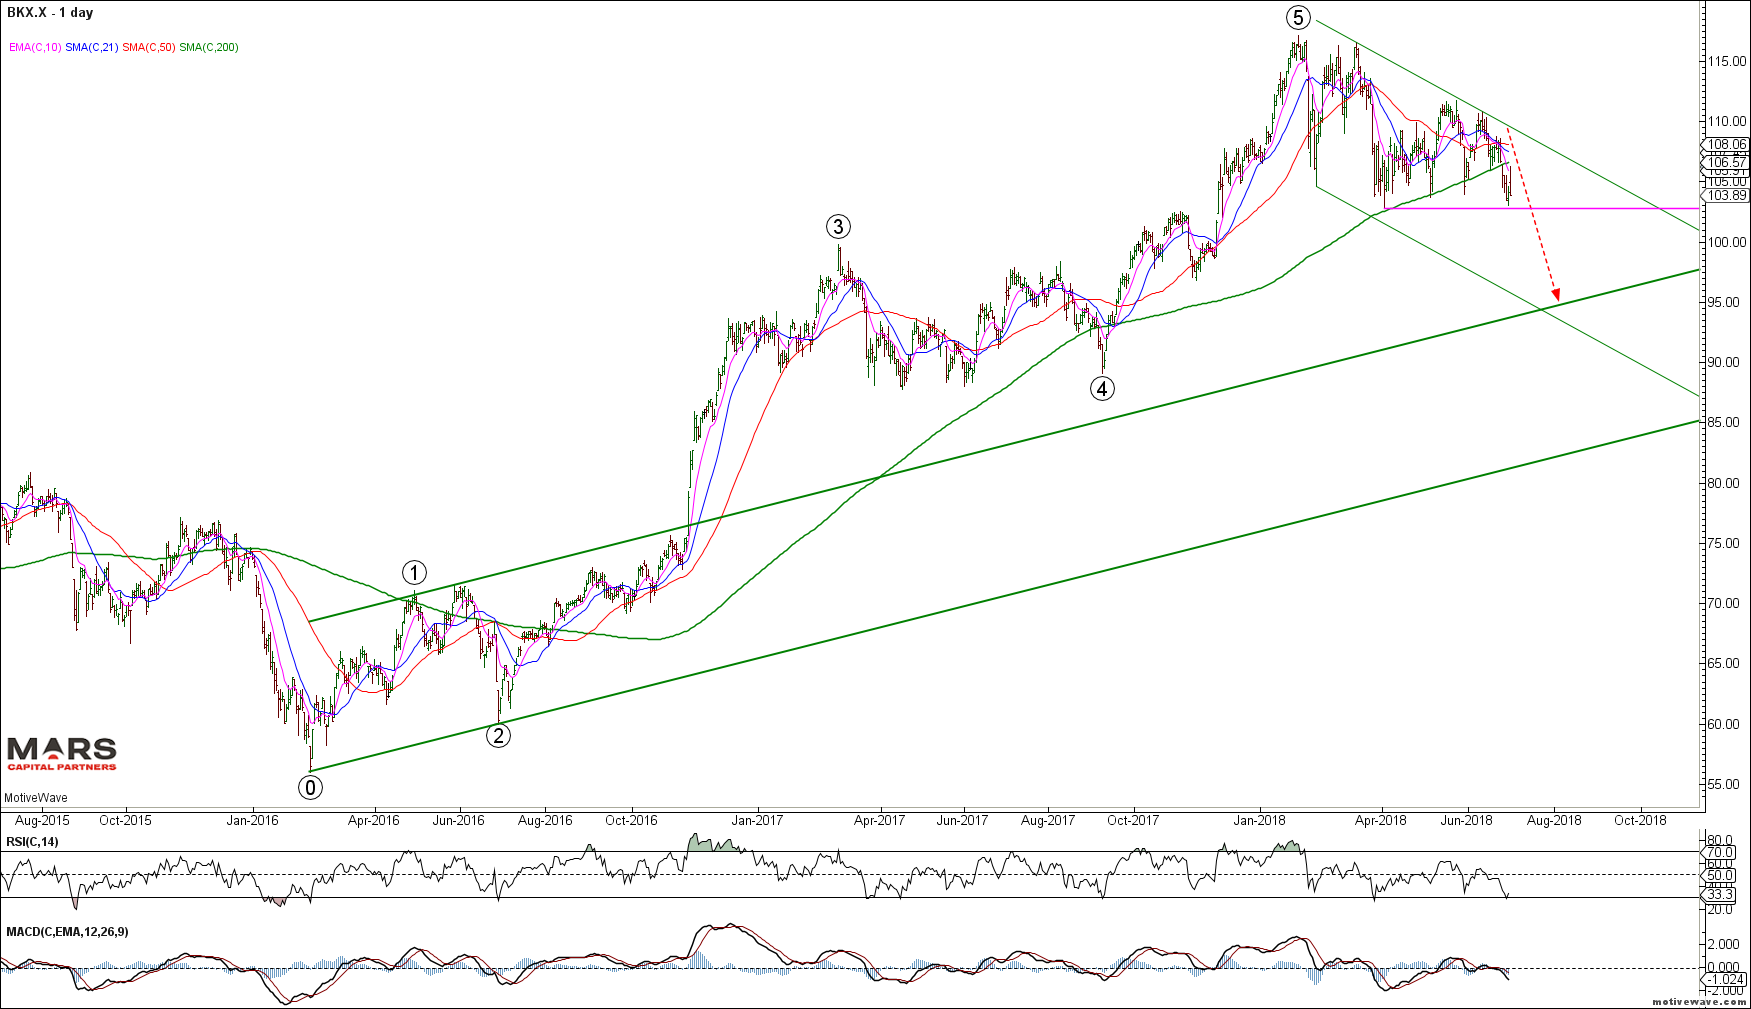
BKX Daily
We continue to be bullish the VIX / VXX against the June lows as volatility compression leads to expansion. Note the bullish momentum divergence at recent swing lows which supports our outlook for lower equity prices – is this the calm before the storm?
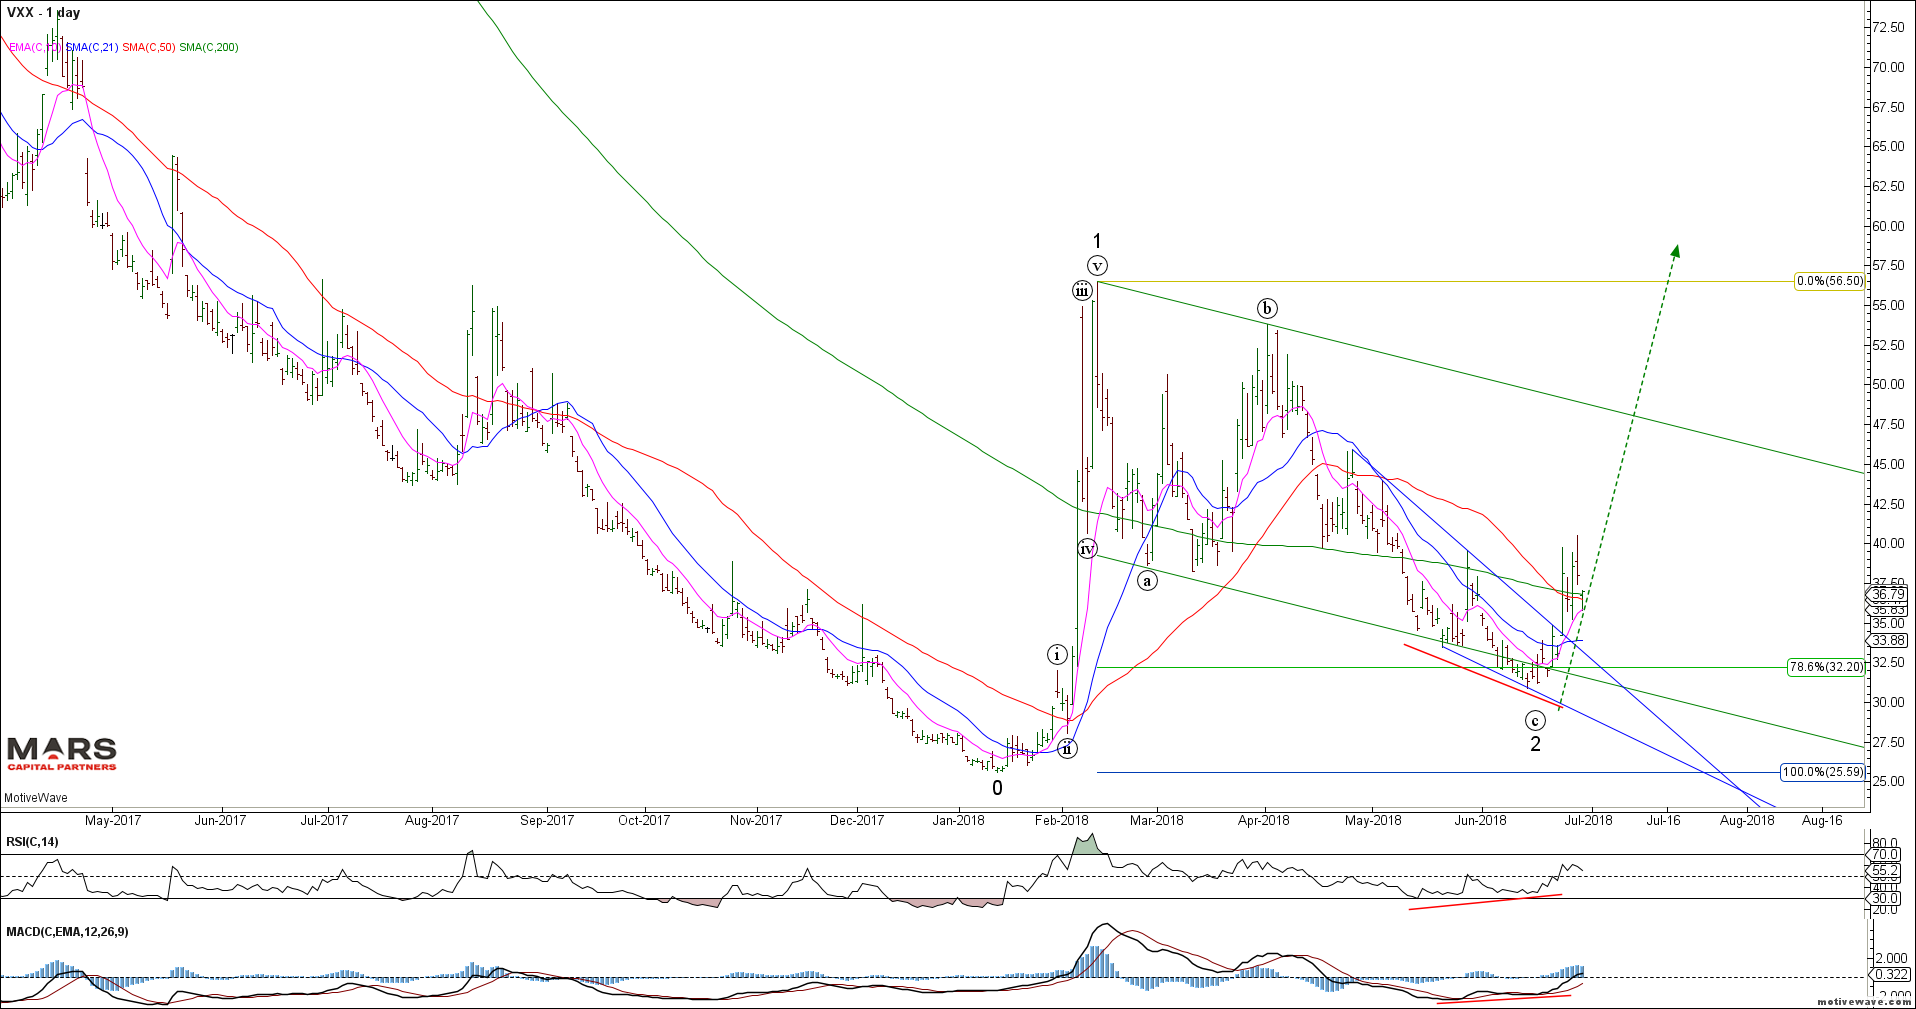
VXX Daily
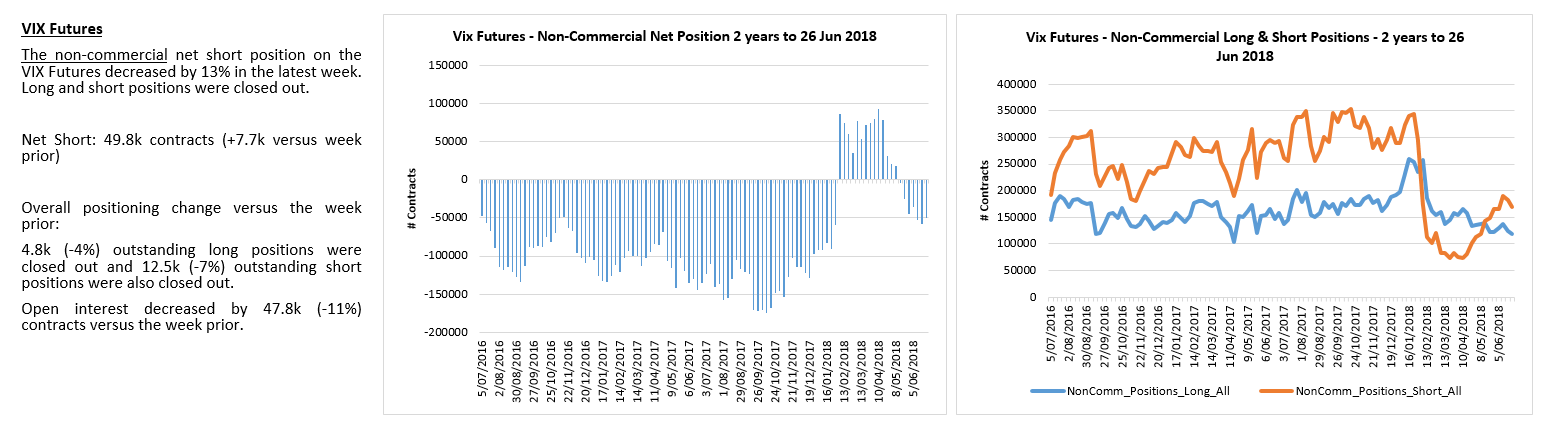
VIX traders are very short again…
As highlighted in last week’s update, AAPL may be our canary in a coalmine as June’s rally to new ATH’s has not been confirmed by momentum and we are starting to see evidence of a bearish reversal near term. AAPL’s worst fear is China disrupting its supply chain as a result of increased trade wars at a time when phone sales are slowing globally. Unintended consequences…
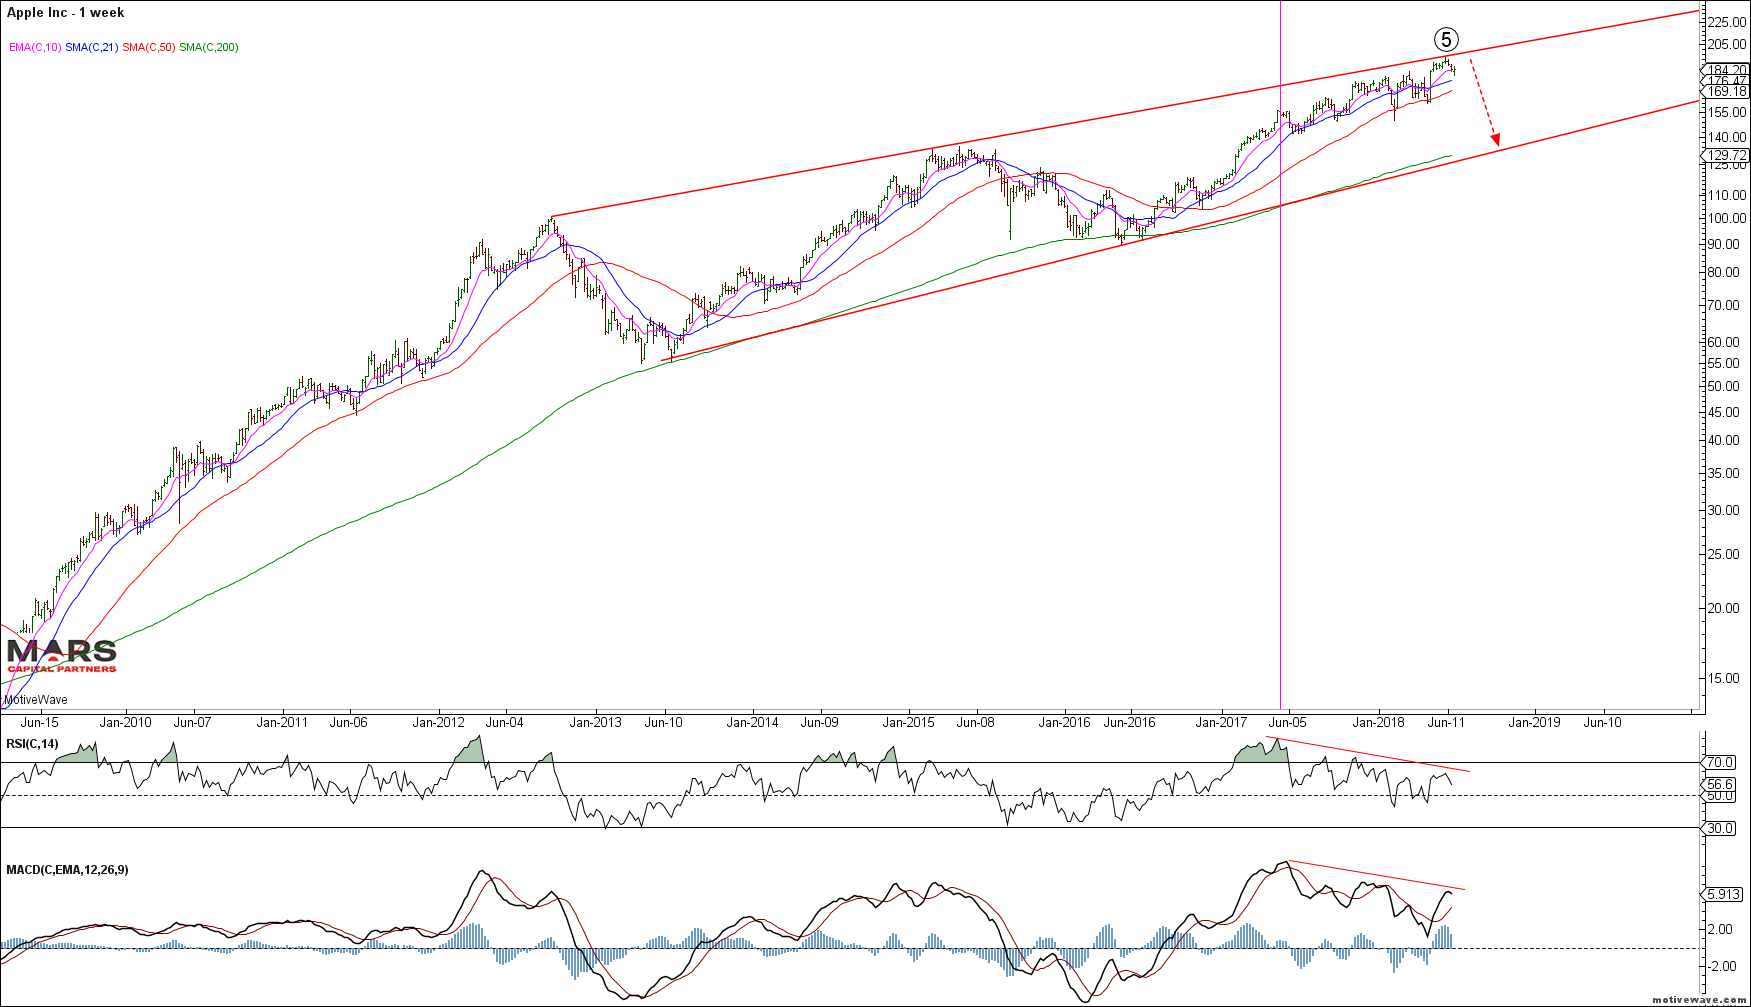
AAPL Weekly semi-log
To the global equity markets and we appear to be forming broad based tops throughout as highlighted by the ASX200 (SPI futures) which looks particularly vulnerable to a significant turn lower as we wedge into recent highs. Once again, note the recent momentum divergence at the highs. We are now looking for evidence of a bearish reversal in this market.
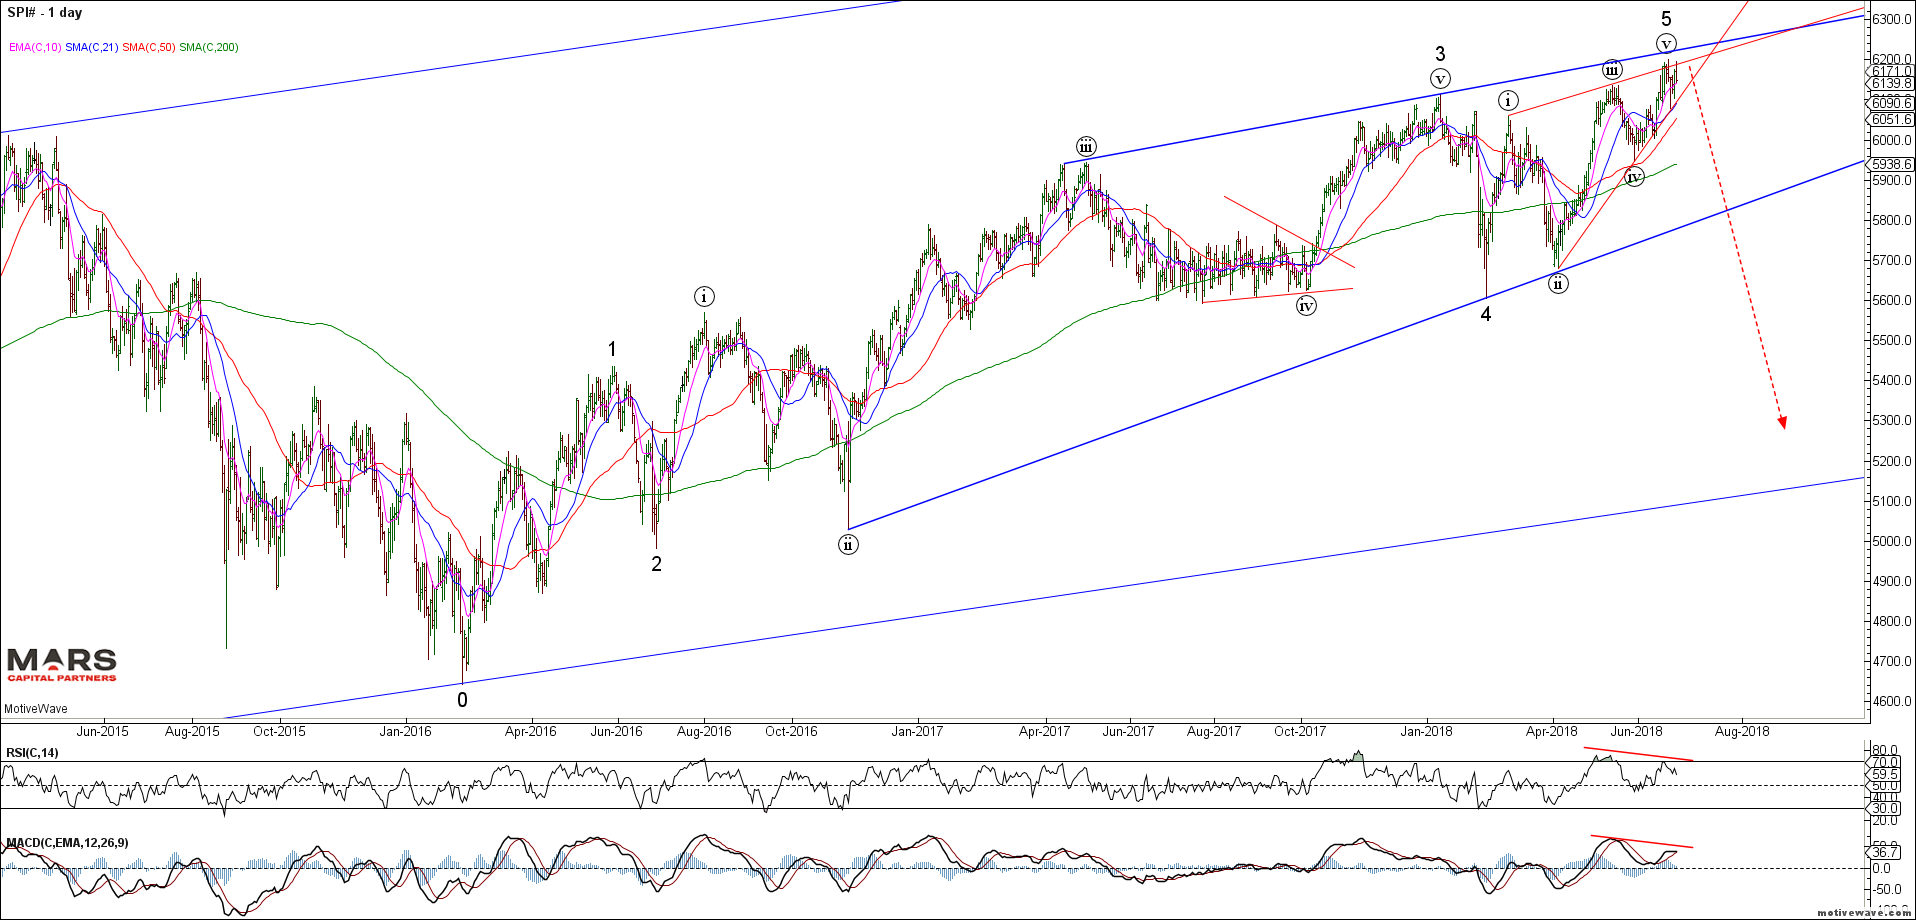
SPI Daily
We have been correctly bearish the European indices and in particular the CAC40 with the expectation of automotive tariffs and faltering banking system. We appear to be in a broad based topping pattern and while we may see a near term counter-trend rally we remain bearish against the 5555 highs as we look for a retest of the February lows. Trade back above 5555 likely sees marginal new cycle highs but this rally from the 2016 lows can be counted as complete with bigger picture risks to the downside. A push to marginal new cycle highs would likely be a gift for shorts.

CAC40 Daily
The FTSEMIB continues to show clear warning signs for the European markets after completing almost 10 years of range trading. Last month’s bearish reversal from key resistance is emblematic of the downside risks facing Italy right now. Bearish.

FTSEMIB Weekly
To the Bond markets and the TLT remains bearish from a bigger picture perspective having established a long term top in July 2016. Near term, we remain range bound as the counter-trend rally stalled out at the obvious 122.50 shelf resistance. We are now flat following the rally from the 116 lows. While we may see near term weakness, the intermediate structure continues to look higher towards the 61.8% Fib and 200 day sma (124.50-125) resistance zone. The bigger picture trend is down but ideal sell zones remain higher.
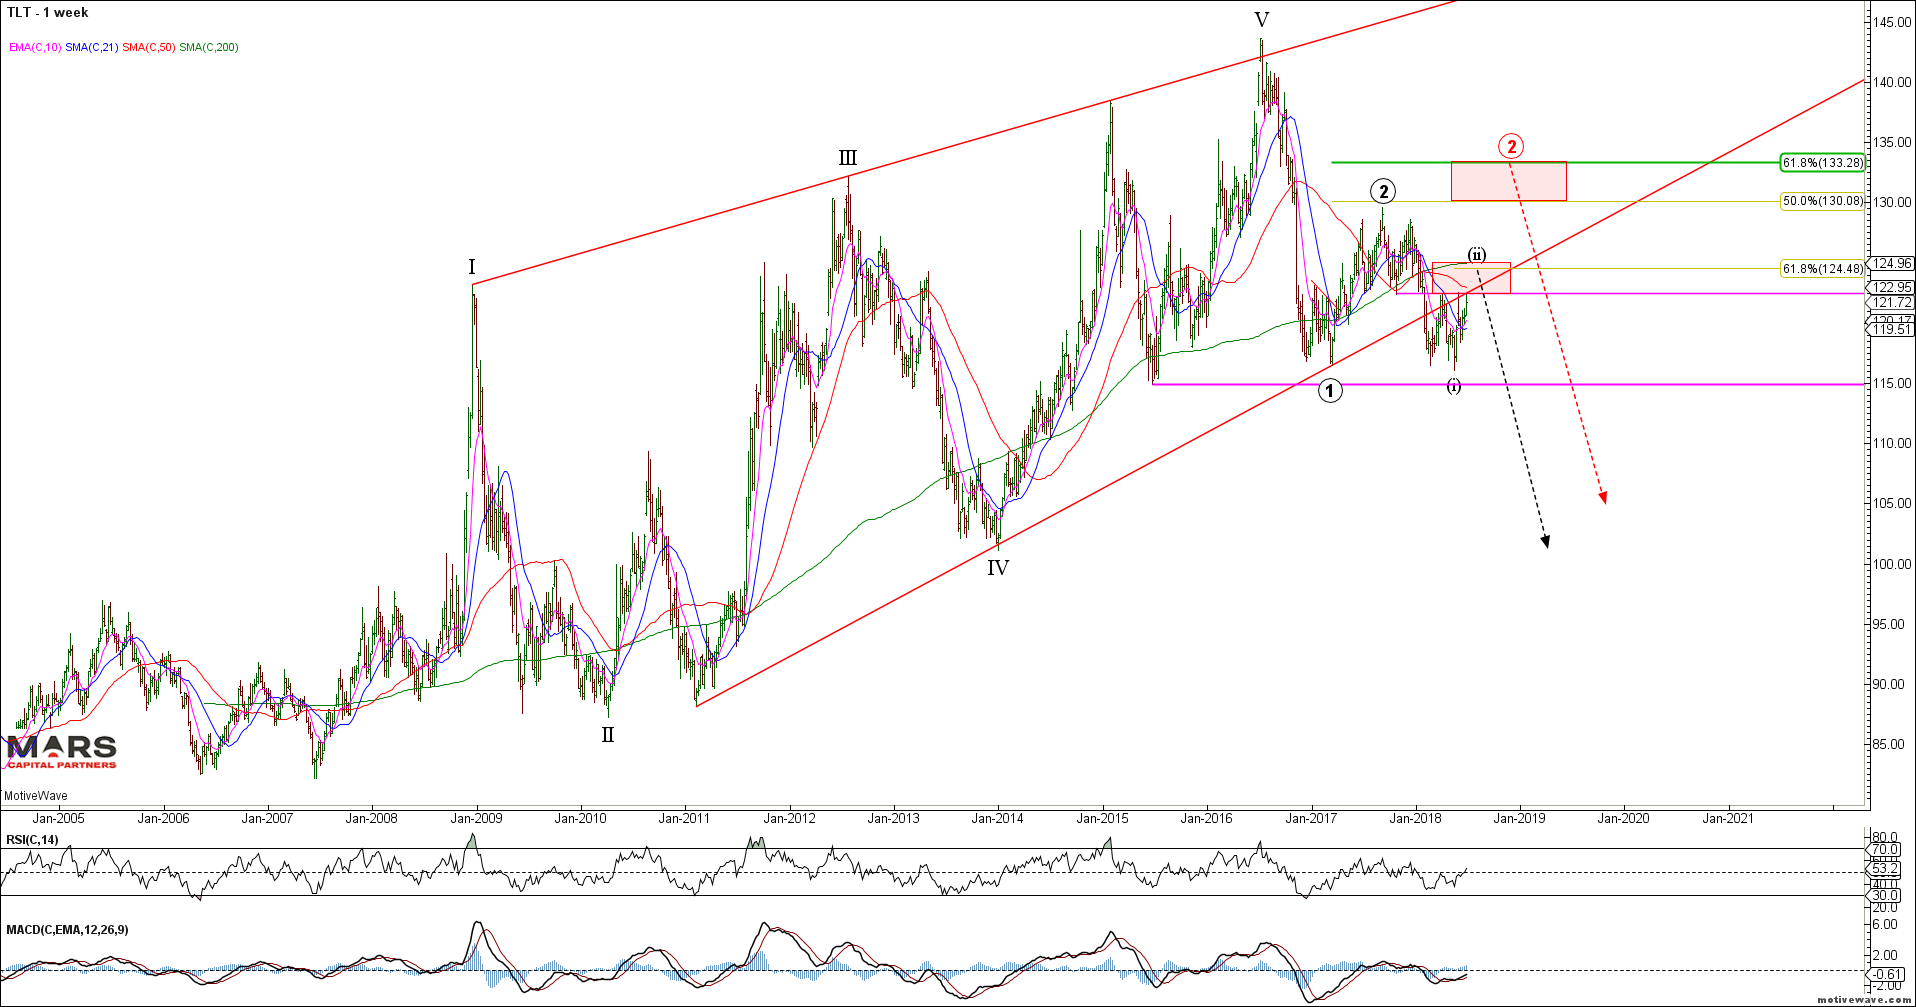
TLT Weekly
The long bond ZB futures show a completed 5 wave decline from the September 2017 highs. We are looking for a counter-trend rally to retest 147’00 resistance and potentially push through to 149 before turning lower again. We are flat bonds looking to short from higher.

ZB Daily
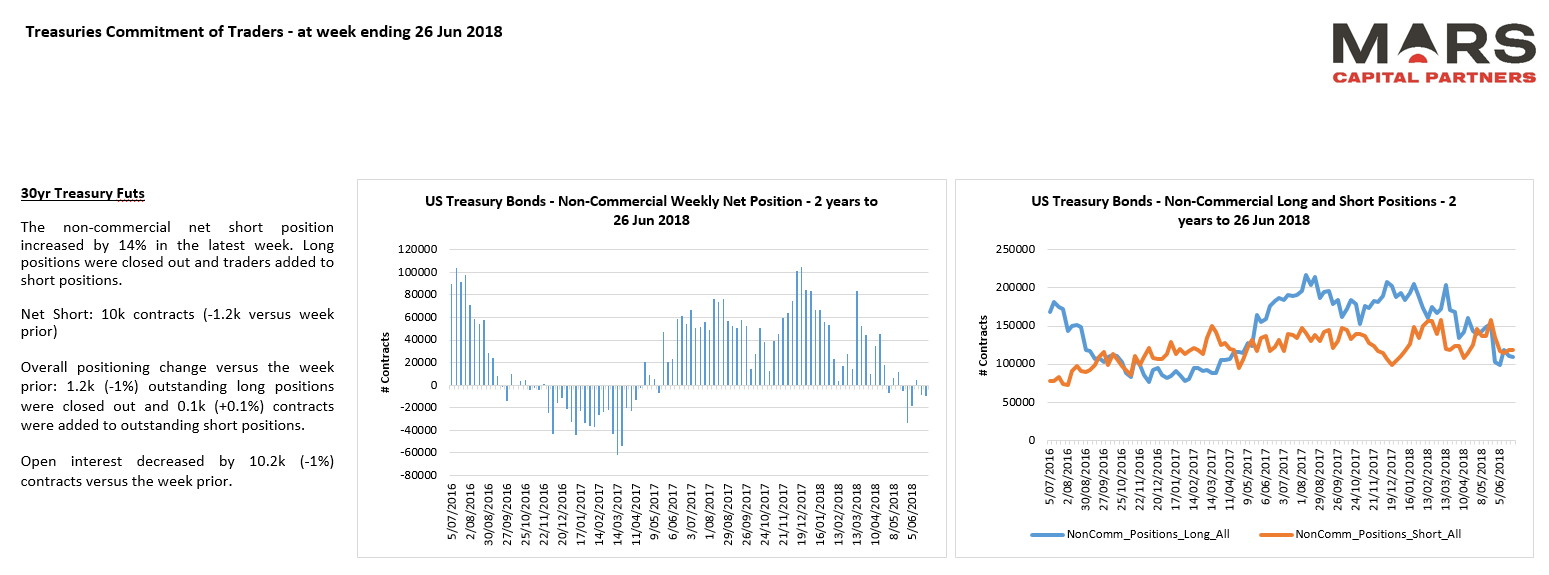
Long bond traders remain flat in this range bound market.
As expected, the TY continues to climb a wall of worry but our sell zone targets remain higher towards 122’00-123’00.
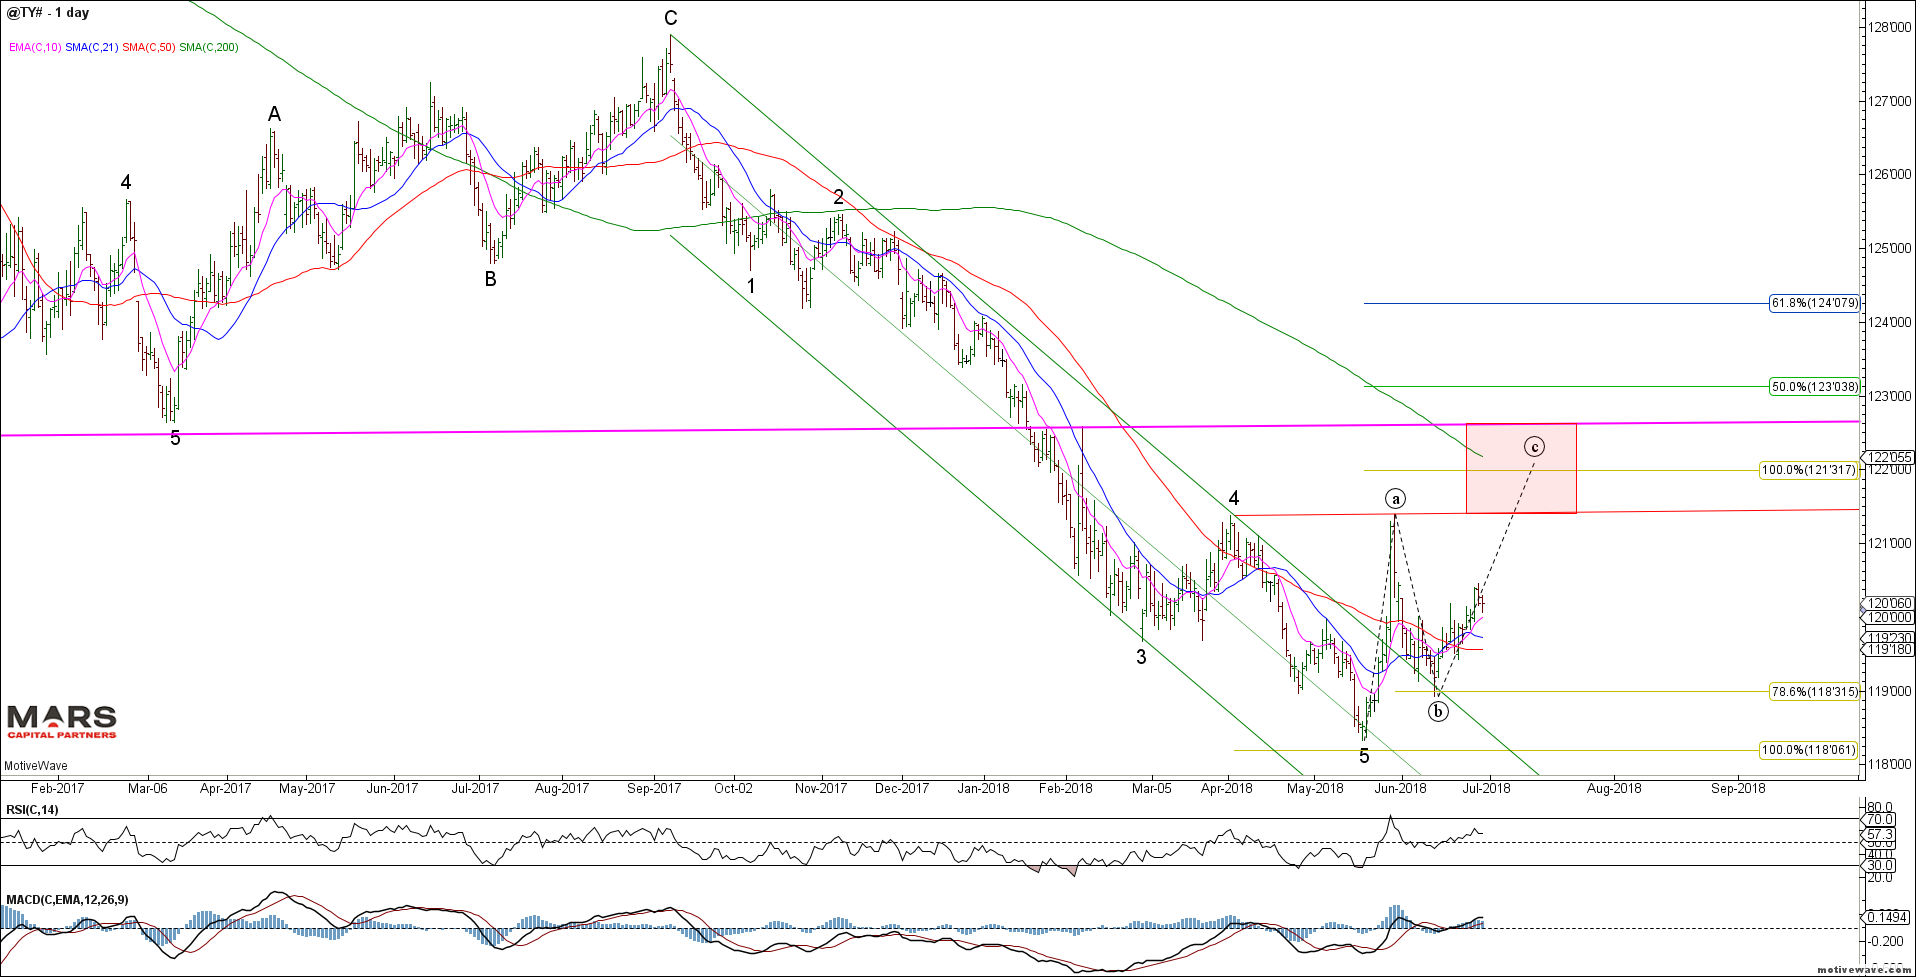
TY Daily
TY traders reducing both long and short exposure while remaining net short.

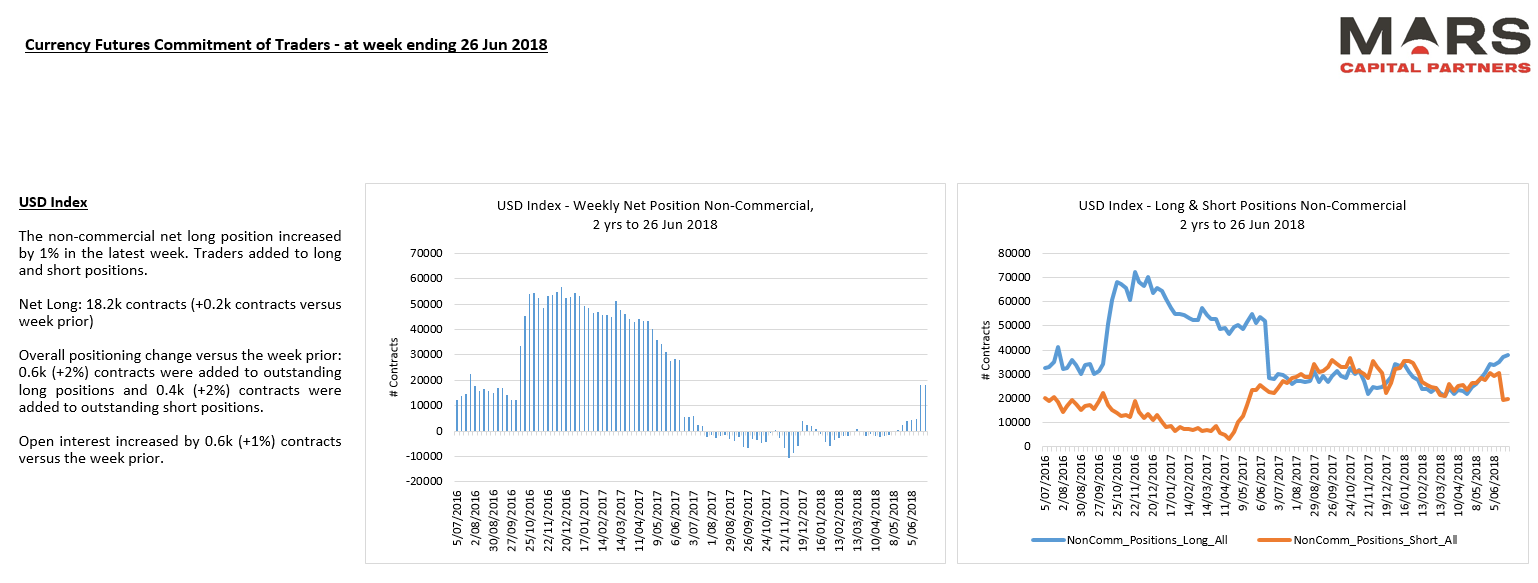
To the FX markets and the US$ appears extended to the upside and may have put in a near term top at 95 resistance to complete wave (v) of A/1. We remain strategically bullish the US$, but are near term defensive as we look for a counter-trend decline towards the 91-92.50 support area before the next strong wave higher can take hold.

DXY Daily
DXY shorts have capitulated while longs embrace the rally.
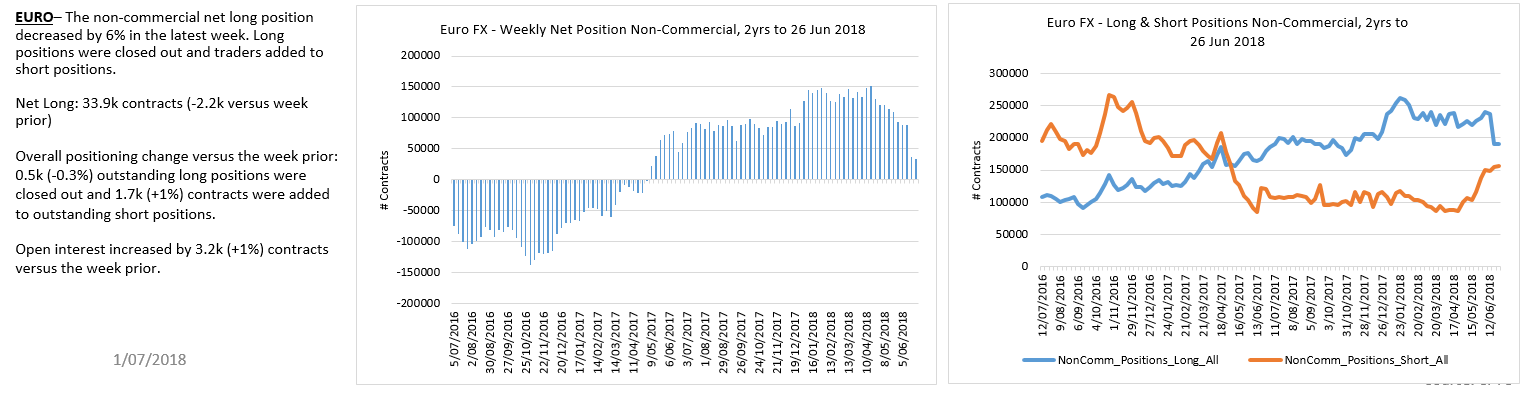
Similarly, we remain bearish the Euro from a bigger picture perspective. Near term, the Euro appears to be trying to hammer out a low at support after completing 5 waves down from the February highs. Ideally, we are looking for a counter-trend rally higher that terminates in the 1.20-1.21 area before the bigger picture Euro downtrend can reassert itself. Strong trade below 1.15 may trigger an extended decline but I’d be wary of shorting into the hole here.
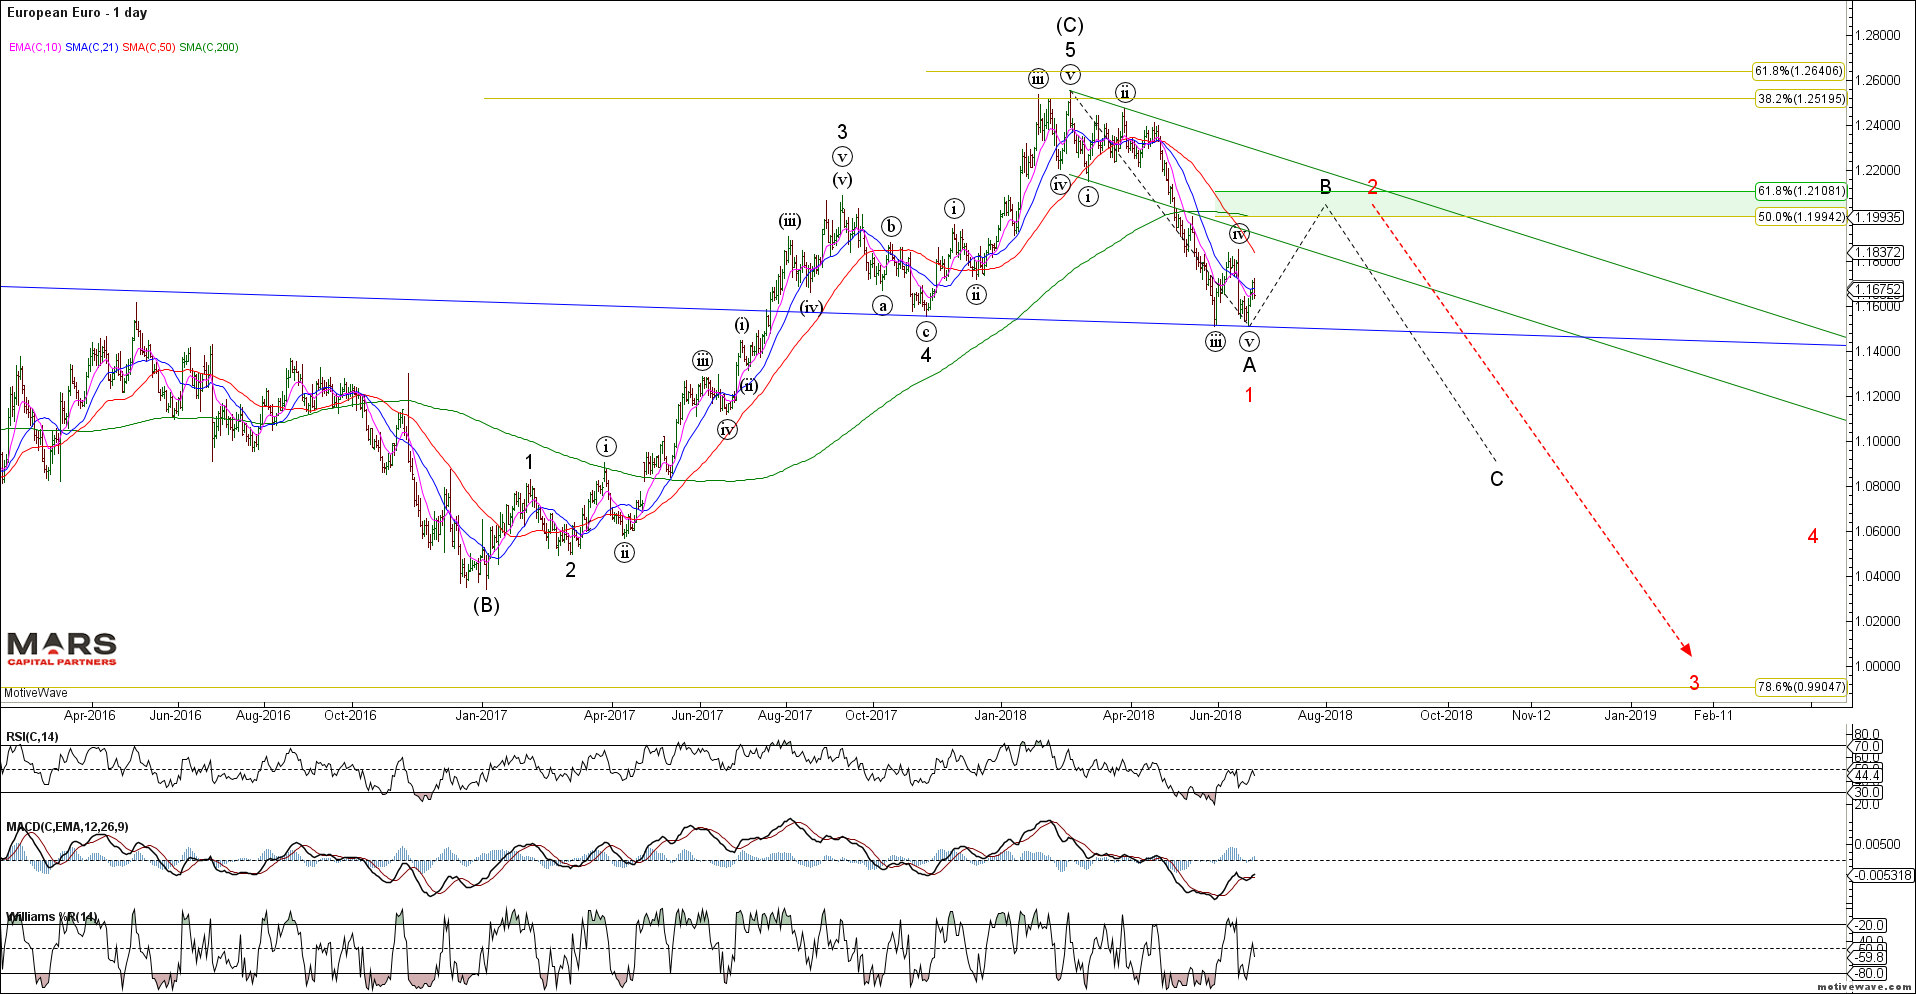
EURUSD Daily
Euro longs have capitulated while shorts press into the lows.
The USDJPY remains in a large triangle compression. This structure remains bullish US$ while 104.60 holds to the downside.
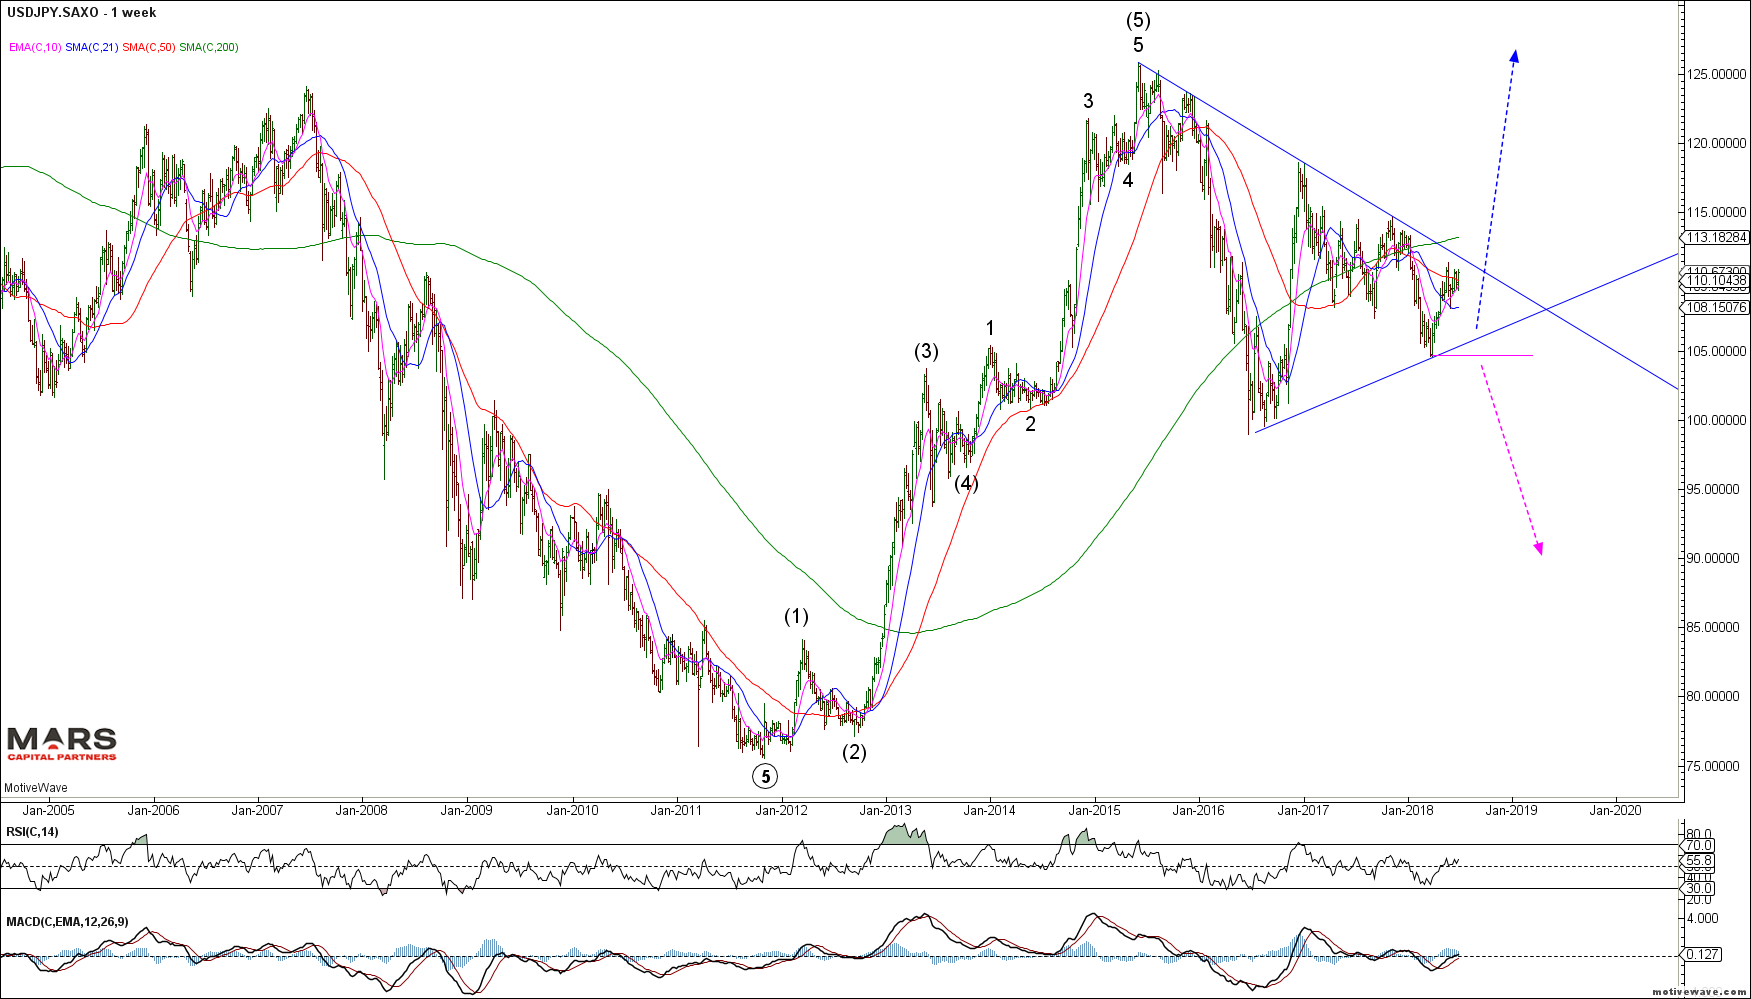
USDJPY Weekly
Near term, the USDJPY rallied from last week’s support zone keeping the bull trend in tact but I am wary of failure here in the 111.00-50 resistance area for a wave (b) high. The structure would look best with a wave (c) decline back towards our 107-108 buy zone against the 104.60 lows. This would be more consistent with our overall views of near term US$ weakness.
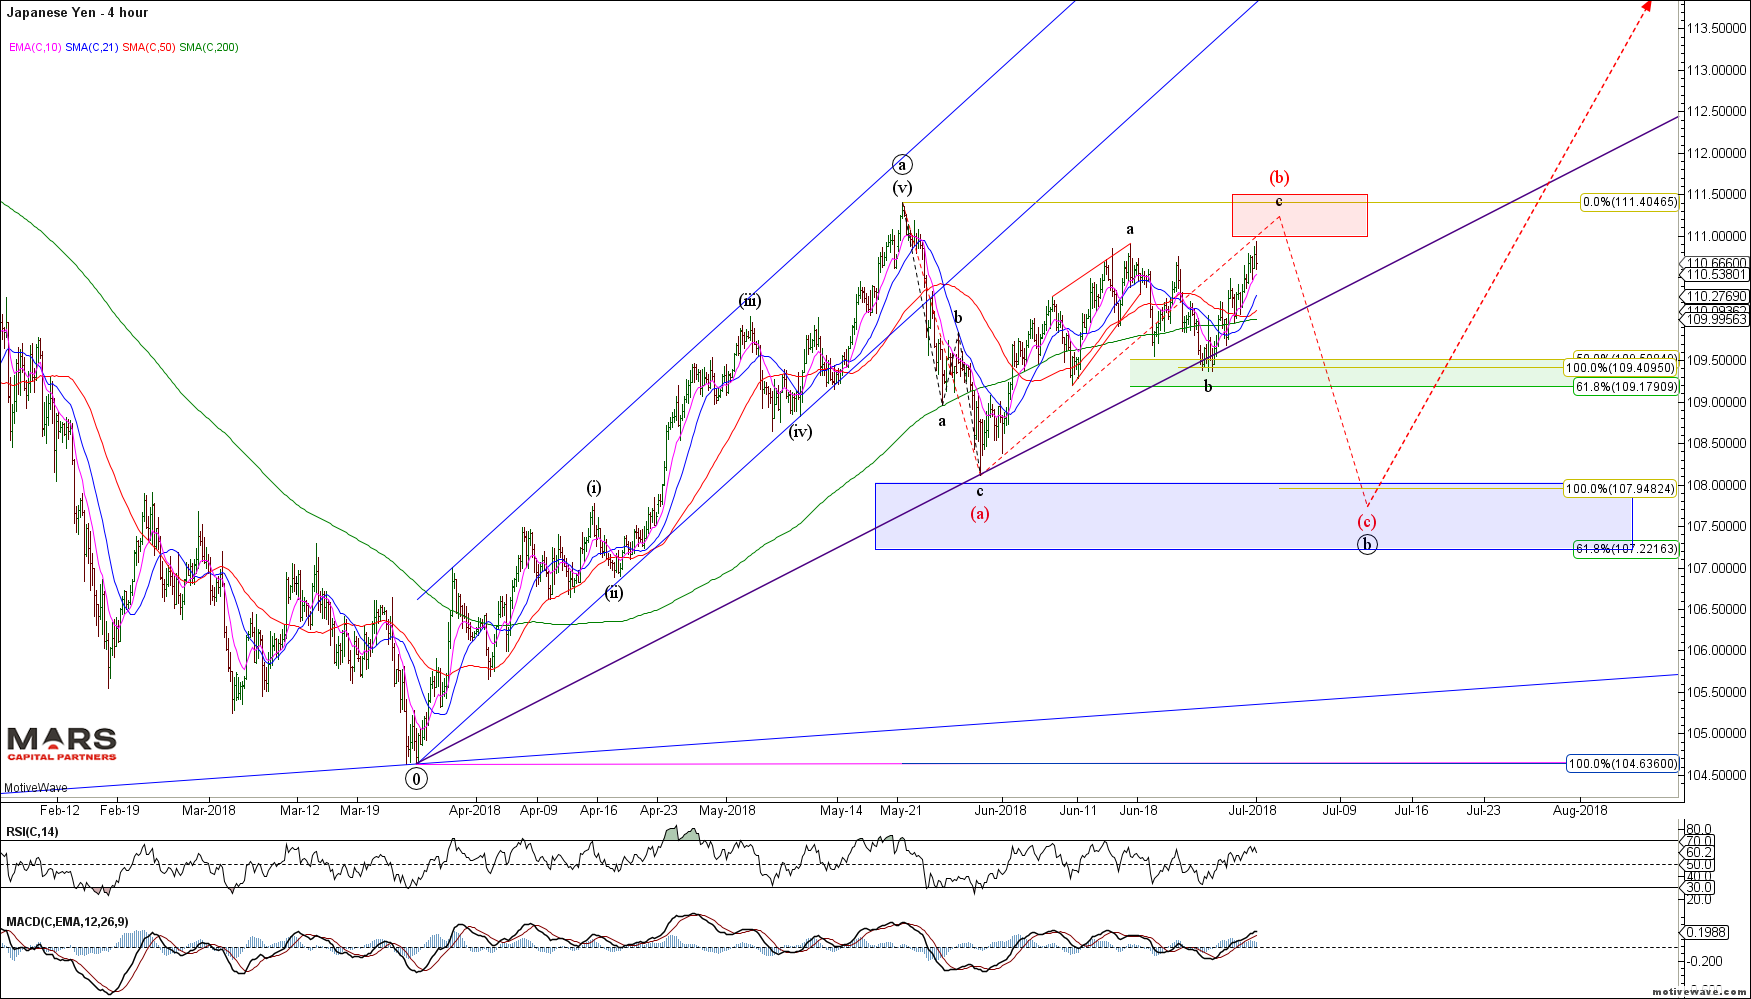
USDJPY H4

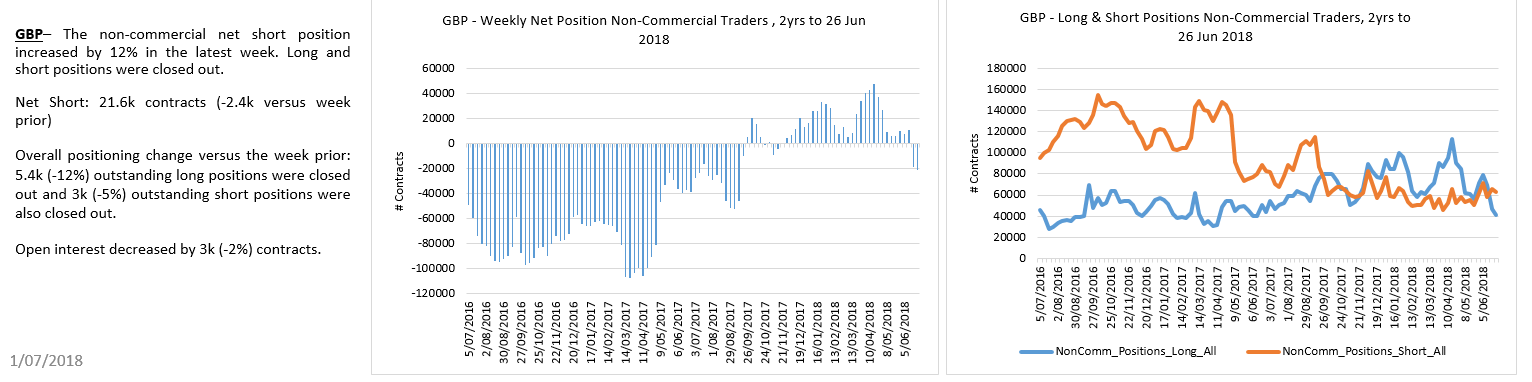
The Pound also appears to have hammered out a near term low with corresponding bullish momentum divergence at recent swing lows. Once again, we are looking for a counter-trend rally back towards the 1.3600 area from these oversold conditions.

GBPUSD Daily
GBP longs have declined to cycle lows.
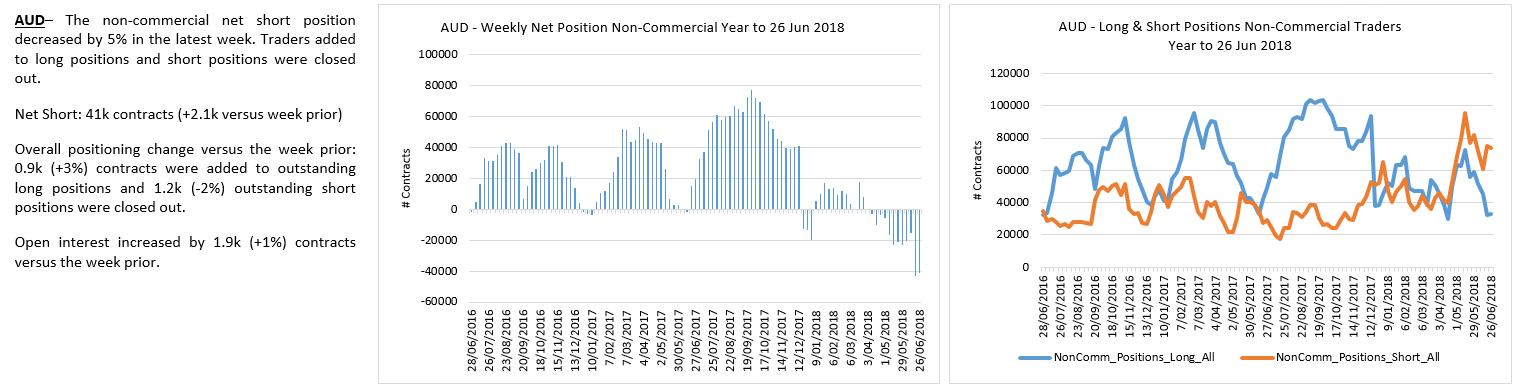
To the commodity currencies and the Aussie and CAD appear to be turning higher from key support. The Aussie$ tagged our 0.7330 Fib support target and has attempted to rally. This is obvious near term structural support for the A$ so we are now looking for a potential bullish reversal for “at least” a counter-trend rally and something much more bullish?
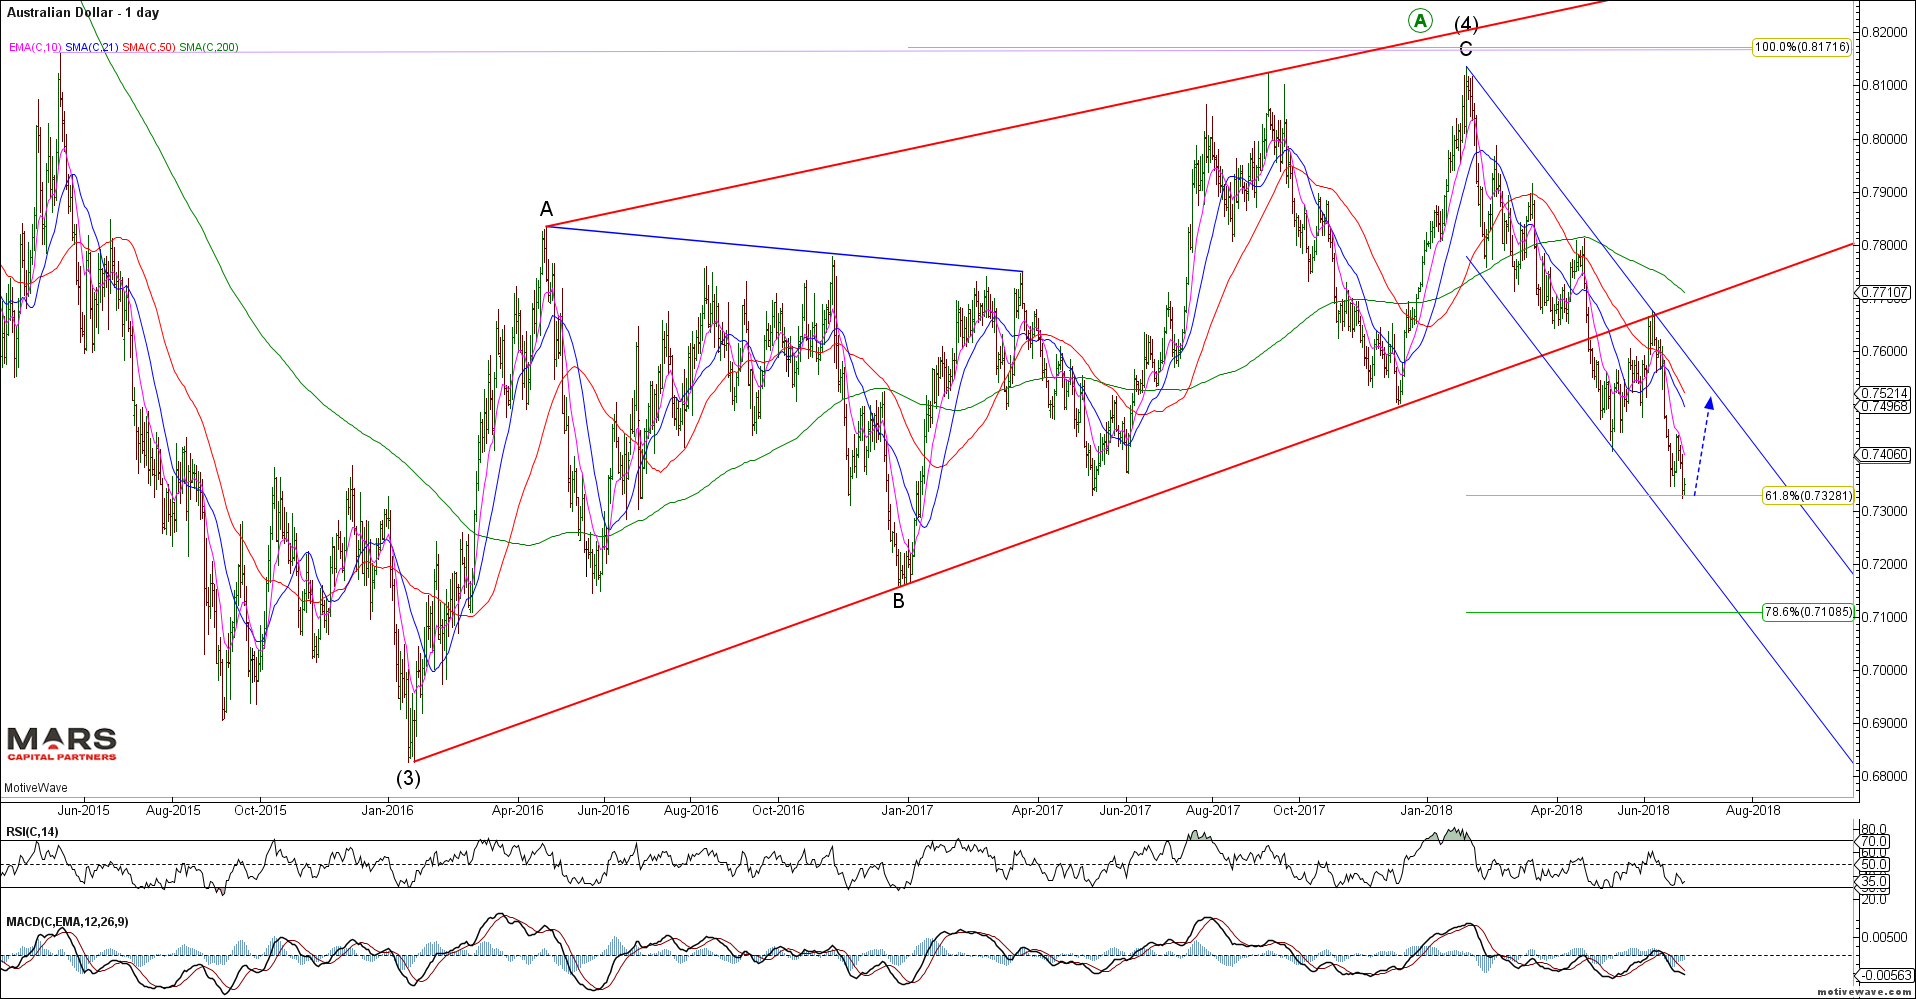
AUDUSD Daily
Aussie$ bulls have now capitulated, opening the door to a rally
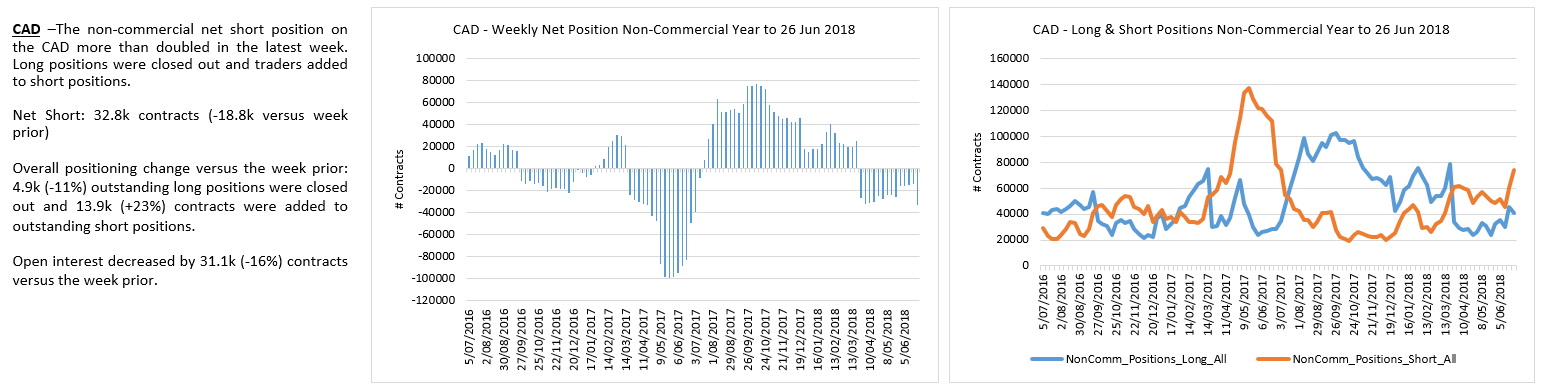
The USDCAD looks to have topped near term and now has two diametrically opposed counts from a big picture perspective. (i) We either completed wave (v) of 1 (green count) and last week’s bearish reversal started wave 2 down towards the 1.26-1.28 support zone before wave 3 higher OR (ii) this latest rally from the September lows was a corrective rally within a larger bear trend (red count) – triggered on trade below critical 1.206 support. Either way, we are near term bearish this pair as we look to see how the decline unfolds (wrong on close above 1.34).
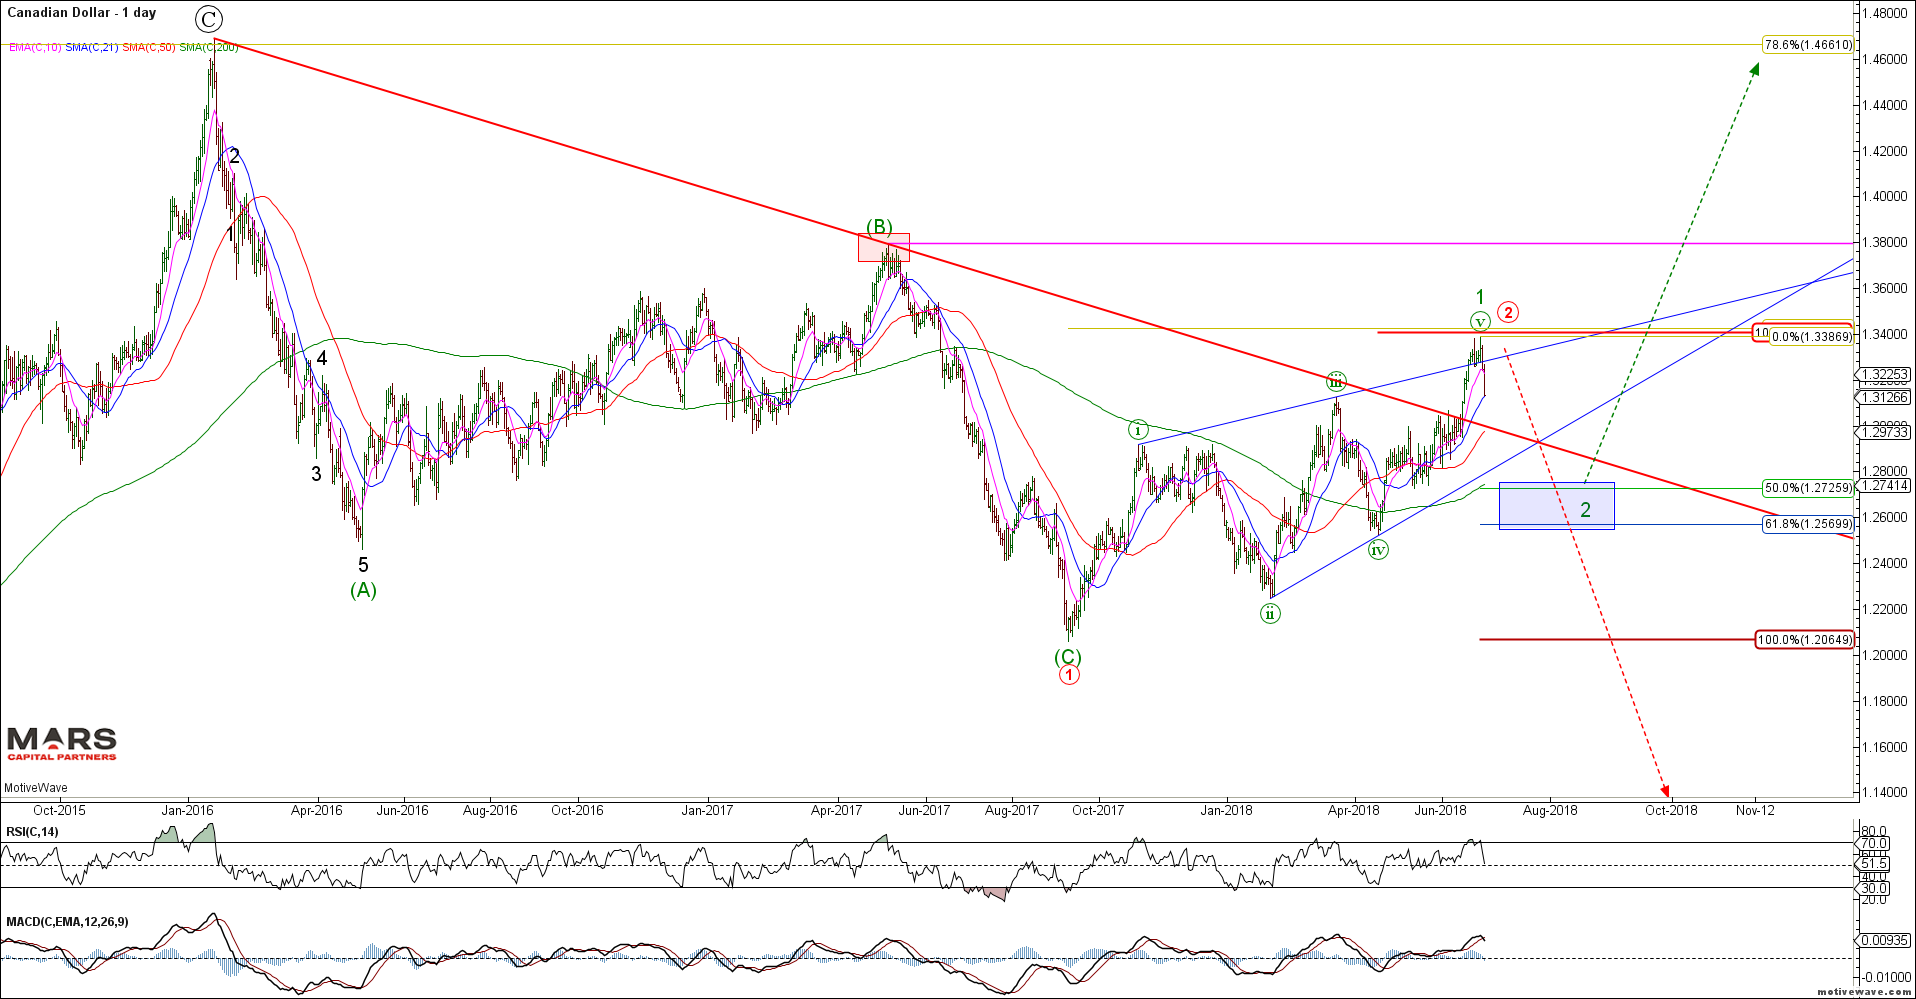
USDCAD Daily
CAD shorts pressing into the lows. Likely caught offside with this reversal.
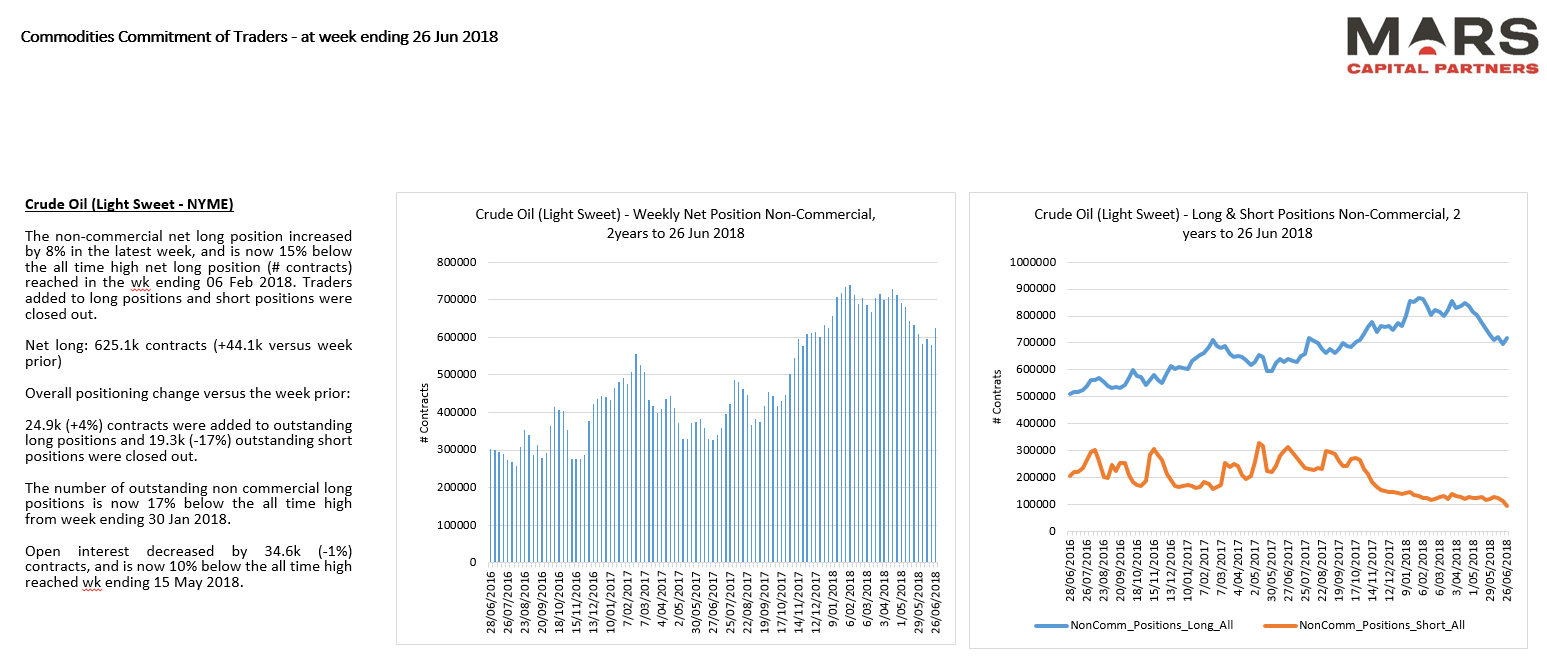
To the commodity markets and our Crude Oil short idea was wrong on last week’s push to new cycle highs. Despite Trump demanding lower Crude prices from the Saudi’s, the bigger picture market structure continues to be defined by higher highs and higher lows in the black gold (reflecting our view on stronger CAD). We must now consider the idea that the 2016 lows marked the end of wave (C) – and not wave 3 of (C) as previously thought. We are standing aside until we gain more clarity on Crude’s market structure.

CL Daily
While traders have reduced longs, shorts have plumbed to new lows.
Natty Gas continues to defy gravity but may be setting up a small degree H&S top on a close below the 50 / 200 day sma shelf support. Watching for a break but no position until we see confirmation of a turn lower.
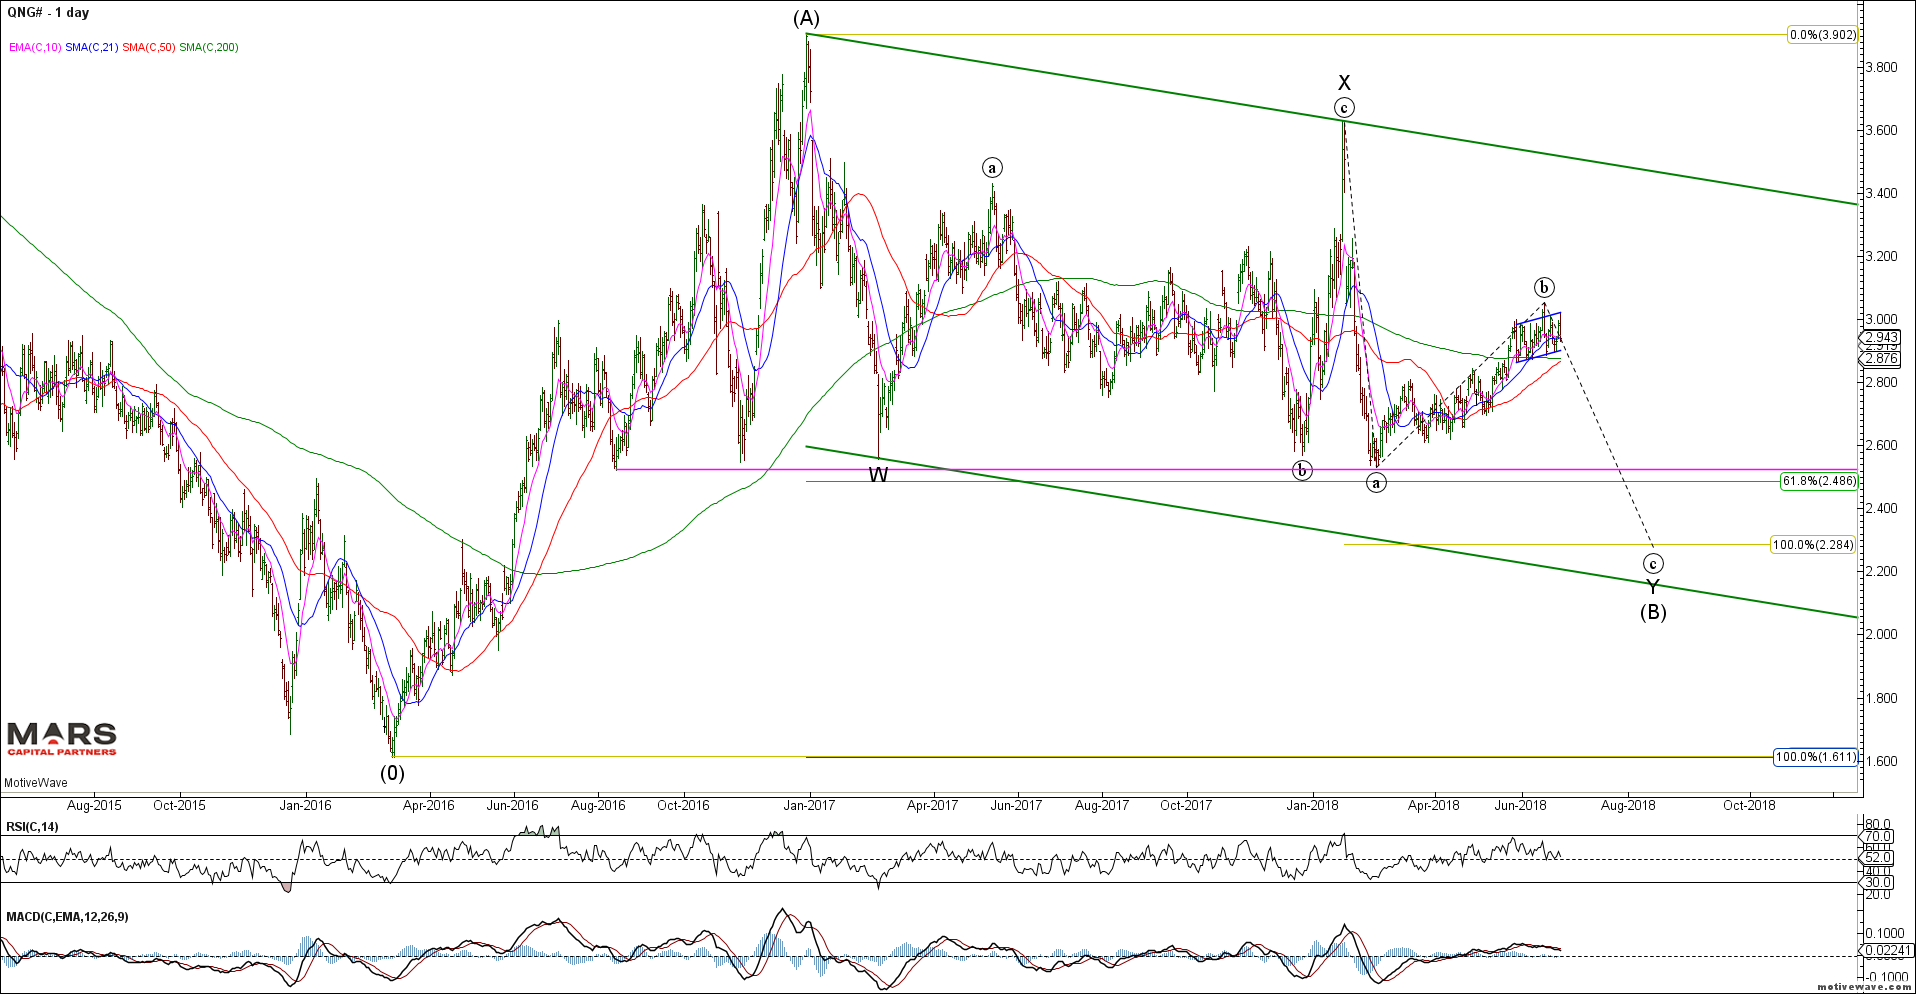
NG Daily
Traders remain slightly net short with both longs and shorts declining.

Dr Copper declined to the top of our shelf support zone where we would expect the bulls to try and make a stand (key inflection point). Strong support resides in the 2.90-2.95 area – a break of which likely triggers a H&S decline. Careful being short in the hole here near term.

HG Daily

To the PM’s and Gold has now met our weekly 200 sma and trend support in the 1250 area from where we would expect to see a counter-trend rally higher for wave (E). We remain bearish Gold from a bigger picture perspective as long as 1380 holds to the upside (bullish above 1380). Our longer term targets remain lower towards $600-700 as we look for a triangle thrust lower in wave (C).
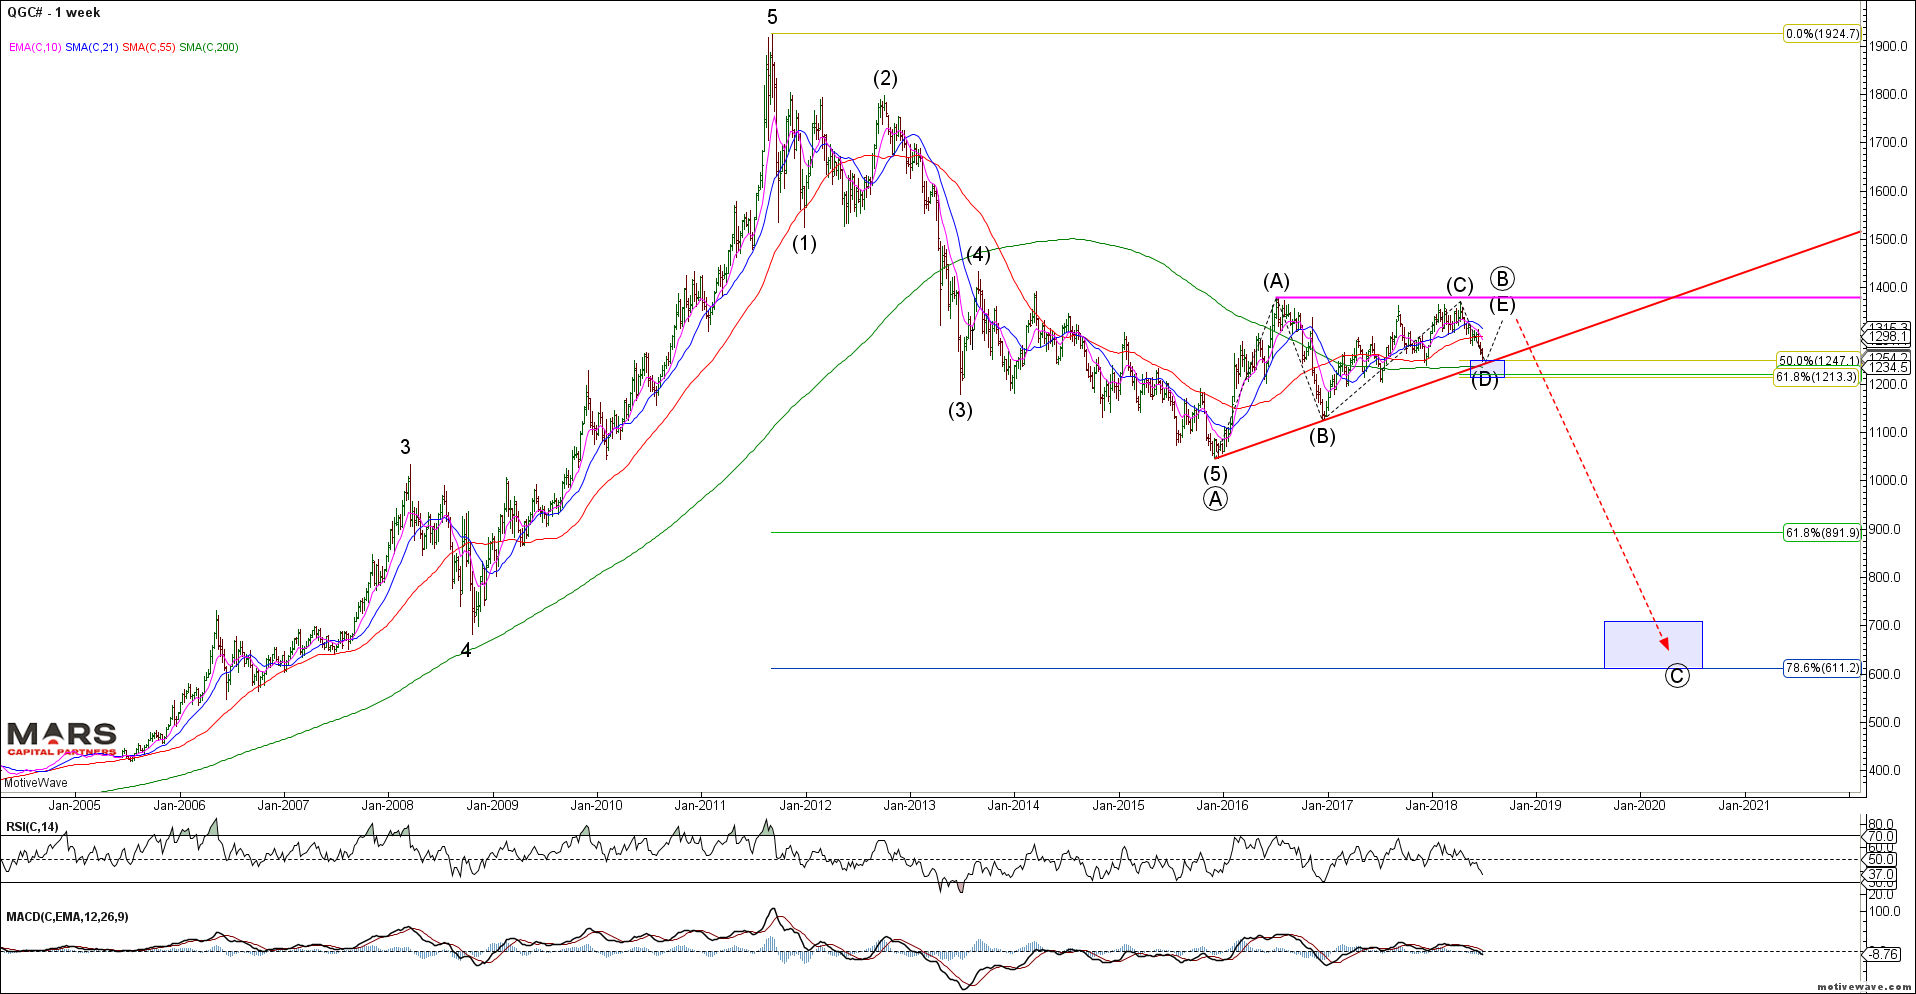
Gold Weekly
Near term, Gold has a cluster of strong support in the 1210-50 area where the bulls should try make a stand… we have no evidence of a tradable low as yet.
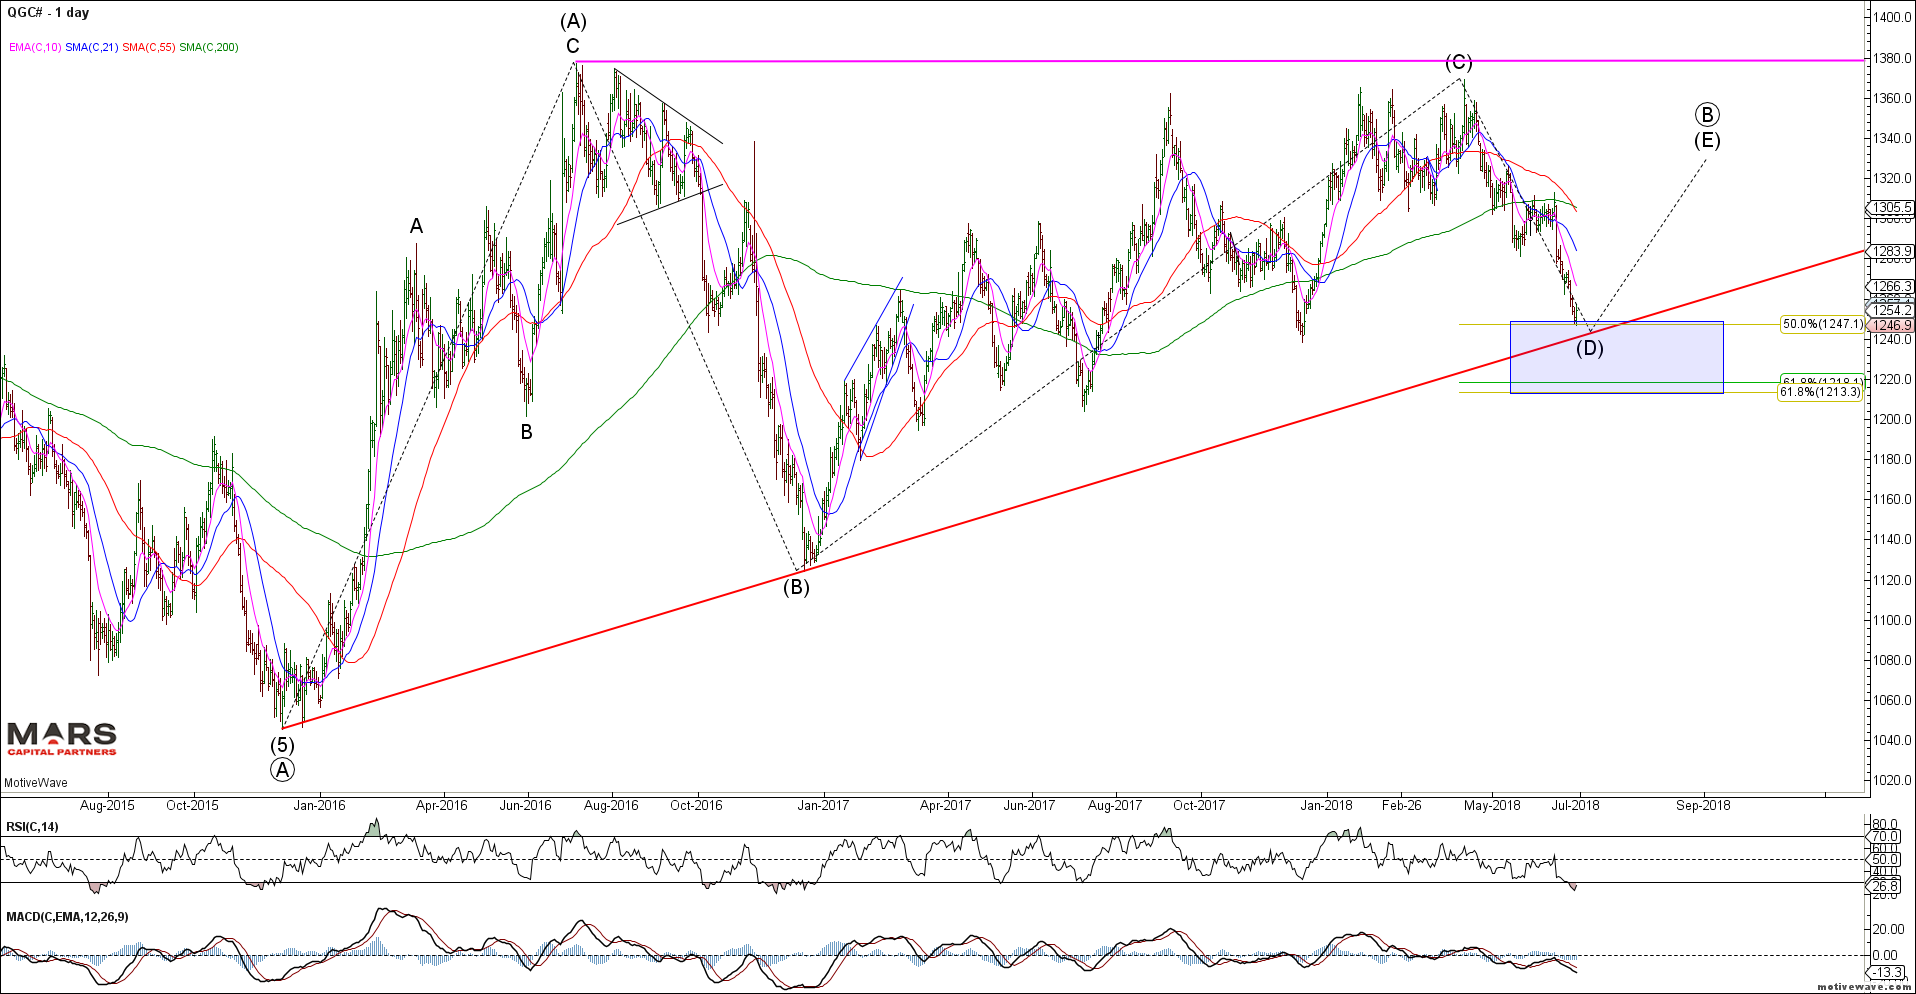
Gold Daily
Gold shorts increasing into the lows.

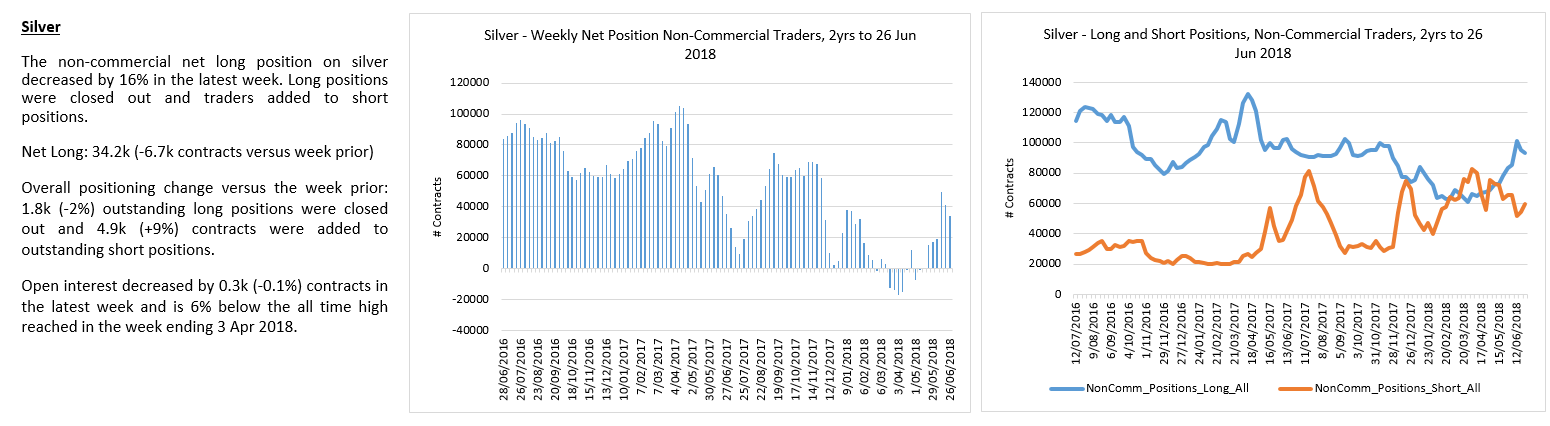
Silver continues to compress within its contracting symmetrical triangle while running stops either side. We are now flat as we look for a counter-trend bounce near term.

Silver Daily
Summary;
We continue to see an important alignment of fundamental, technical and sentiment indicators warning of a potential market top.
While we are beginning to see increased evidence of a bearish market turn with trend exhaustion for the leaders and fragmented markets, the February lows remain key structural support for the bulls.
We are tactically bearish equities, neutral bonds within a larger bear market, near term bearish US$ (while strategically bullish) and near term bullish PM’s within a larger bear market.
