
Macro Review and Outlook for w/c 8 October 2018
Macro review for w/c 1 October 2018 – “Stalling export trade” was a key theme from the latest round of PMI’s for September. This was evident in the manufacturing PMI’s for the Eurozone, including Germany, Japan, China and Canada. There was ‘modest’ improvement in the US and UK export orders.
The manufacturing PMI for China is on the verge of contraction. The PBOC announced a reduction of 1% in the RRR for some banks. Chinese officials are also considering further fiscal stimulus measures.
The US ISM Manufacturing PMI and the Markit Manufacturing PMI, although not as strong as each other, were consistent with the final US Factory Orders data for Aug. Growth in factory orders for all manufacturing industries recorded the second strongest growth in new orders for the last year. Stronger factory orders data can be traced back to transport equipment manufacturing activity.
The divergence remains between the US ISM non-manufacturing PMI and the Markit Services PMI data. Activity in the ISM non-manufacturing reached all-time highs in Sep while growth in the US Markit Services PMI continued to slow in Sep.
US payrolls data was lower for Sep, but previous months were revised higher. From the household survey (16yrs+), annual employment growth continued to slow, and participation declined over the last year. Real earnings continued to grow at a constant rate.
US Consumer credit growth continued to accelerate in Aug, which is likely to support consumption/spending growth.
A busy week of US Federal Reserve speeches. A full range of views were expressed from hiking rates to a point that are somewhat restrictive, to taking a more cautious path and a slower rate of hikes. Chairman Powell’s interview garnered the most attention, but also noteworthy was Atlanta Fed President/CEO Bostic speech. He has previously been more cautious on hikes but admitted that the strength of the economy had surprised to the upside – with the potential for overheating, a higher path for rates would be required.
The RBA kept rates on hold and Australian retail sales rebounded in Aug after a weaker Jul.
There is more detail covered in the full review for last week – use the links in the contents page to navigate to different country sections. Download here (hit the back button on your browser to return to the site);
The outlook for w/c 8 October 2018 – Light supply of US Treasuries this week with the US Treasury auctioning and settling $156b in ST bills, raising approx. $1b in new money. Only $26m will roll off the Fed balance sheet this week on 11 Oct. The US Treasury will also auction approx. $74b in longer-term notes and bonds which will settle next Monday 15 Oct.
The key releases this week;
US PPI and CPI data for Sep
Eurozone and German Industrial production and German trade data – providing further insight on the slow-down in export/manufacturing demand
Aussie housing lending data for August – as we track the slowdown in the housing market
UK monthly GDP for Aug
Brexit is approaching critical timings – likely a heightened level of activity over the next week and a half. At the EC meeting next week on 17-18 Oct it will be decided whether there has been enough progress on the Brexit withdrawal agreement to call an additional EC summit on 17-18 Nov to agree and formalise the agreement.
Further detail and the calendar of key releases is provided in the full briefing document – download it here (hit the back button on your browser to return to the site);
Comments and feedback are welcome. Please email me at kim.mofardin@marscapitalpartners.net
MCP Market Update: October 8th, 2018 – Yields Break
Last week we finally saw US bonds break major support (TLT 116) that we have been watching closely. This is a major turning point for risk assets in a debt fuelled world and in particular, its effect on Emerging Market debt which when combined with a strengthening US dollar bodes further trouble ahead. Also of note was the Nasdaq’s bearish reversal on a failed retest of the ATH’s as warned last week. All in all it was a bad week for risk parity strategies.
The TLT broke critical 116 shelf support and accelerated lower as expected invalidating the near term bullish counter-trend potential. We have long been bearish bonds (since the July 2016 highs) and we expect this trend to continue. While we may see a re-test of the 116 break-down level the trend remains down from a bigger picture perspective.
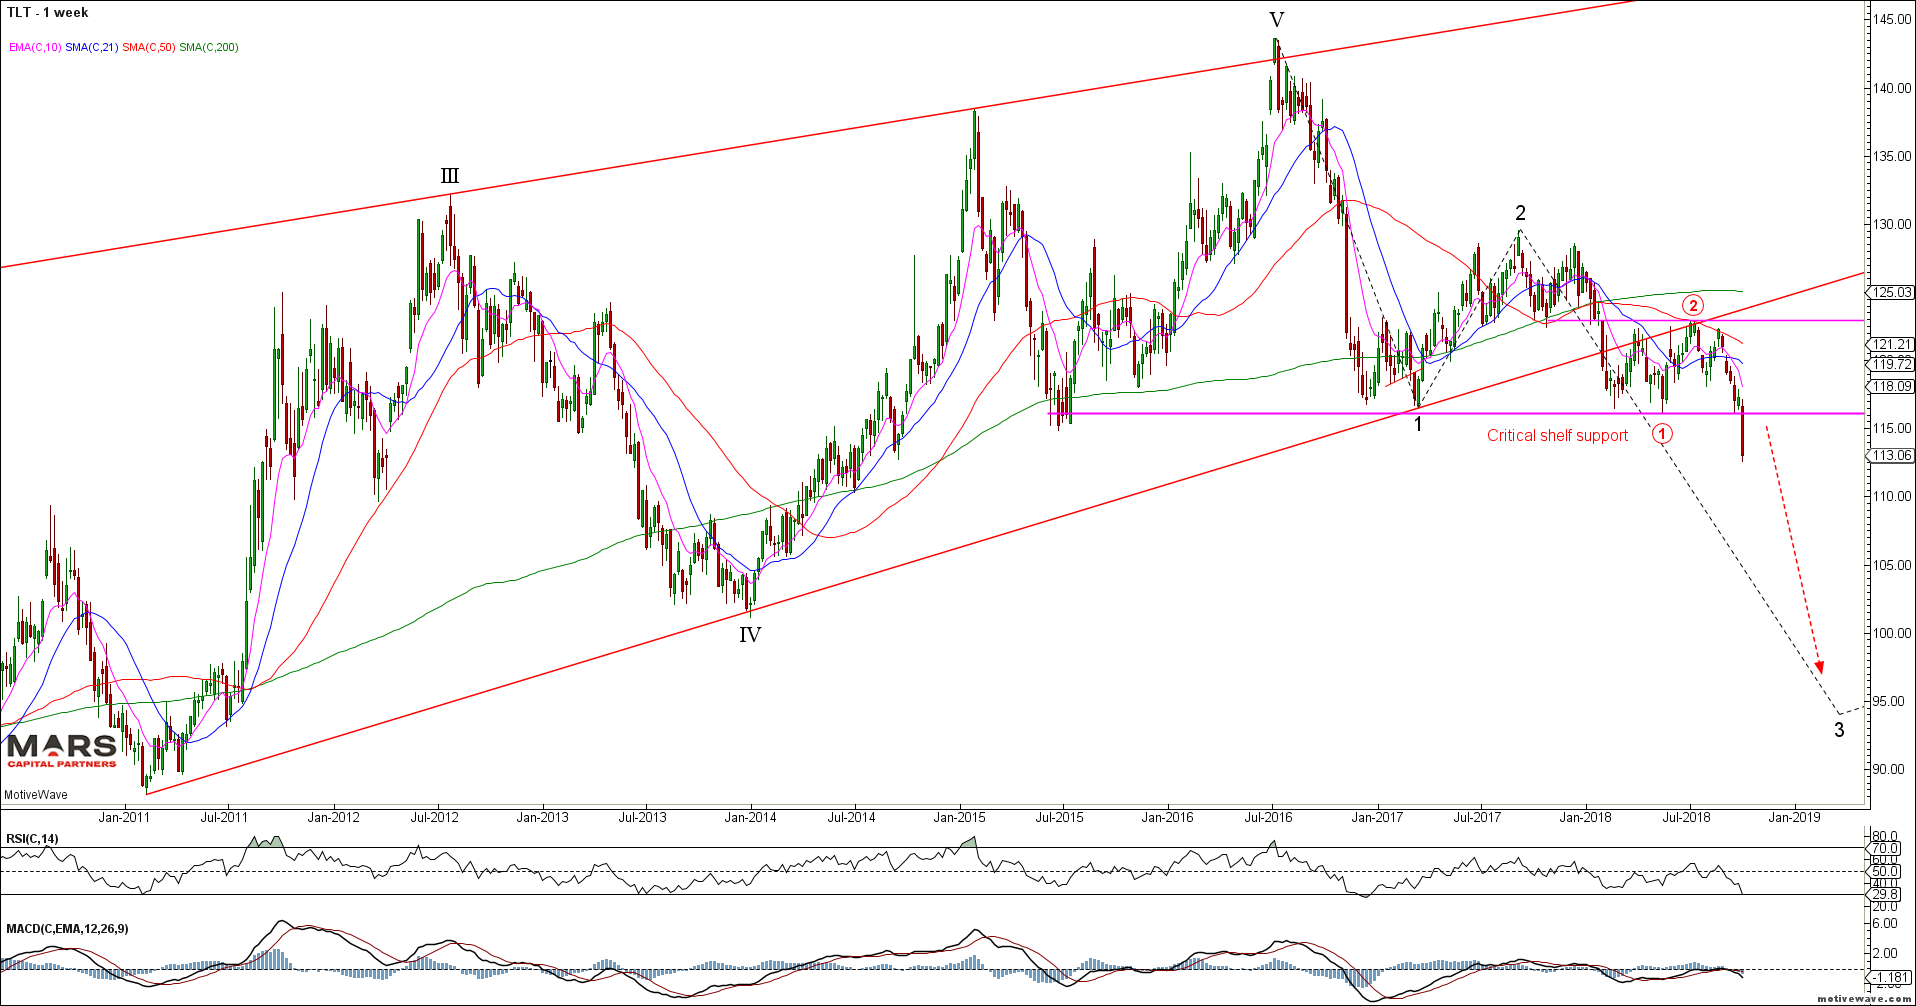
TLT Weekly
Yields broke higher above key resistance in what should be a powerful wave (iii) of 3 rally shown below. Only a strong close back below last week’s break-out would alter this bullish yield count.
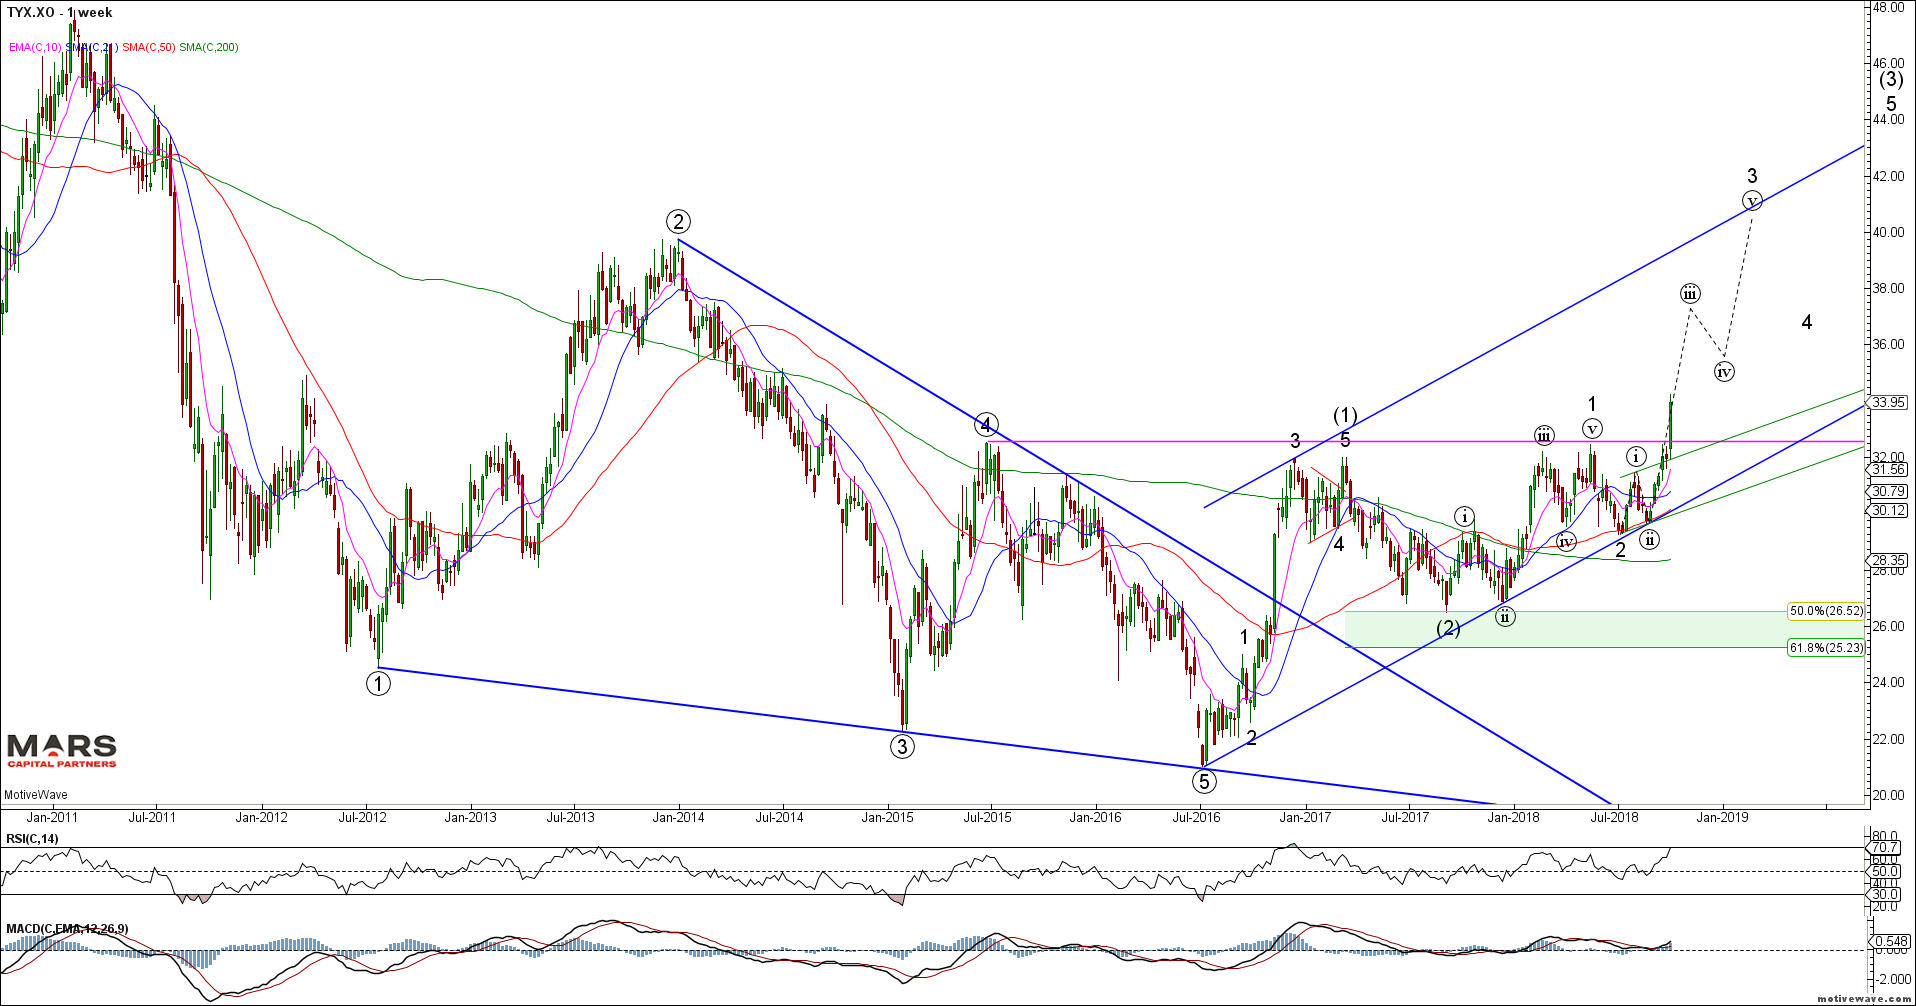
TYX Weekly
The SPX / ES broke near term trend support and declined directly to our intermediate support in the 2865-75 area posted last week. While we could see a near term counter-trend bounce early this week the intermediate trend remains down – confirmed with a close below 2865.
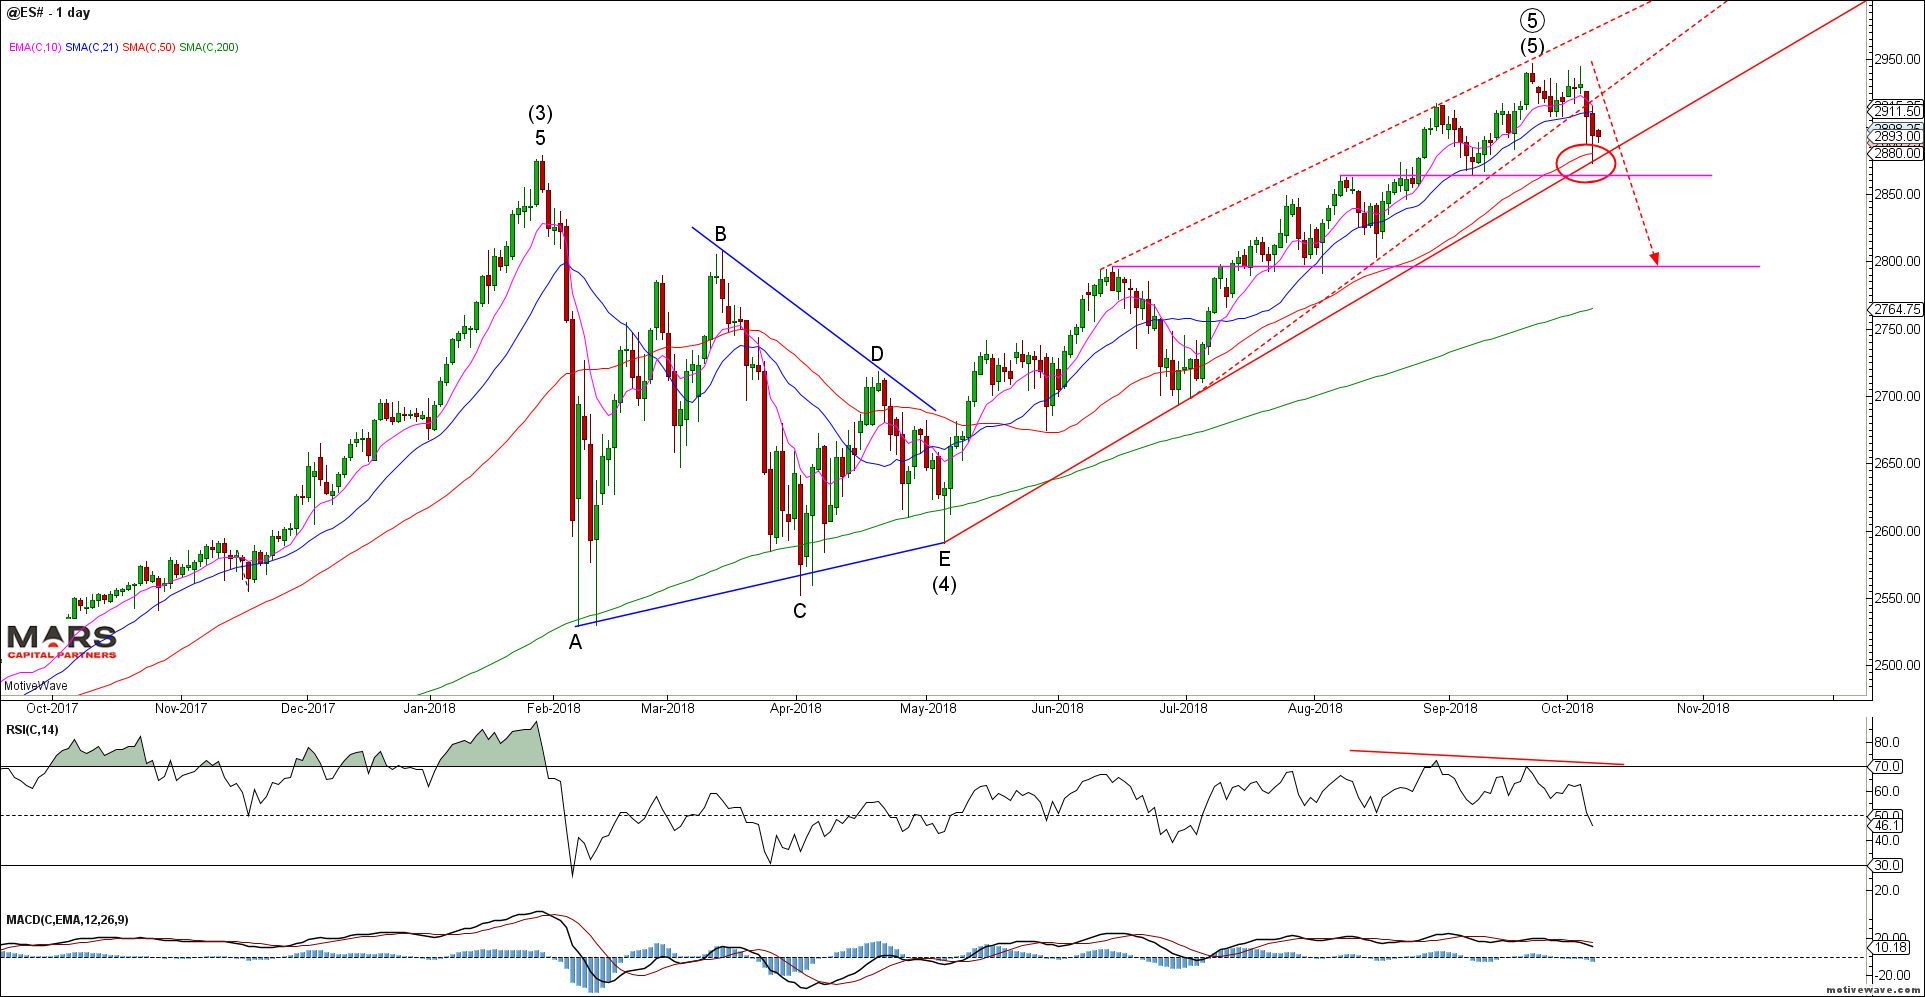
ES Daily
The near term SPX count appears to be an impulsive decline into support to complete either wave (a) or (i) down. Any counter-trend rally should be limited to resistance in the 2905-15 area before another wave lower as shown below. However, support remains support until broken so a close below 2863 will help trigger the next wave lower towards 2800.
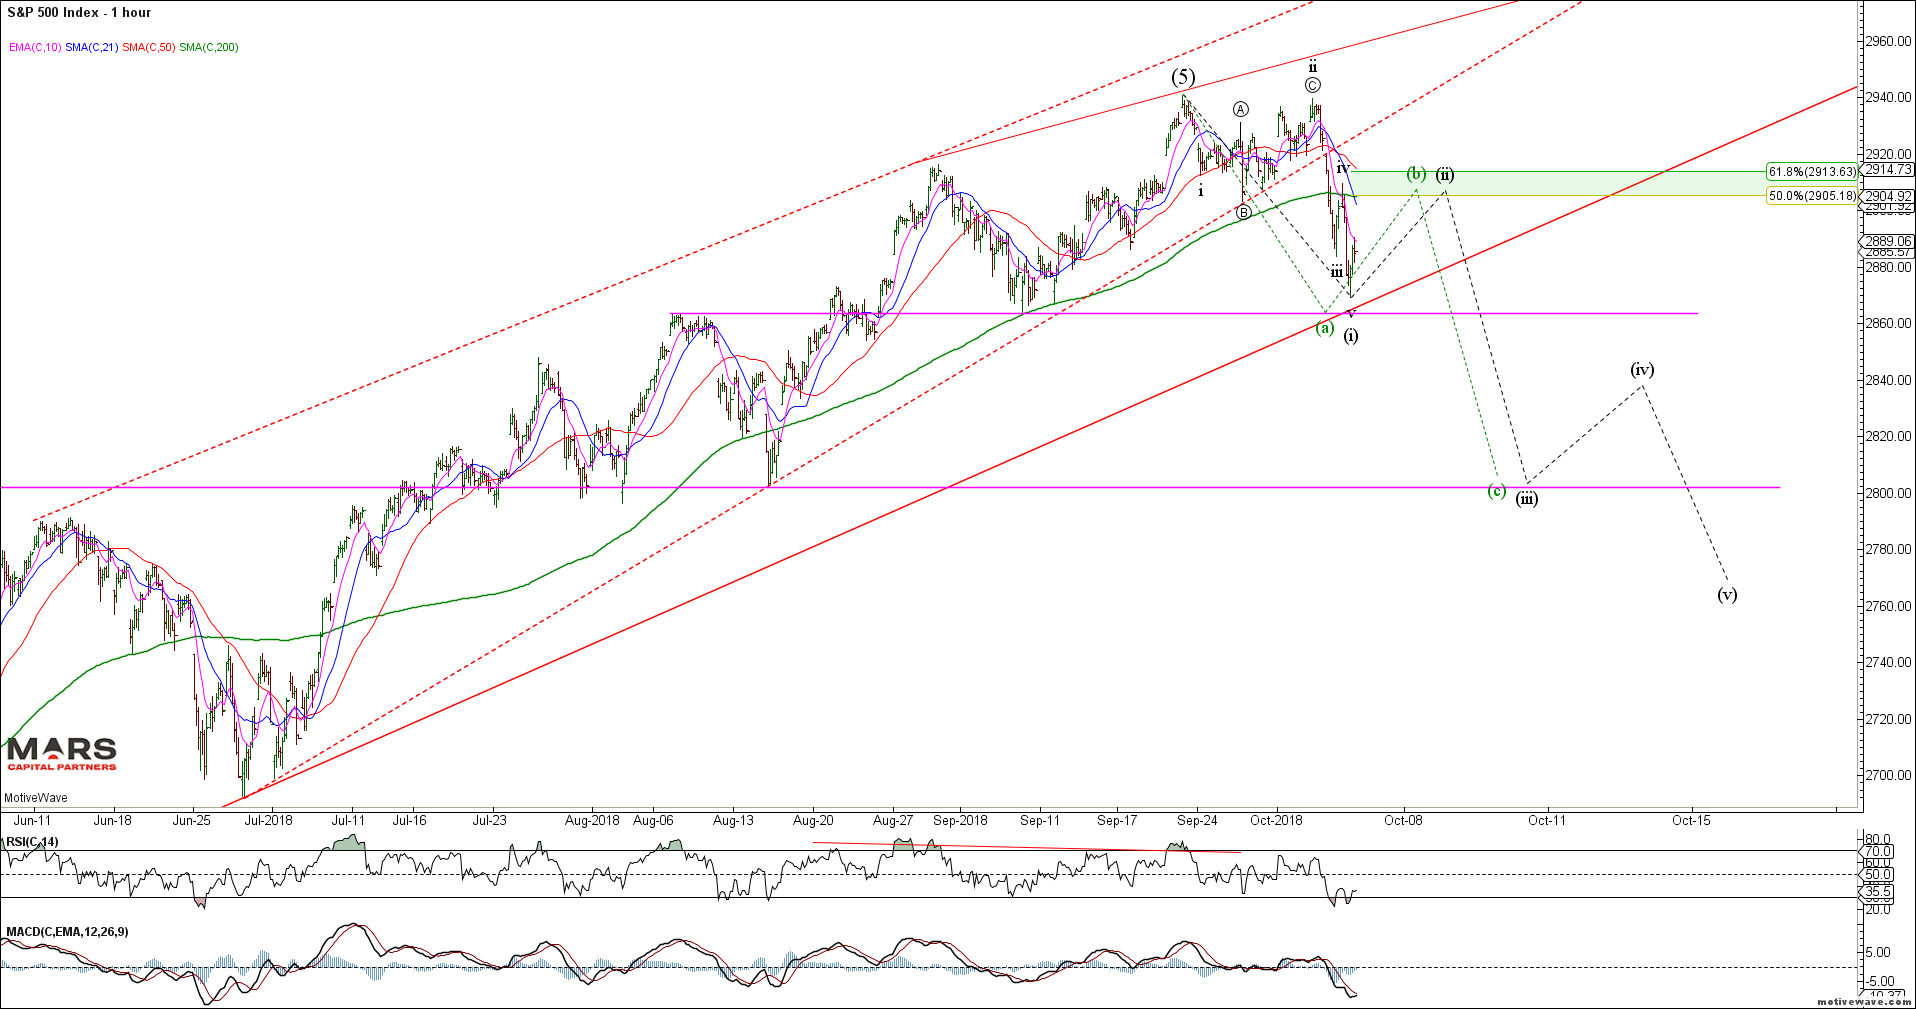
SPX H1
ES shorts are at new cycle lows – warning sign as bulls embrace the highs.
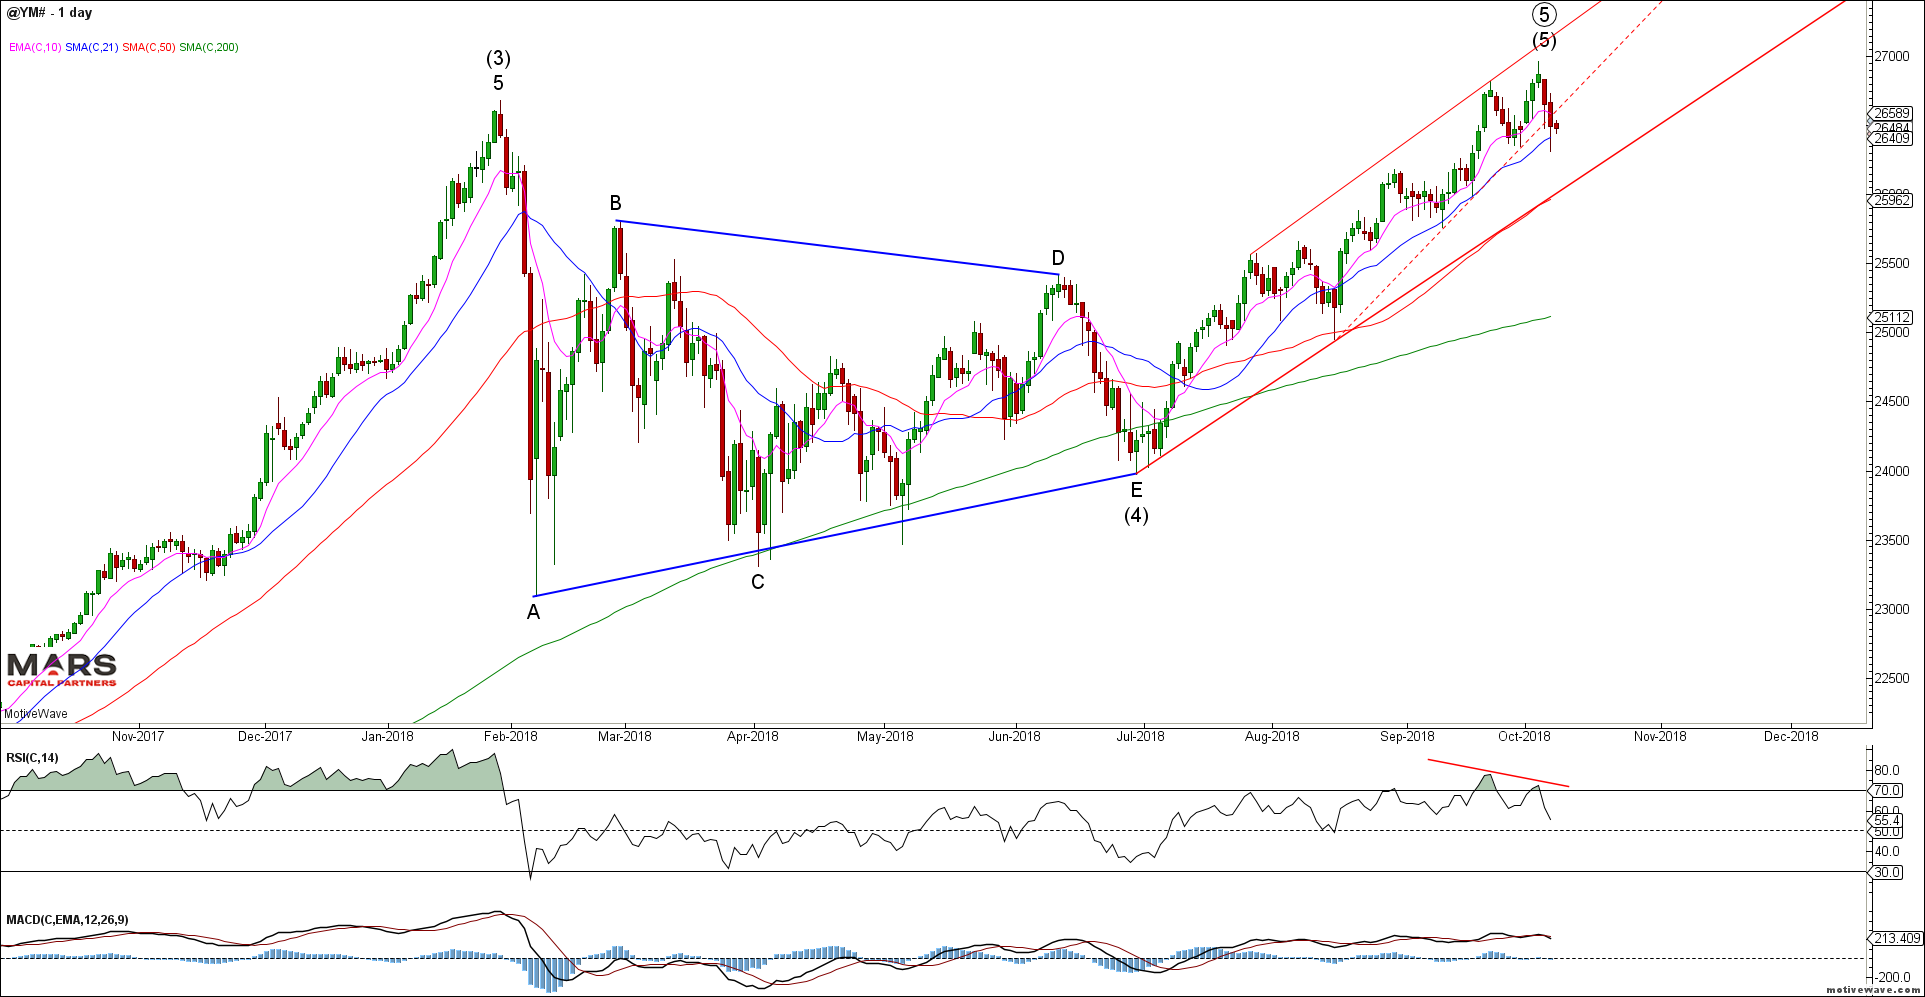
The Dow / YM also broke near term trend support but remains well above key trend and 50 day sma support in the 26000 area. Of note is the bearish momentum divergence at last week’s new ATH’s.
YM Daily
YM traders also embracing the rally…
The Nasdaq indices formed non-confirmation highs with the NDX making marginal new highs which was NOT confirmed by the broader Nasdaq Composite index. Last week we warned…
“The near term NQ_F bear case (lower probability but great R/R) is that we are completing a retest of the swing highs in an ending diagonal wave (c) of B/2 red count – it may be worth buying some cheap puts on a retest of the highs. A strong close at new ATH’s will invalidate this count.”
The NQ made marginal new ATH’s but was unable to sustain the break higher and reversed 350pts lower last week as expected breaking the 50 day sma long term support in the process. This break in structure suggests a retest of the 200 day sma.
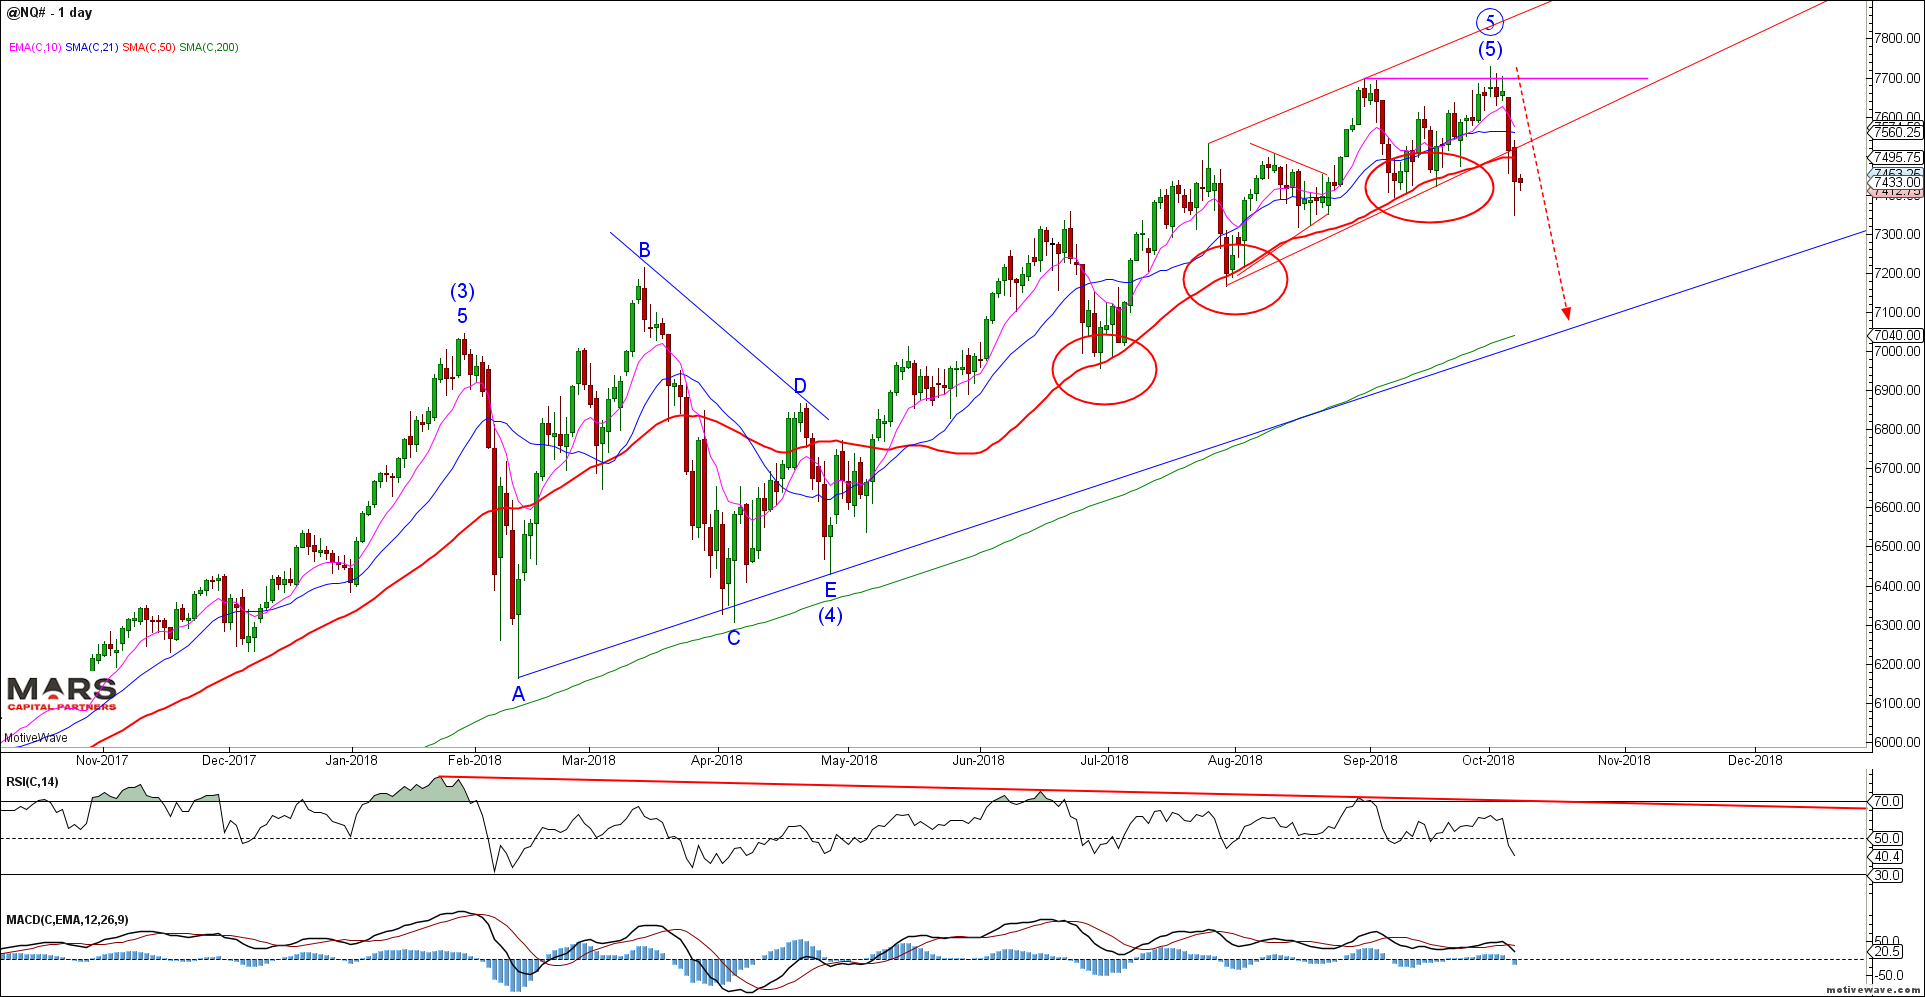
NQ Daily
Our near term NQ count held up well knowing that we should allow for a marginal new high and hence the focus on near term puts. Any counter-trend bounce should be capped by the 50 day sma and Fib resistance in the 7540 area. We remain bearish given this break of key trend support with targets near the 200 day sma. While it is unclear whether this initial decline is complete we should be aware of the potential for a counter-trend rally within the larger bear market.
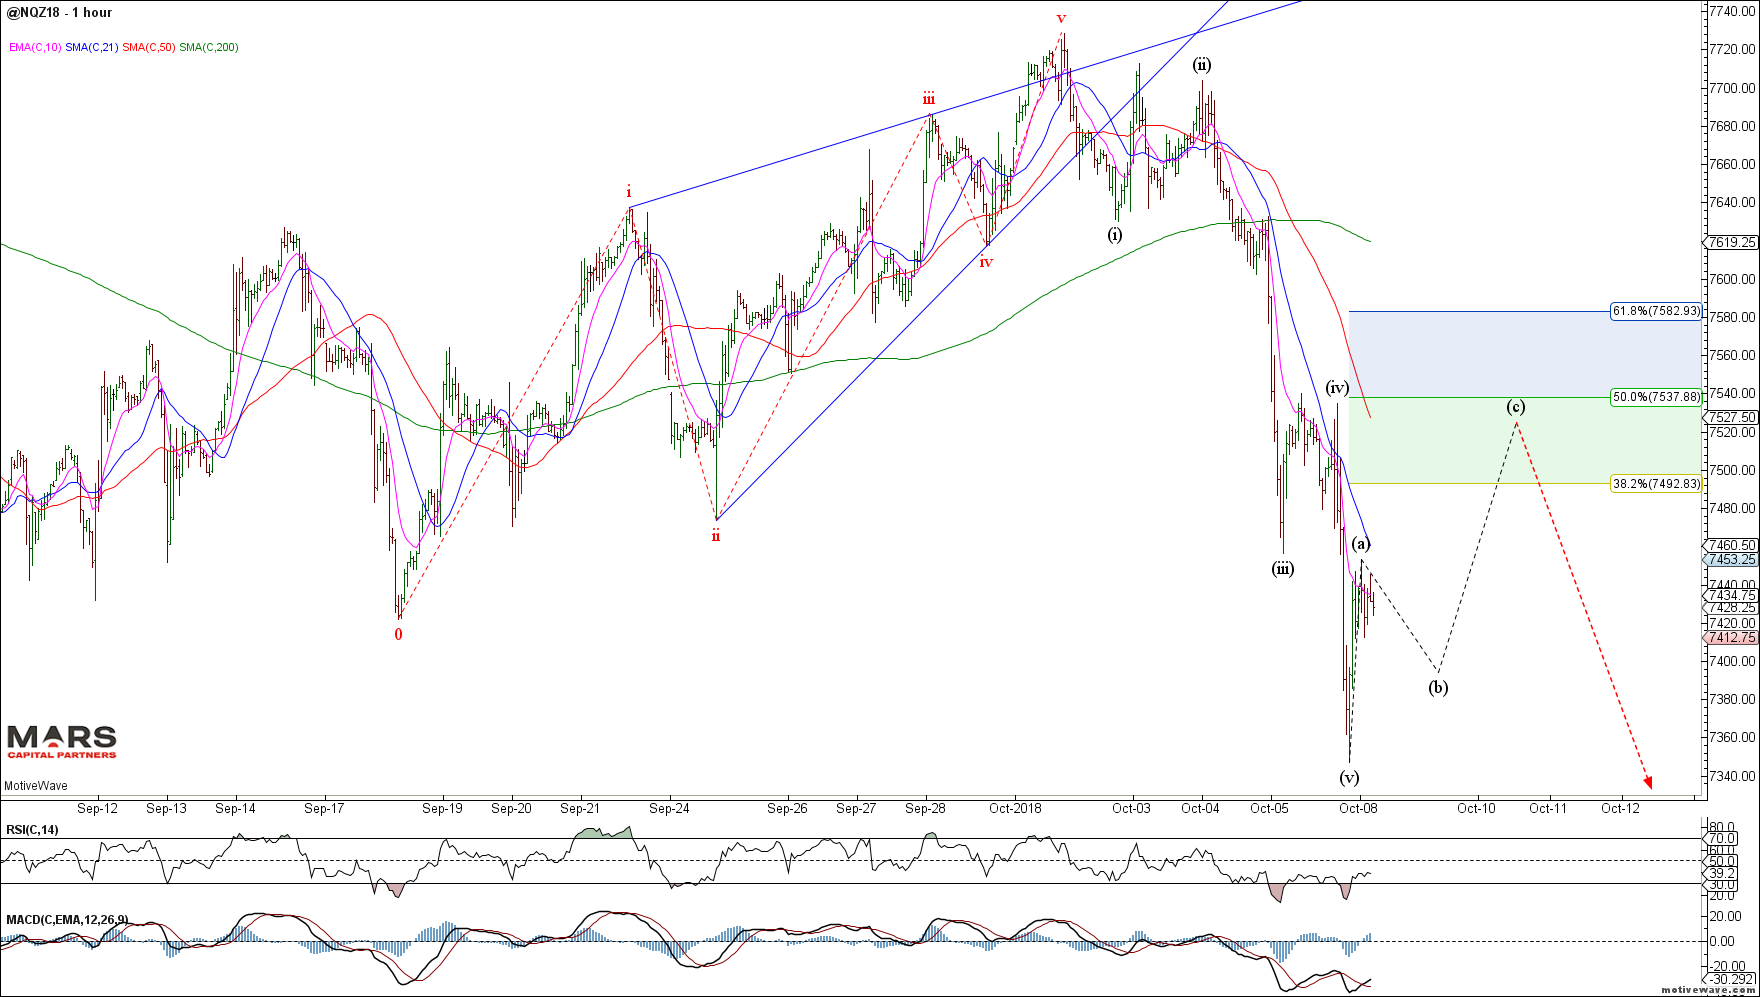
NQ_F H1
The Nasdaq Composite did NOT make new highs and broke key near term support. Major trend and 200 day sma support resides in the 7500 area. Note that there are enough waves in place to count the rally from the 2016 lows as complete – note the bearish momentum divergence at the recent swing highs.
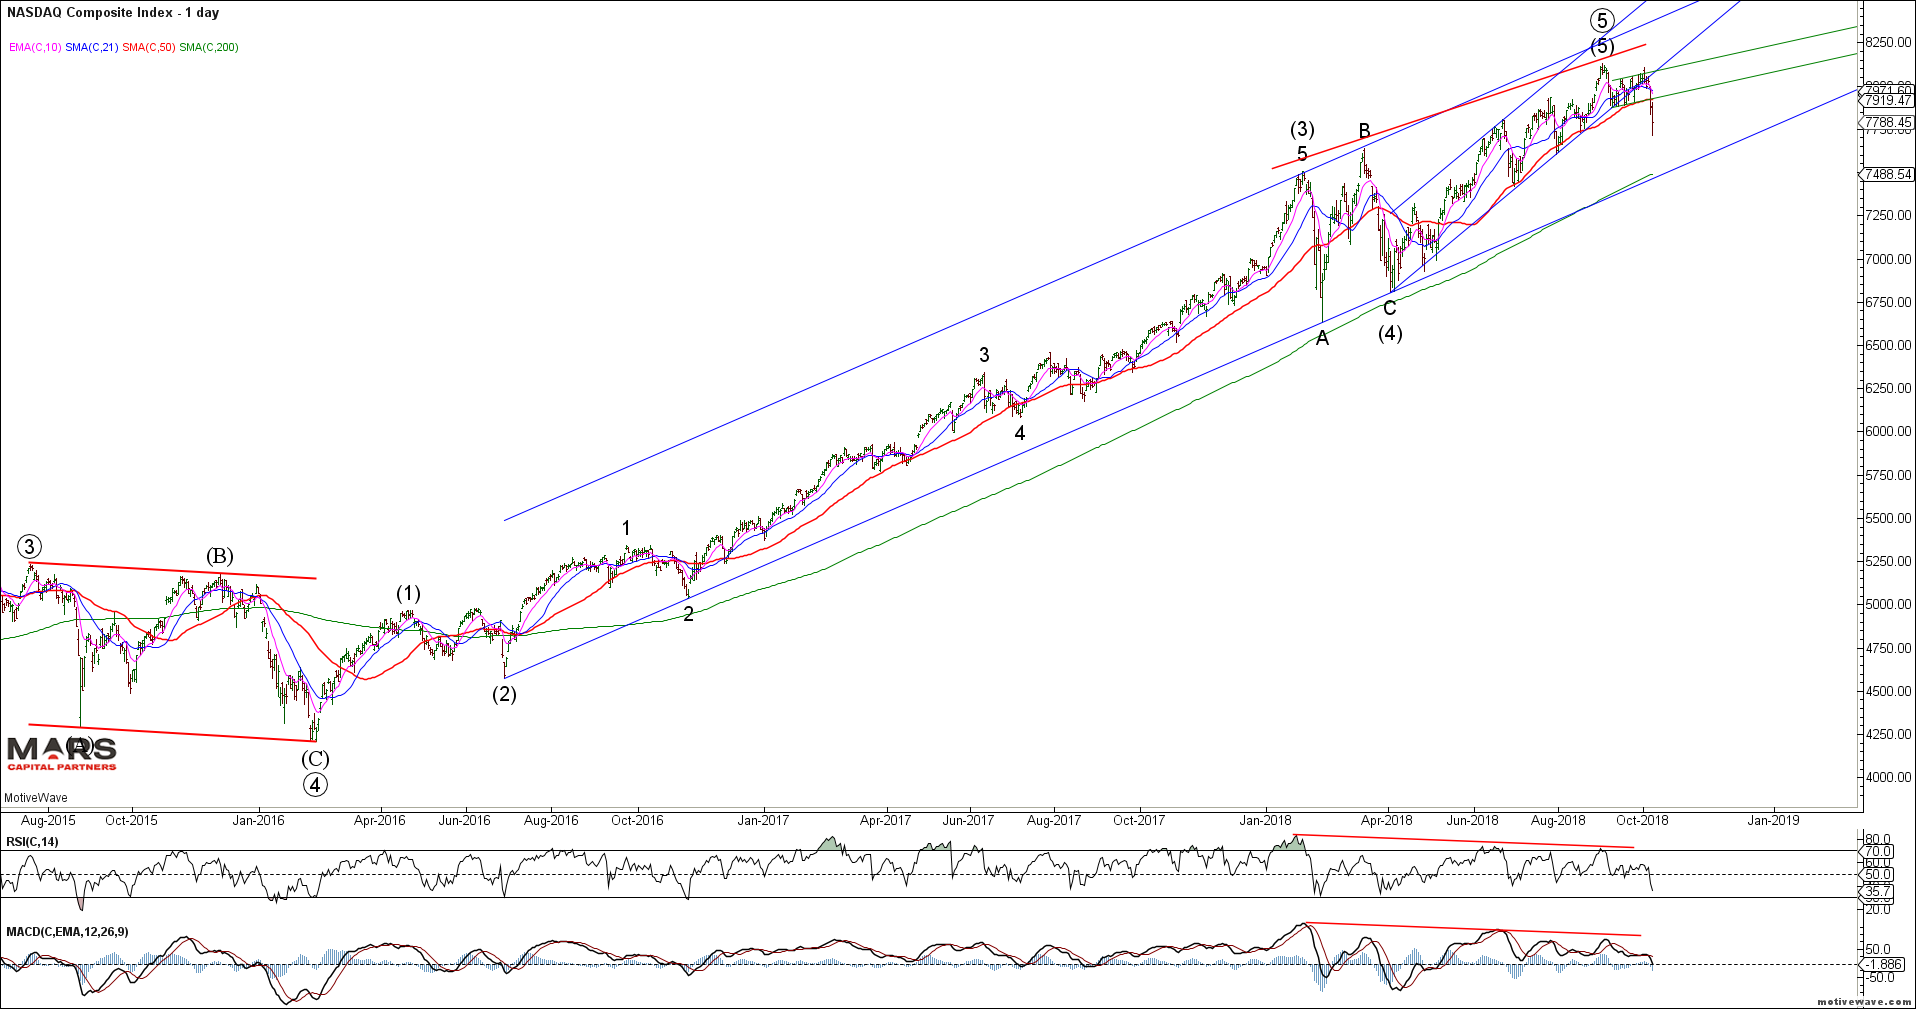
Nasdaq Composite Daily
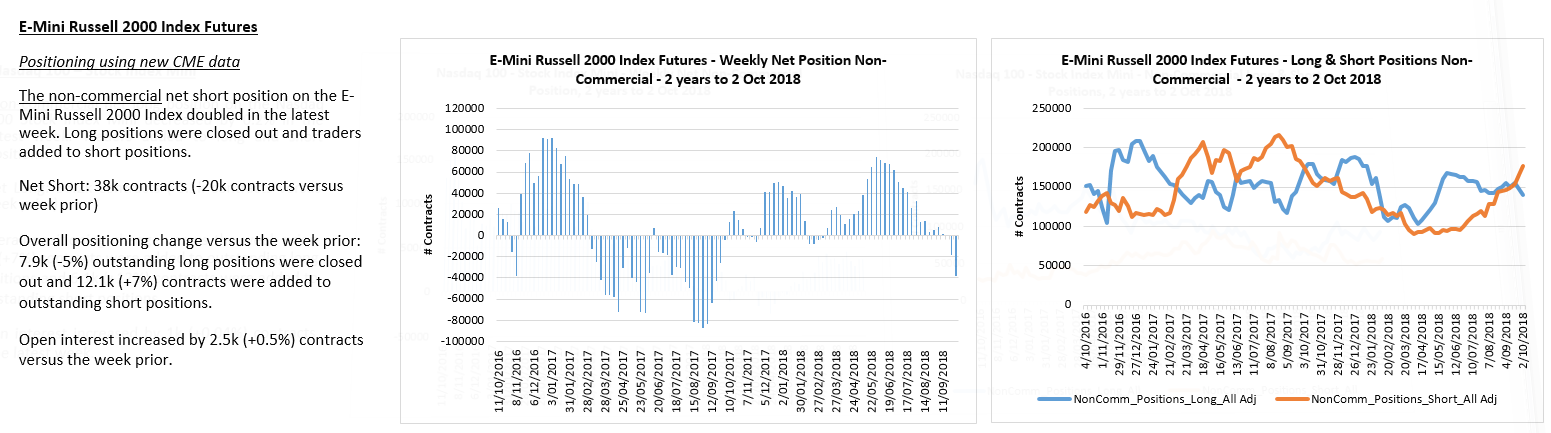
The Russell 2000 / RTY provided early warning to the market weakness as it quickly declined below bullish 1686 support highlighted last week. The bulls were unable to reclaim the 1733 resistance and quickly broke down towards the 200 day sma and wave (3) breakout support from where you would expect buyers to emerge. A close below the 200 day sma would add to the bearish structure.
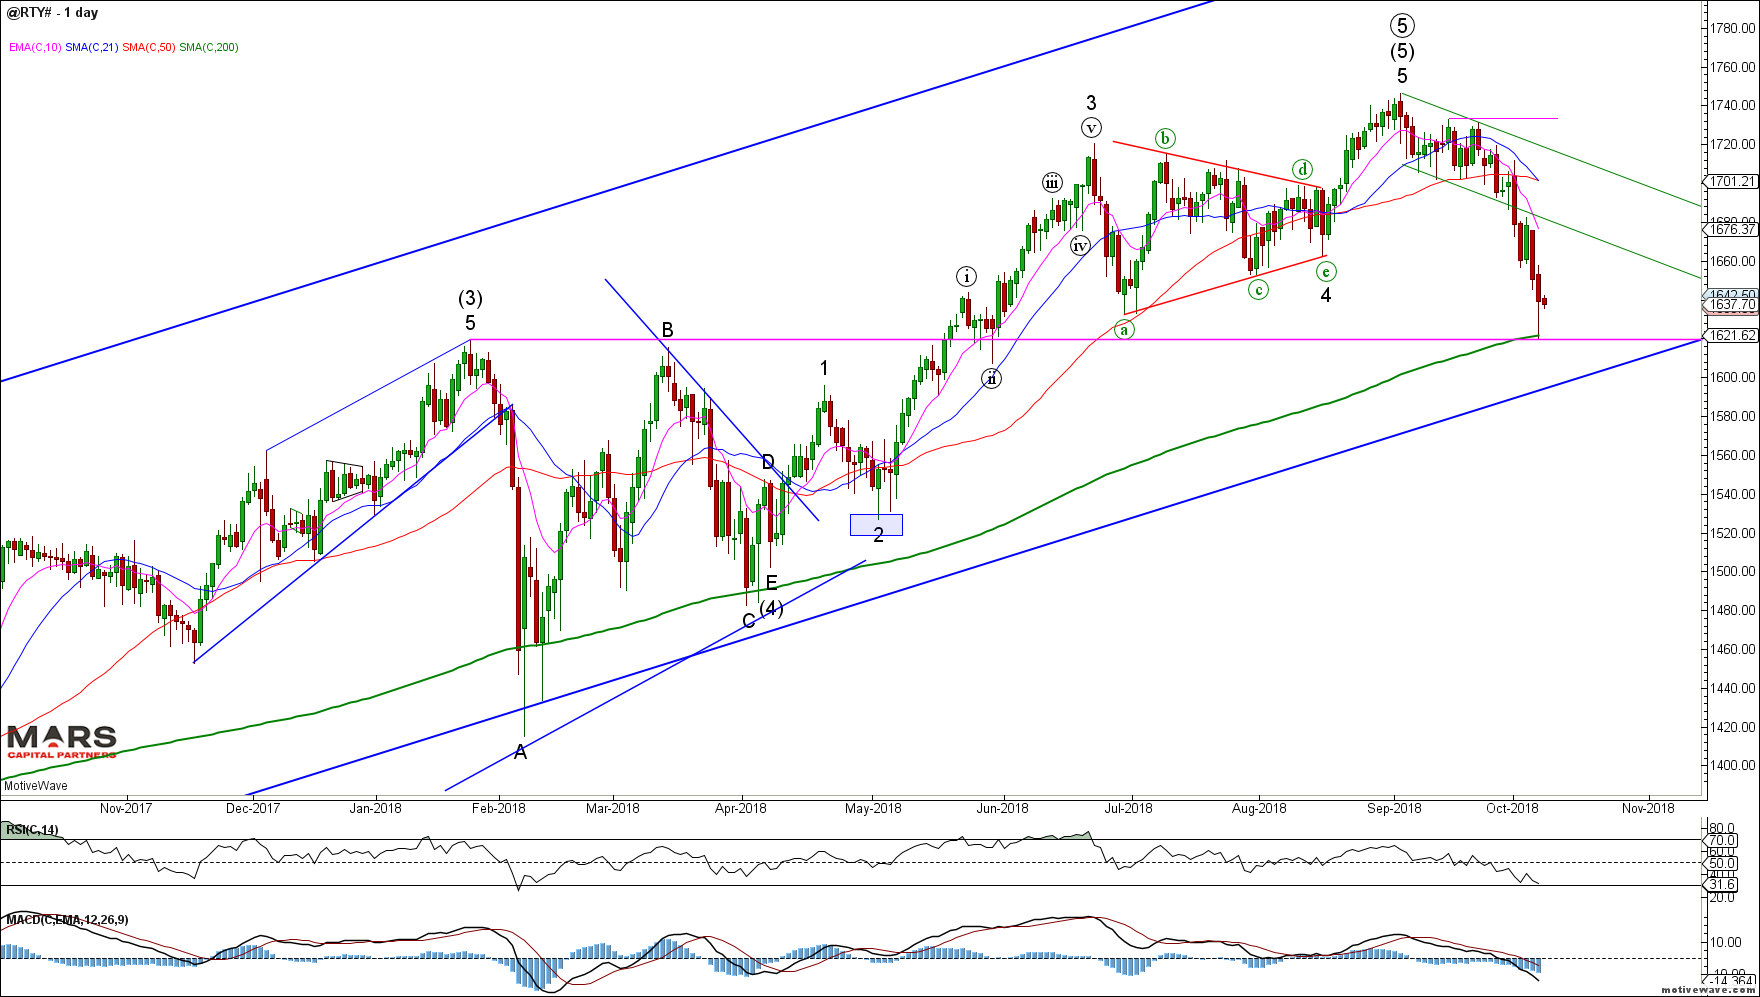
RTY Daily
Russell shorts continue to pile in which helps explain recent relative weakness.
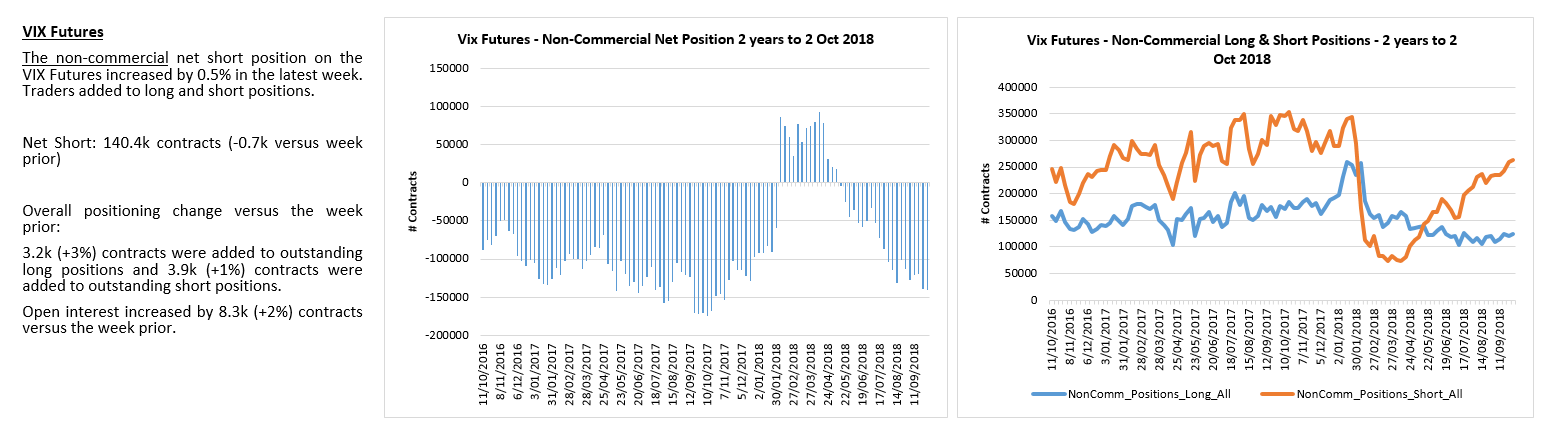
As noted previously, the VIX is attempting to rotate higher from base support after breaking its near term declining wedge. The VIX really needs a close above 20 to gain upside momentum. Note the Weekly RSI continues to hold trend support and is attempting to rotate higher. We continue to expect higher volatility in the coming weeks and months.
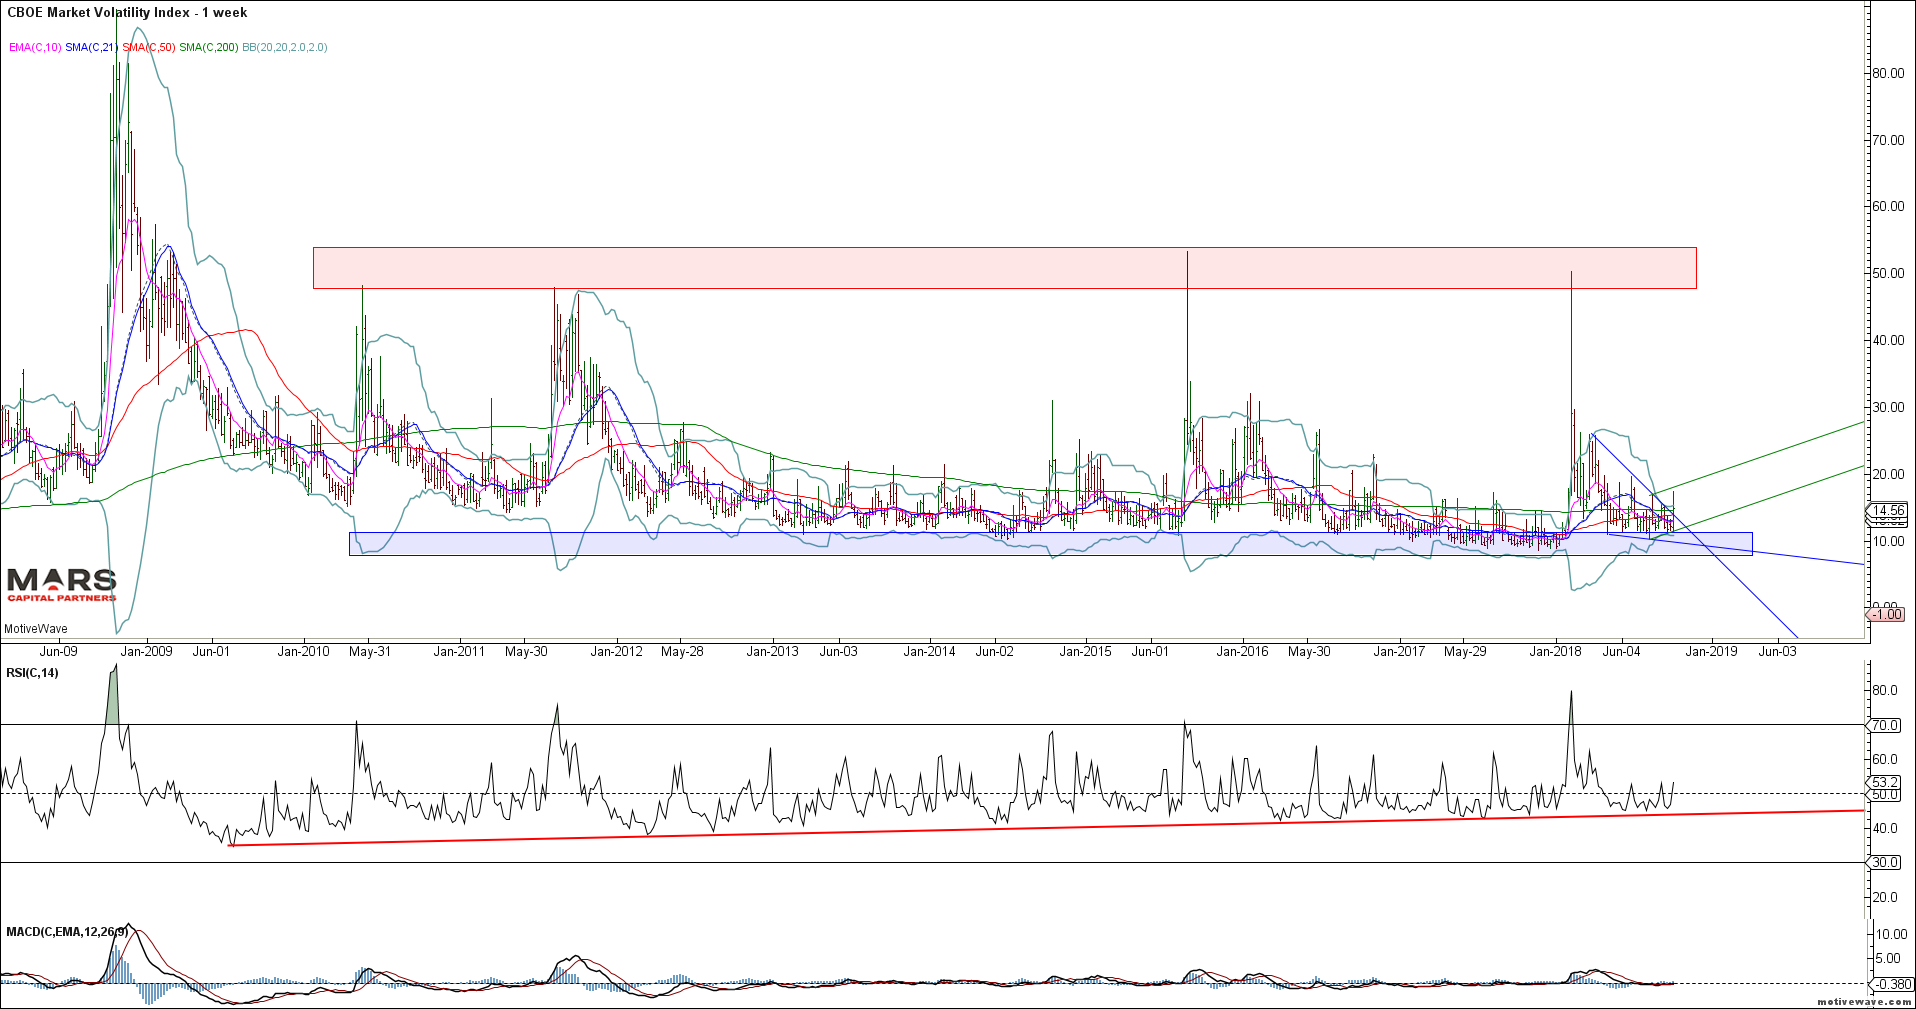
VIX Weekly
VIX traders only know one way – short vol
To the global equity markets and the Nikkei 225 failed to sustain its new cycle highs. While the structure appears to be a 4th wave triangle thrust to new highs (ending 5th wave) we need a decline back below 23000 to confirm that this rally is not extending. Cautiously bearish against new swing highs.
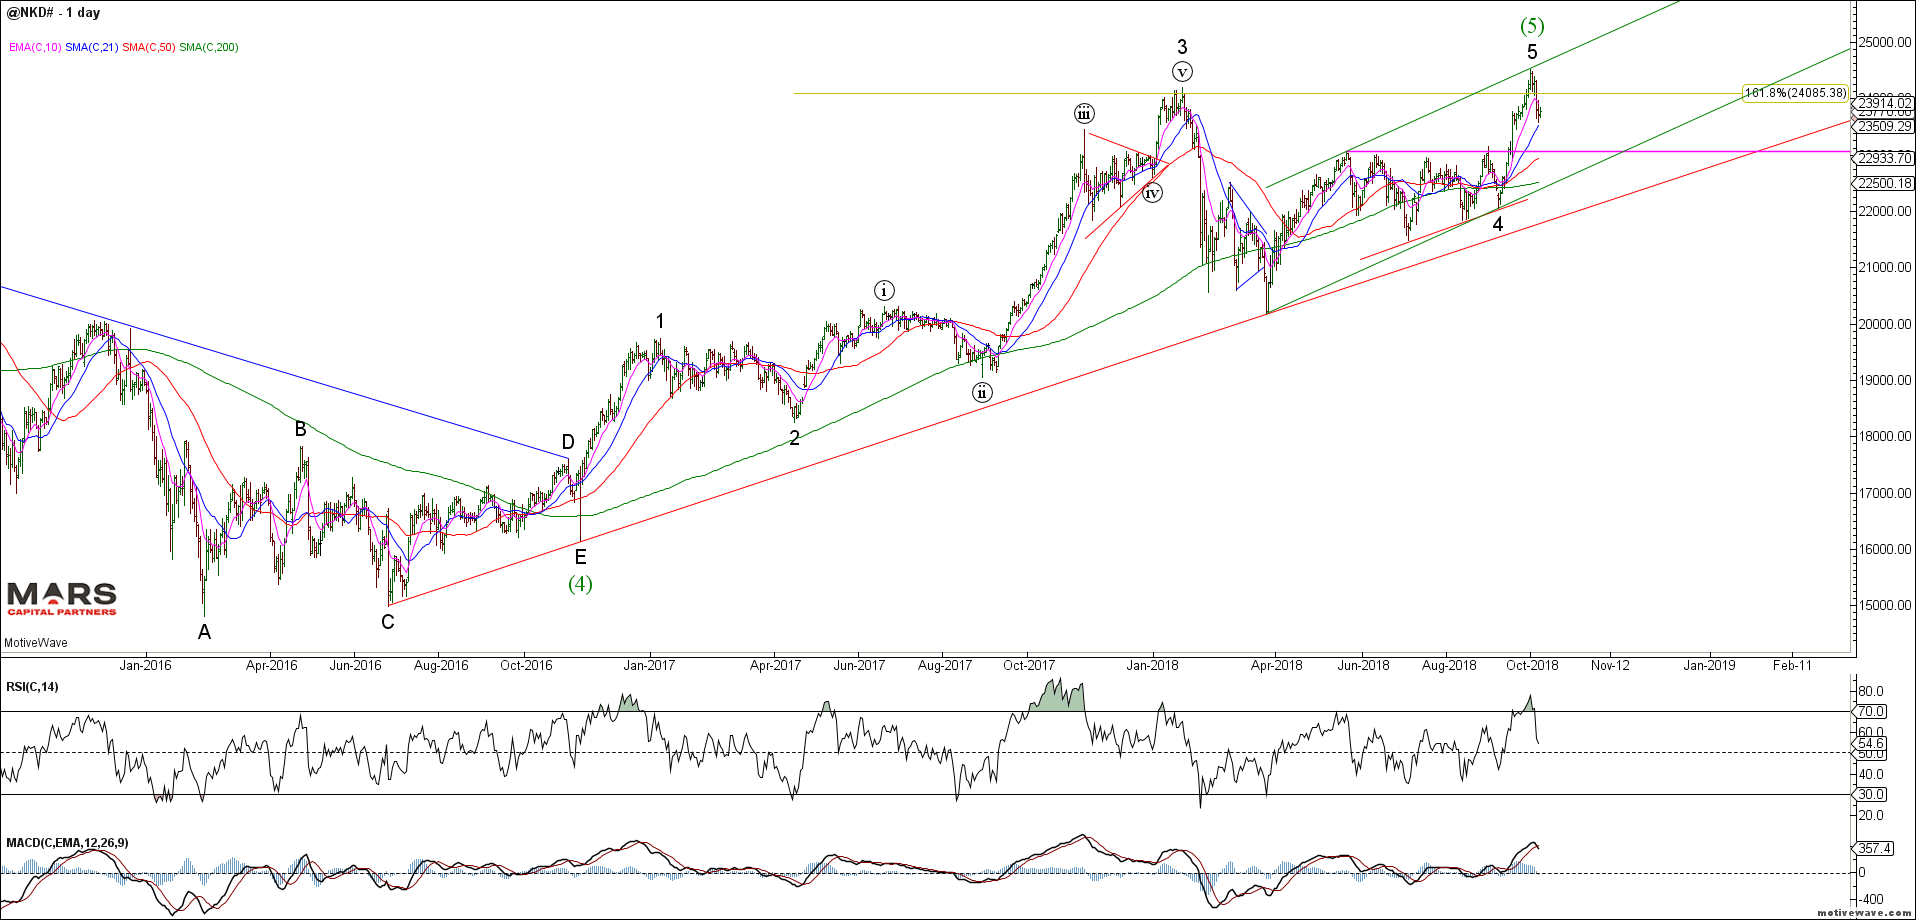
NKD Daily
The question for me is whether this Nikkei 225 rally completes the bigger picture 5 wave rally from the 2008 lows. IF so, we could see a large decline back to the wave 4 extremes in the 15000 area. Too early to call but I am aware of the possibility.
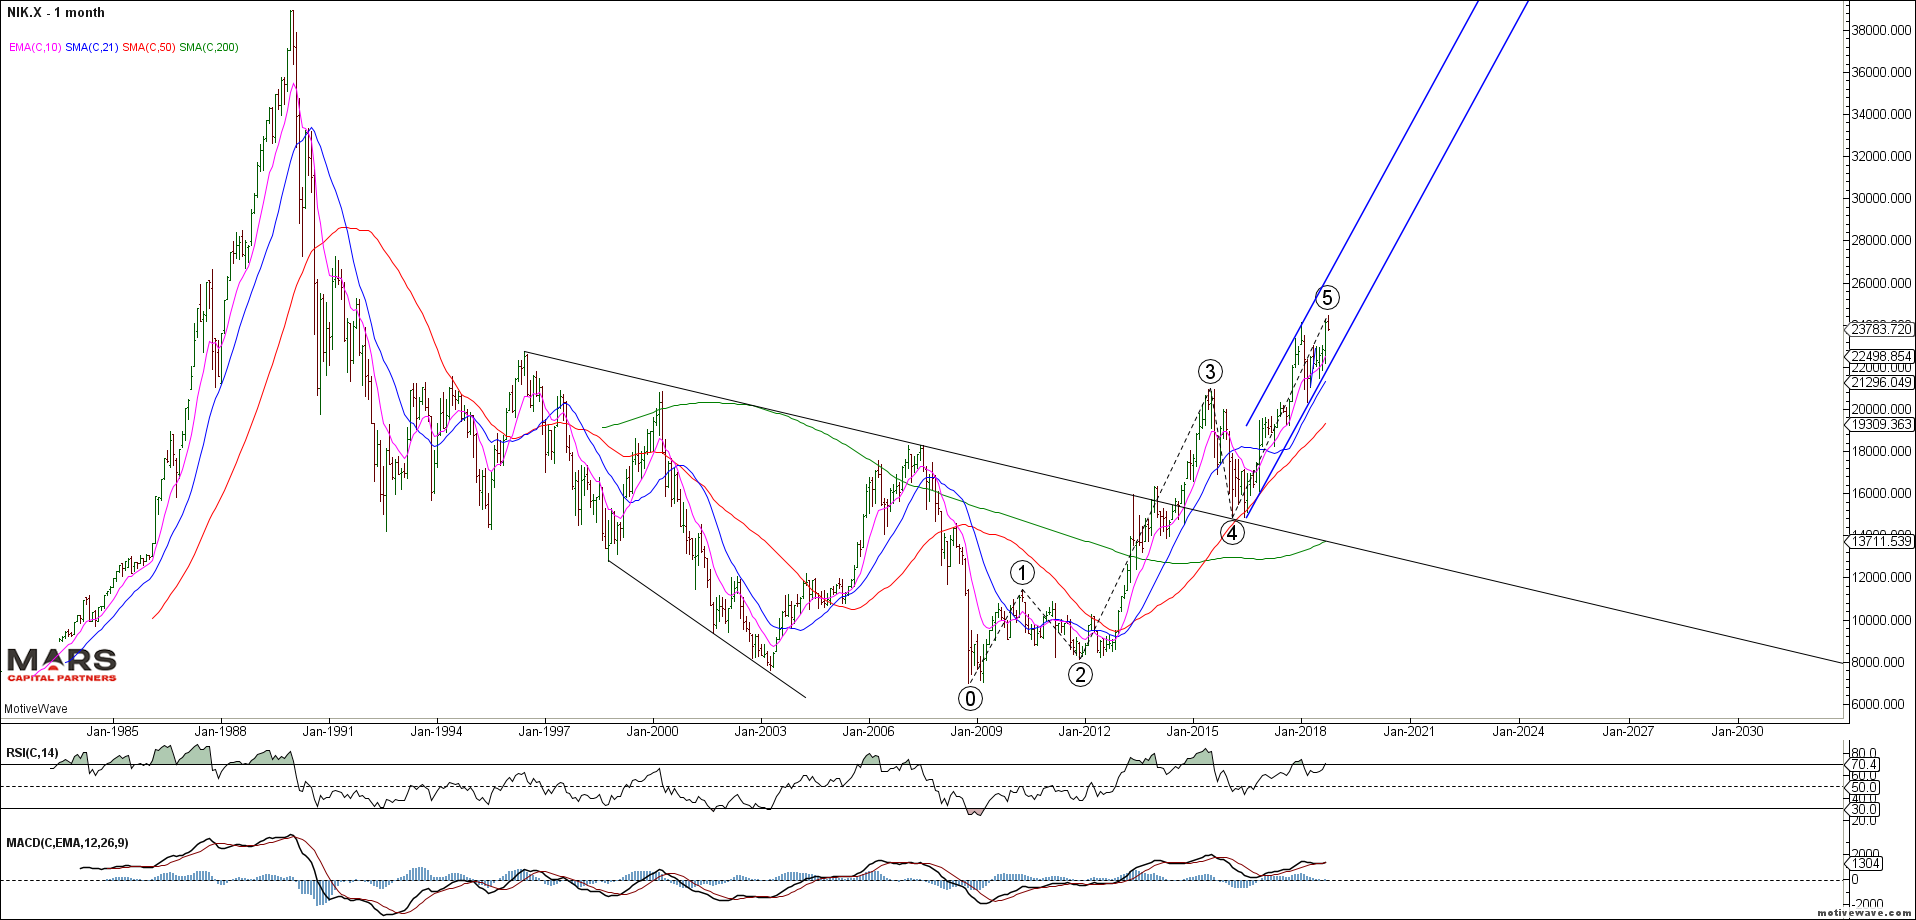
Nikkei 225 Monthly
The ASX200 turned lower from the 50 day sma as expected but remains above previous swing support. We remain bearish looking for a test of the 200 day sma (6180) or rising red trend support (6130). A break of the rising red trend support would be very bearish.
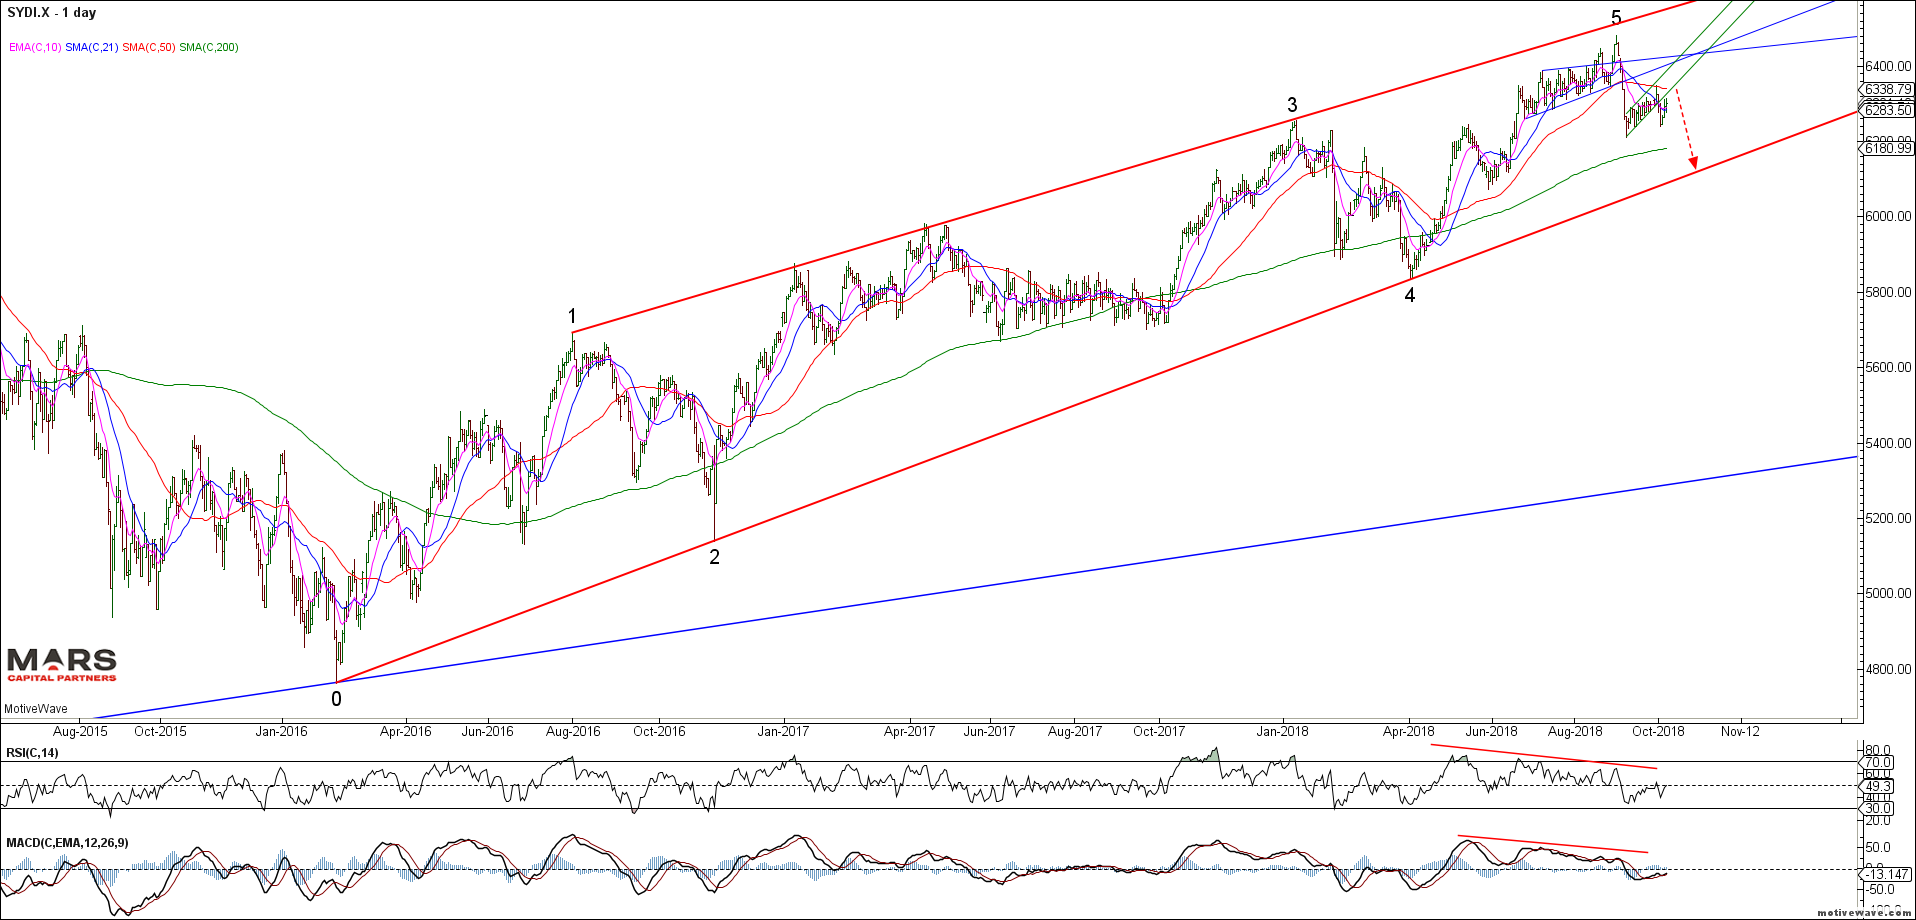
ASX200 Daily
The European markets continue to stall at resistance as the major rounding top pattern remains possible. So far the near term DAX decline is only in 3 waves into 61.8% Fib support. I have no reason to own the European equity markets given the fundamental backdrop. The declining neck line support for the potential H&S resides in the 11500 area. The DAX has been unable to break back above its declining 50 / 200 day sma’s which should probably be our bull/bear line in the sand.
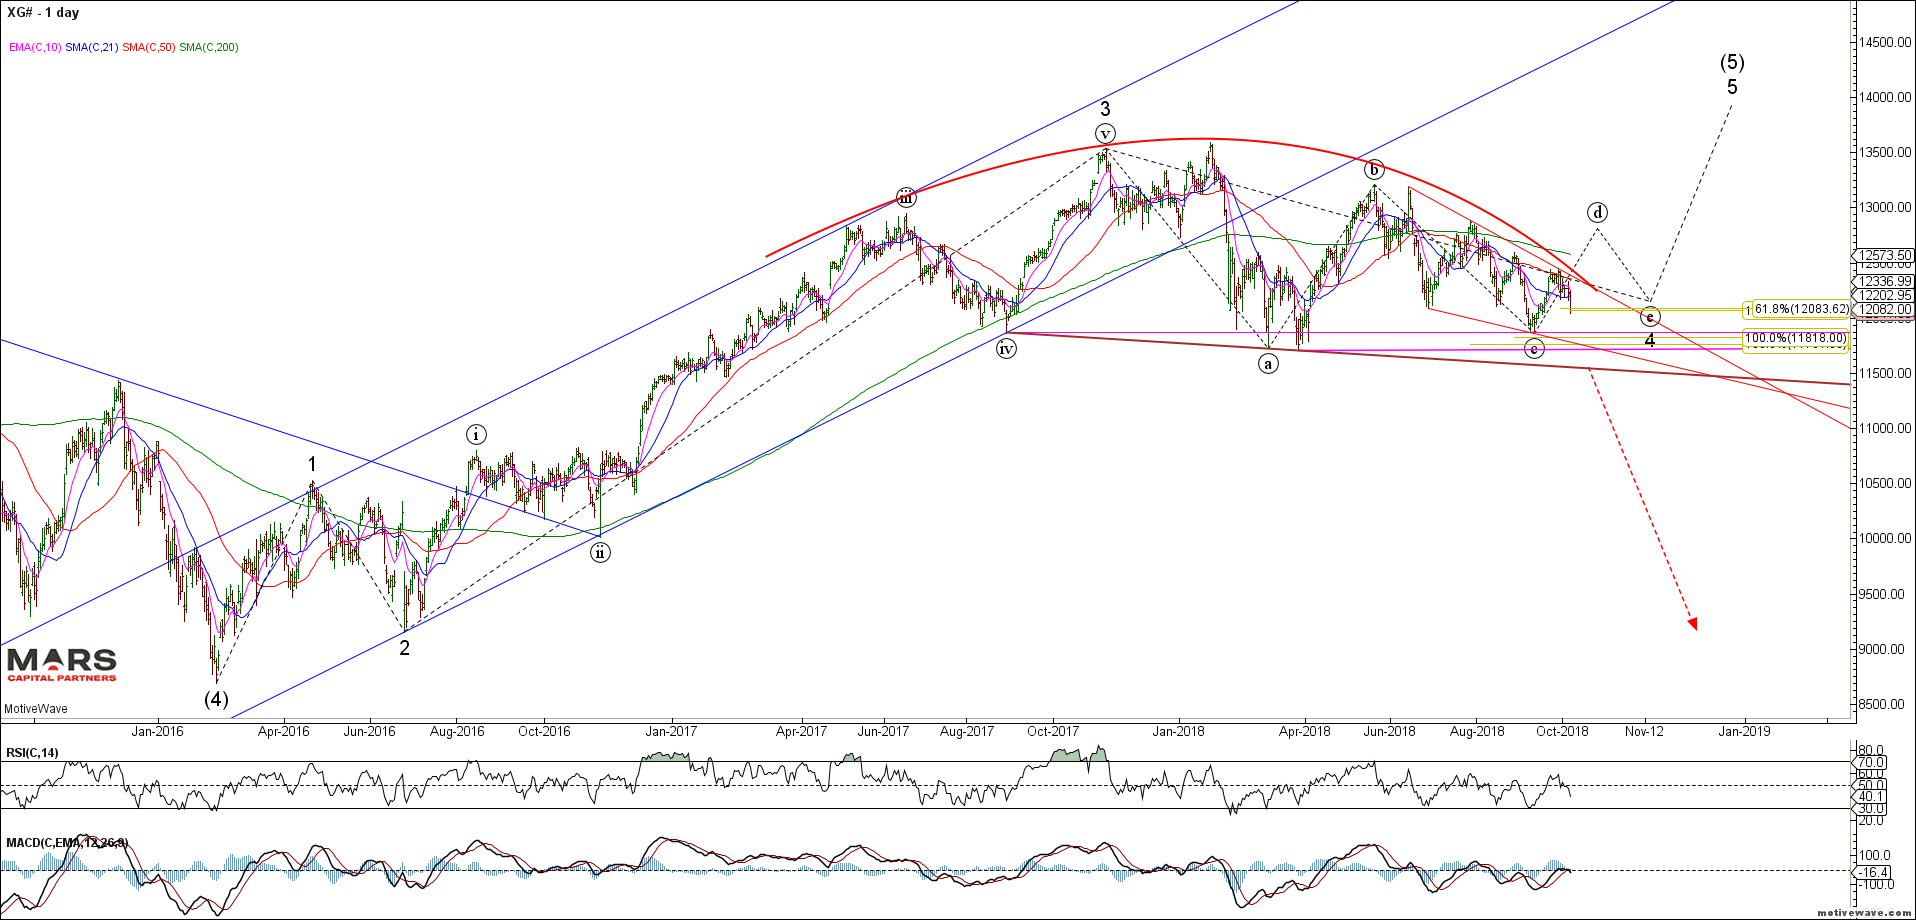
DAX Daily
The near term DAX count is more complex with the bearish red wedge challenging the impulsive looking rallies (green triangle count). This chart appears messy but the key message is that bulls need to make a stand here to avoid a larger breakdown towards 11700.
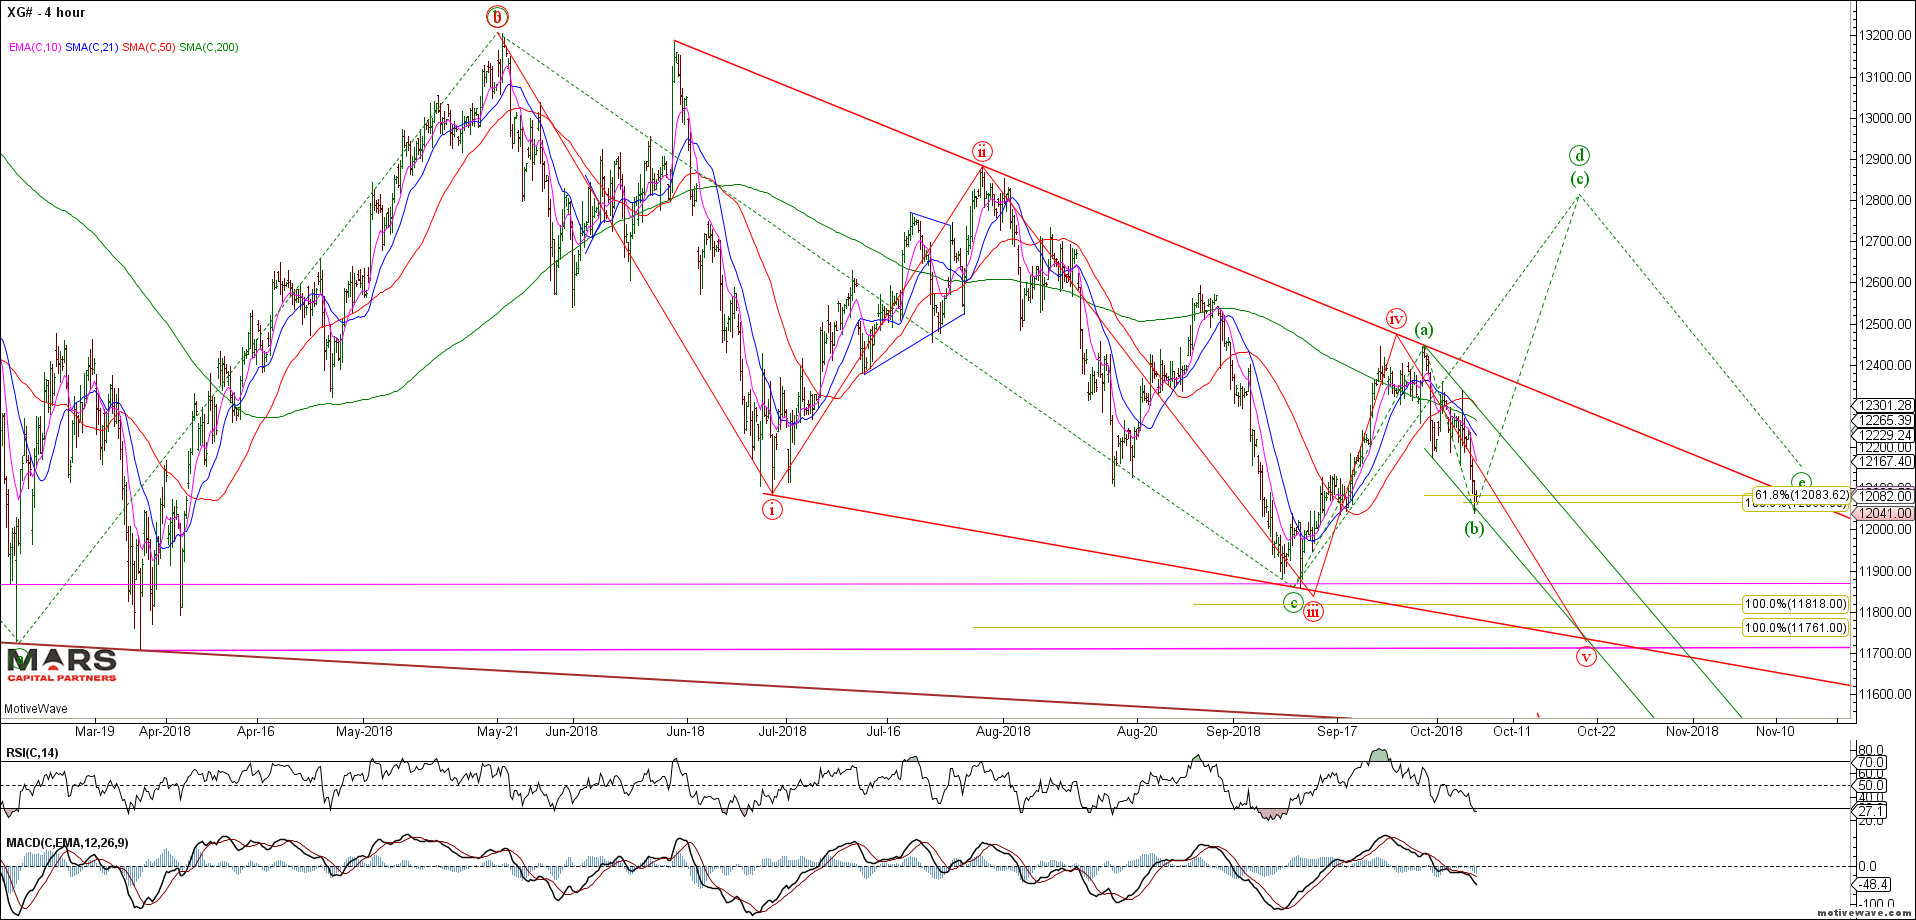
DAX H4
Not surprisingly, EEM continues to stair step lower towards a back-test of the green trend channel breakout. While it may find near term support here, the bigger picture trends of rising rates and a stronger US dollar will continue to pressure emerging market equities. Until something fundamentally changes (eg., resolution of China trade dispute) the bigger picture trend remains down. Trade back above $45 would be bullish.
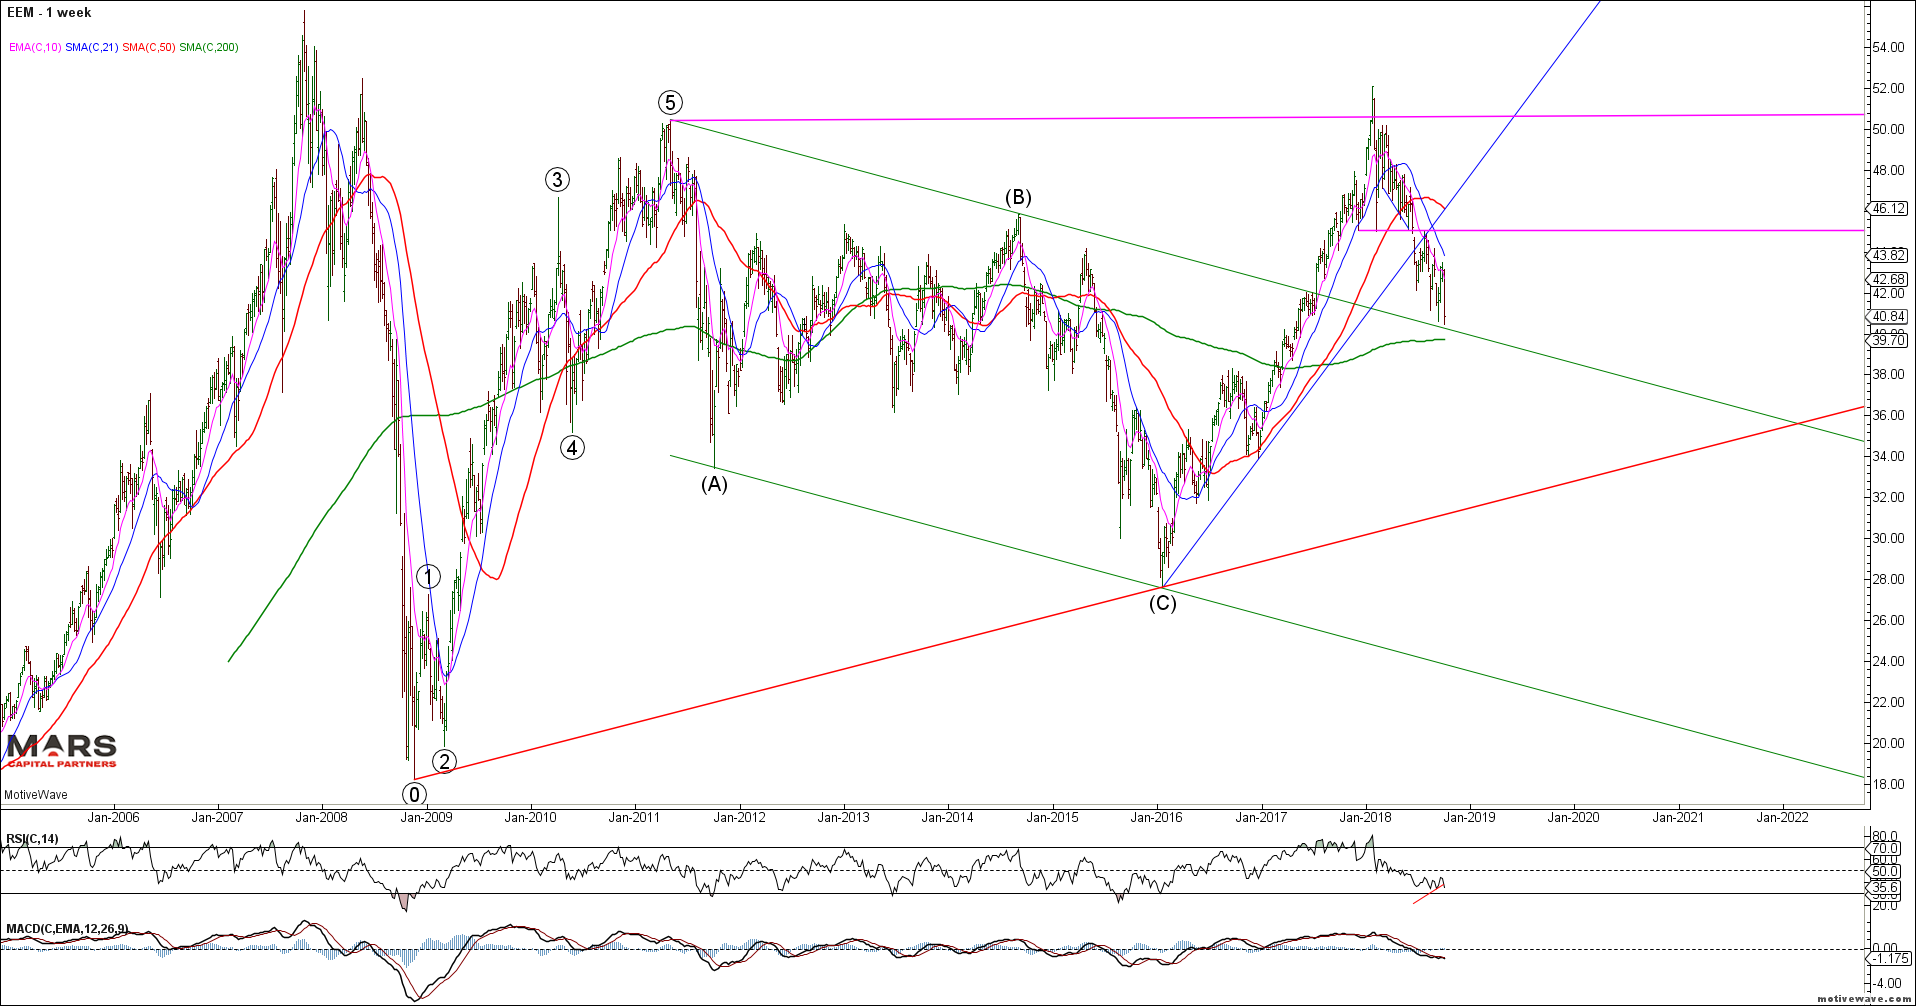
EEM Weekly
To the Bond markets and we finally had a clear break of our 116 “line in the sand” support. Last week we said, “a strong close below the 115-116 shelf support will likely see an acceleration of the downtrend. Key inflection point here for US rates.” – we remain bearish bonds given this fast break lower with targets much lower. Only a close back above 116 would alter this immediately bearish wave count.
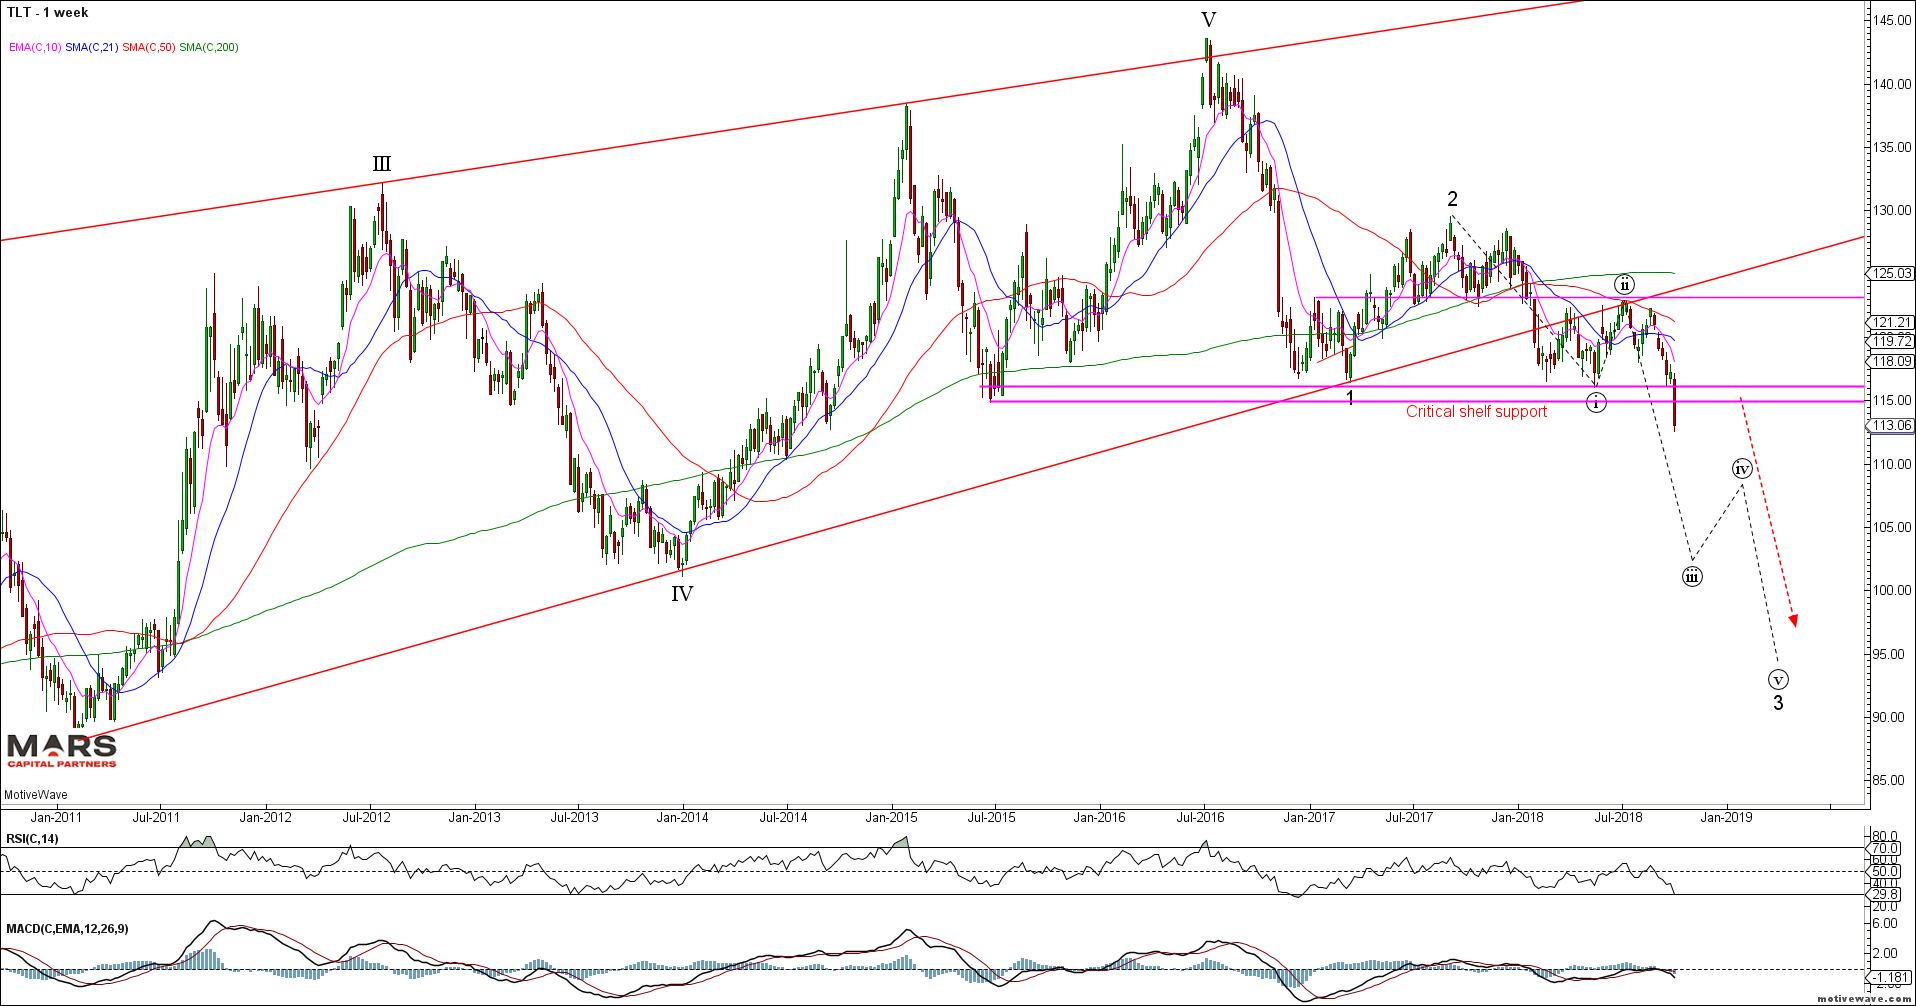
TLT Weekly
The 30yr (ZB) continues to impulse lower following its break of support. While we may see a re-test of the 140 breakdown area on a counter-trend bounce (not likely), the trend remains down until proven otherwise. Given the market’s general bearishness I will remain alert to a potential bullish reversal – in the meantime the trend is your friend. There is nothing bullish about this chart – lower lows and lower highs since the September 2017 counter-trend highs..
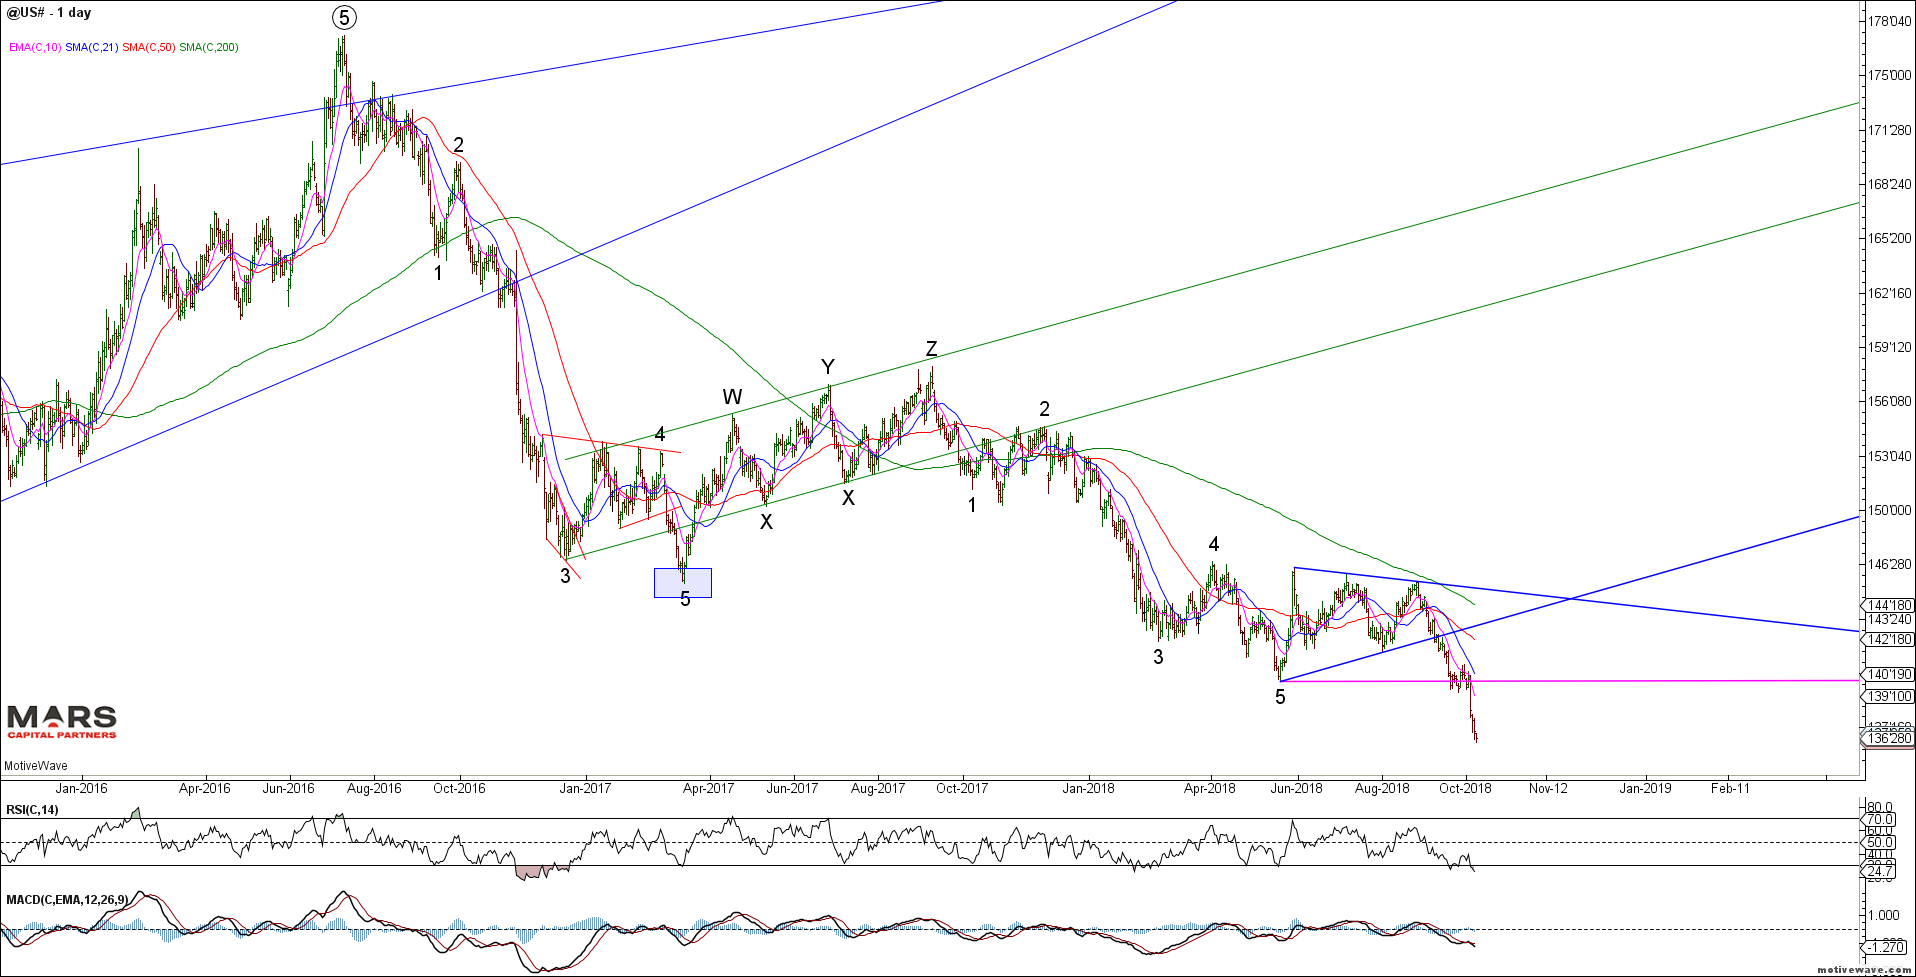
ZB Daily
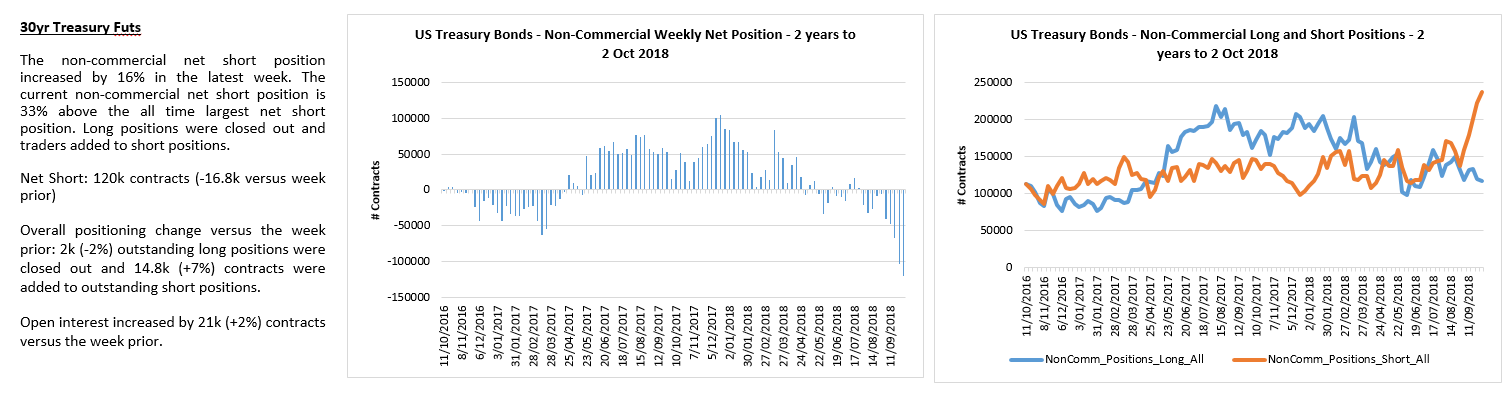
The acceleration in ZB shorts is worrying but you can’t fight the trend until it bends.
The TY continues to break lower in its downtrend as the decline extends. Only a strong close back above the breakdown area and 119’00 would invalidate our bearish outlook.
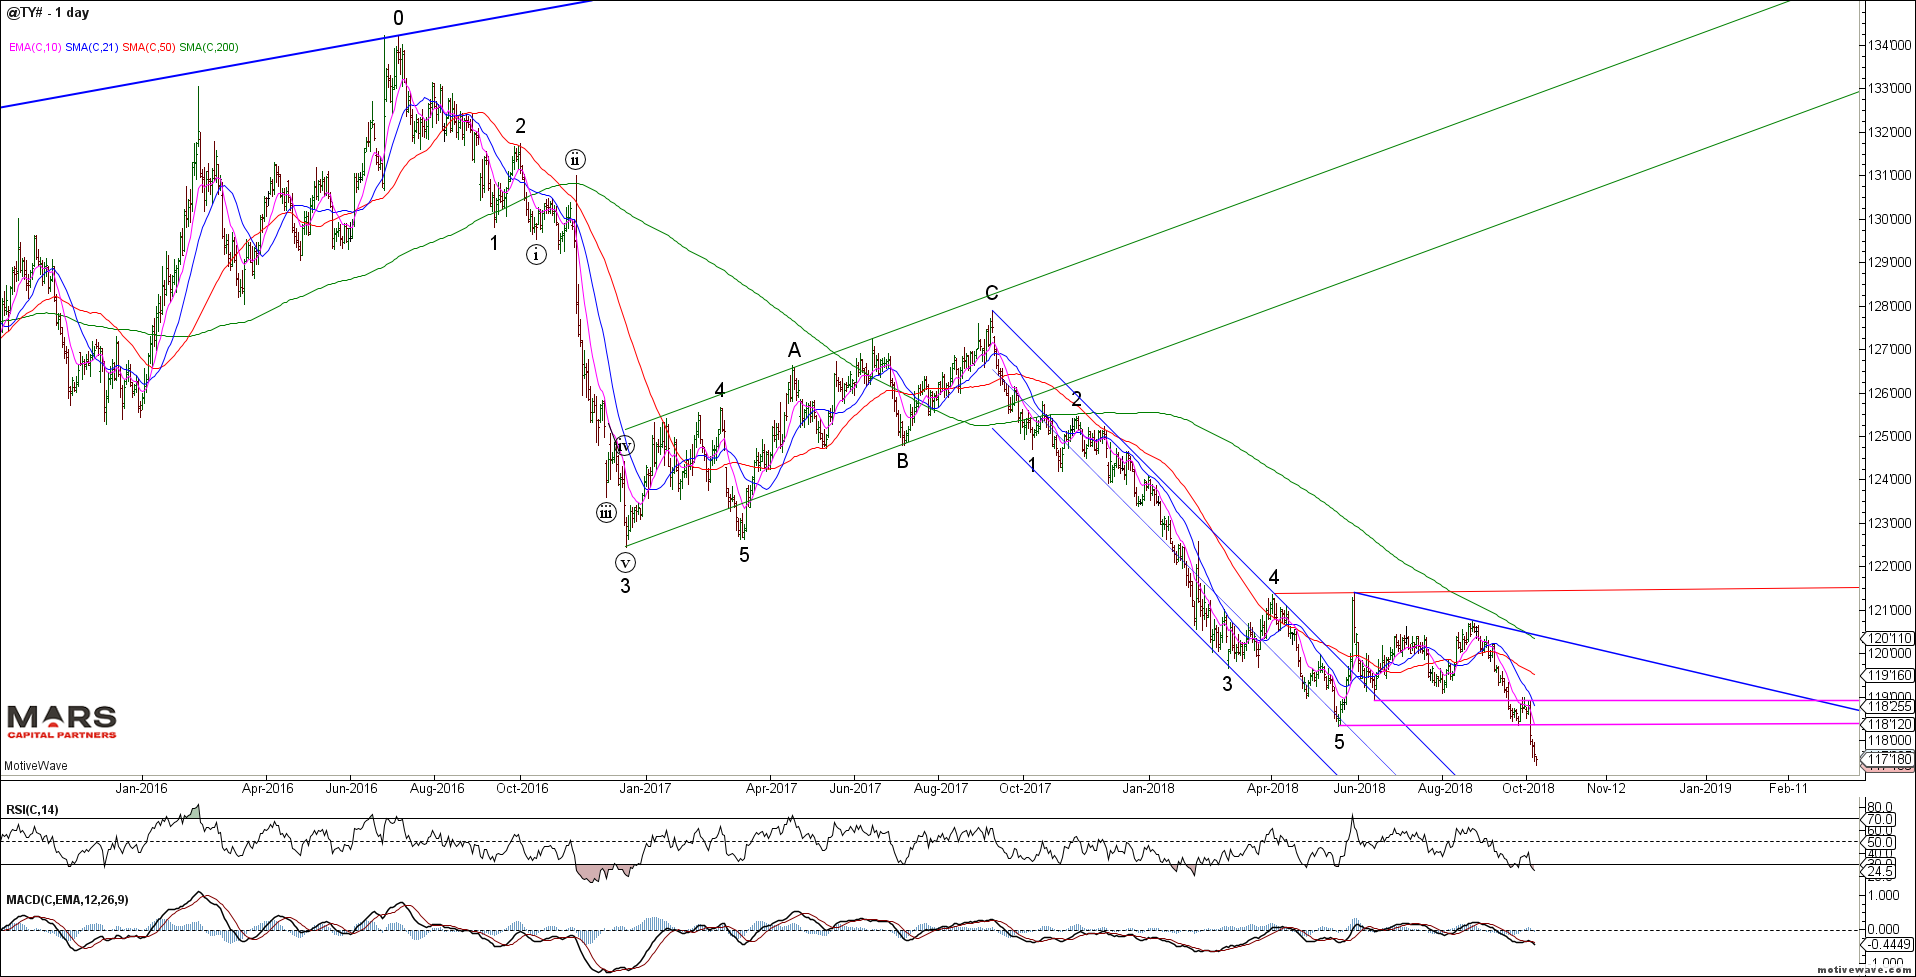
TY Daily
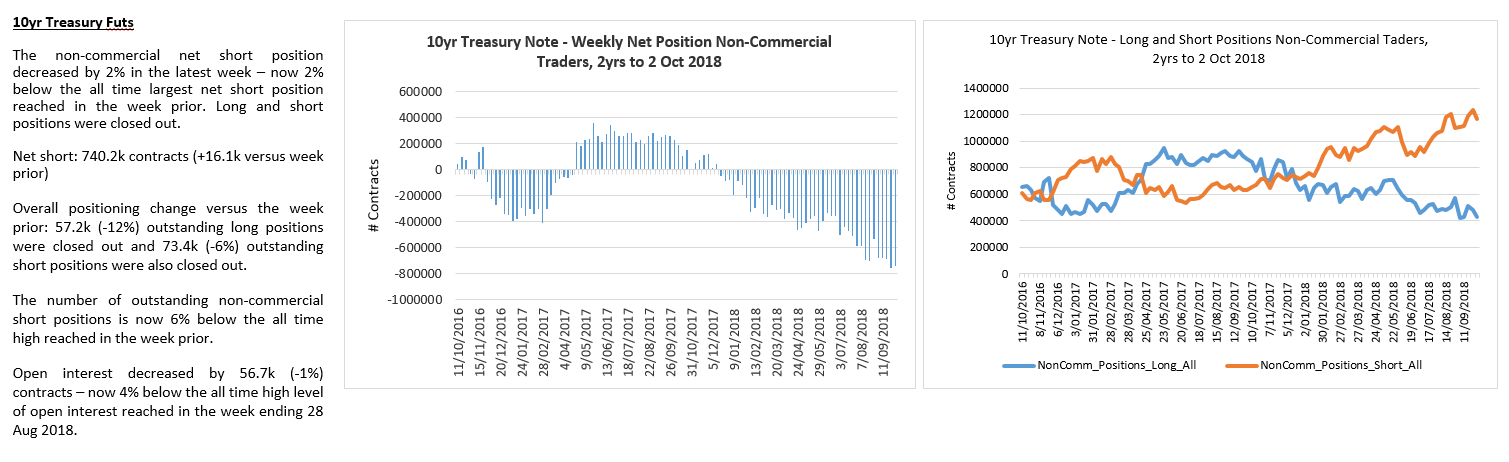
TY bond traders remain heavily net short.
To the FX markets and US dollar strength continued as expected. The latest DXY rally appears impulsive so we remain bullish for at least a retest of the wave A/1 highs against recent swing lows. This is a very crowded trade.
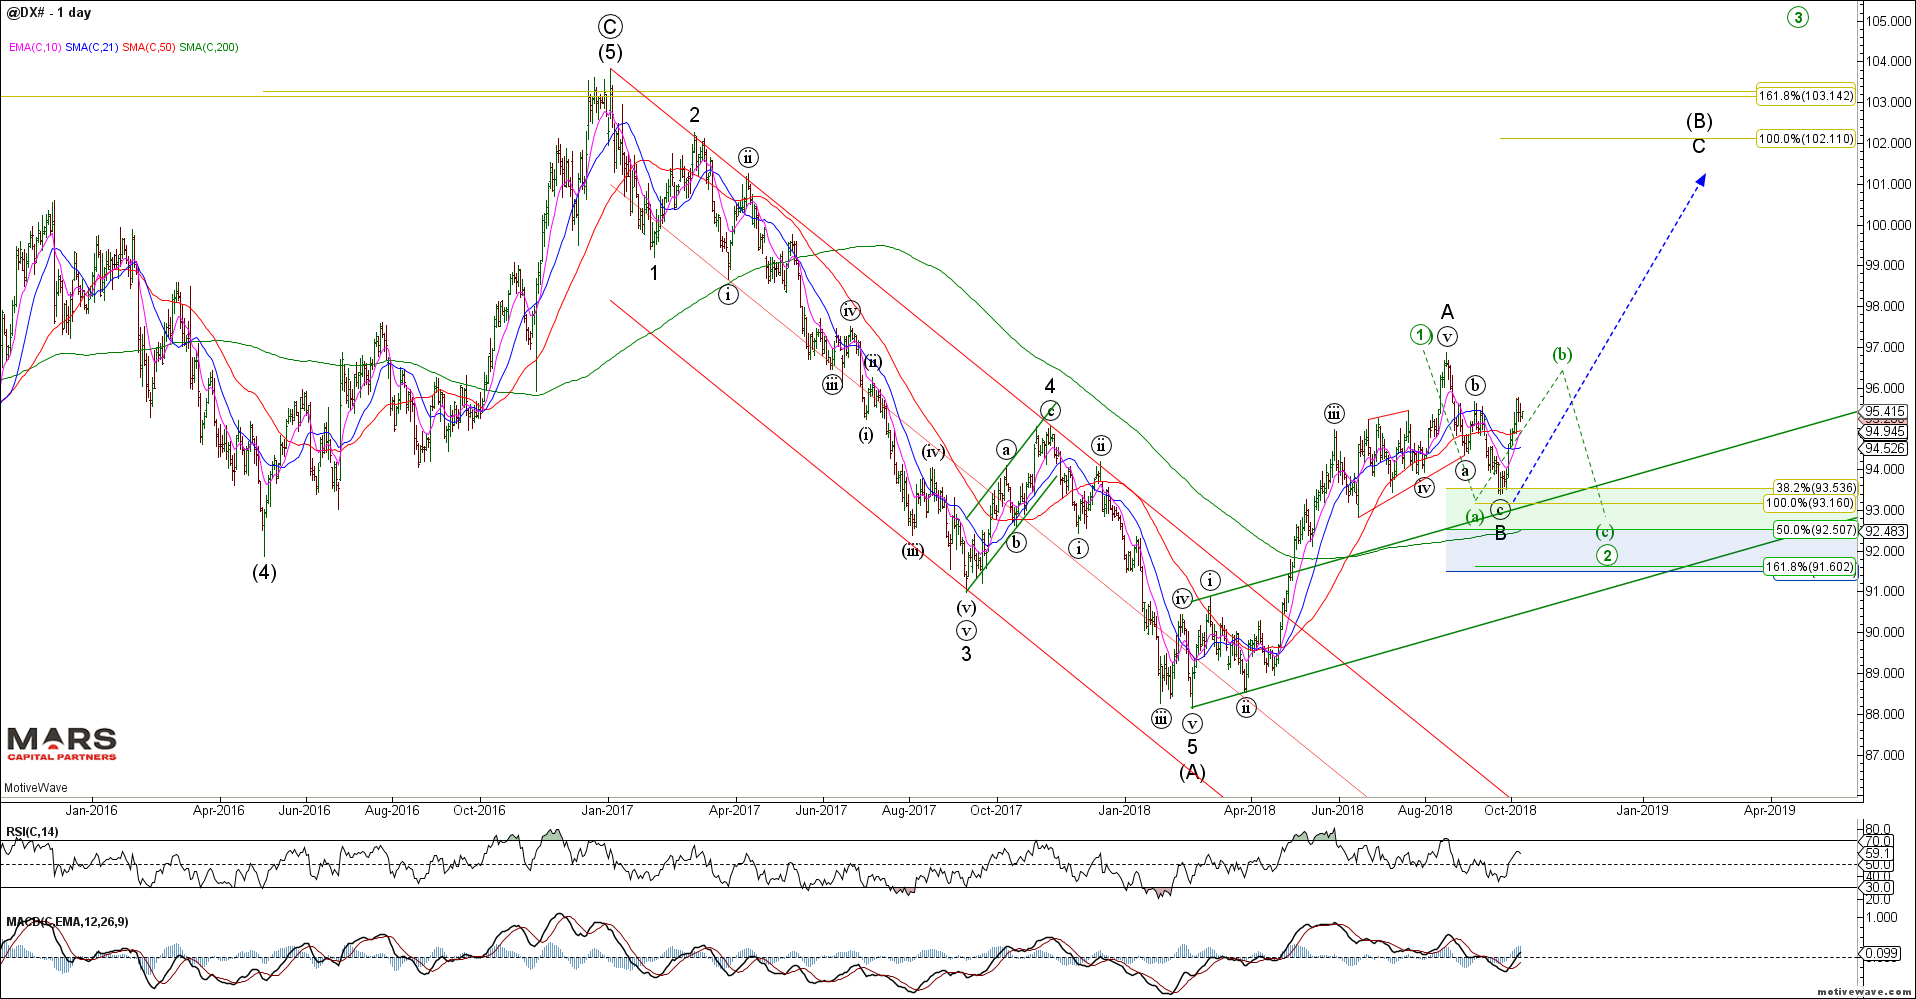
DXY Daily
Near term the DXY trend has enough waves in place to potentially complete a smaller degree wave (i) / (a) but there are no strong signs of a top. Any decline back towards 94.30-94.60 would likely be an opportunity to add longs. The bigger picture trend remains higher.
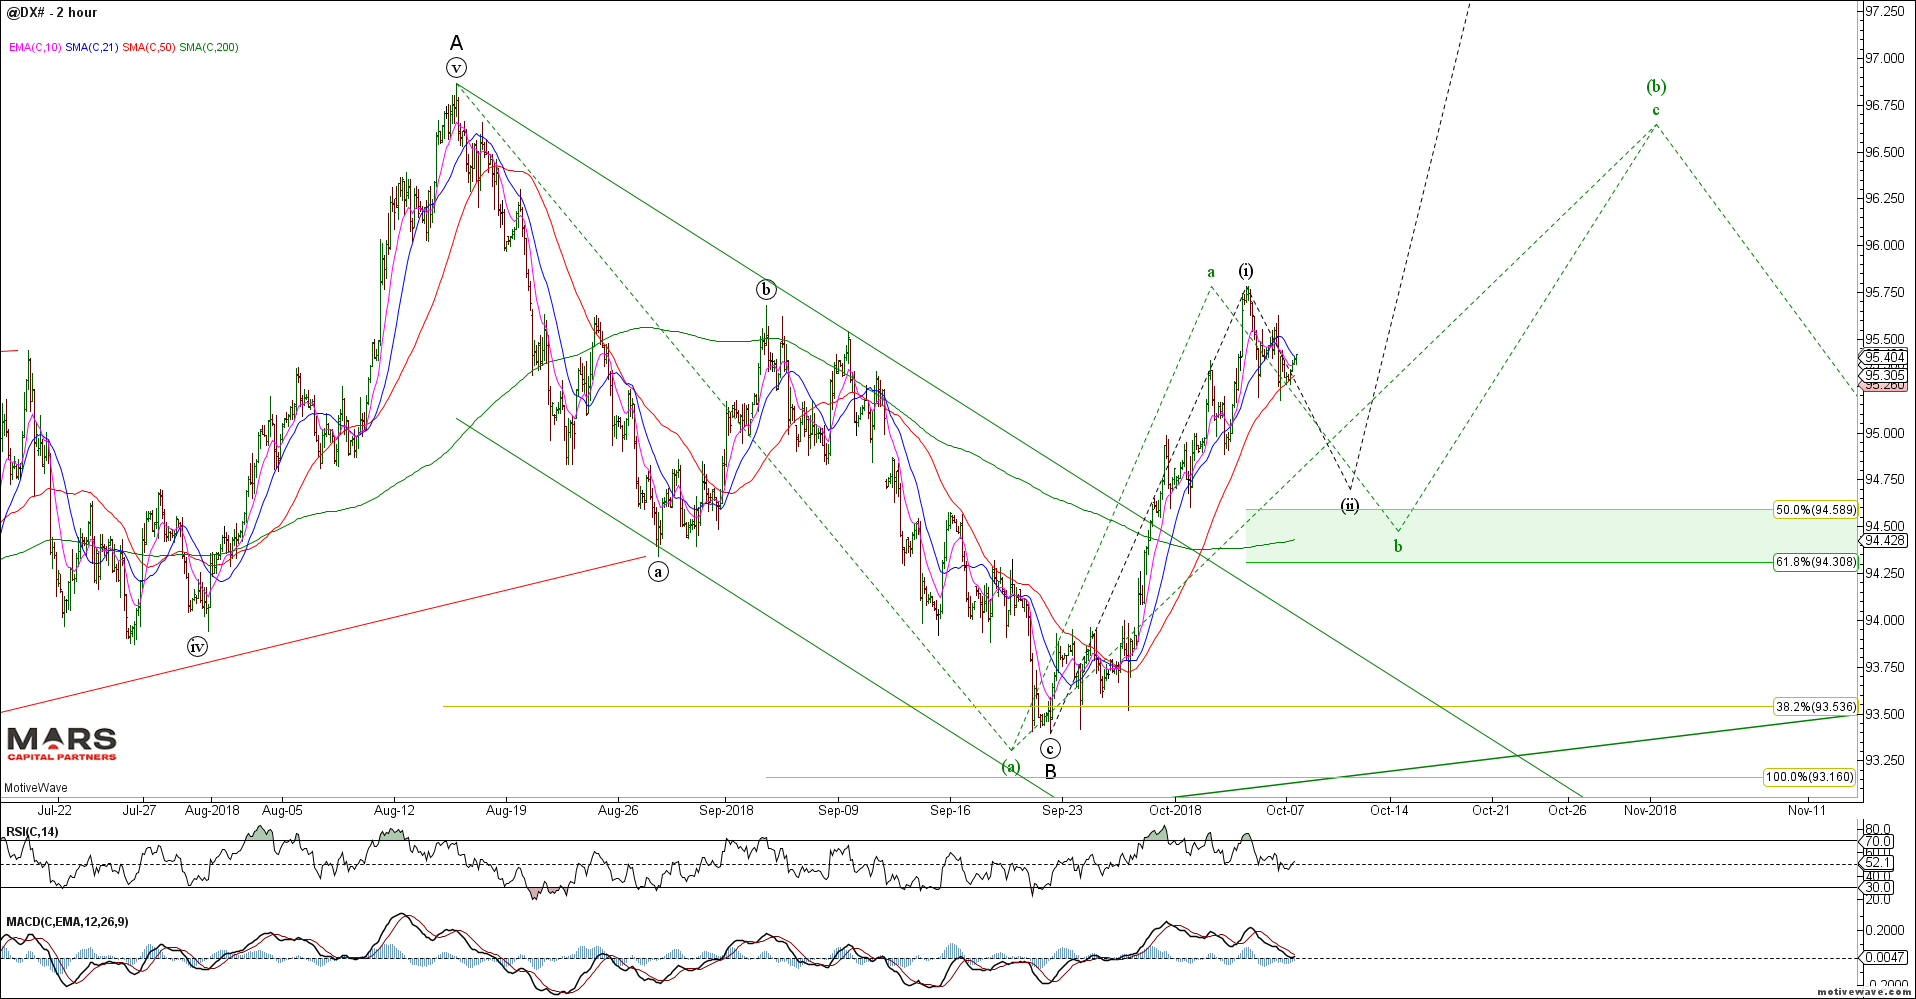
DXY H2
The DXY appears to be another one-sided bet.
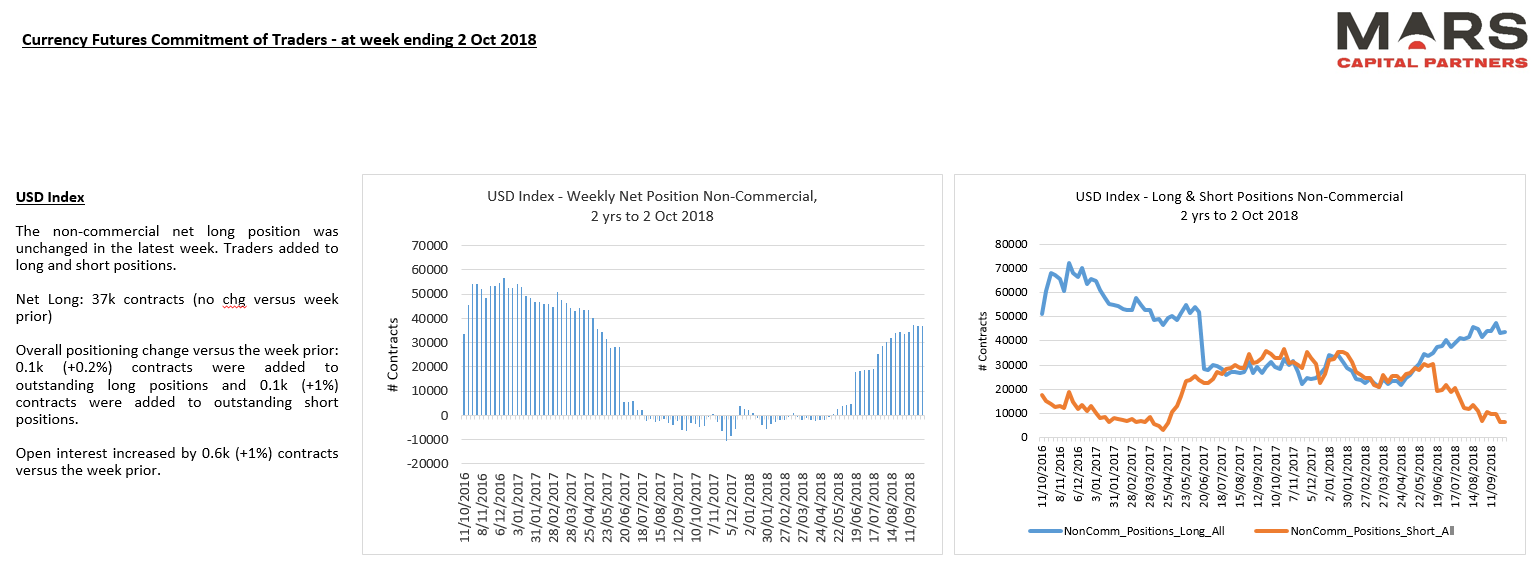
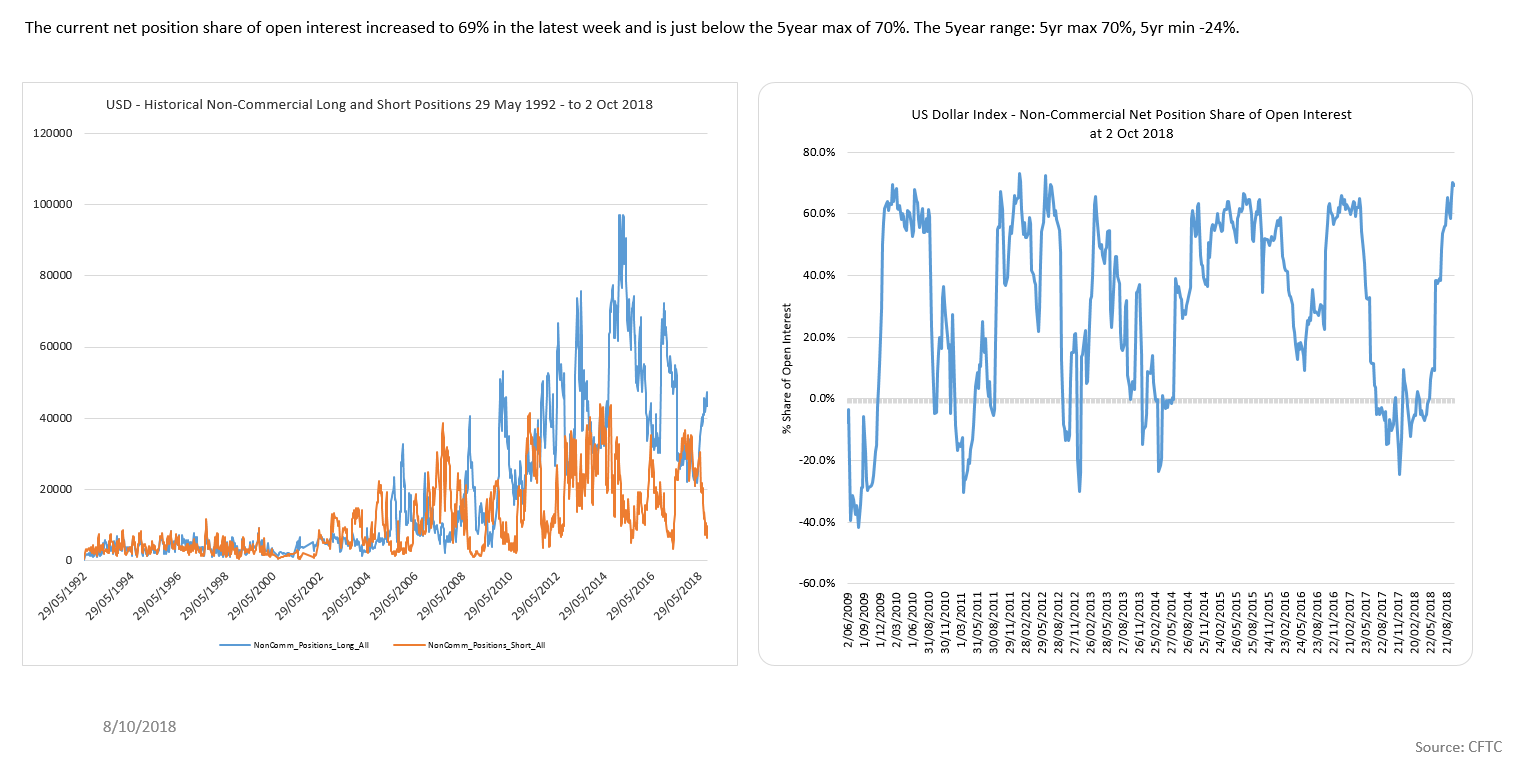
The DXY net position share of open interest is pushing multi-year highs once again.
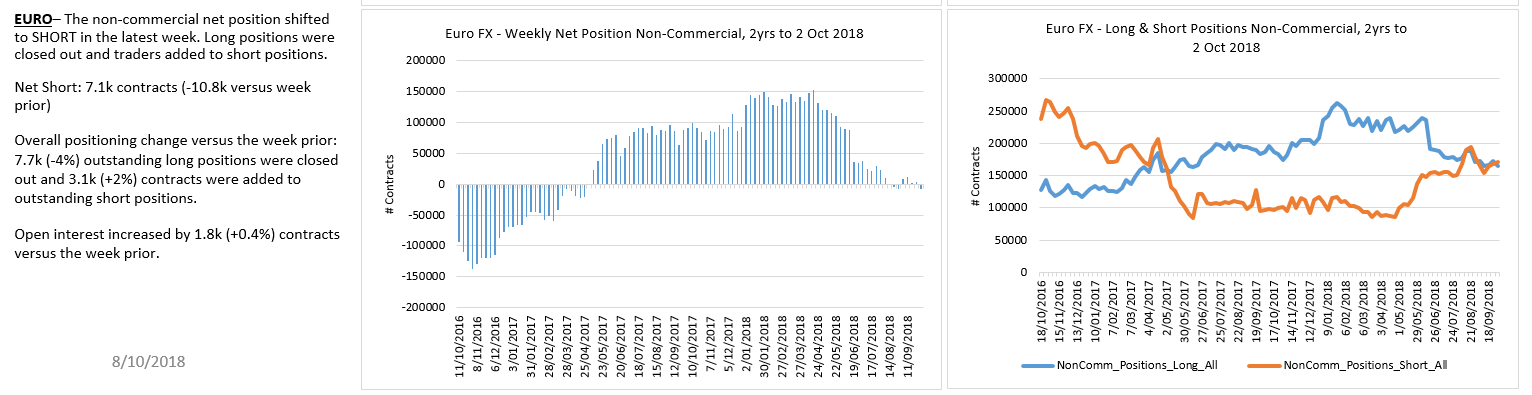
Similarly, the Euro continues to decline impulsively from recent swing highs. The big picture trend remains down. The question is whether this recent decline is part of a larger corrective structure (green count) or something more immediately bearish.
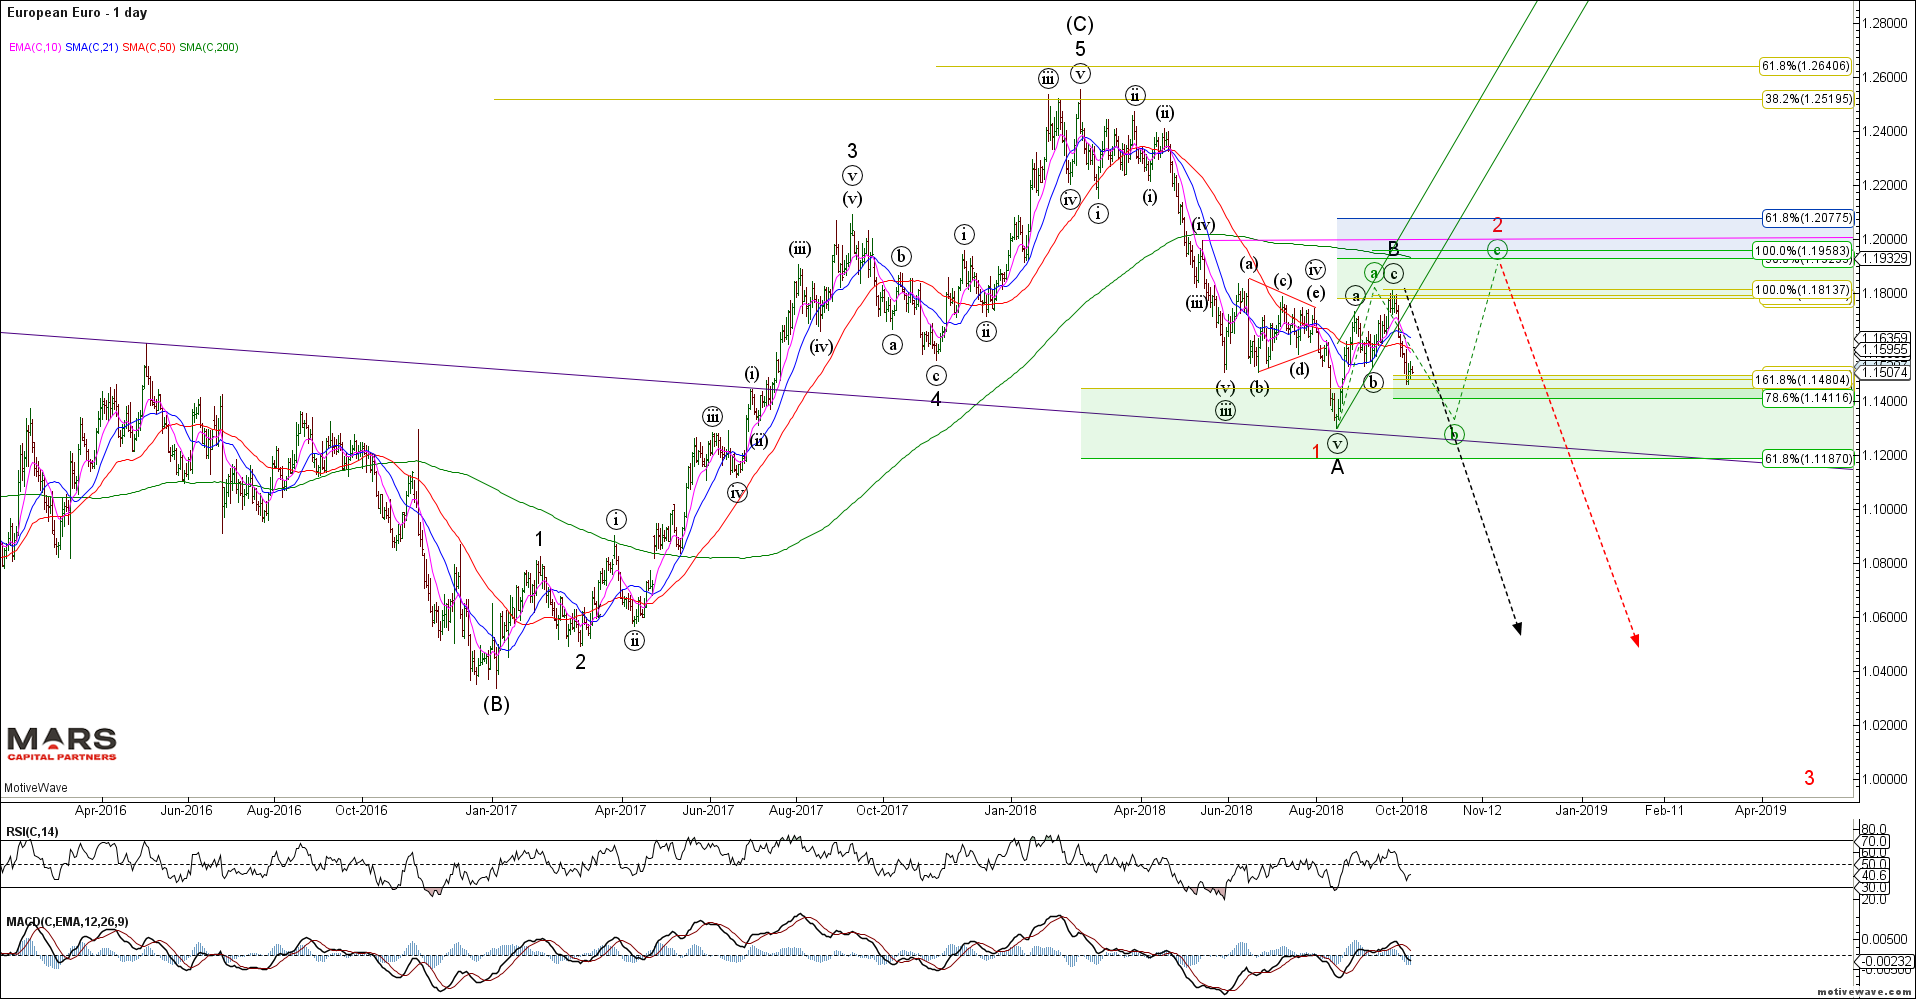
EURUSD Daily
Near term the Euro has enough waves in place to complete its initial decline. Any counter-trend rally should find resistance in the 1.1600-1.1680 area before the next wave lower for (iii) / (c). We remain bearish the Euro as we look for a retest of the 1.1300 lows.
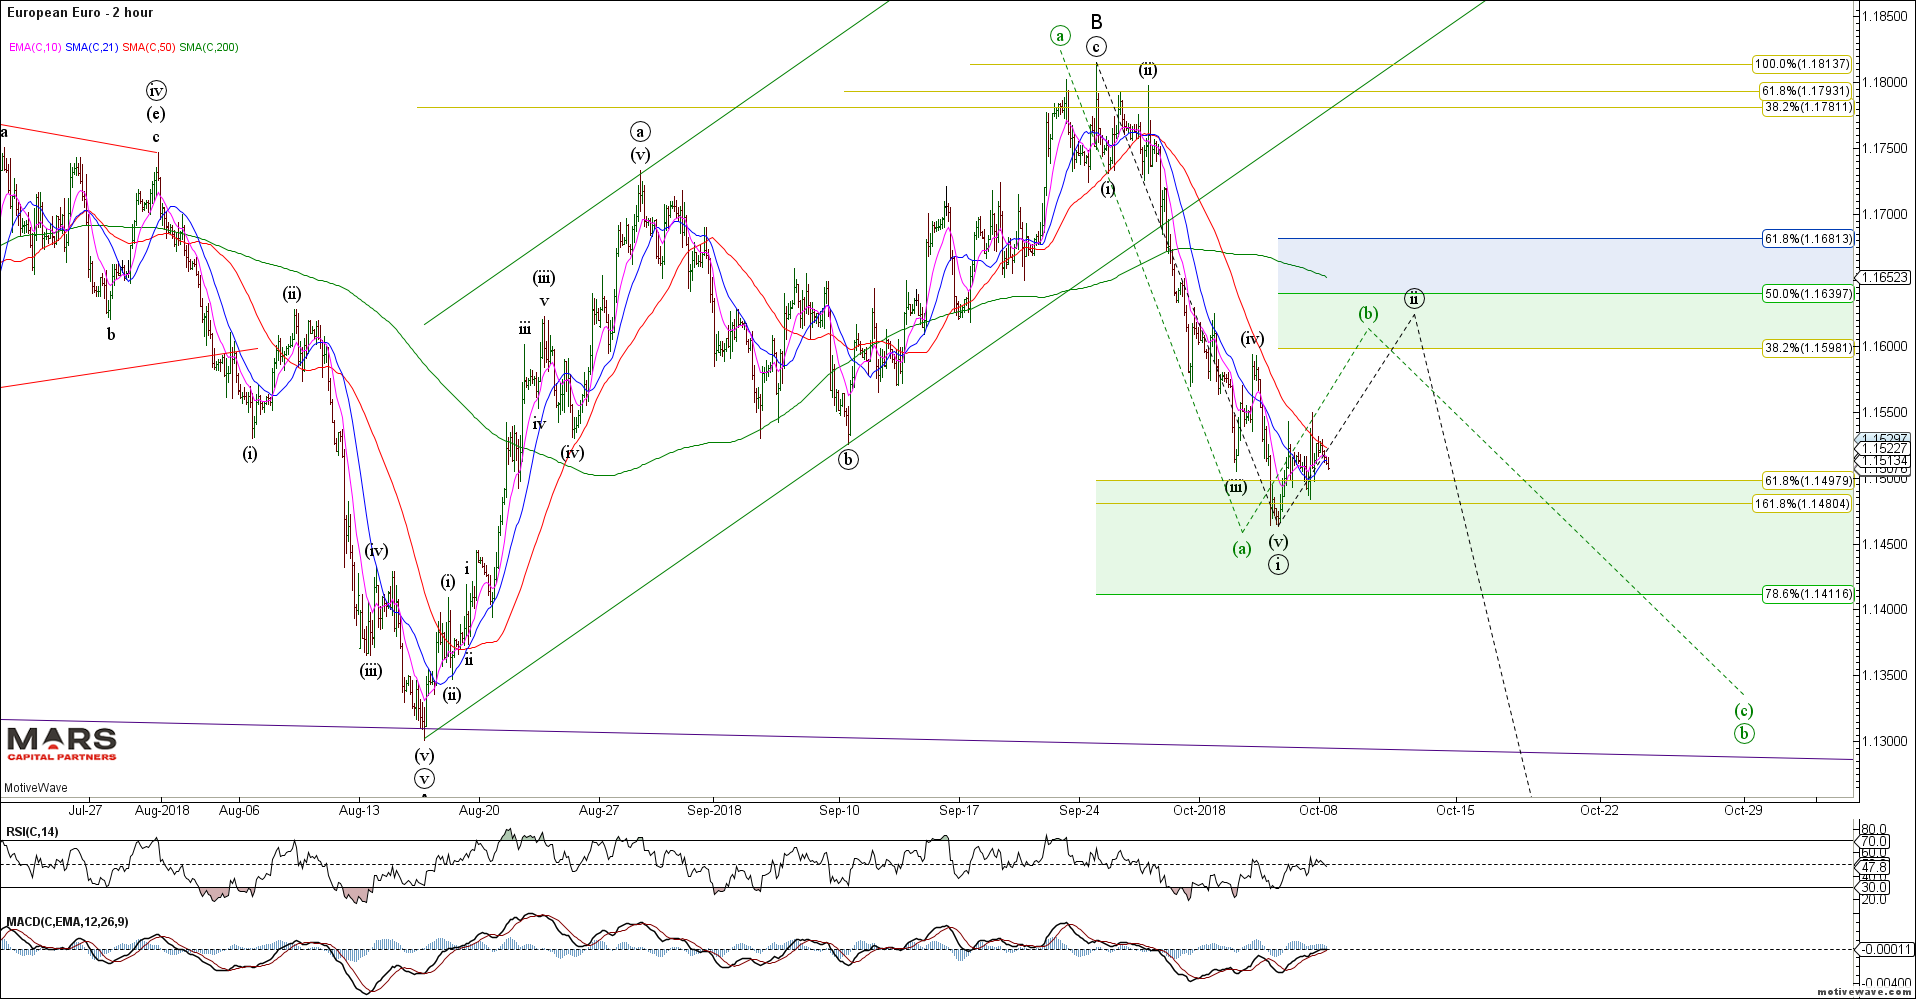
EURUSD H2
Surprisingly, Euro traders appear flat.
The USDJPY has stalled at our first resistance area (114.55-90) with enough waves to complete red wave (c). A close above 115 near term resistance likely sees a push higher towards our next targets in the 117 area.
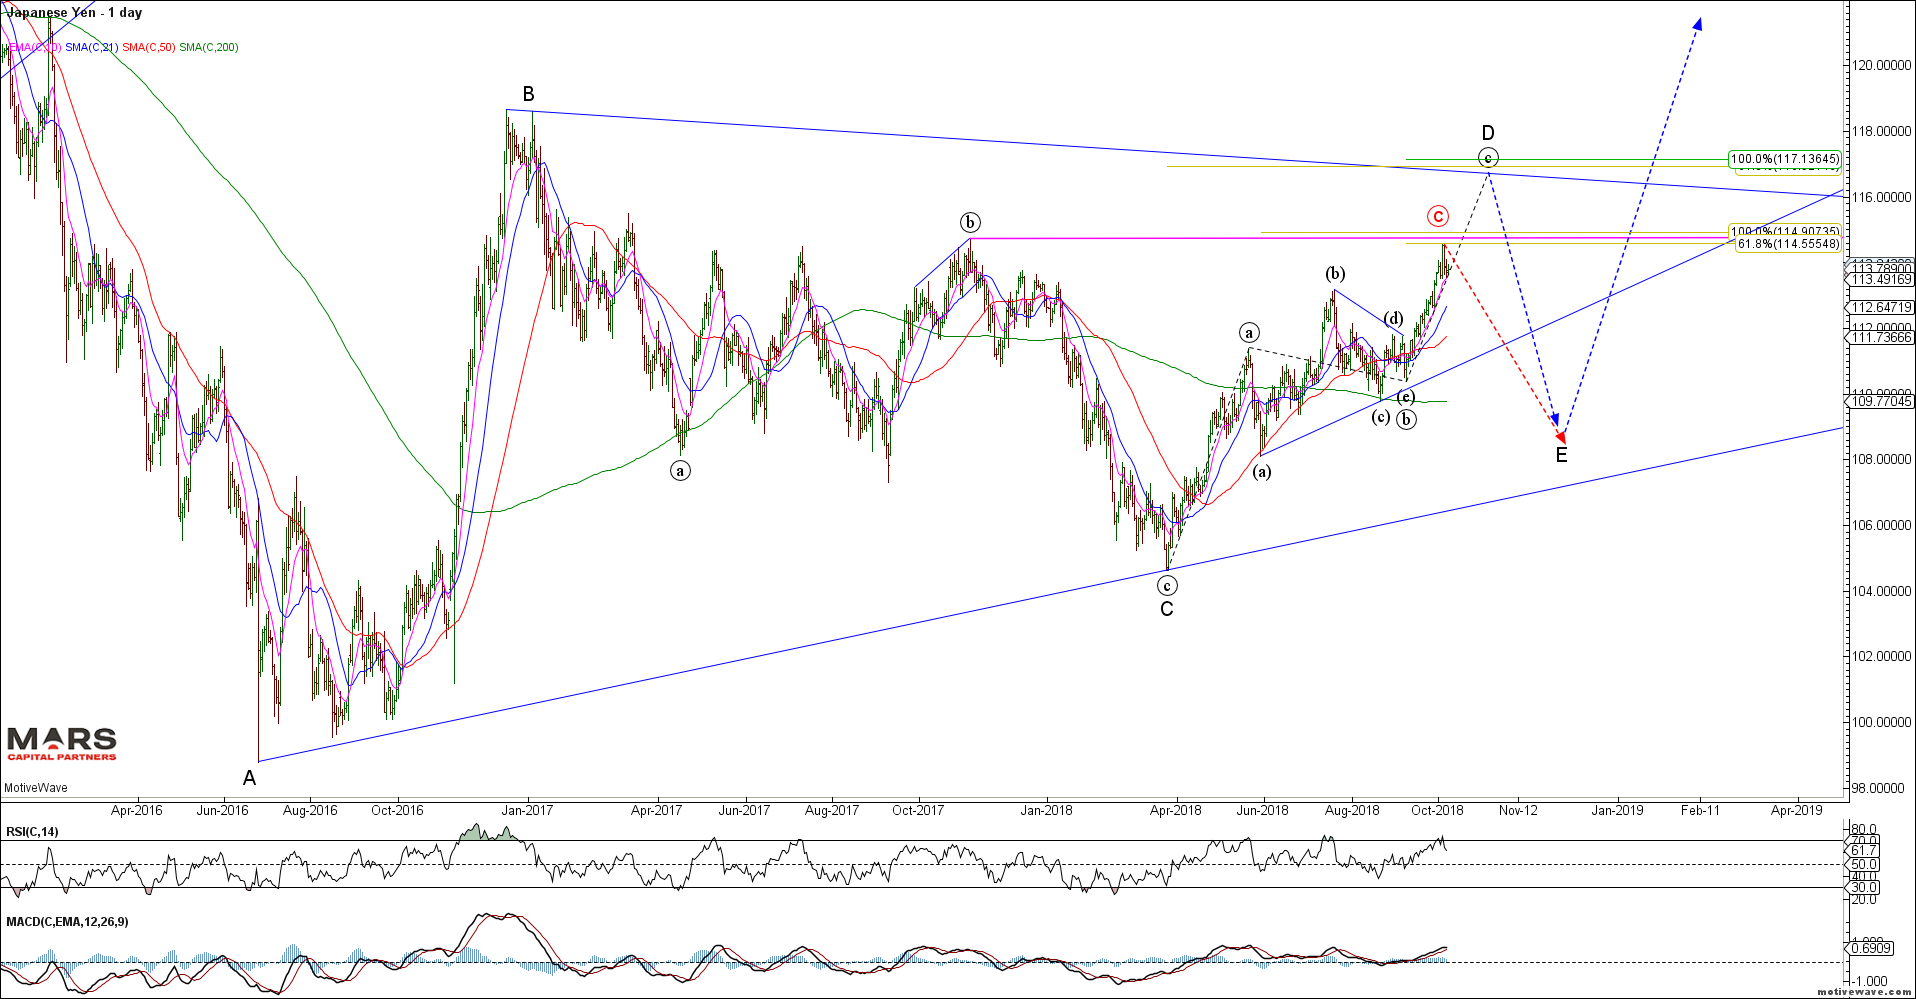
USDJPY Daily
Near term the USDJPY may be forming a small degree H&S top likely confirmed on a break below 113.50 – this is highly speculative but I like the R/R for a potential near term top.
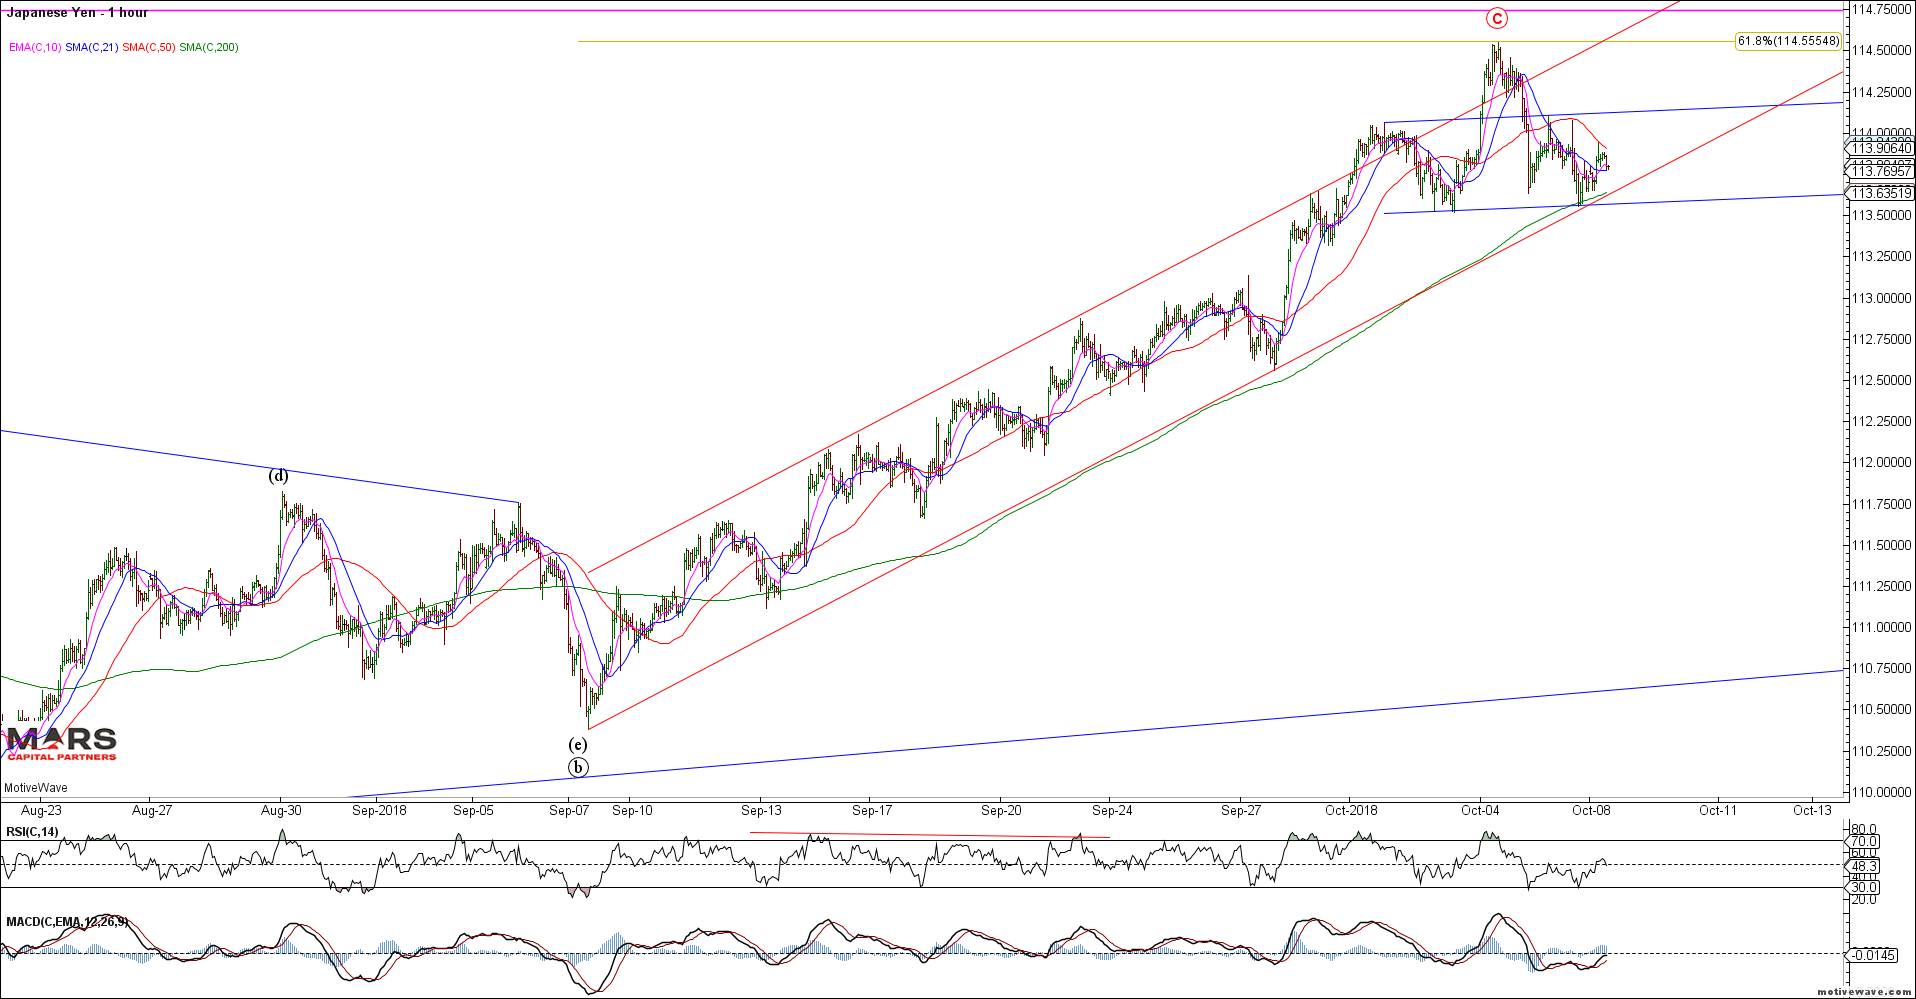
USDJPY H1
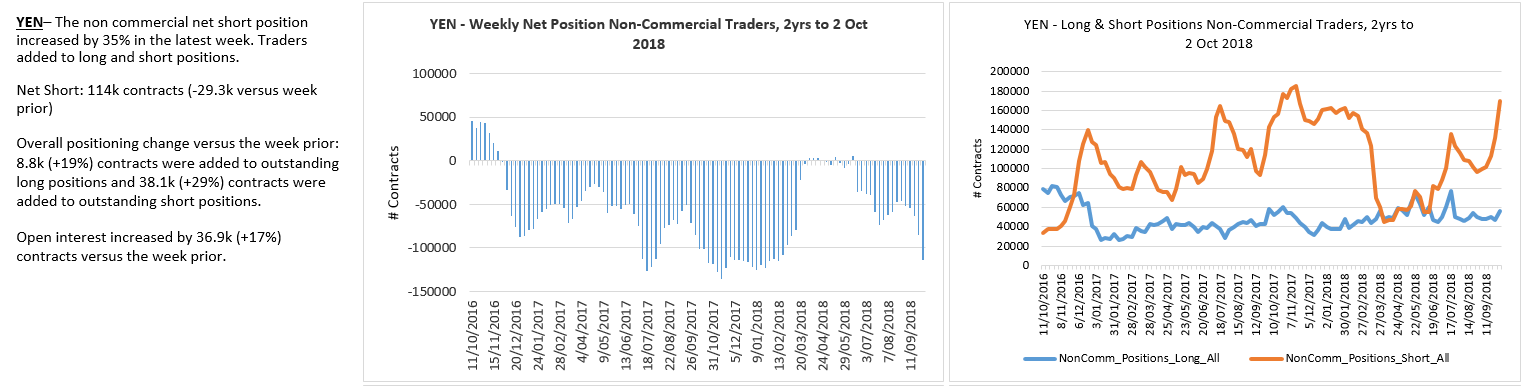
Yen shorts have spiked higher – prefer to fade this crowd.
The Aussie$ broke to new cycle lows last week after another failed rally attempt. The 50 day sma continues to act as strong resistance for this downtrend – there is no reason to buy the Aussie$ as it continues to trend lower into major 0.6830 support.
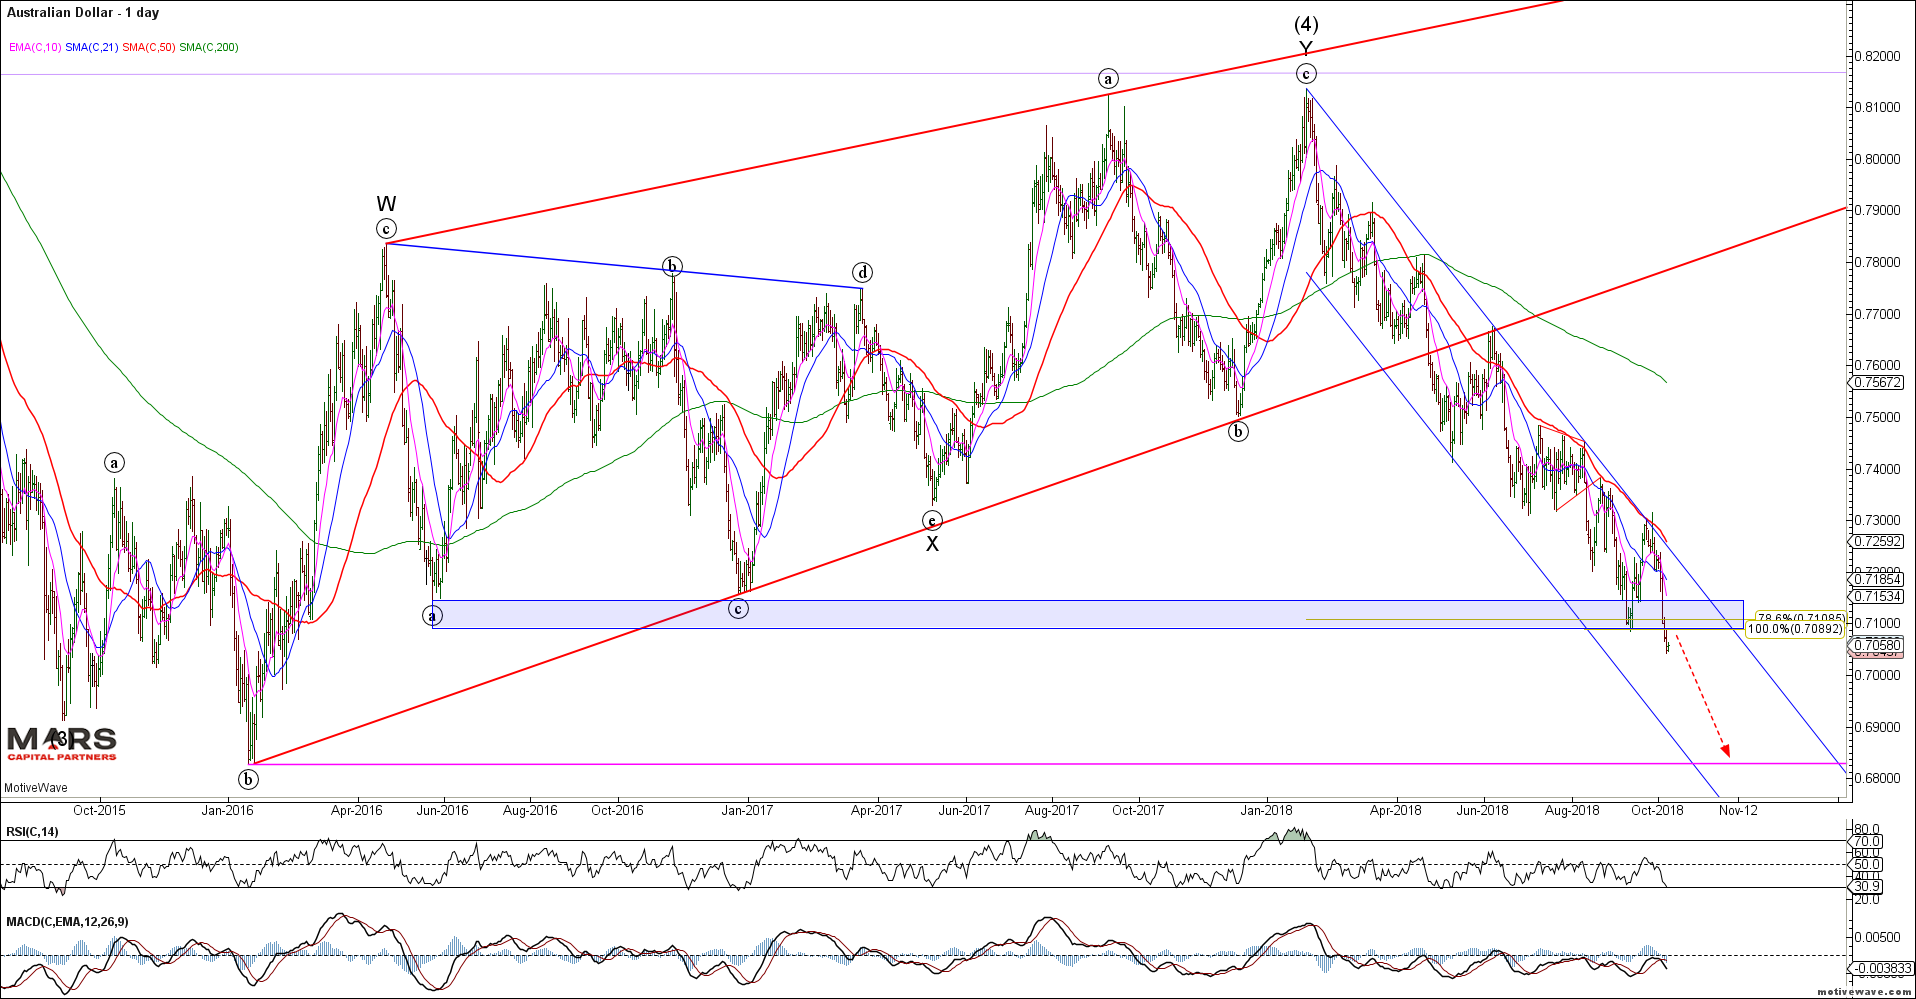
AUDUSD Daily
The AUDNZD should be completing a small degree wave (b) triangle prior to its wave (c) thrust lower towards 1.07 to complete its weekly wave B triangle correction – I continue to see this structure as bigger picture bullish with buy levels in the 1.07 area.
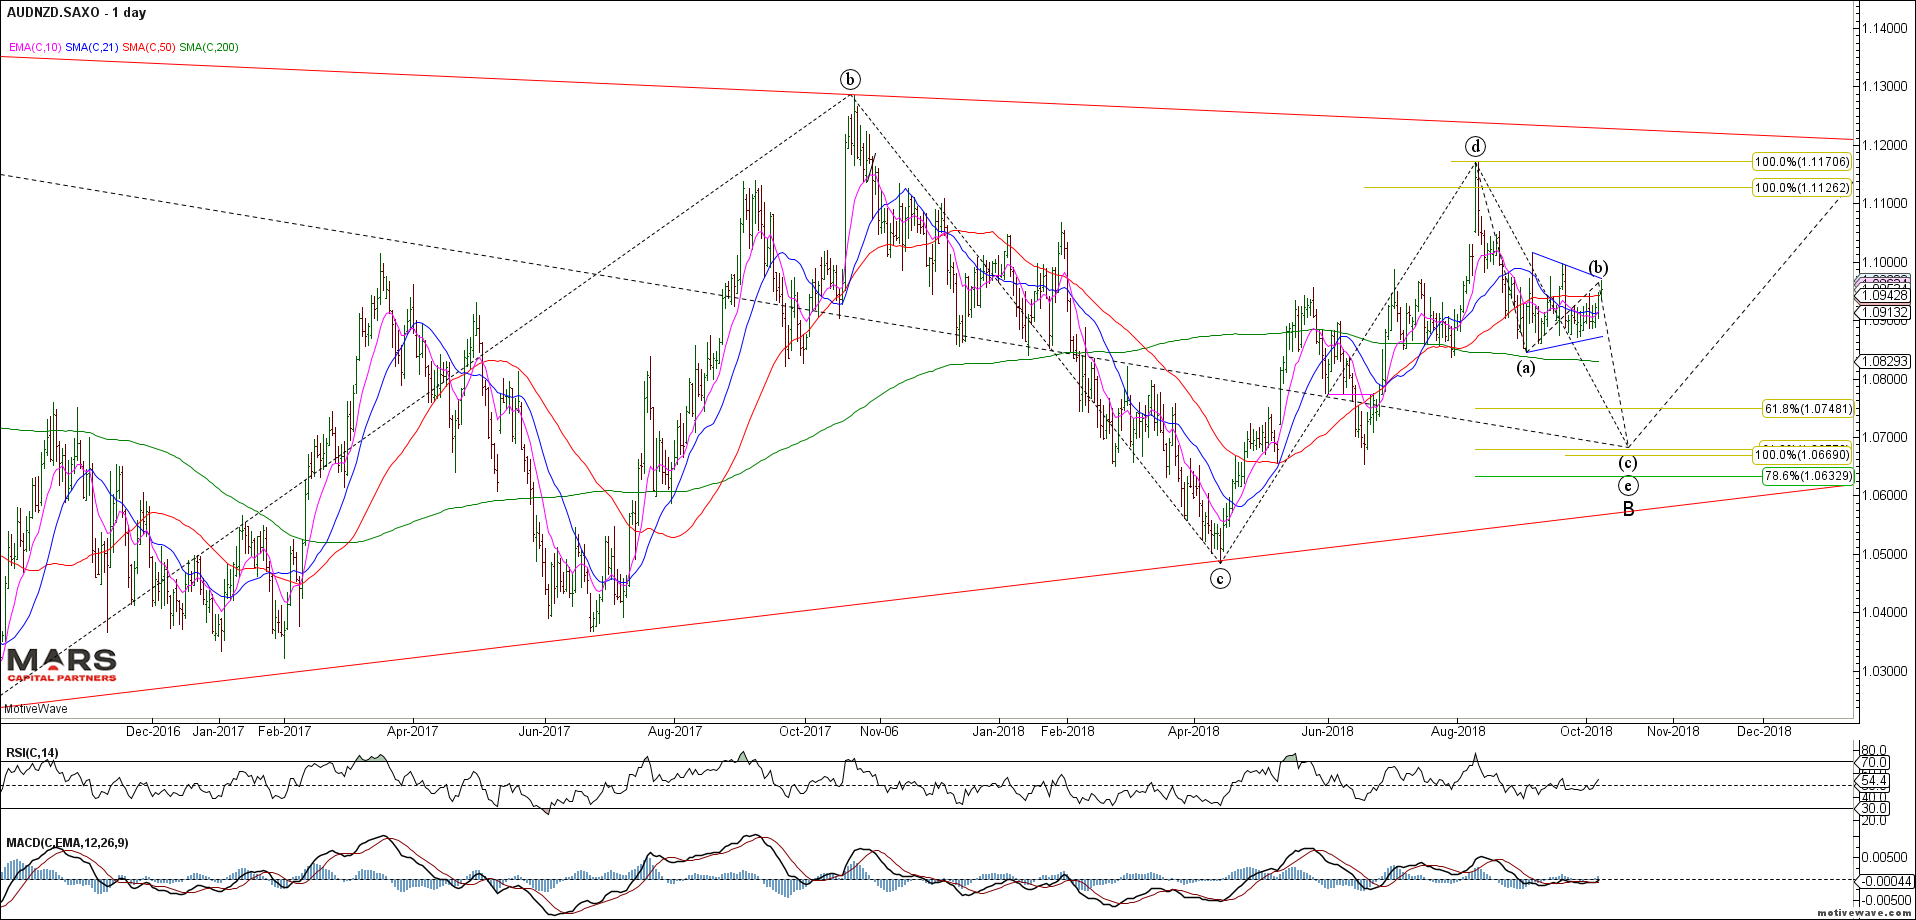
AUDNZD Daily
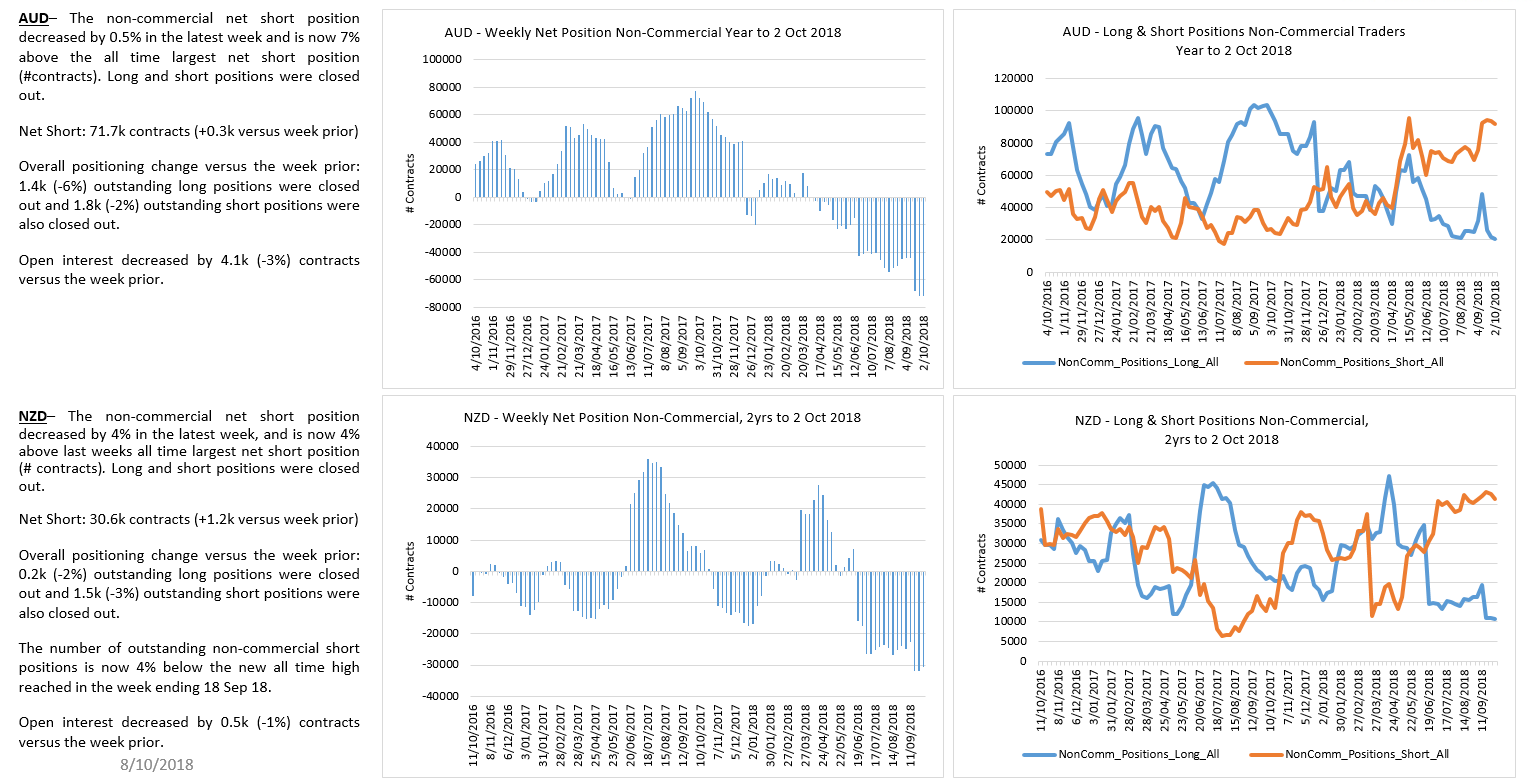
Both Aussie and Kiwi positioning remain at bearish extremes.
The USDCAD continues to frustrate as we fell short of our 1.2740 buy targets once again. What is becoming clear is that this decline from the June wave 1 highs is corrective (series of 3 wave counter-trend waves) so we will be looking for opportunities to get long this pair. I’m just not chasing it here. Bullish against recent swing lows.
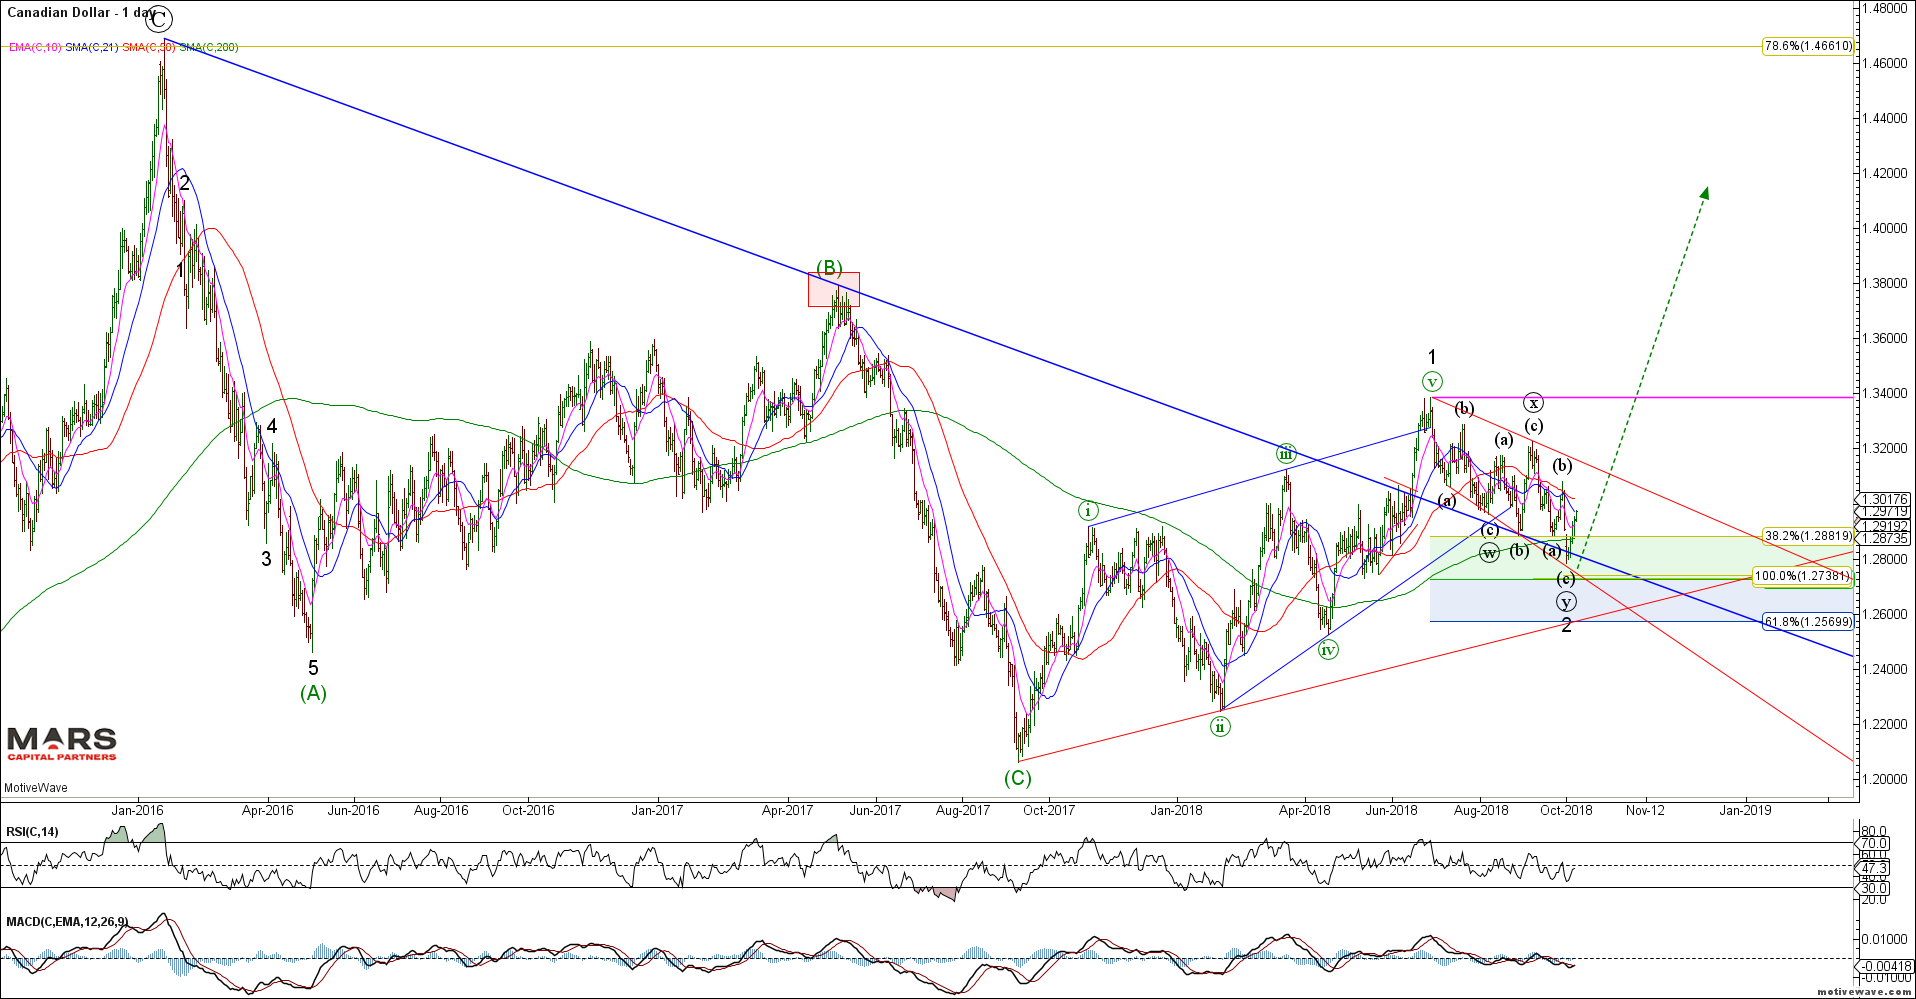
USDCAD Daily
The near term USDCAD wave structure highlights the corrective nature of the decline within a broadening formation. Likely a very bullish structure on trade back above 1.3230
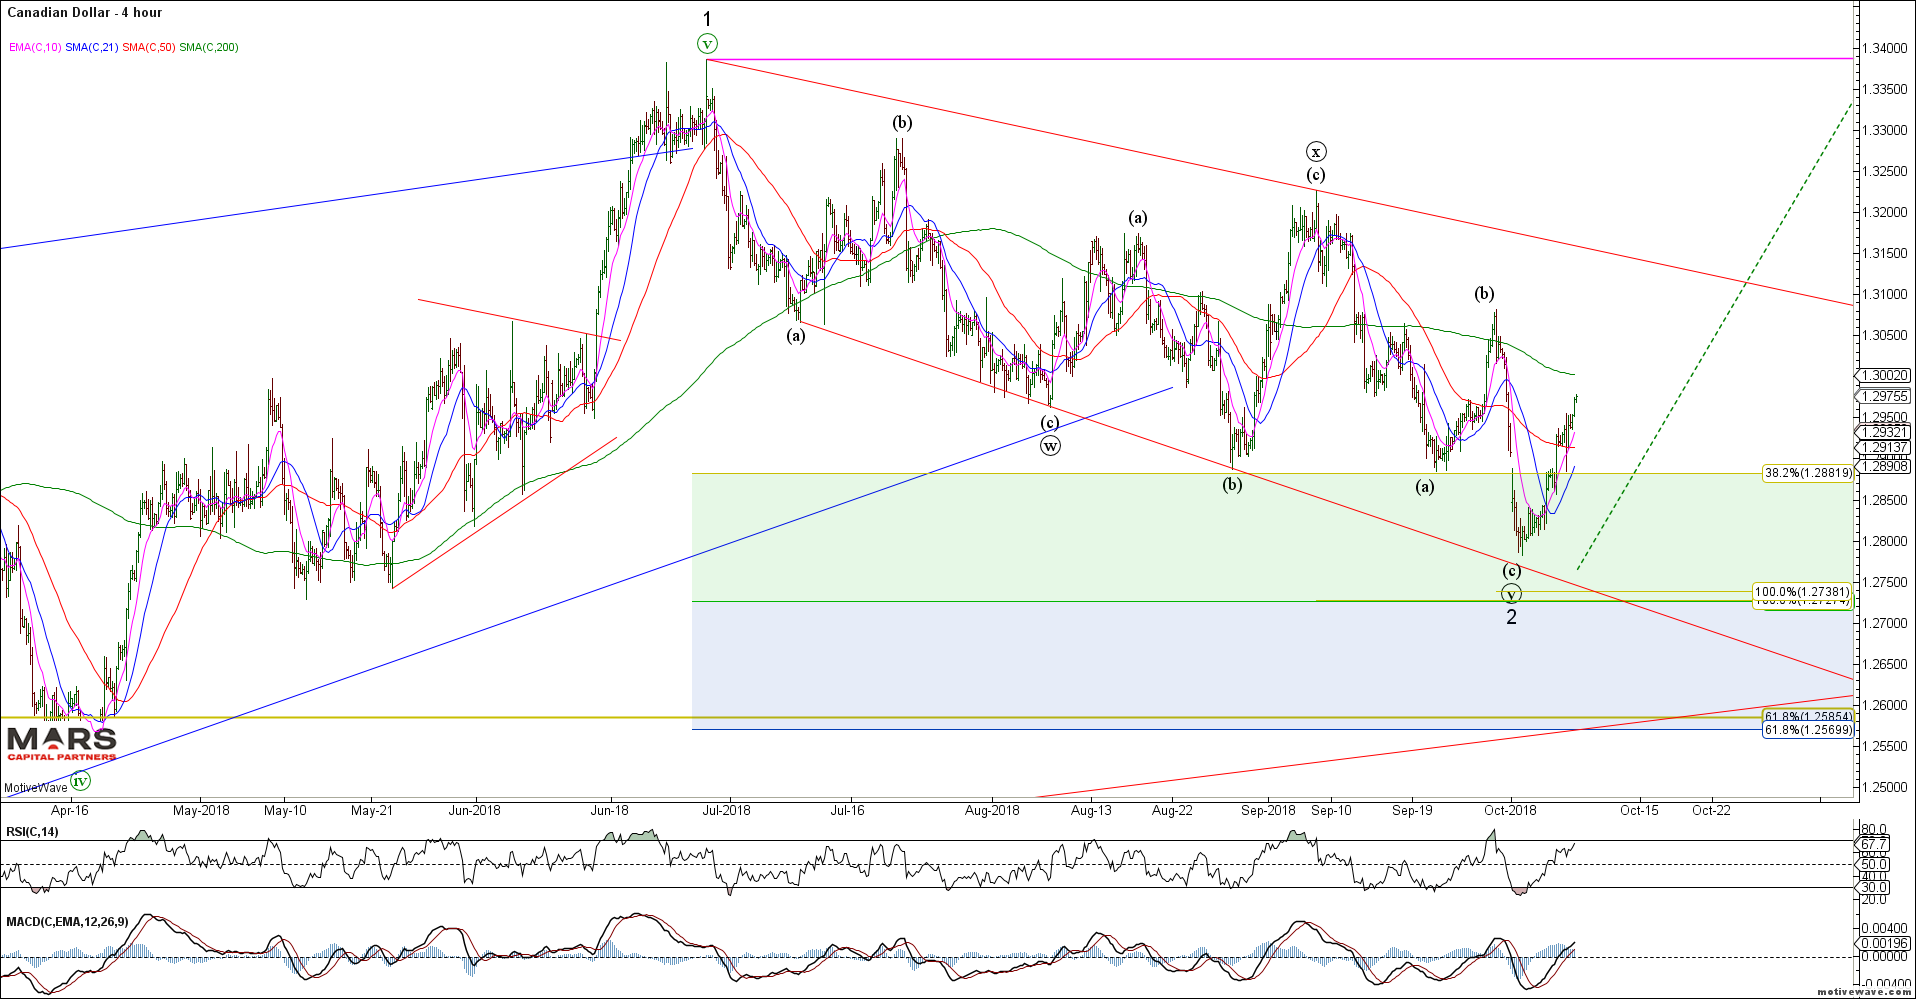
USDCAD H4
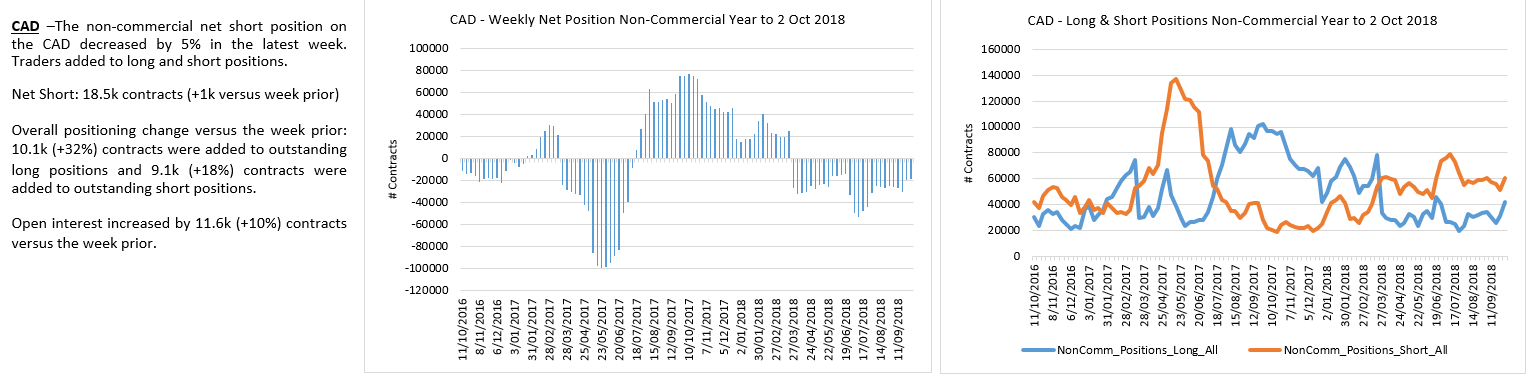
CAD traders have been whipsawed flat.
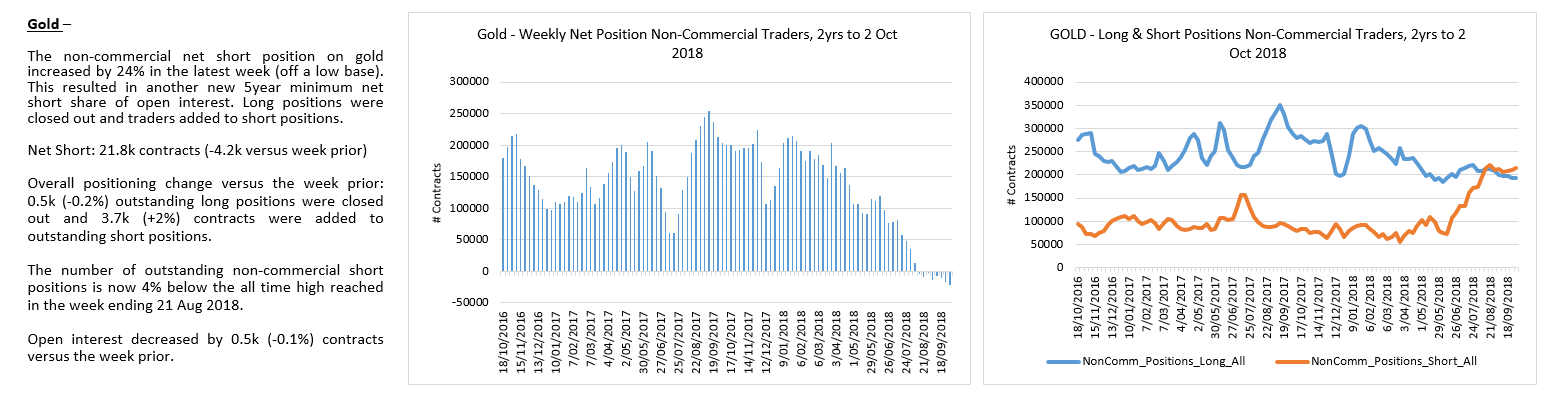
To the commodity markets and the precious metals pushed higher last week but Gold was unable to break out of near term congestion (1220-25 resistance) – it is difficult to be too bullish Gold given our stronger USDCNH outlook. May be best to allow for a decline towards our bigger picture 1120 buy zone.
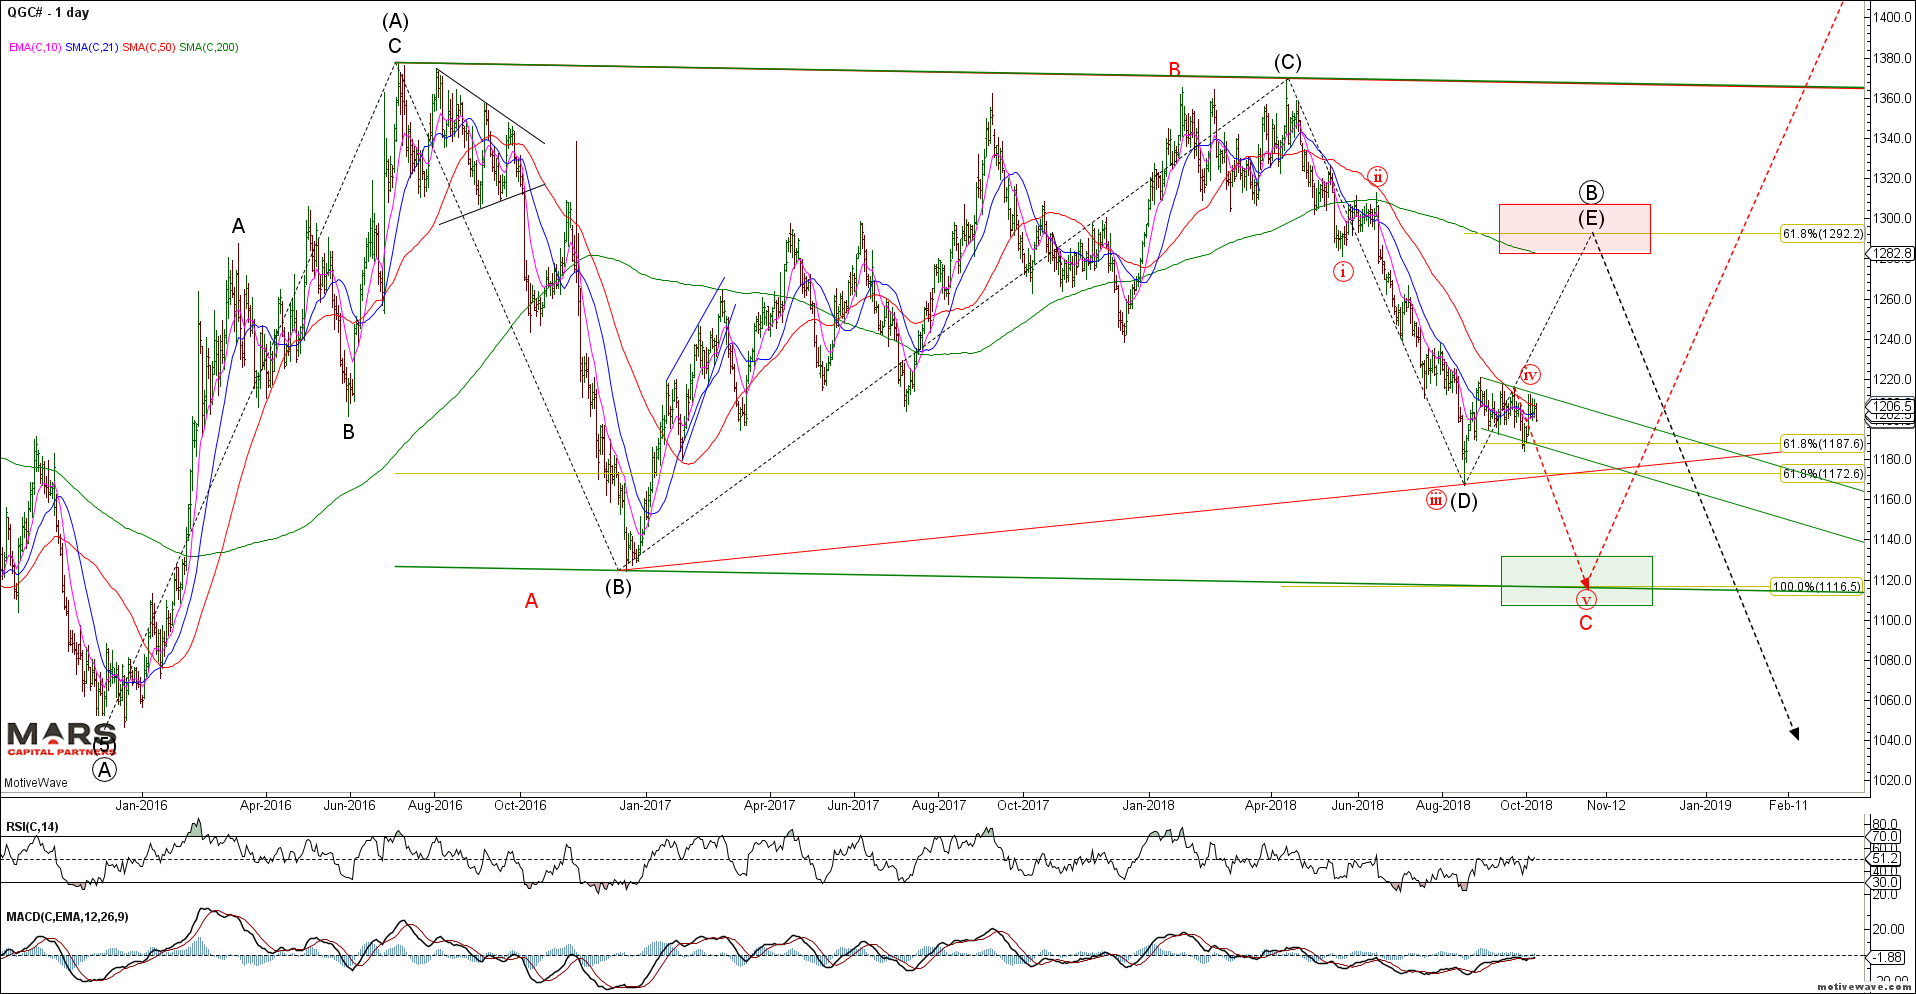
Gold Daily
The recent Gold rally from Fib support does NOT look impulsive and could be forming a triangle.
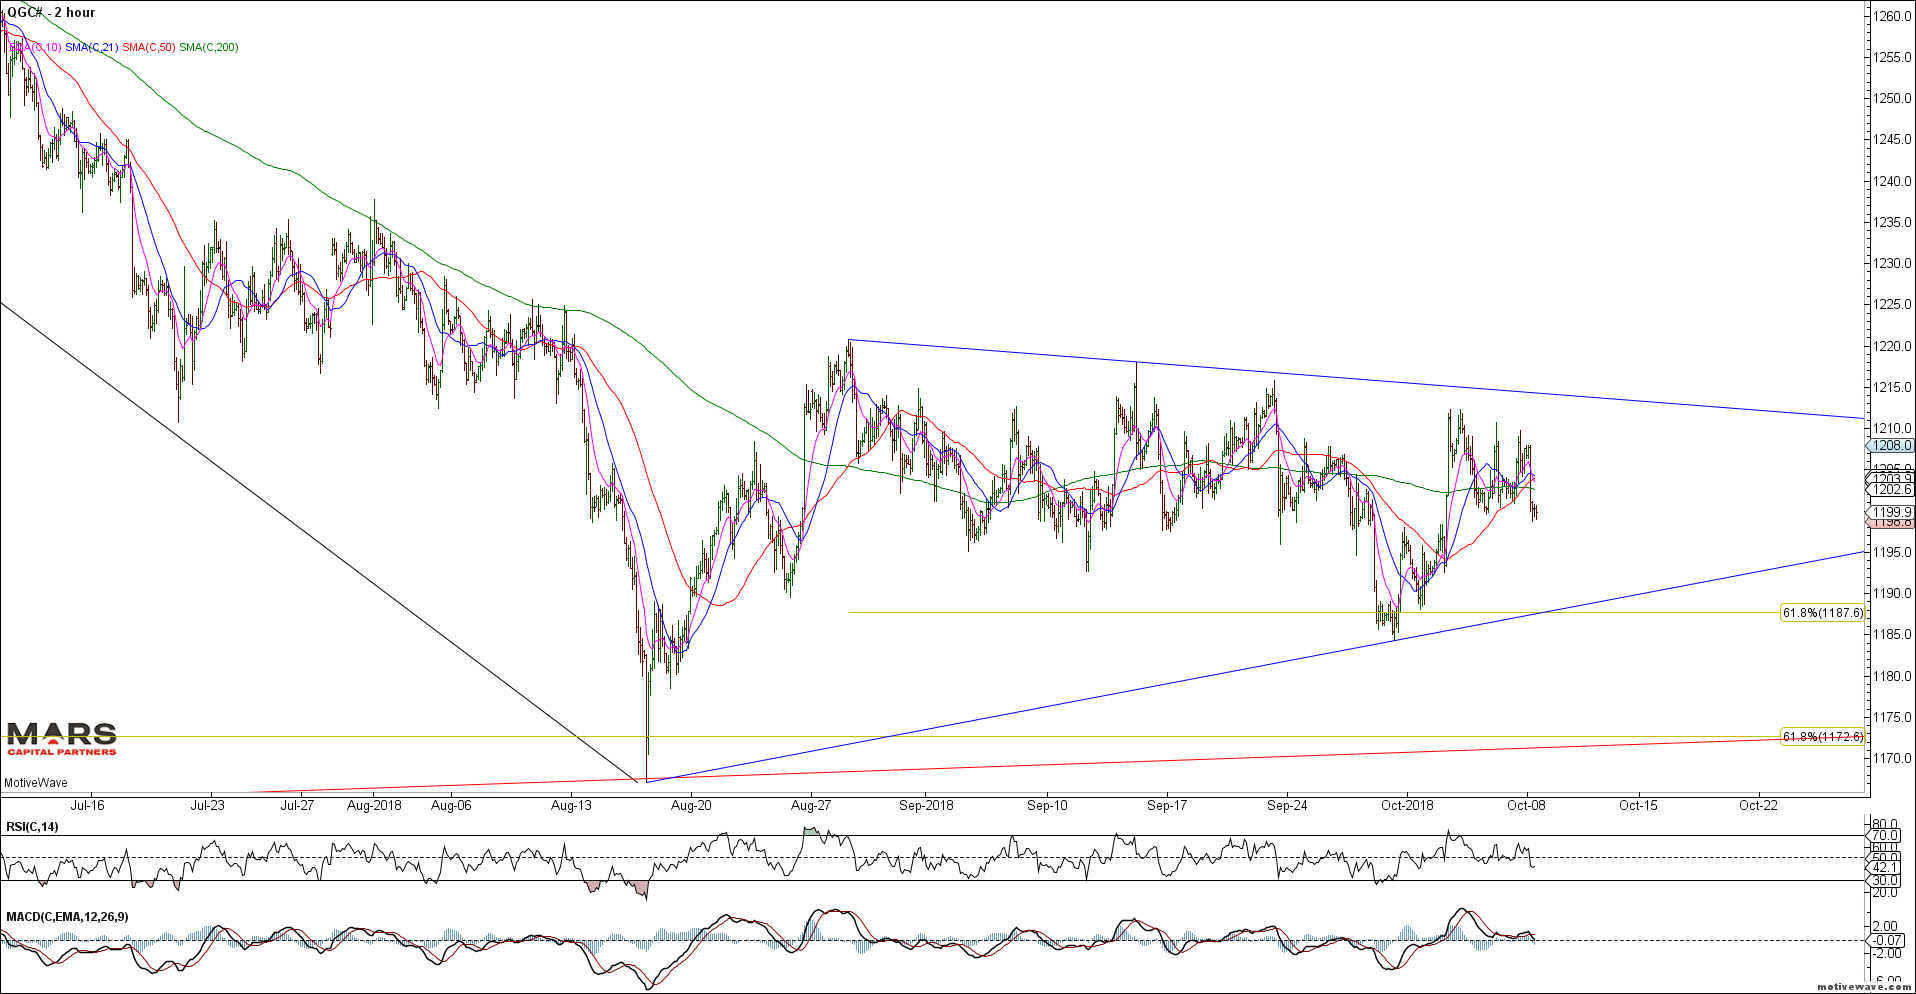
Gold H2
I’d still prefer to see a capitulation in Gold longs.
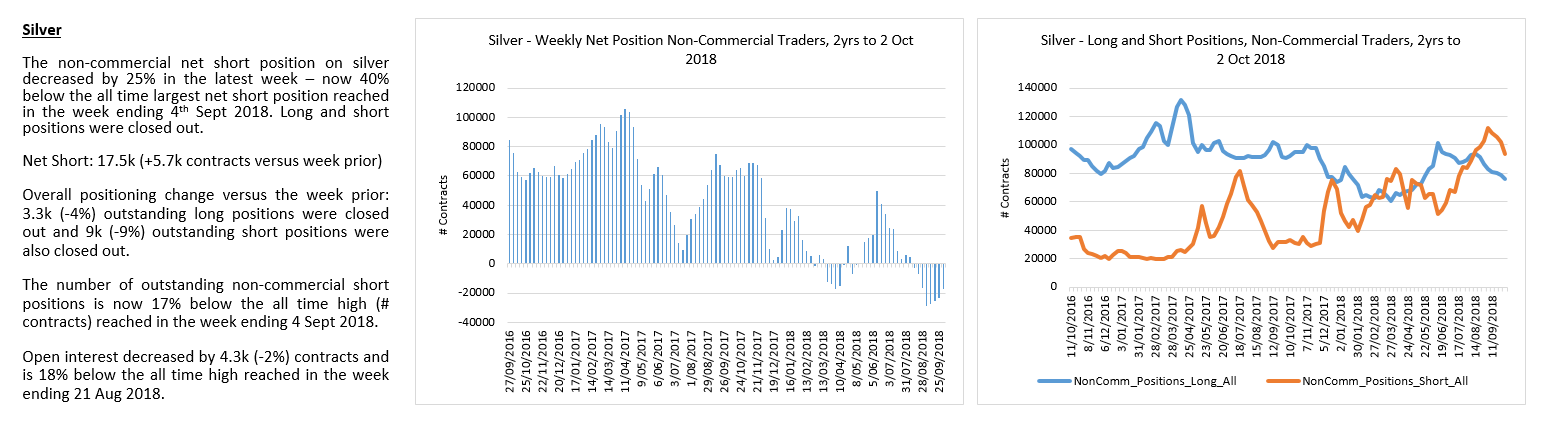
Silver rallied more strongly than Gold but was unable to clear $15 resistance. The structure of the rally is not clearly impulsive and failed at the 50 day sma. No position for me here.
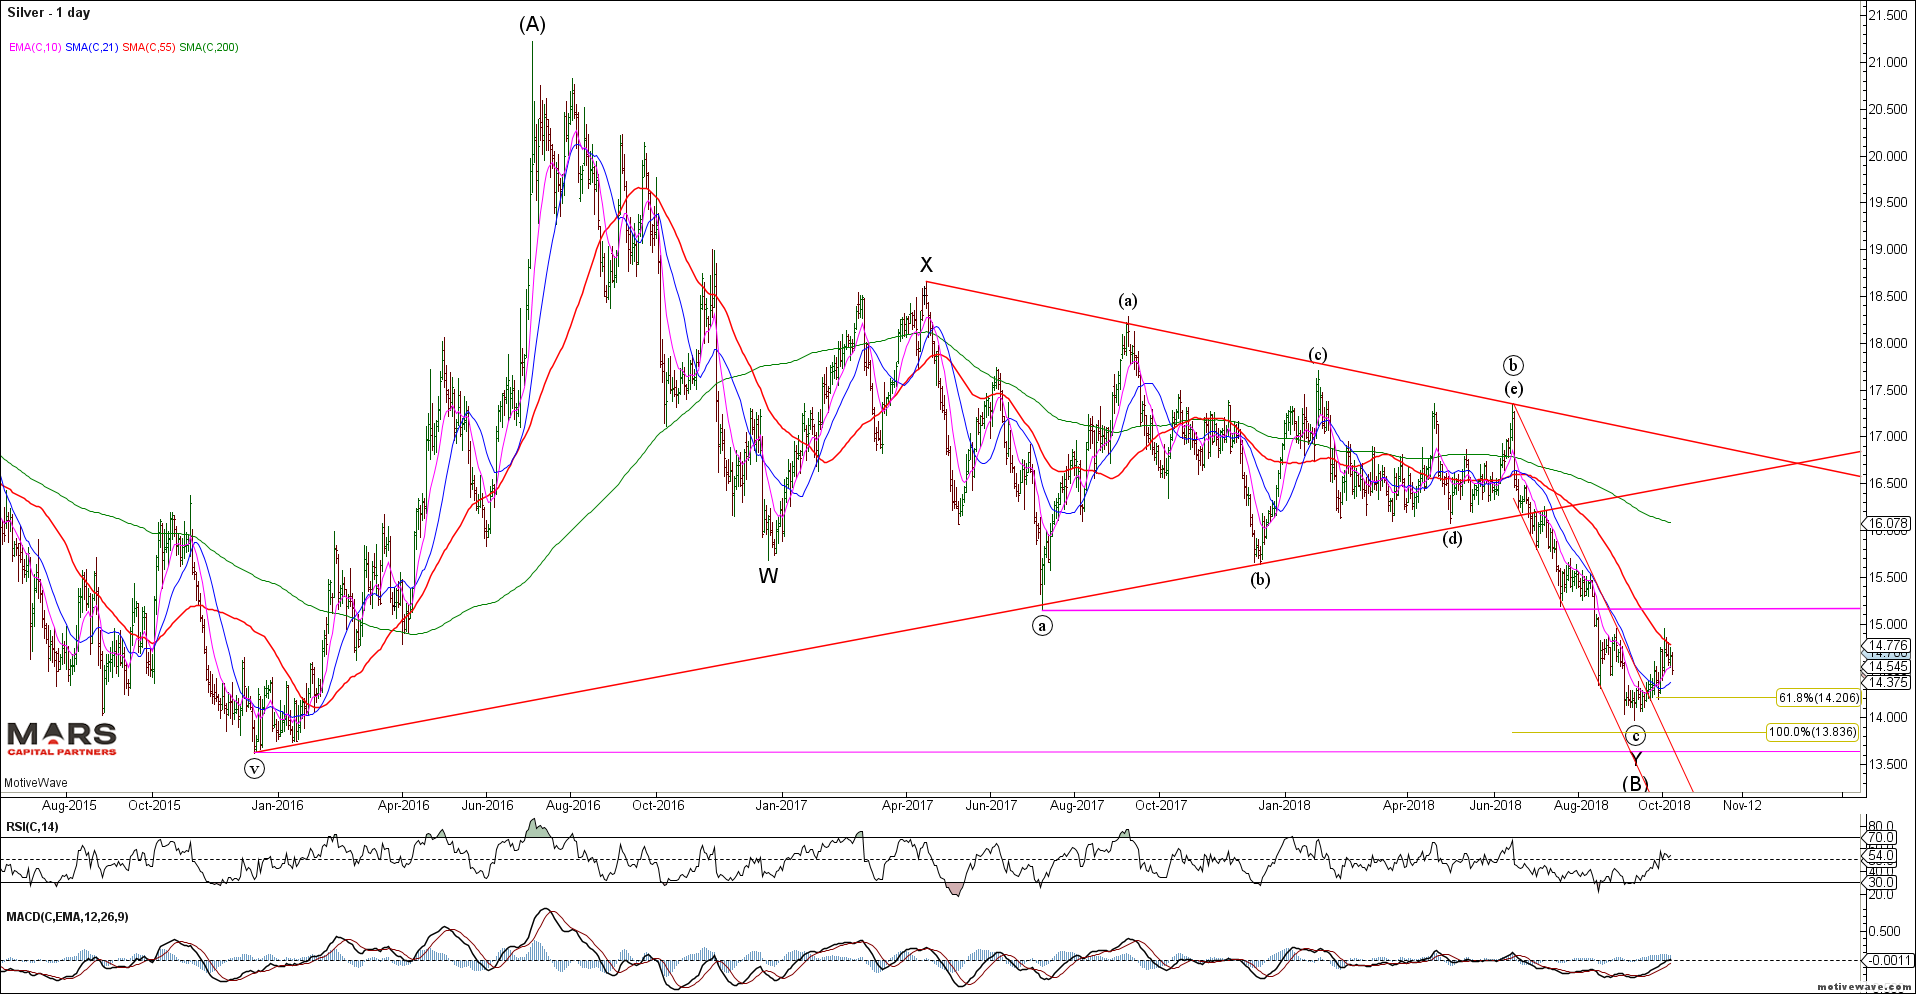
Silver Daily
One bullish potential for Silver near term is a leading expanding diagonal (rare) – I just don’t like the idea of shorting into long term support here. Near term Silver needs to hold the 14.20-35 area and clear 15.00 to gain upside momentum. Very speculative but Silver calls are cheap.
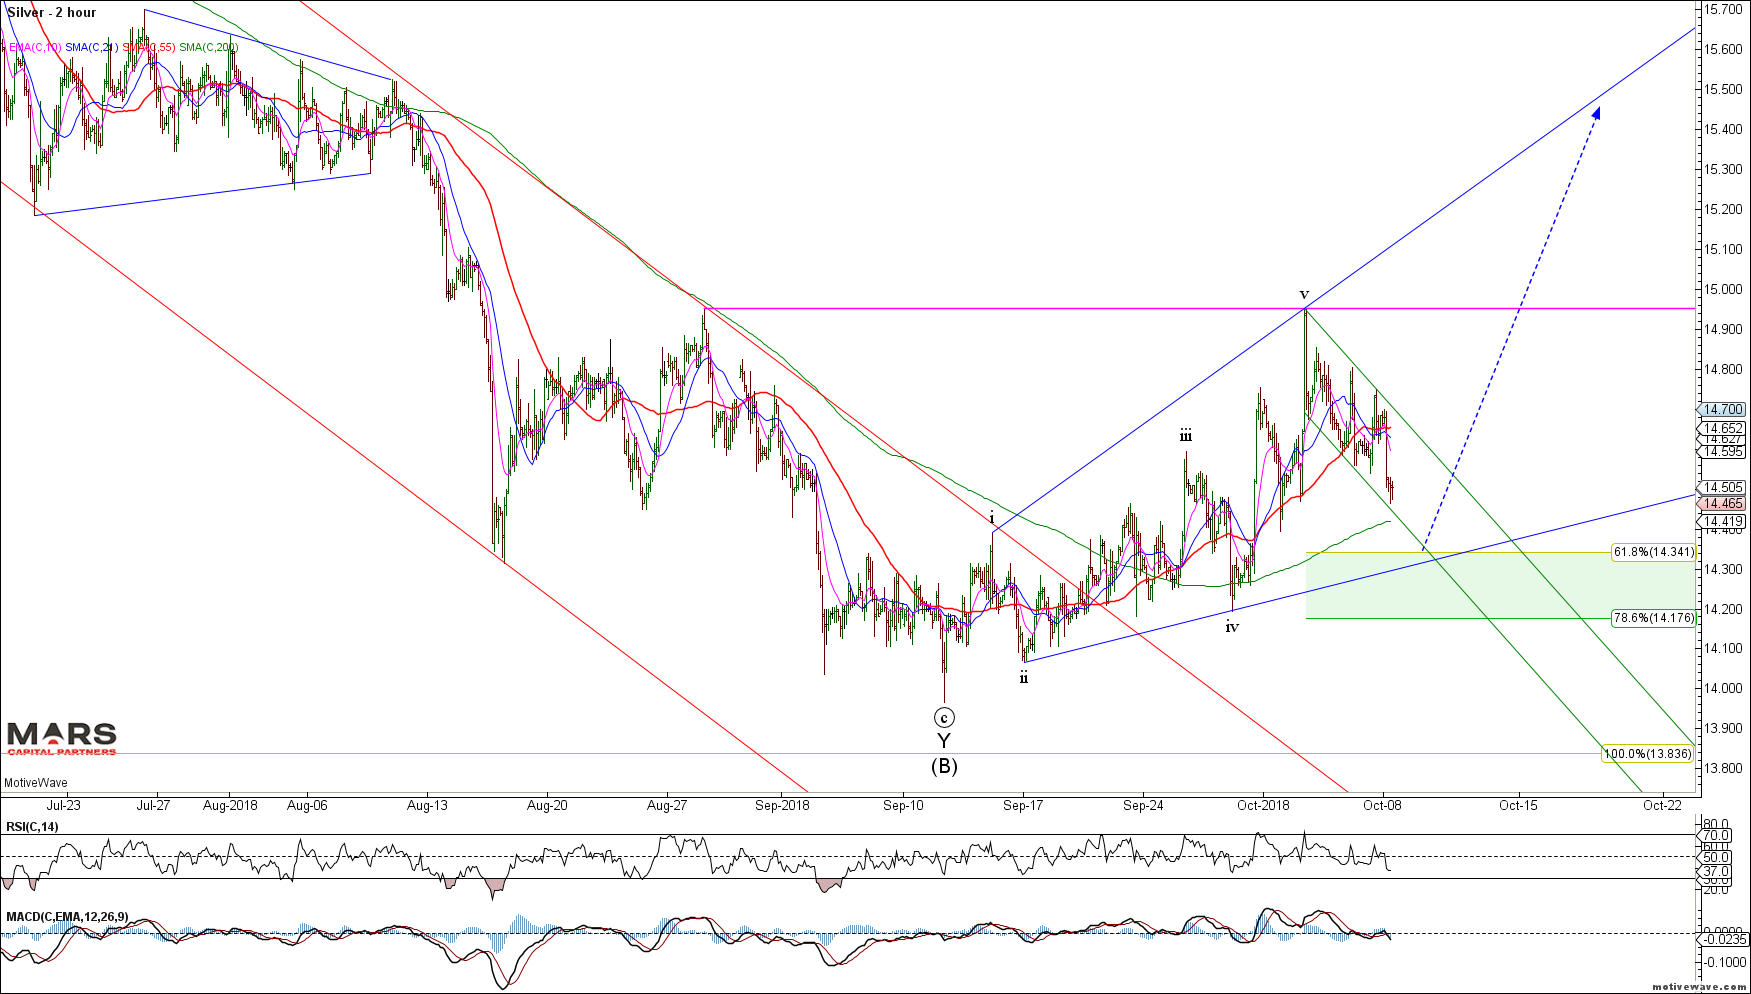
Silver H2
Crude Oil (CL) made new cycle highs following our impulsive rally structure and pulled back late last week for what should be a small degree wave iv within the larger bull trend. Trade back below 71.50 invalidates this near term bullish count and opens the door to more bearish potential.
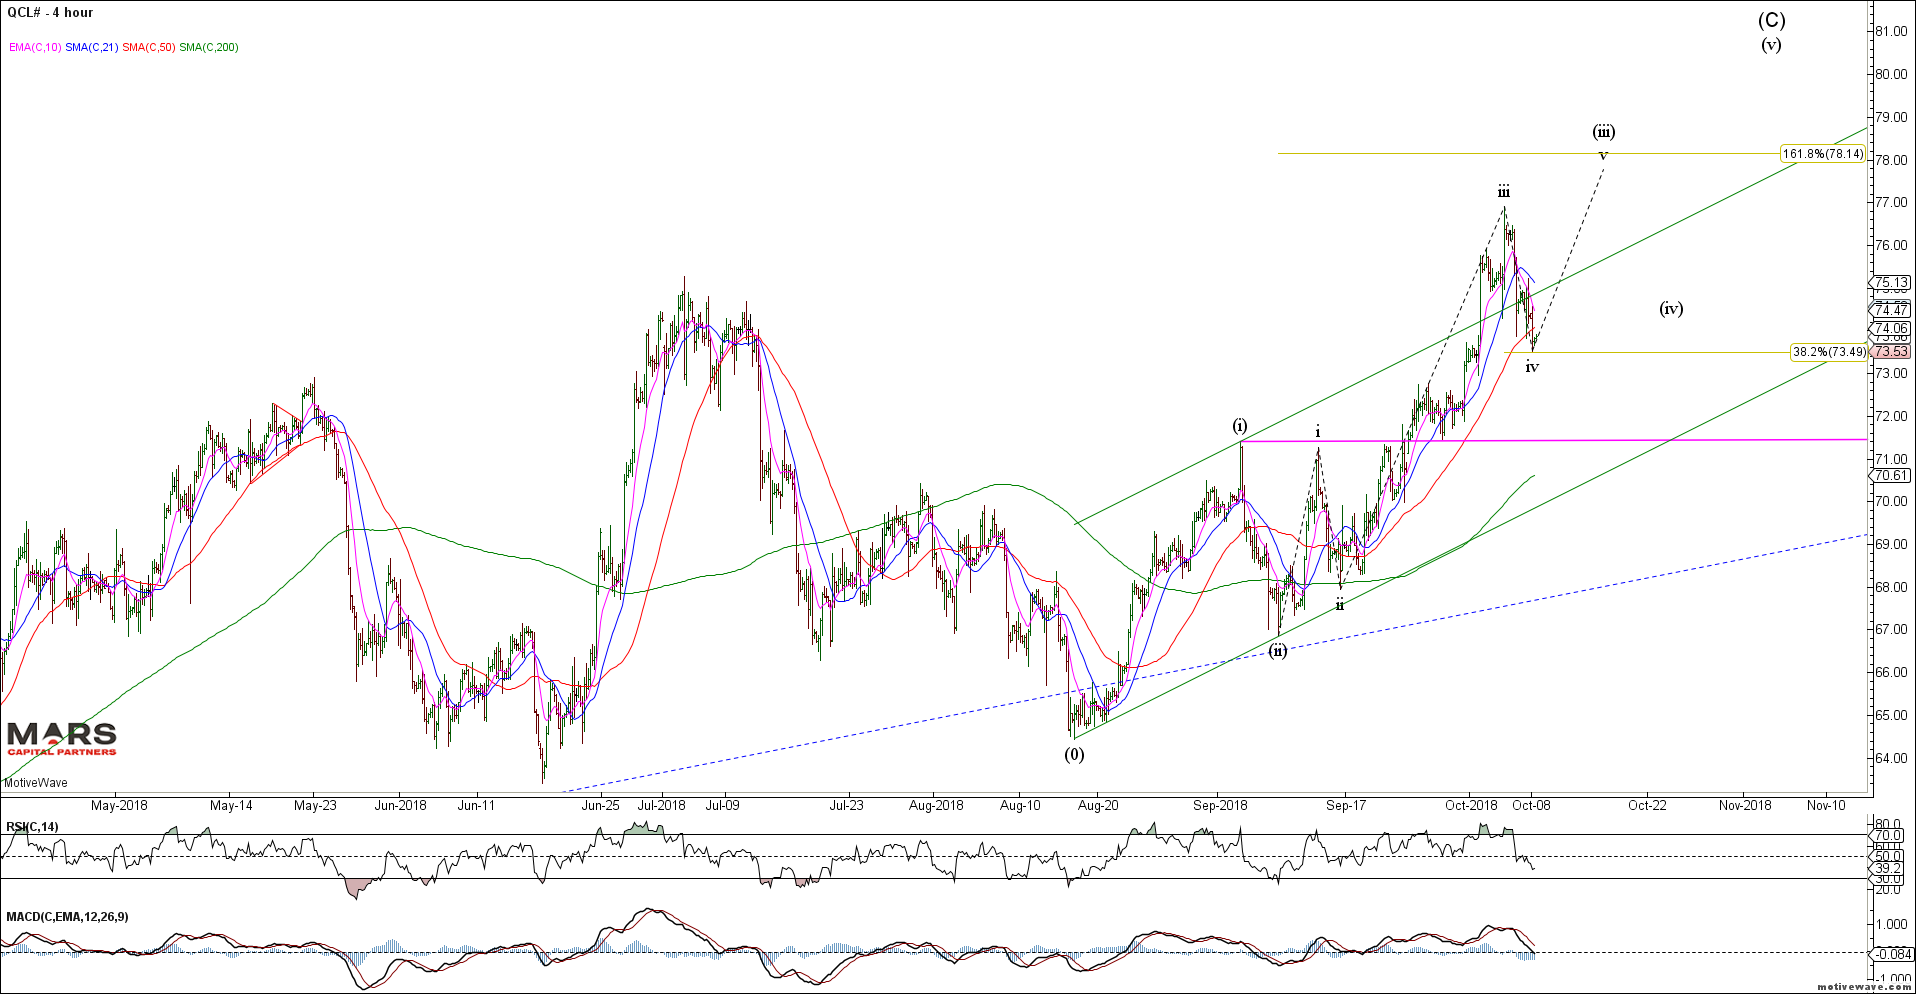
CL H4
Natty Gas continued to extend its gains into Fib resistance as it attempts to break out of its corrective channel. Maybe a triangle? Still no interest for me here.
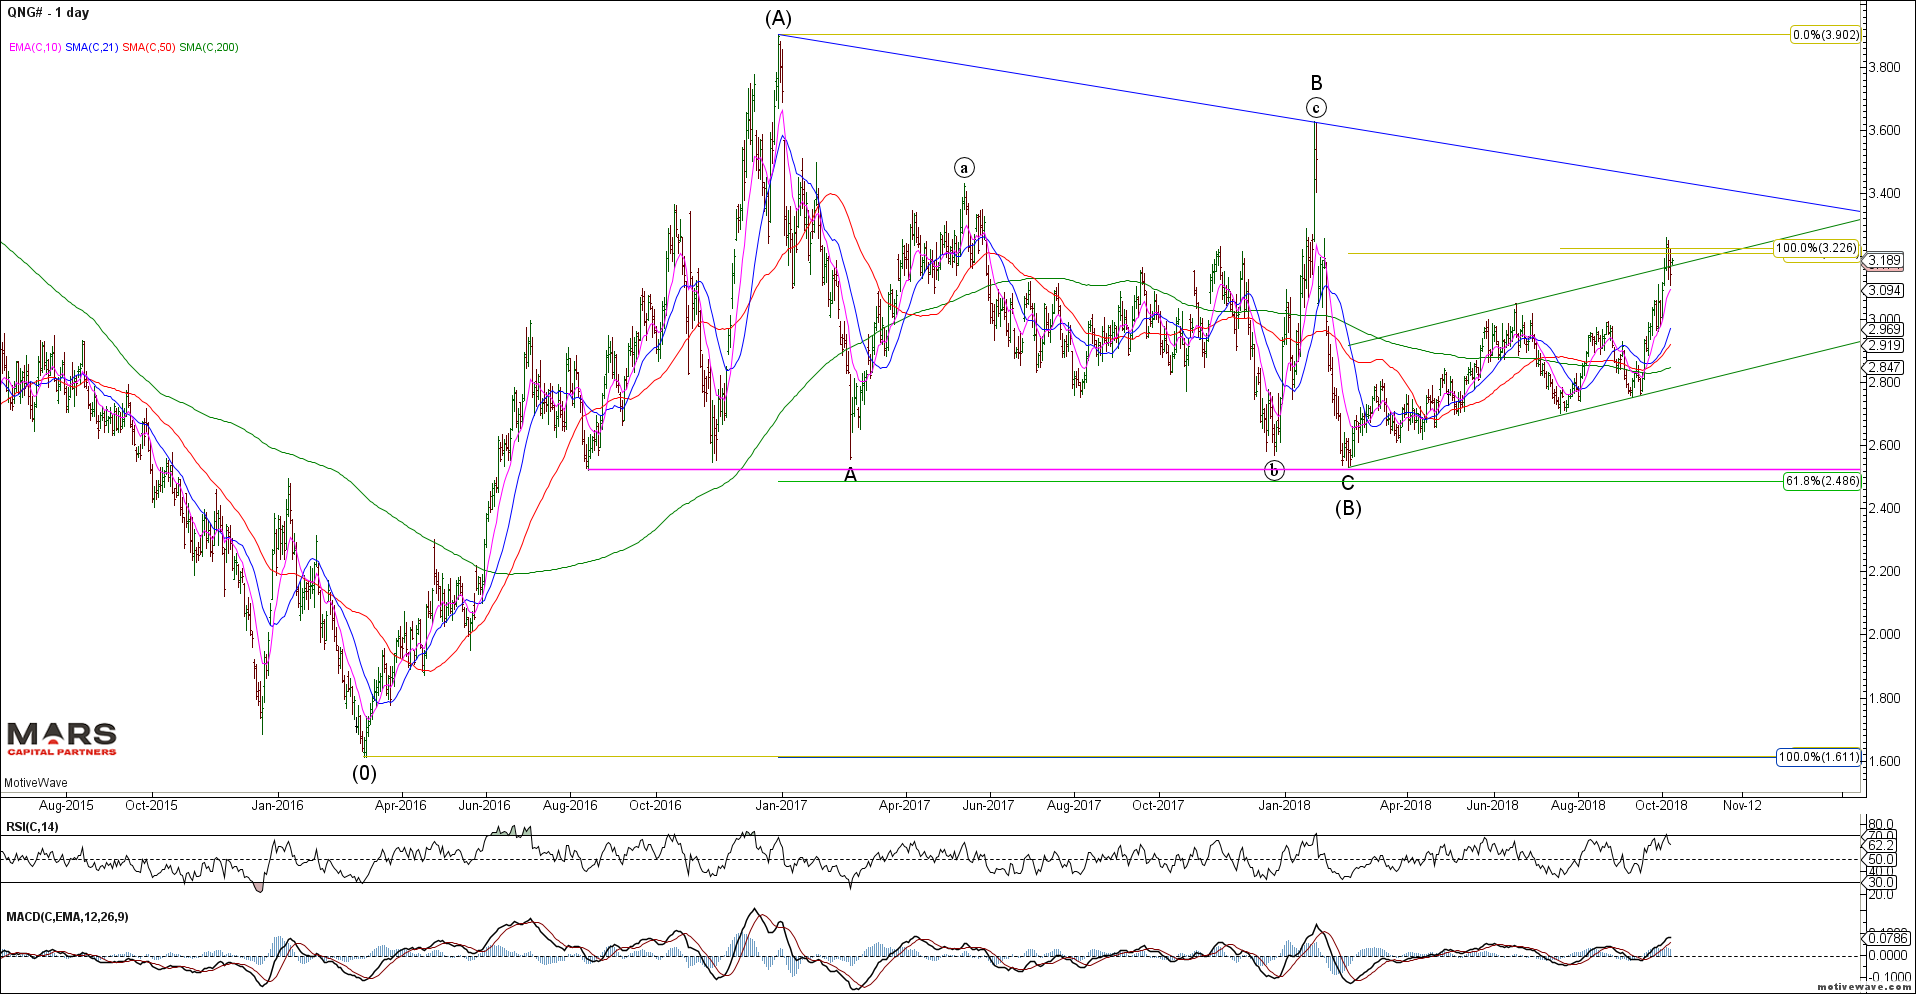
NG Daily
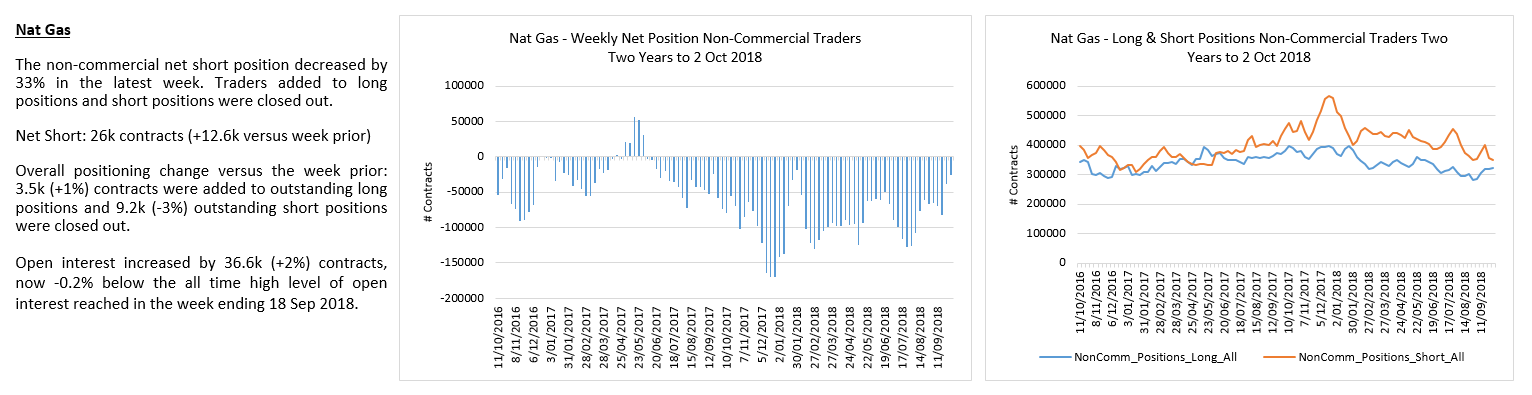
NG shorts slowly getting squeezed out.
Dr Copper continues to stall at Fib resistance – still no position or clear structure to trade against.
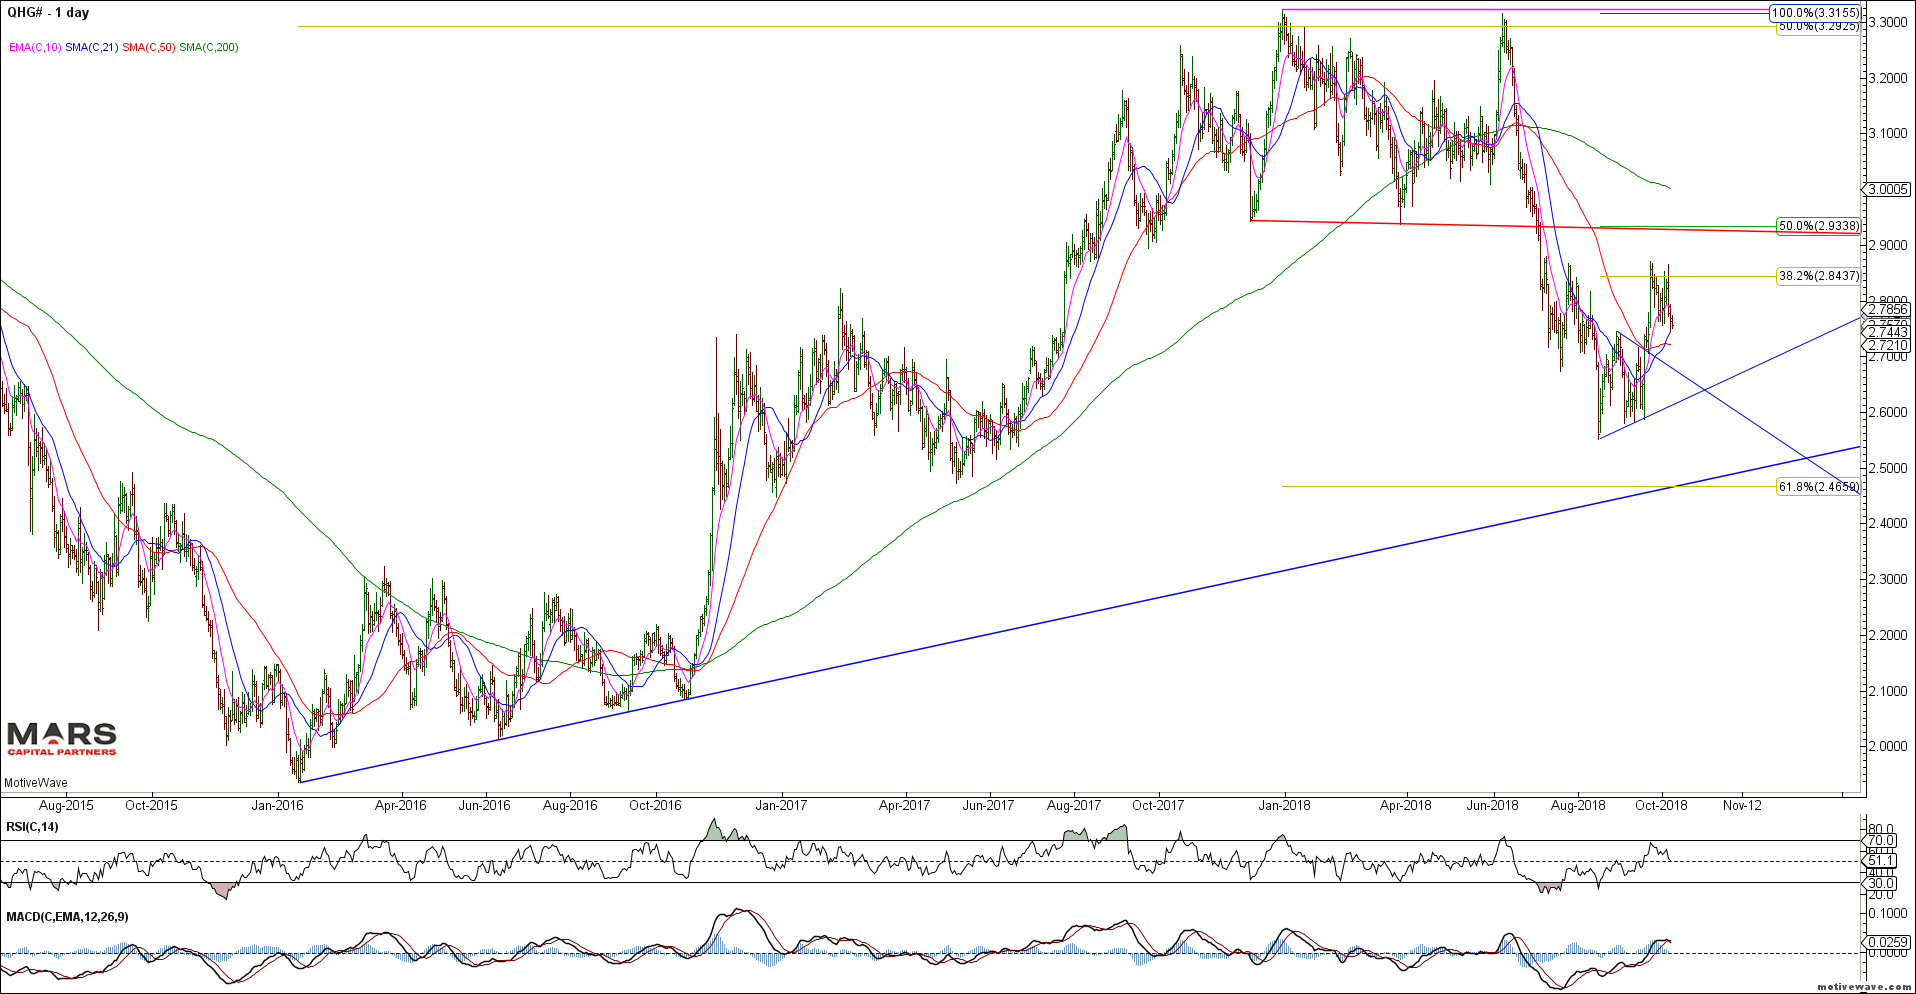
HG Daily
That’s all for now folks. Have a great week 🙂
