
It’s time for our mid-year review to update and augment our outlook for the second half of 2021. This follows on from our year ahead review posted on January 4th (see here). Our key stagflation themes and outlook remain unchanged…
“As we head into 2021 with the tailwinds of historic fiscal and monetary stimulus coupled with a speculative “Tulip” mania (see Bitcoin, SPAC, Robinhood, etc) it is important to take note of WHERE we are in the cycle. We are nearing the very end of a super-cycle degree equity market rally.
What if we see global stagflation? Then we should expect to see a continued strong rally in commodities that will likely lead to a sharp reversal in rates, pressuring the CB’s to reverse the QE course, cost push pressures negatively impacting corporate earnings at a time when balance sheets are impaired with historically high debt levels. The result – rallying commodities, strong commodity currencies, sharply rising rates and bearish equities.“
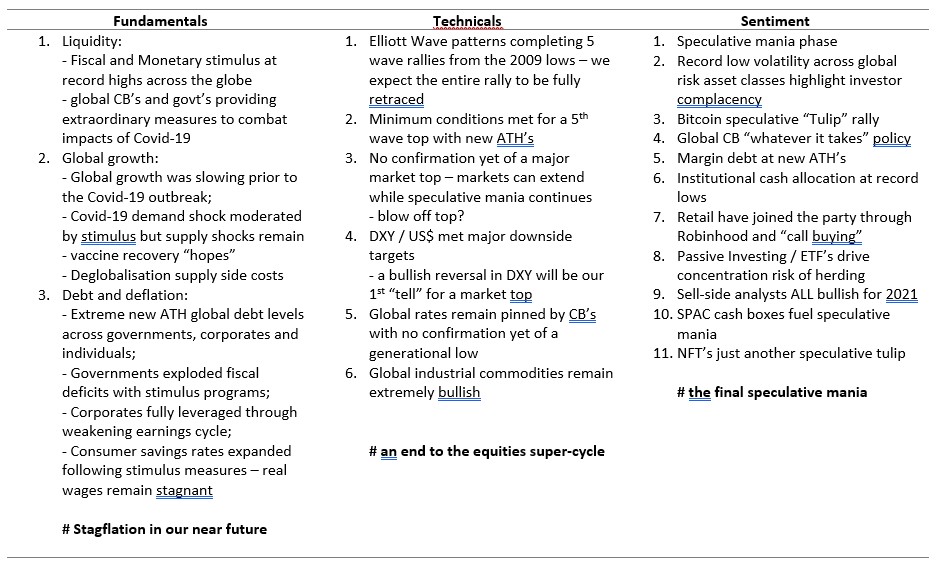
Key Themes:
- Equities remain in extended 5th waves as we look for a super-cycle top
- VIX is providing the opportunity for long term portfolio insurance
- Rates remain pinned by CB’s with no confirmation of a bigger picture change in trend
- The DXY continues to hold important support and is threatening to break higher
- Commodities remain in big picture bull markets but are at risk of near term exhaustion
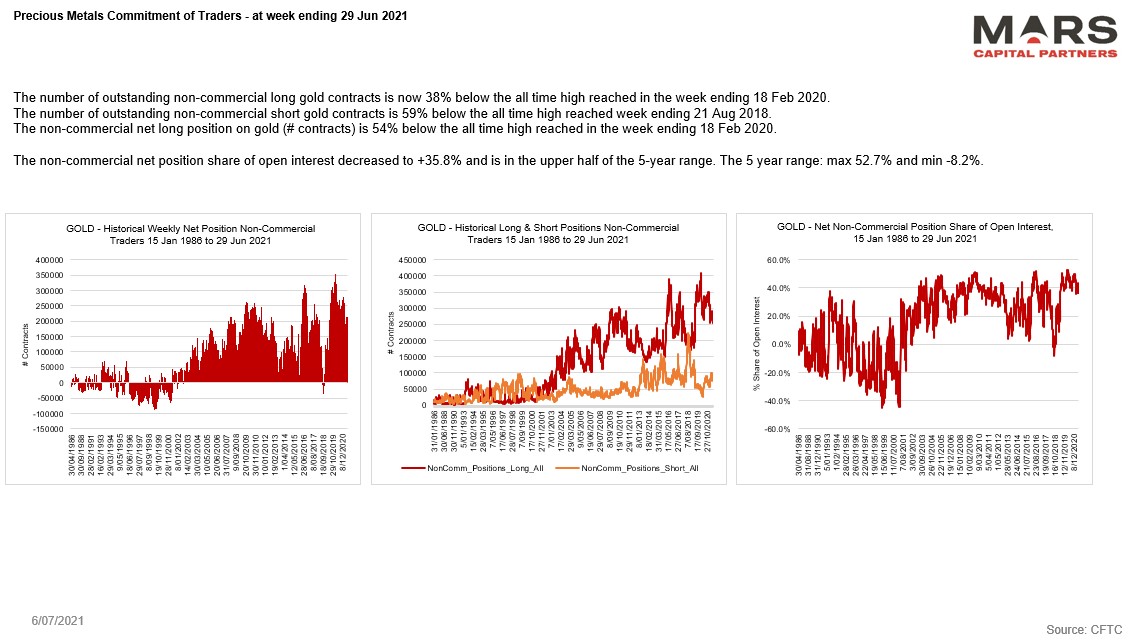
- Gold remains within a larger corrective decline
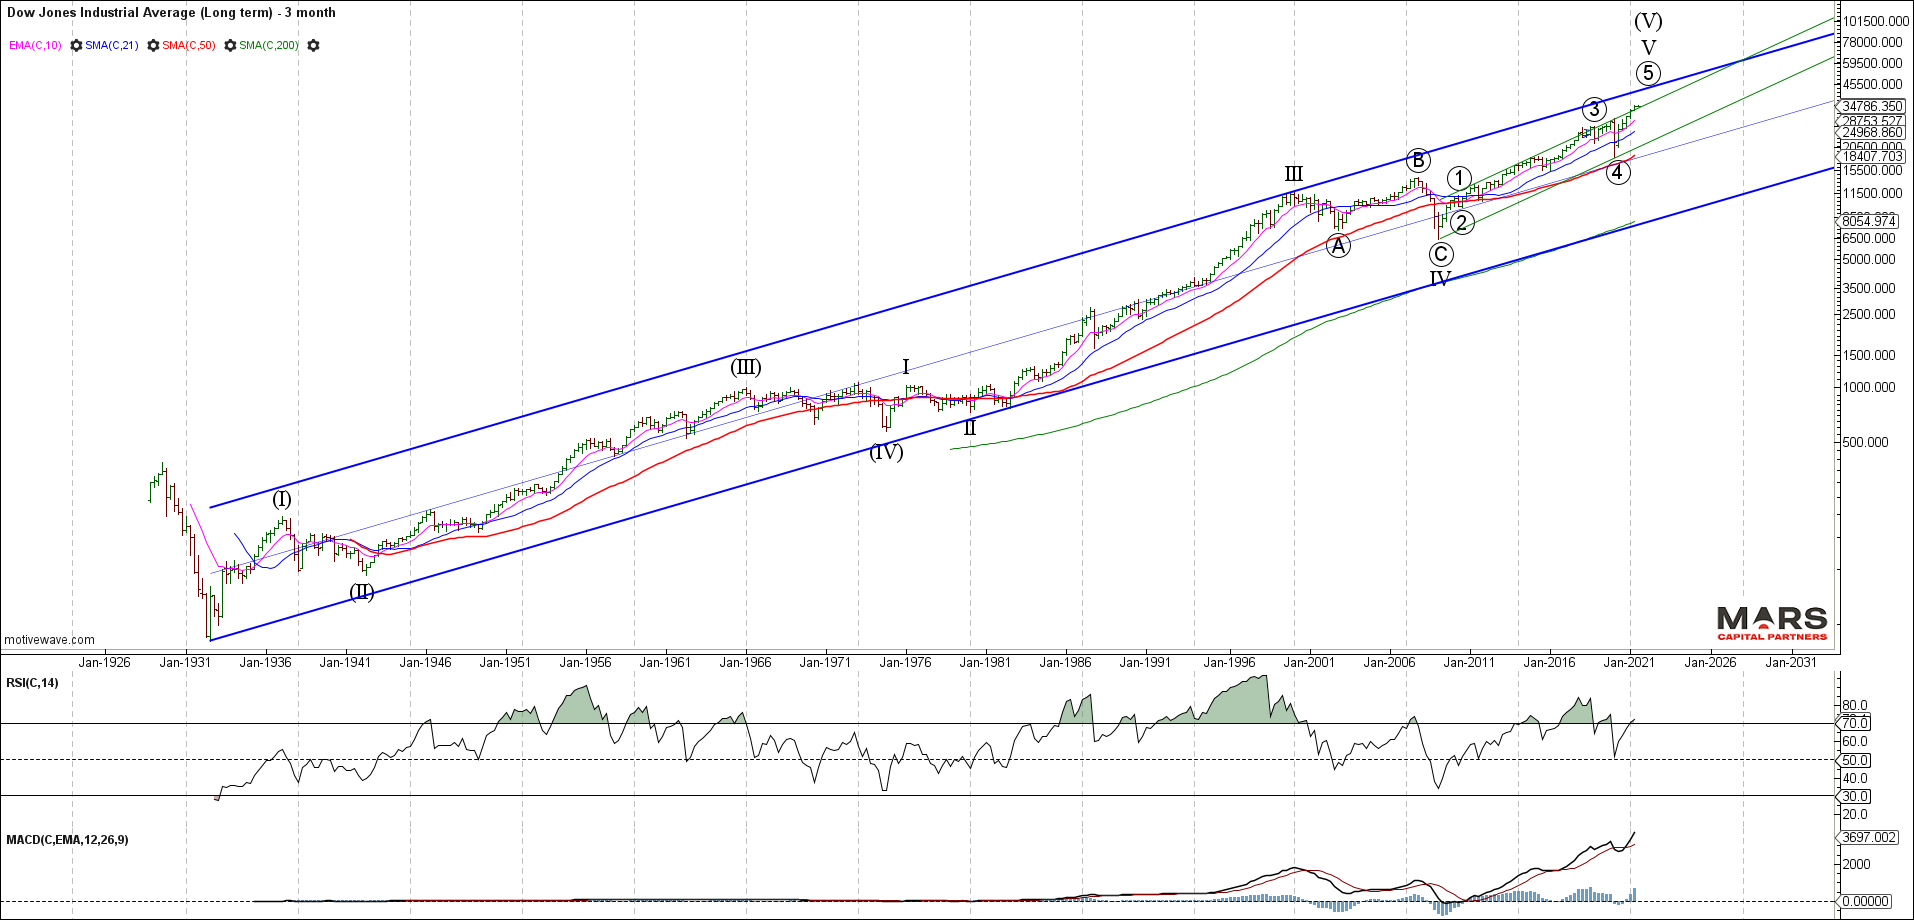
Equities completing a super-cycle top
Wave 5 of V of (V) continues to extend in 2021 with no evidence of trend exhaustion or a tradable top. Speculative debt fuelled bubbles will continue until hope fades and with retail traders now fully on board, we are nearing the end of this super-cycle degree trend.
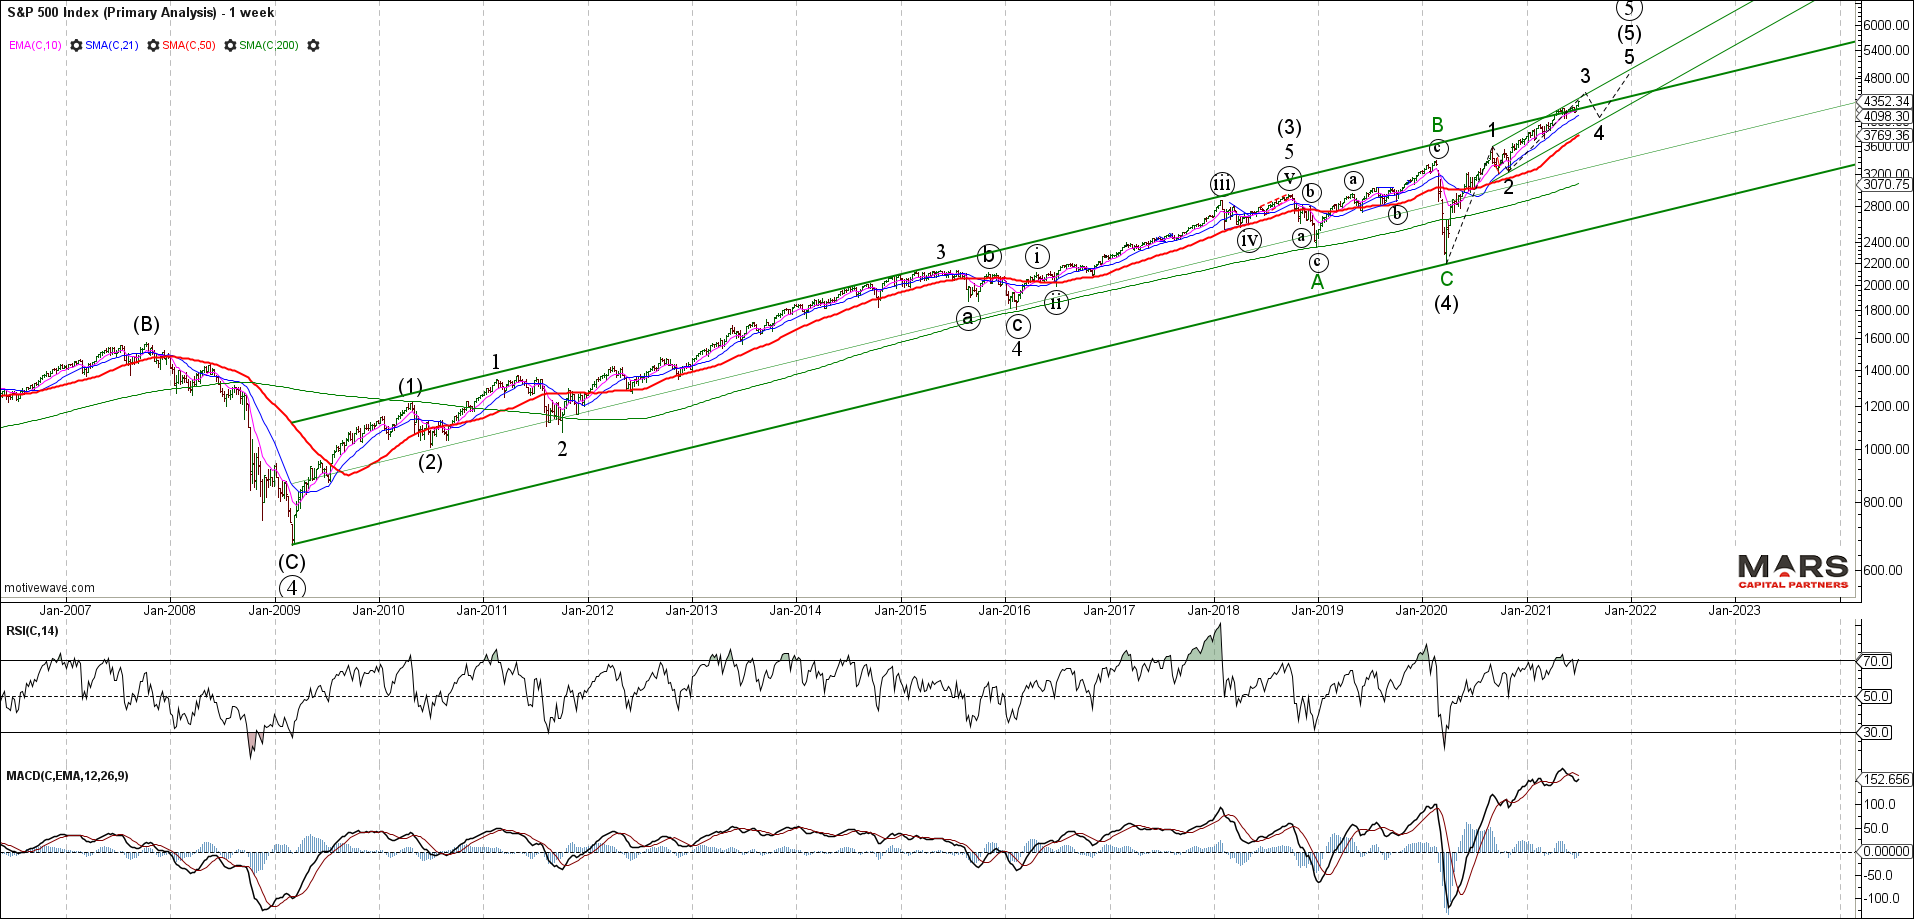
The SPX continues to impulse higher in what we expect to be an ending wave 5 of V of super-cycle degree. Wave (5) has pushed through initial measured equality targets and continues to subdivide higher with no evidence of weakness. The bulls remain in control until proven otherwise – the question for the 2nd half of the year is whether we are completing wave 3 of (5) or all of (5)? The bull count shows we are in wave 3 of (5) with a final cycle peak not due until the end of the year. We will continue to monitor the progress of this bull market until we have a reason to fight it.
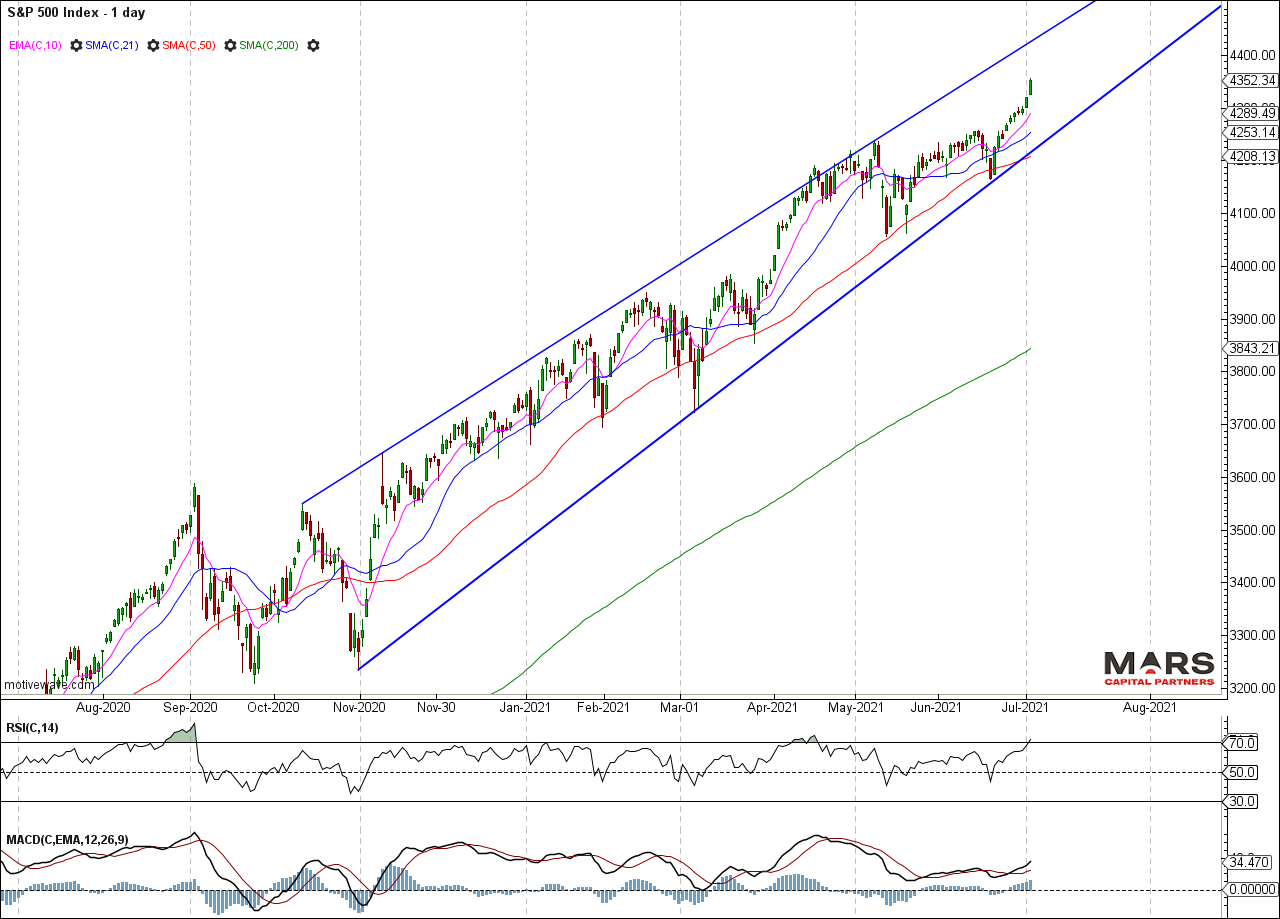
The Daily SPX cash chart highlights the near term trend supporting this bull market. Note of particular interest the rising blue trend line from the November 2020 lows and 50 day sma support. The recent rally has broken up and away from support in either a 5th wave blow-off or 3rd wave trend continuation. The bulls remain in control until this trend support breaks. We will remain vigilant in trying to identify any evidence of a change in trend. In the meantime, the trend is your friend until it bends.
ES trading remains muted and only slightly net long. All the institutional and retail activity appears to be in physical stocks.
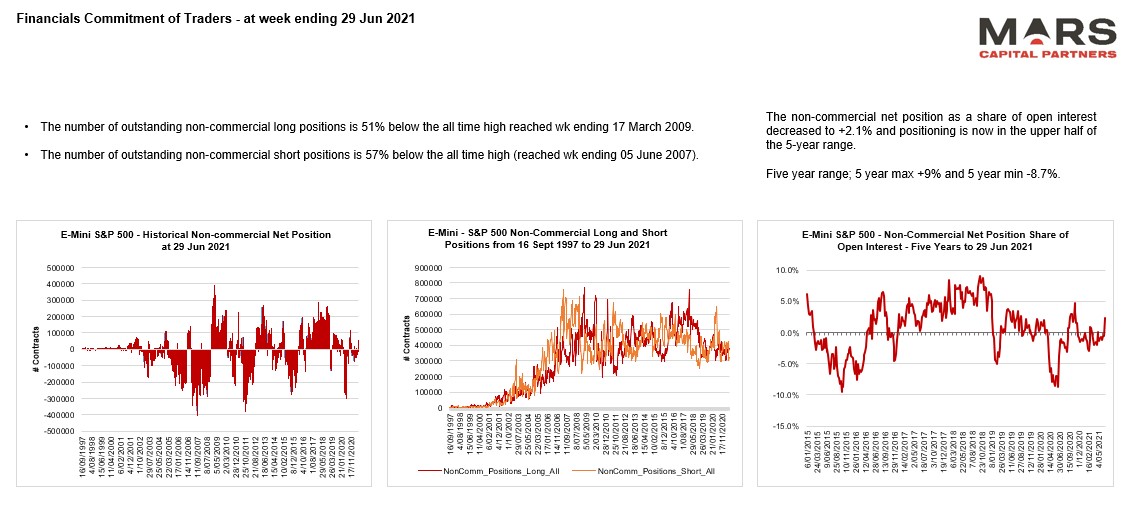
The Russell 2000 continues to provide the clearest wave structure with 3 waves up from the March 2020 lows. This structure still requires a 5th wave higher to new ATH’s to help complete wave 5 of (5) of V. Until the Russell makes its final push to new ATH’s, it will be premature to call an end to the bull market.
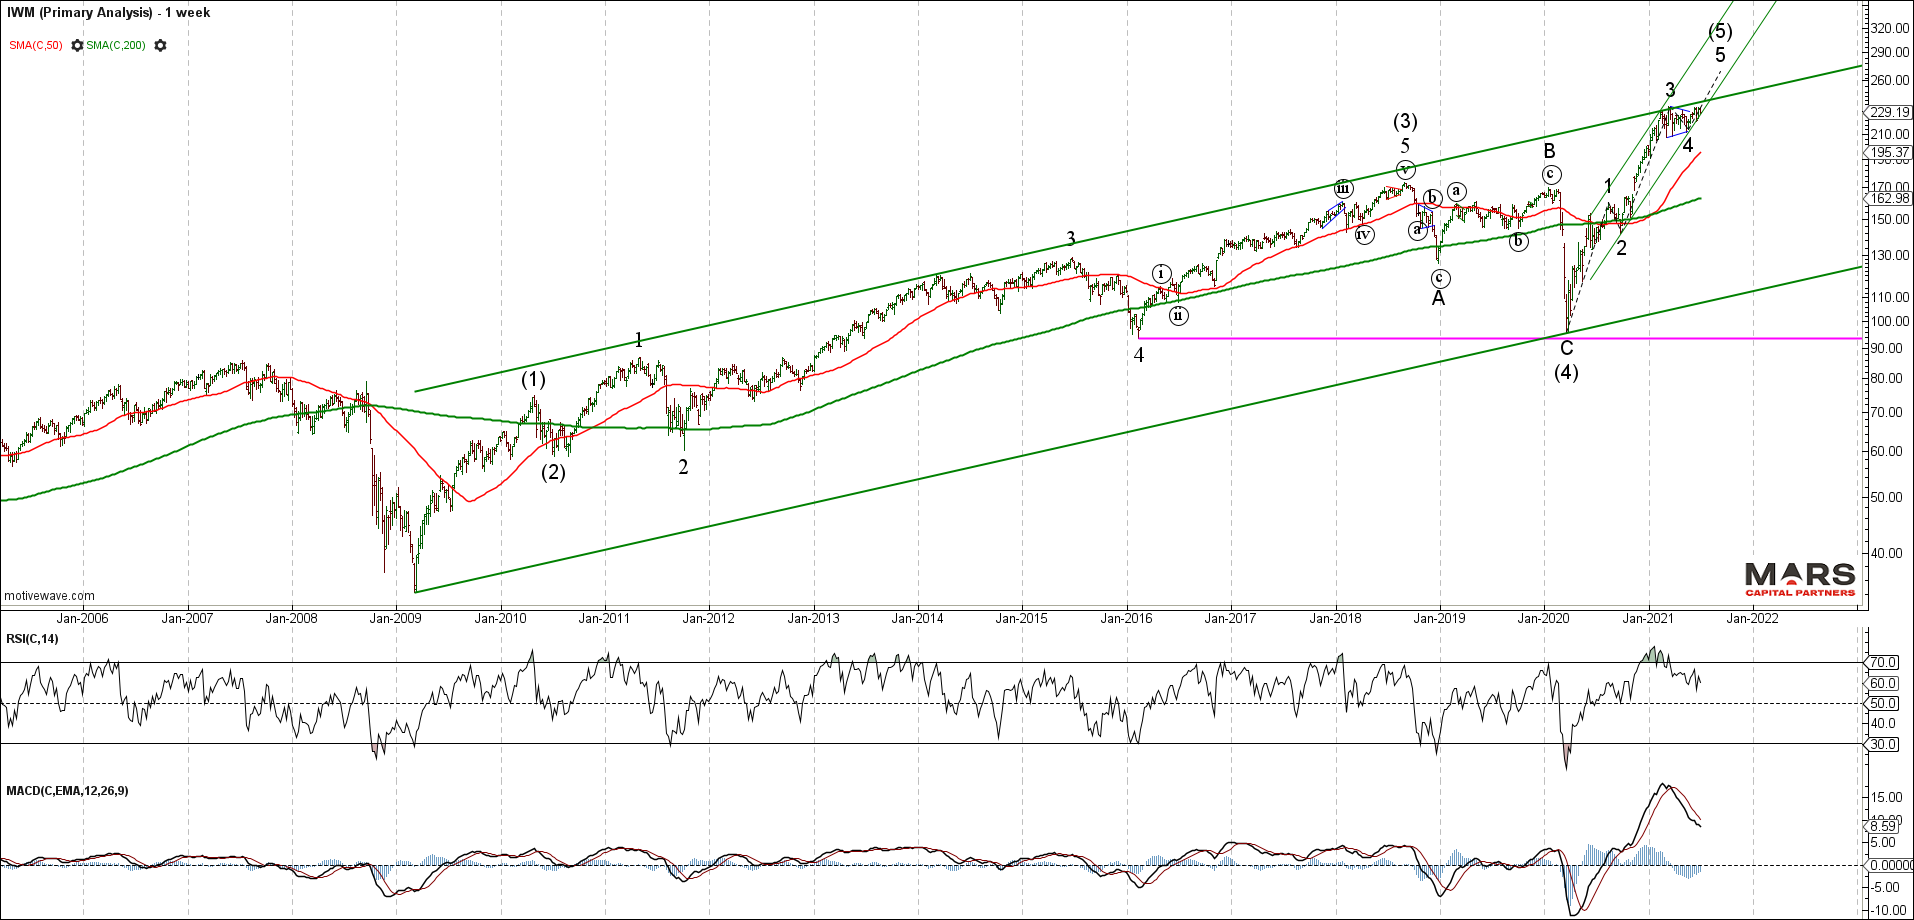
The IWM / RTY continues to stall at overhead resistance and while wave 4 may become more complex, the structure will not be complete until we see a strong wave 5 to new ATH’s. Any near term failure here will likely find strong structural support in the 205 area of underlying trend support and the 200 day sma for a more complex wave 4. We remain bullish the small caps from a structural perspective.
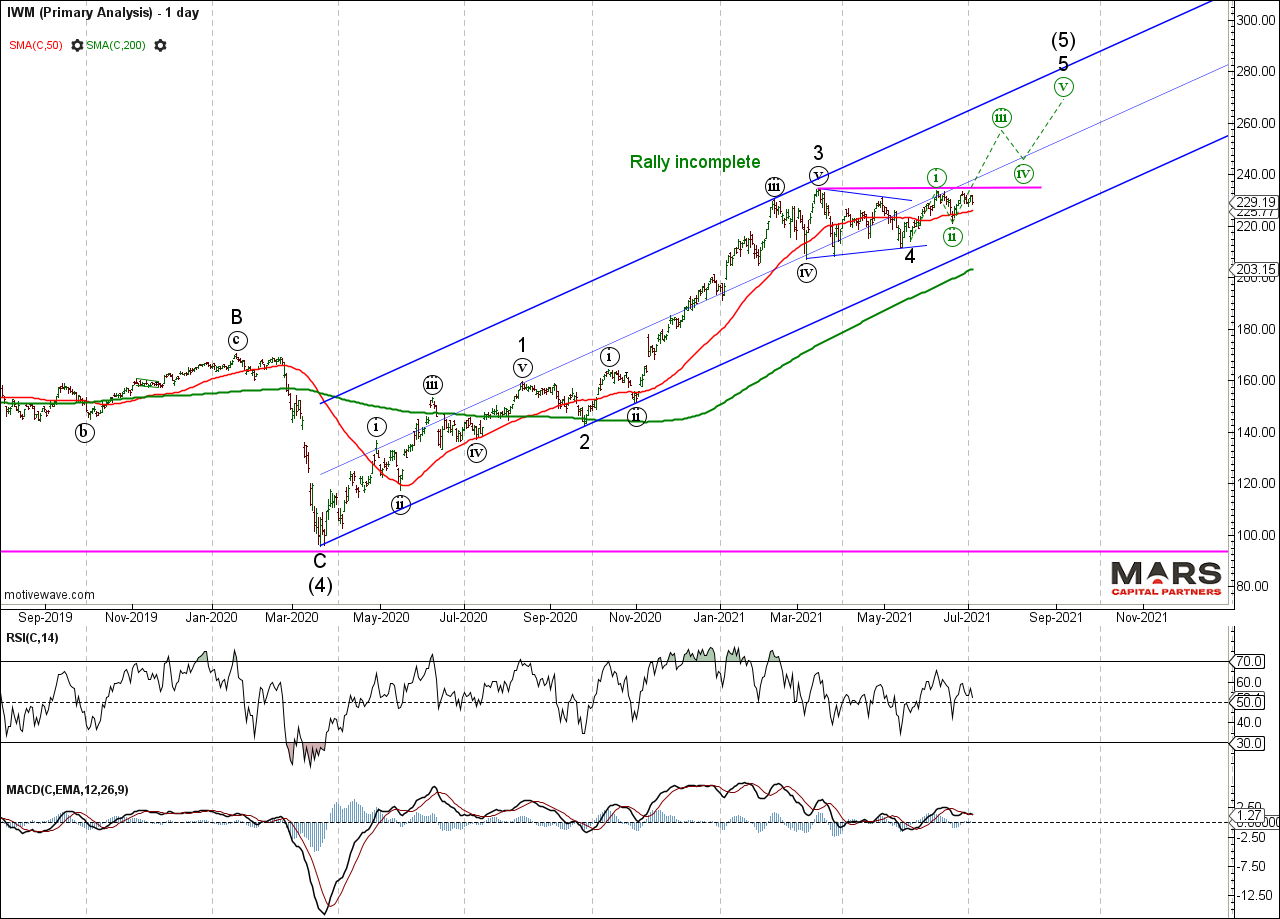
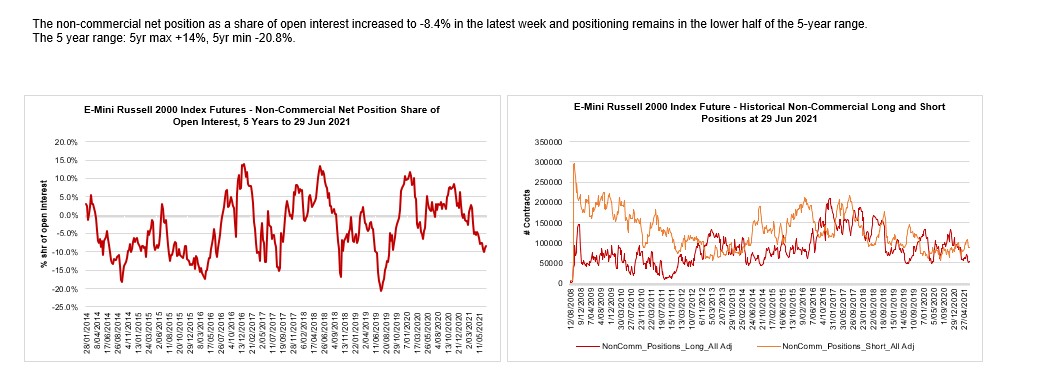
RTY traders remain net short potentially providing fuel for the 5th wave rally to new ATH’s.
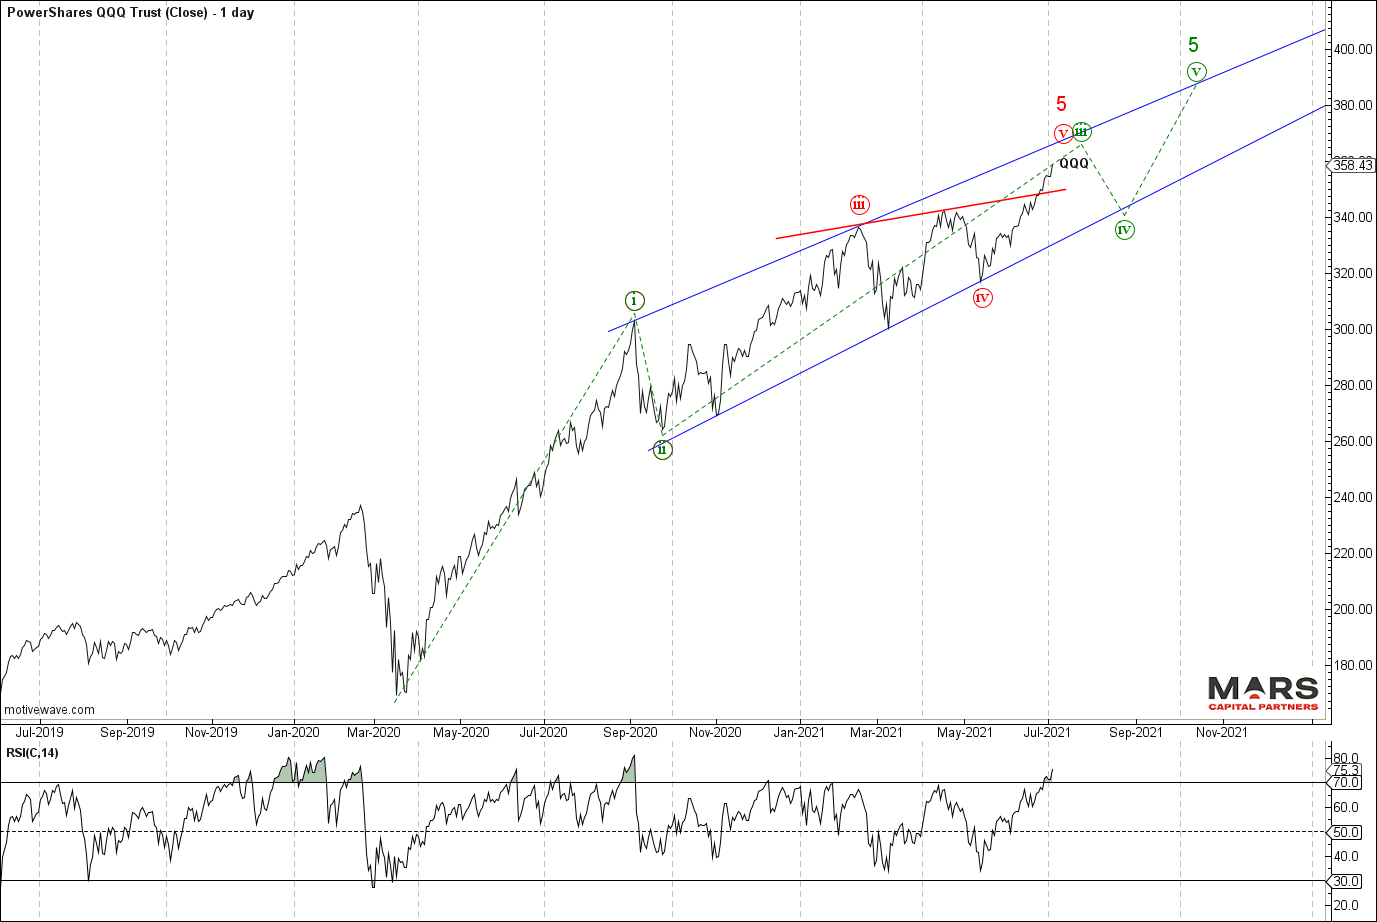
The Nasdaq / QQQ continues to extend higher off trend support in what is expected to be wave (v) of 5 or more bullish wave (iii) of 5 that extends higher later in the year. There is no evidence of a tradable top as rates remain muted and investors refocus on long duration assets. Importantly, the bullish trend remains unbroken with the series of higher highs and higher lows continuing throughout the year – until this changes, the bulls remain in control.
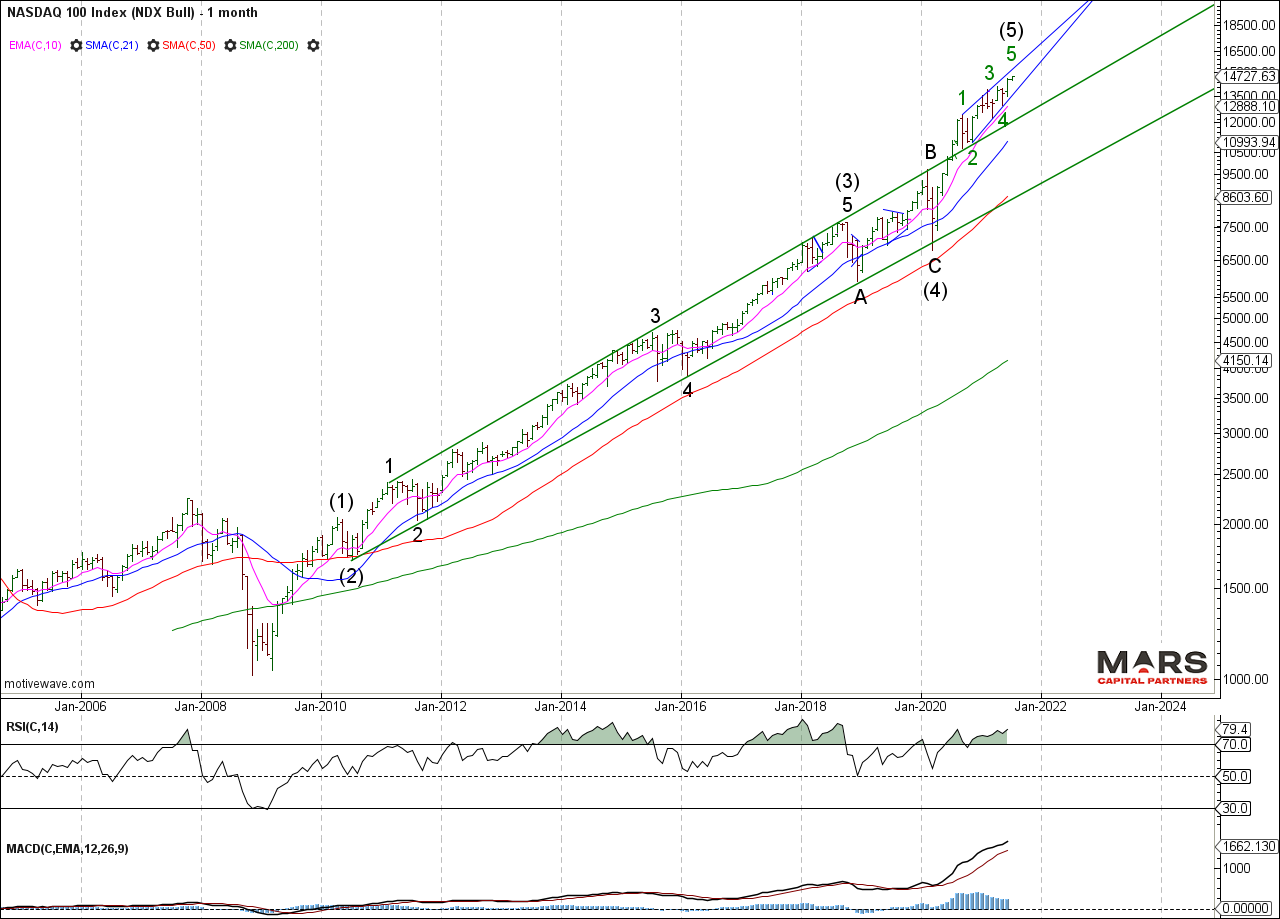
The bigger picture Nasdaq / NDX shows a wave (5) extension that continues to hold above its trend channel breakout. We continue to count this rally from the 2020 lows as an ending 5th wave given its overlapping wedge structure and wave count from the 2009 lows. Likely a blow-off rally until we see evidence of trend exhaustion and reversal later in the year.
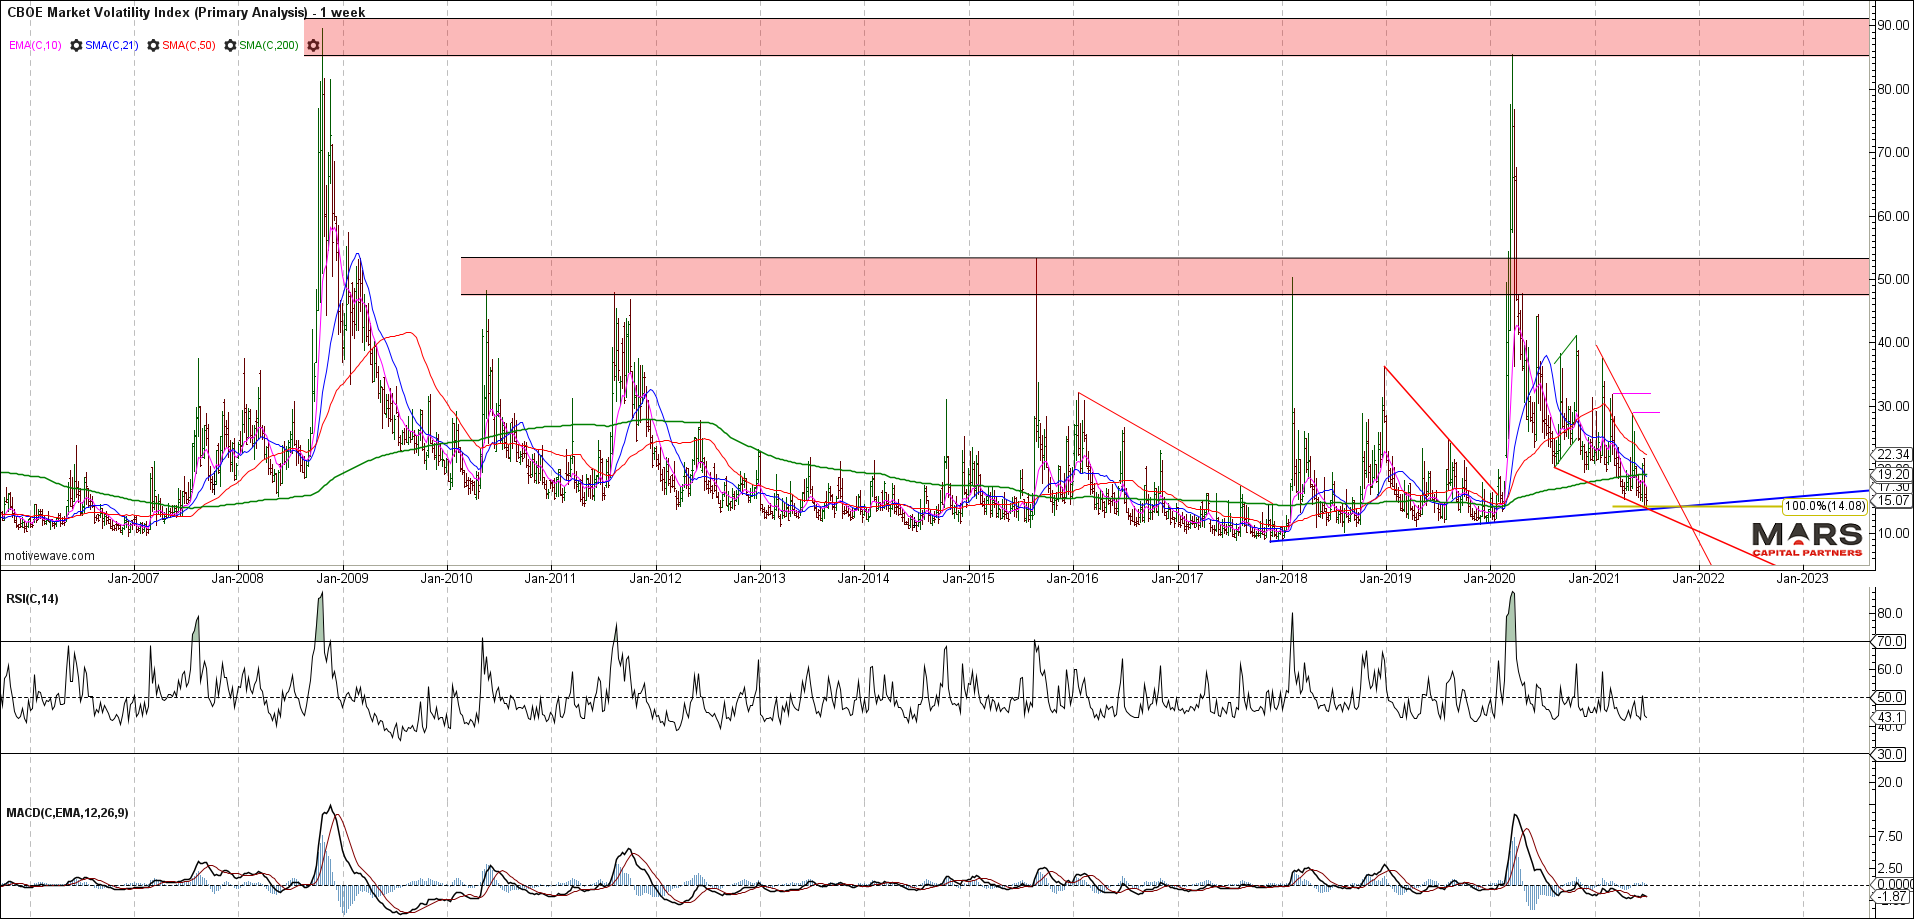
The VIX closed the gap we highlighted at the start of the year and continues to wedge lower into trend support. Despite equities at new ATH’s, the VIX continues to hold above the 2017 lows providing a bullish non-confirmation. We continue to see this wedging decline as an ending pattern but we have no evidence of a bullish turn. Patience is required as equities grind higher. Alternatively, we have the opportunity to buy long dated portfolio insurance at cheap levels.
Bond markets and Rates
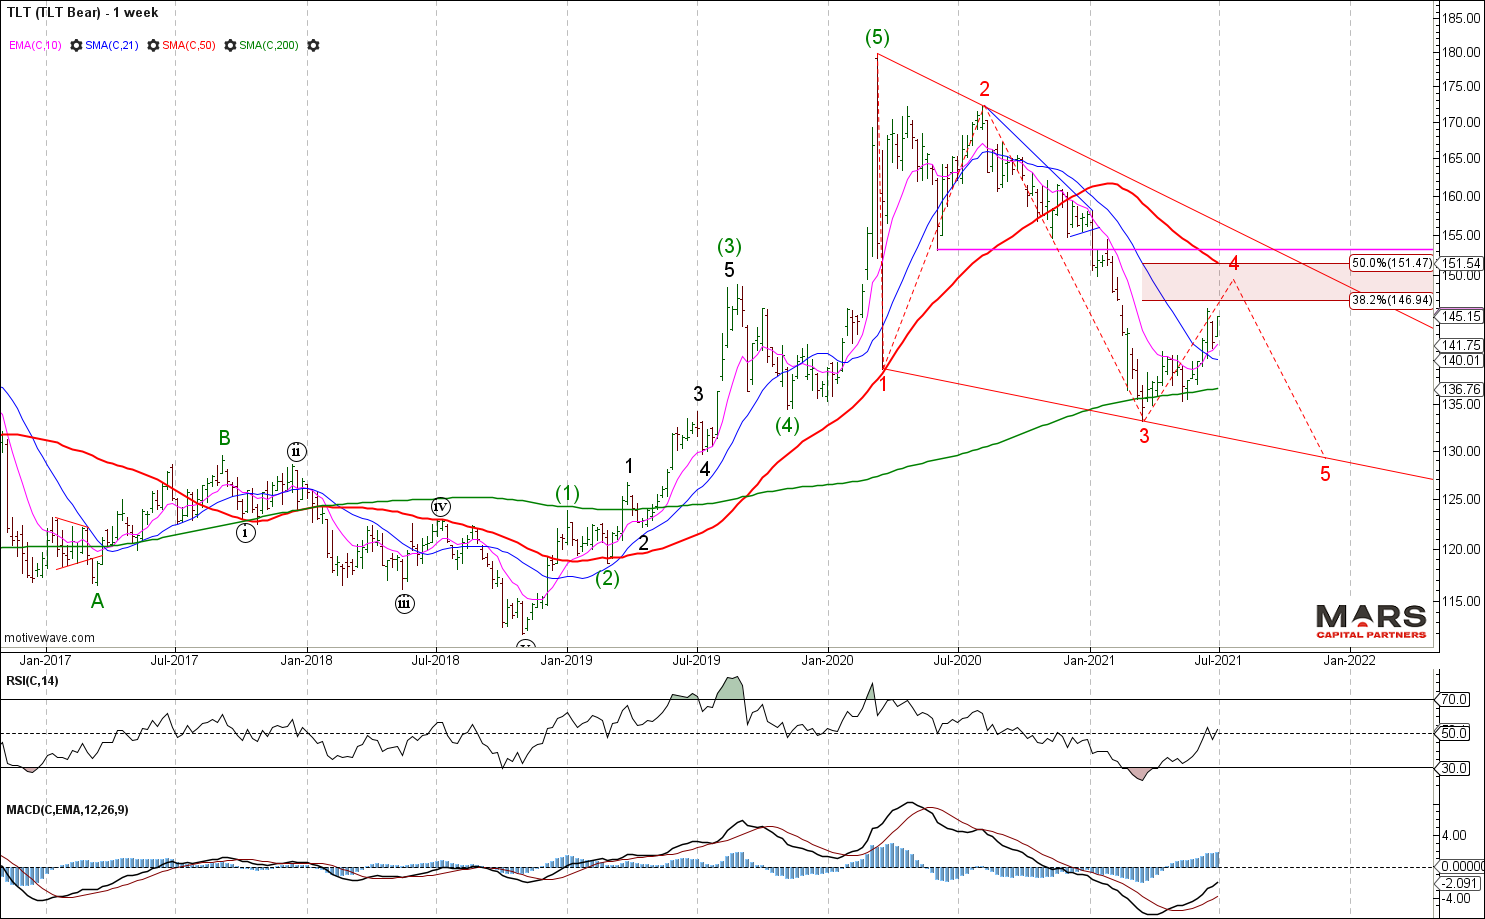
The bond markets as represented by the TLT are rebounding after 3 waves down of equality from the March 2020 highs. The decline is clearly corrective which calls into question the stag-flationary / inflationary outlook requiring higher rates. Central banks are attempting to pin rates at the lows given historically high debt levels globally. Bond bears need to break the March 2021 lows to help confirm a bigger picture change in trend.
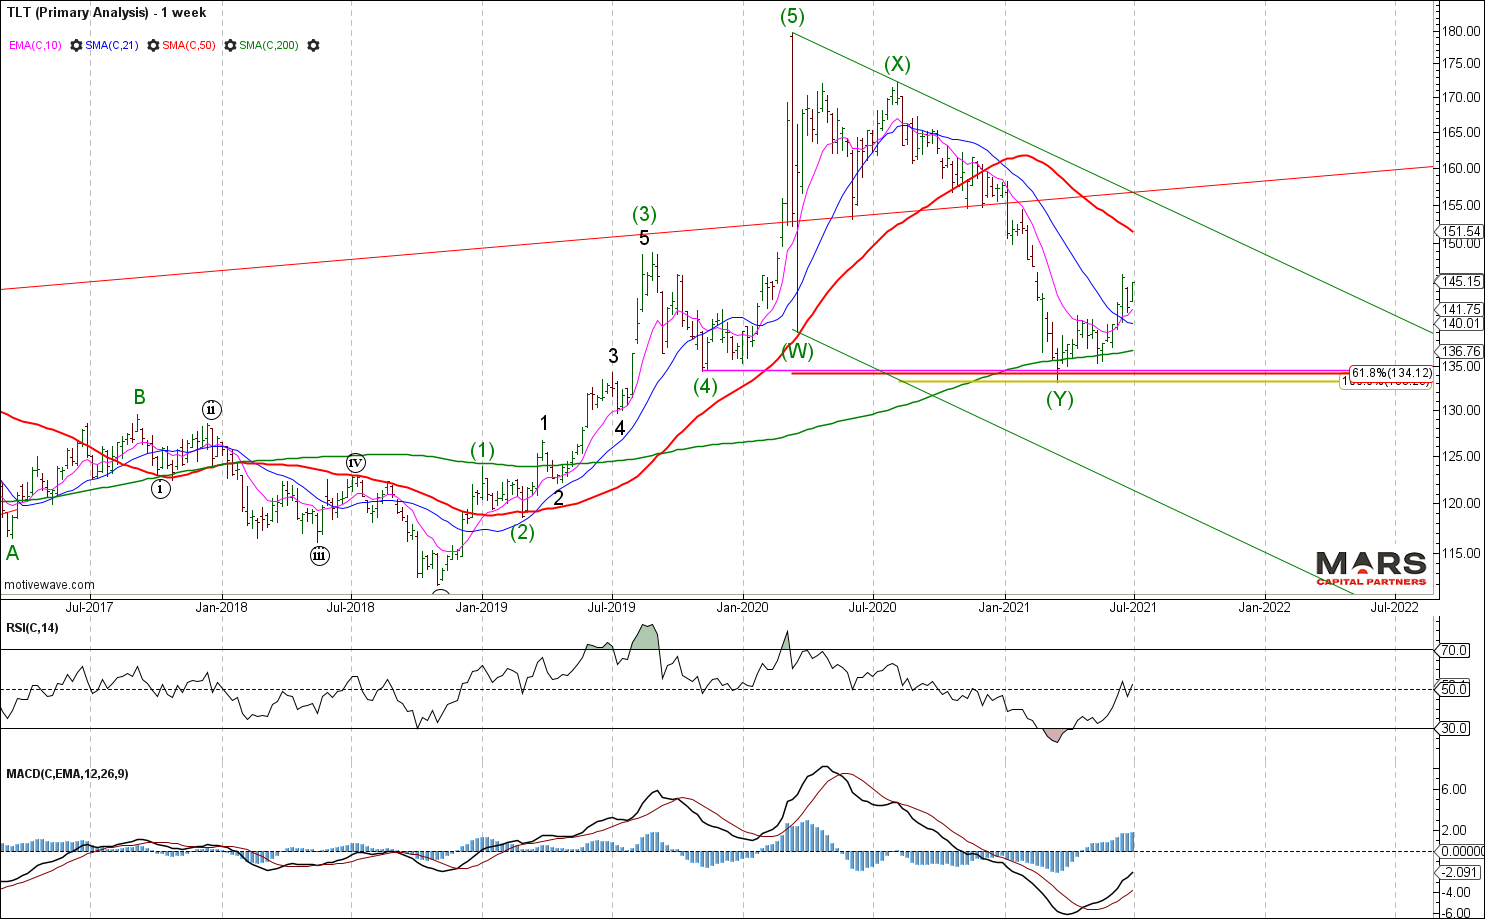
The bearish case for bonds given the market structure is a potential leading diagonal that requires another wave down to marginal new lows. If the TLT continues to rally impulsively, we will need to reconsider our long term bearish outlook for bonds. No evidence yet of a bearish turn as the Fed continues to hold the line.
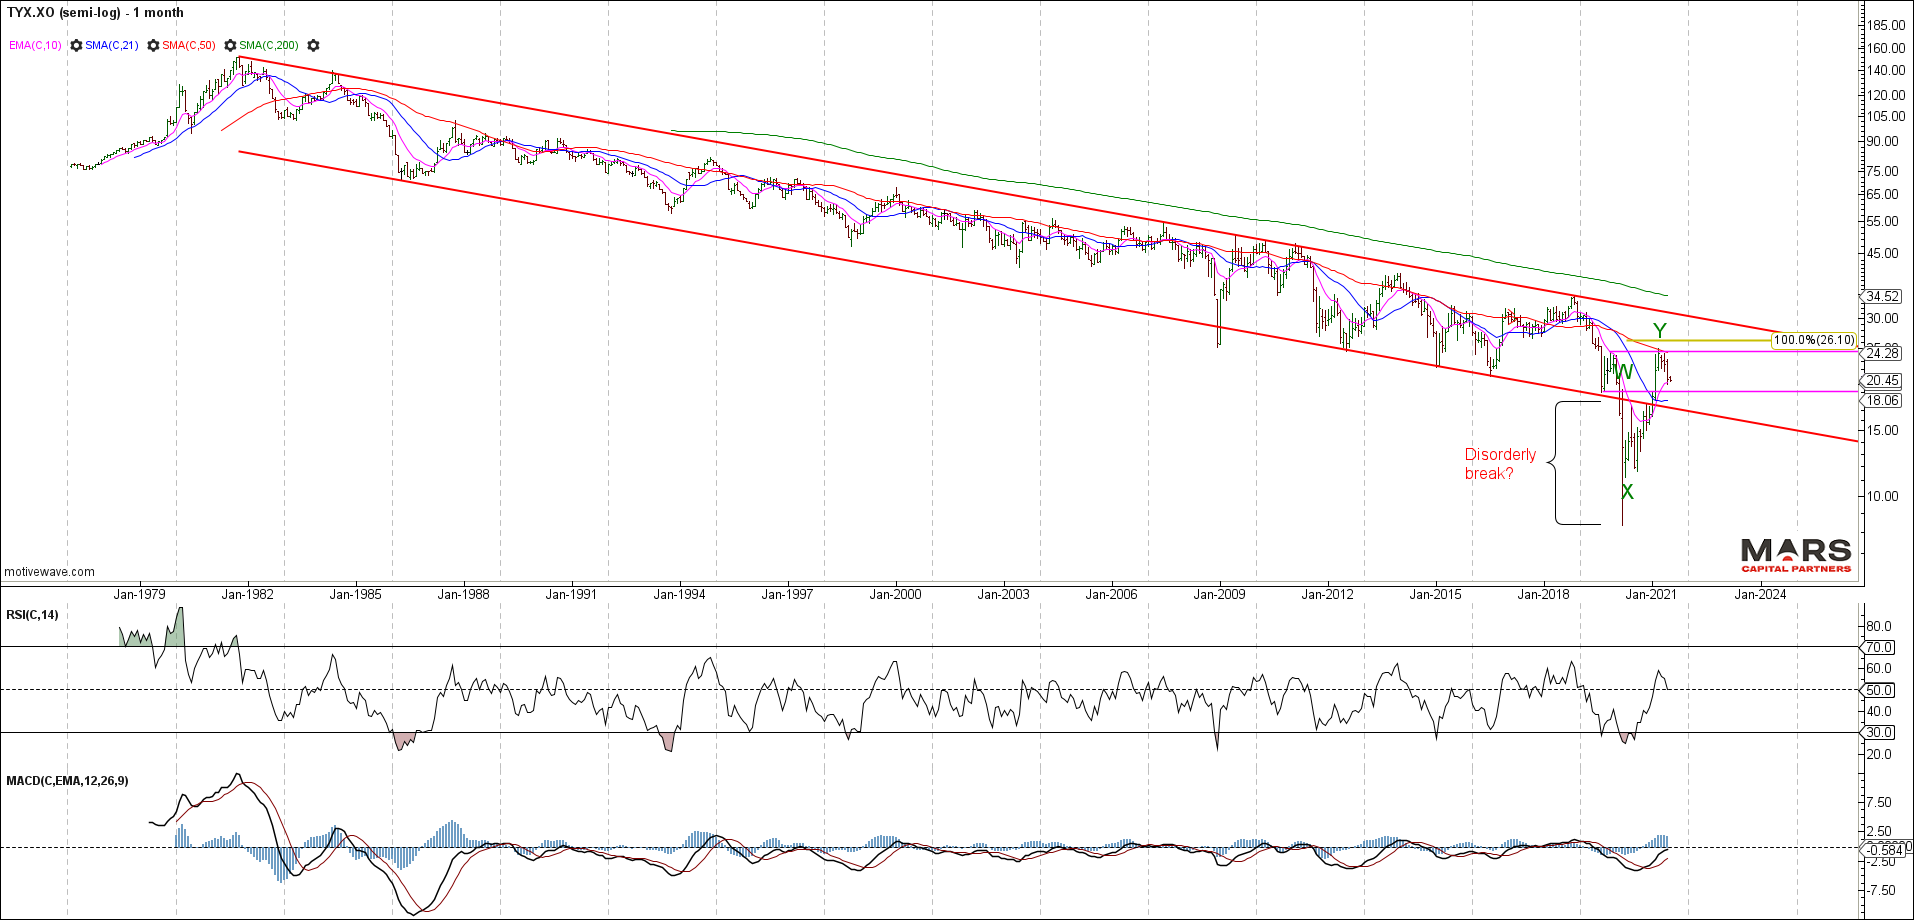
From a big picture perspective, the TYX has rallied in 3 corrective waves of equality from the March 2020 lows. Bulls need to extend this rally into 5 waves up for a change in the big picture trend to up.
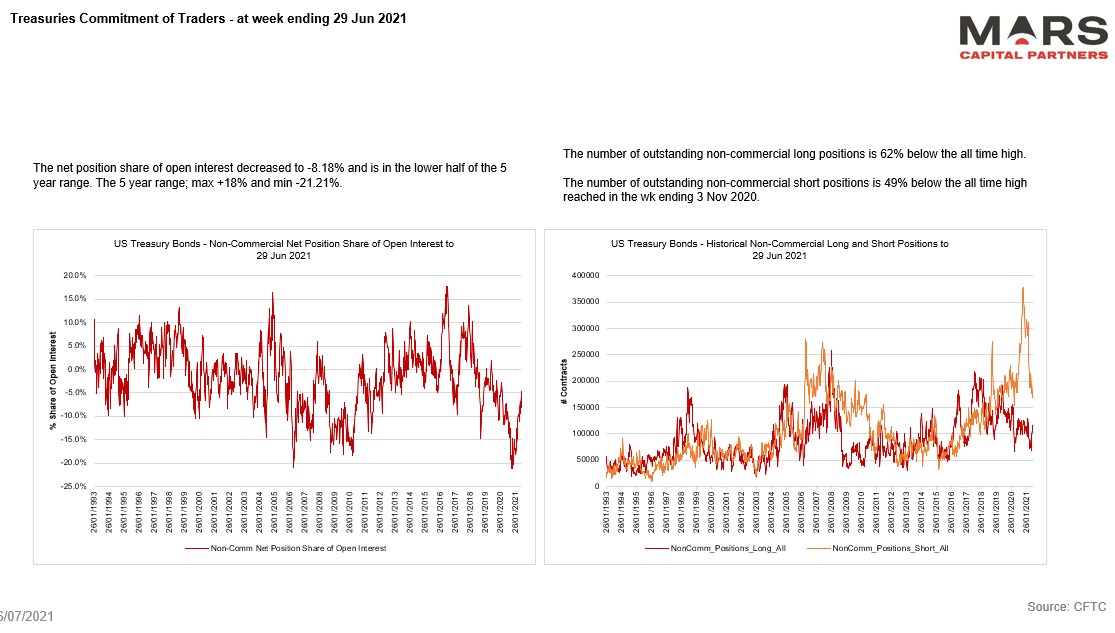
Long bond traders have been squeezed out of their short positions and curve steepeners.
FX markets and the US$
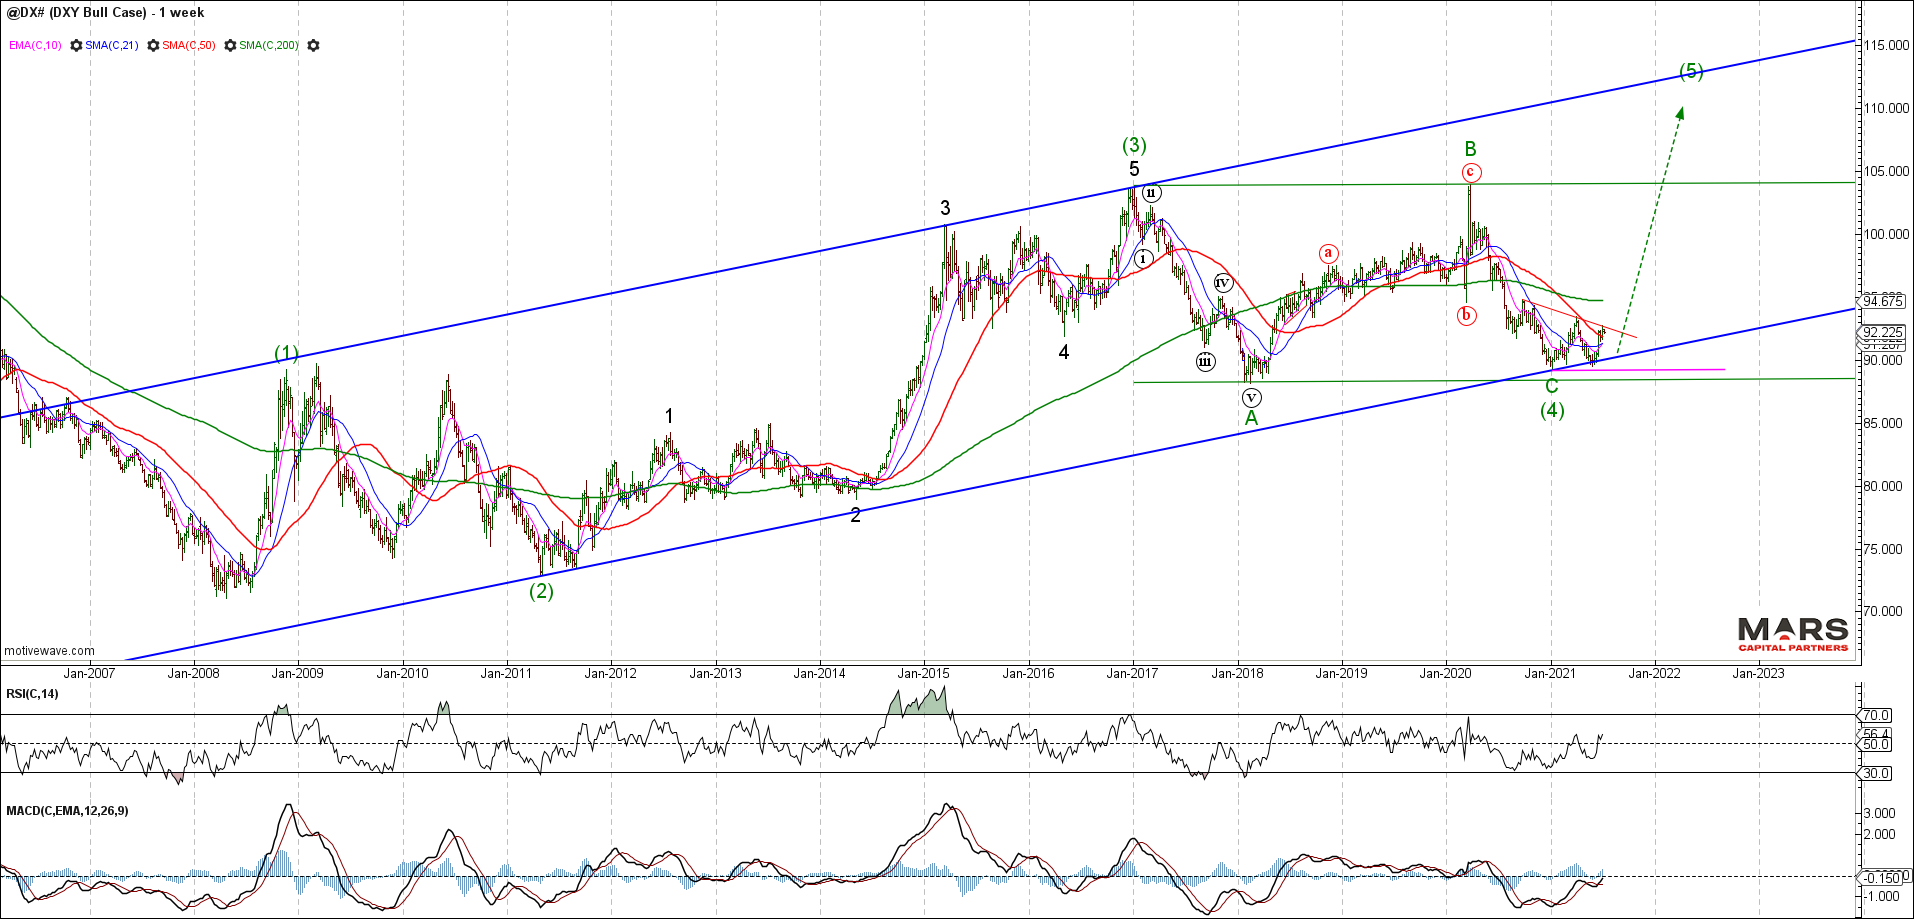
To the FX markets and the US$ continues to hold support from the start of the year. January’s lows are our new Maginot line for the potential bull market in the DXY – below this risks a continued 3rd wave decline that breaks equality support in the 87.40 area and targets much lower prices for the US$. The recent compression is setting up a strong move in either direction – much will depend on Fed signalling through the end of the year. Strong resistance that DXY bulls need to clear remains in the 94-95 area.
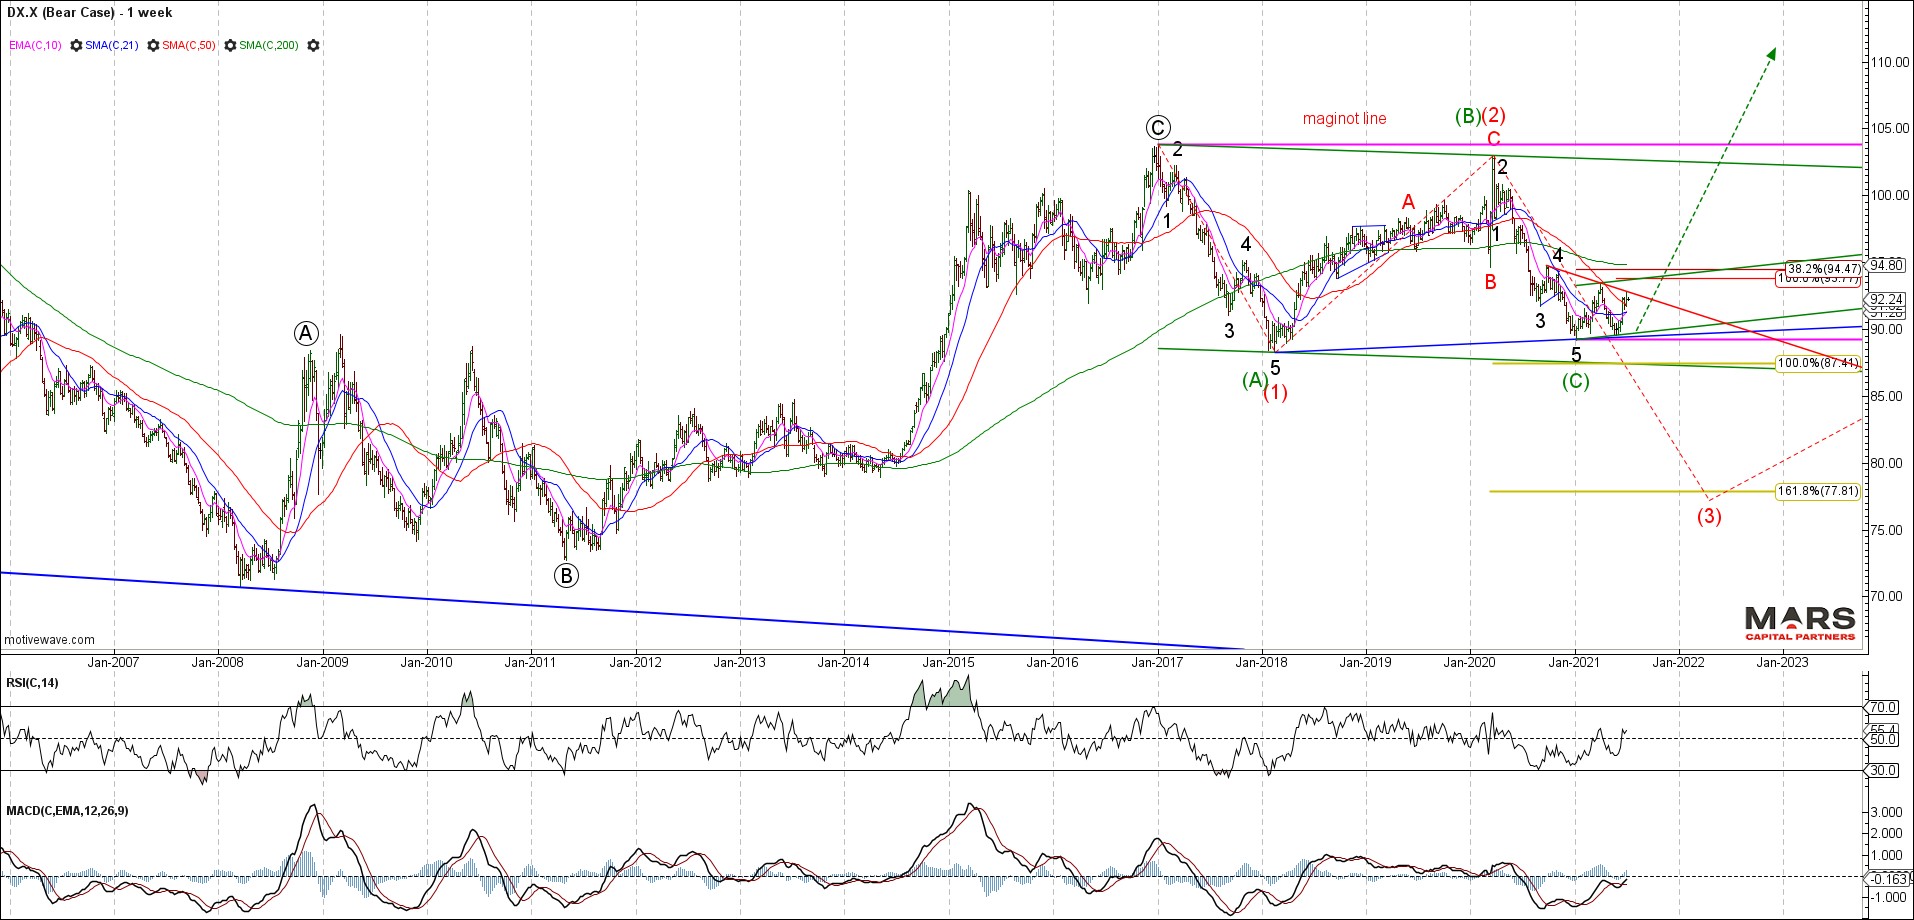
The DXY long term bull case remains a strong potential if it can break up and through near term resistance while holding swing lows. This bullish outlook will likely require the Fed to shift its policy signalling to a more hawkish outlook.
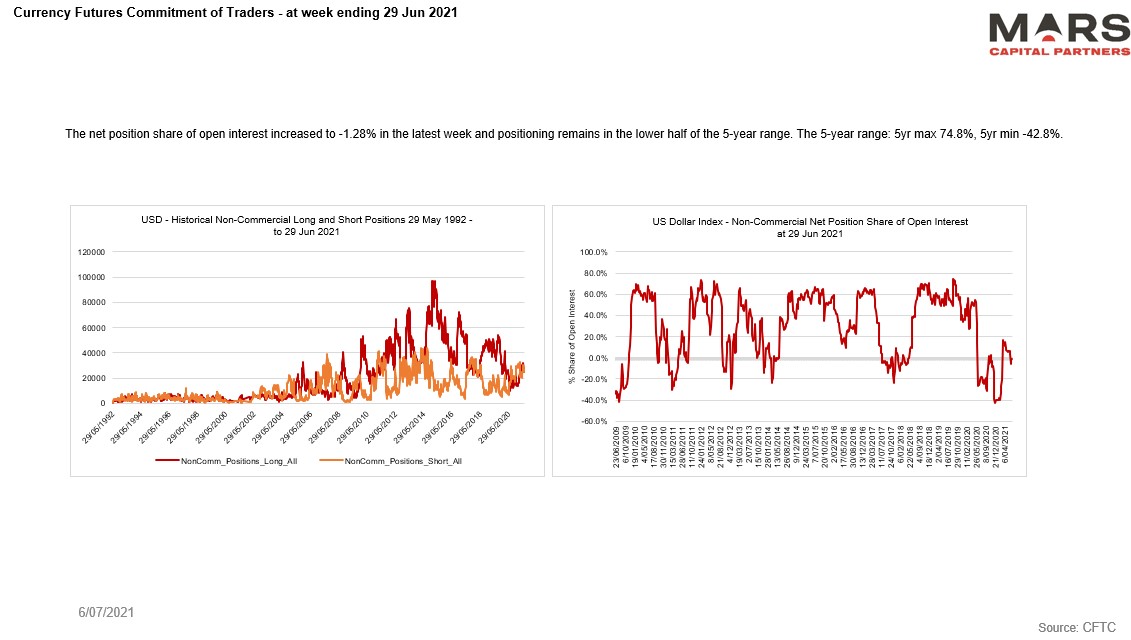
DXY longs are trying to get up off the floor.
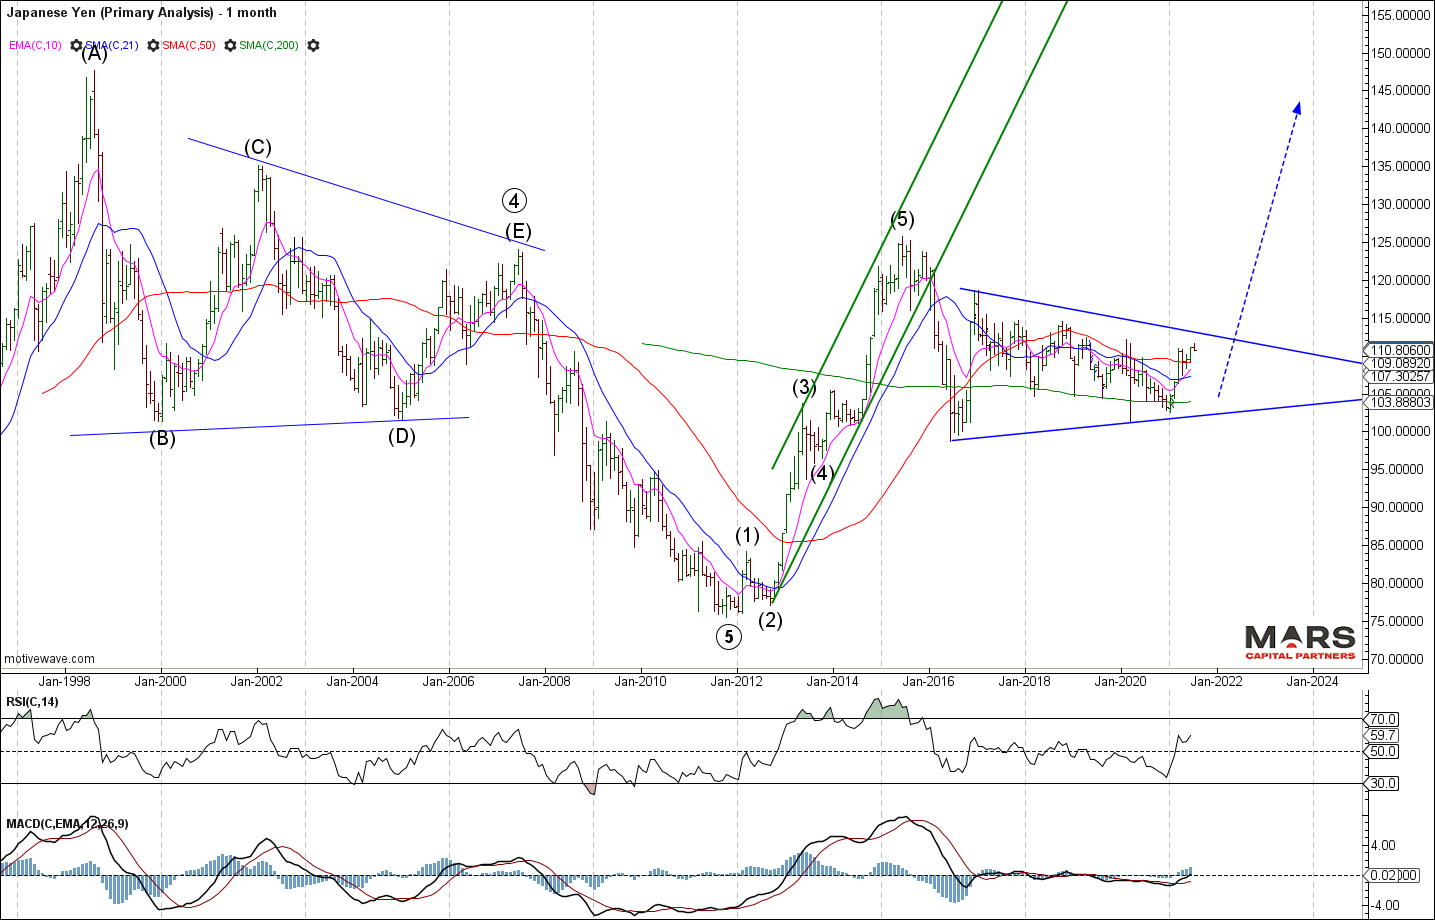
The USDJPY remains range bound and corrective following its impulsive rally from the 2011 lows. Our bigger picture outlook remains bullish for this pair as we look for a break up and out of this congestion. Our base case is that the USDJPY made a generational low in 2011 and the bigger picture trend has turned with upside targets in the 145 area.
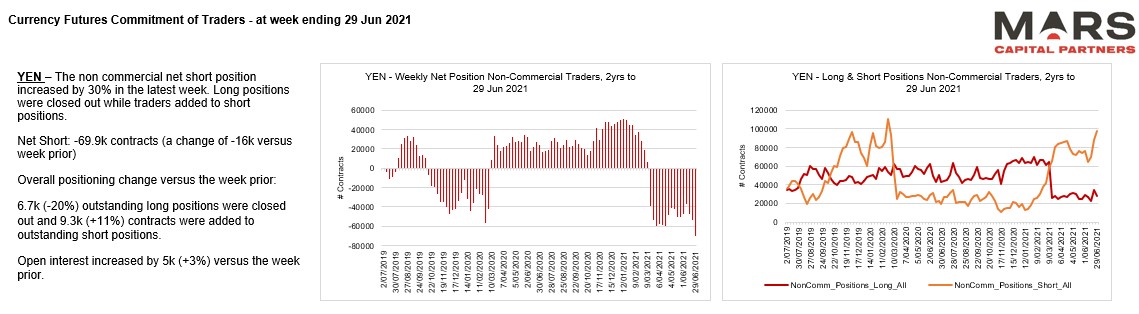
Yen traders are now extremely short making them vulnerable to a near term correction.
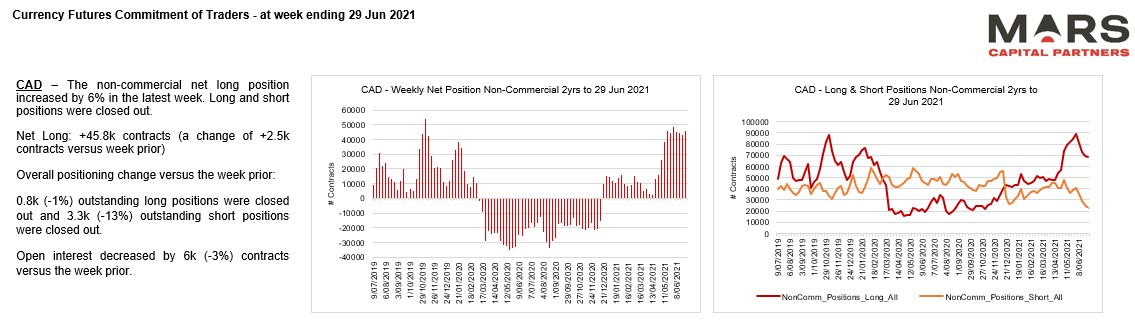
The USDCAD met our measured downside targets in the 1.20 area from where we have seen an attempted rally. Structurally, we have a clear 3-3-5 Flat correction from the January 2016 highs. The onus is now on the USDCAD bulls to make a stand and hold the 1.20 major support zone – failure to do so will likely see an accelerated decline through support towards 1.04 and below.
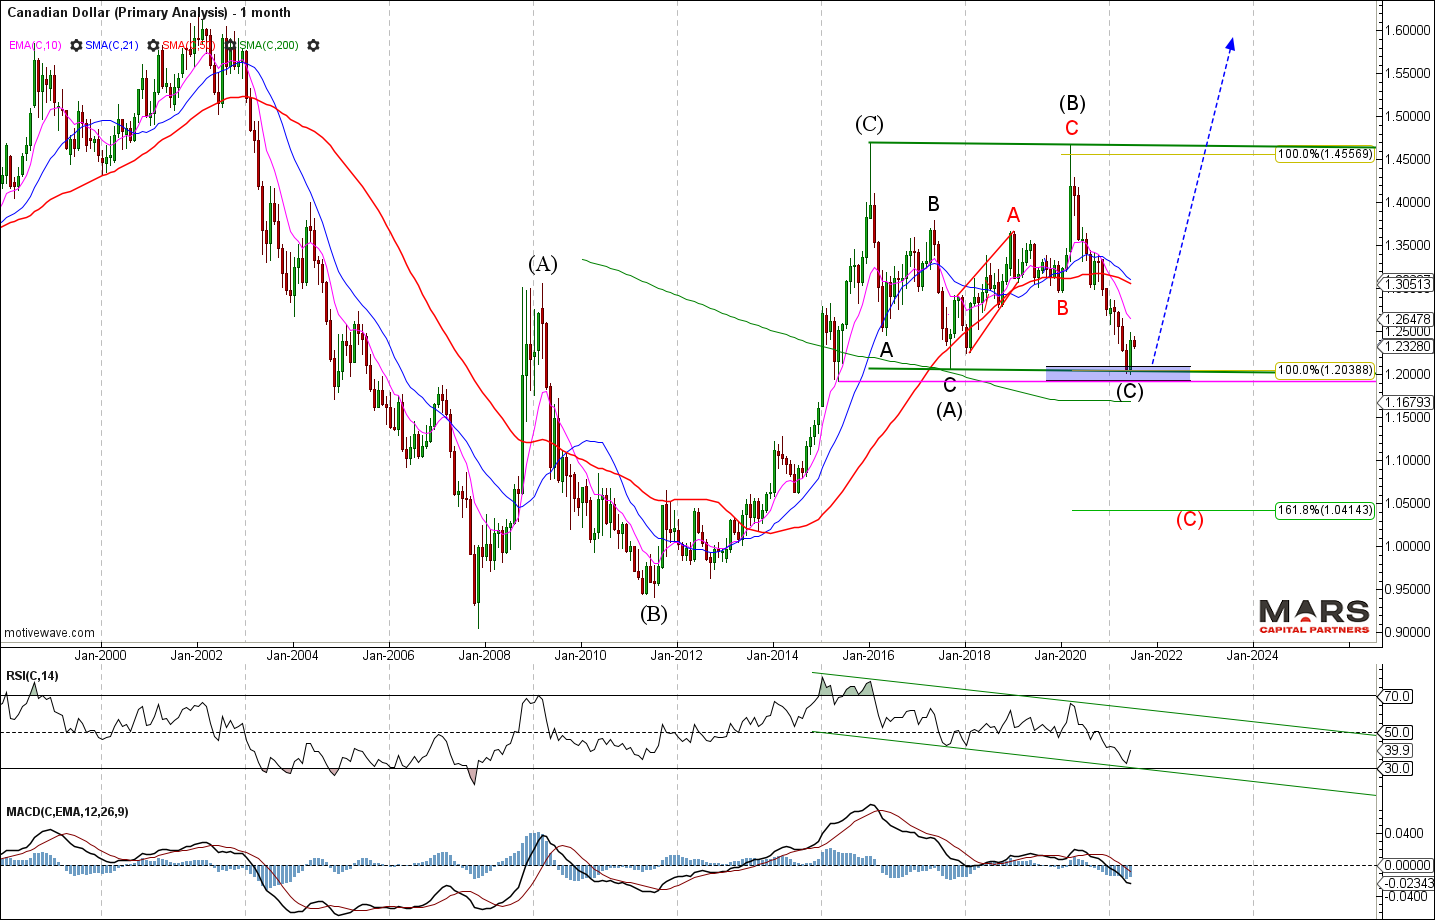
CAD traders remain excessively long. Buyer beware.
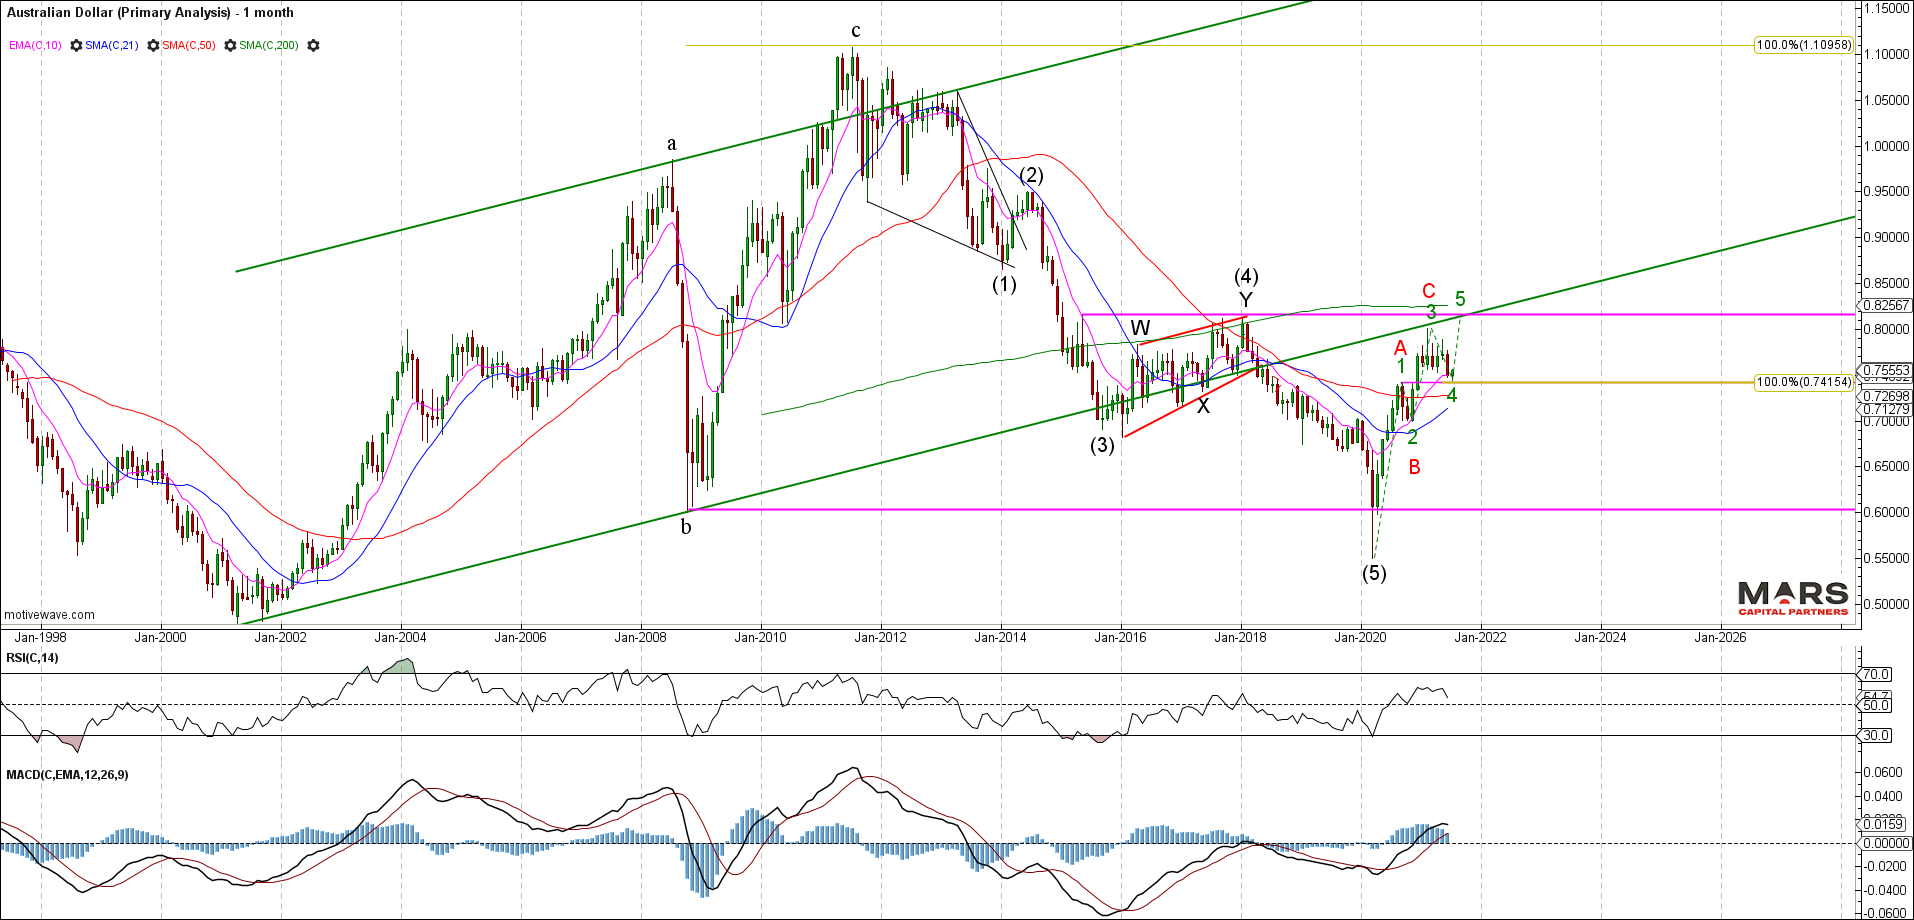
The Aussie$ outlook is less clear having struggled to rally only in 3 waves into trend resistance so far from the March 2020 lows. The AUDUSD needs to rally immediately in wave 5 while holding 0.74 support to keep the bull case alive. Major resistance remains in the 0.82 area of the prior 4th wave.
Commodities
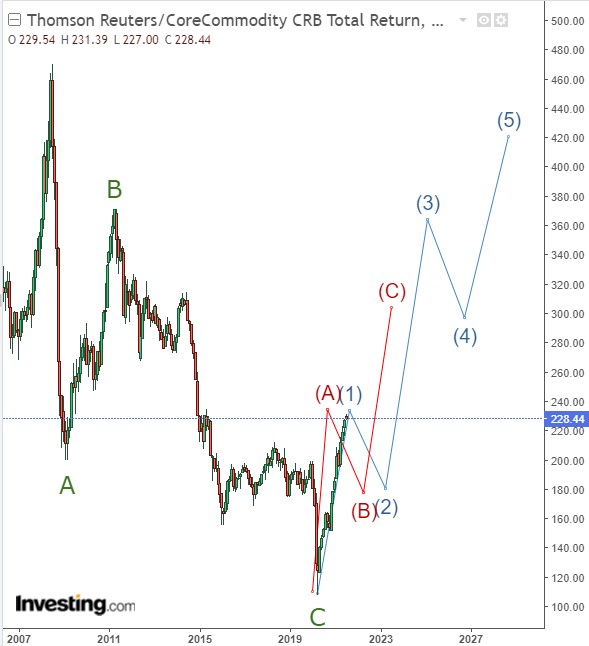
Industrial commodities confirmed our bullish outlook from the start of the year but may be nearing an end to the initial impulsive wave up. The rally is clearly extended and we now have enough waves in place for wave 1 / A up off major swing lows in 2020. We remain bullish commodities from a big picture perspective but are wary of any near term pullback setting up the next wave higher. No evidence yet of a tradable top and the big picture structure is clearly bullish.
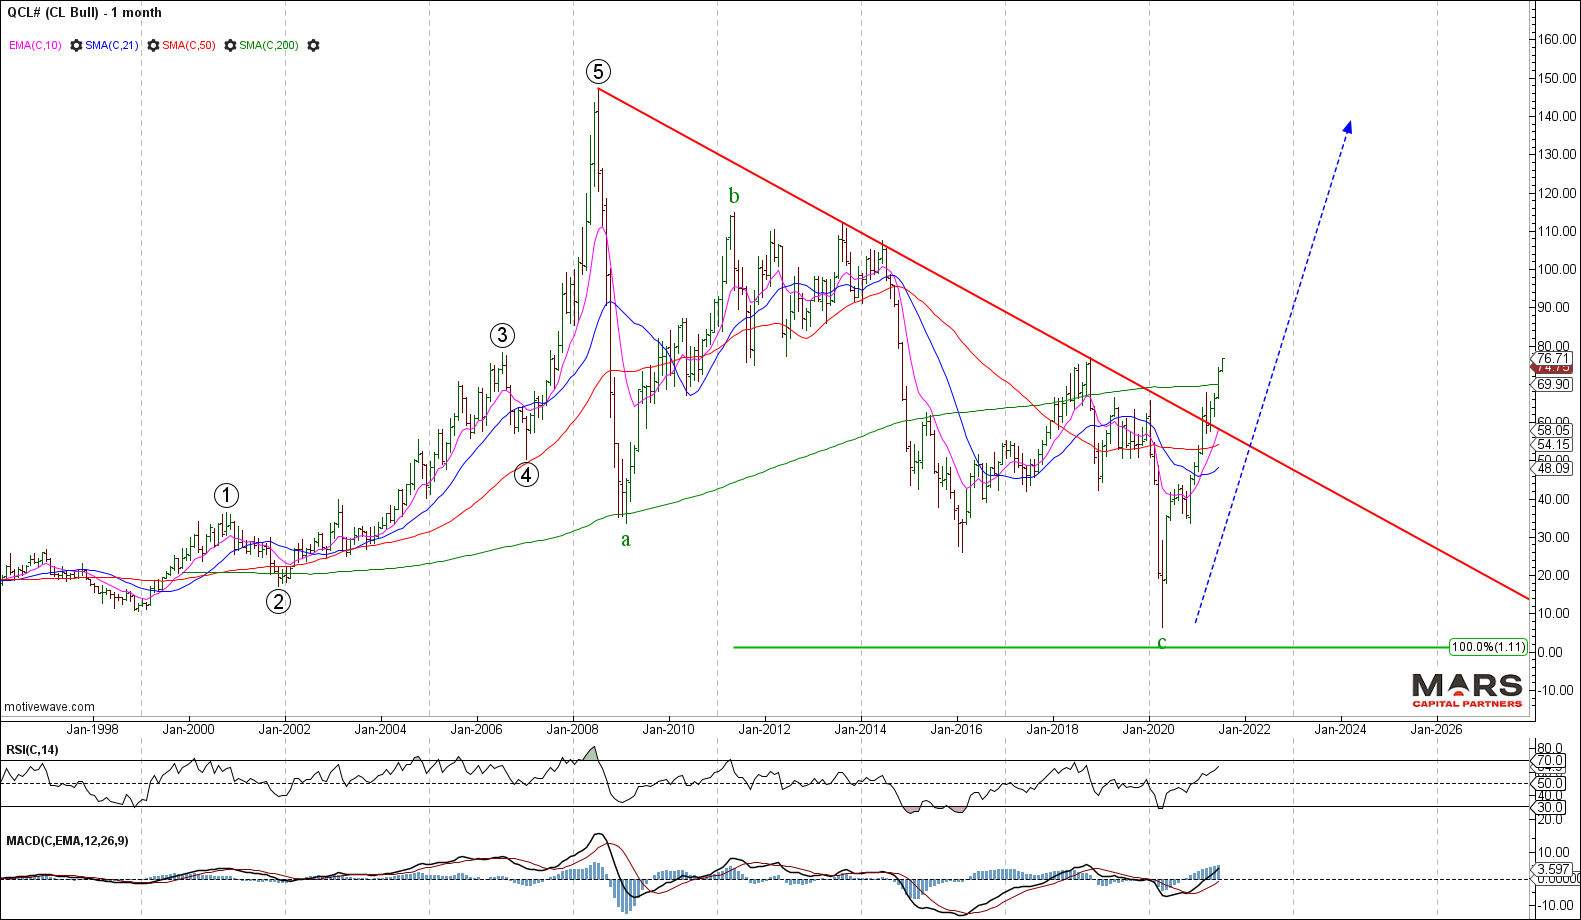
Crude Oil continues to lead the way for our bullish commodities story with a strong impulsive rally from the April 2020 lows. The current rally is very extended so we should be alert to the potential for a near term correction within the bigger picture bullish trend. CL remains bullish from a structural perspective.
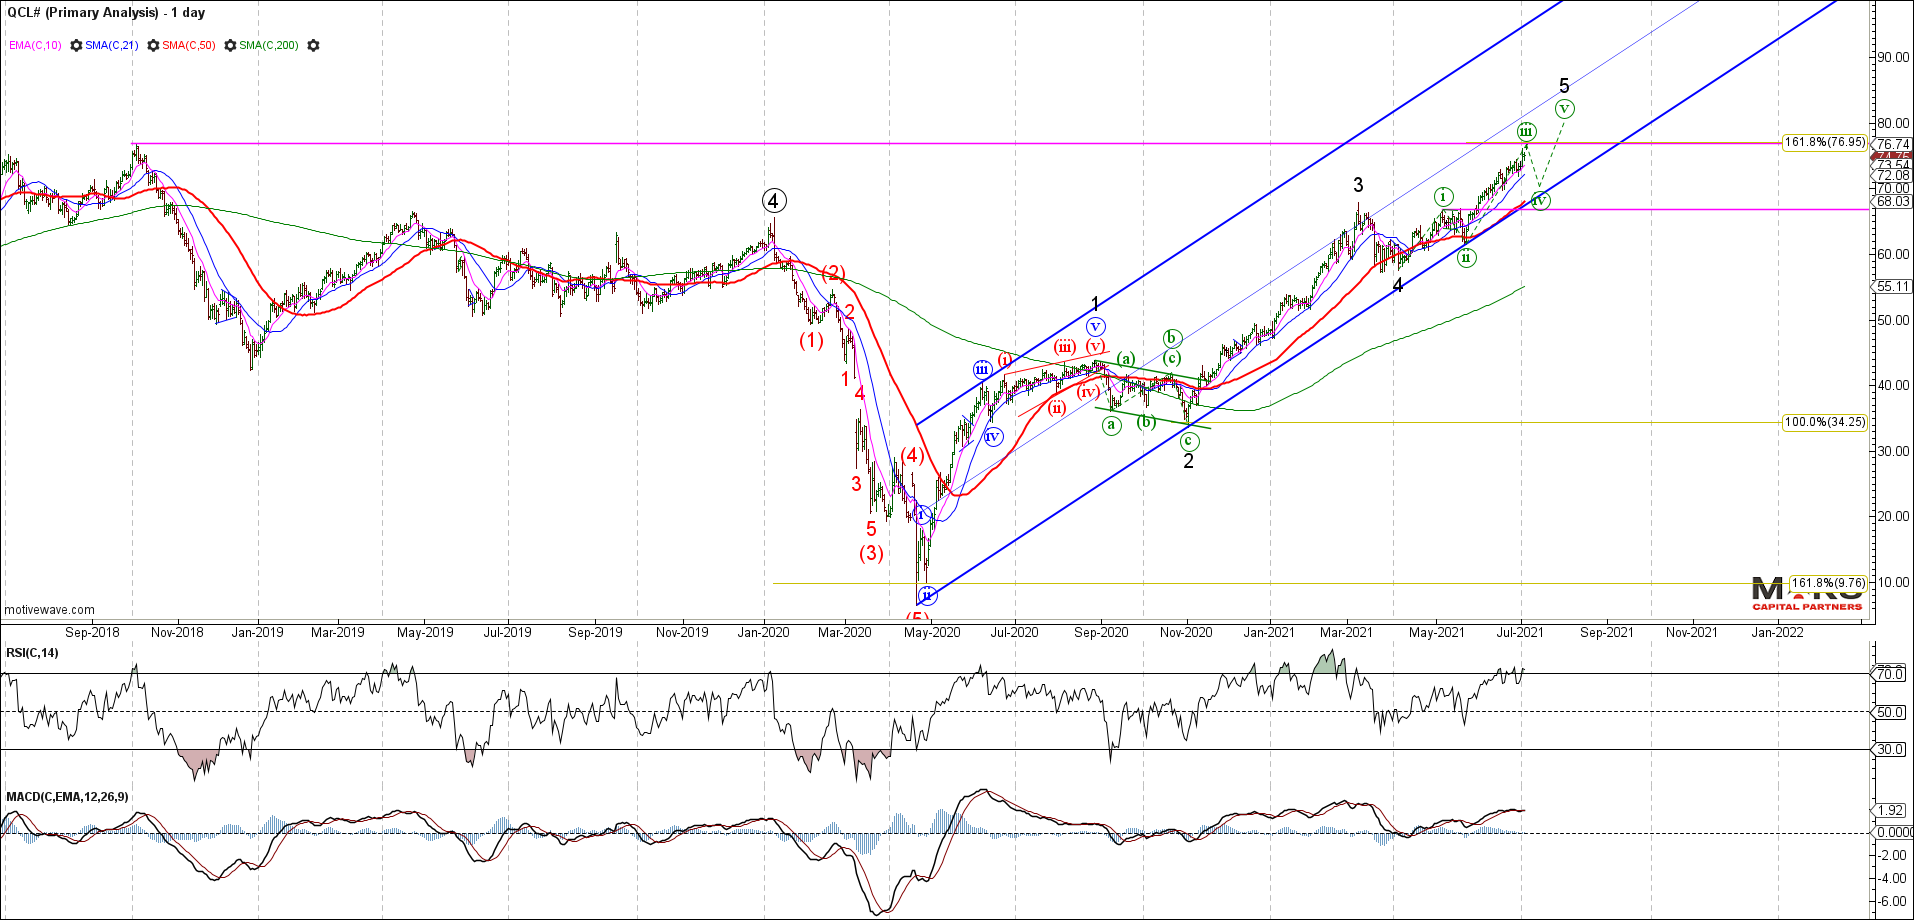
The CL bull count remains intact as wave (iii) of 5 continues to extend higher. Note the importance of trend support and the 50 day sma. Any close below support will likely signal an end to the initial rally up from the April 2020 lows. Ideally, we’d like to see another small degree 4th and 5th wave to end the rally but the structure remains bullish until proven otherwise.
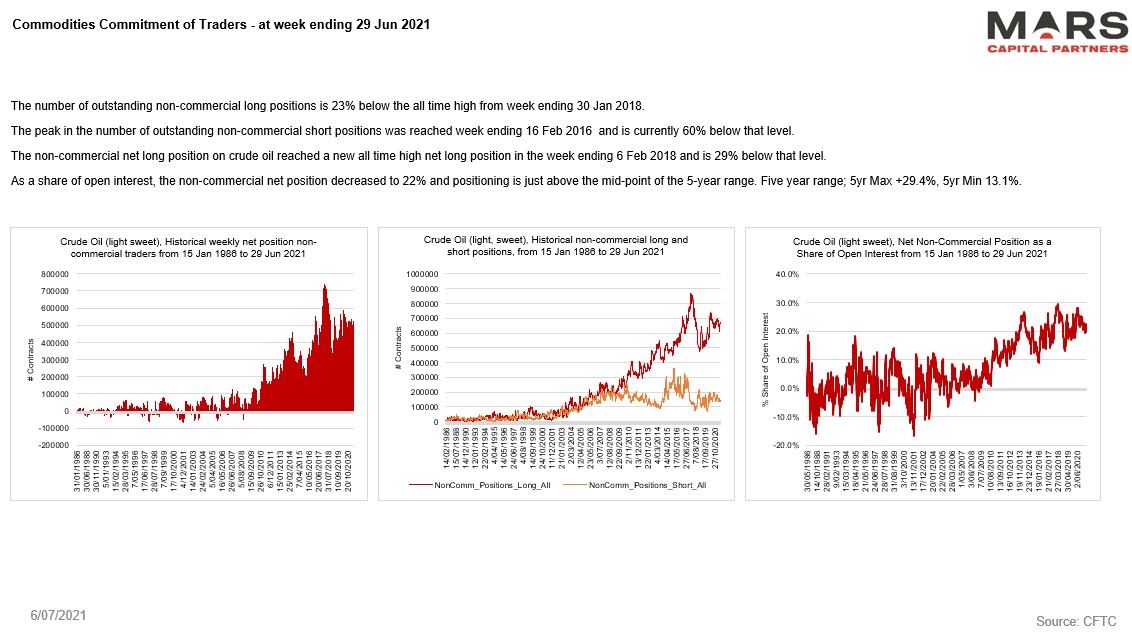
CL bulls continue to press into the highs. Very one-sided trade at the moment.
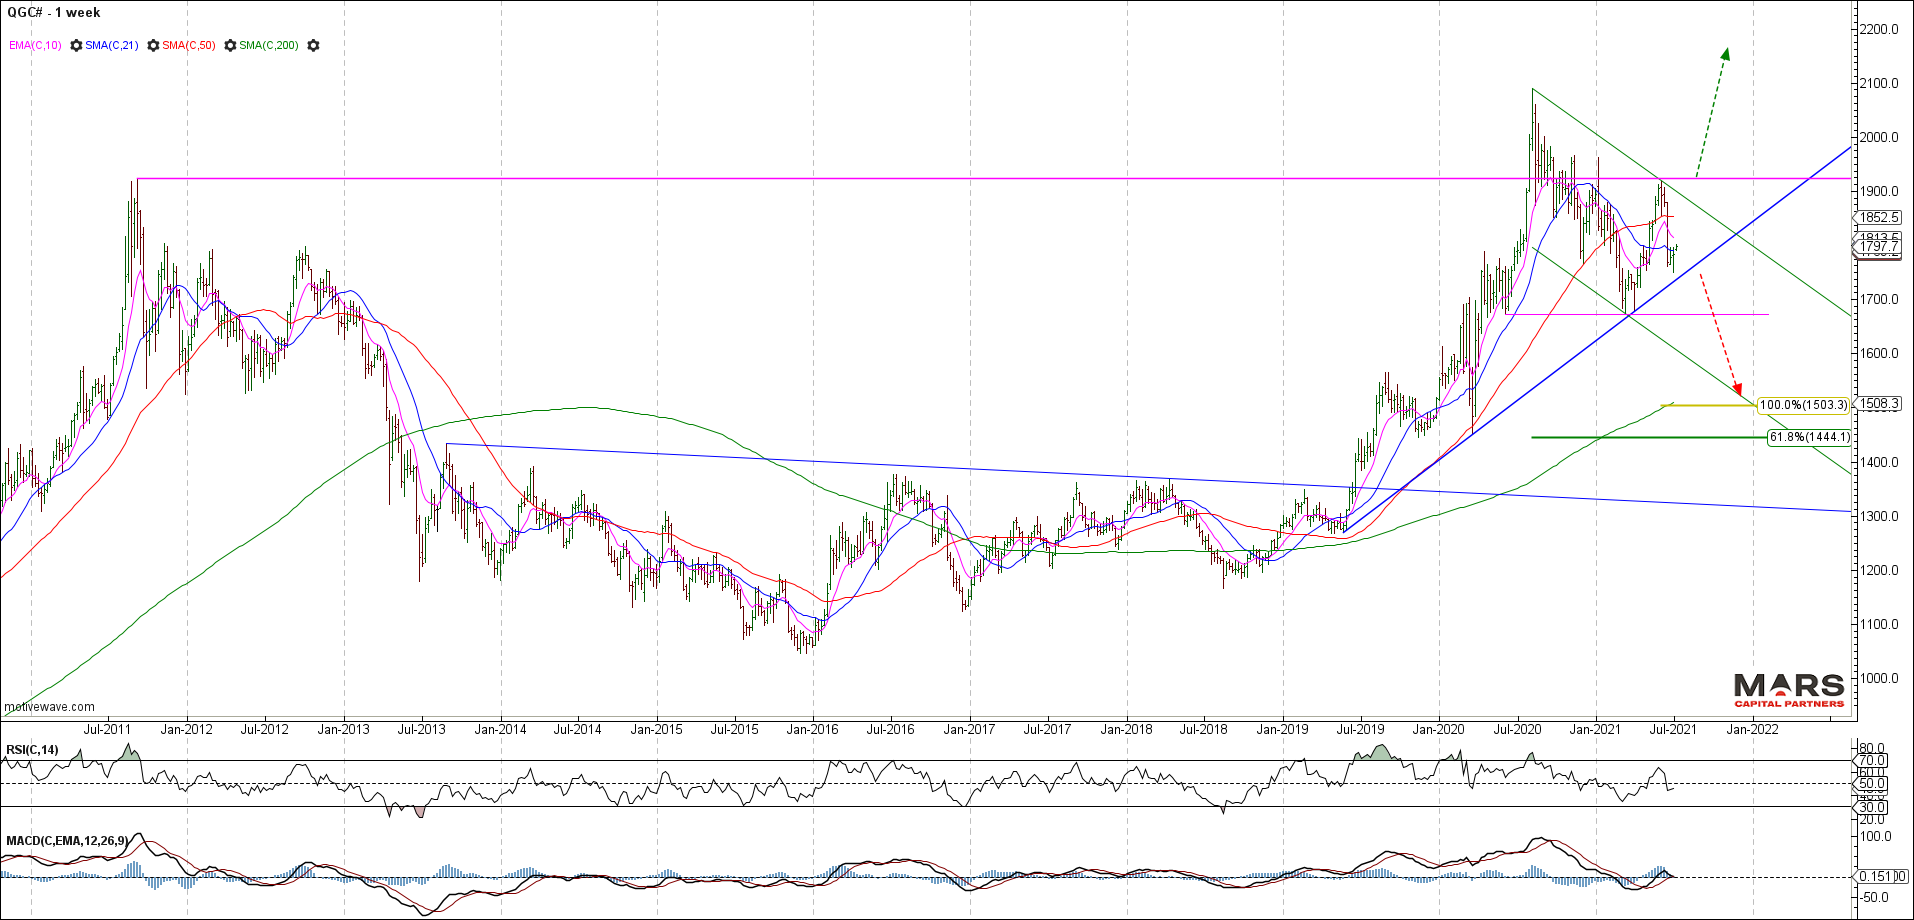
Gold failed to break higher and remains within a corrective decline from the August 2020 highs. Last week’s impulsive decline into trend support warns that any break will likely see an extended decline. With the Fed minutes due out this week, a hawkish tone will likely sink Gold to a break below trend. Bulls obviously need to clear 1920 resistance to gain any upside momentum and risks failure below 1670. A lot will depend on the Fed’s near term signalling but Gold remains vulnerable here. No strong view but likely bearish near term.
Gold traders remain very long despite the pullback in price. May be some more pain to come.
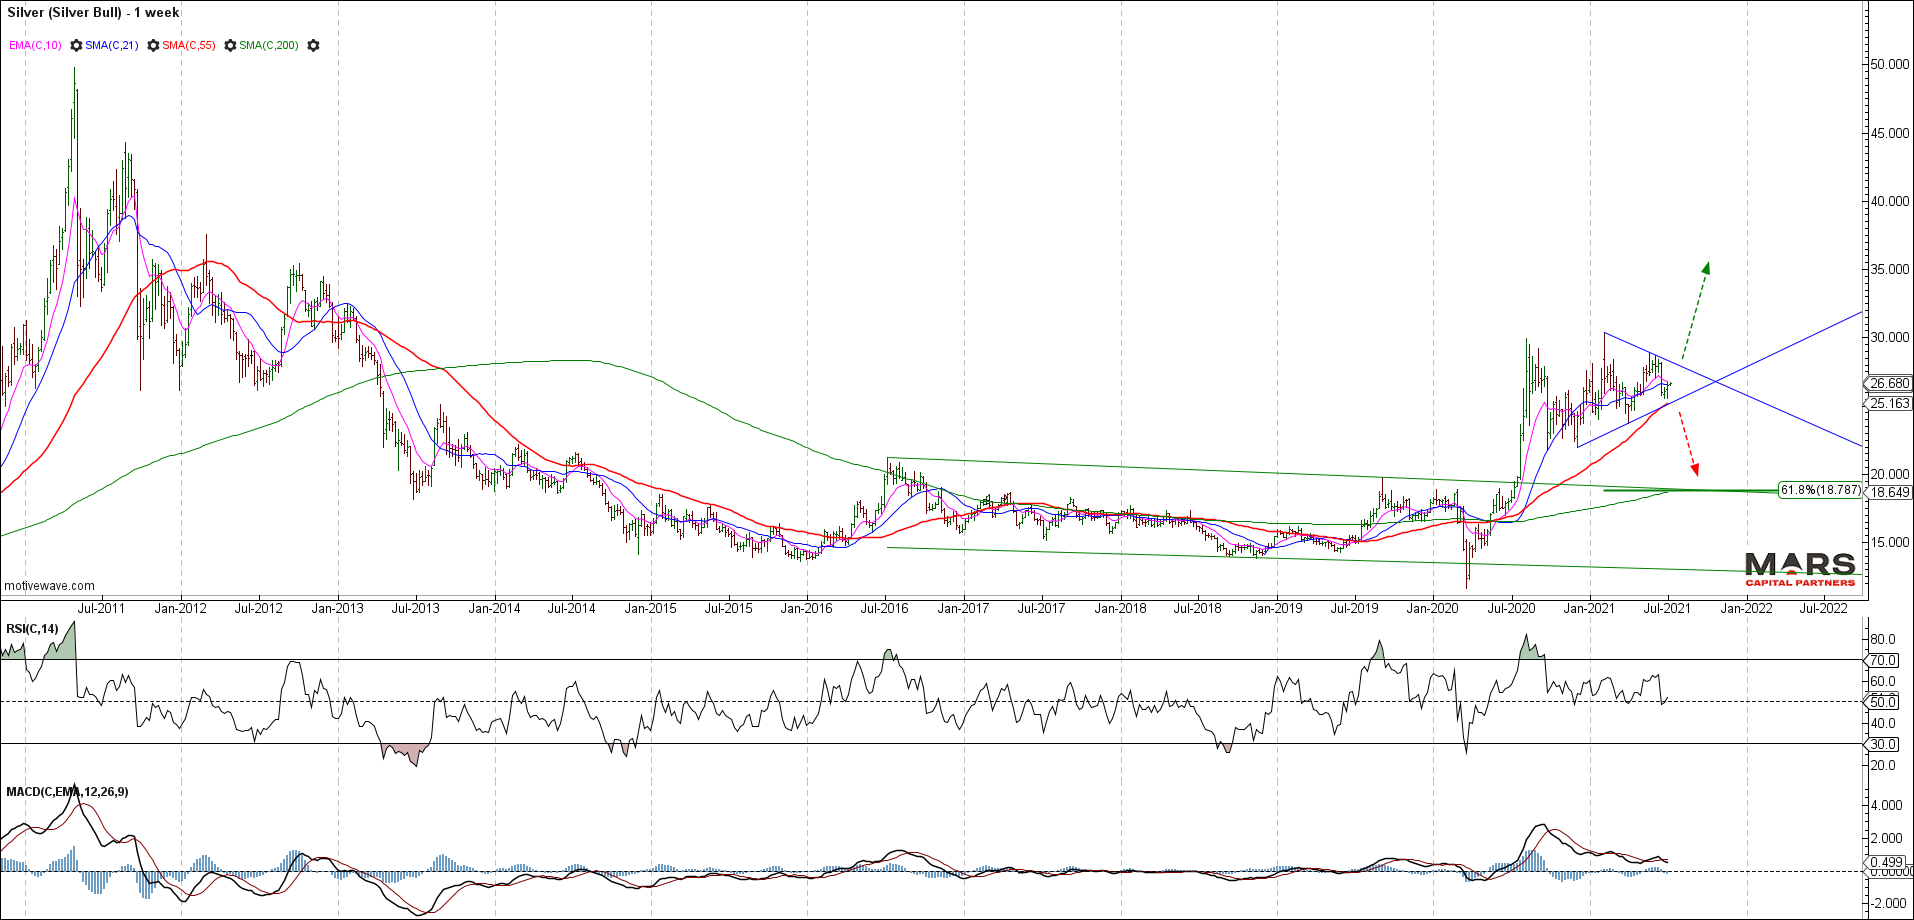
Silver appears to be compressing within a triangle and has been range bound this year. While the structure appears bearish, triangles can thrust in either direction. A break down likely targets support in the 18.80 area for the 200 week sma and 61.8% fib retracement. Each way bet here with no clear near term direction. Bulls need to hold the 50 week sma support near term.
Crypto
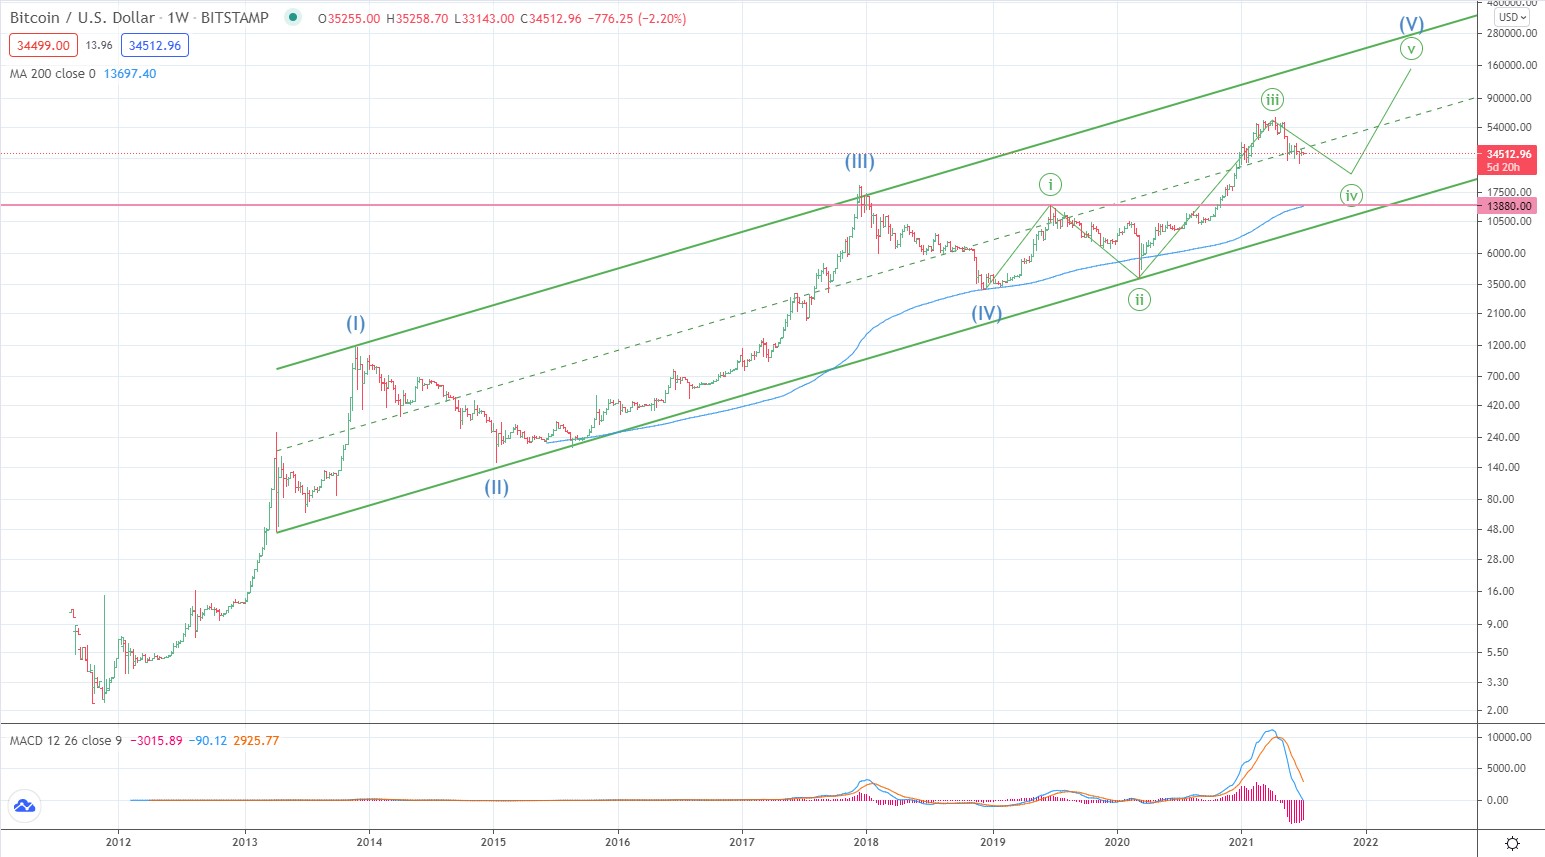
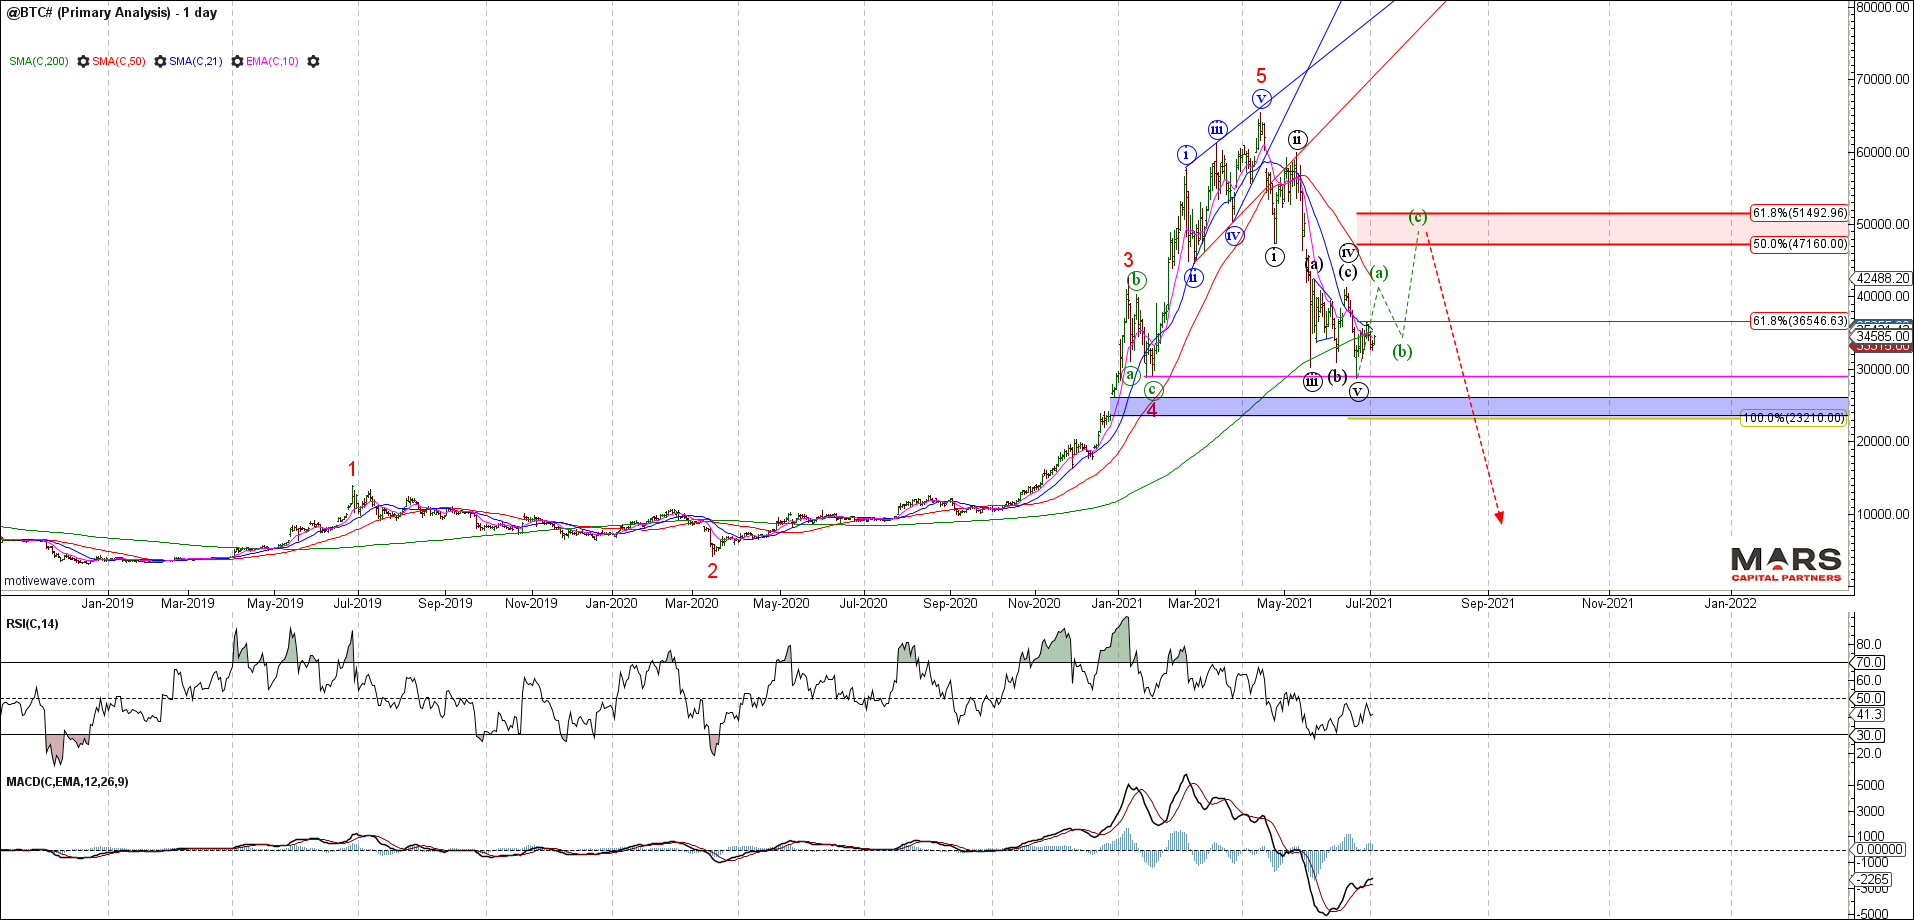
Bitcoin met our wave 3 targets before reversing impulsively for what is likely to be wave (a) of an a-b-c corrective decline for wave (iv). The bear case is that this latest rally was ALL of 5 but will only be confirmed with a decline back below 13880 wave (i) overlap.
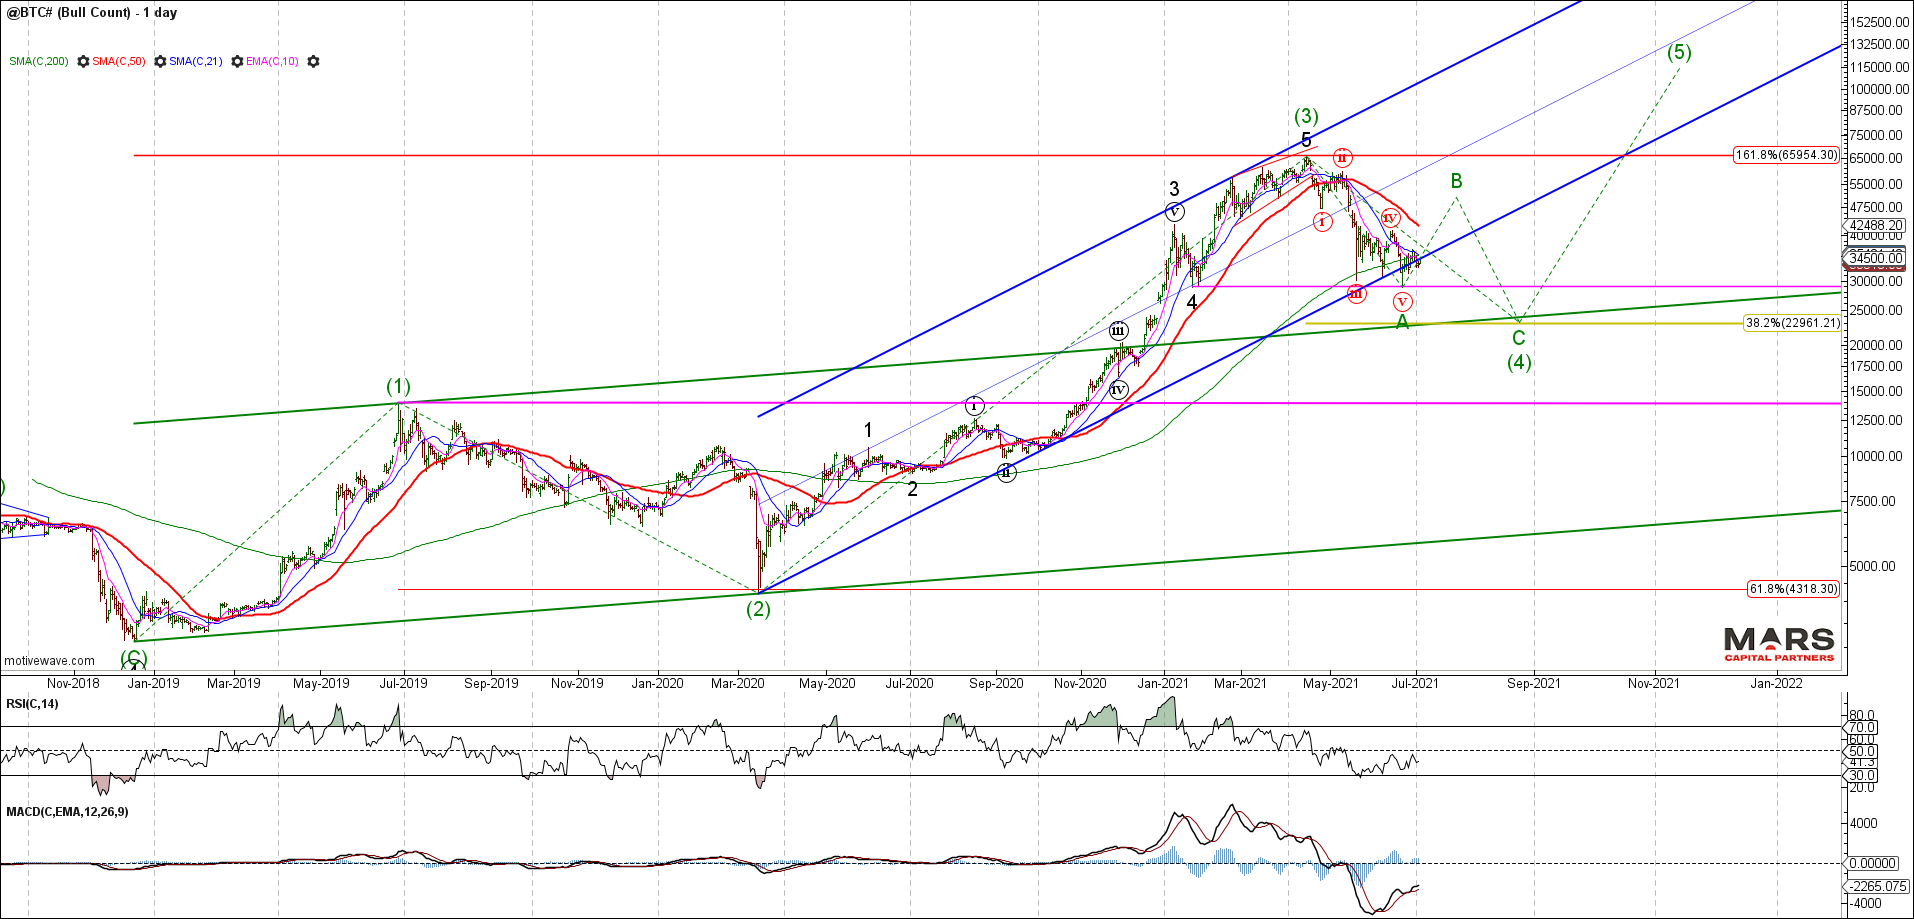
Bitcoin has enough waves in place to complete wave A of an a-b-c wave (4) corrective decline targeting the 23000 support zone. Any immediate decline back below 13880 overlap invalidates the long term bull count.
The Bitcoin bear case is for a completed 5 waves into the April highs followed by an impulsive wave down. Ideally, we see a corrective rally that targets the 47160-51500 fib resistance zone before the next wave down. Either way, we would like to see a strong counter trend rally that clears immediate resistance in the 36550 area. Near term bulls need to hold the wave (v) lows.
Wishing everyone a prosperous 2nd half of the year. Trade safe 🙂
