
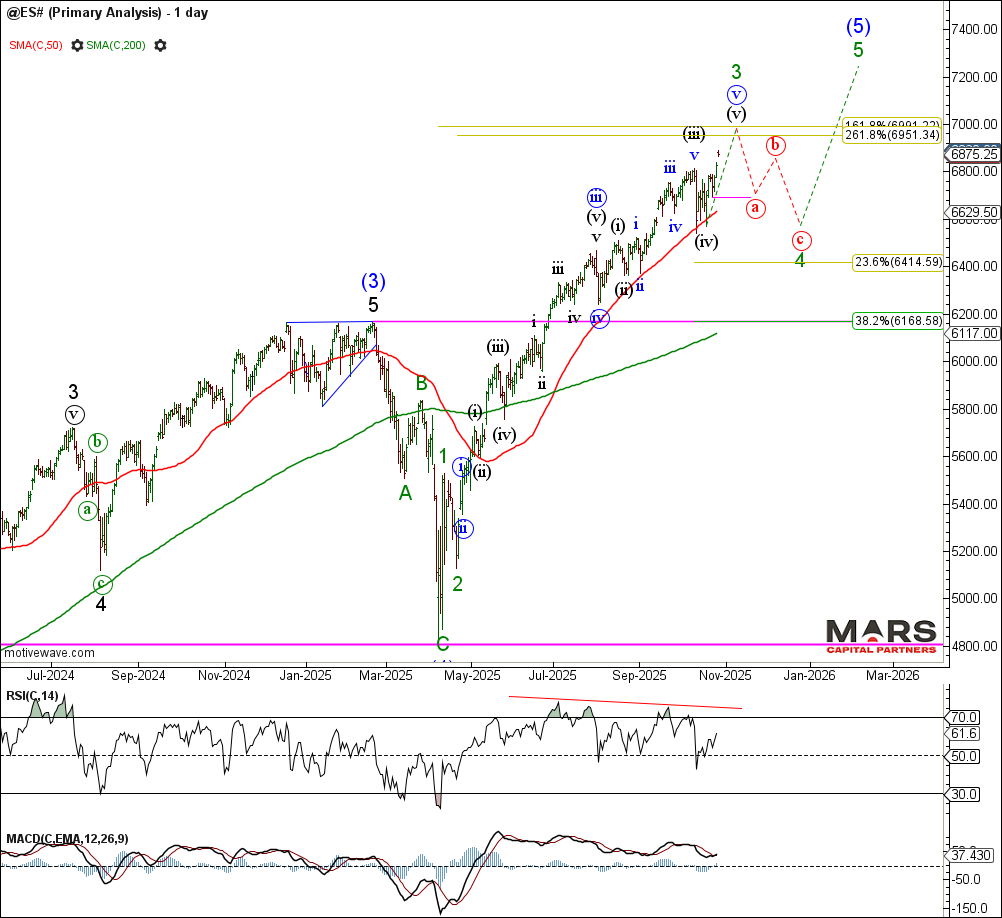
Last week, the equity market melt up continued as the rally extended directly to new ATH’s after holding key trend support at the 50 day sma. The latest rally appears to be a wave (v) of 3 extension as the primary bull trend continues. The big picture rally appears incomplete and would still look best with a wave 4 corrective decline and ending wave 5 of (5) rally into year end. Despite the increasingly bearish momentum divergence, the “everything” rally continues to extend higher with no evidence of trend exhaustion. Note that Bitcoin is warning of a final 5th wave rally and potential big picture topping pattern – caveat emptor.
The bond markets pushed marginally higher but remain range bound within a big picture triangle consolidation. We remain neutral bonds. The US$ / DXY continues to trade sideways within a near term consolidation but would still look best with a final push to marginal new lows. PM’s reversed sharply lower but need to see downside follow through this week to help confirm a bearish change in trend. Crude Oil declined for a hard test of key support before rallying strongly for a potential bull reversal.
Equity Markets – Wave 3 extension
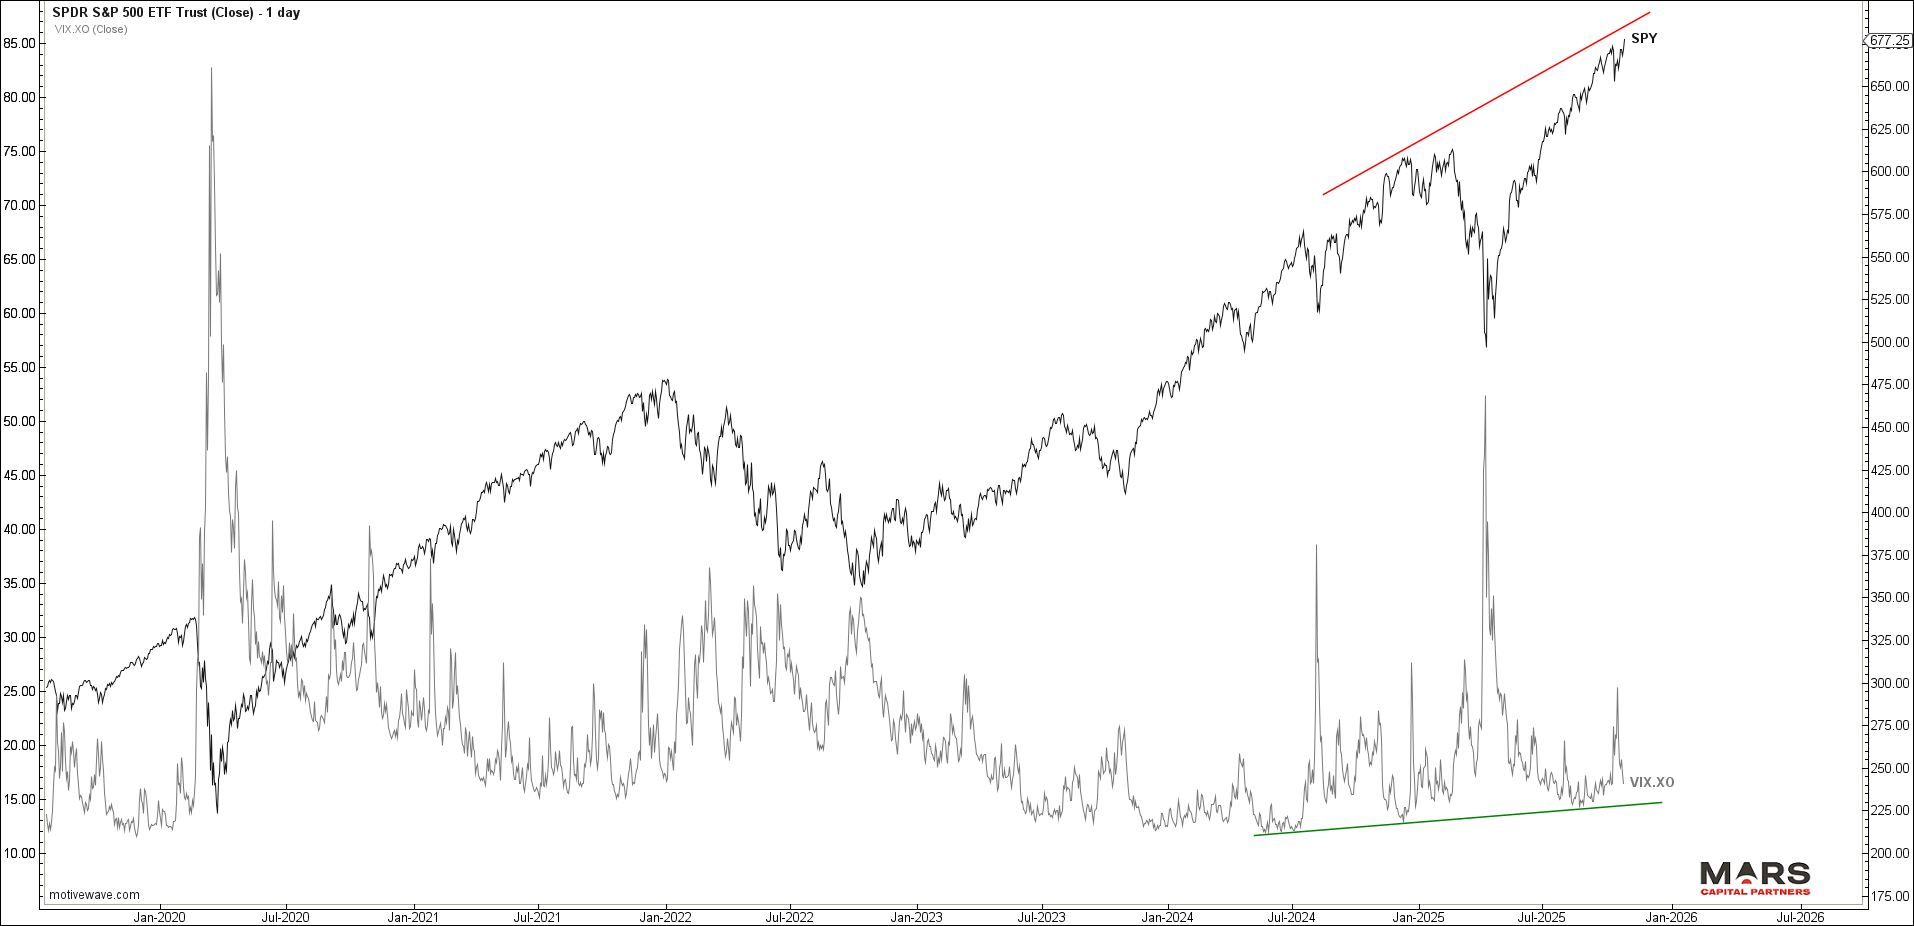
Last week, the benchmark S&P500 rebounded strongly from key trend support at the 50 day sma to push to new ATH’s. The primary bull market trend continues to extend in wave 3 while supported by the 50 day sma. The big picture structure would still look best with a wave 4 corrective retracement followed by a final wave 5 of (5) rally into year end. Note the bearish momentum divergence increasing at each consecutive new high (warnings abound).
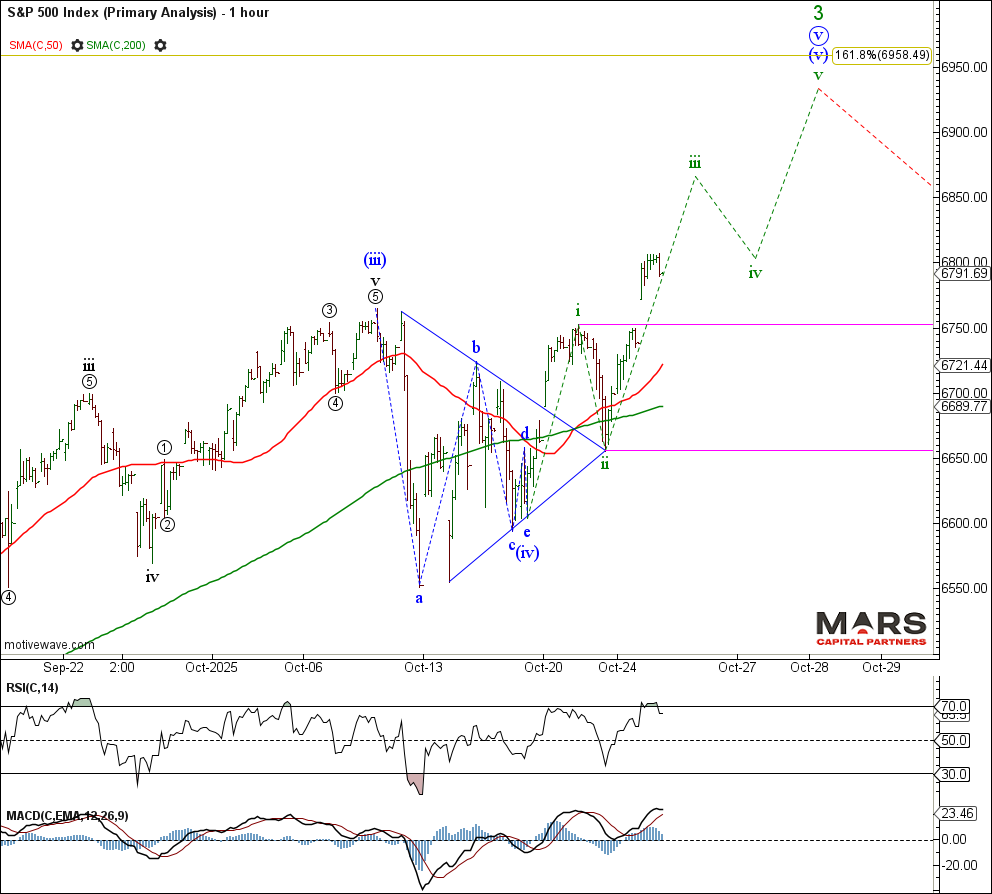
The near term S&P500 cash rally counts best as a small degree wave iii of (v) triangle thrust while above the 6752 overlap. Triangle thrusts are usually ending waves… trade back below 6655 would warn of a larger decline.
The Nasdaq also broke to new ATH’s after holding near term 50 day sma trend support. The rally still counts best as a wave (v) of 3 extension with the primary bull market trend intact. The structure would still look best with a wave 4 corrective decline followed by a wave 5 of (5) rally into year end. The 50 day sma remains key trend support for this rally. There is no evidence of a tradable top as this bullish momentum extends.

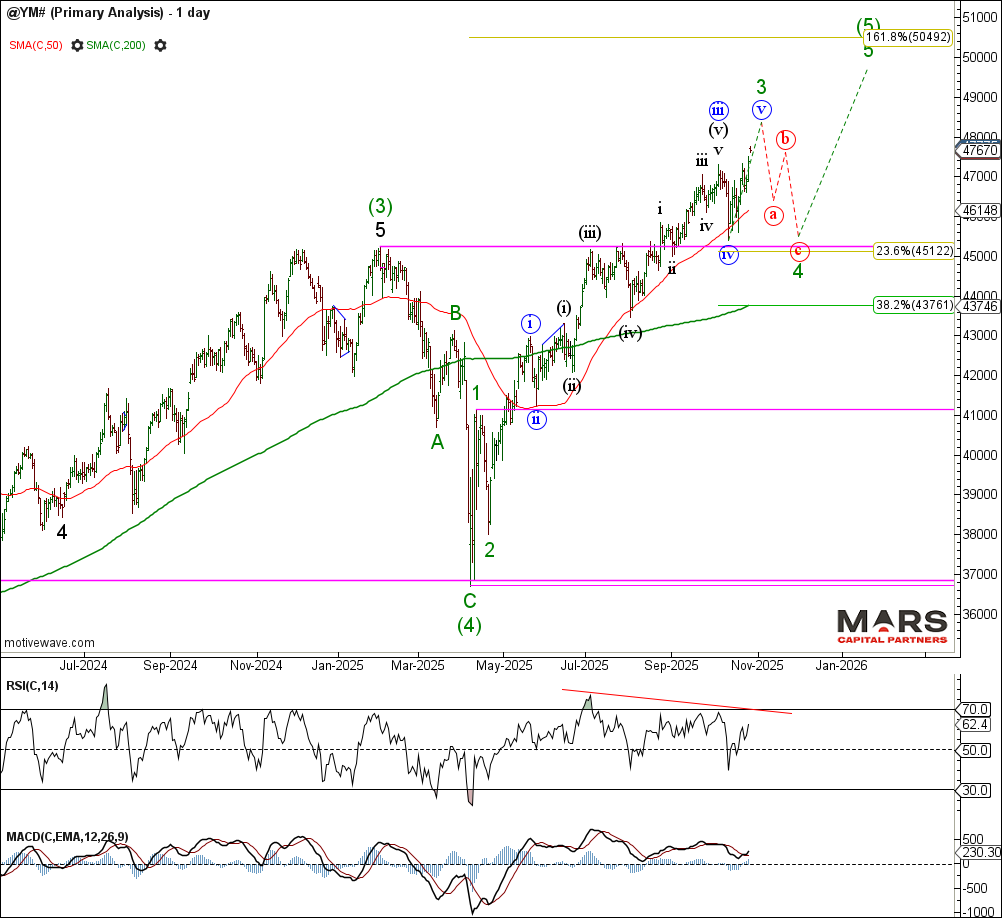
The DJIA also pushed to new ATH’s as wave (v) of 3 continued to subdivide higher. The lack of downside follow through warns that the bullish momentum remains intact. Despite the bearish momentum divergence building on the daily chart, there is no evidence of a tradable top as the wave 3 of (5) rally extends.
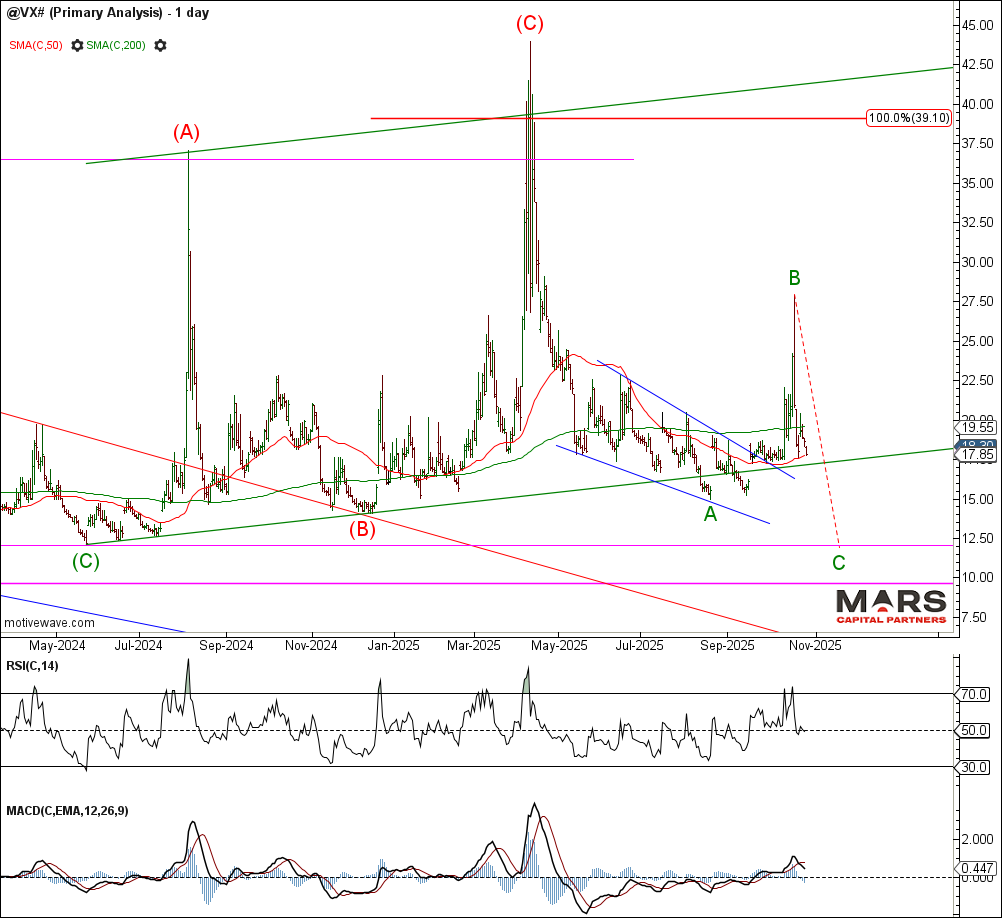
The VIX / VX continued to extend lower in line with equity market strength. Key support remains lower towards the 10-12 area but we should be aware of the higher VIX lows despite new ATH’s in equity markets (inter-market divergence). The VIX remains within a bigger picture compression and continues to diverge with equity market highs – mind the gap.
Bond Markets – Testing resistance
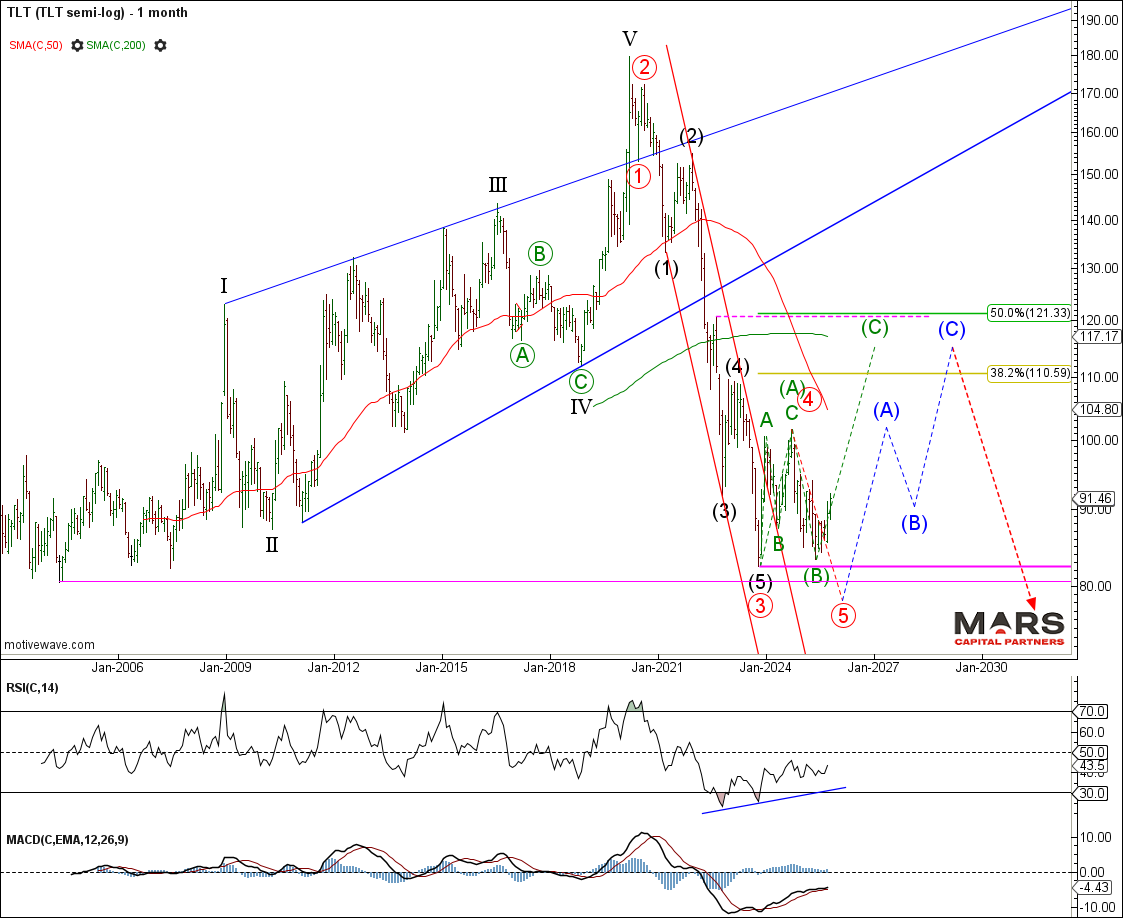
To the bond markets and the TLT continues to hold big picture support without confirmation of a bullish change in trend. It remains unclear whether green wave (B) was the low or if the structure requires a final push to new lows in red wave (5)? If in doubt, stay out until we have confirmation of a tradable low and bullish reversal.
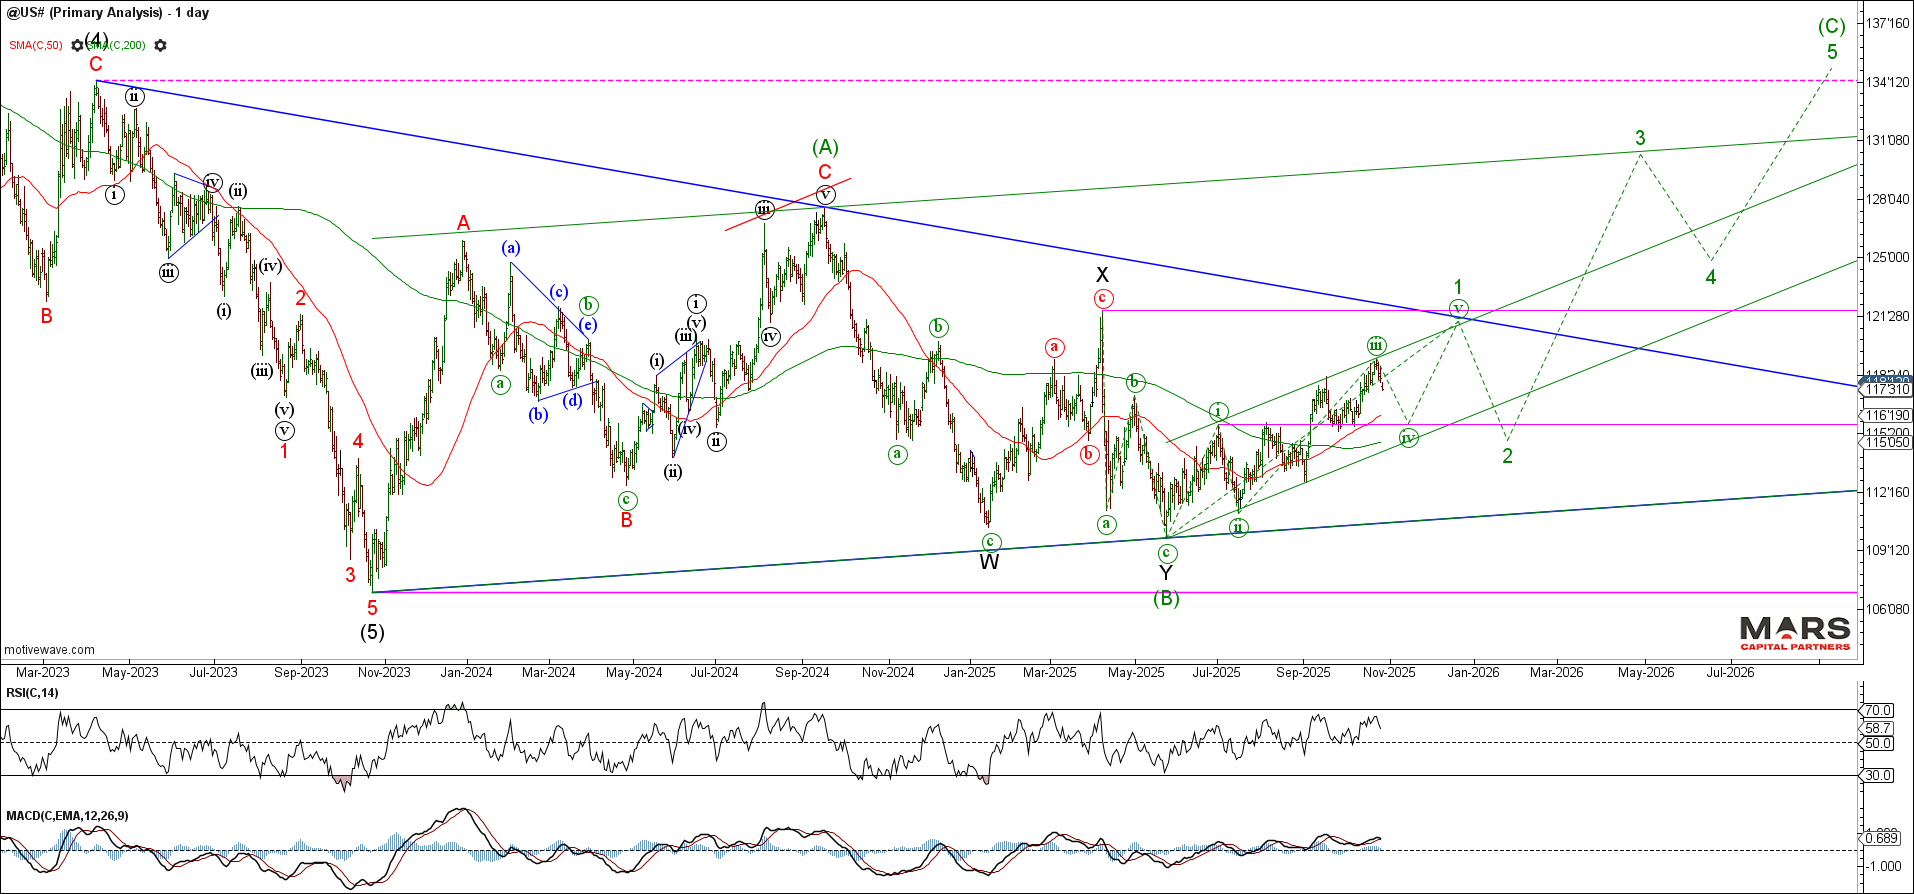
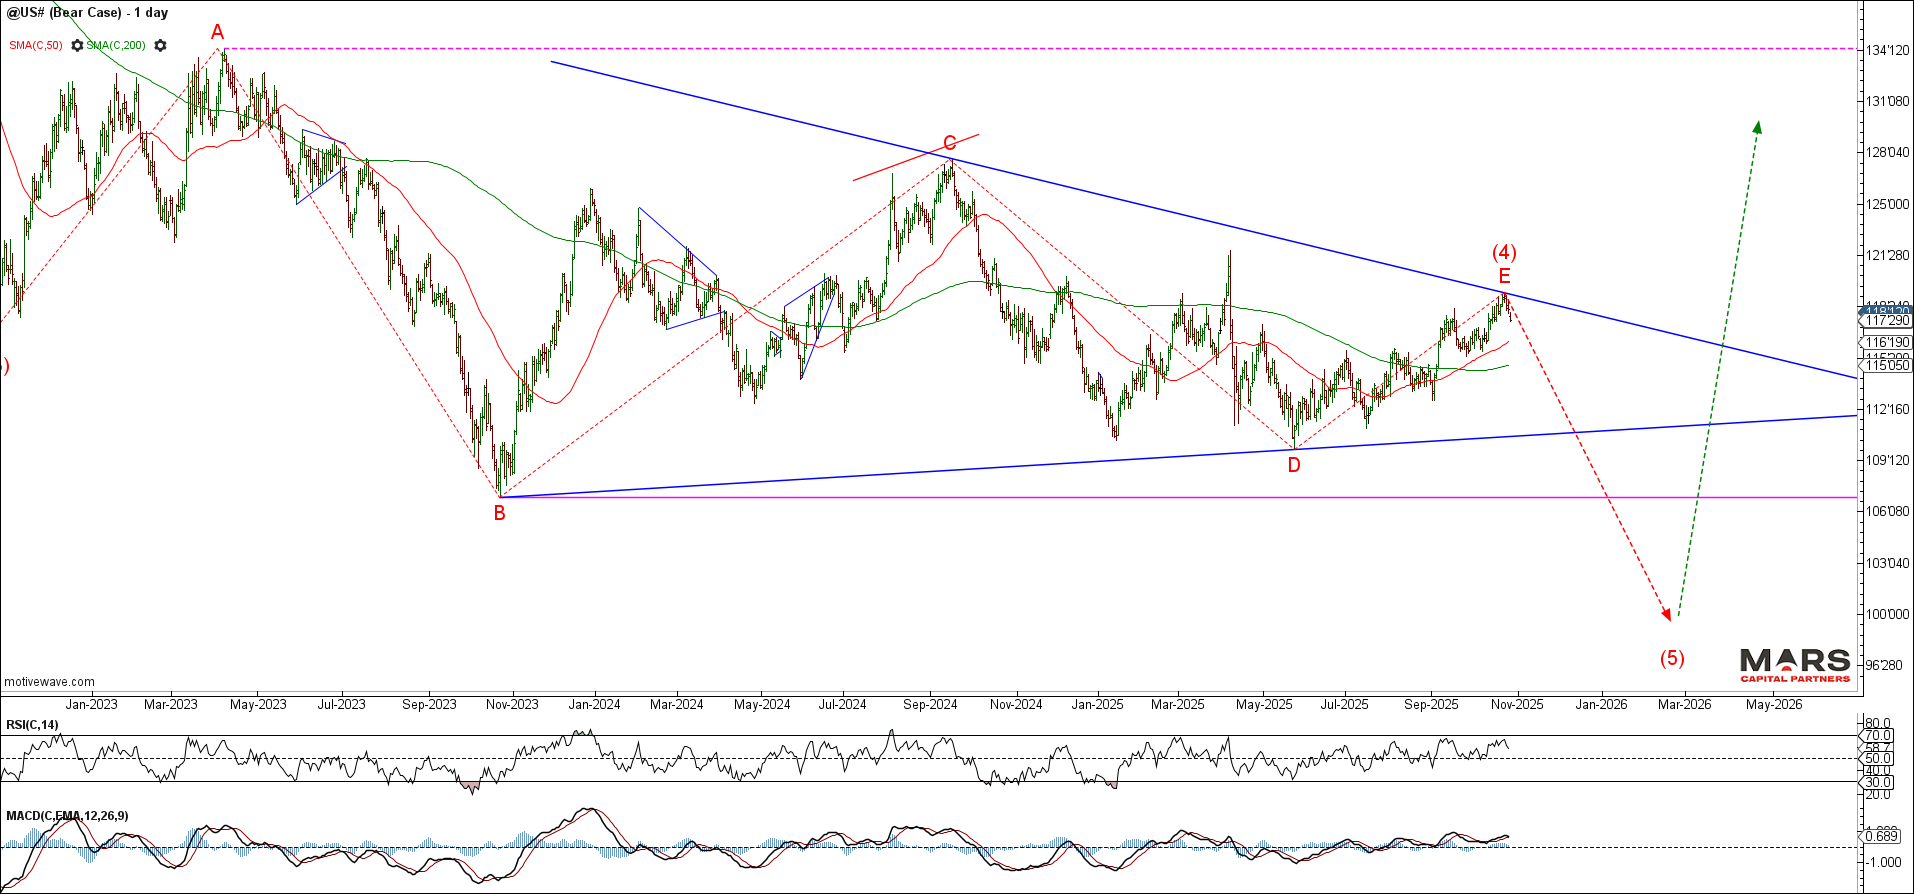
The US30yr / ZB remains range bound as it tests the top end of the triangle consolidation. The question is whether this is a bullish or bearish triangle with two-way risks? Bulls need to break overhead resistance in the 122’00 area to help confirm more bullish potential in green wave (C) higher. The Bear Case is a large degree wave (4) triangle that has enough waves in place to trigger a wave (5) decline to major new lows (red case).
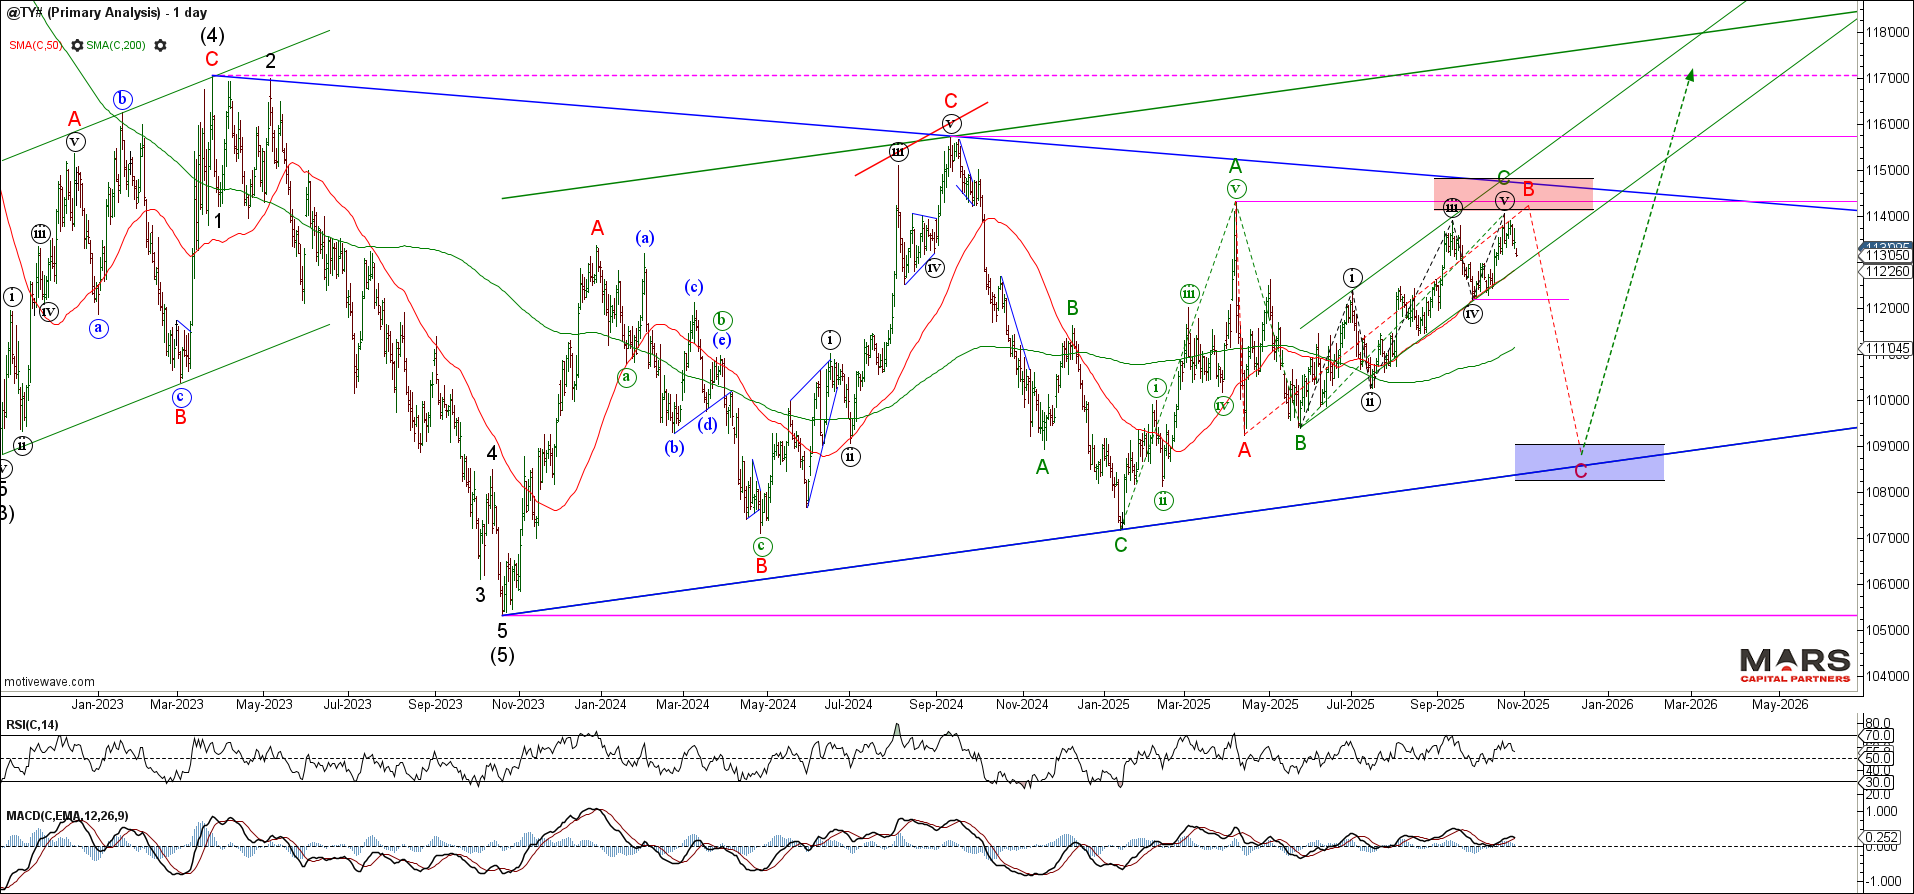
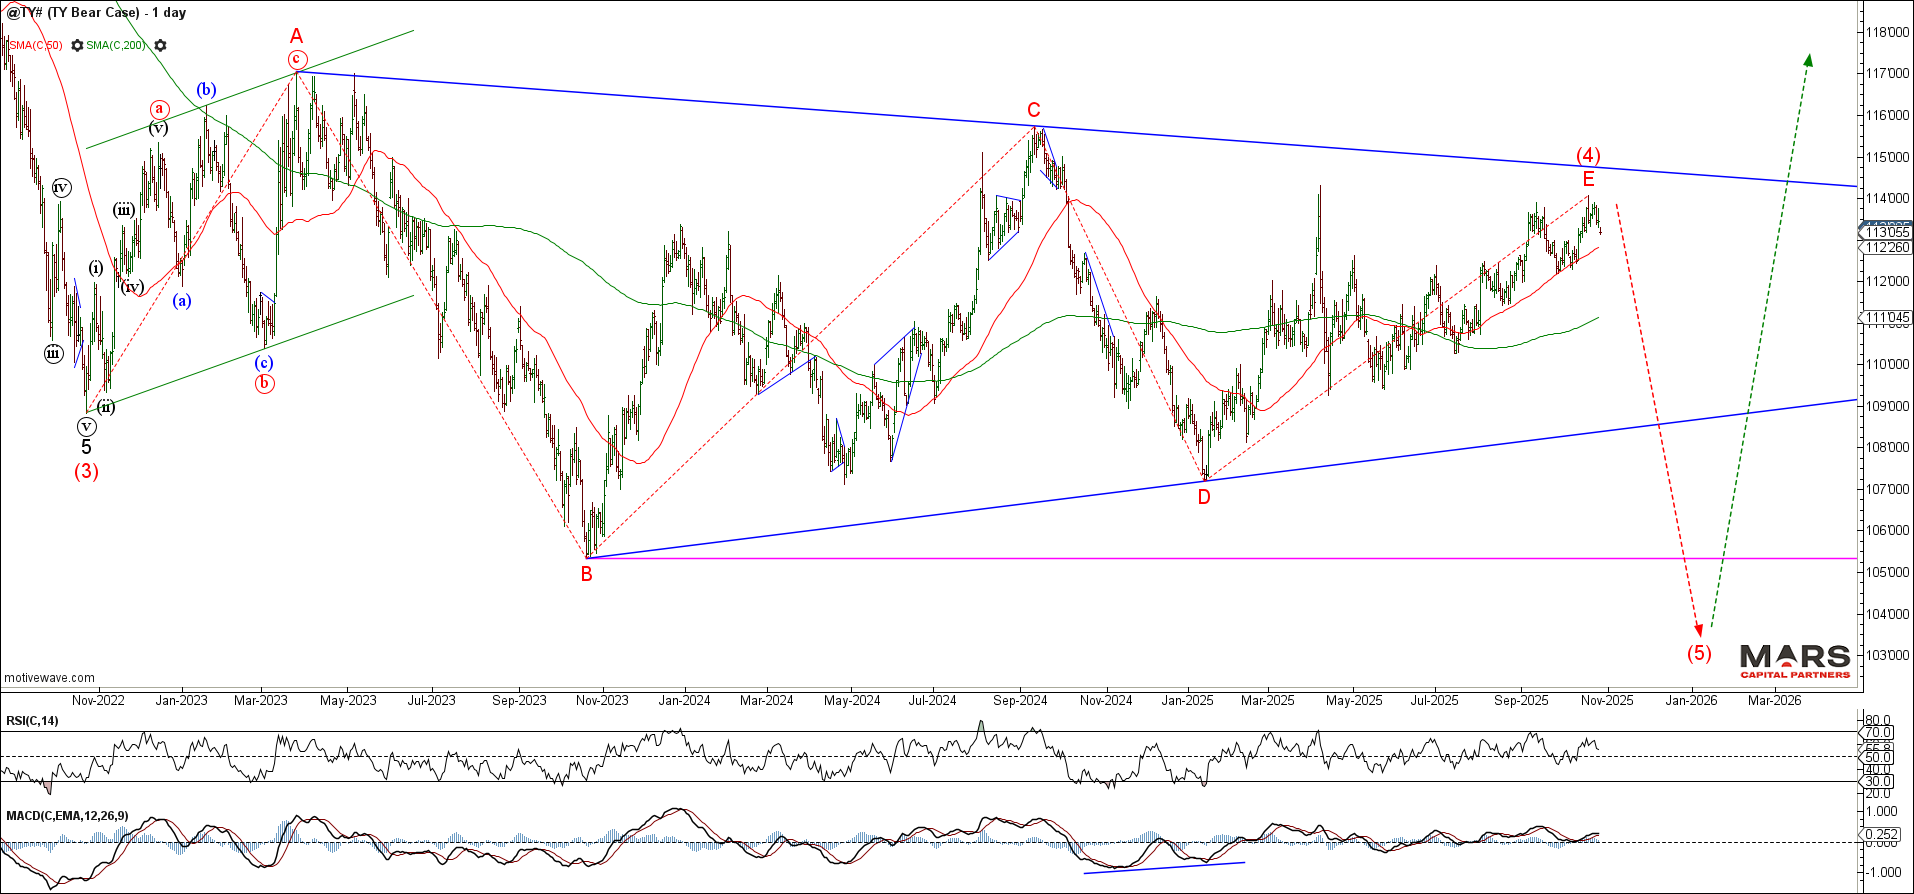
The US10yr / TY is attempting to reverse lower from layered resistance in the 114-115 area. On going sideways consolidation and bullish base or bear triangle? Bears need to see downside follow through and impulsive decline that breaks near term 112 support to open the door to a wave C or (5) decline (Bear Case). Trade above the 115’24 swing highs invalidates the bear triangle and opens the door to a larger ongoing rally.
FX Markets – DXY unconfirmed low
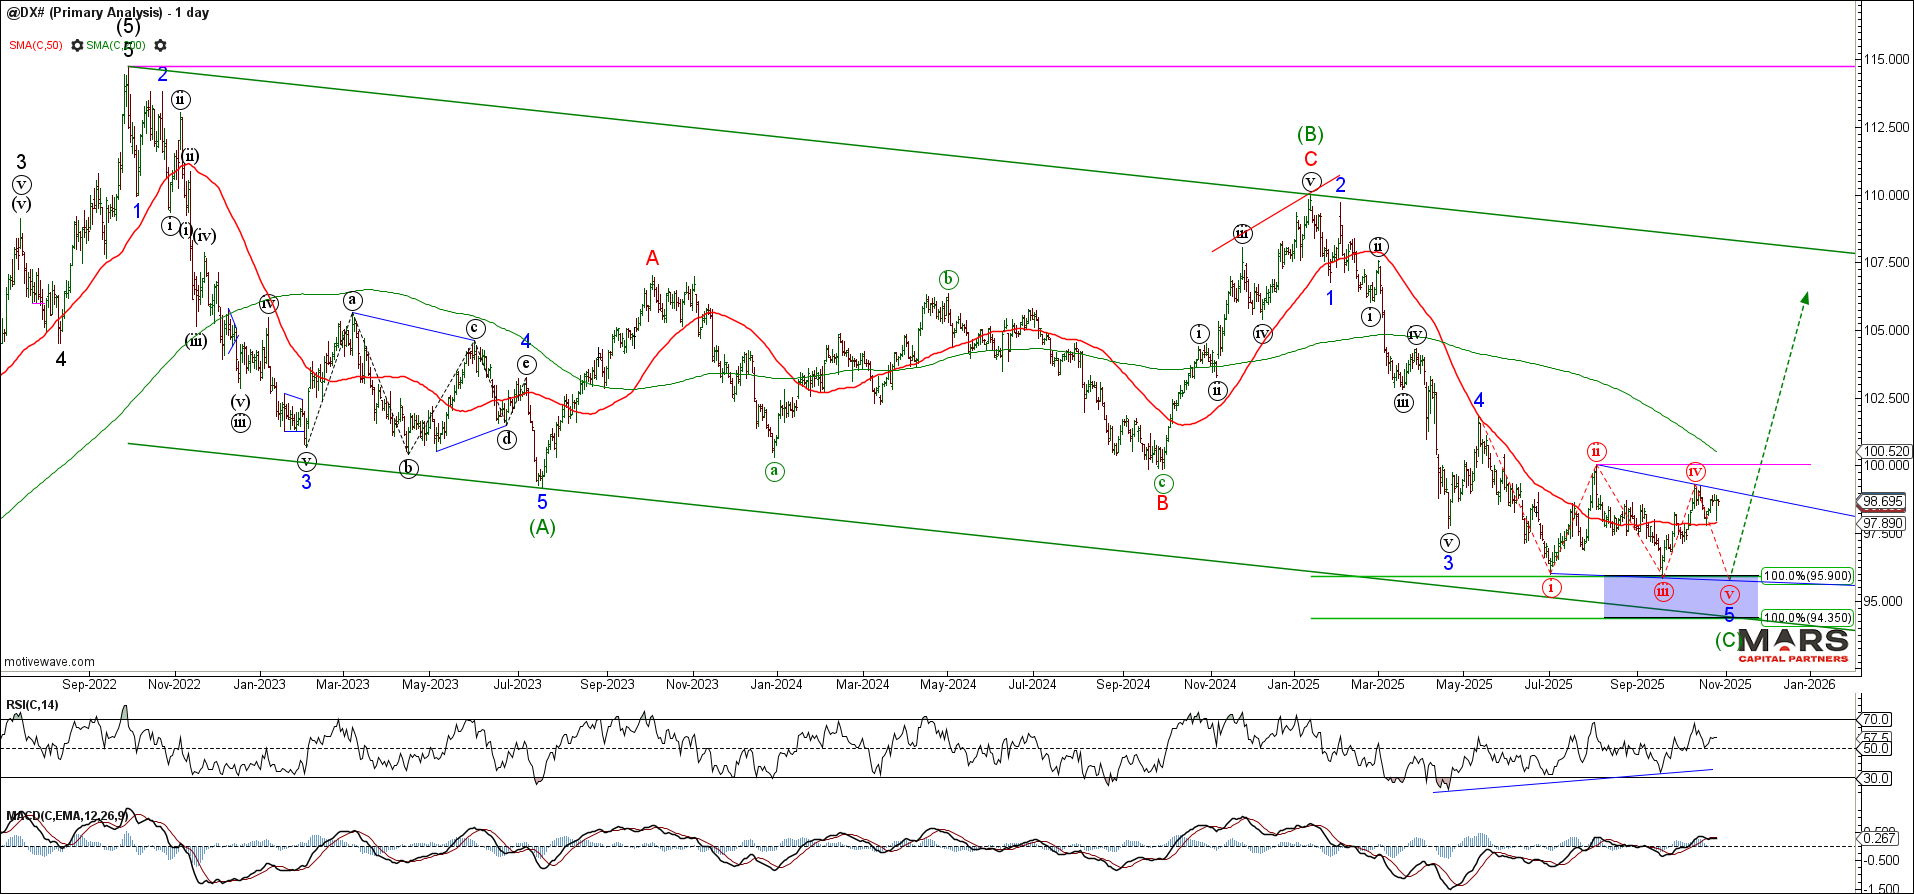
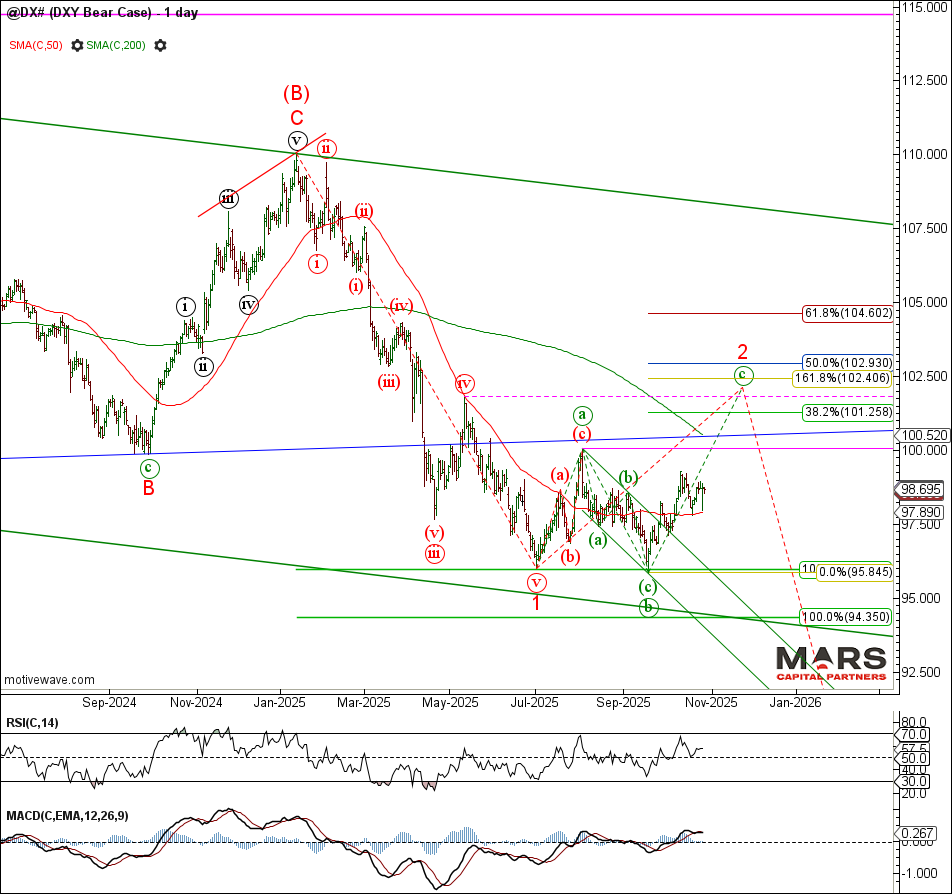
To the FX markets and the DXY continues to trade sideways as we look for confirmation of a tradable low. Given the corrective nature of the rally near term, it would still look best with a final 5th wave decline into key support in the 95-96 area. Trade back above 100.00 resistance would invalidate the near term red count and open the door to a more complex corrective rally.
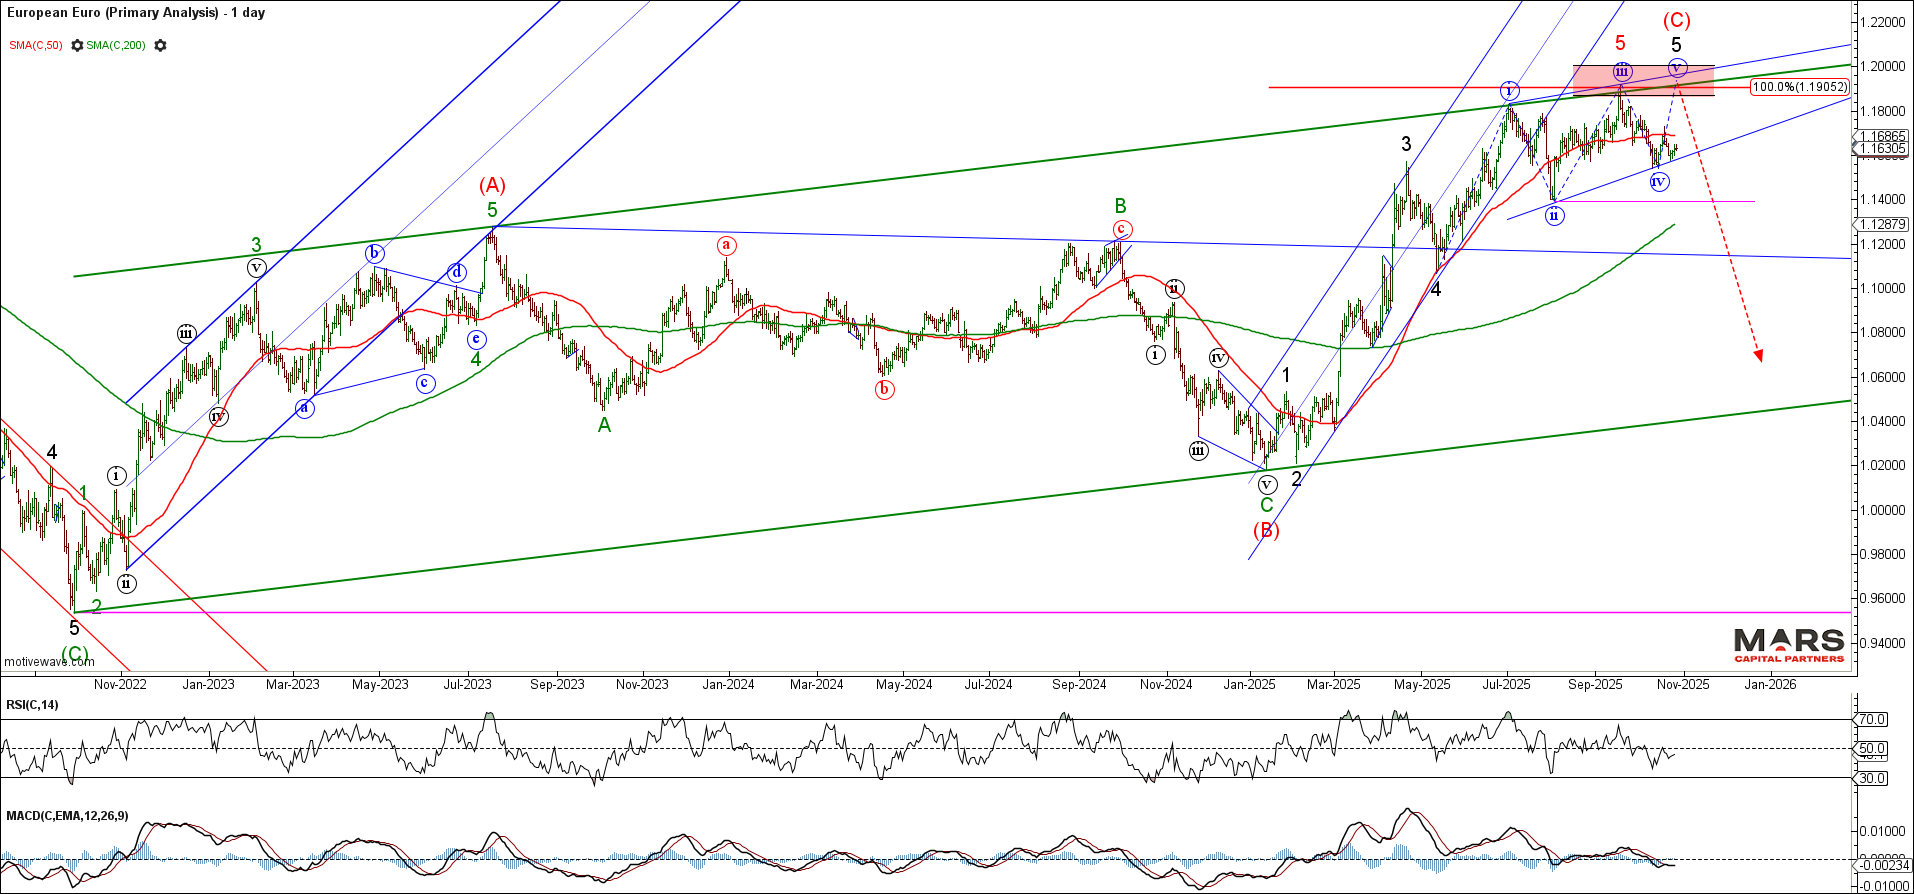
The Euro continues to hold near term trend support but is threatening roll over. It remains unclear whether the Euro has topped or would look best with a wave (v) of 5 to marginal new highs. We continue to see this as a topping pattern with downside risks. Bears need to see an impulsive 5 wave decline that breaks 1.14 support to help confirm a bearish change in trend. The 1.19-1.20 area remains a key resistance zone for bears.
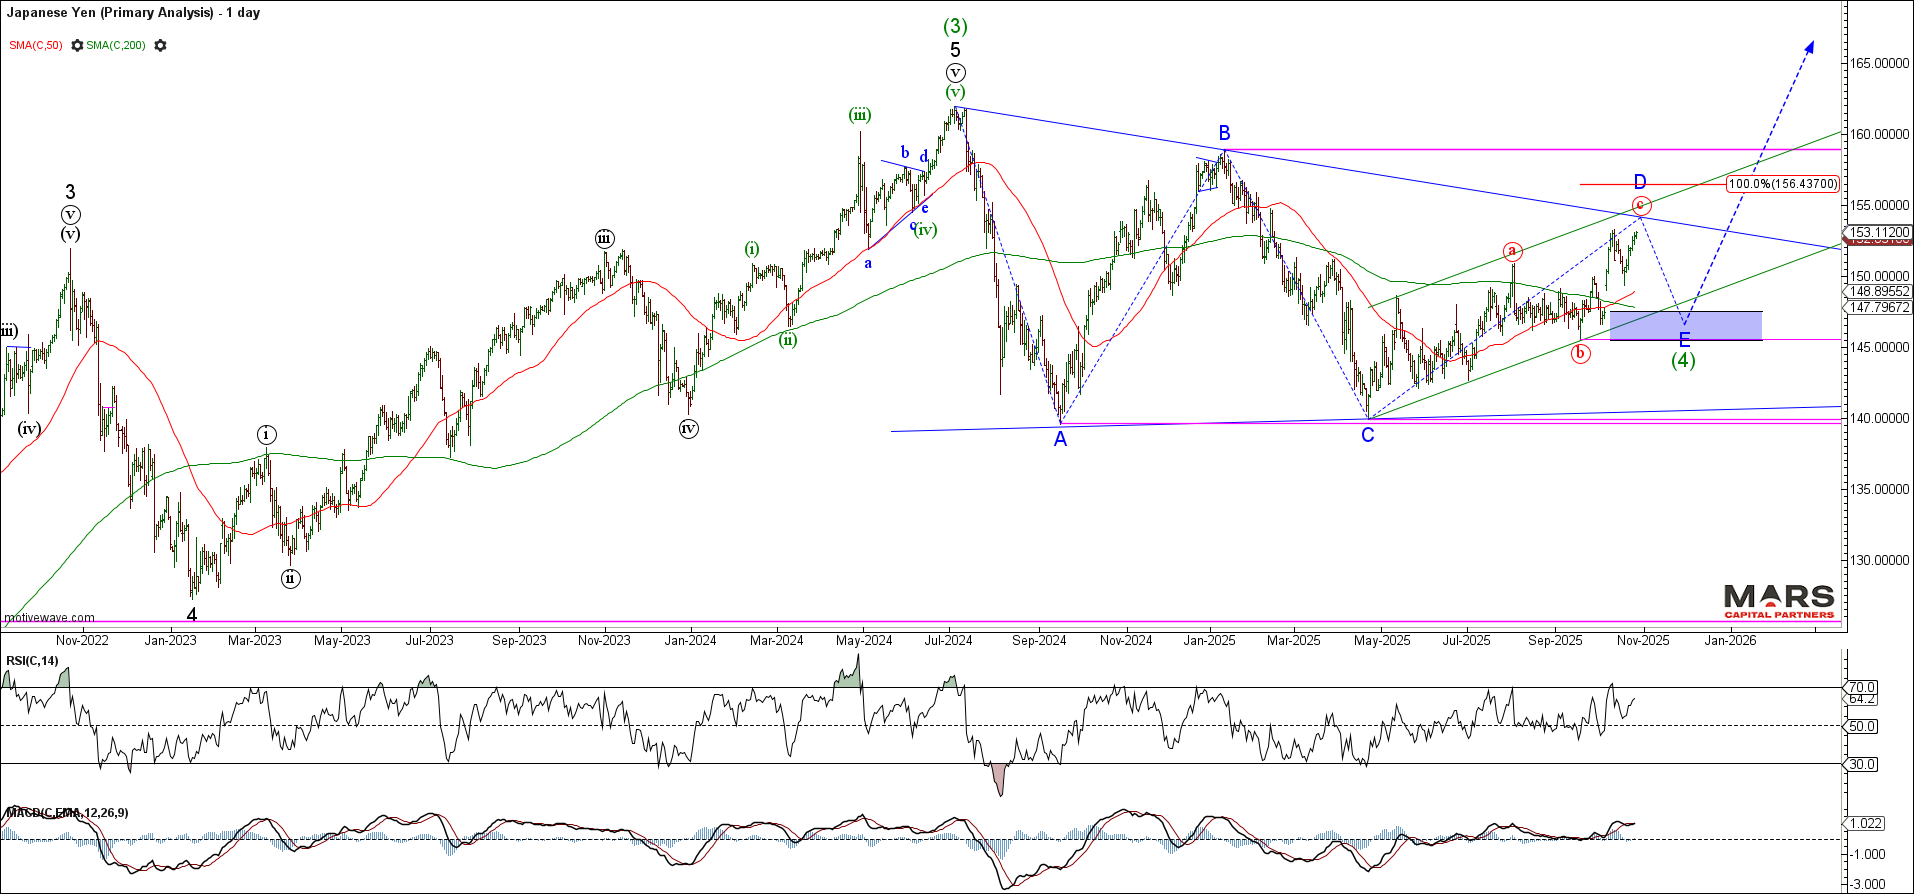
The USDJPY continues to push higher to test trend resistance within what appears to be a large wave (4) bullish triangle consolidation. Ideally, we’d like to see a corrective decline towards support in the 146-147 area to help complete wave E of the triangle before the bull market reassirts itself. The bullish triangle is invalidated on a break of 140 support.
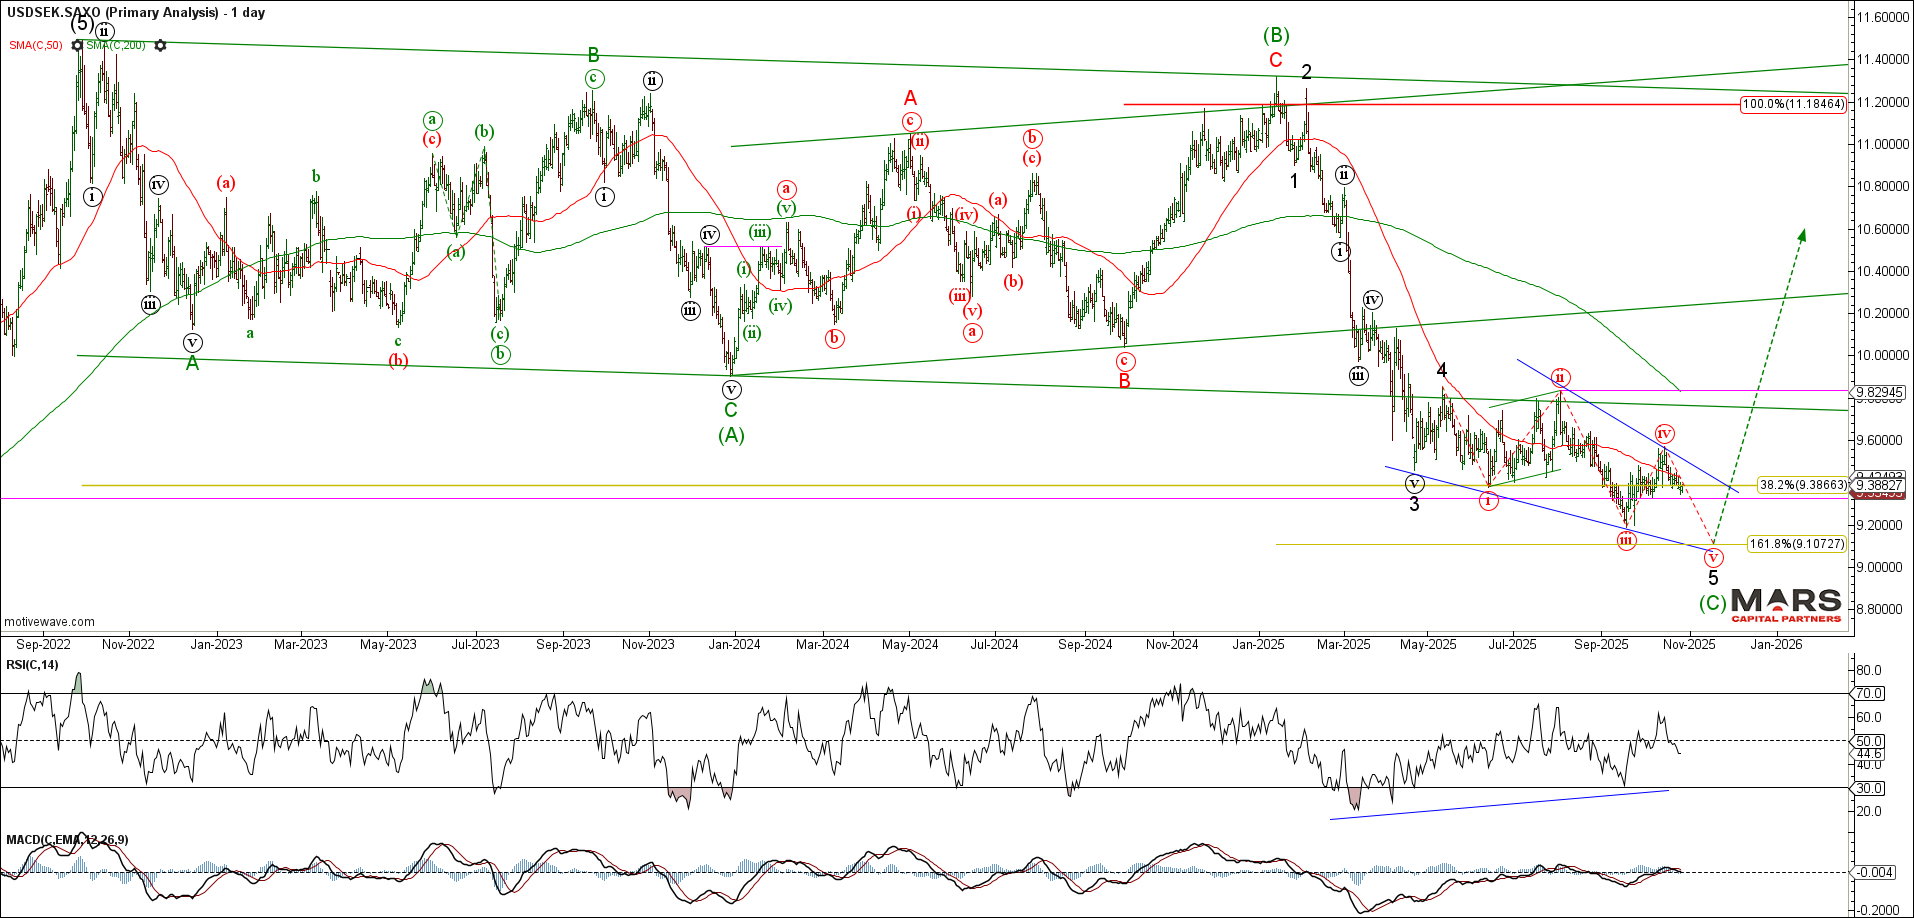
We continue to track the USDSEK closely but do NOT have confirmation of a tradable low. The structure would still look best with a final wave (v) of 5 decline to marginal new lows to help complete the decline (wedging into the lows). Bulls need to see an impulsive 5 wave rally to help confirm a bullish change in trend.
Commodity Markets – Crude holds support
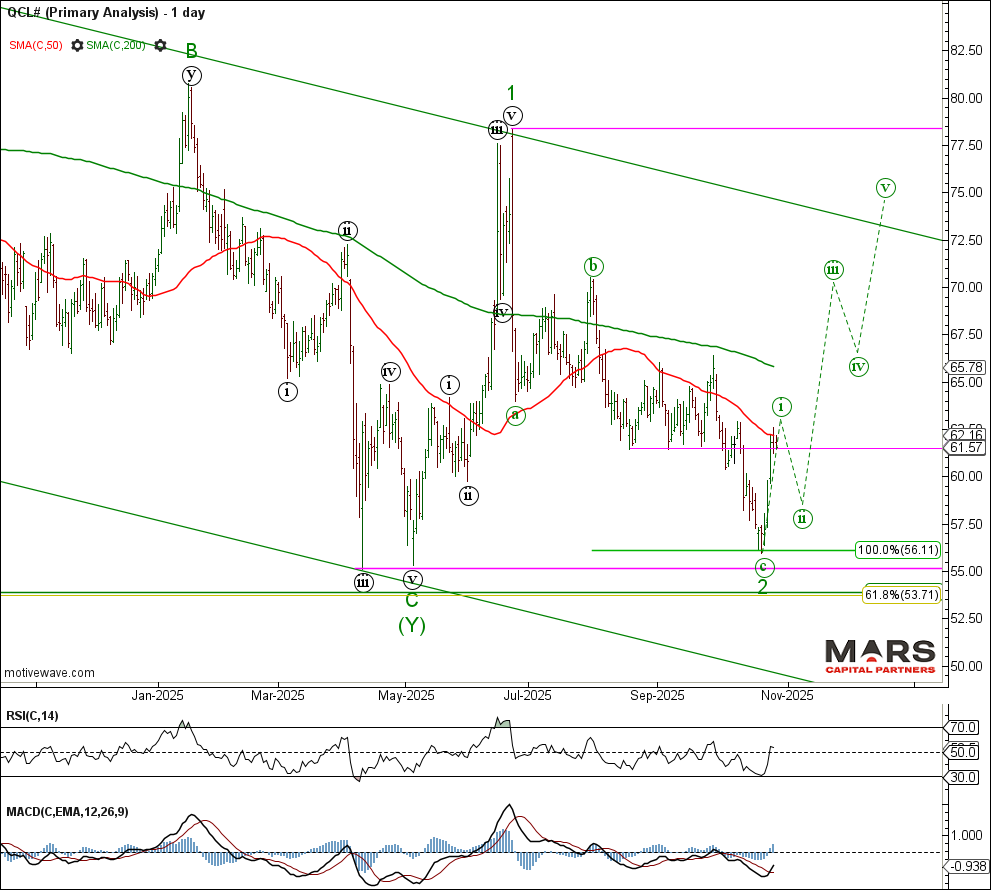
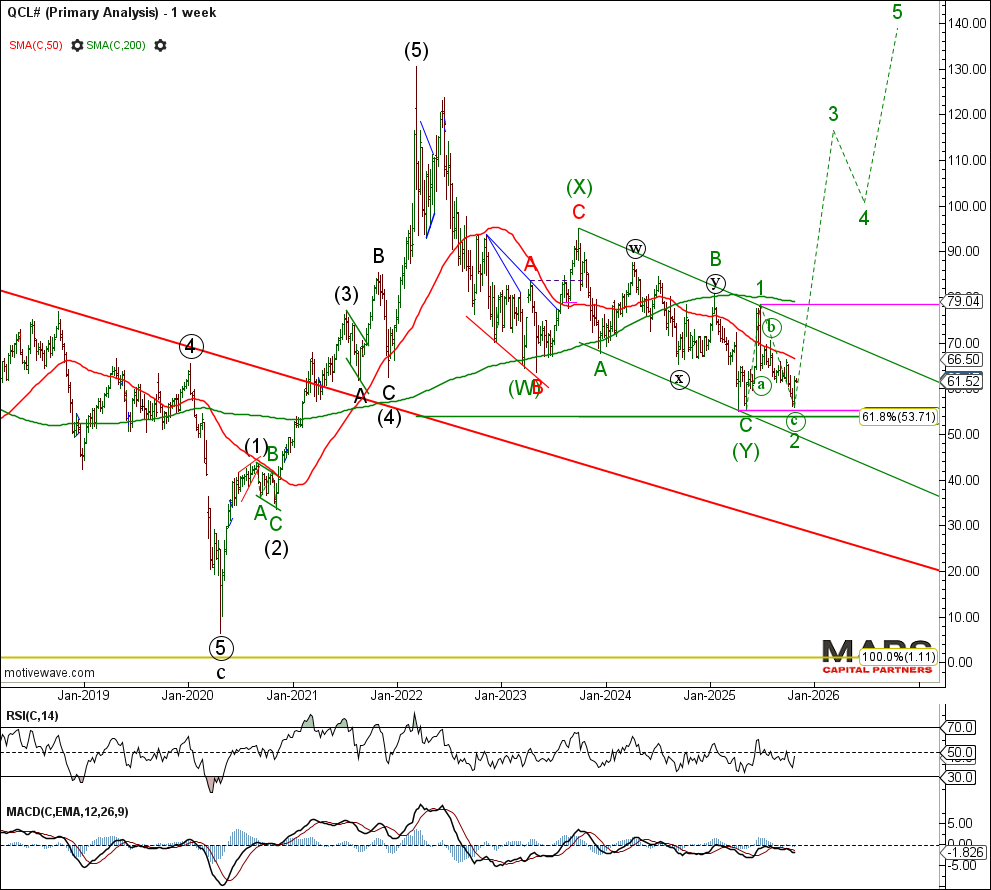
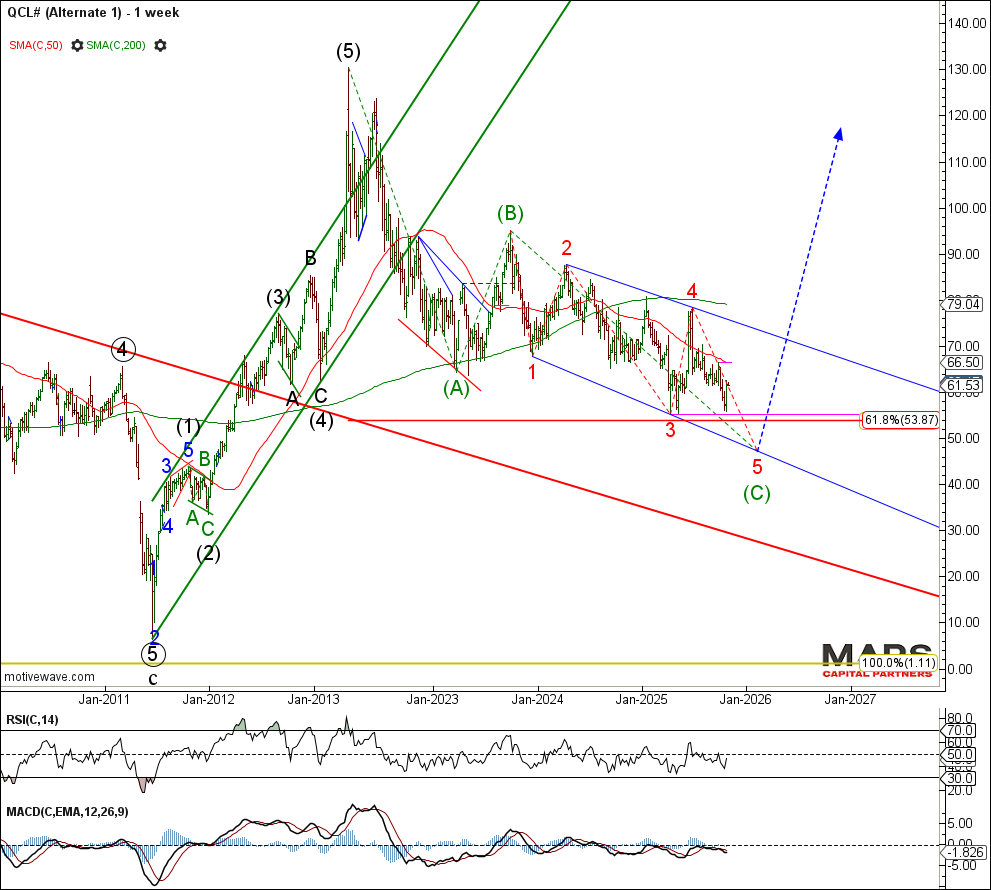
To the commodity markets and CL rallied strongly after a hard test of key support in the 55 area (as warned) for a weekly bull reversal. Bulls need to see upside follow through and extend this rally into 5 waves up to help confirm a bigger picture bullish change in trend. A break of last week’s lows opens the door to a red wave 5 of (C) extension lower (Alternate count). Bullish while these lows hold.
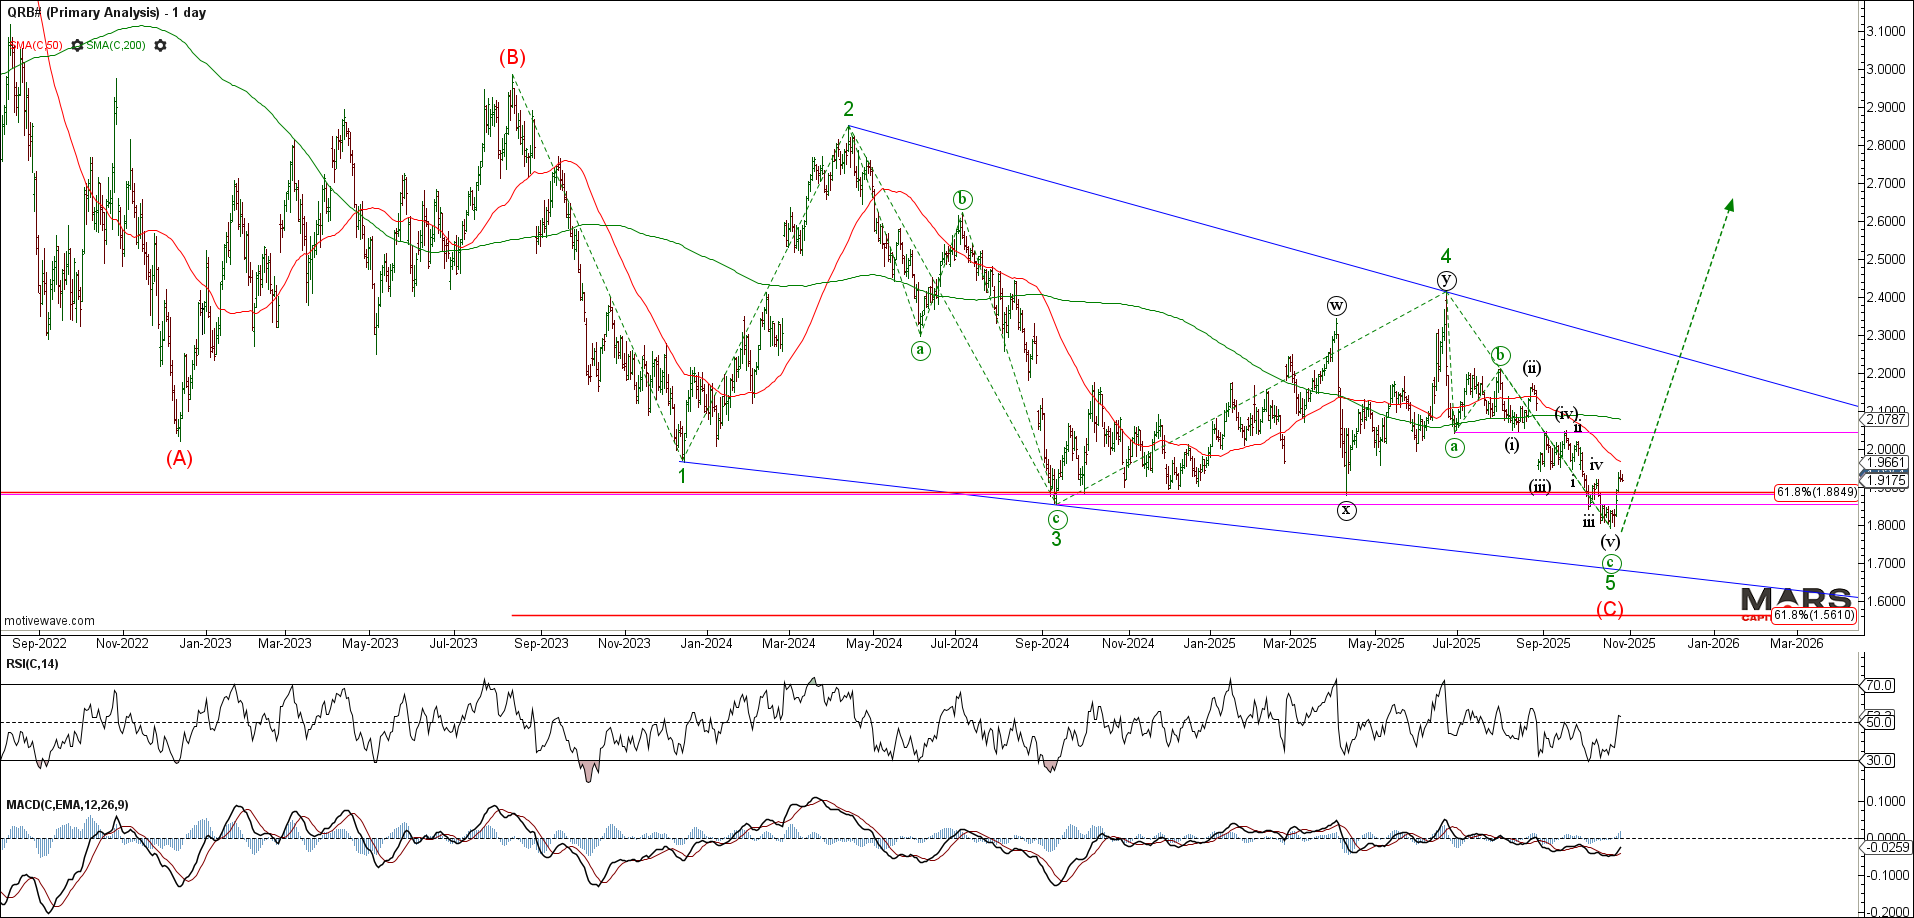
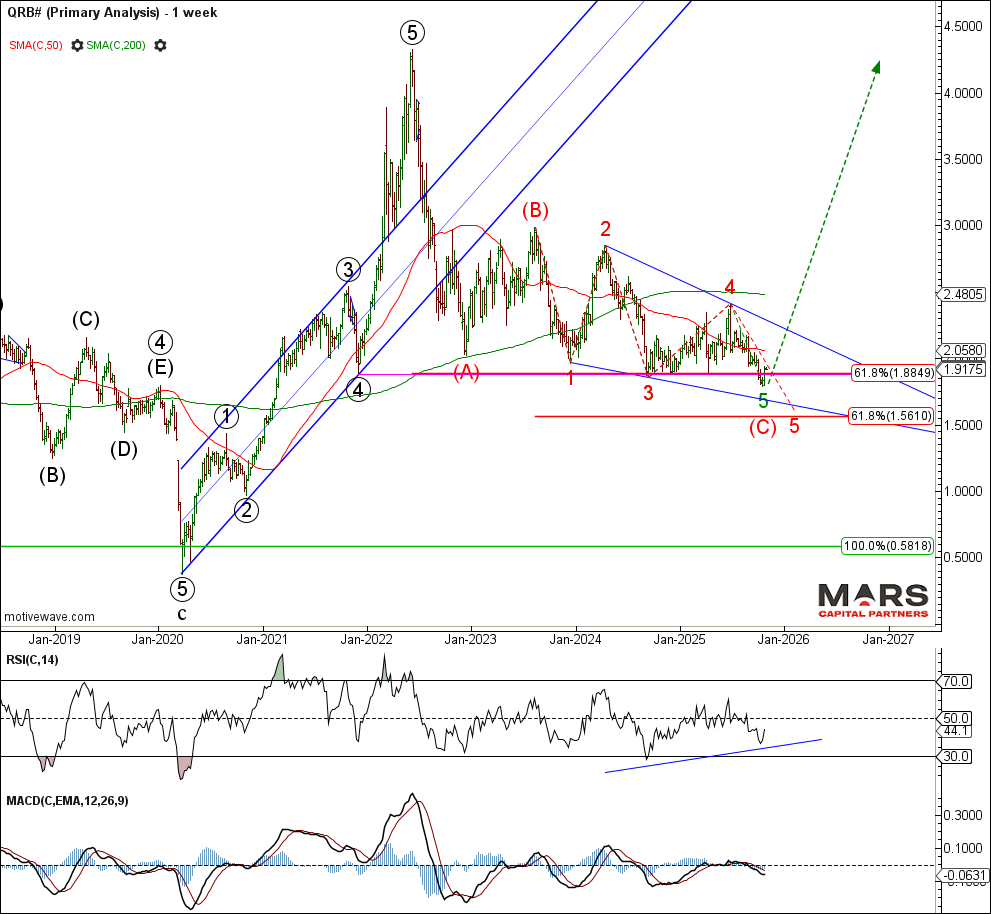
RBOB reversed sharply higher last week to potentially hammer out a wave 5 of (C) low (as warned). Bulls need to see upside follow through this week and an impulsive 5 wave rally that clears overlap resistance in the 2.043 area to help confirm a big picture change in trend. The risk is a continued stair step decline towards the 1.60-1.70 area.
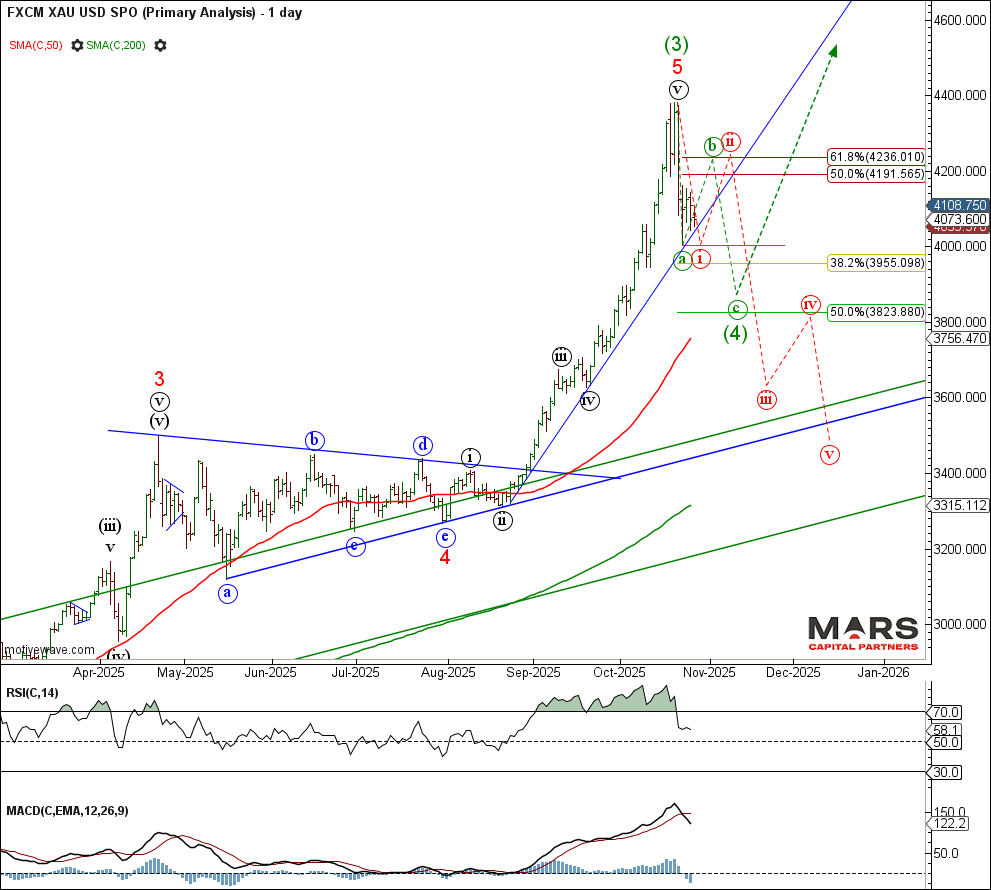
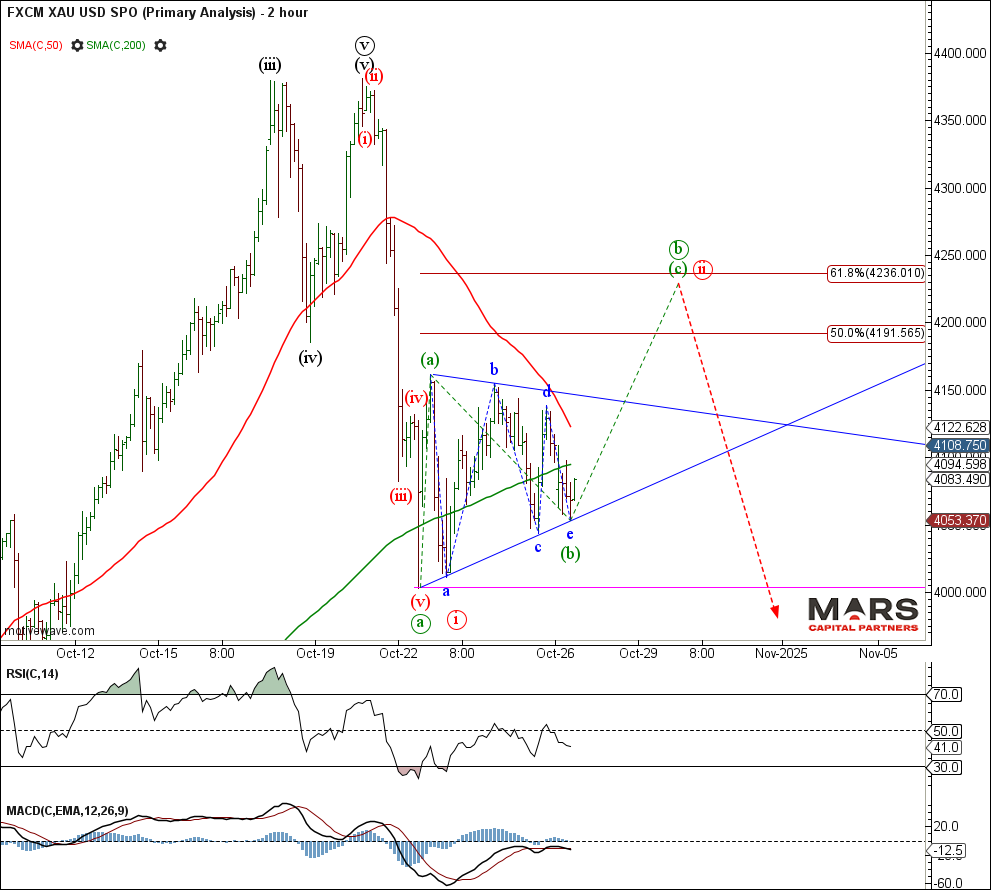
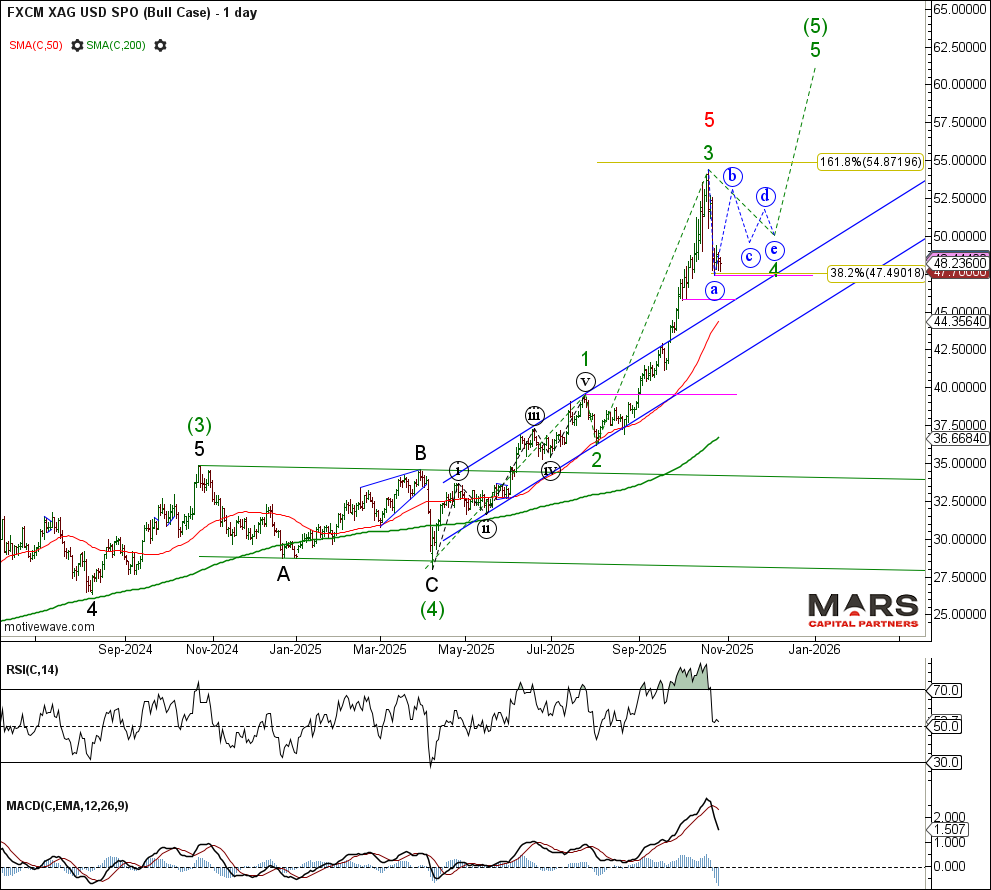
To the PM’s and both Gold and Silver are warning of bearish reversals. The recent decline in Gold appears impulsive but continues to hold trend support for wave (a) or (i) down. Bears need to break this trend support for an extension lower in wave (iii) or (c) down. Bears will need to extend this decline into an impulsive 5 waves down to help confirm a bigger picture change in trend (red count). The bullish green alternate is that the recent strong rally is only completing green wave (3) of an ongoing wave (5) rally into year end.
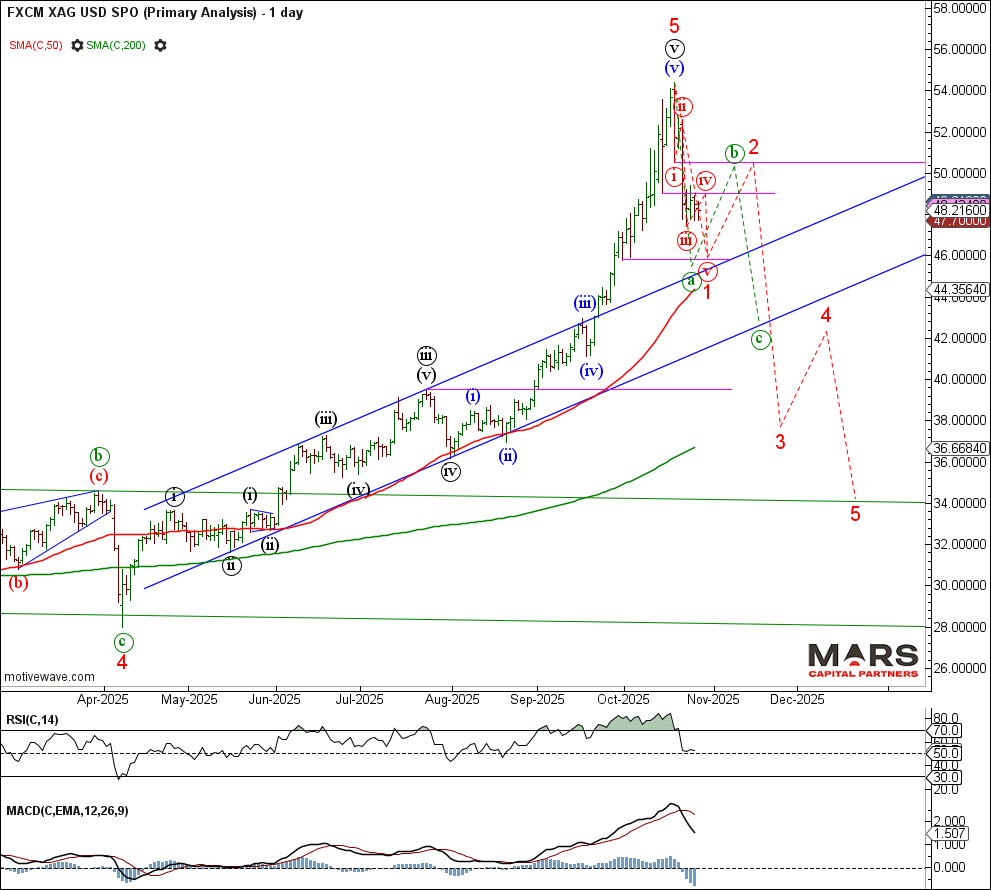
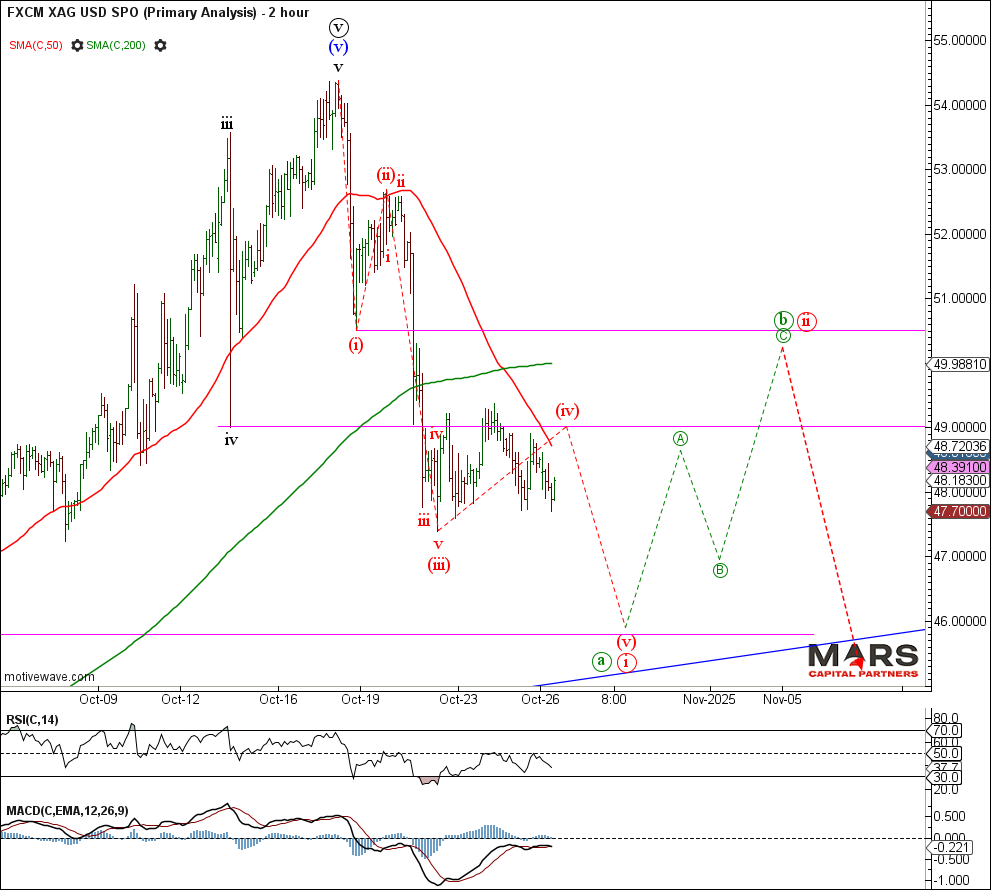
Silver extended sharply lower last week but the decline is only in 3 waves so far. Bears need to extend this initial decline into 5 waves down to help confirm a bigger picture change in trend. The alternate bull count would need to hold last week’s lows and extend higher in a corrective wave 4 triangle consolidation. Near term inflection for Silver.
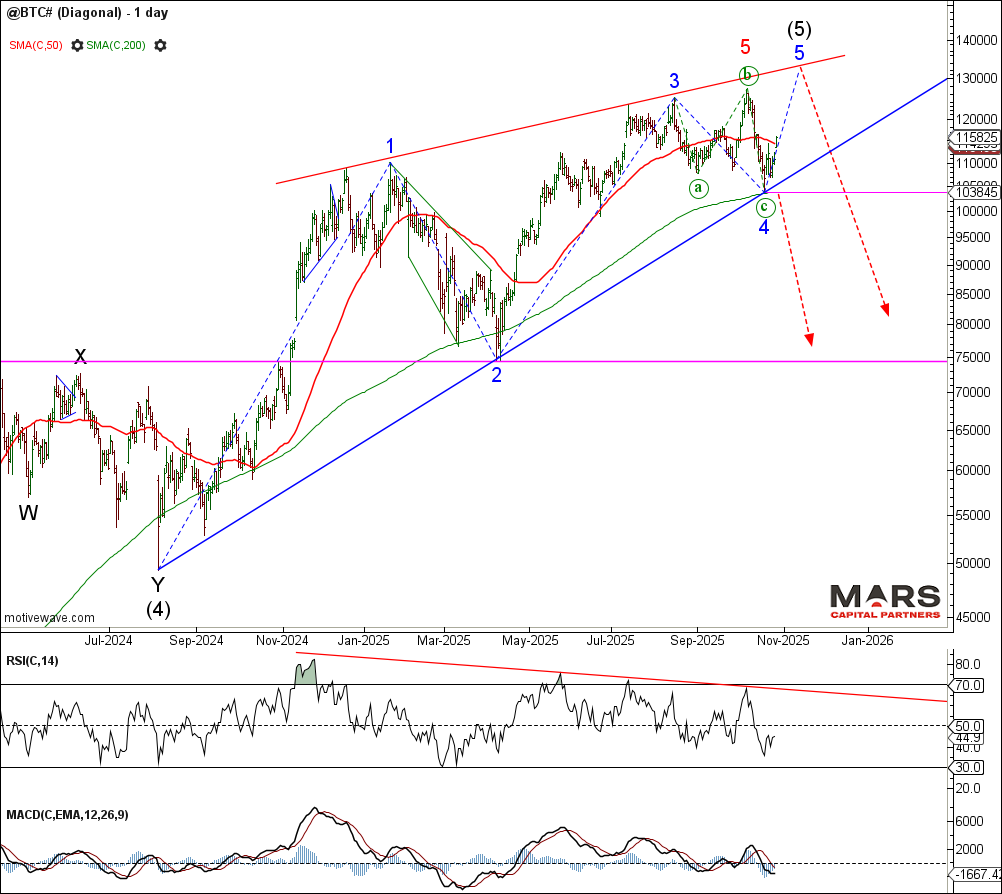
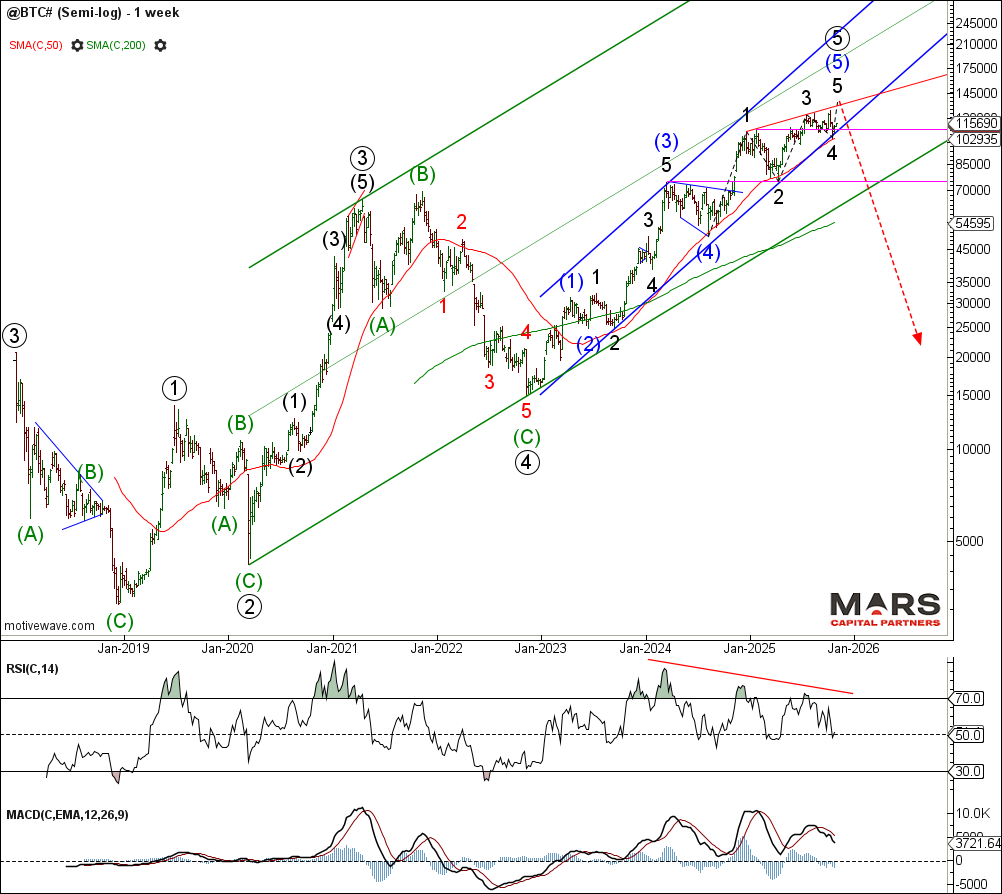
Crypto Markets – Ending Diagonal?
To the crypto markets and Bitcoin is attempting to rally up from our 200 day sma support. The rally would still look best with a final wave 5 of (5) rally to potentially end this bull market trend (wedging into the highs). A break of 200 day sma support likely invalidates the bull count and triggers a strong decline. Be aware that any push to new ATH’s could be an ending rally and major top. Note the bearish momentum divergence across multiple timeframes…likely topping so caveat emptor!
That’s all for now. Have a great week 🙂
