
The Macro Outlook: Energy Shock & Inflation Pass-Through
The key events for the w/c 6 April 2026: US inflation (PCE Feb, CPI Mar), ISM Services PMI, FOMC Minutes, RBNZ Meeting
Macro Recap: Testing the Resilience of the US Economy
The geopolitical conflict and uncertainty involving Iran continues to anchor market sentiment, though the nature of the uncertainty is evolving. Beneath the surface of the daily noise, the primary signals remain unchanged: energy production curbs persist, and the Strait of Hormuz remains effectively closed, with Iran managing specific conditions for limited traffic.
The longer these core disruptions remain unresolved, the greater the likelihood of longer-lasting economic damage. As the conflict teeters on the edge of becoming a protracted event, we shift our focus toward tracking its tangible impacts on U.S. and global economic resilience, including the expected inflation shock.
Mixed US Labor Market Signals
While last week’s US labor market data for March provided mixed signals, there was a more positive edge leading into the conflict. Growth in non-farm payrolls of +178k in March was stronger than expected. Revisions to prior months were small: net -7k. While monthly payroll data has been volatile recently, the March print suggests the labor market may have been on a more positive trajectory before the conflict. Importantly, job growth broadened across industries this month, moving beyond the narrow gains seen last month. However, this strength was tempered by the household survey, where the unemployment rate edged down to 4.3% primarily due to a drop in labor force participation, rather than an increase in employment. This reinforces that the recent “low dynamism” gear has continued.
Other parts of the labor report suggest some pressure for nominal labor income growth in March. Despite the stronger growth in payrolls, aggregate hours worked continued to contract in March, posting two consecutive months of decline. Annual growth in aggregate hours worked remains largely subdued at a mere +0.4% over the year. At the same time, growth in average hourly earnings also slowed to +0.2% over the month, and to a near-term low of +3.5% over the year. With headline inflation set to rise, this may begin to place added pressure on the spending power of that income.
Growth Resilience Under Pressure
The US growth resilience appears to be coming under pressure further into Q1. The latest Atlanta Fed GDP nowcast for Q1 showed growth edging lower to +1.6% based on data released last week:
- US Trade (Feb): The largest contributor to the slower growth run rate was a larger-than-expected trade deficit in Feb.
- Retail Sales (Feb): The contribution from consumer spending edged lower, despite a seemingly rosier retail sales result. The nominal retail control group data (which feeds into the GDP calculation) increased by +0.5% in Feb, but Jan growth was revised lower from +0.3% to +0.2%.
- The ISM Manufacturing PMI (Mar): Demand conditions remained moderate, and the broader headline PMI edged up from 52.4 in Feb to 52.7 in Mar. Unsurprisingly, the ISM prices index began to show the first impact of higher energy prices and supply chain disruption from the conflict, rising to the highest level since 2023. Just under two-thirds of firms reported higher prices this month, while the report also noted a broad range of commodity prices rising this month.
Global Impact and Inflation
The second pillar for the week involved data points more directly exposed to the geopolitical shock. The Eurozone prelim CPI for Mar showed headline inflation rising by +1% over the month – led by a +4.9% increase in energy prices. Annual headline inflation is expected to increase to +2.5% in March (from +1.9% in Feb). Importantly, core CPI has remained fairly stable at +2.3% in March (from +2.4% in Feb).
The global manufacturing PMI reading edged down slightly, but remained in positive expansion in March. The effects of the conflict were most evident in the sharp rise in the global input price index for March. The remainder of the full suite of global PMIs will be released this week (services).
Outlook for the week ahead: US inflation (PCE Feb, CPI Mar), ISM Services PMI, FOMC Minutes, RBNZ Meeting
A heavy data calendar remains in place this week as markets continue to navigate significant geopolitical uncertainty and headline risk. This week, we continue to focus on evaluating U.S. domestic resilience and tracking the broader global impact of the Middle East conflict.
U.S. Domestic Activity: The main focus this week is on the key US inflation data. This will include the February PCE (a pre-conflict baseline) inflation report and, importantly, the March CPI report, which will provide the first look at the pass-through of the energy price shock into US domestic inflation. Building out our view of the evolving domestic growth backdrop will be personal spending & income, factory activity, and the Q4 GDP (final release). Additionally, the latest FOMC minutes will offer further insight into the Committee’s decision to remain on hold at the March meeting.
Global Impact: On the global front, the final suite of S&P Global Services PMIs will be released, providing a view on any initial impacts of the conflict on the services sector.
Key factors & events to watch this week:
US Inflation
There will be two inflation reports this week. The first will be pre-conflict: the Fed-preferred PCE price index for Feb. The second will be a more closely watched CPI for March, which is expected to reflect the notable impact of rising energy prices.
- Headline PCE inflation for Feb is expected to increase by +0.4% over the month, up from +0.3% in Jan. This would leave headline PCE inflation unchanged at +2.8% in Feb.
- Core PCE inflation for Feb is also expected to increase by +0.4% over the month in Feb (from +0.4% in Jan). This would see annual core PCE inflation slow to +3% in Feb (from +3.1% in Jan).
- Headline CPI for March is expected to increase by +0.9% over the month, up from +0.3% in Jan. Annual growth in headline CPI is expected to jump to +3.4% in Mar, from +2.4% in Feb.
- Importantly, core CPI is expected to only edge slightly higher to +0.3% over the month in Mar (from +0.2% in Feb). Annual growth in core CPI is expected to increase to +2.7% in Mar, from +2.5% in Feb.
US Growth Backdrop
The tracking for US GDP growth so far in Q1 has edged lower to a +1.6% run rate based on the latest update of the Atlanta Fed GDP nowcast. Several reports this week will add further to the Q1 tracking:
- Personal spending for Feb is expected to increase by +0.5% (from +0.4% in Jan).
- Personal income for Feb is expected to increase by +0.3% in Feb (down from +0.4% in Jan).
- Factory Orders for Feb are expected to slow, falling by -0.2% in Feb (from +0.1% in Jan).
- The ISM Services PMI is expected to edge lower to 55 in Mar (from 56.1 in Feb).
- The final estimate for Q4 GDP is expected to confirm the +0.7% annualized growth rate.
US Federal Reserve
- The latest FOMC meeting minutes will be released this week.
- Fed Vice Chair Jefferson will give a speech on the economic outlook this week.
RBNZ
- The RBNZ meets this week and is expected to keep its policy rate unchanged at 2.25%.
Global Developments
- China’s CPI for Mar is expected to be little changed over the year at +1.2% in Mar (from +1.3% in Feb)
- Canada’s labour market survey for March is expected to show a small rebound in employment growth of +12.6k (from -83k in Feb), while the unemployment rate is expected to tick up to 6.8% (from 6.7% in Feb).
- The remainder of the S&P Global Services PMIs for March will be released this week.
This week, the US Treasury will auction and settle approx $460bn in ST Bills, with a paydown of $54bn.
The US Treasury will also auction the 3-year and 10-year Notes, and the 30-year Bond this week, to settle next week.
More detail (including a calendar of key data releases) is provided in the briefing document – download the pdf below:
Comments and feedback are welcome. Please email me at kim.mofardin@marscapitalpartners.net
Mars Market Update: April 6th, 2026 – Uncertainty Remains
Last week, equities rebounded strongly as Trump looks to TACO his way out of the Iran conflict. The decline in the SPX, DJIA and Russell all appear impulsive for wave A or 1 down. This initial rebound appears to be part of a larger degree counter-trend rally that potentially sets up the next decline in wave 3 or C down. Ideally, we’d like to see a 3 wave corrective rally that reverses from 61.8% fib and 50 day sma trend resistance. The structure of the Nasdaq decline is not clearly impulsive and may be warning of underlying market strength. The uncertainty remains extremely high. “The longer this Iran conflict remains unresolved, the greater the risk of stagflationary headwinds of higher rates and energy prices.”.
Bond markets rebounded from trend support but remain trapped within big picture triangle consolidations. The US$ / DXY extended marginally higher into overhead resistance unconfirmed by new lows in the Euro. The rally up off the major lows is impulsive and while it may see a near term pullback, it remains bullish from a big picture perspective. Commodities remain mixed as energy markets test recent highs while the metals rally appears corrective – this behaviour reflects the stagflationary fears for the global economy the longer this conflict persists.
Equity Markets – Counter-Trend Rally?
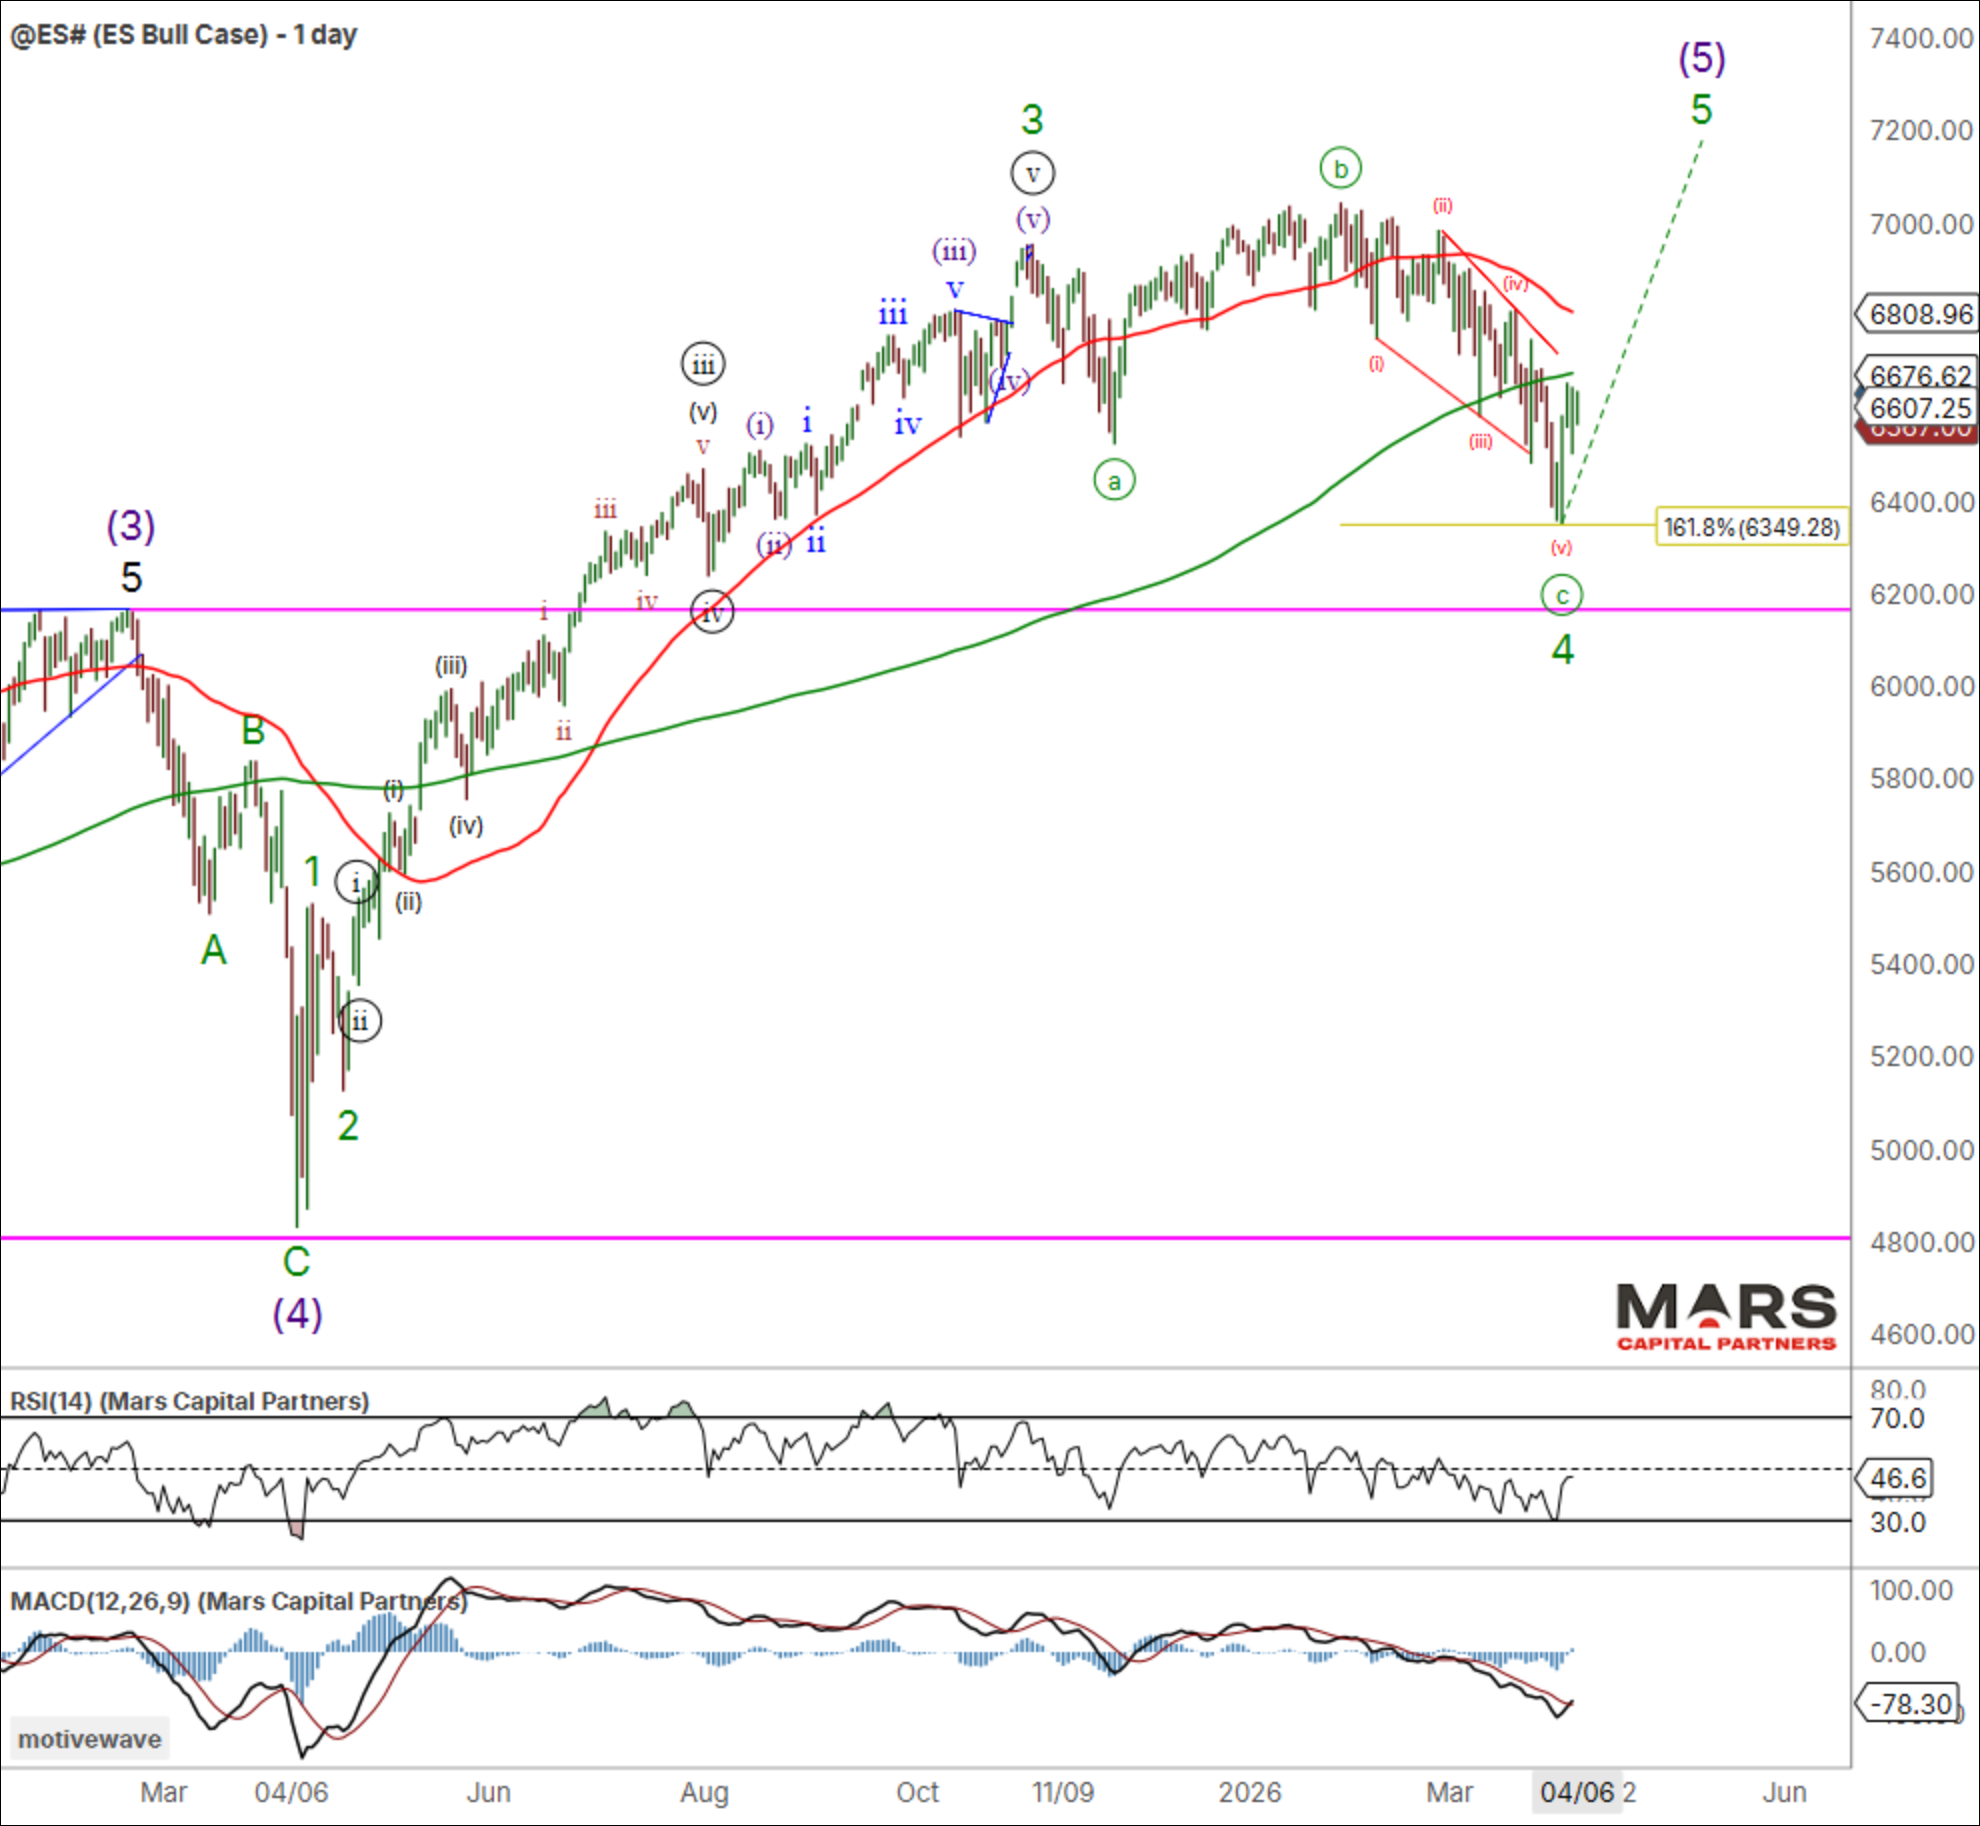
Last week, the benchmark SPX / ES rebounded from fib support for what is likely wave (a) up of a counter-trend rally. The structure of the decline appears to be a leading diagonal decline for wave A or 1 down that potentially sets up a strong decline once this counter-trend rally completes. Overhead resistance remains at the 50 day sma and 61.8% fib retracement in the 6780-6800 area. Our continued caution remains warranted given the extended nature of the 2026 decline.
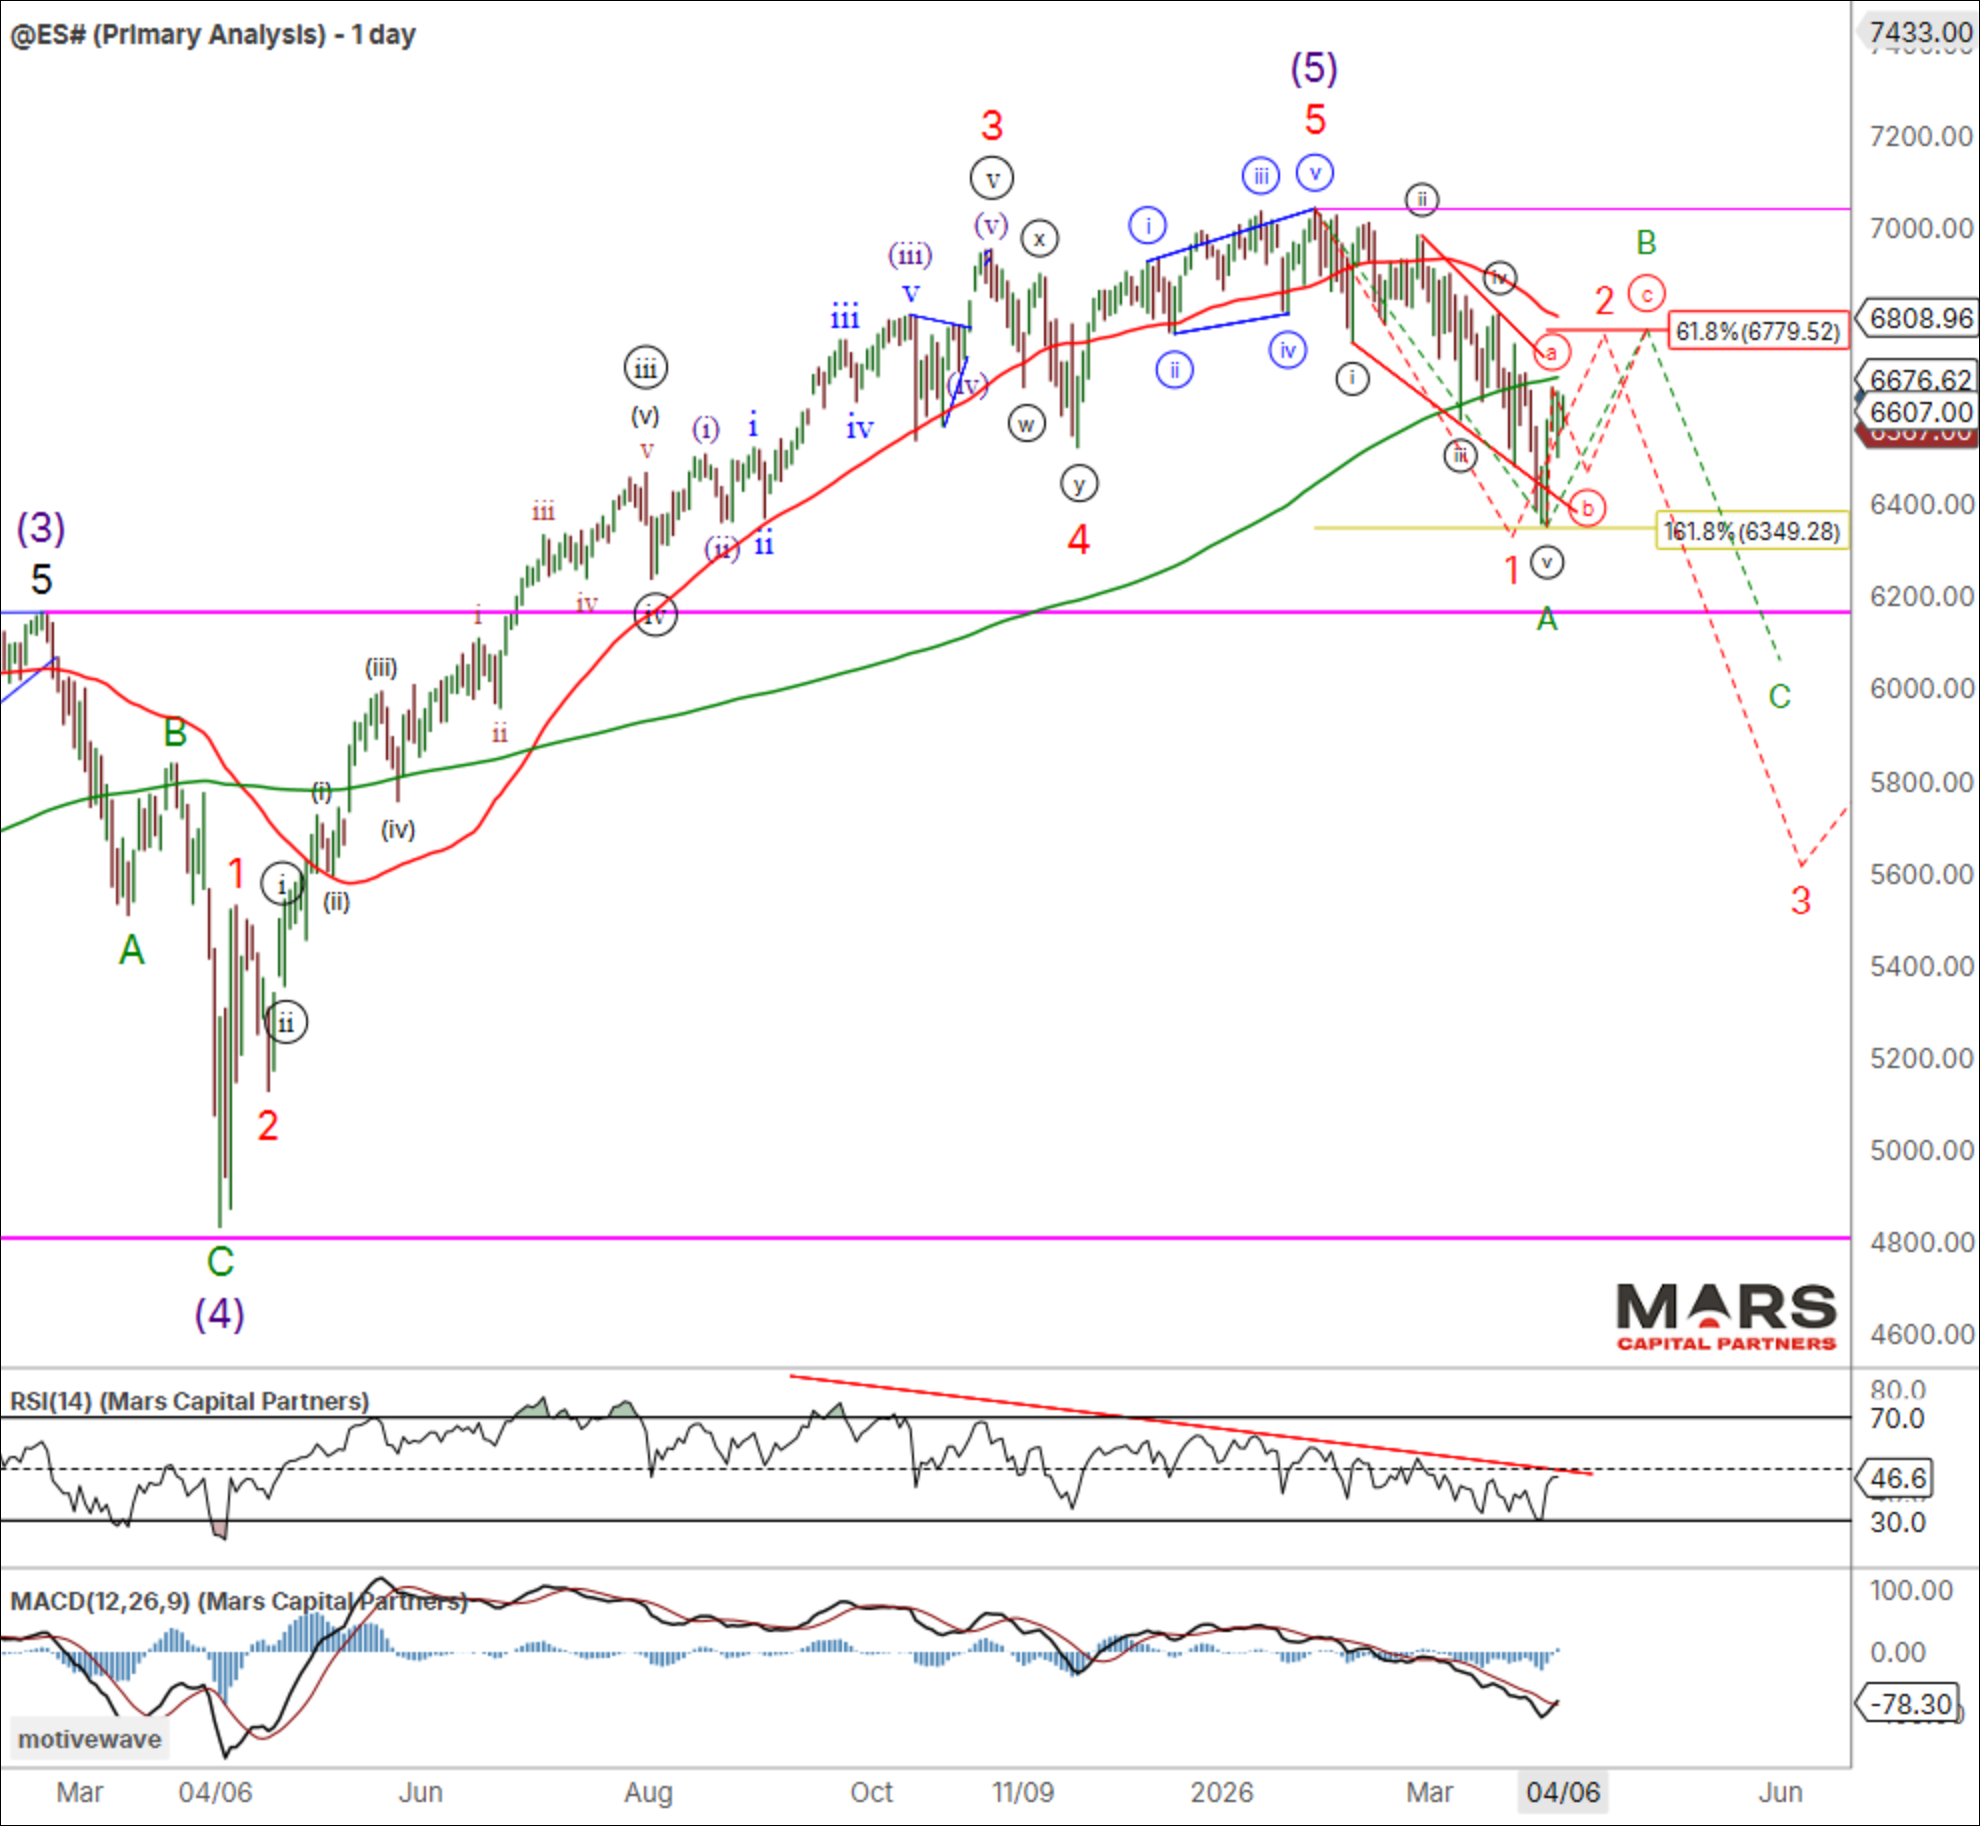
What if we’re wrong and the latest SPX / ES decline completed wave (c) of 4 with a final wave 5 to new ATH’s now on deck? While lower probability (and not our base case), we should be aware of the potential if Trump is successful and the Hormuz Straight clears. We should be aware that any push to marginal new highs is likely an ending wave.
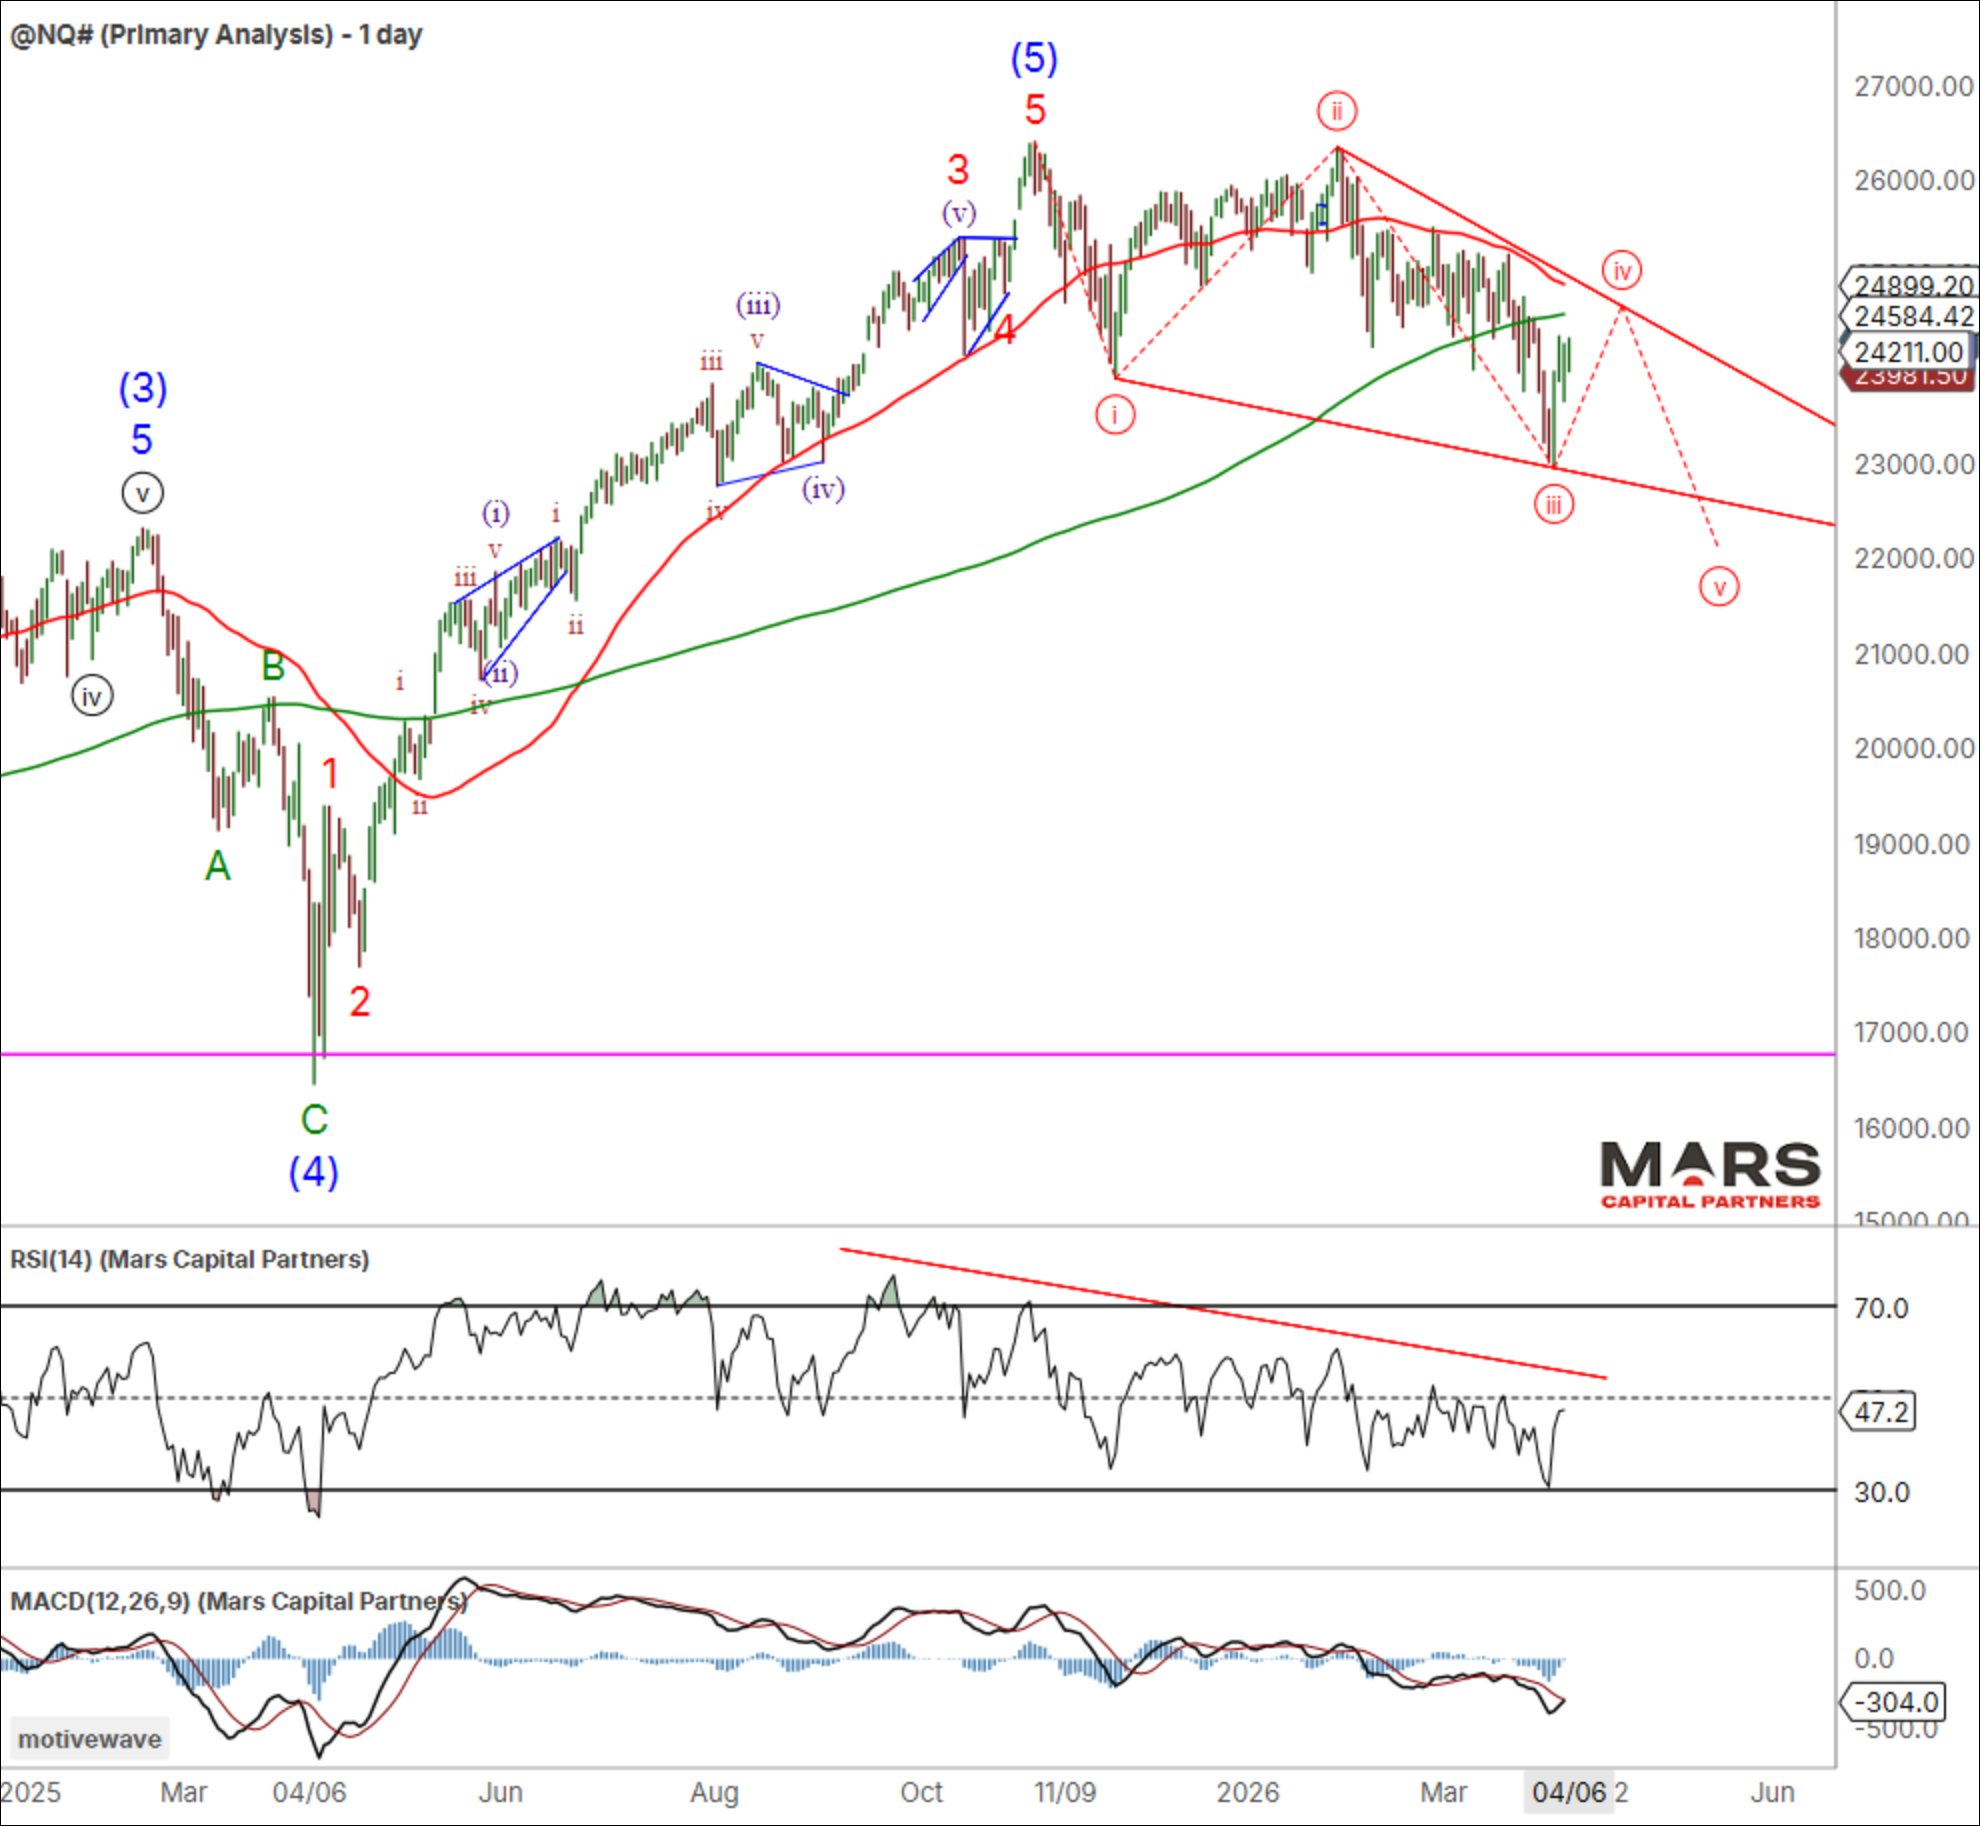
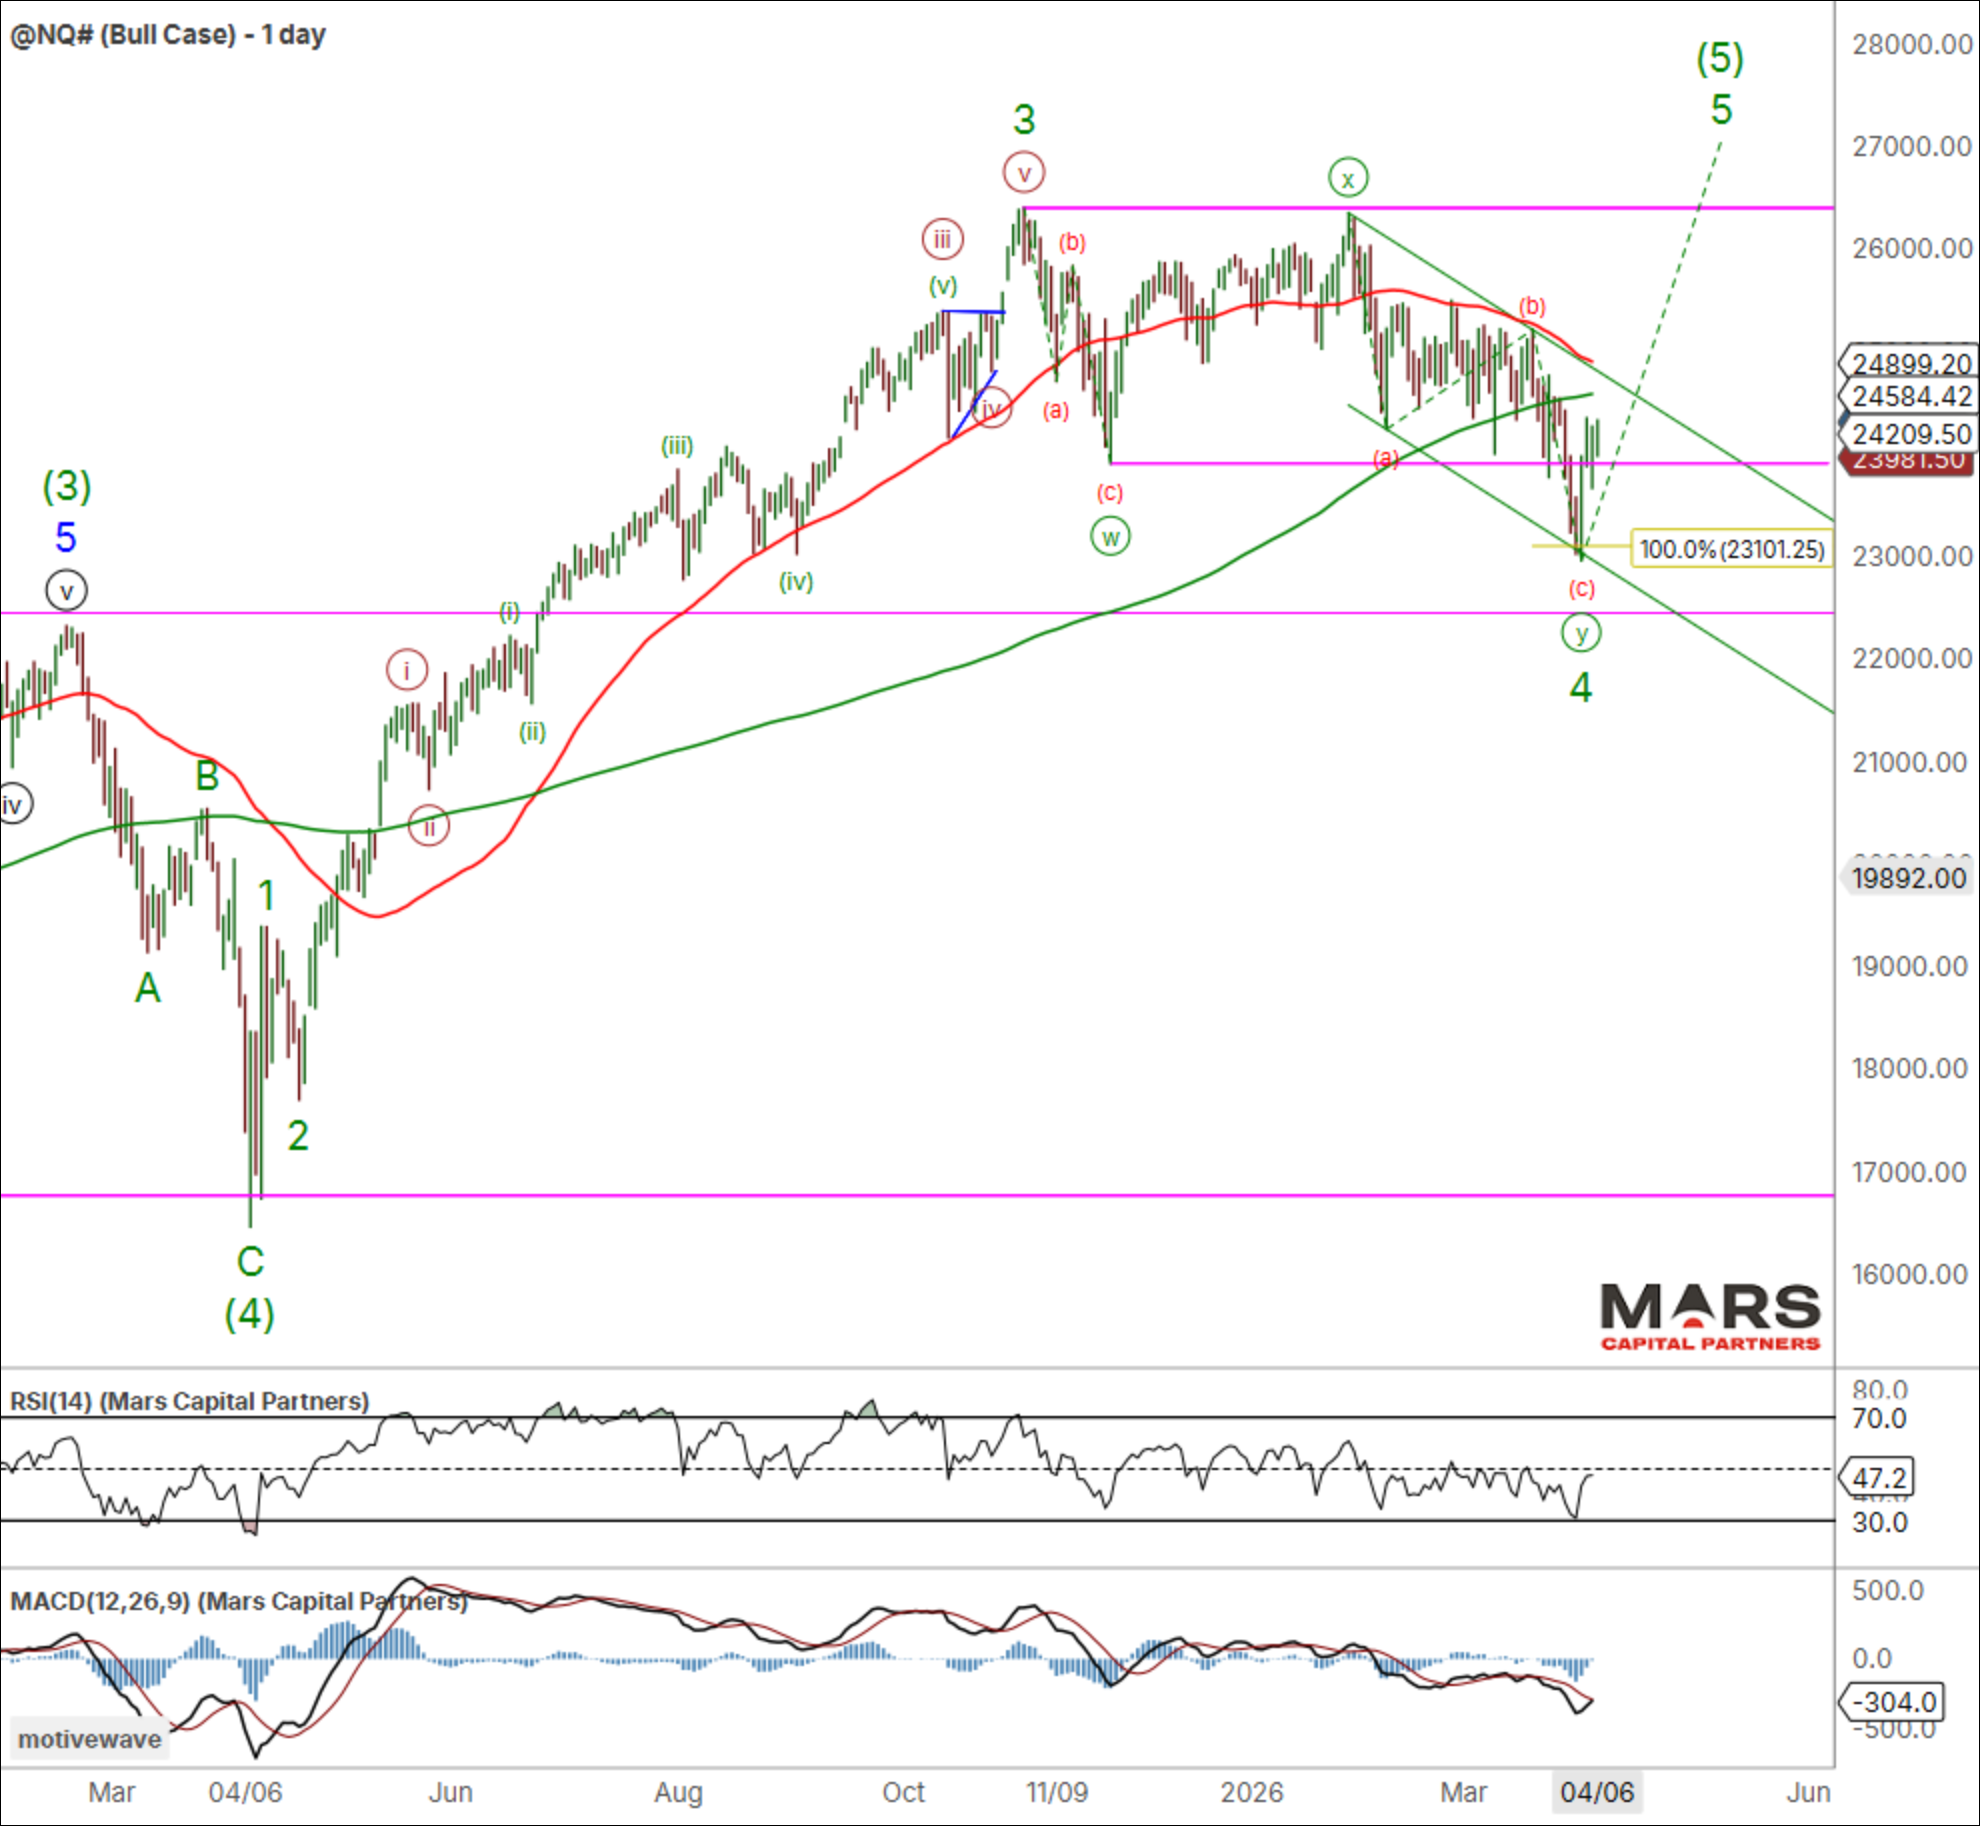
The Nasdaq / NQ failed to see downside follow through last week and rebounded through overhead resistance in the 24000 area. The decline appears corrective and needs to extend lower in 5 waves to help confirm a bigger picture decline. The bullish alternate is a completed wave 4 corrective decline that sets up a final wave 5 of (5) rally. Overhead trend resistance remains at the 50 day sma as two-way risks remain. Low confidence outlook given what appears to be a complex correction while last week’s lows hold.
The DJIA / YM rebounded from support in the 45000 area after what appears to be an impulsive decline signaling the start of a larger degree bear trend. Ideally, we’d like to see a 3 wave counter-trend rally that tests resistance in the 48300-500 area of the 50 day sma and 61.8% fib. A counter-trend rally likely sets up the next wave 3 or C decline through overlap support in the 45000 area.

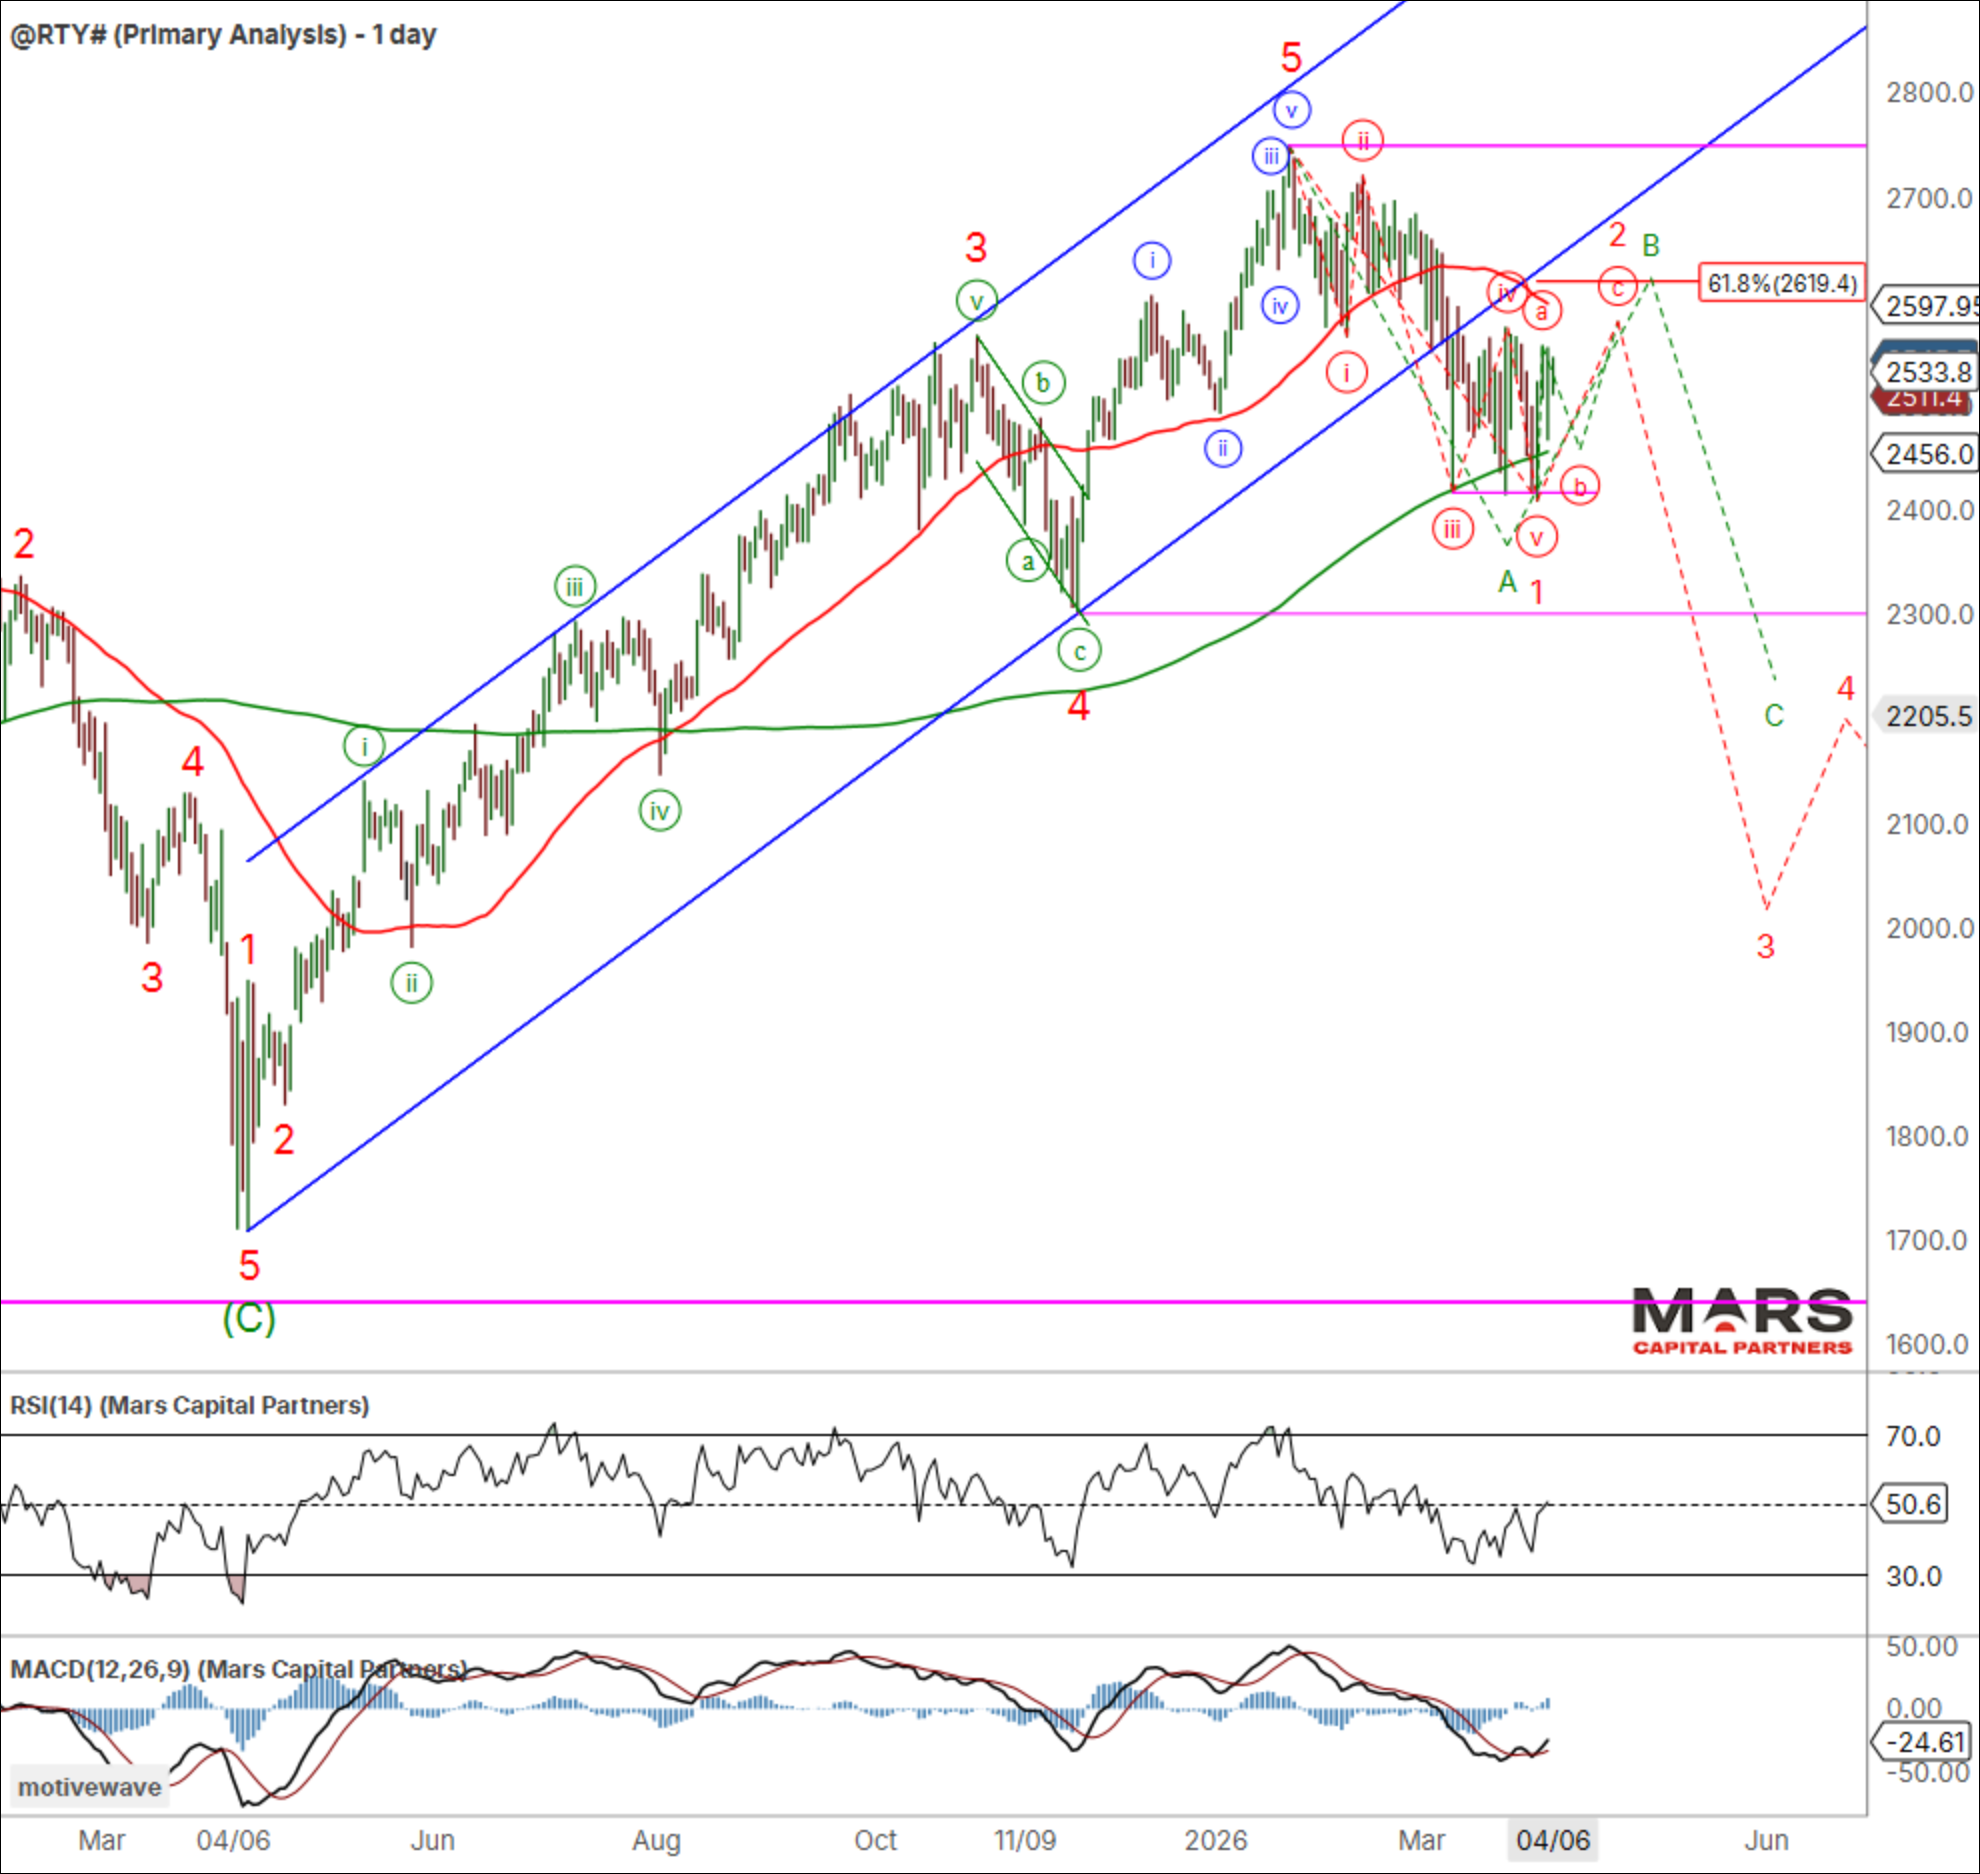
The Russell 2000 / RTY continued to stair step lower and has enough waves in place to complete 5 down. While the structure of the decline is not ideal, the recent rally is likely only wave (a) up of a counter-trend rally. Overhead resistance remains in the 2600 area from where the bears would need to make a stand. Bears need to break the 200 day sma and secondary support in the 2300 area to help confirm a larger degree decline.
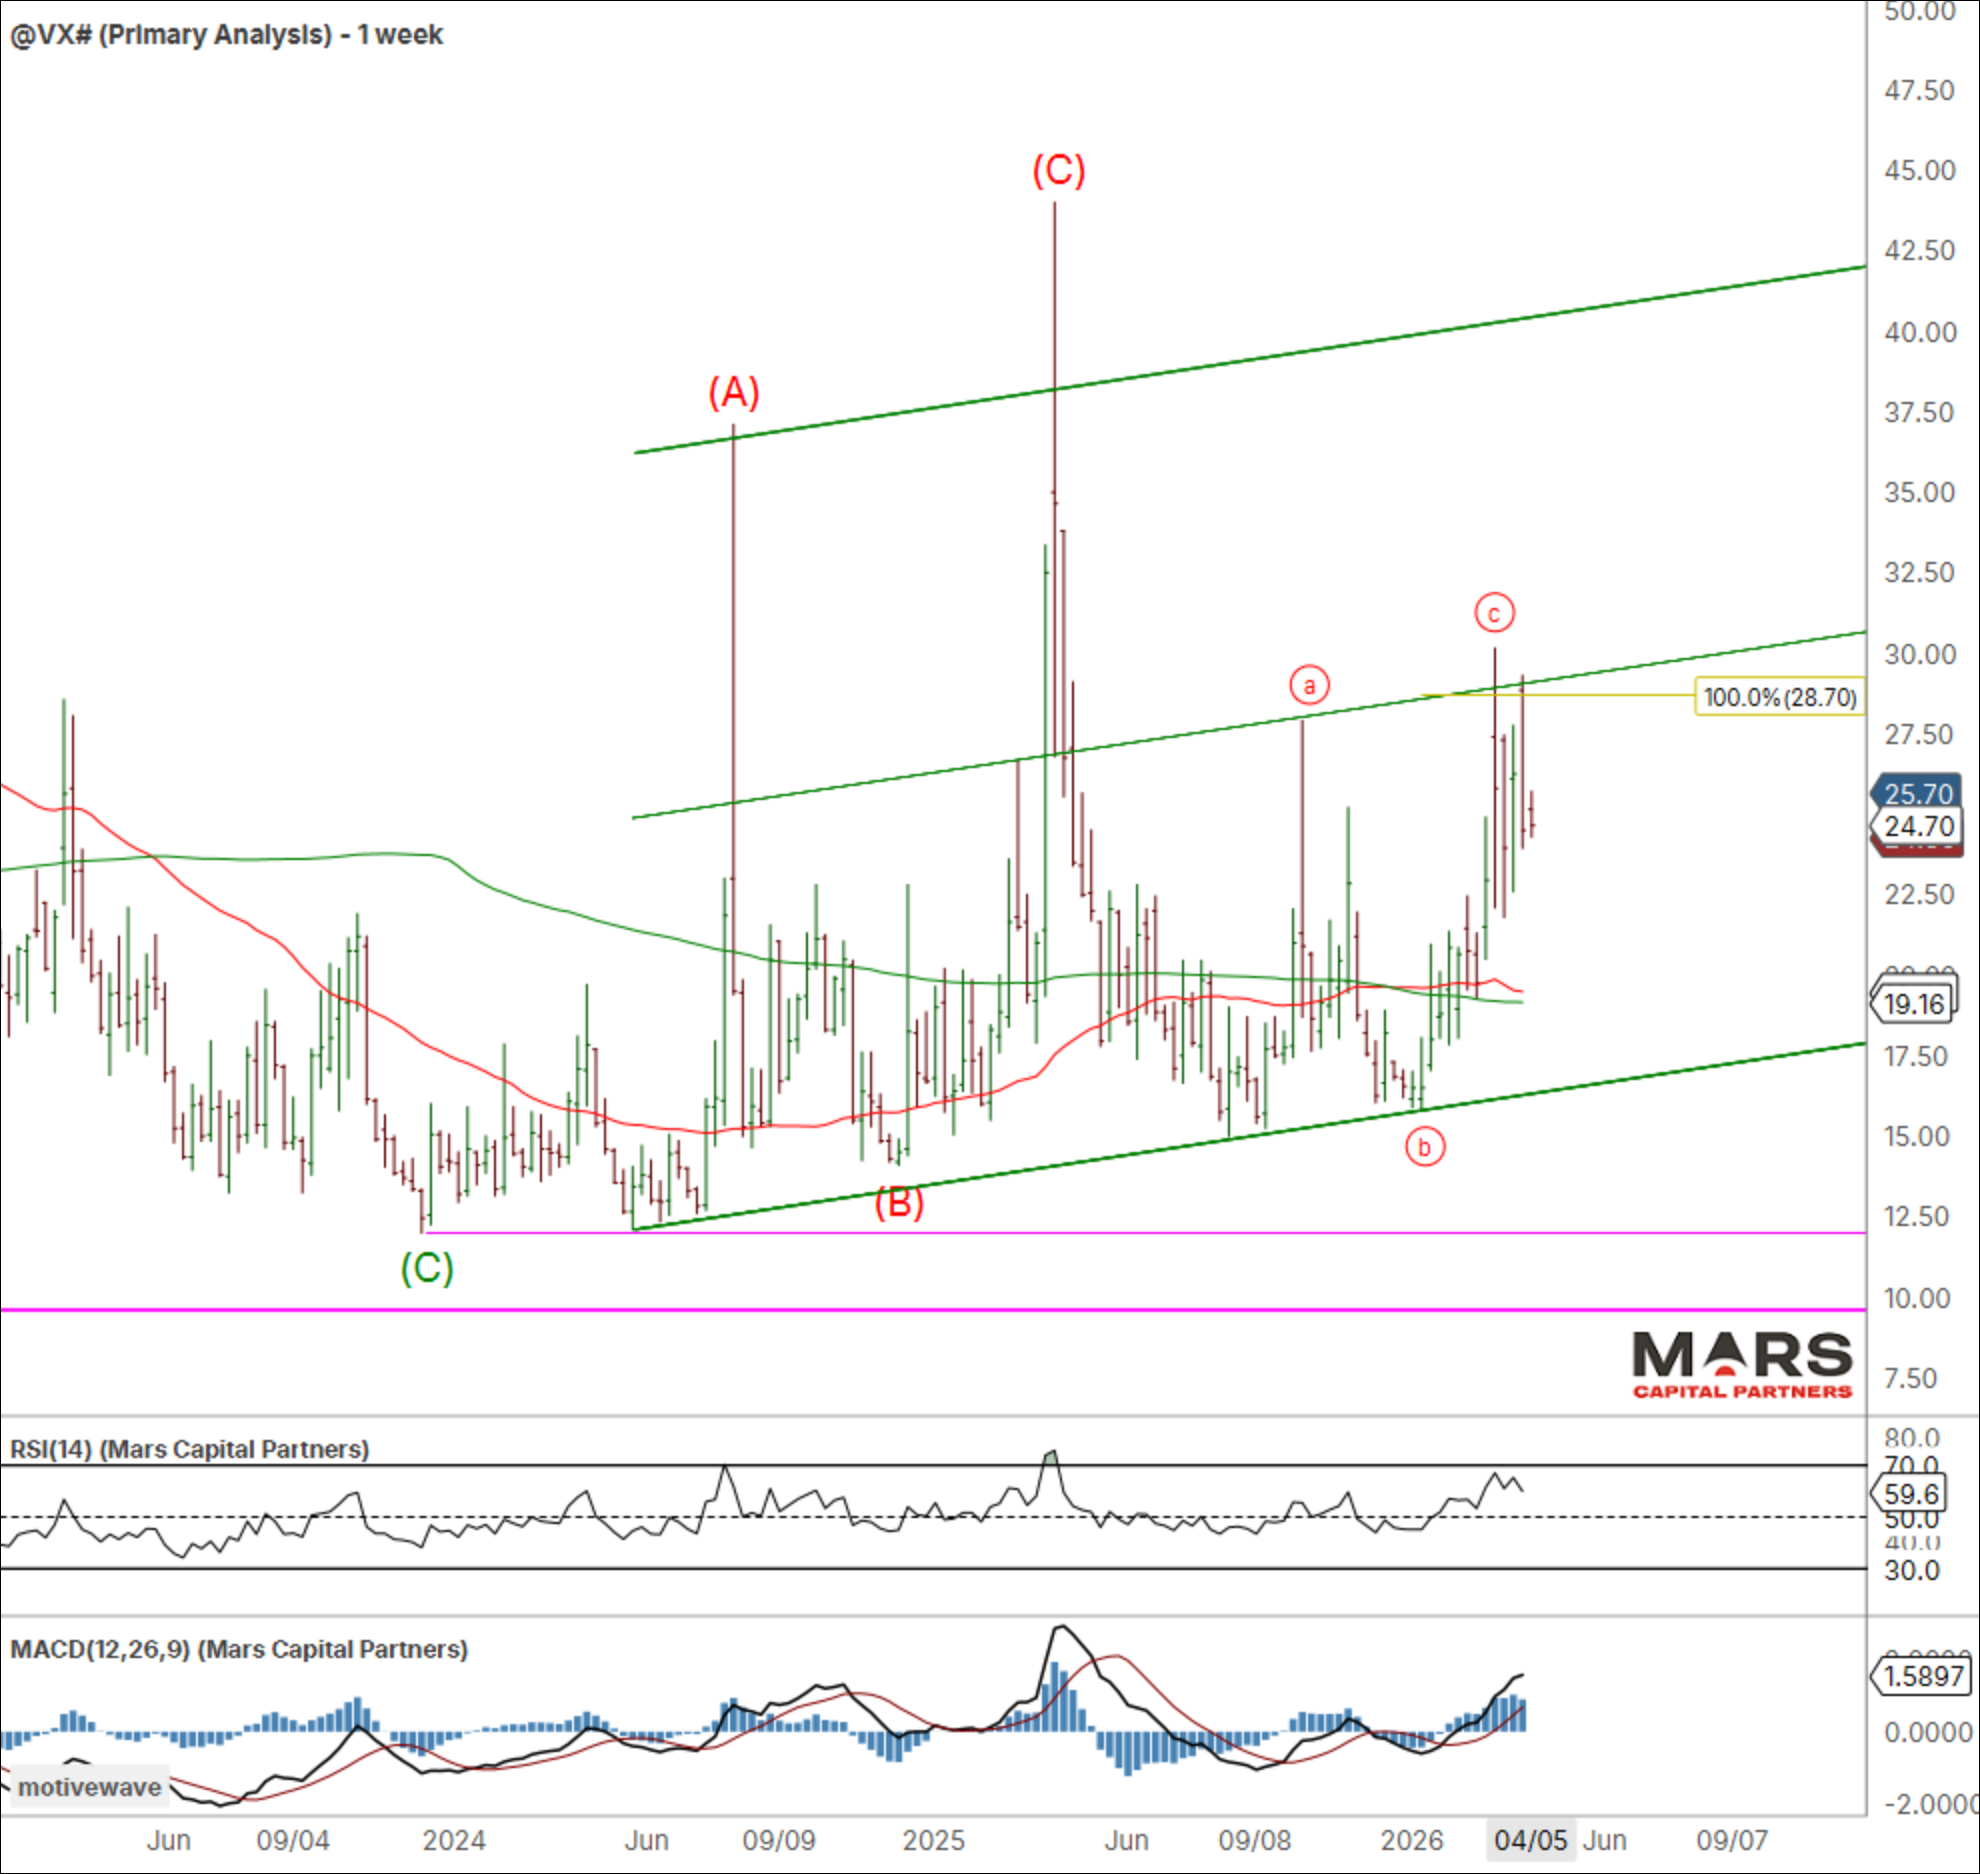
The VIX / VX remains range bound with another failed test of trend channel resistance. The equity bulls retain the potential for new highs while the VIX remains contained. A break above the wave (c) highs would warn of an accelerated decline in equity markets so buyer beware. Trump needs to end this Iran conflict or risk the consequences.
Bond Markets – Testing Support
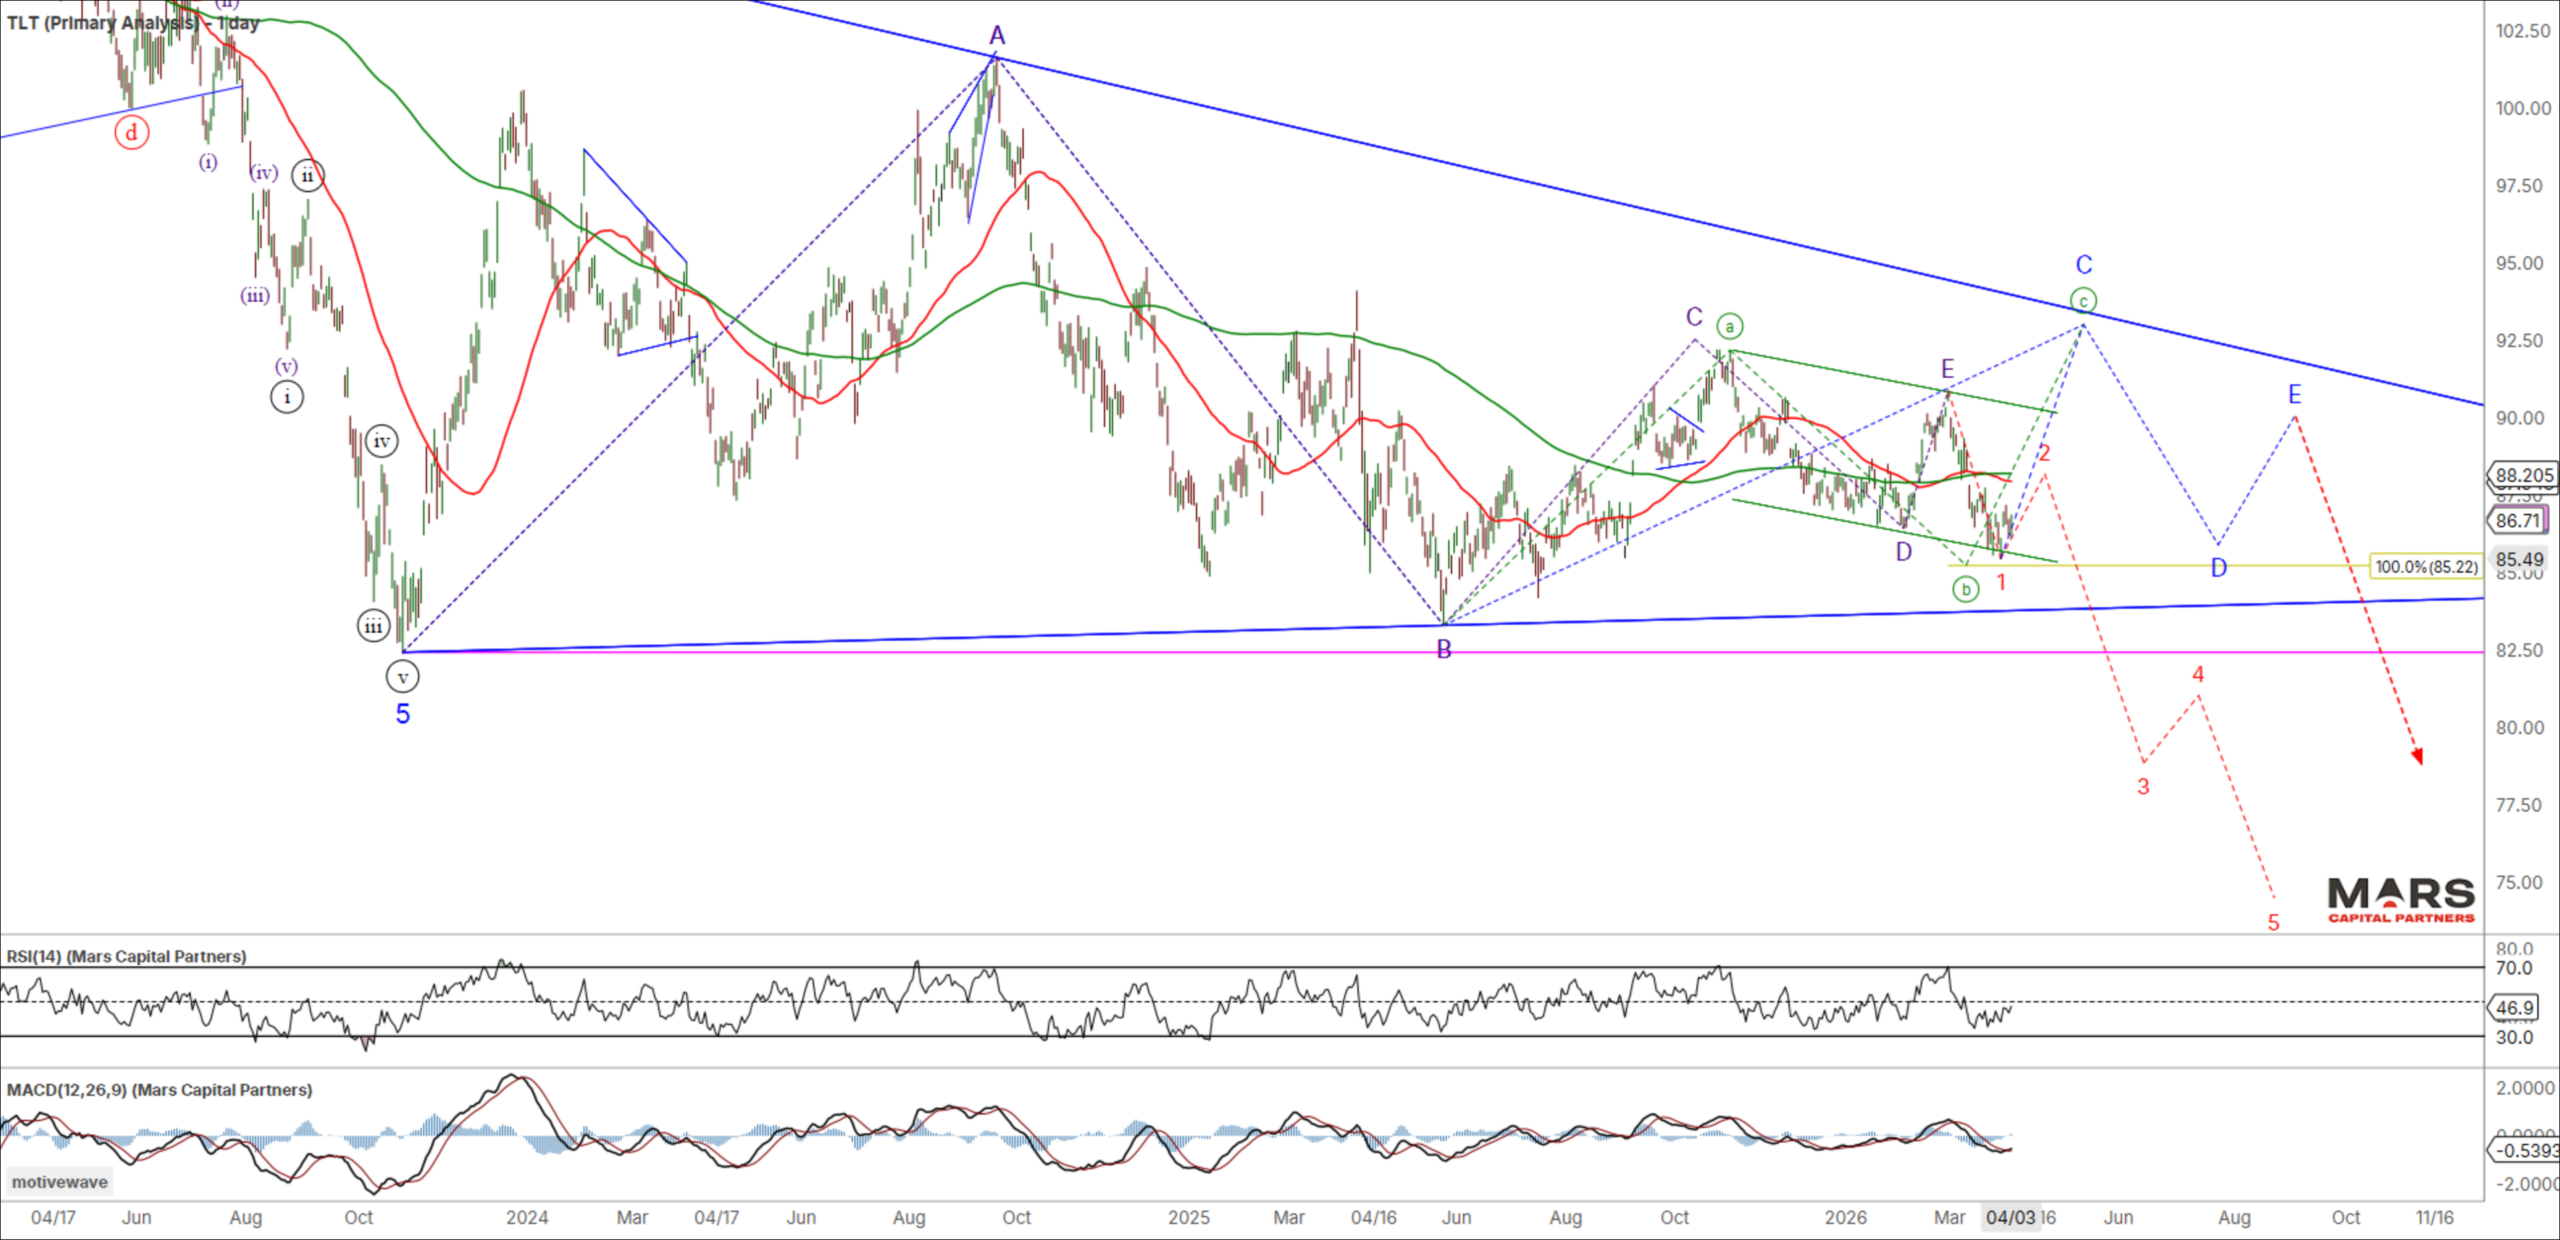
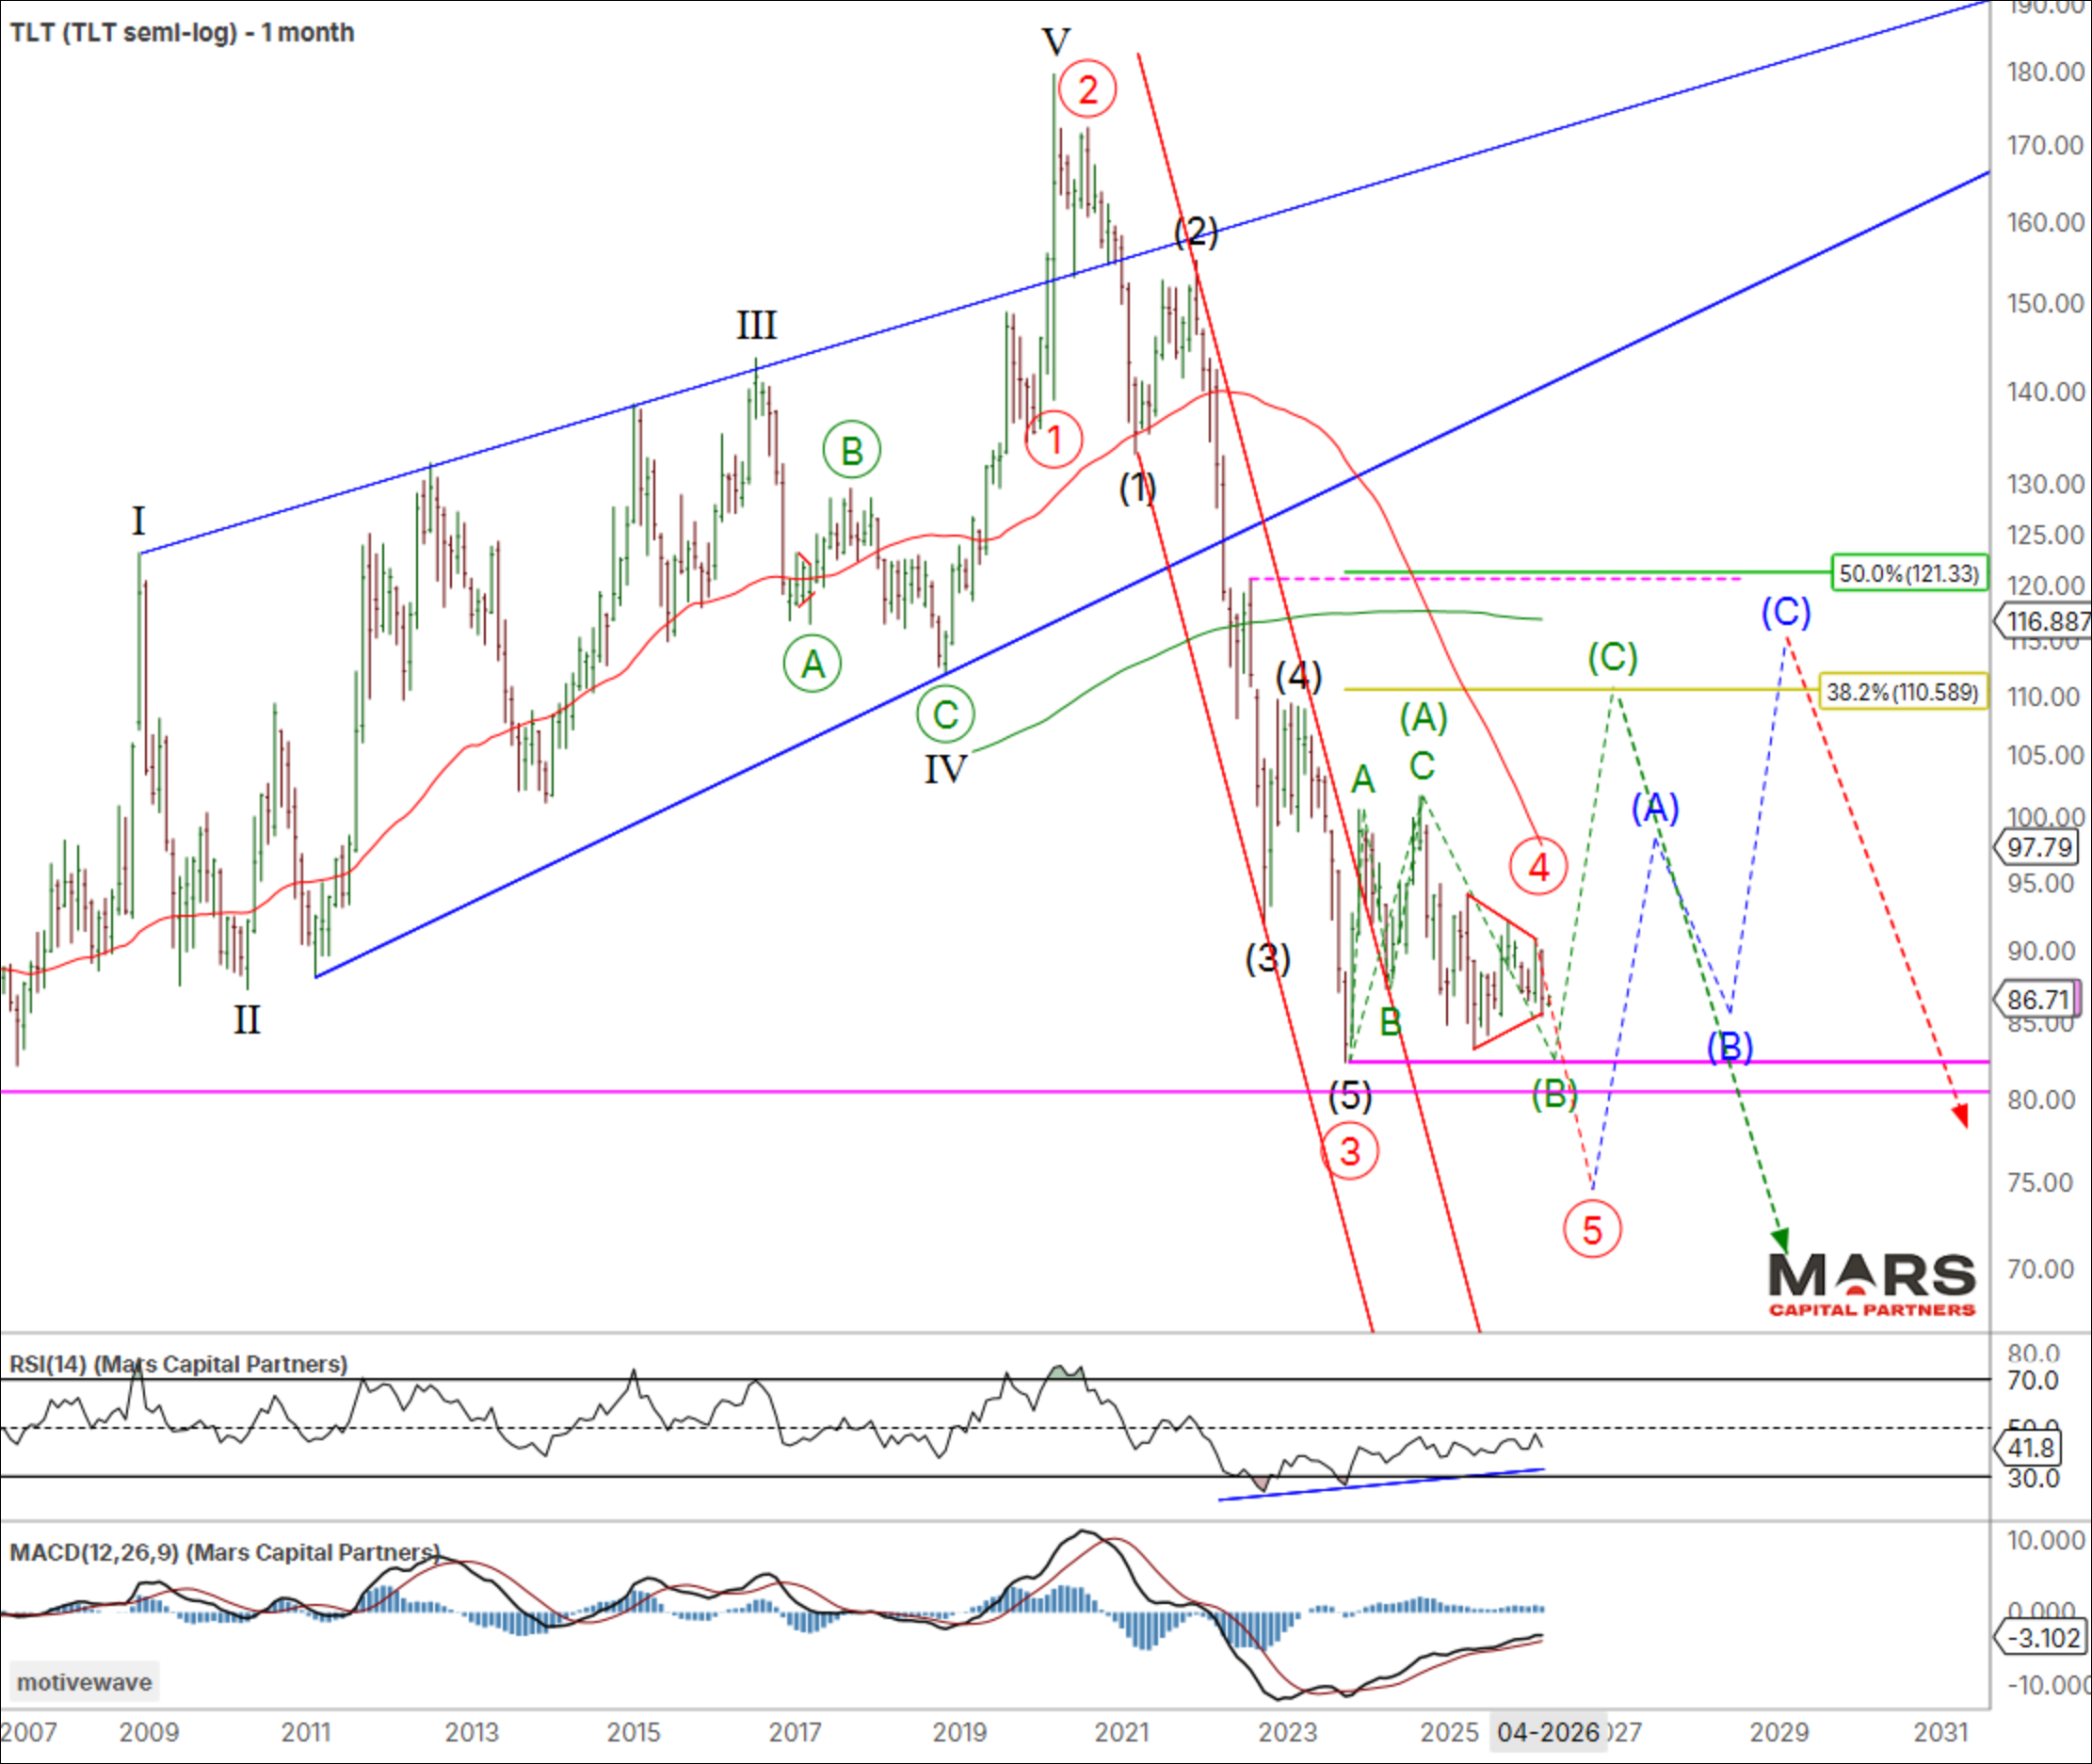
To the bond markets and the TLT rebounded from equality support to remain range bound from a big picture perspective. Bulls need to hold trend support in the 84-85 area or risk a strong red wave 3 of (5) decline. Importantly, bonds remain range bound within big picture triangle consolidations and any push to new swing lows is likely an ENDING wave. Near term inflection as bonds test support.
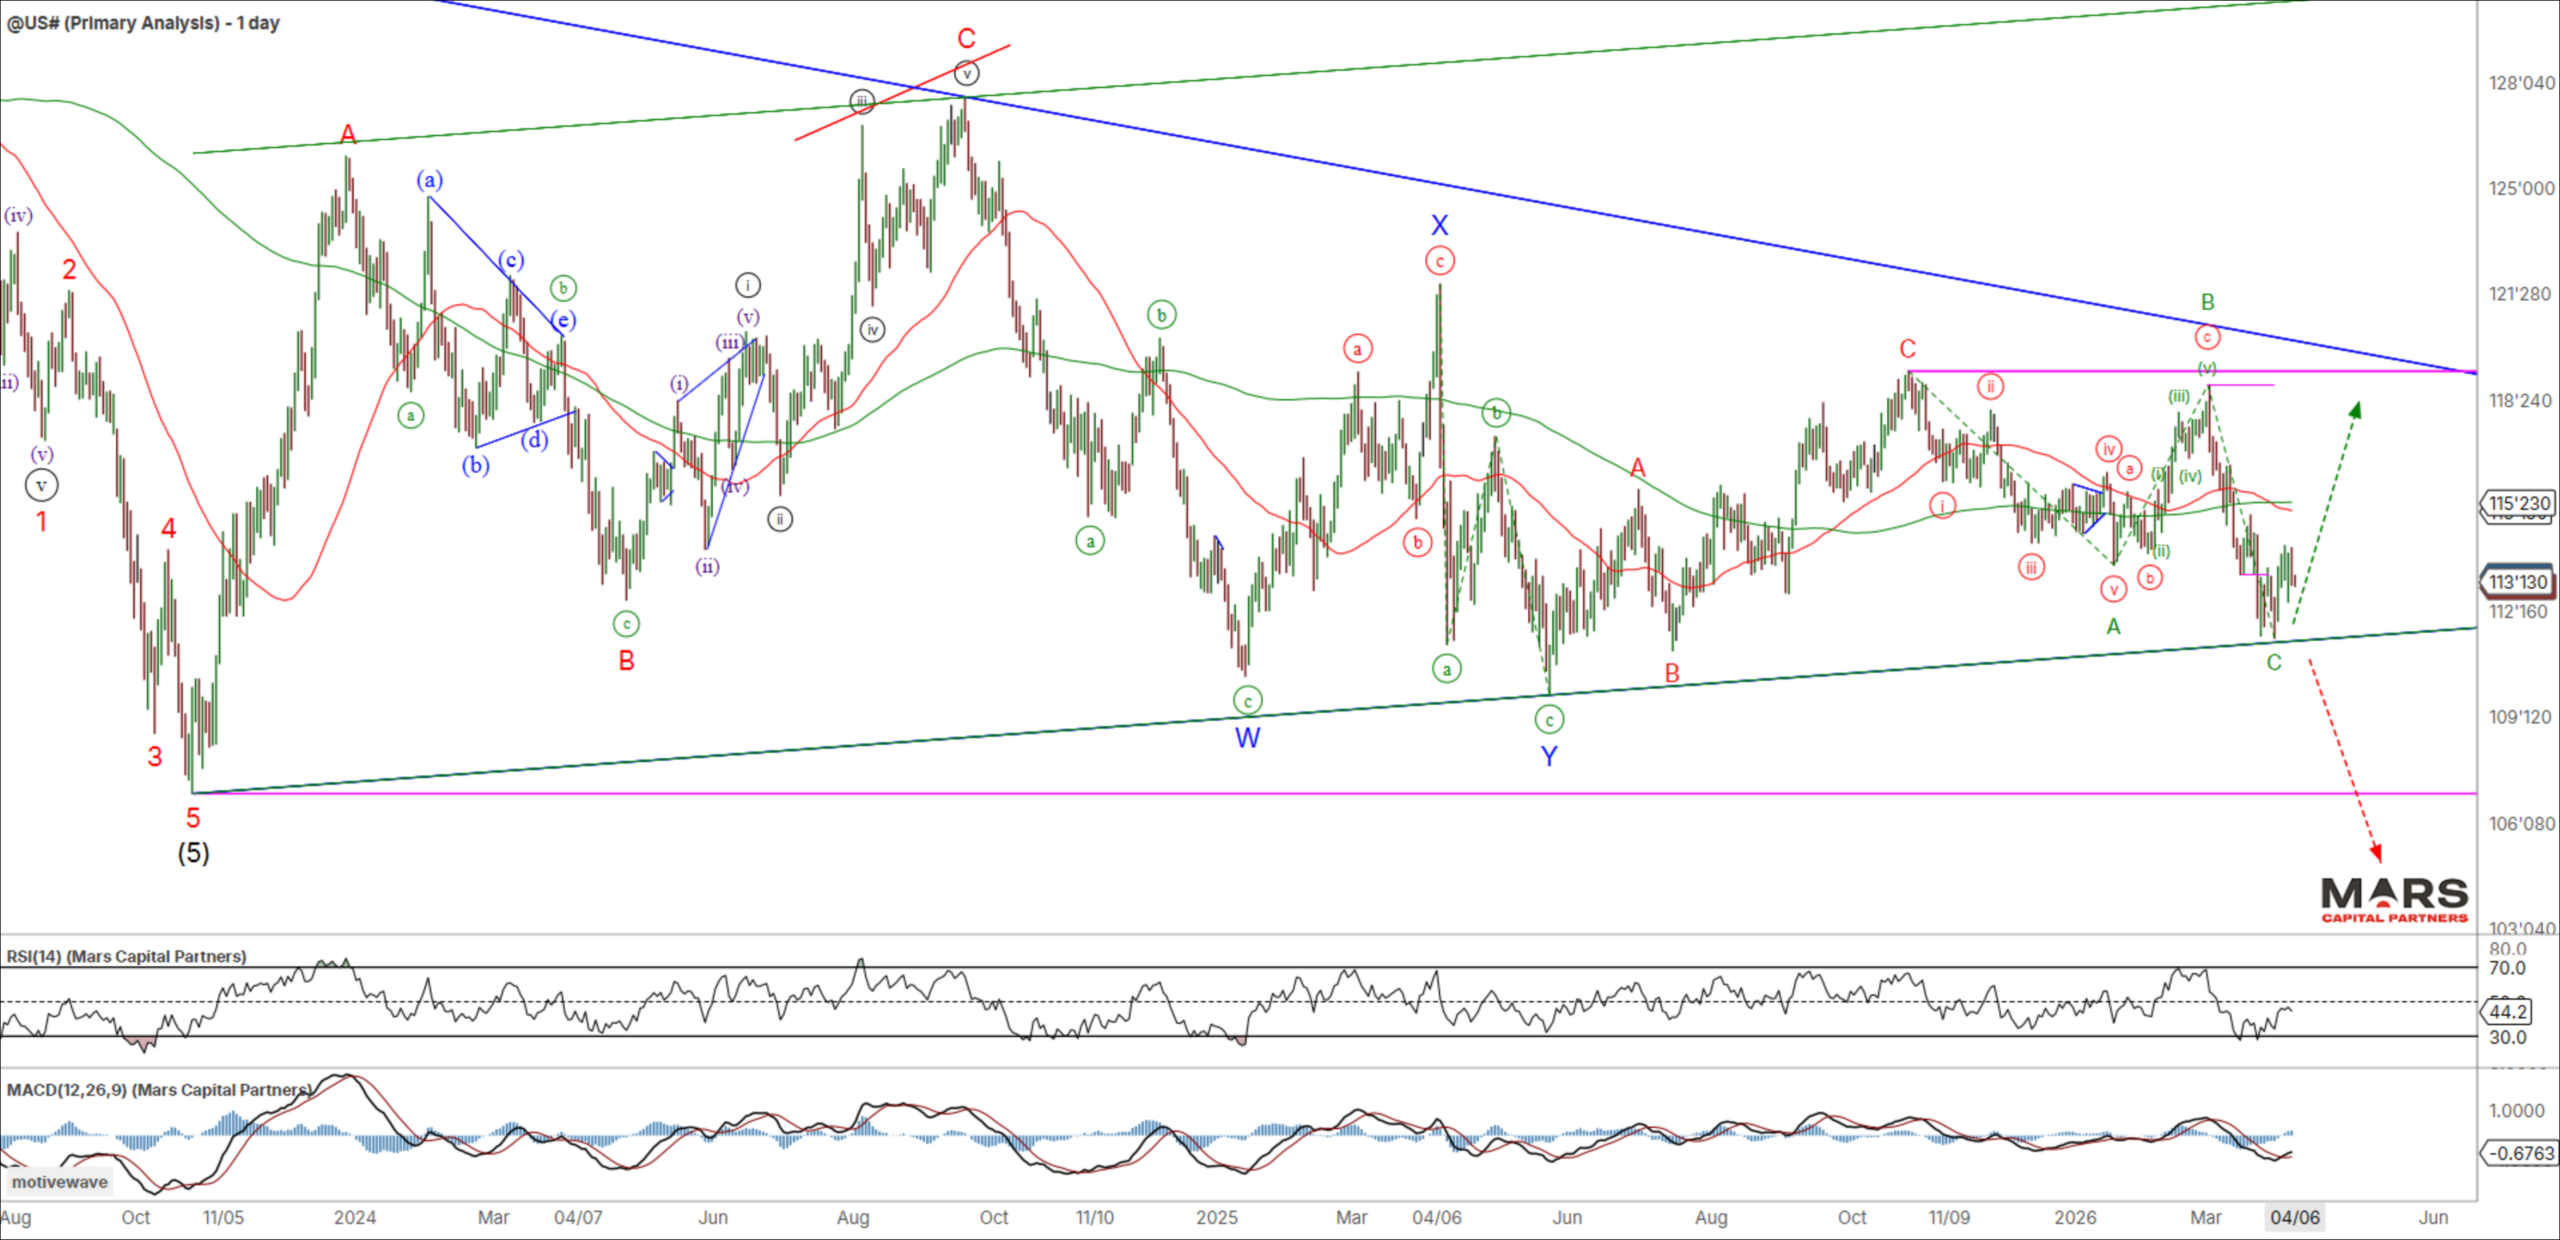
The US30yr / ZB rebounded from key trend support in the 112 area but the rally is not yet clearly impulsive. It remains range bound within a big picture triangle consolidation and support is support until broken. A break of trend support opens the door to a stronger wave (iii) decline and at least a hard test of major swing lows (or lower). Bulls need to hold the line here.
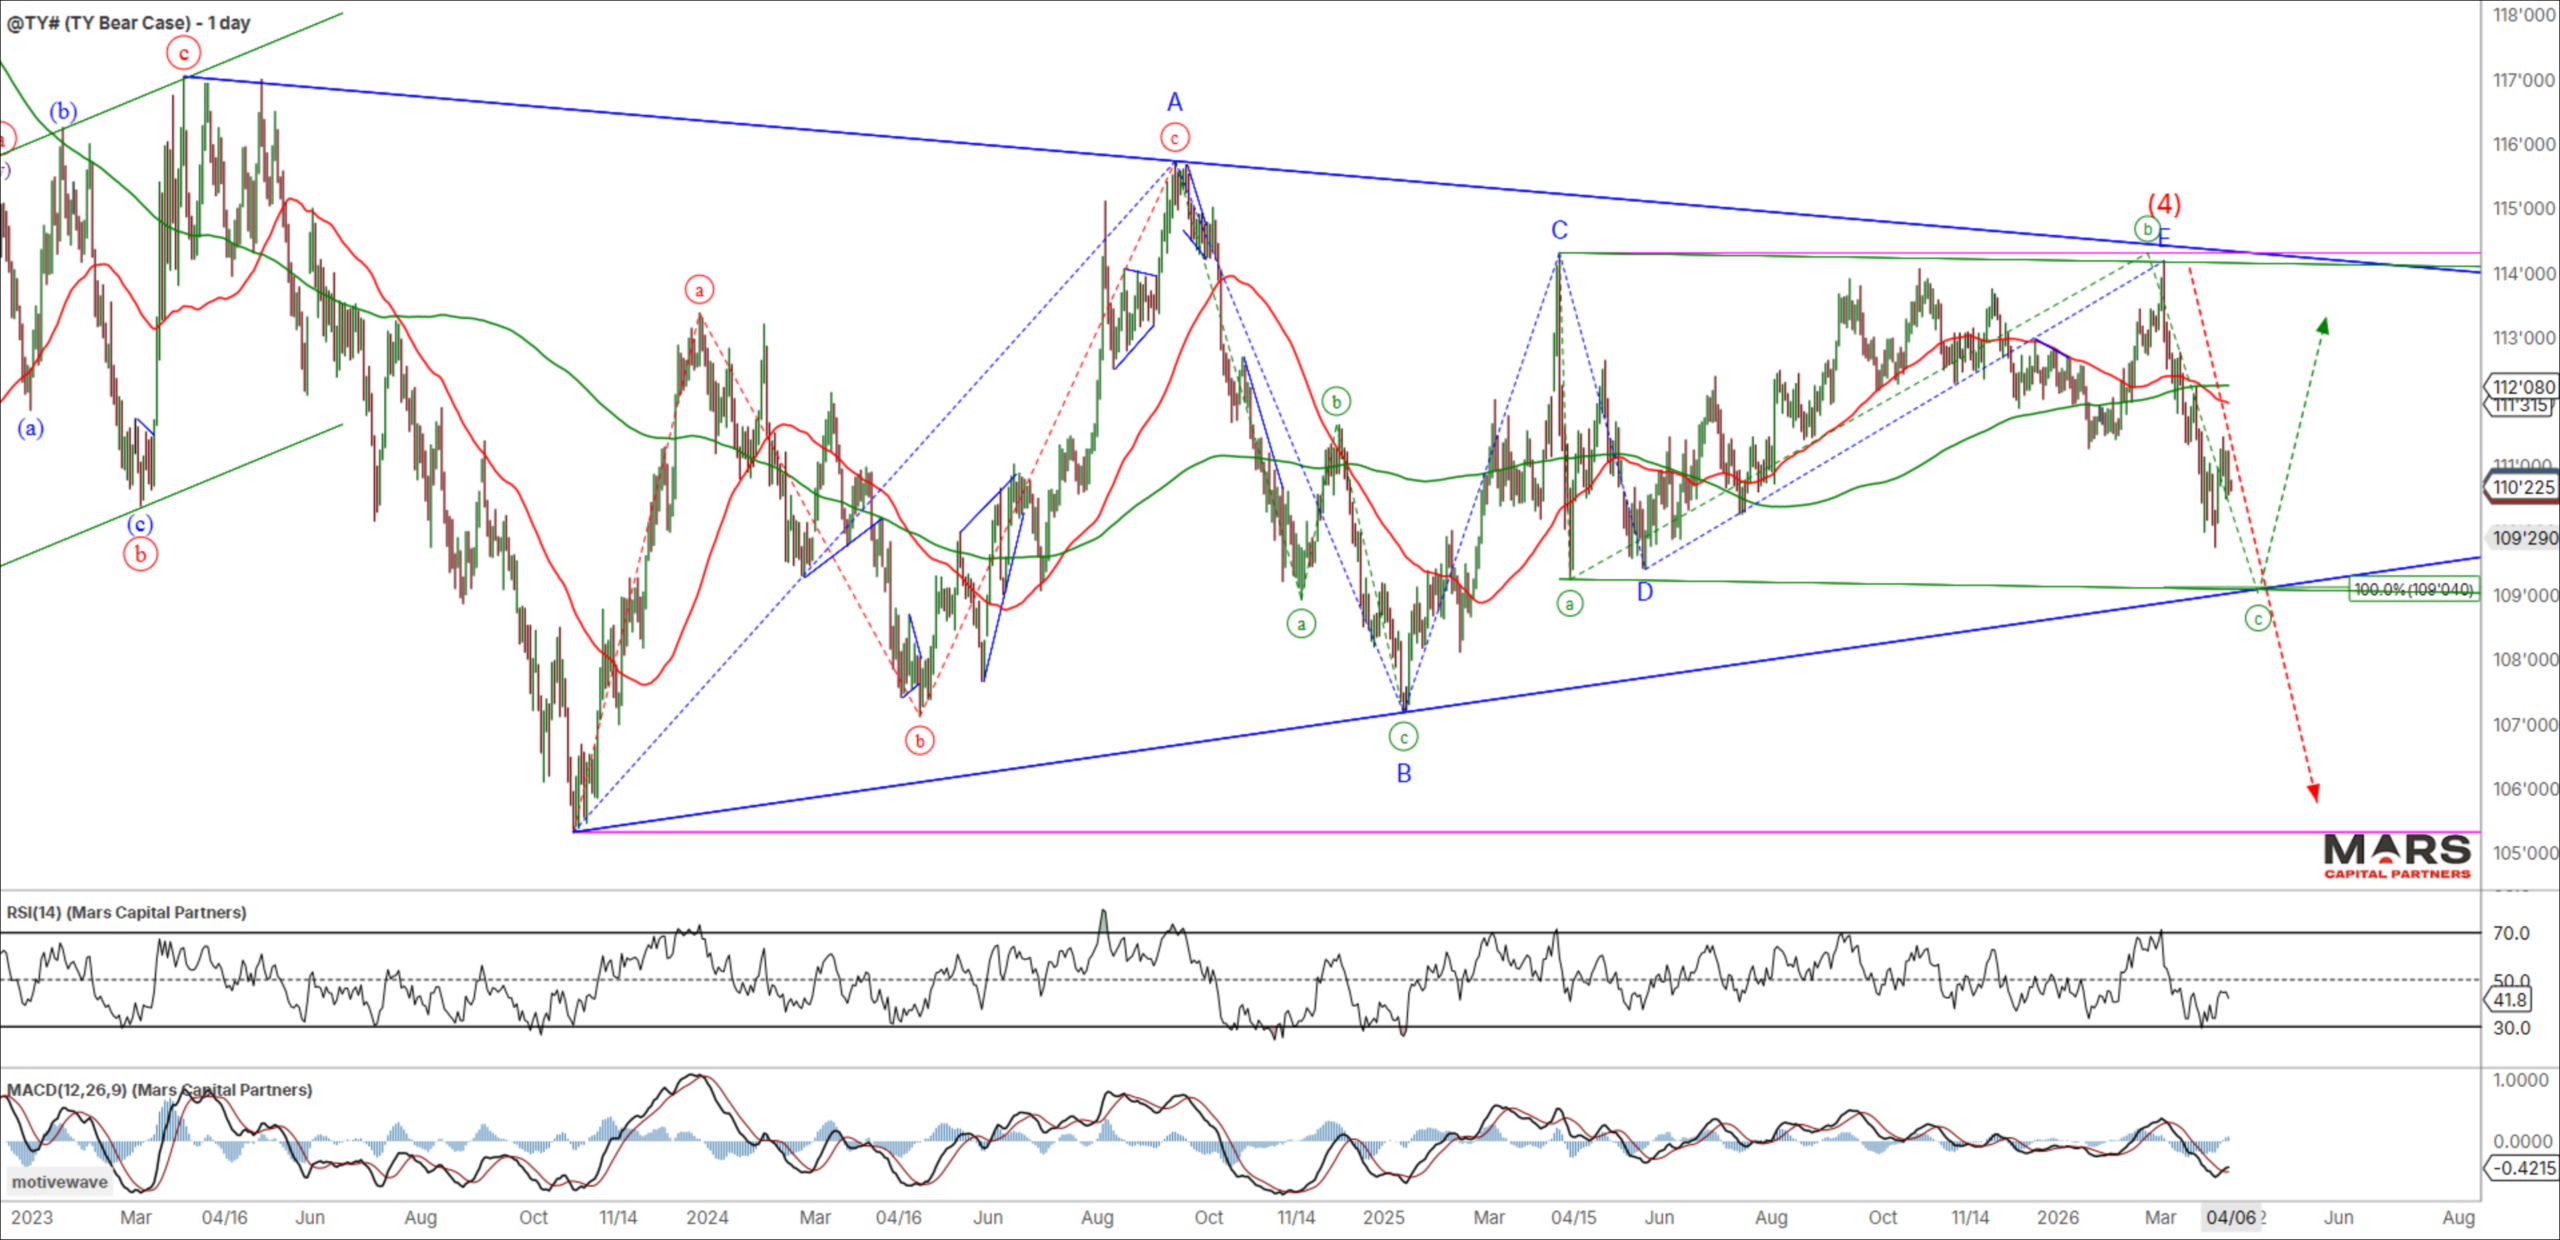
The US10yr / TY rebounded last week but remains short of measured targets and support in the 109 area. Bulls need to hold this trend support or risk an accelerated decline towards the 2023 lows. Bonds remain range bound within this triangle consolidation as the range racing continues. Two-way risks and range compression leads to expansion…
FX Markets – DXY Inflection
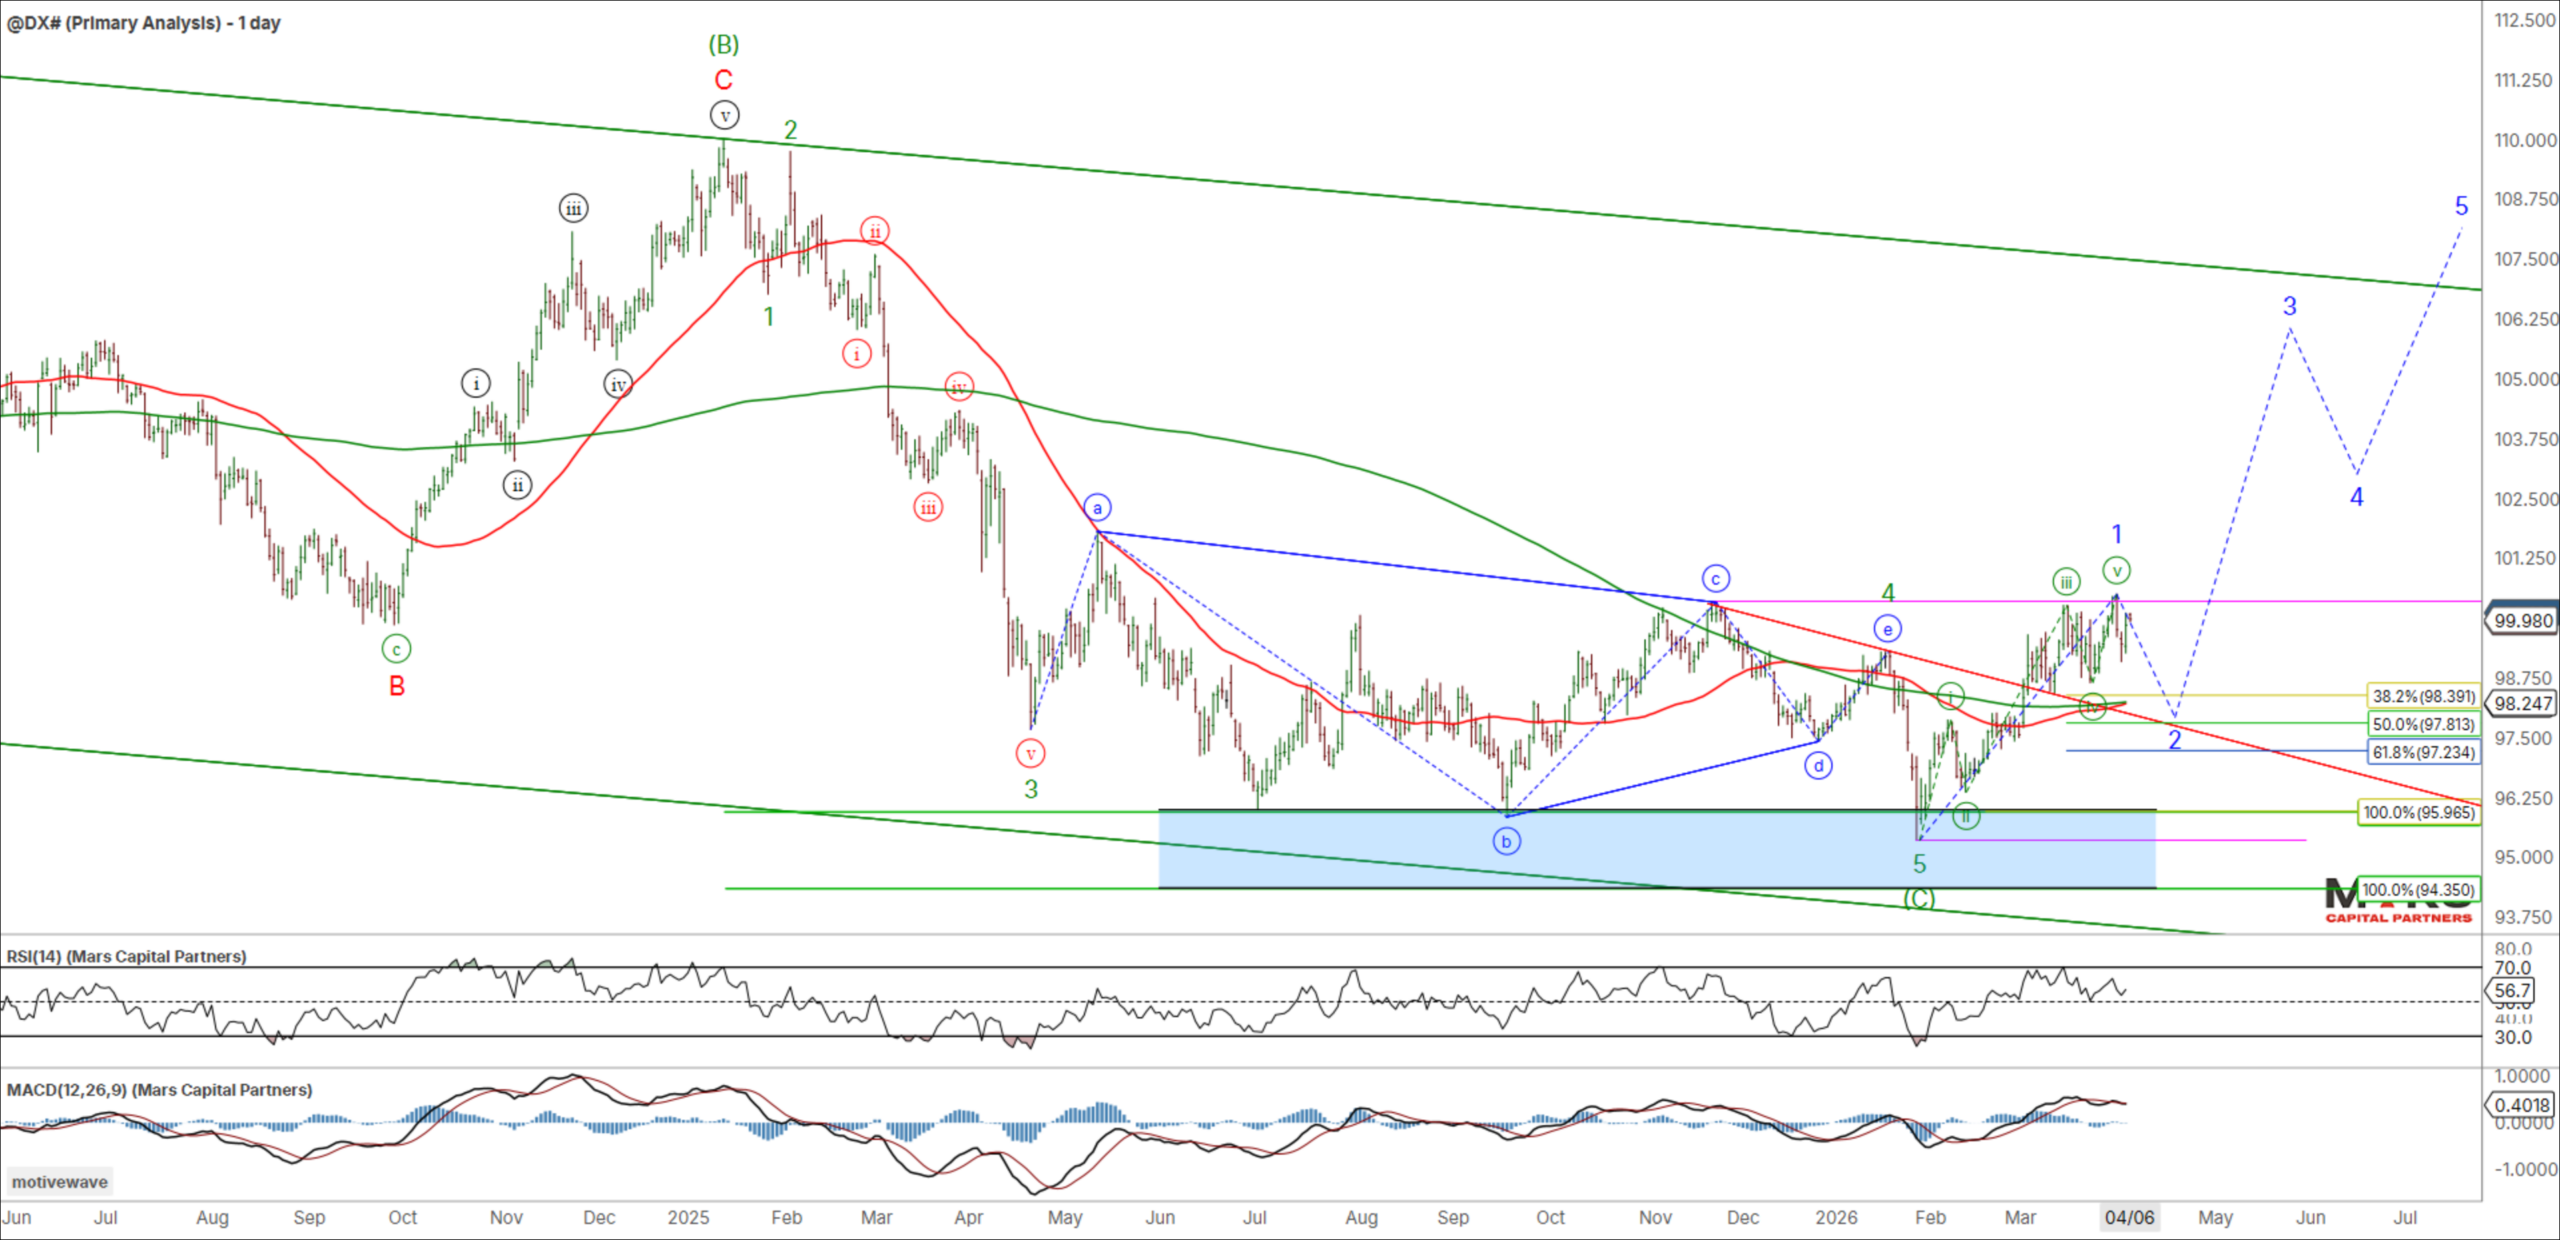
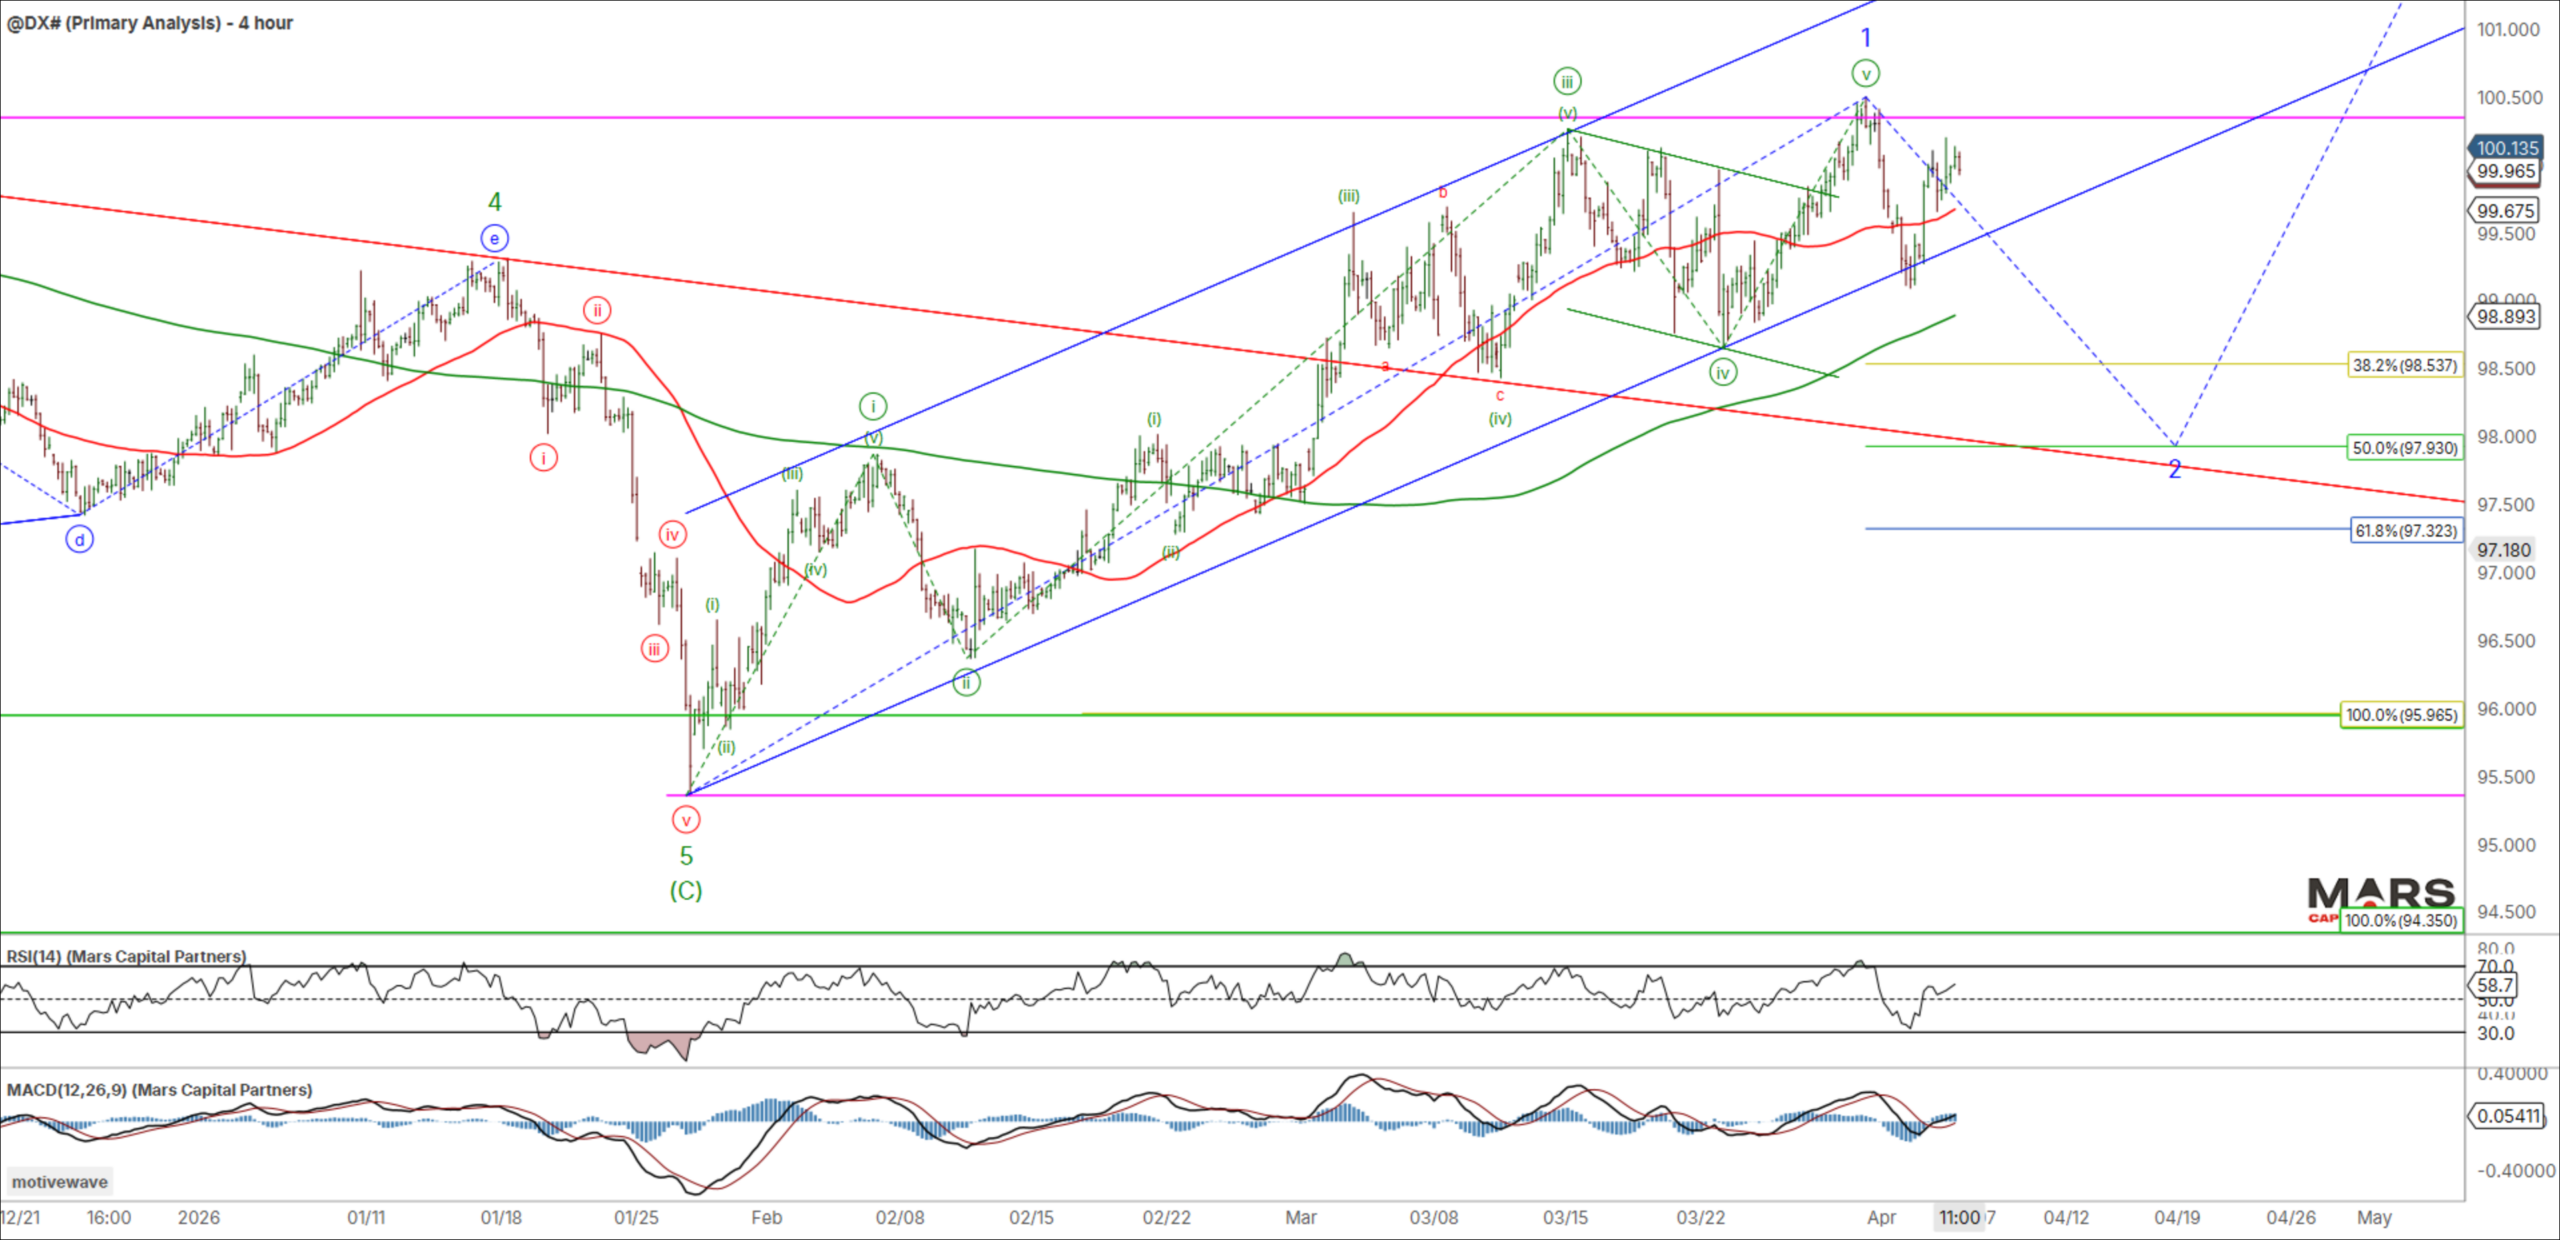
To the FX markets and the DXY pushed to marginal new highs and is testing resistance in the 100.35 area. While this rally can continue to extend immediately higher, the risk is a correction lower for wave 2 down. Support for the bullish trend remains lower in the 97.50-98.30 area of the 50 / 200 day sma and fib support. While we could see a near term correction lower, the bigger picture outlook remains bullish while the 95.36 swing lows hold.
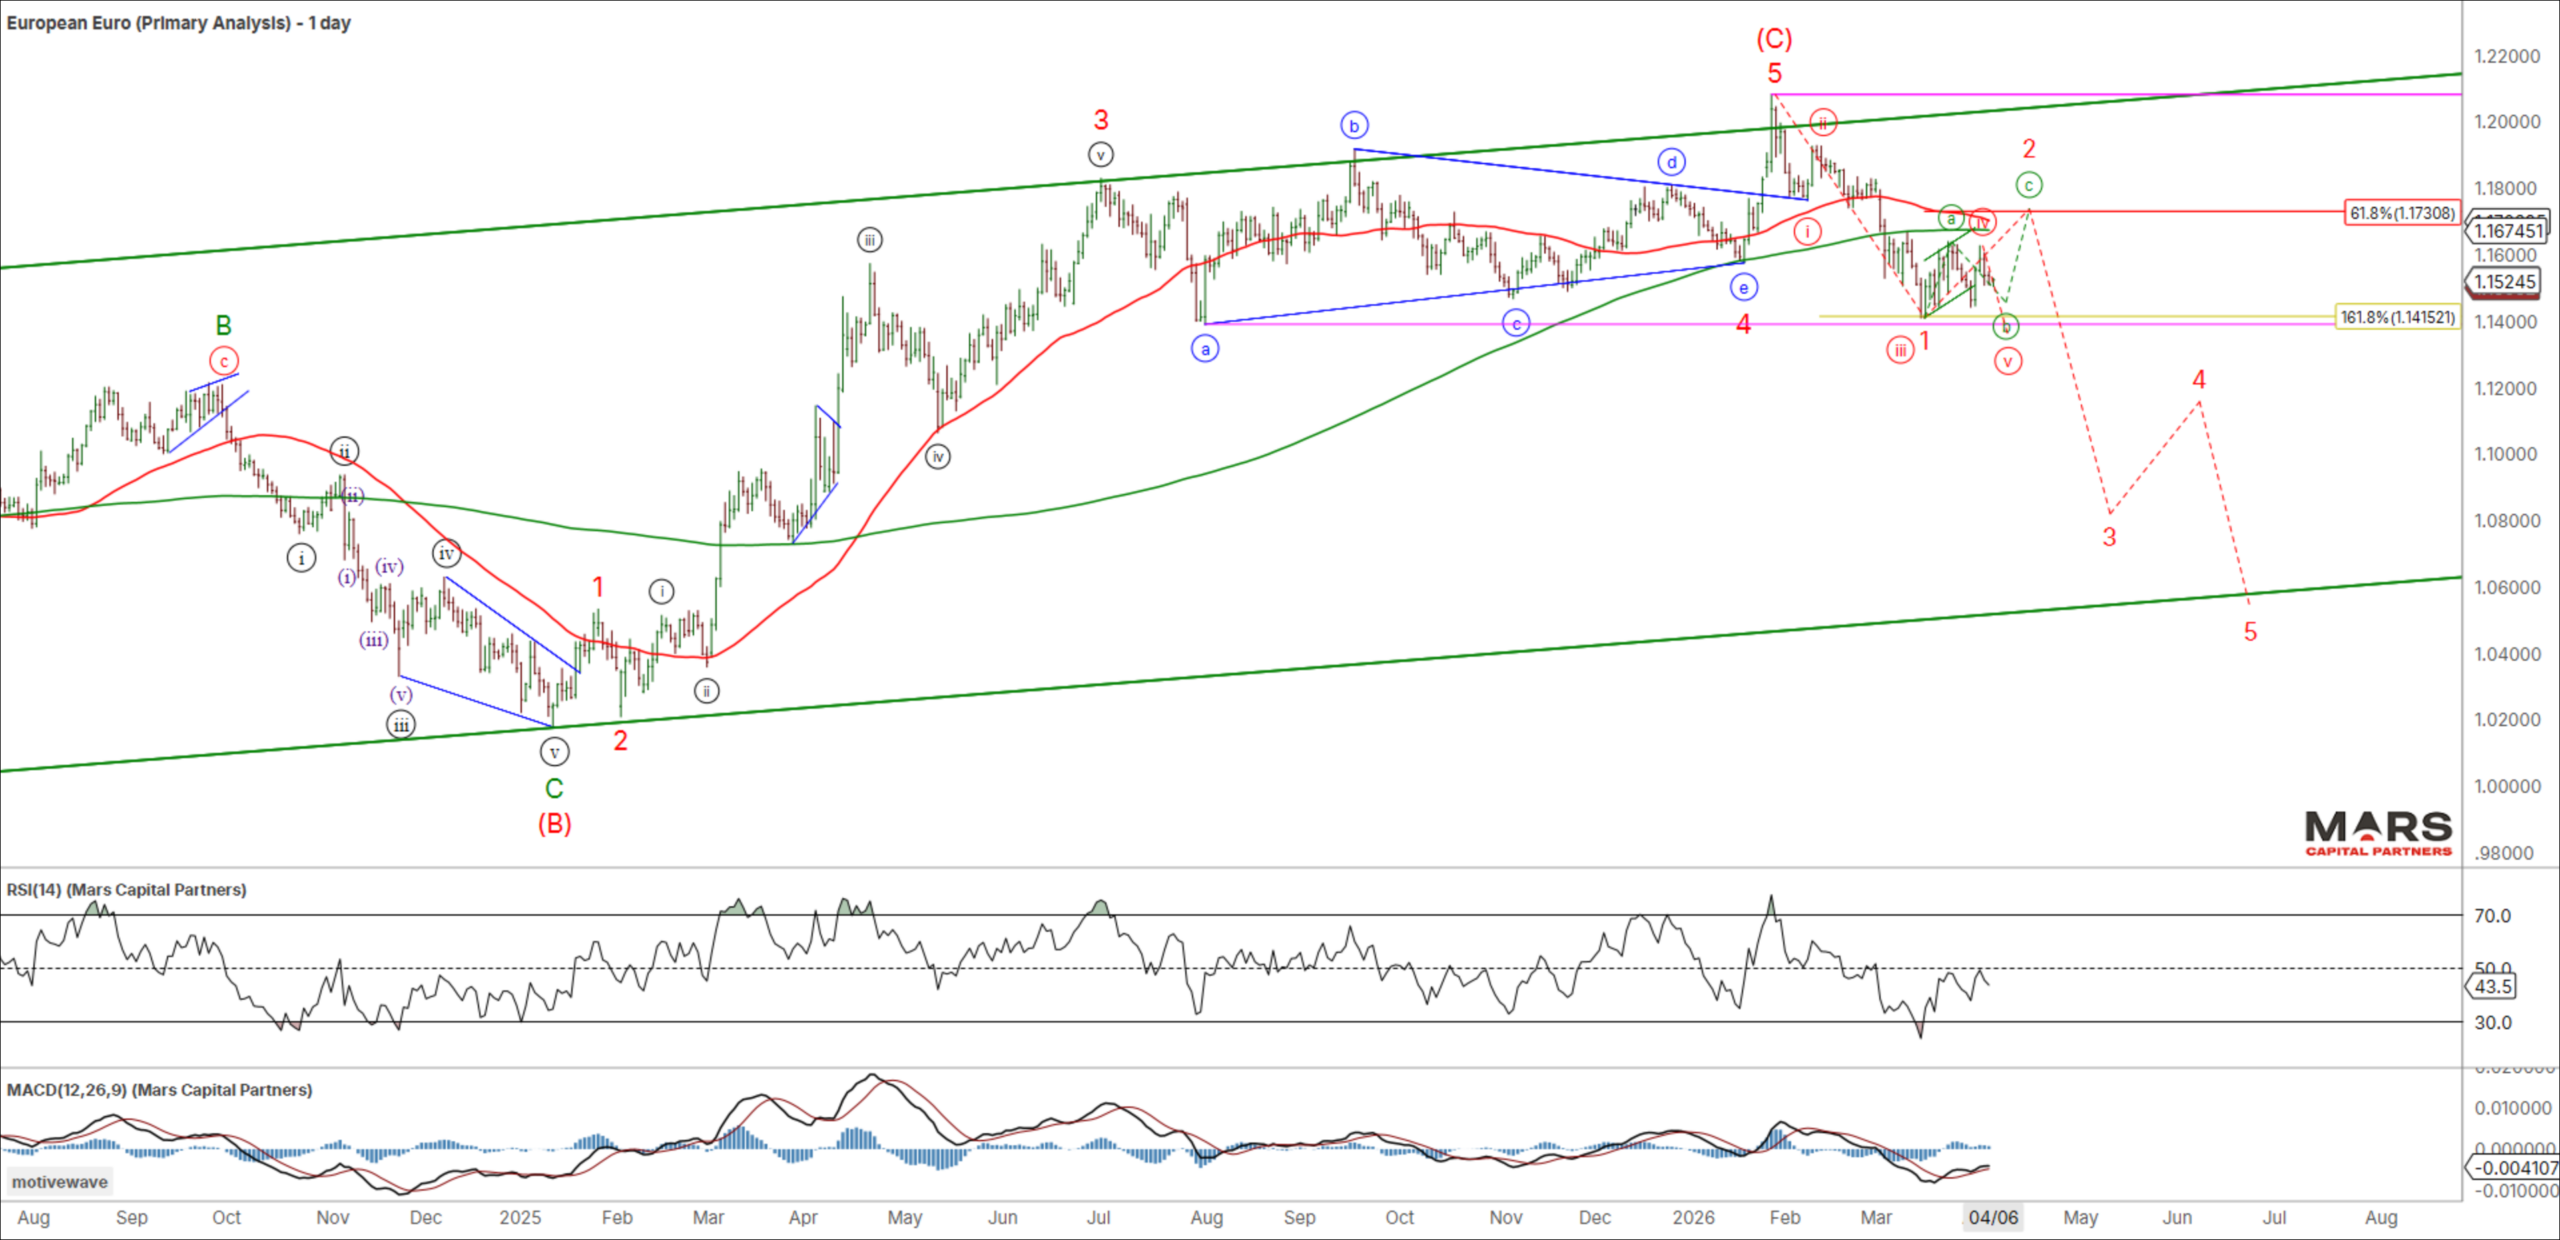
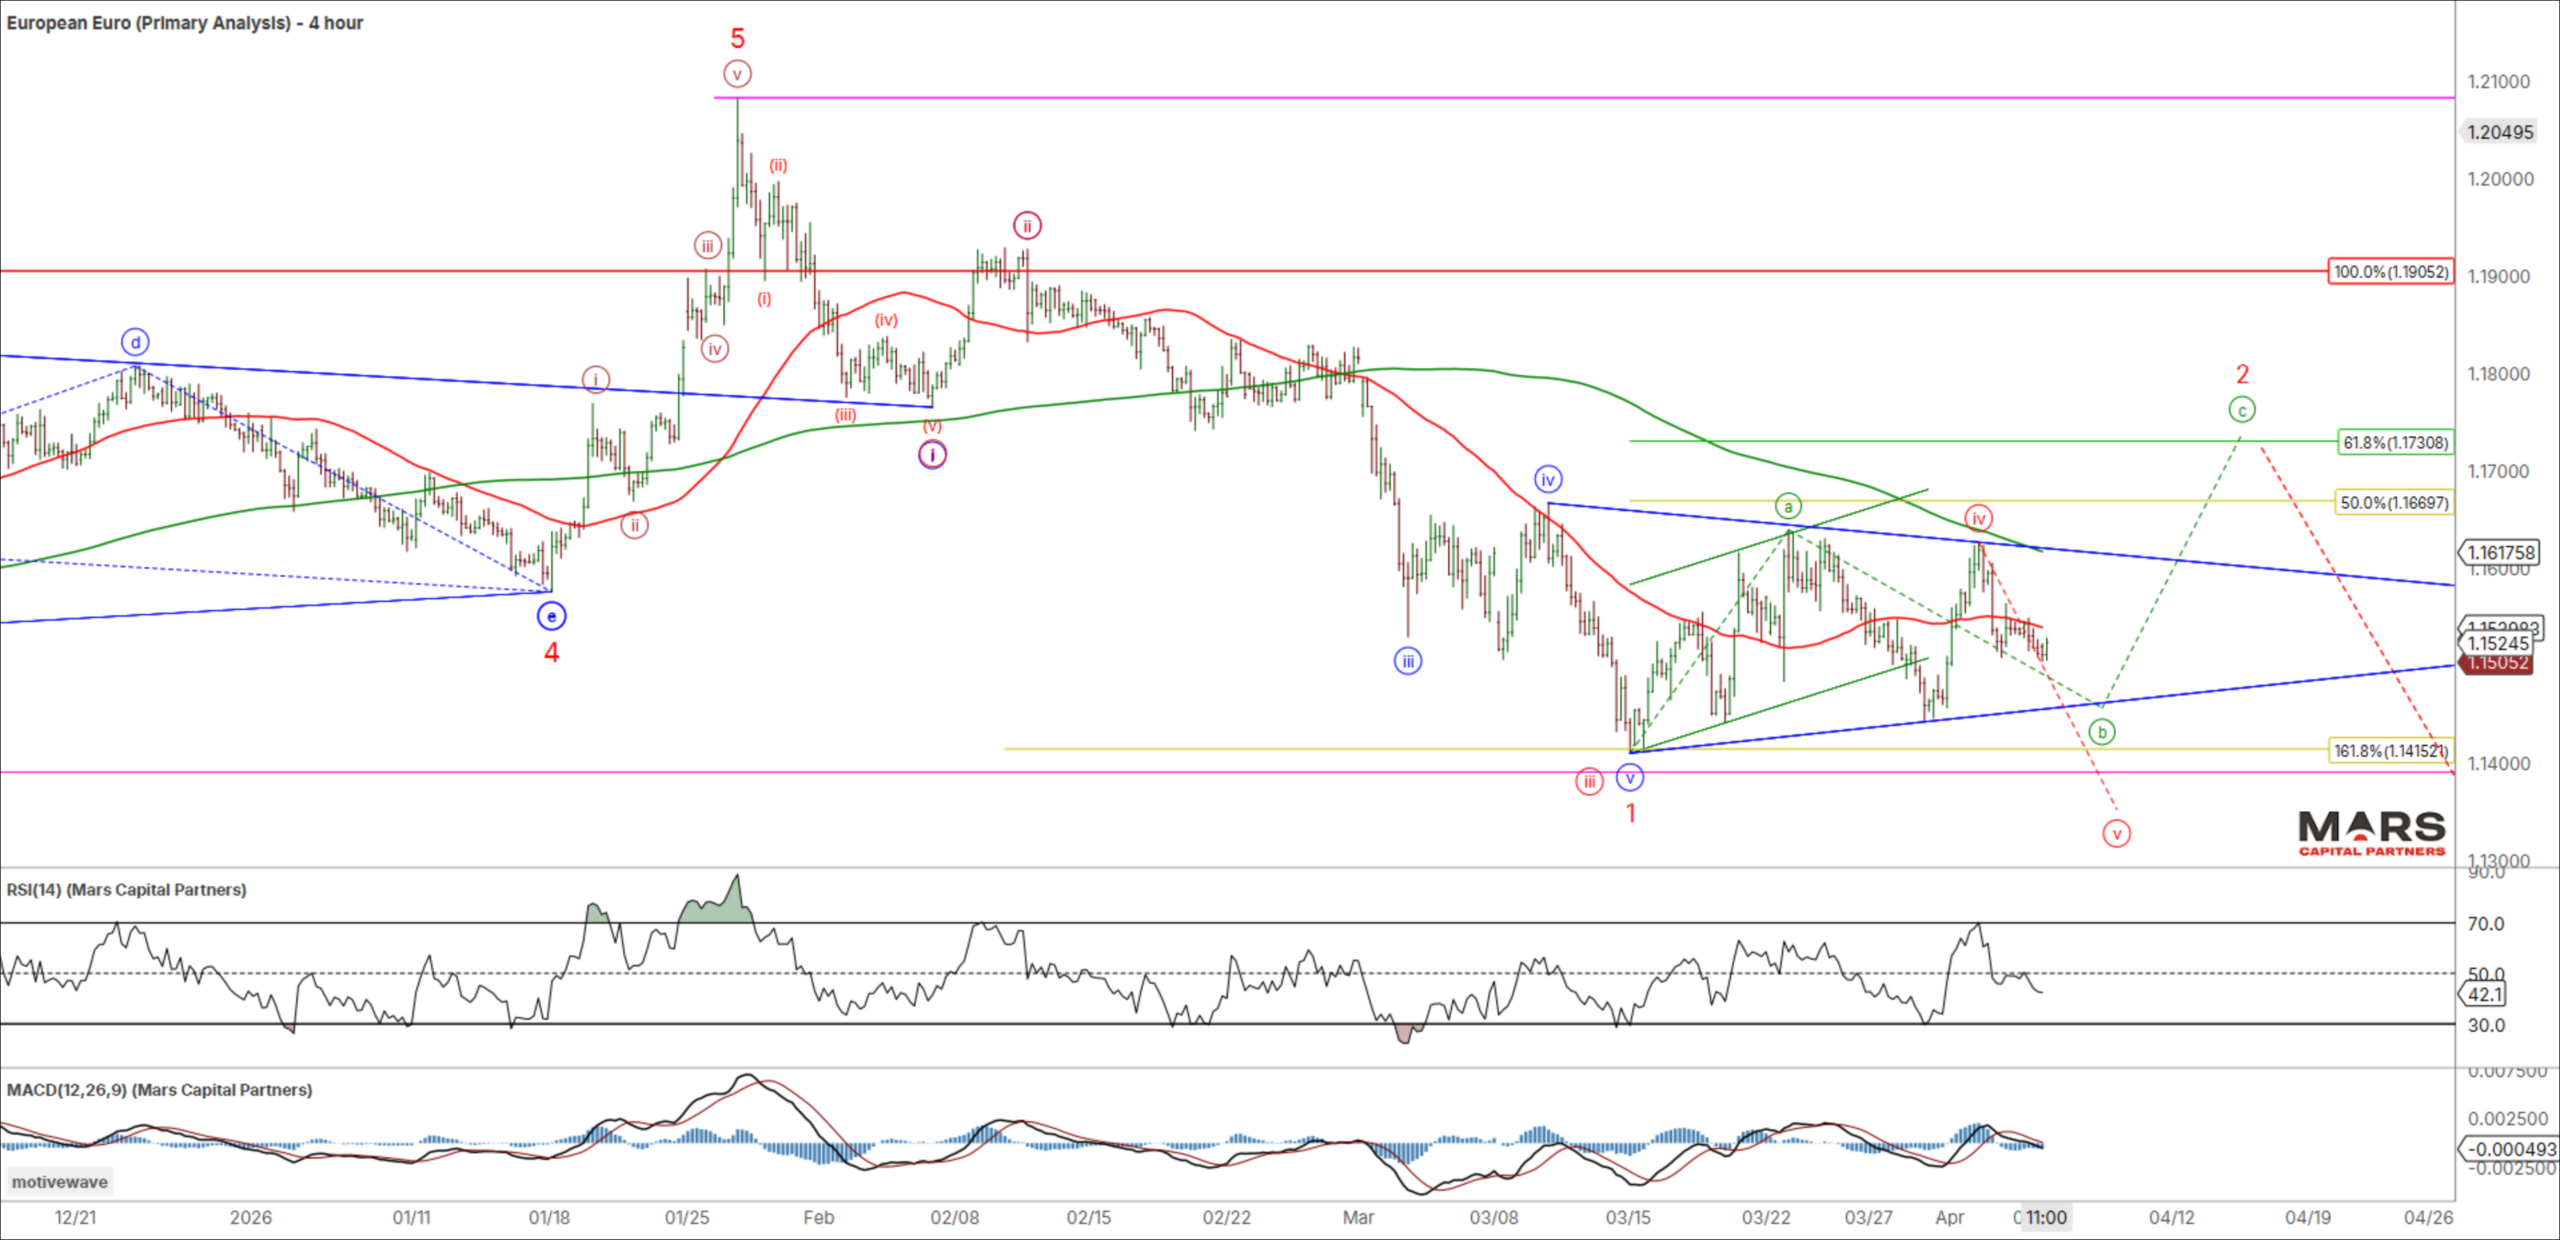
The Euro failed to confirm the DXY marginal new highs and remains range bound near term. The question is whether the Euro has completed its initial 5 wave decline or needs a final wave lower to complete. Strong support remains in the 1.14 area as we look for a corrective wave 2 rally to develop towards overhead resistance in the 1.1700-30 area. The outlook for the Euro remains bearish as we look for a resumption of the big picture bear trend.
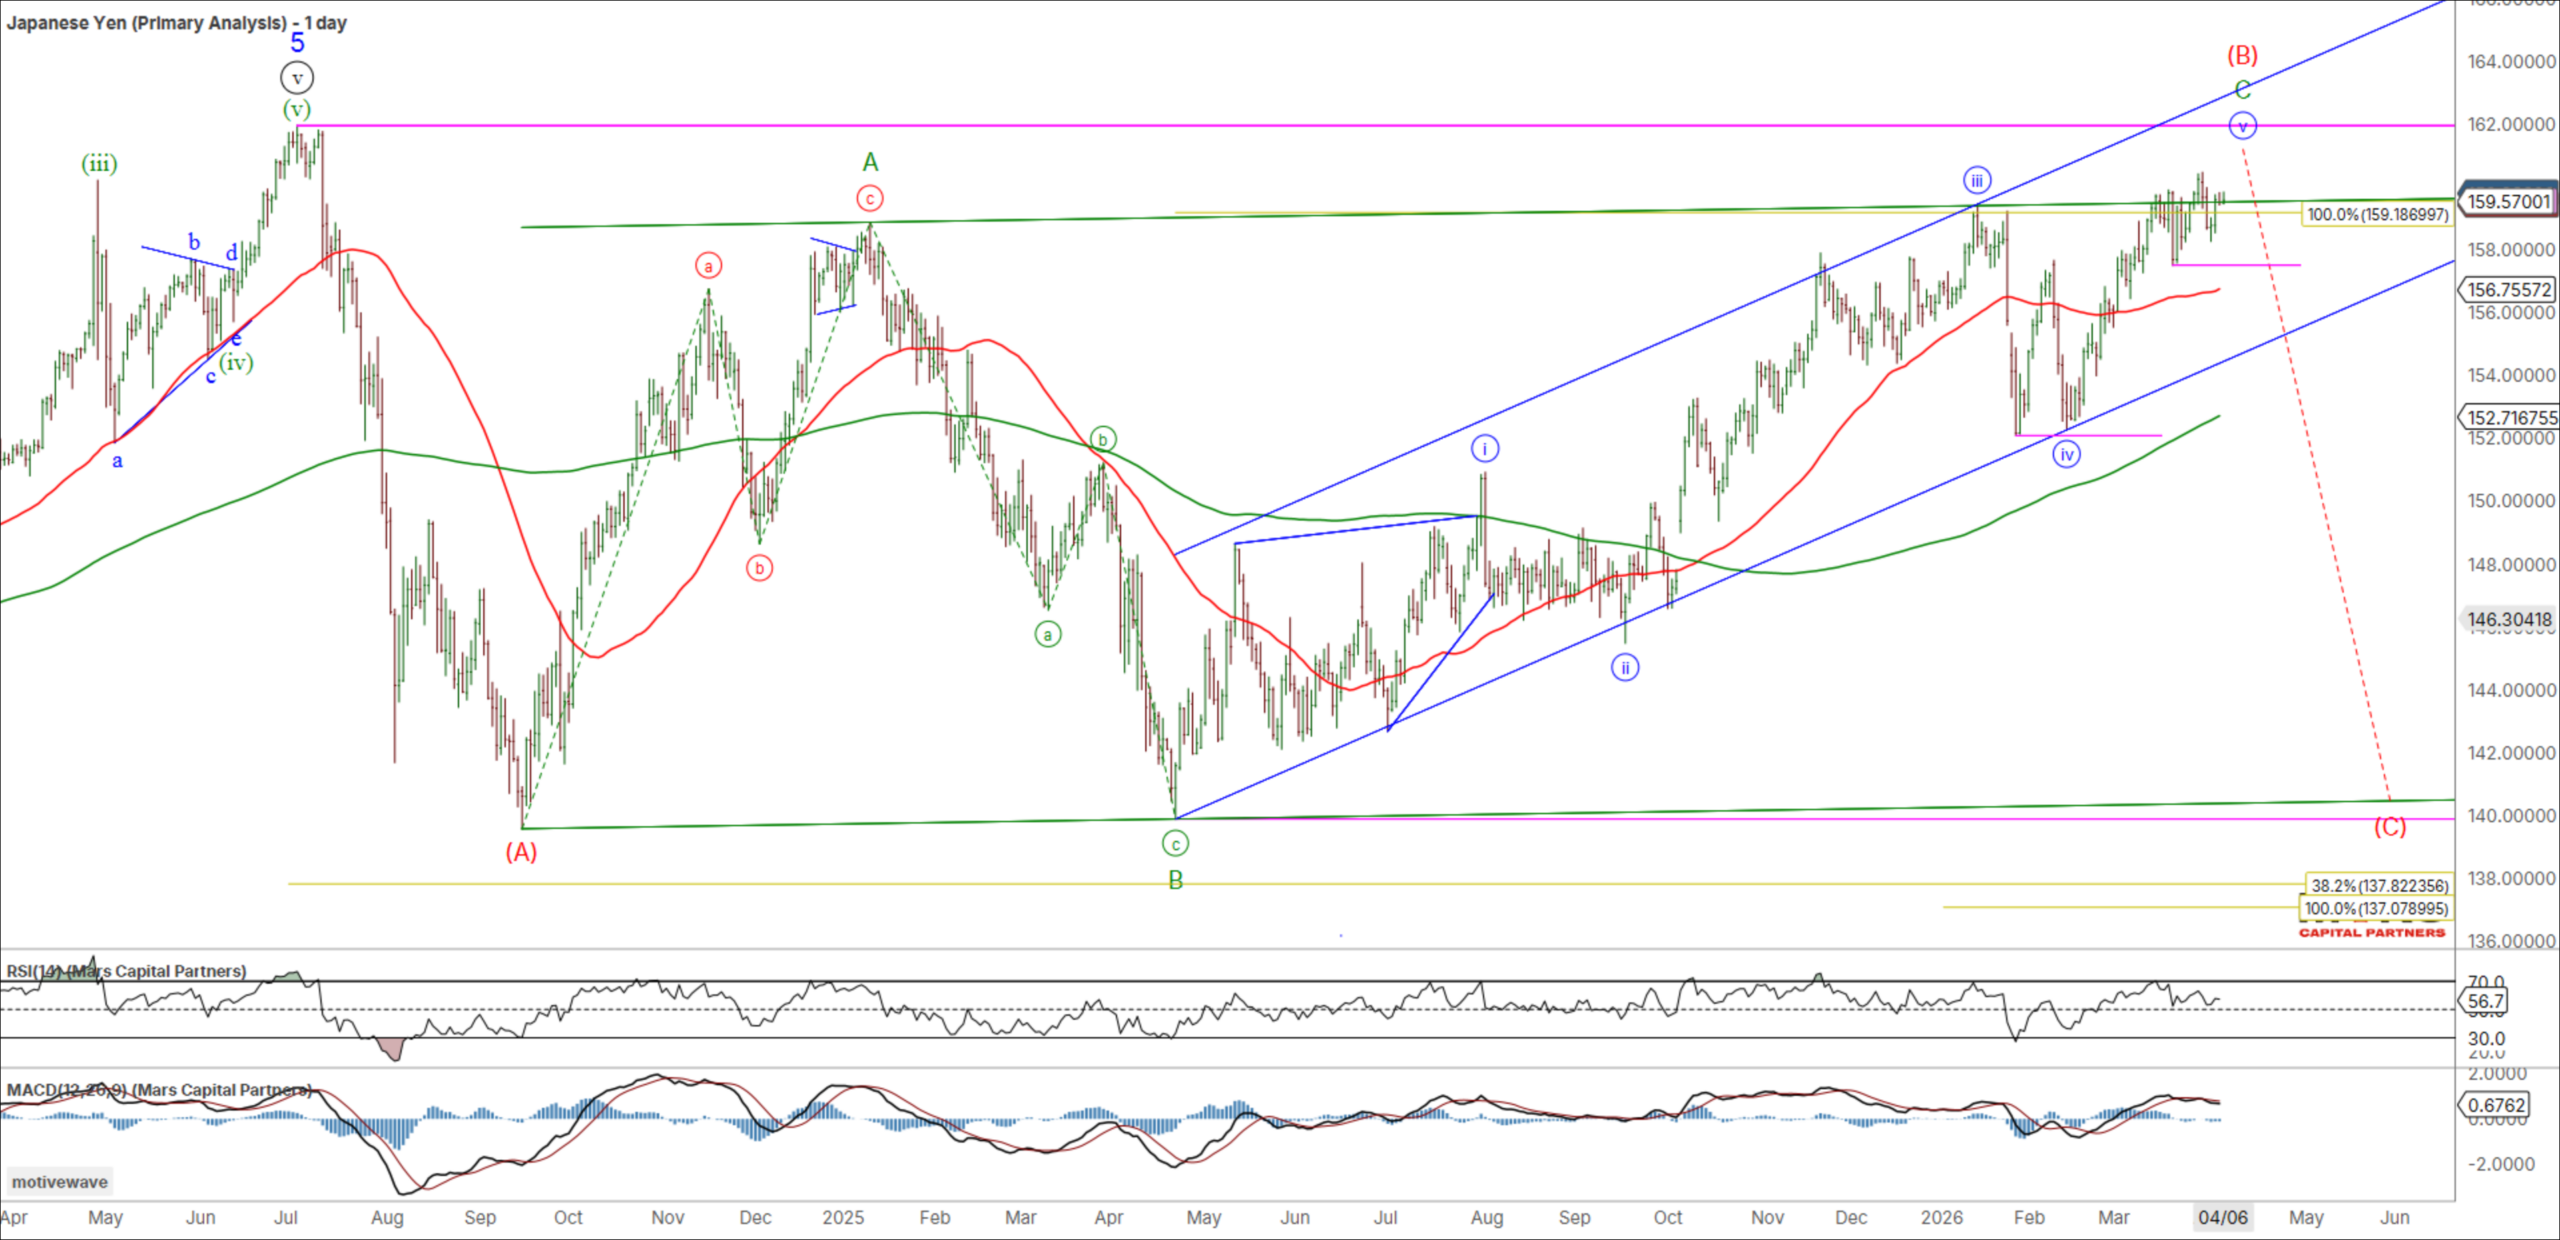
The USDJPY pushed marginally higher last week but remains below key resistance in the 162 area. We do not have confirmation of a tradable top or bear reversal as bulls and bears fight it out. Bears need to reverse this rally and break this series of higher highs and higher lows to help confirm a bearish change in trend. We remain bearish against the 162 highs as we look for a large red wave (C) decline towards measured targets in the 138-140 area. Trade above 162 invalidates the bear case.
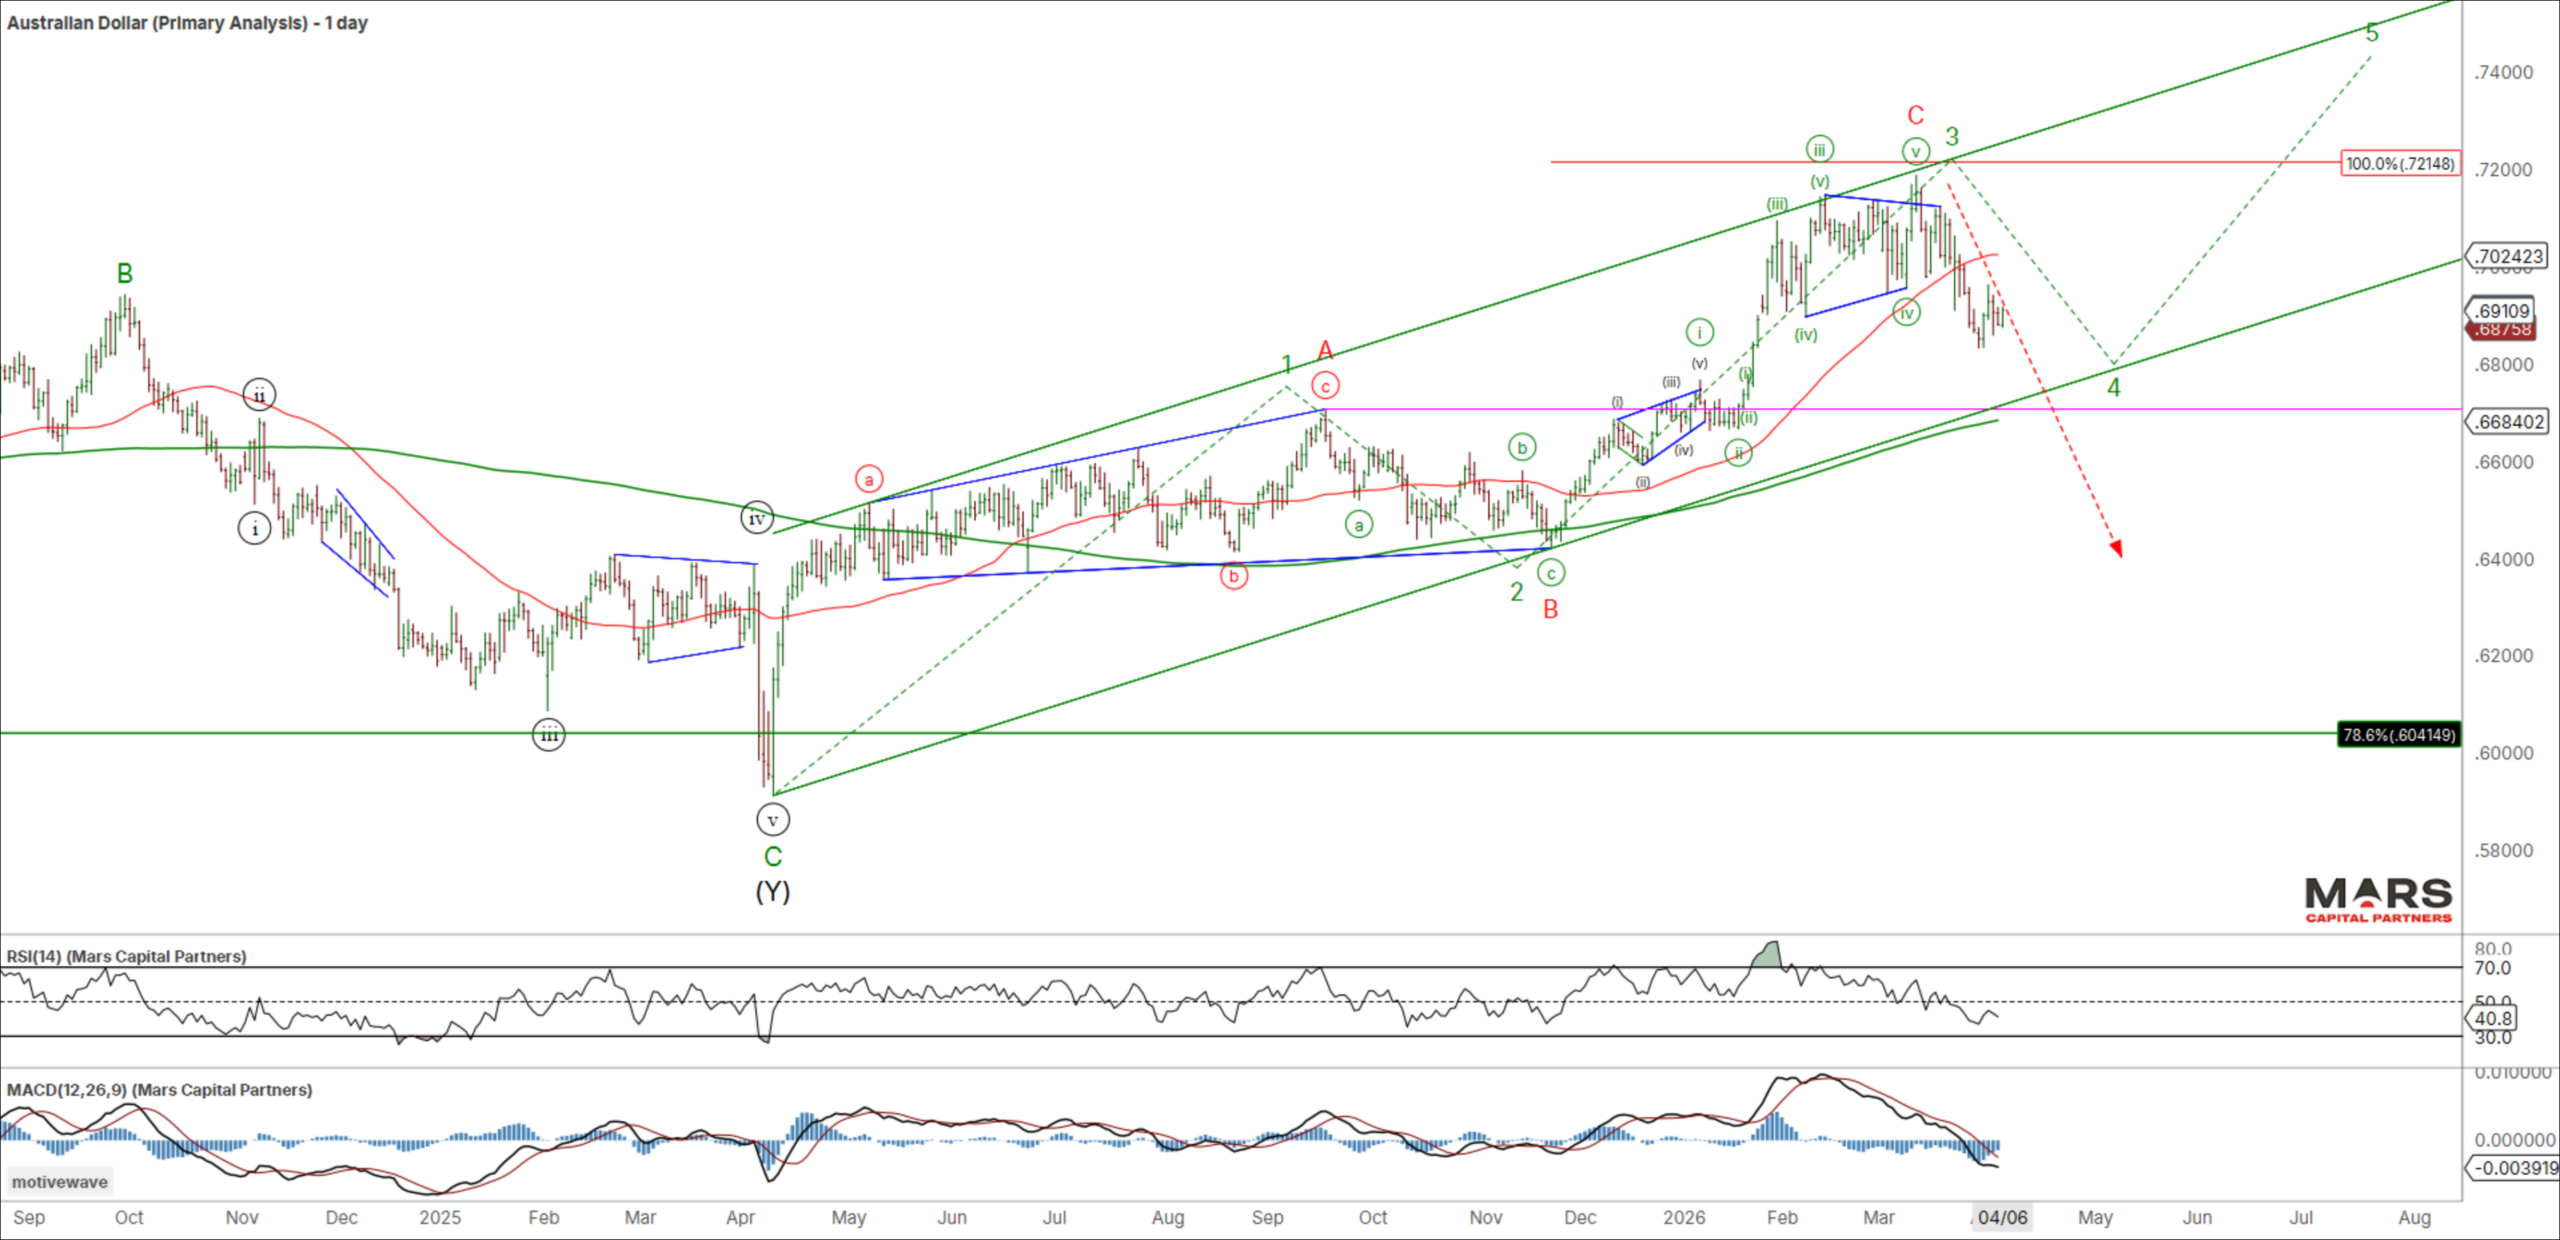
The Aussie$ extended lower last week as expected after potentially completing a corrective 3 wave rally from the 2025 lows. Bears need to extend this decline through overlap support in the 0.67 area to help confirm a more bearish outlook. Bulls need to hold this overlap support in the 0.67 area and extend higher above 0.72 resistance to help confirm a bigger picture bullish outlook.
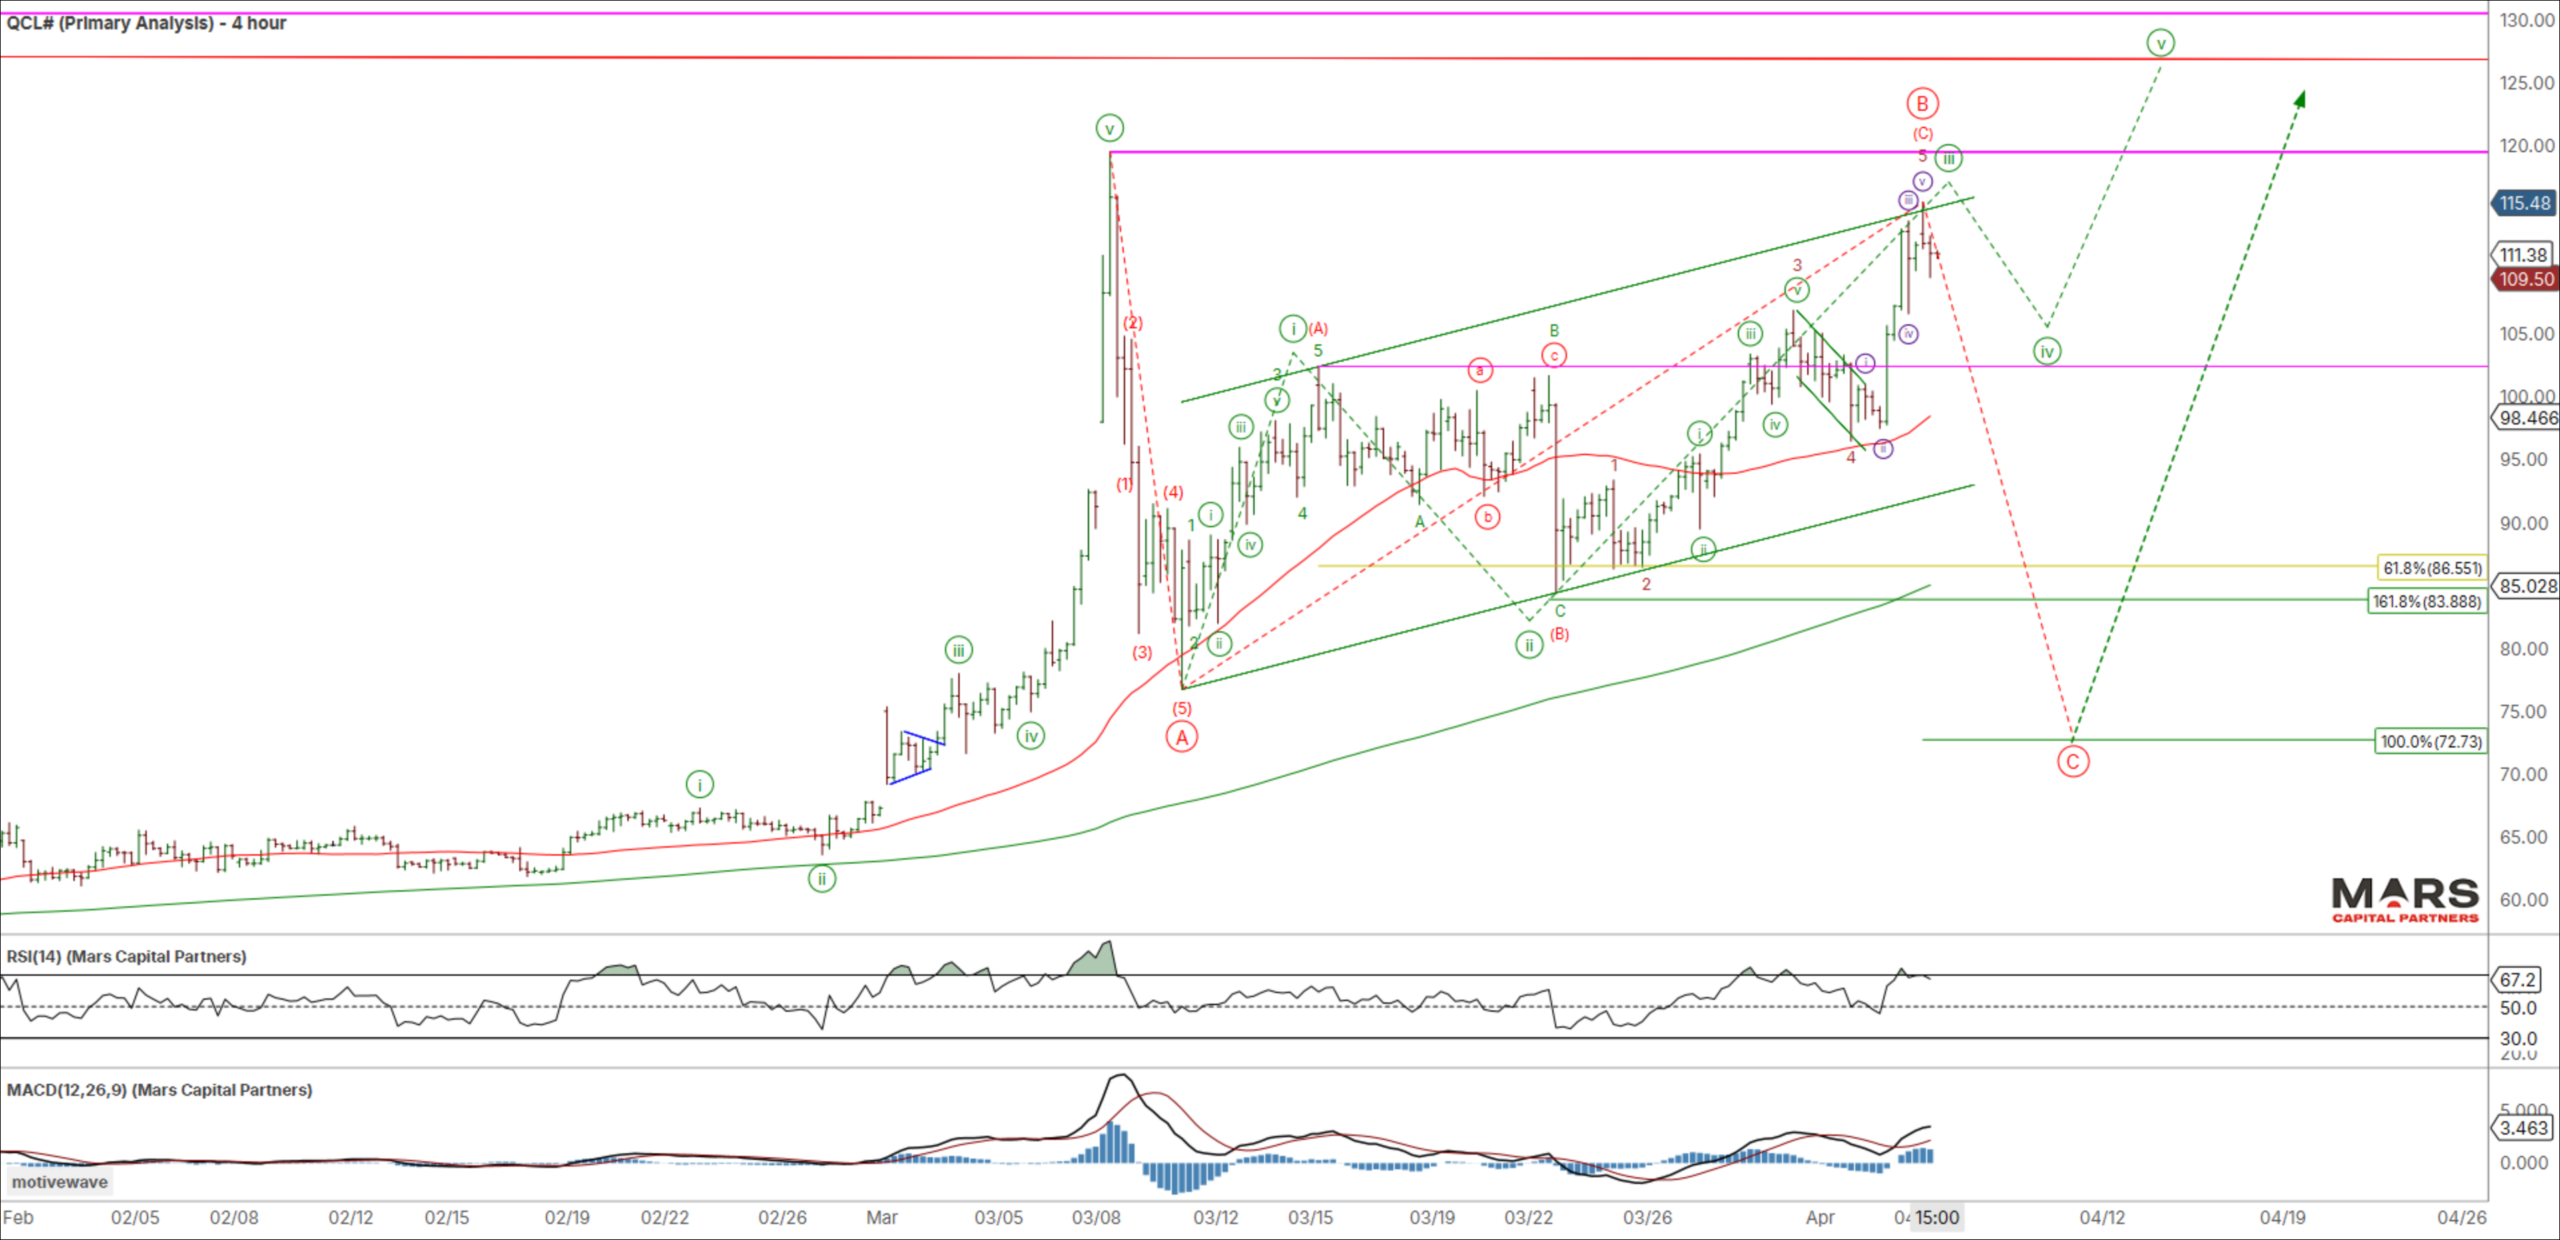
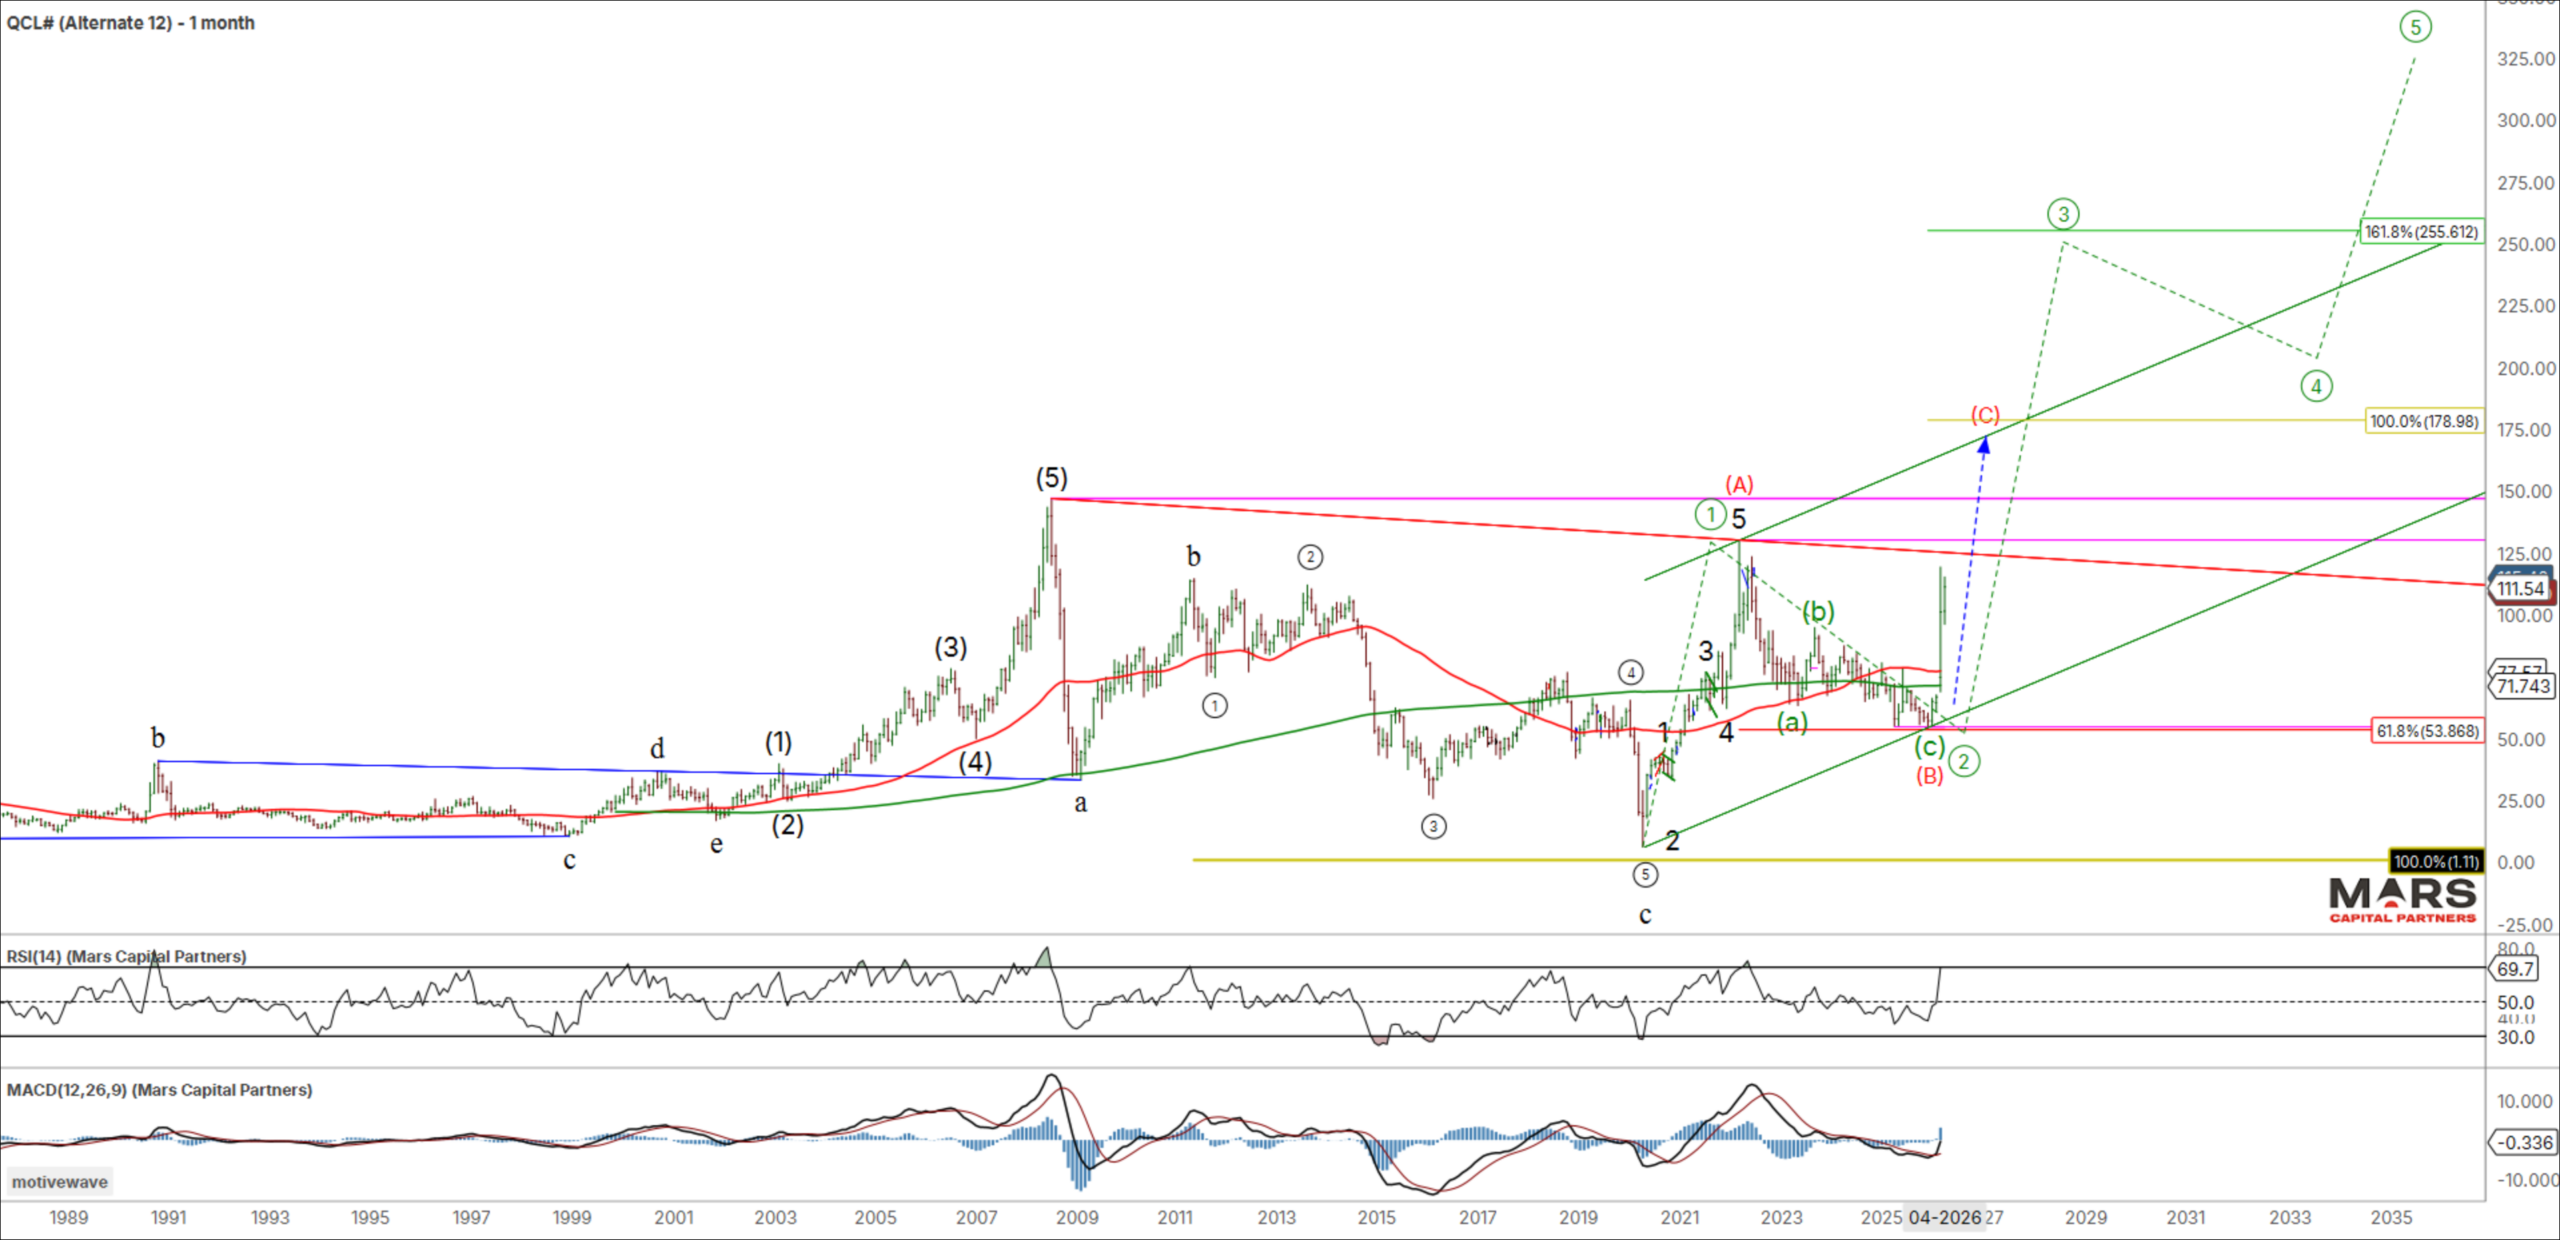
Commodity Markets – CL Inflection
To the commodity markets and Crude Oil is testing recent swing highs at a key inflection. The big picture rally appears incomplete but near term risks a sharp bear reversal for wave (c) down. The extreme volatility and uncertainty is resulting in impulsive rallies and declines opening the door to two-way risk. Bears need to reverse this rally back below the 102.44 overlap to help confirm a counter-trend rally. Bulls need to hold this overlap support to extend higher in a final green wave (v) rally. Either way, the risk remains for a continued rally to new ATH’s consistent with our long term outlook.
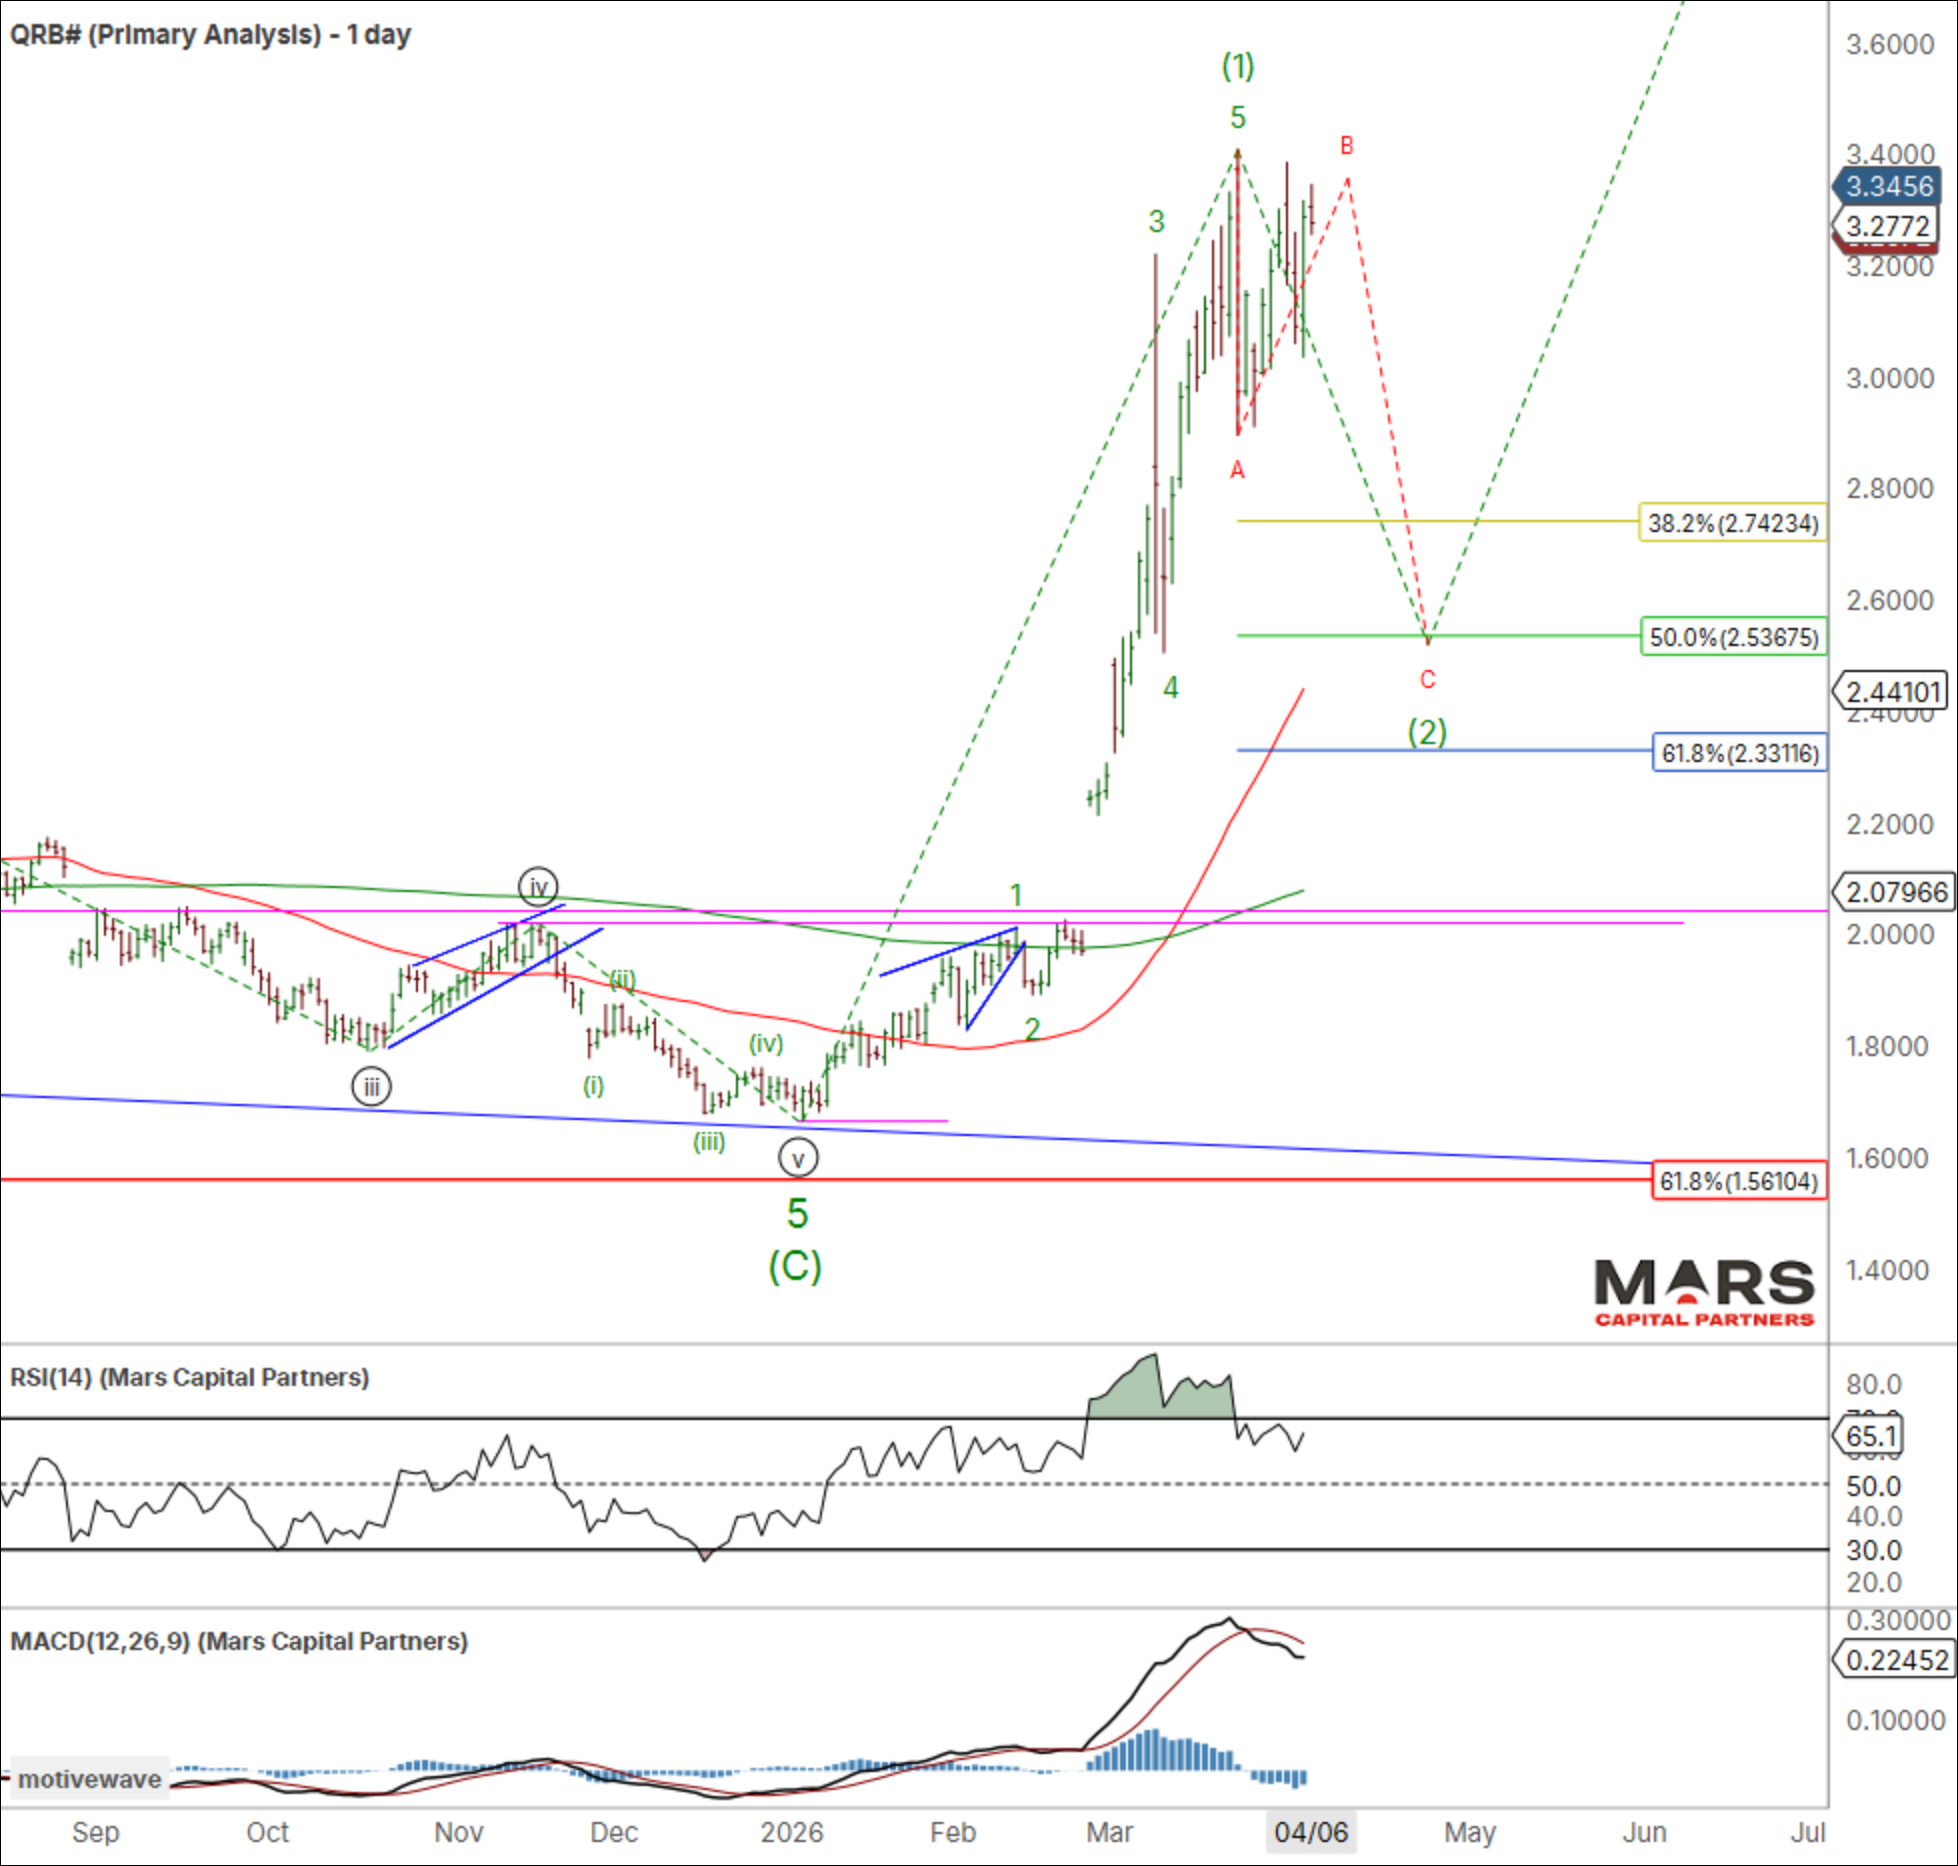
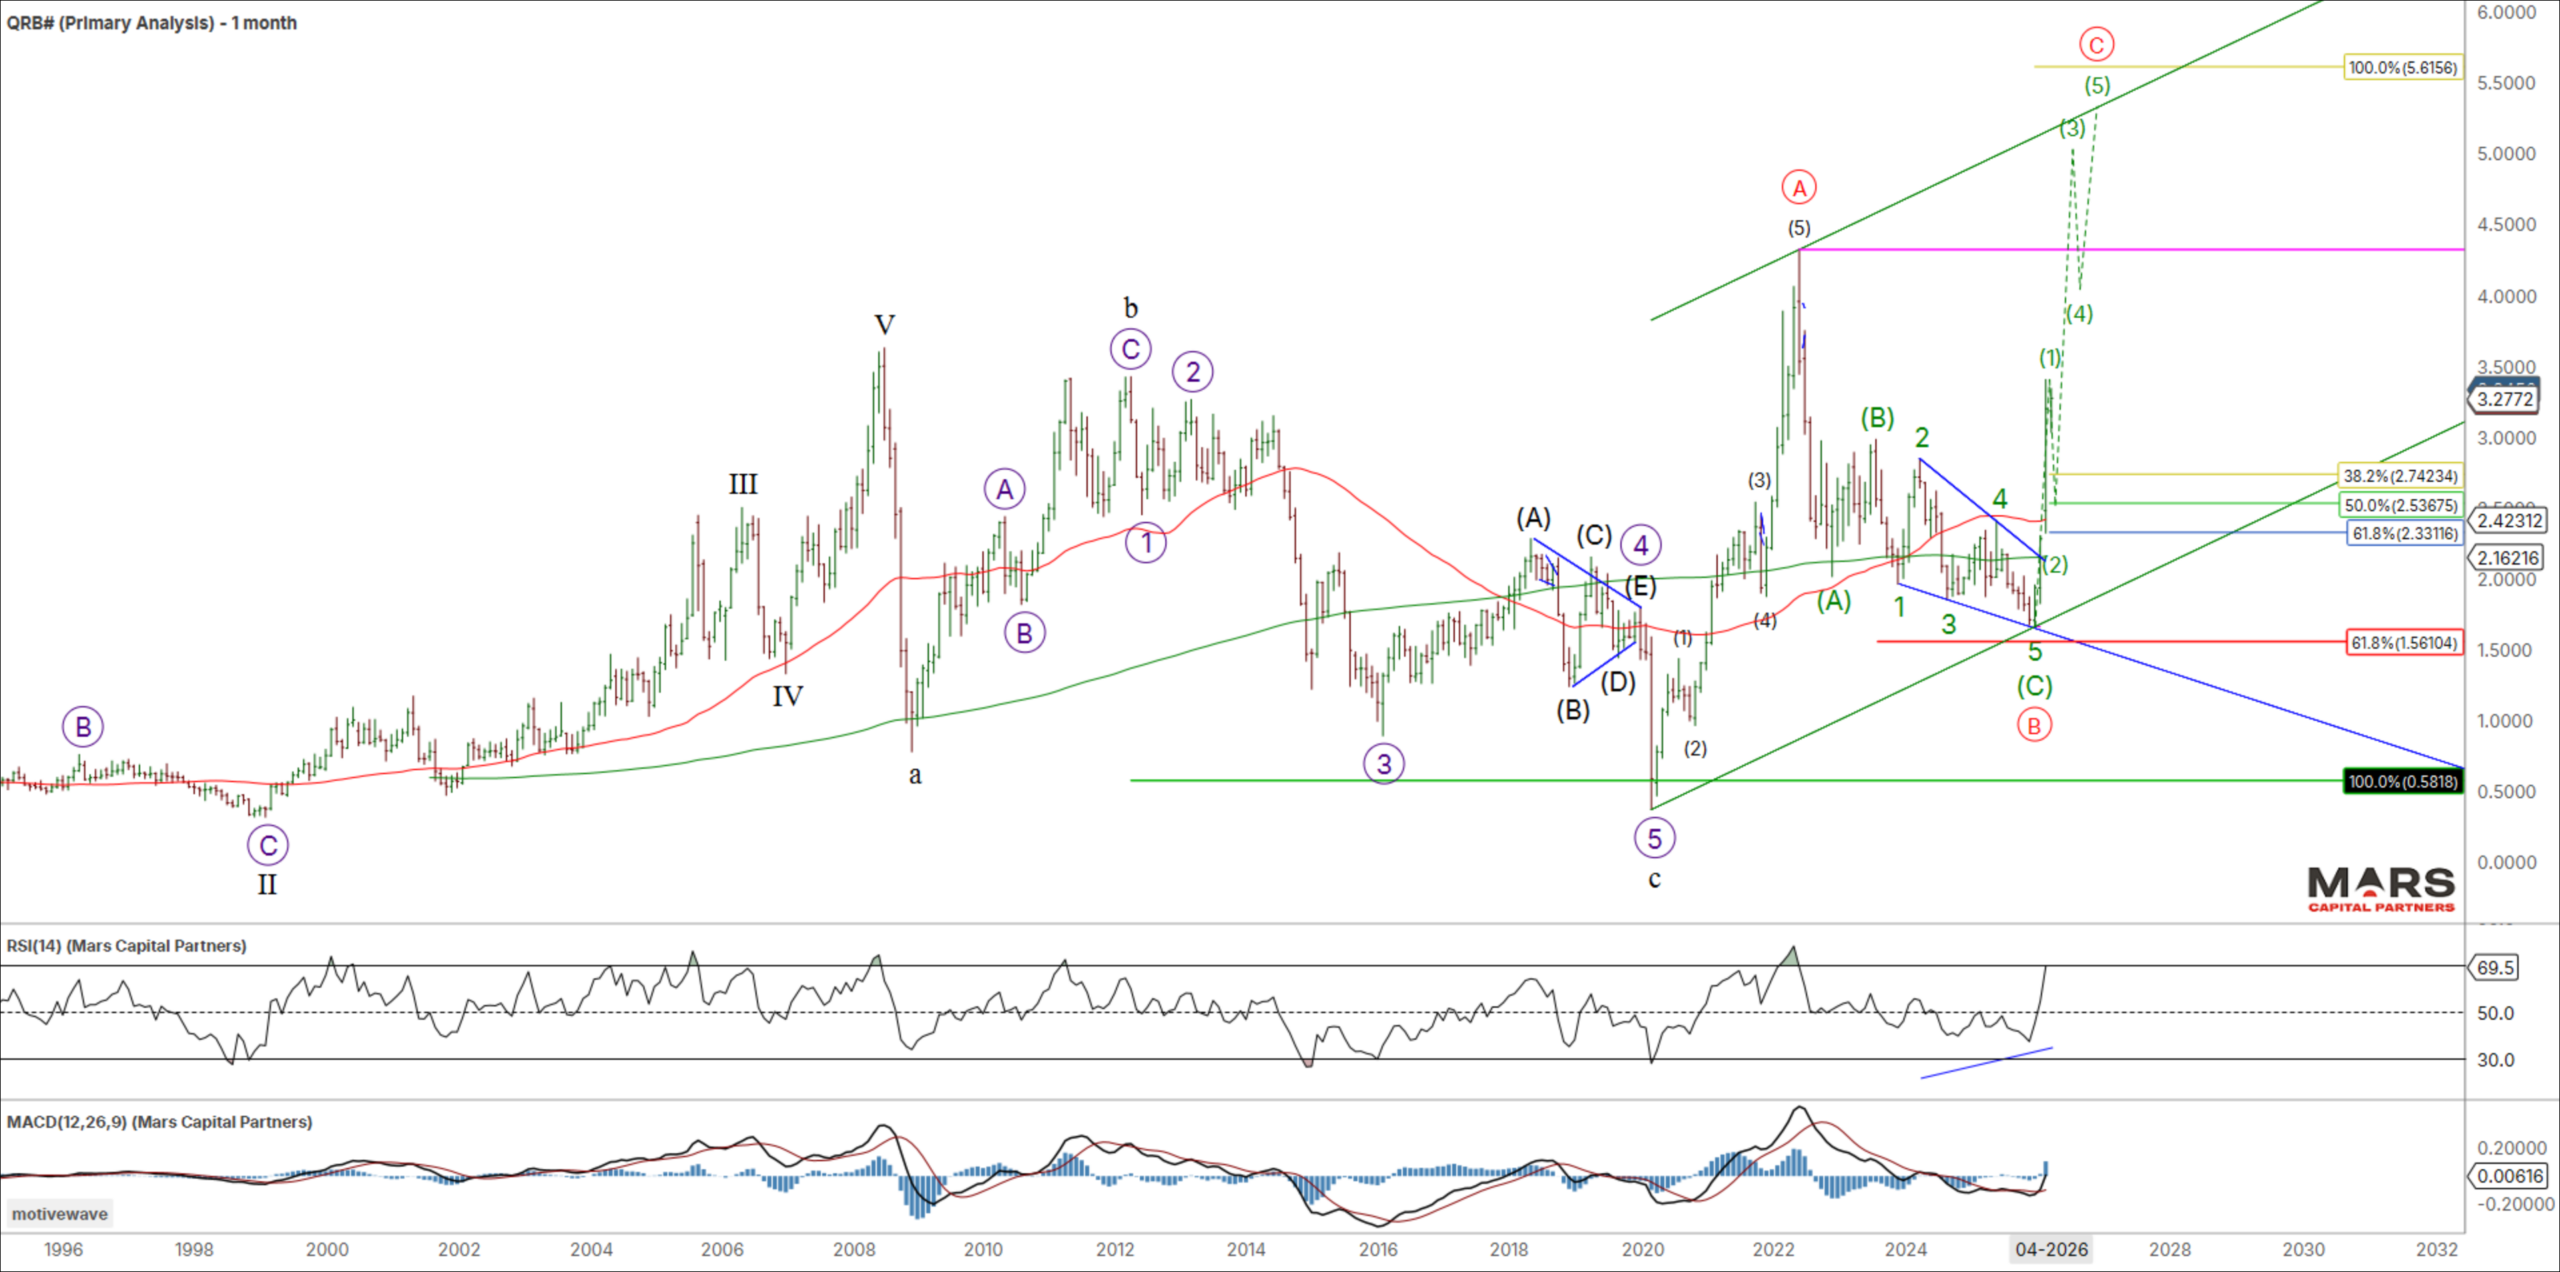
RBOB has enough waves in place to complete an initial impulsive 5 wave rally with the near term risk of a corrective decline. While it could extend immediately higher, the risk is a wave (c) of 2 decline in line with the CL bear case. Strong support remains lower in the 2.50 area of the 50 day sma. Near term downside risk within a bigger picture bullish outlook.
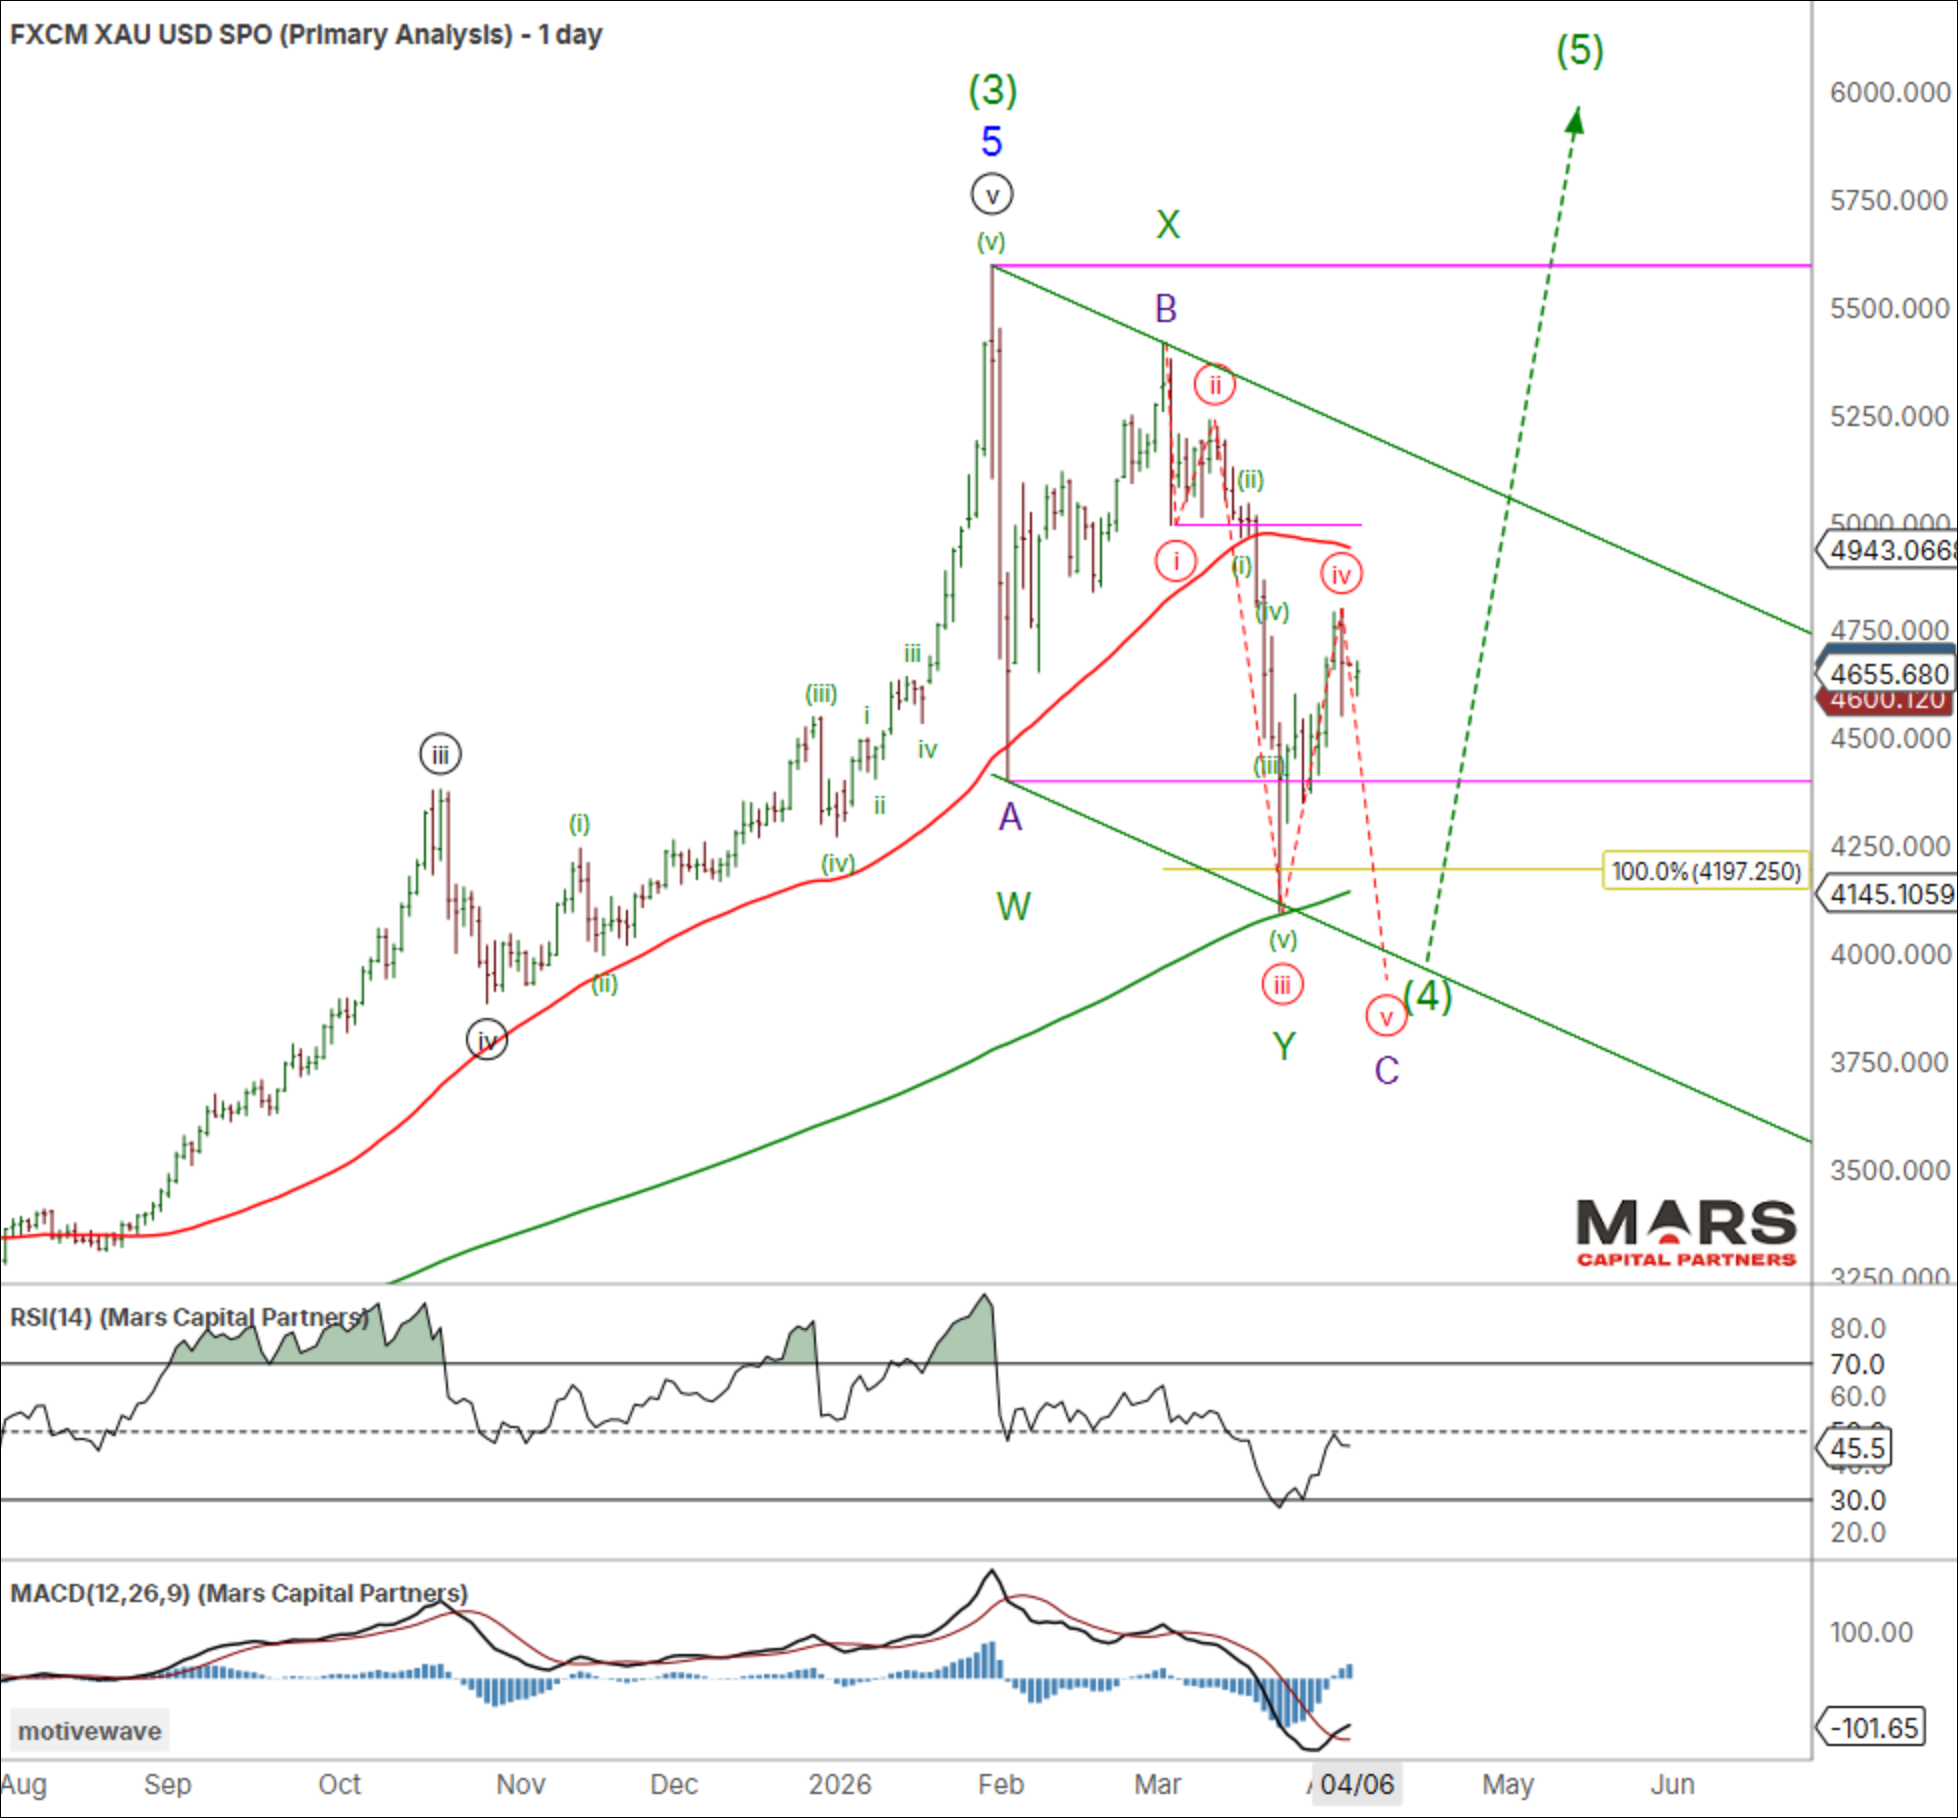
To the PM’s and Gold rebounded higher last week but the rally appears corrective. While there are enough waves in place to complete a W-X-Y wave (4) decline of equality into the 200 day sma and equality support, the corrective rally warns of further downside risk. It is unclear whether the wave (4) corrective decline is complete or becomes more complex with layered support in the 3900-4200 area.
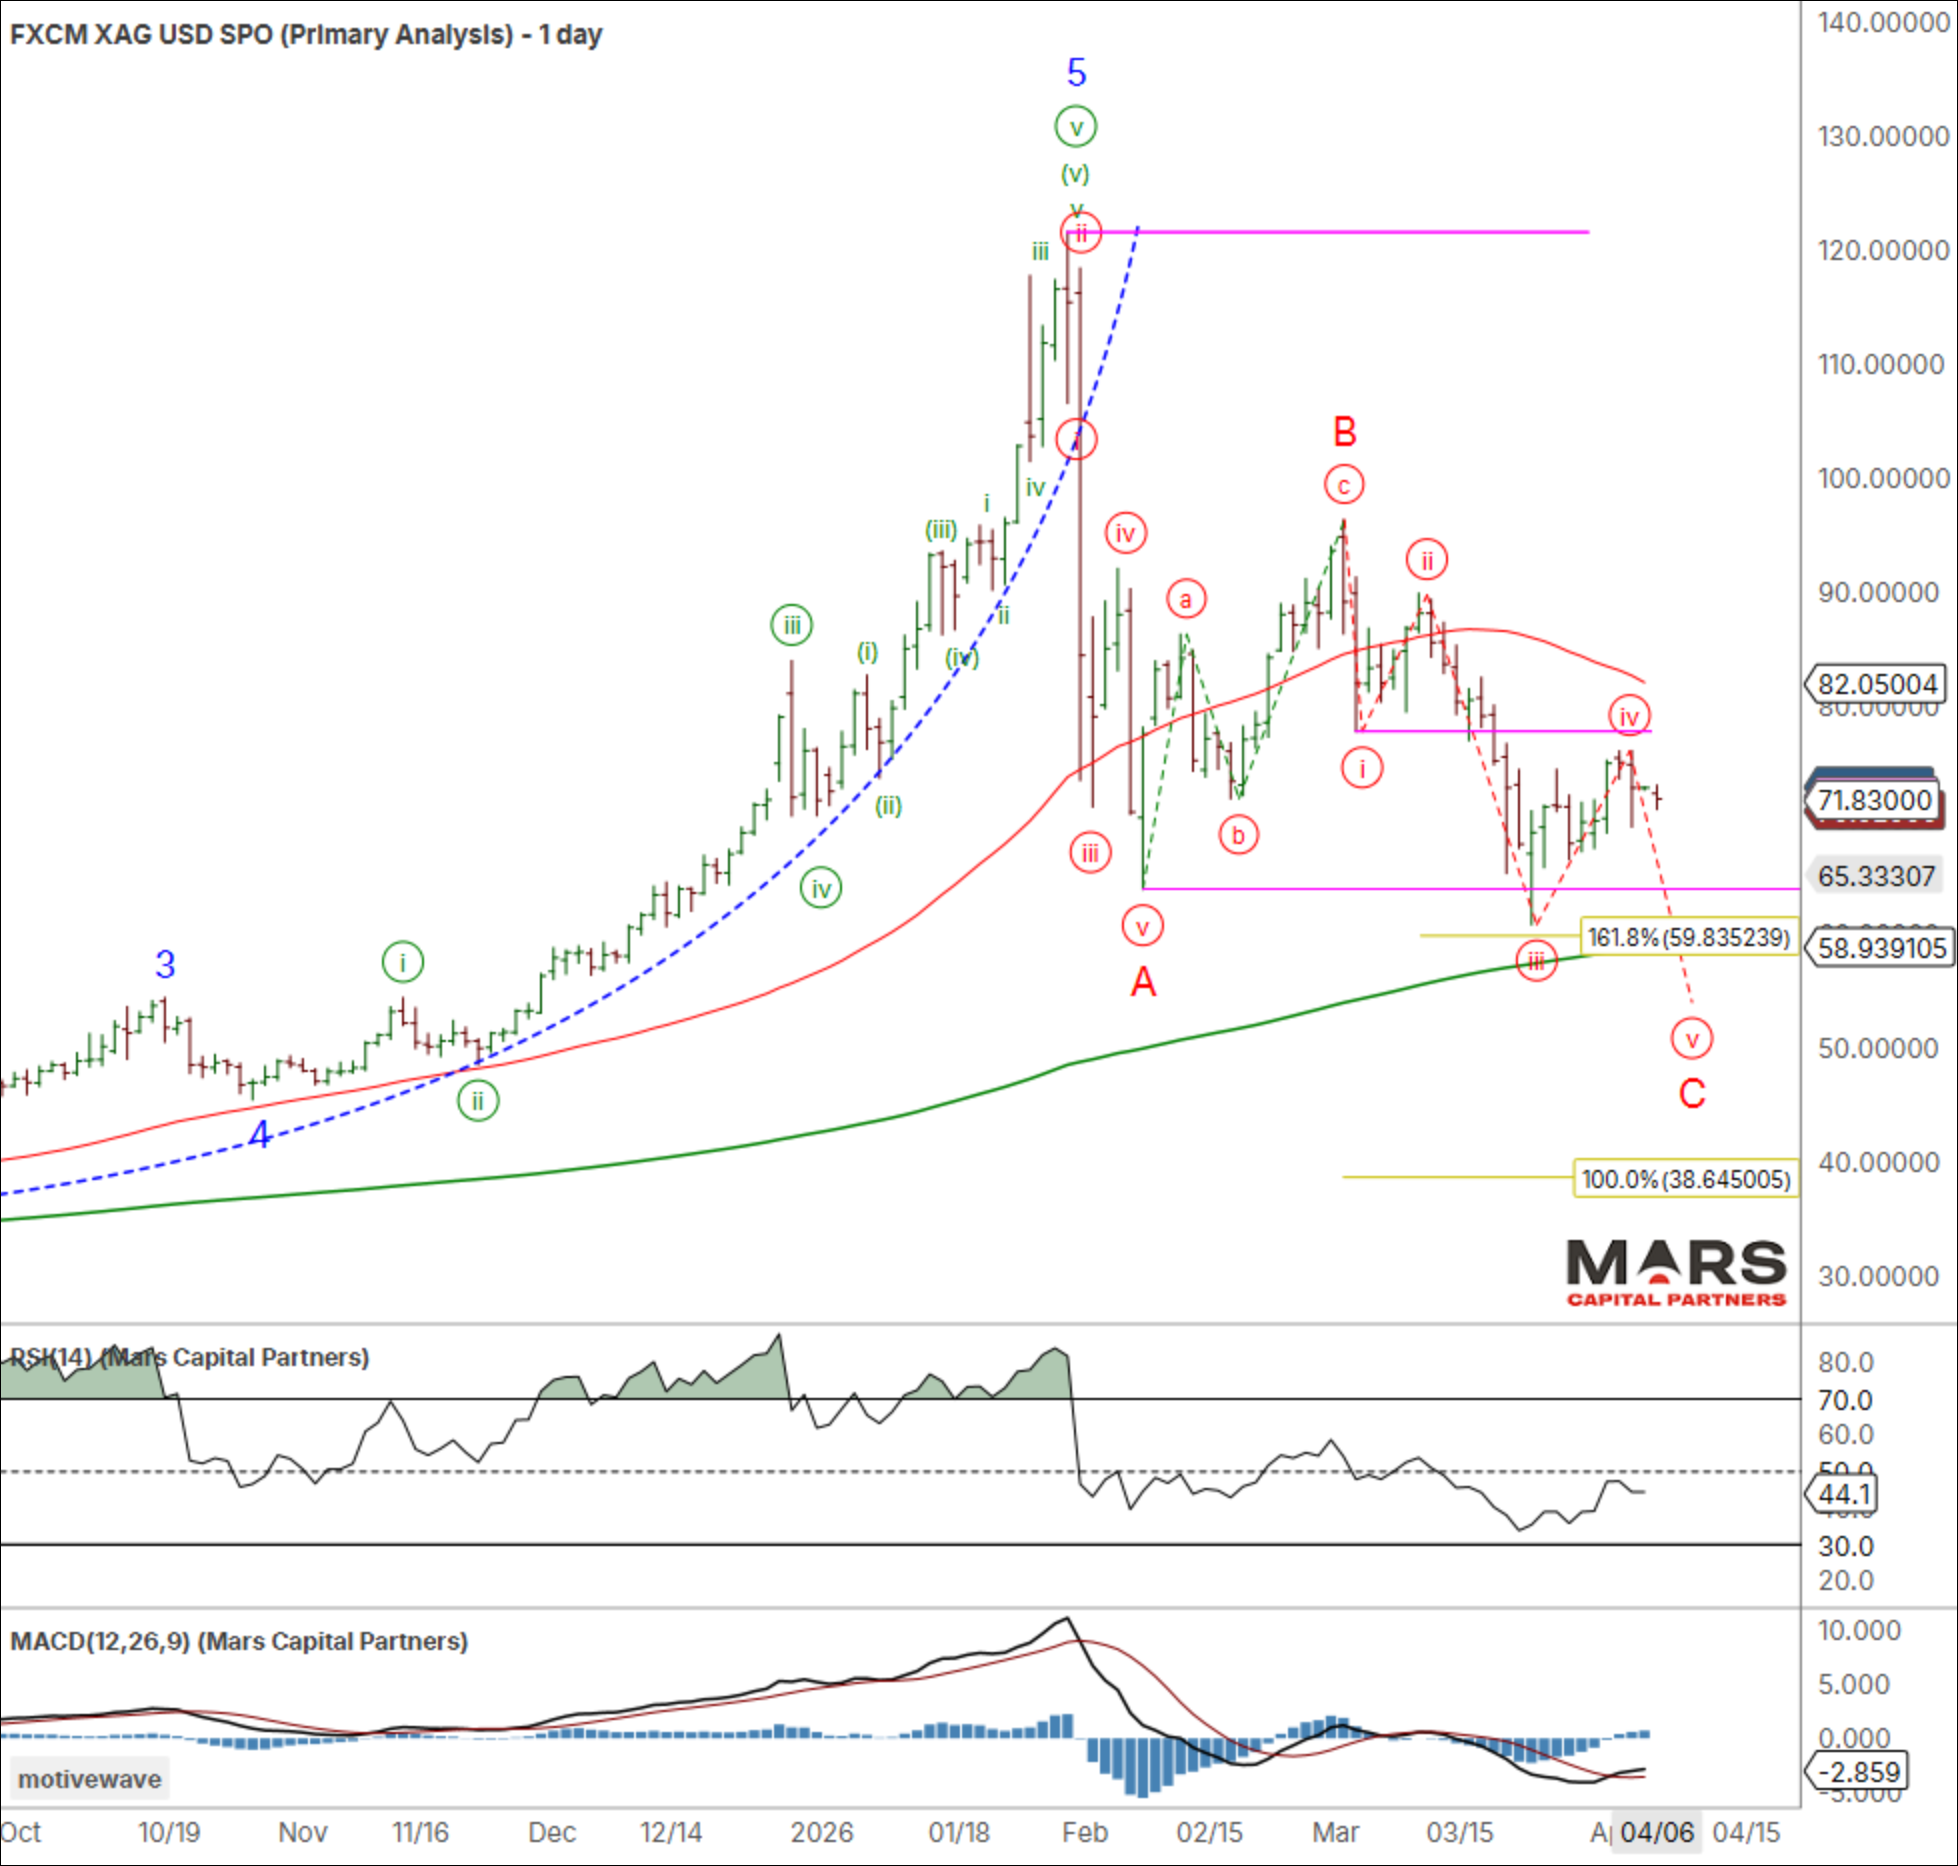
Silver rebounded last week but the rally appears corrective. The decline appears incomplete and would still look best with a wave (v) of C down towards the 200 day sma (at a minimum). Equality targets remain lower towards the 38-50 area while trade back above the 77.75 wave (i) overlap opens the door to a more complex correction. The big picture decline appears incomplete.
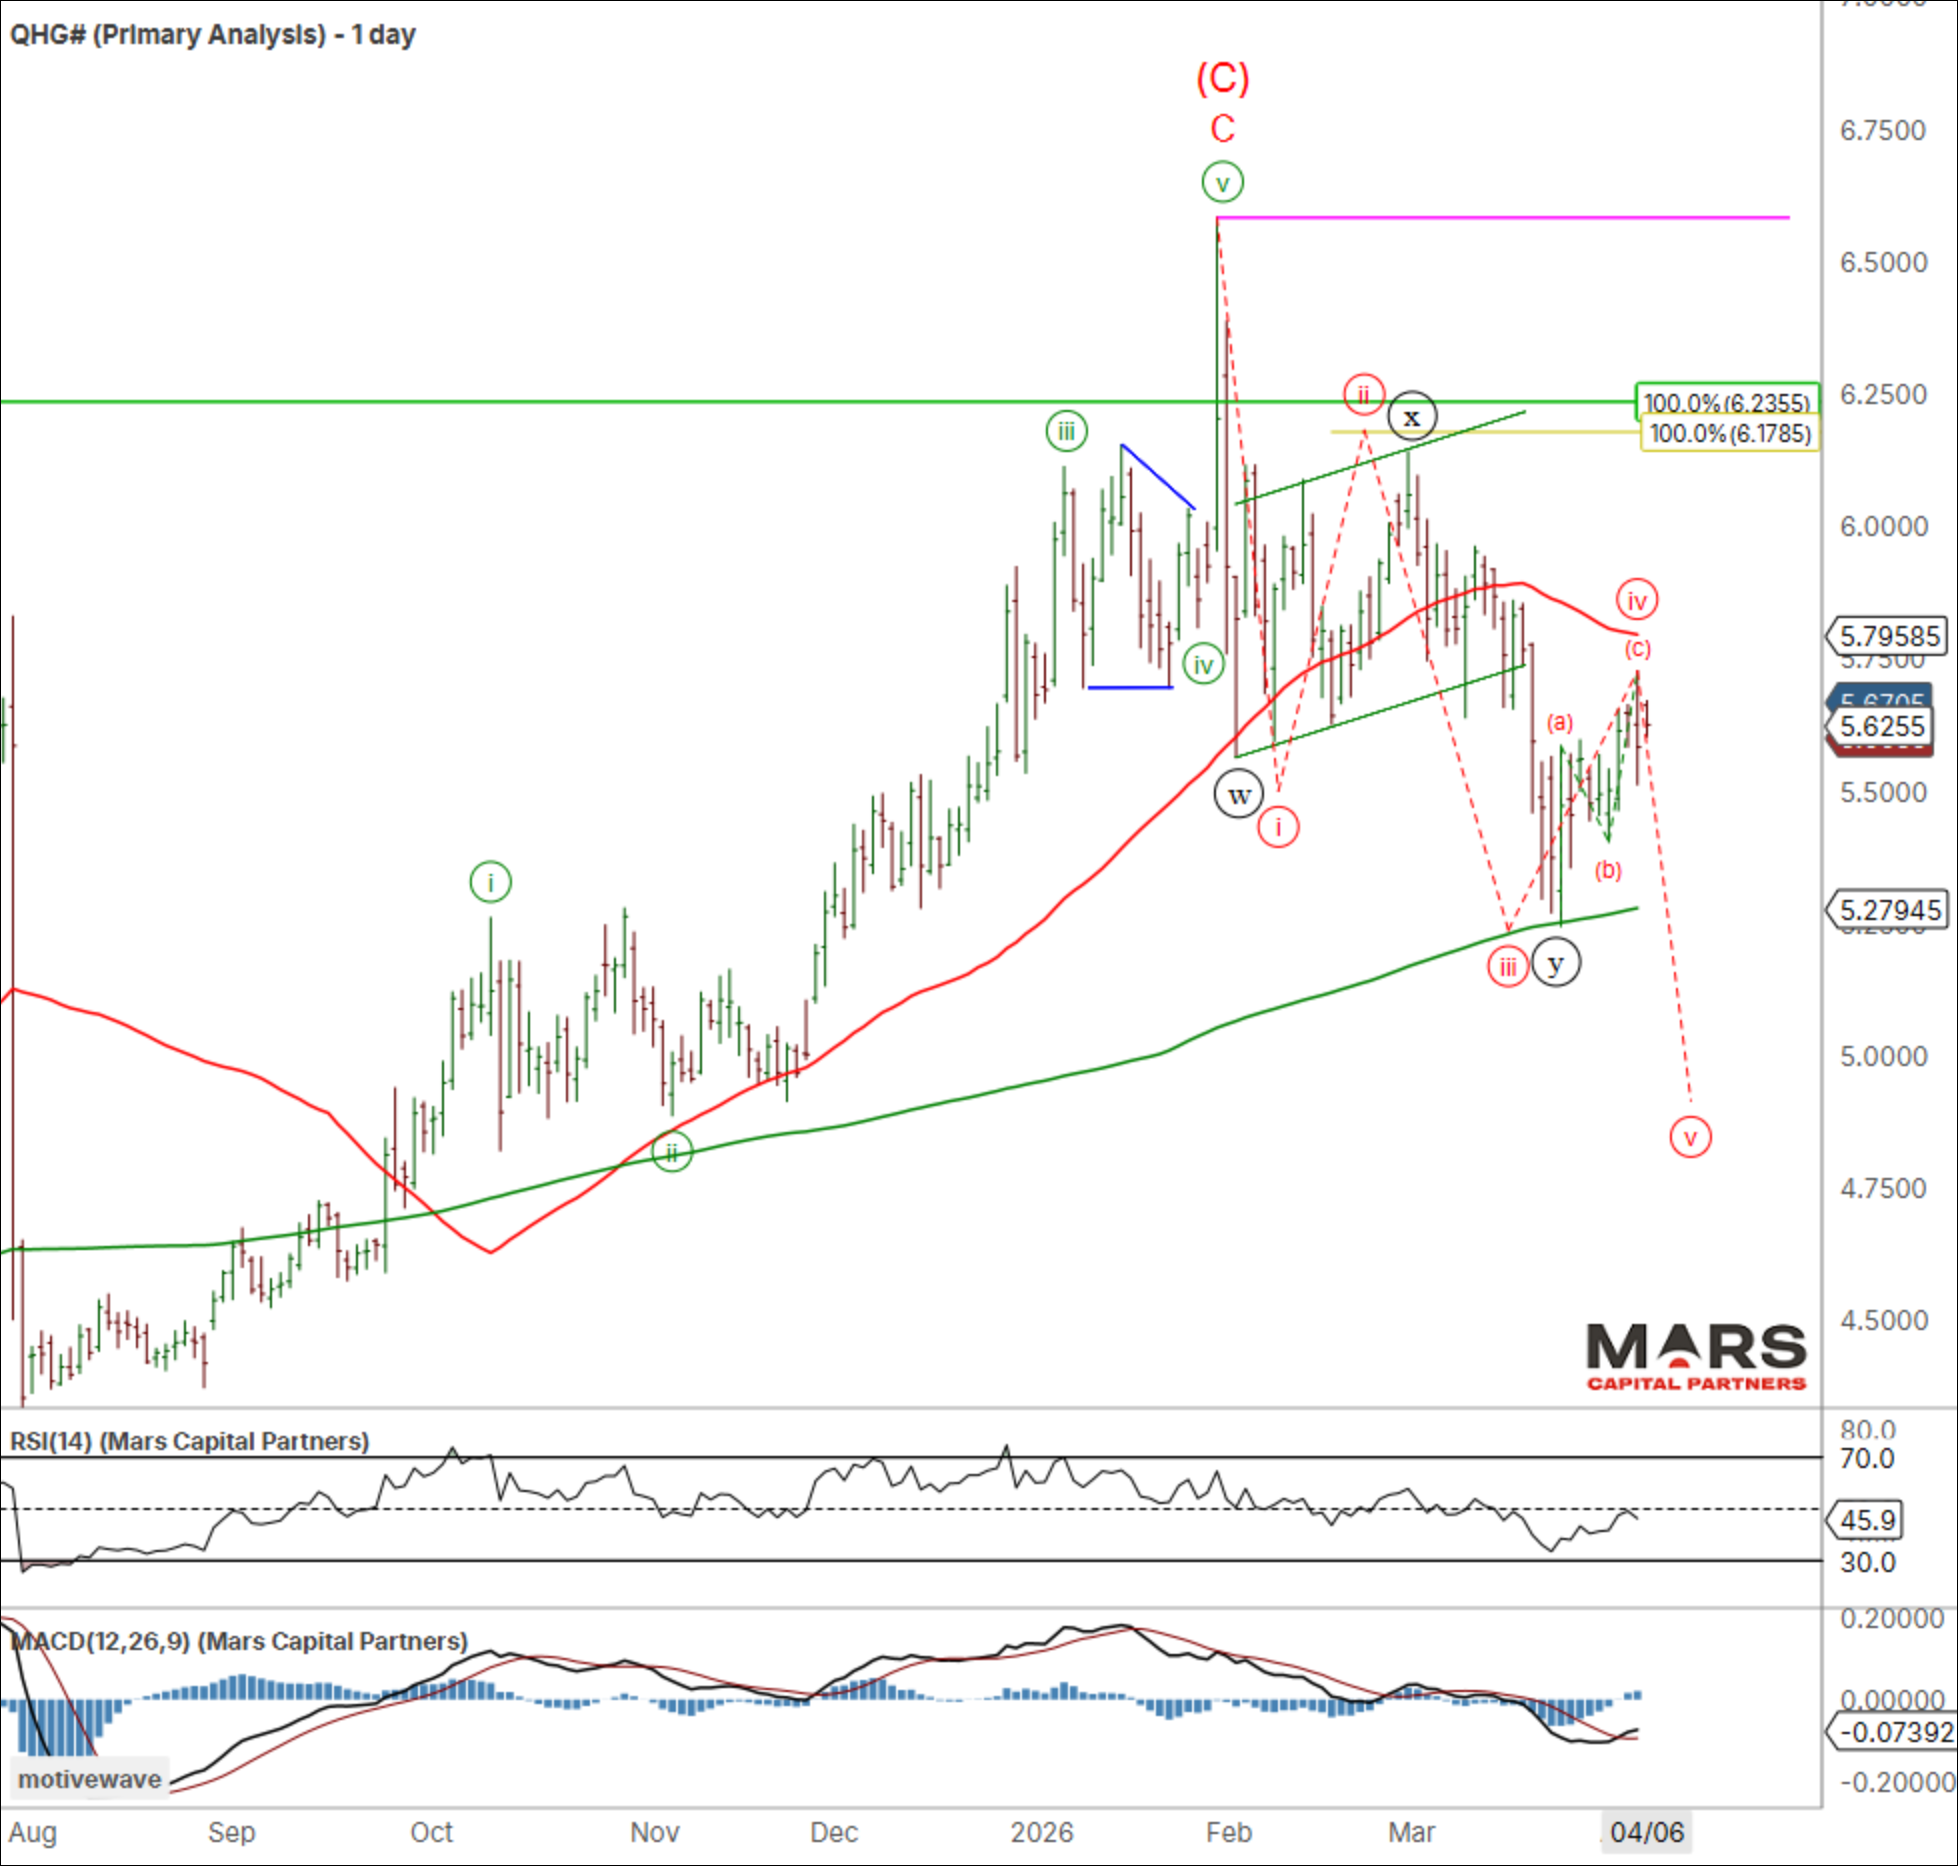
Dr Copper continues to hold 200 day sma support but the rally appears corrective and the decline incomplete. It would still look best with a red wave (v) decline to marginal new lows. The bulls would need to see a strong rally higher in an impulsive 5 waves up to invalidate the bear case.
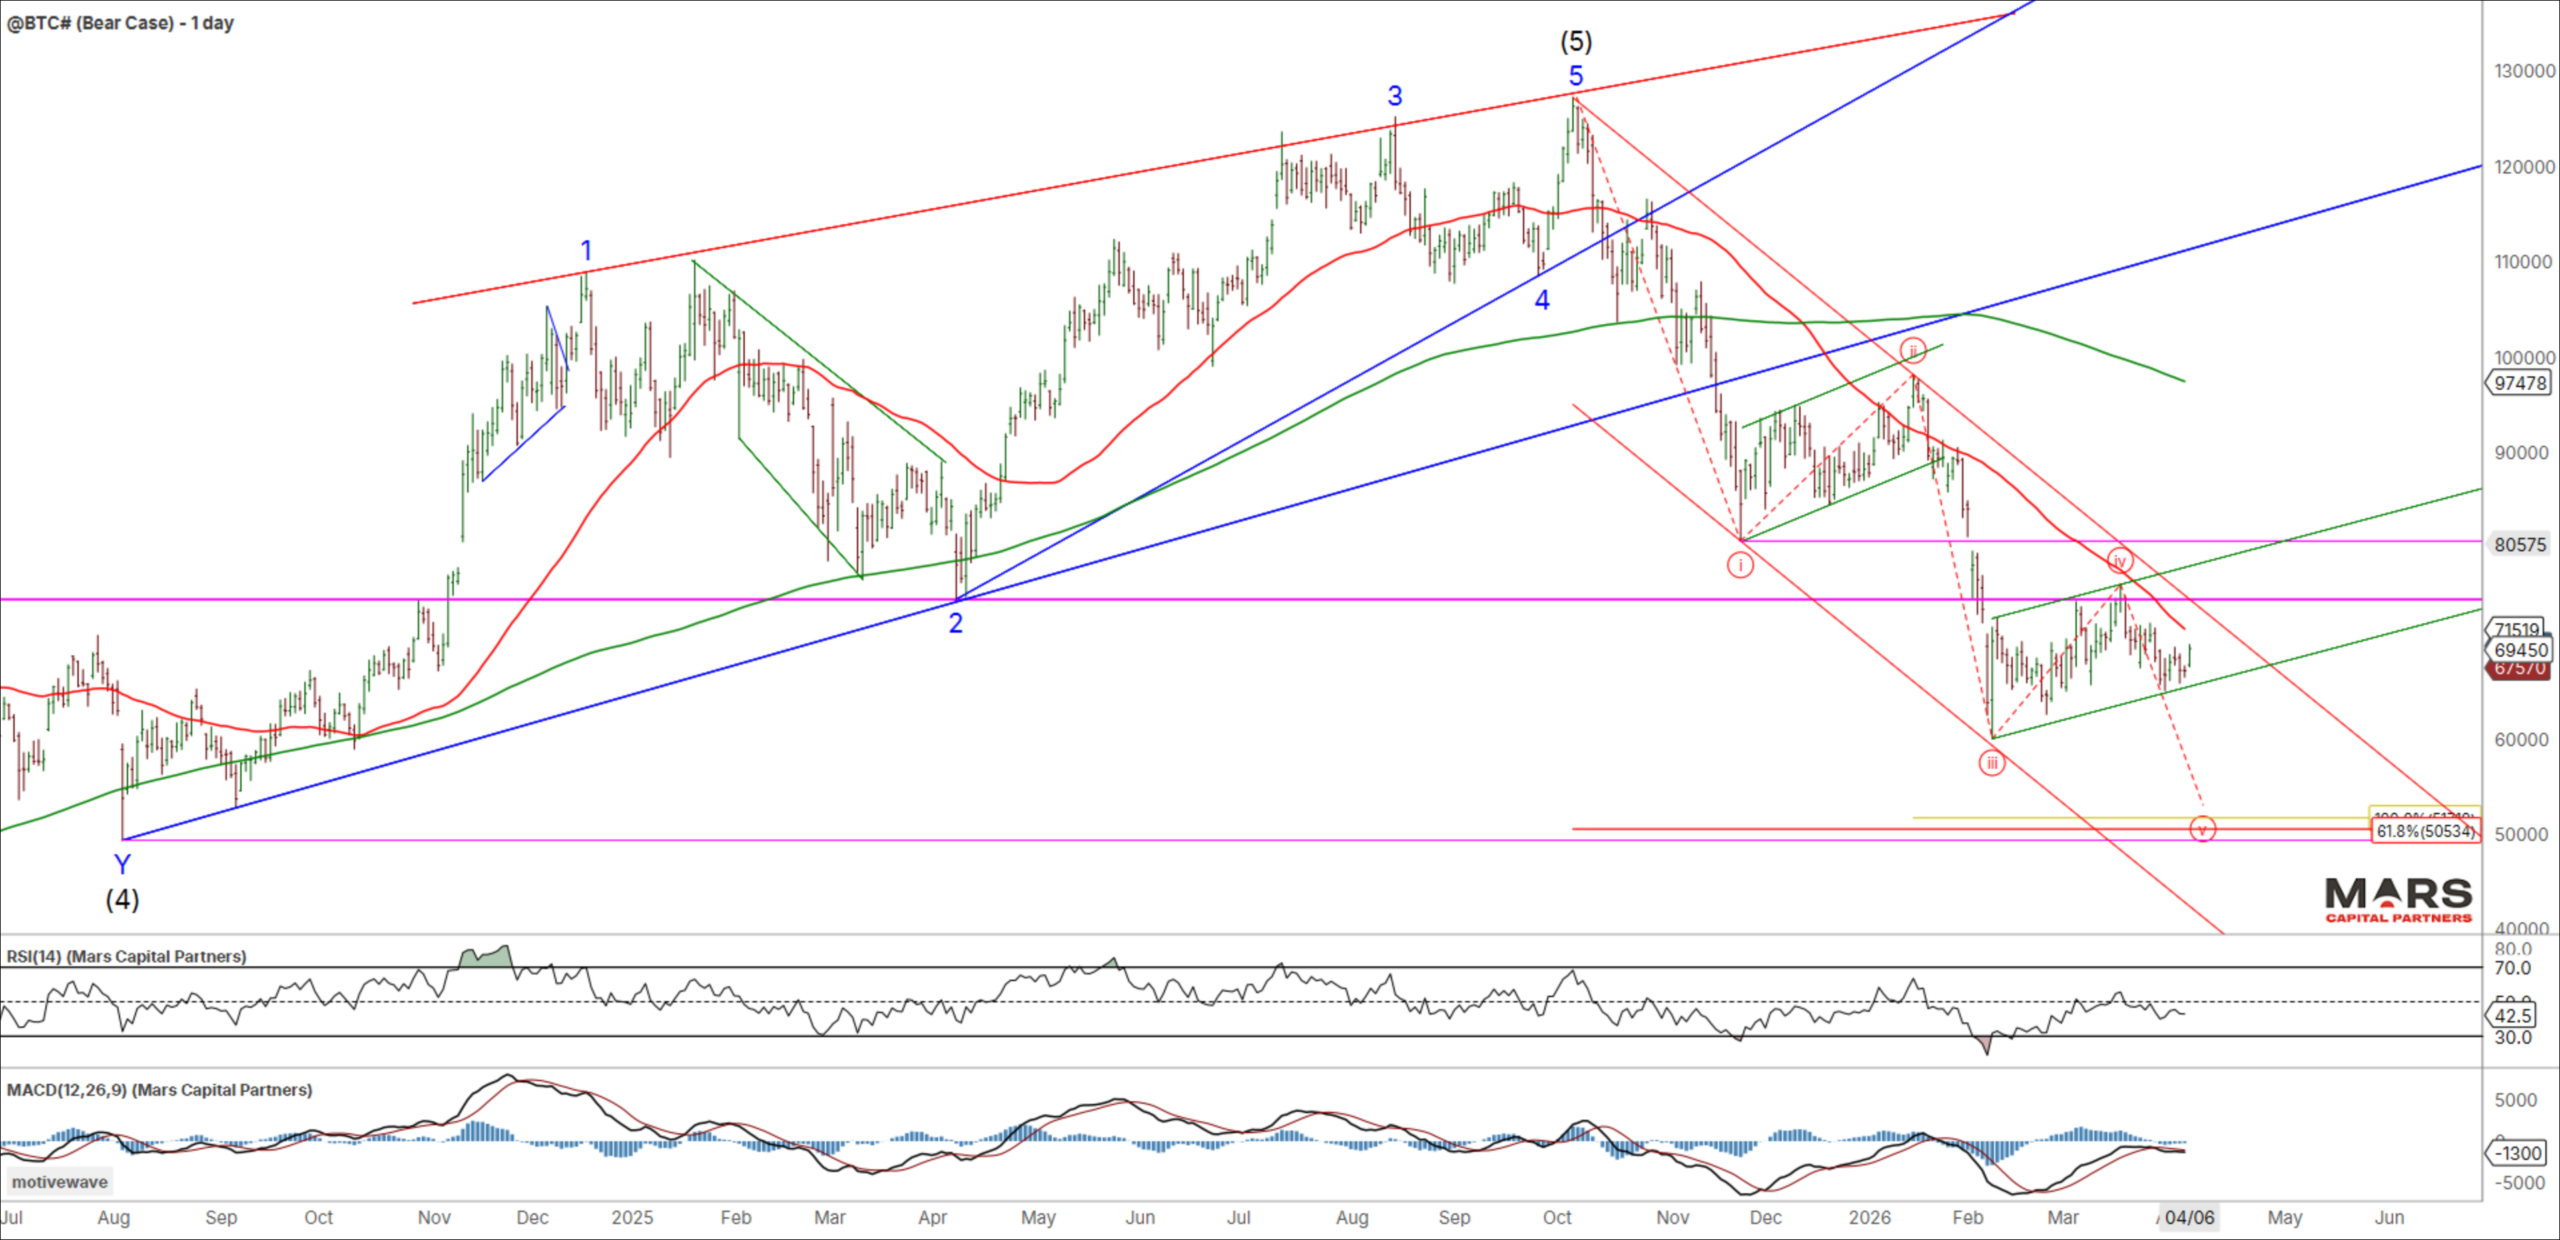
Crypto Markets – Holding Support
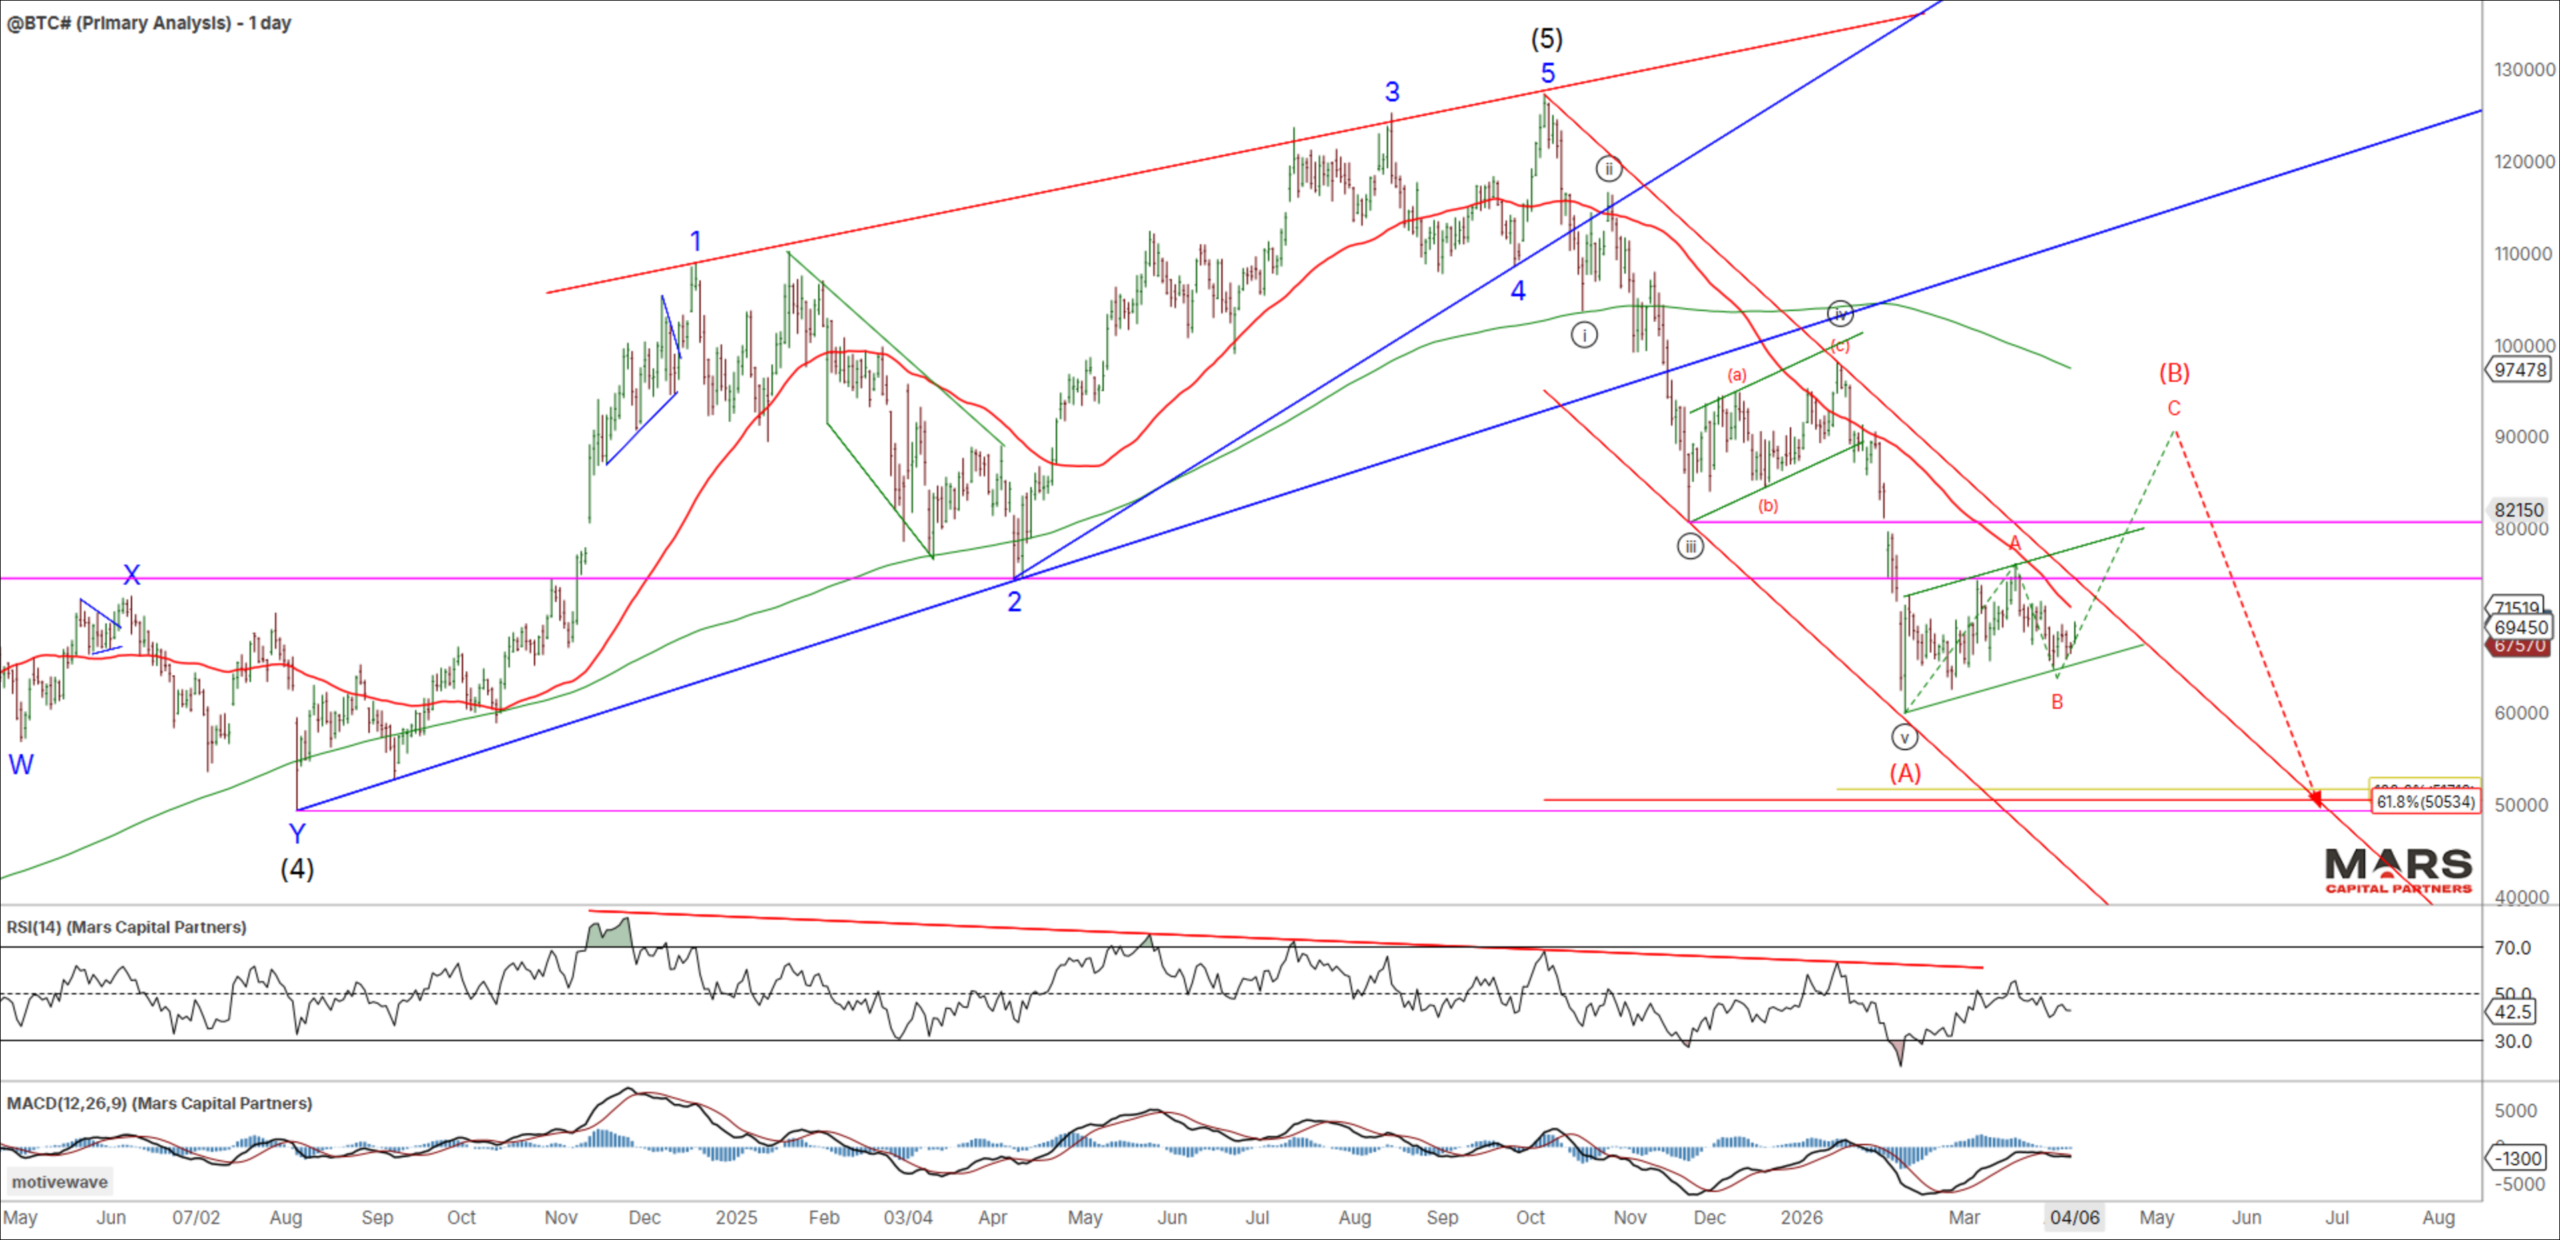
To the crypto markets and Bitcoin continues to hold trend channel support after a corrective 3 waves down so far. Bulls need to hold the line here and break back above 50 day sma resistance for a more complex and larger wave C rally. The risk remains for a downside extension while below the 50 day sma resistance (bear case). We remain bearish from a big picture perspective while allowing for a near term counter-trend rally for wave (B) towards the 200 day sma.
That’s all for now. Have a great week and trade safe. 🙂
