Last week, equities saw a corrective decline in what is likely a continued bullish impulse wave C of (B). Bonds continued to rally to complete an impulse up from recent swing lows. The US dollar refuses to roll over, calling into question the bearish count.
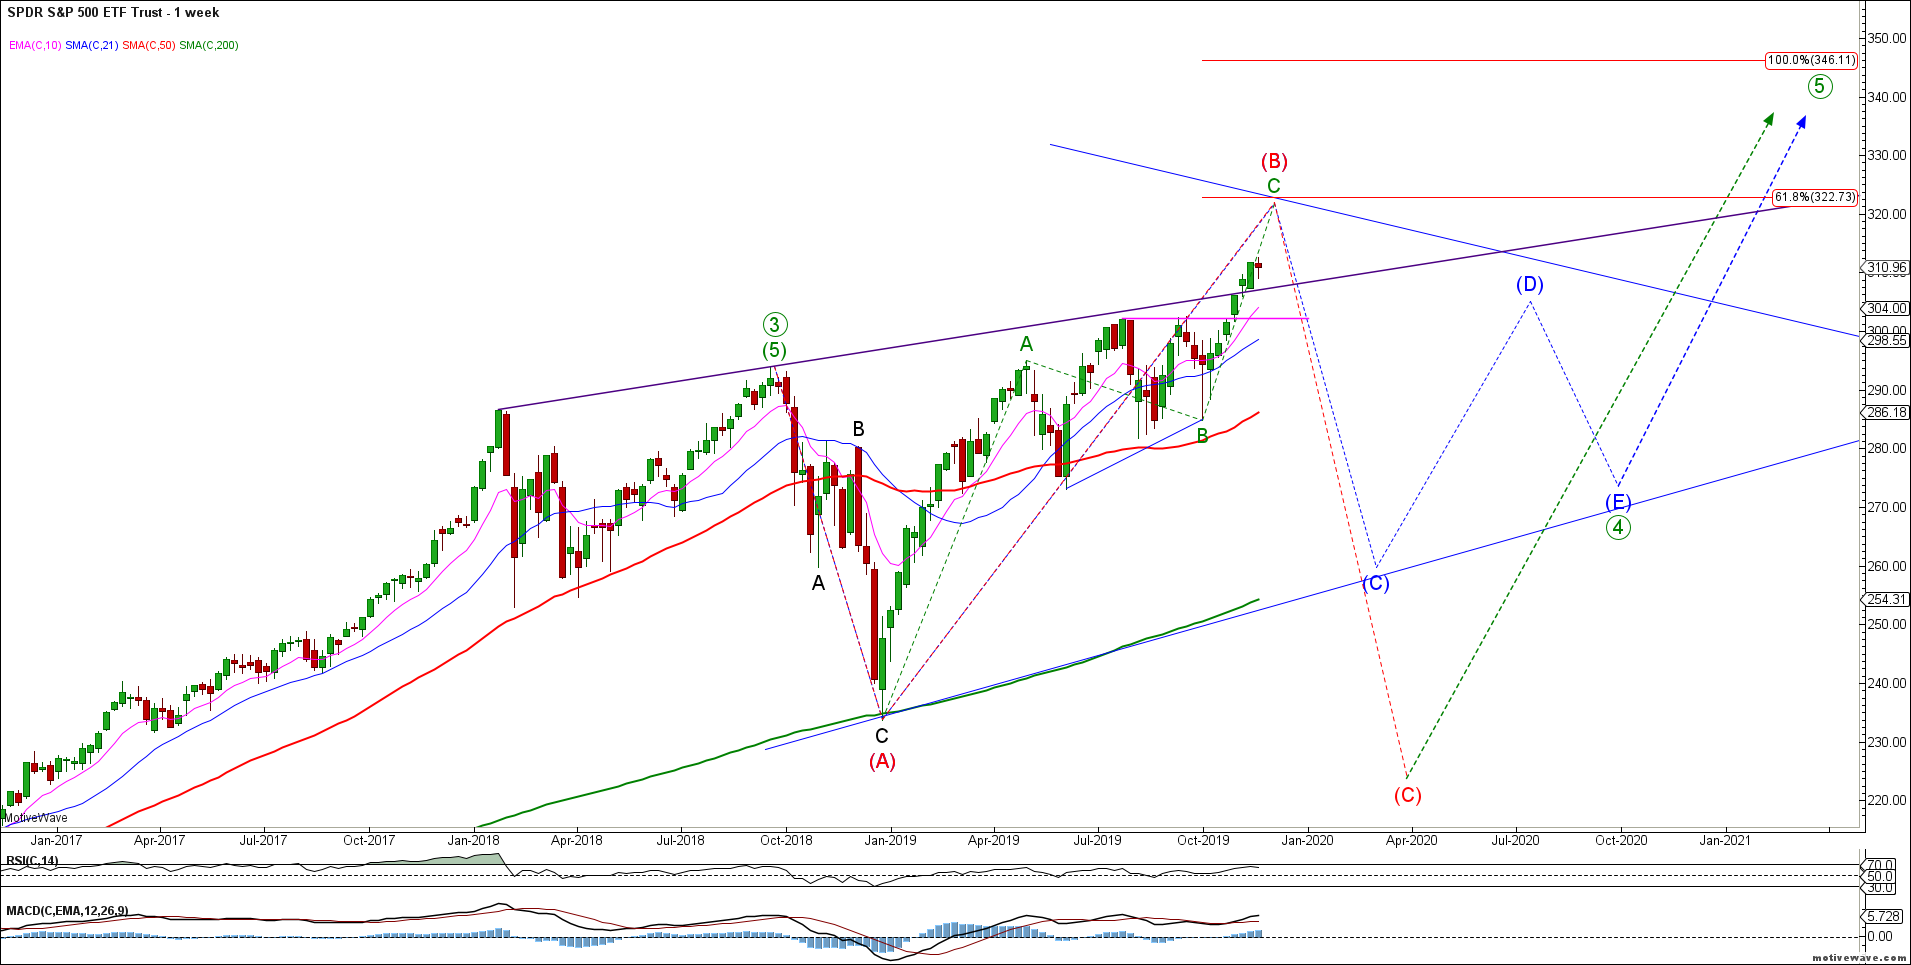
The big picture rally in SPX / ES appears in tact as wave C of (B) targets remain higher. Last week’s decline was corrective in this seasonally bullish period. We have no evidence of a tradable top in equities – the bulls remain in control.
SPY Weekly
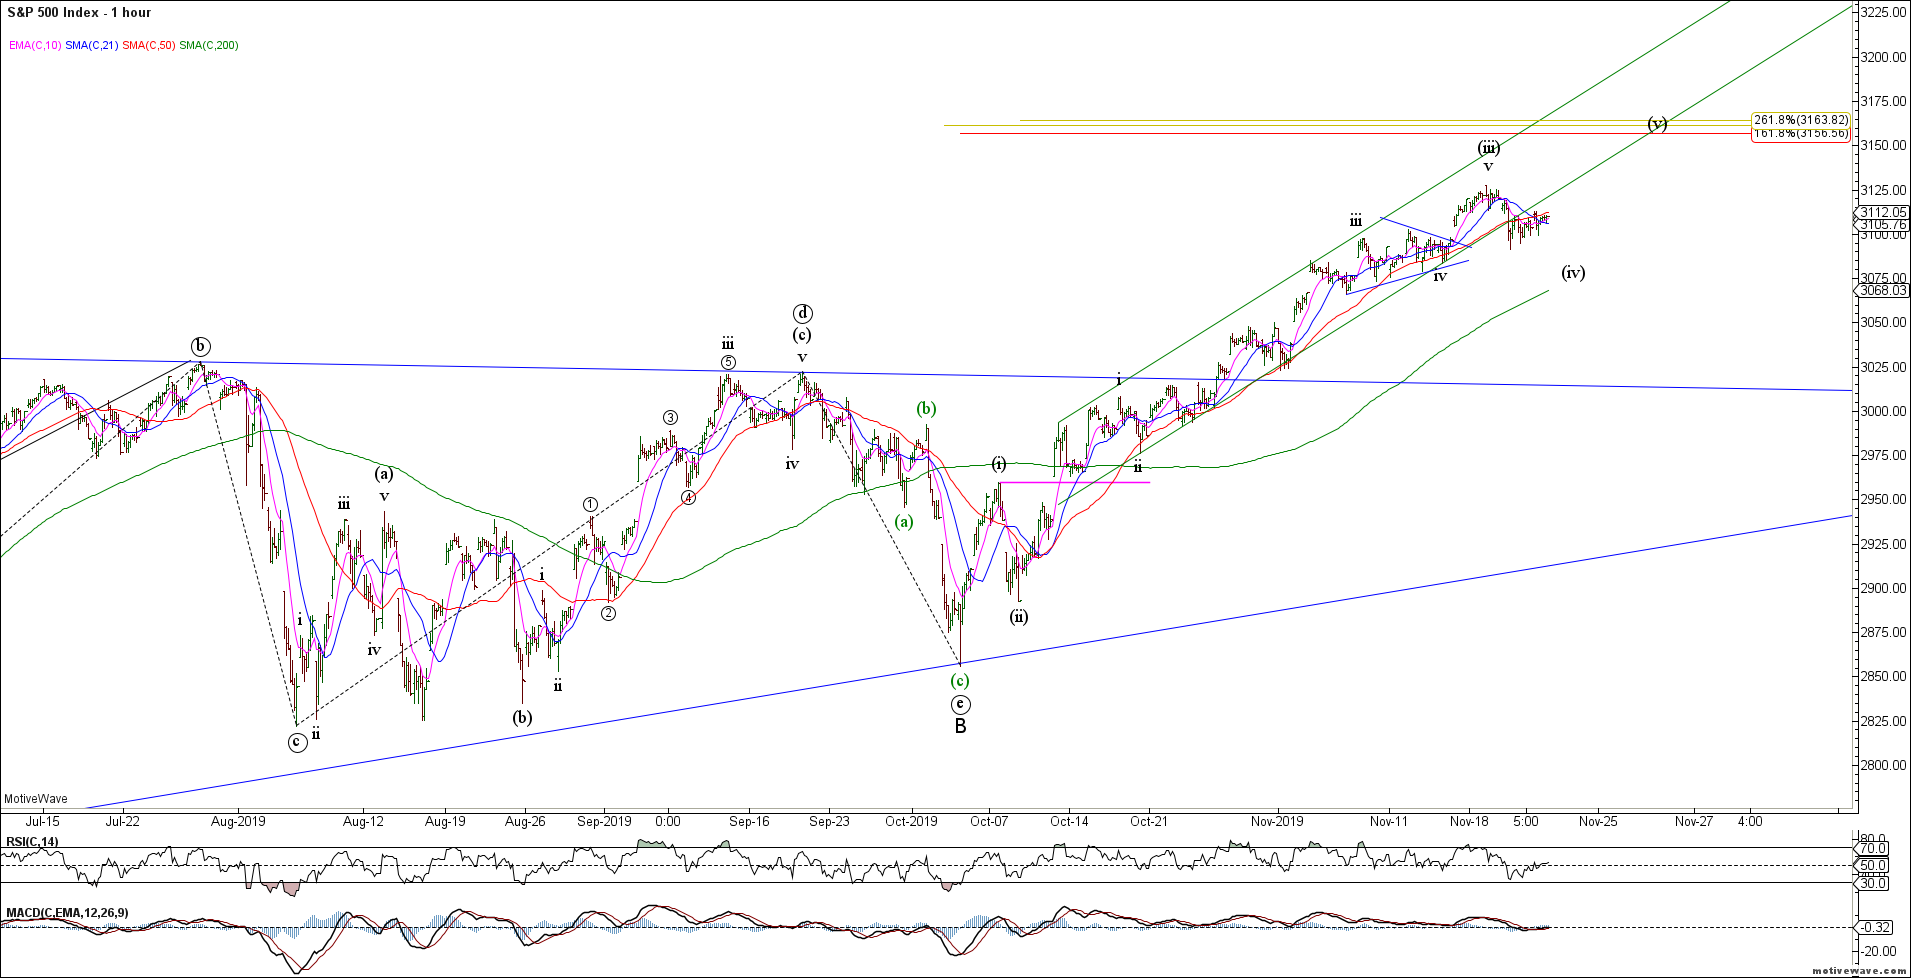
Last week’s decline in SPX / ES appears corrective for what is likely wave (iv) in an ongoing impulsive rally higher. Near term support resides in the 3075 area for the impulsive rally.
SPX H1
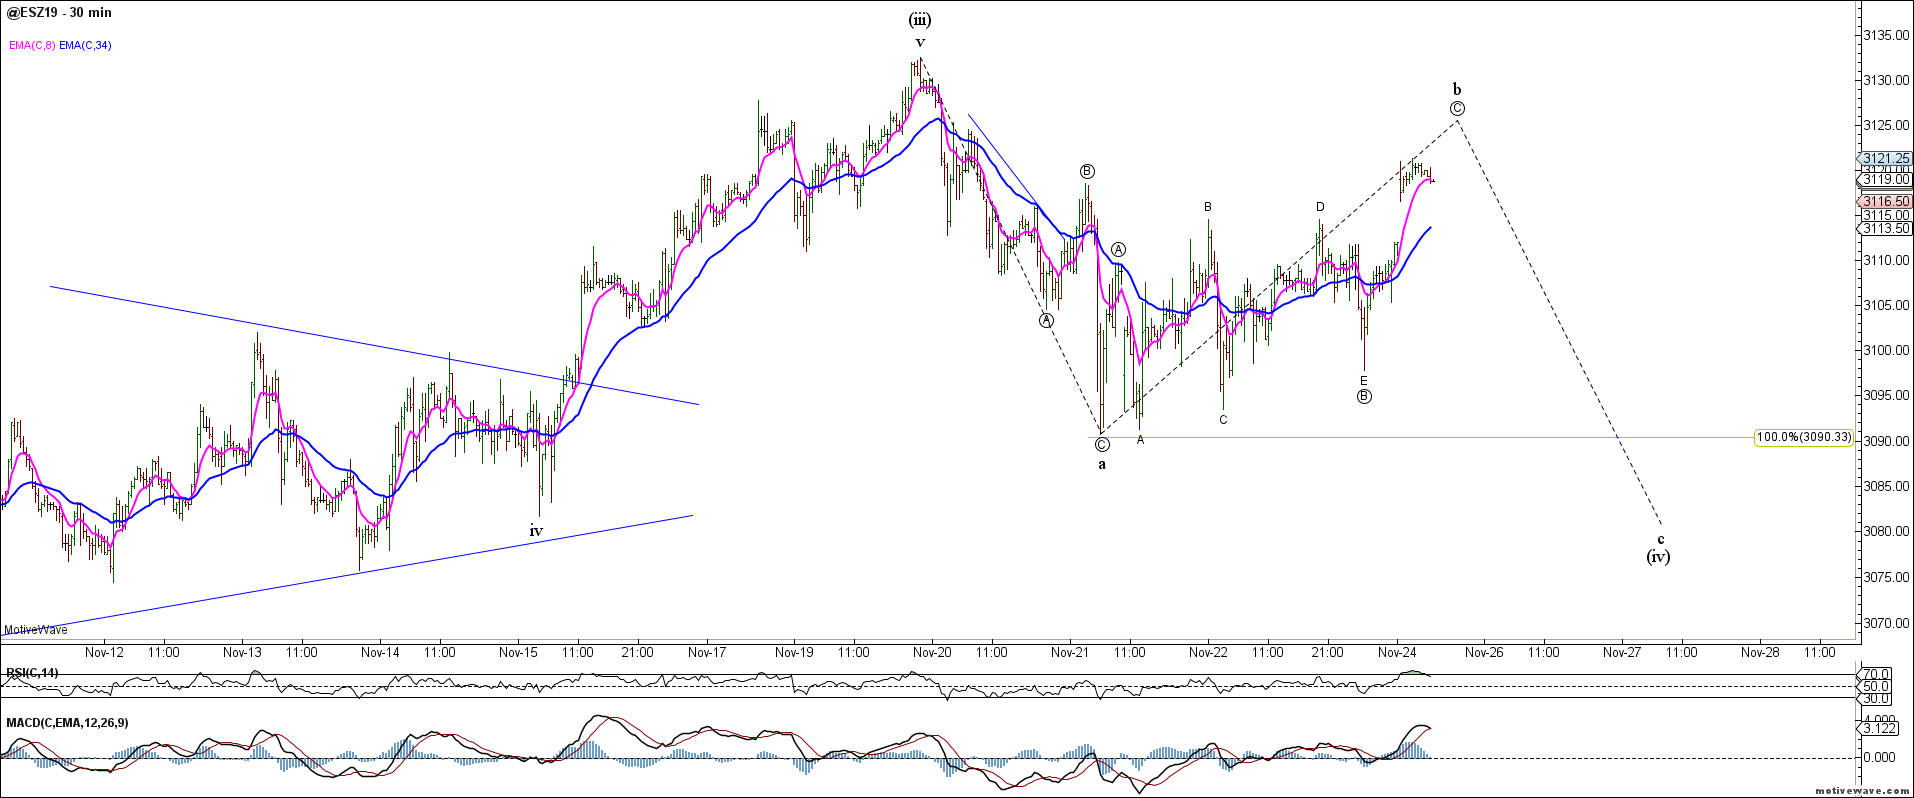
The very short term ES chart shows a corrective 3 waves down from recent swing highs. While the correction could be complete, it would look better with another wave c down to complete (iv).
ES 30m
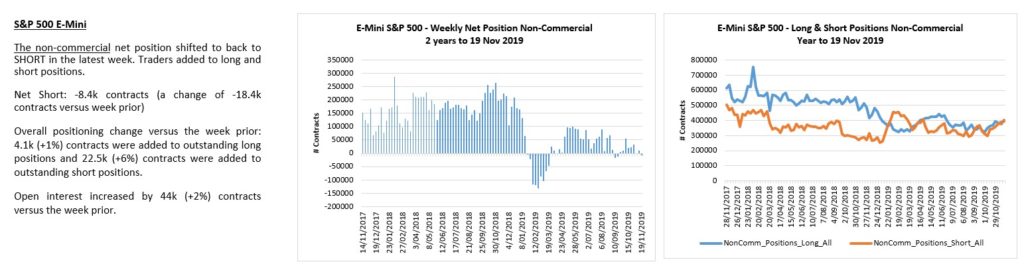
ES traders remain flat and disinterested.
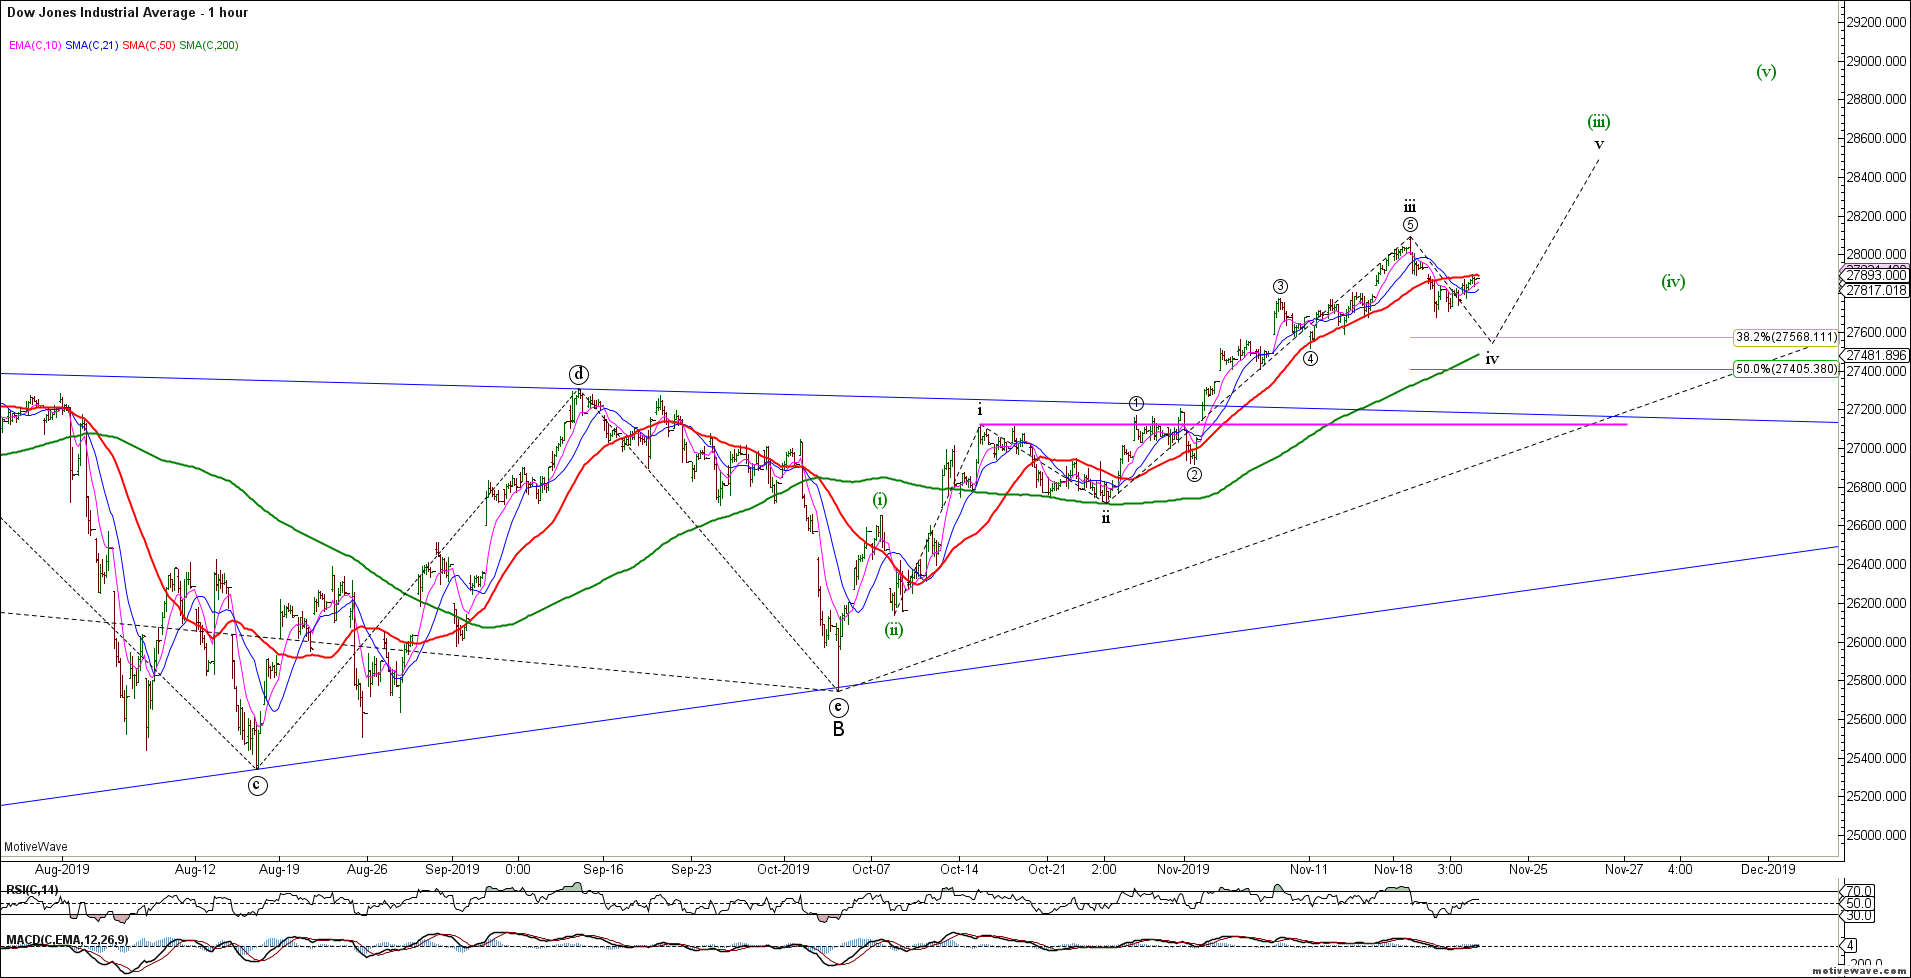
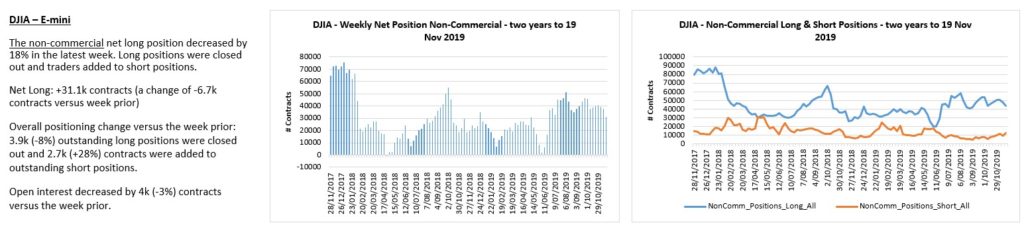
The DJIA appears to have completed a small degree wave iii in this ongoing impulsive rally. Near term support resides in the 27500 area for wave iv of (iii). Trade back below 27100 invalidates this nested bull count.
DJIA H1
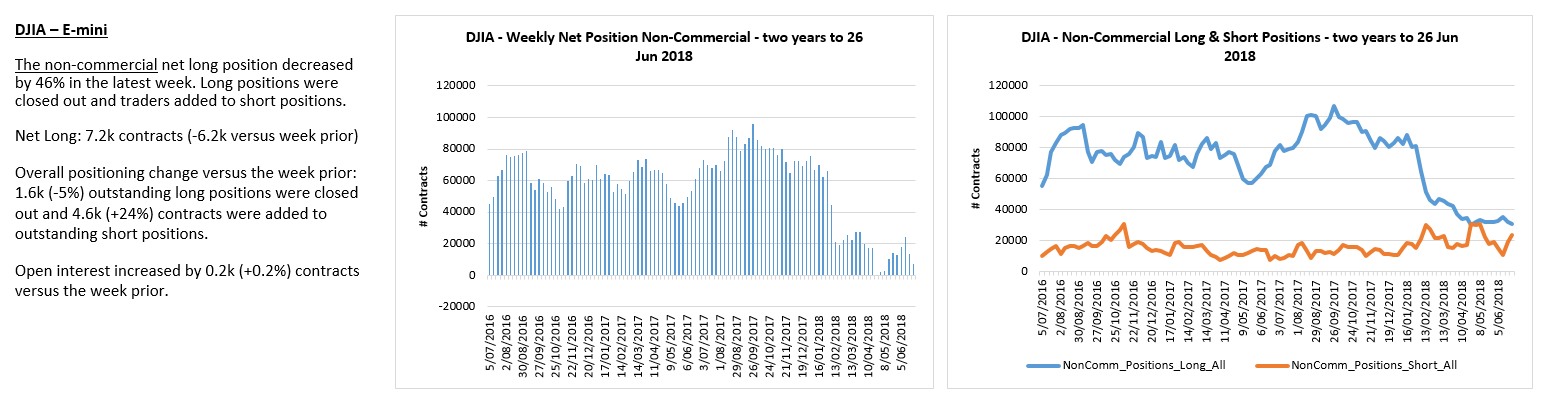
YM traders paring back longs and adding shorts.
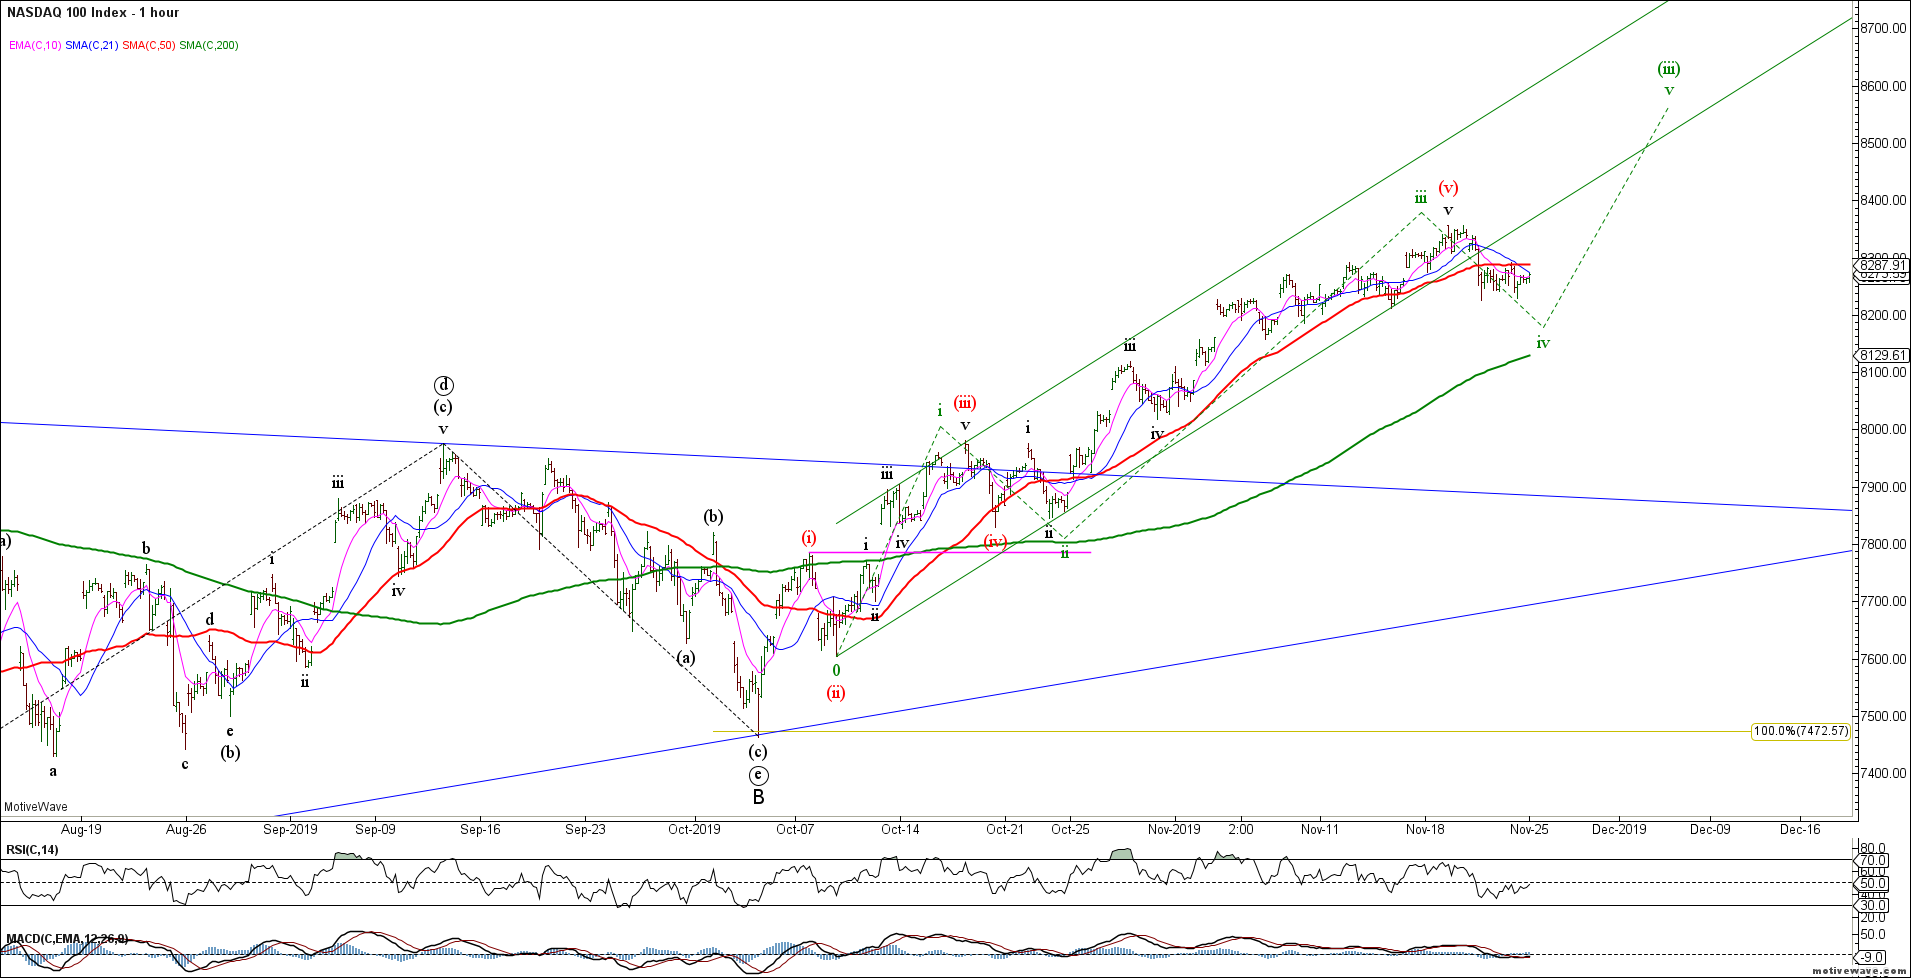
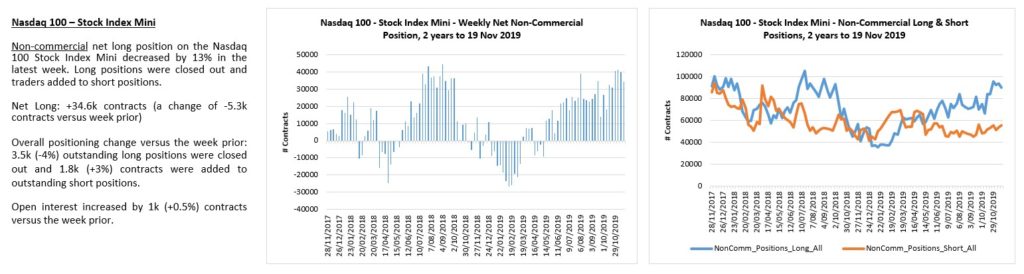
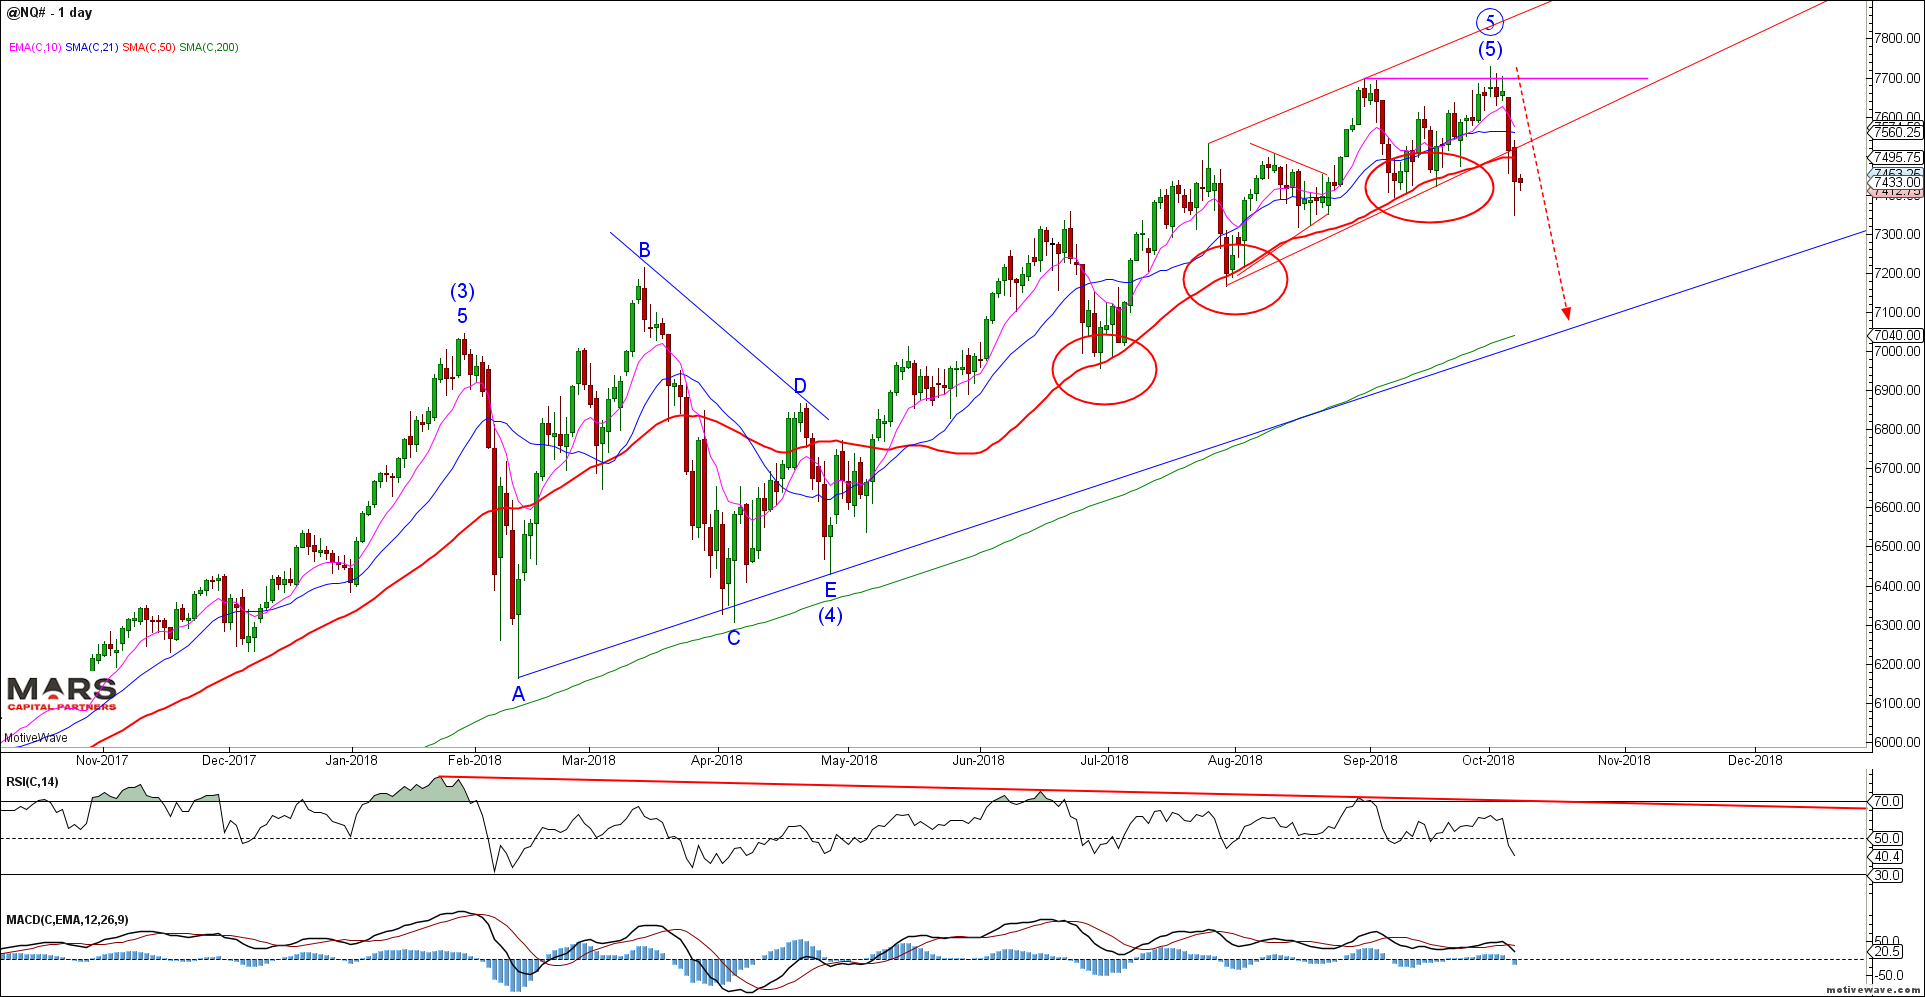
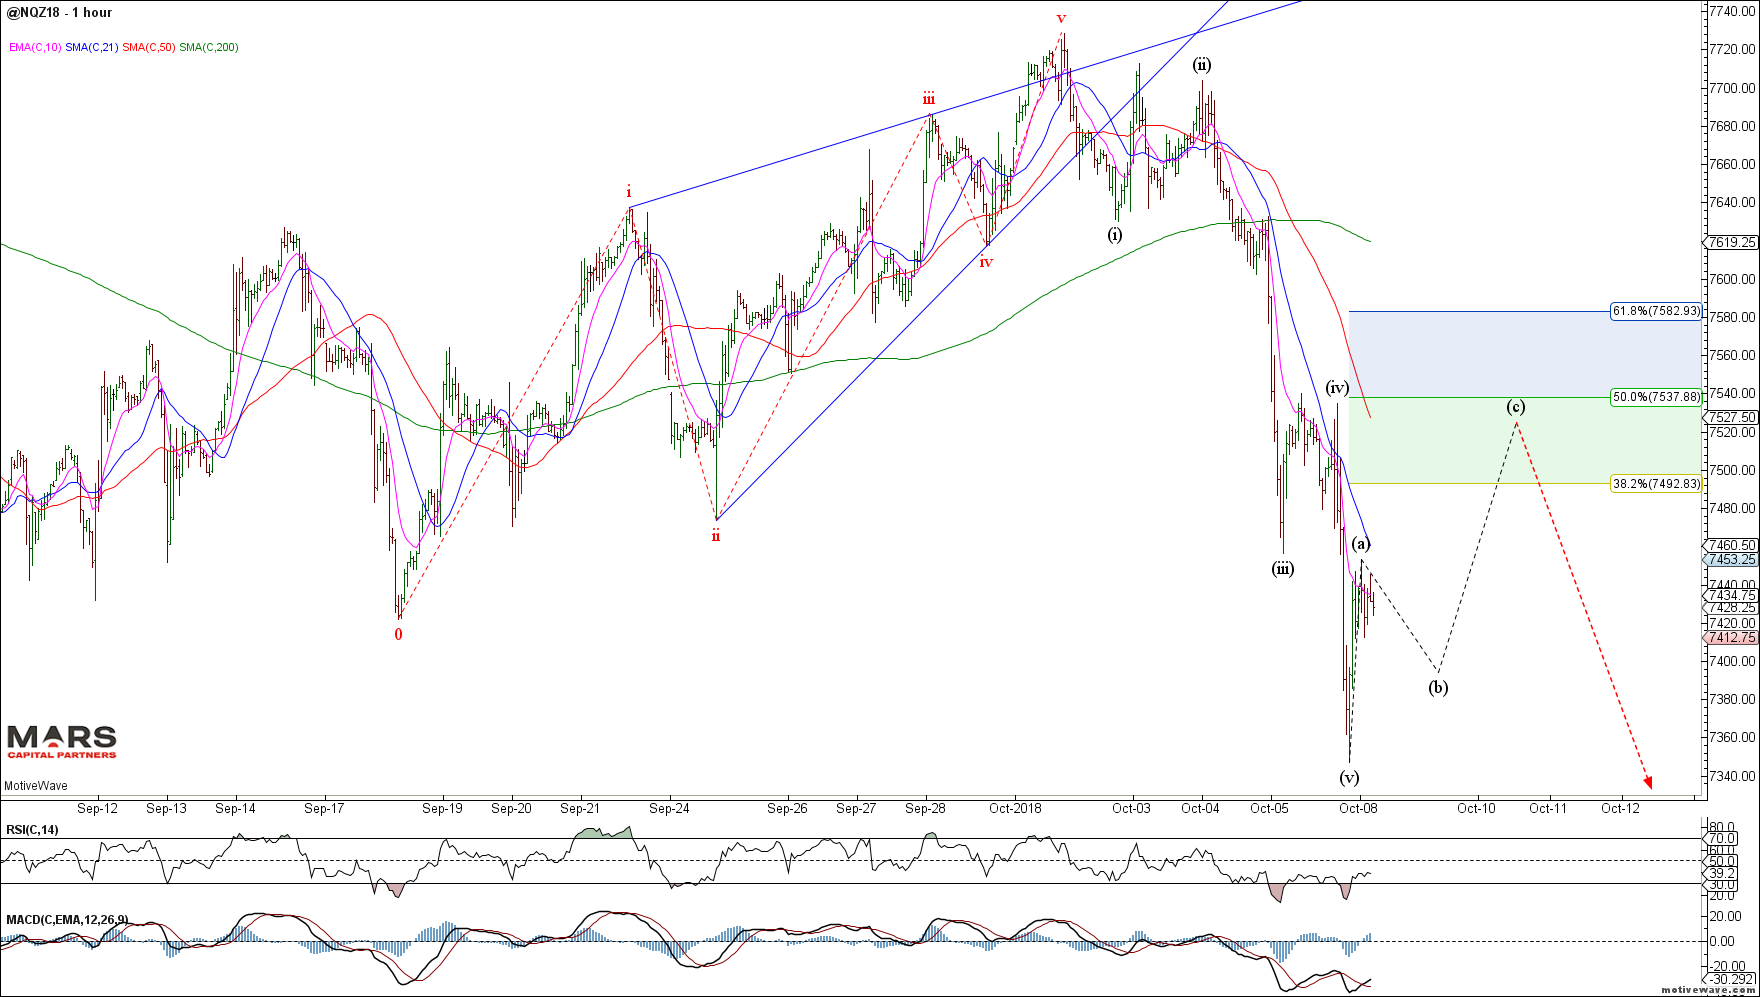
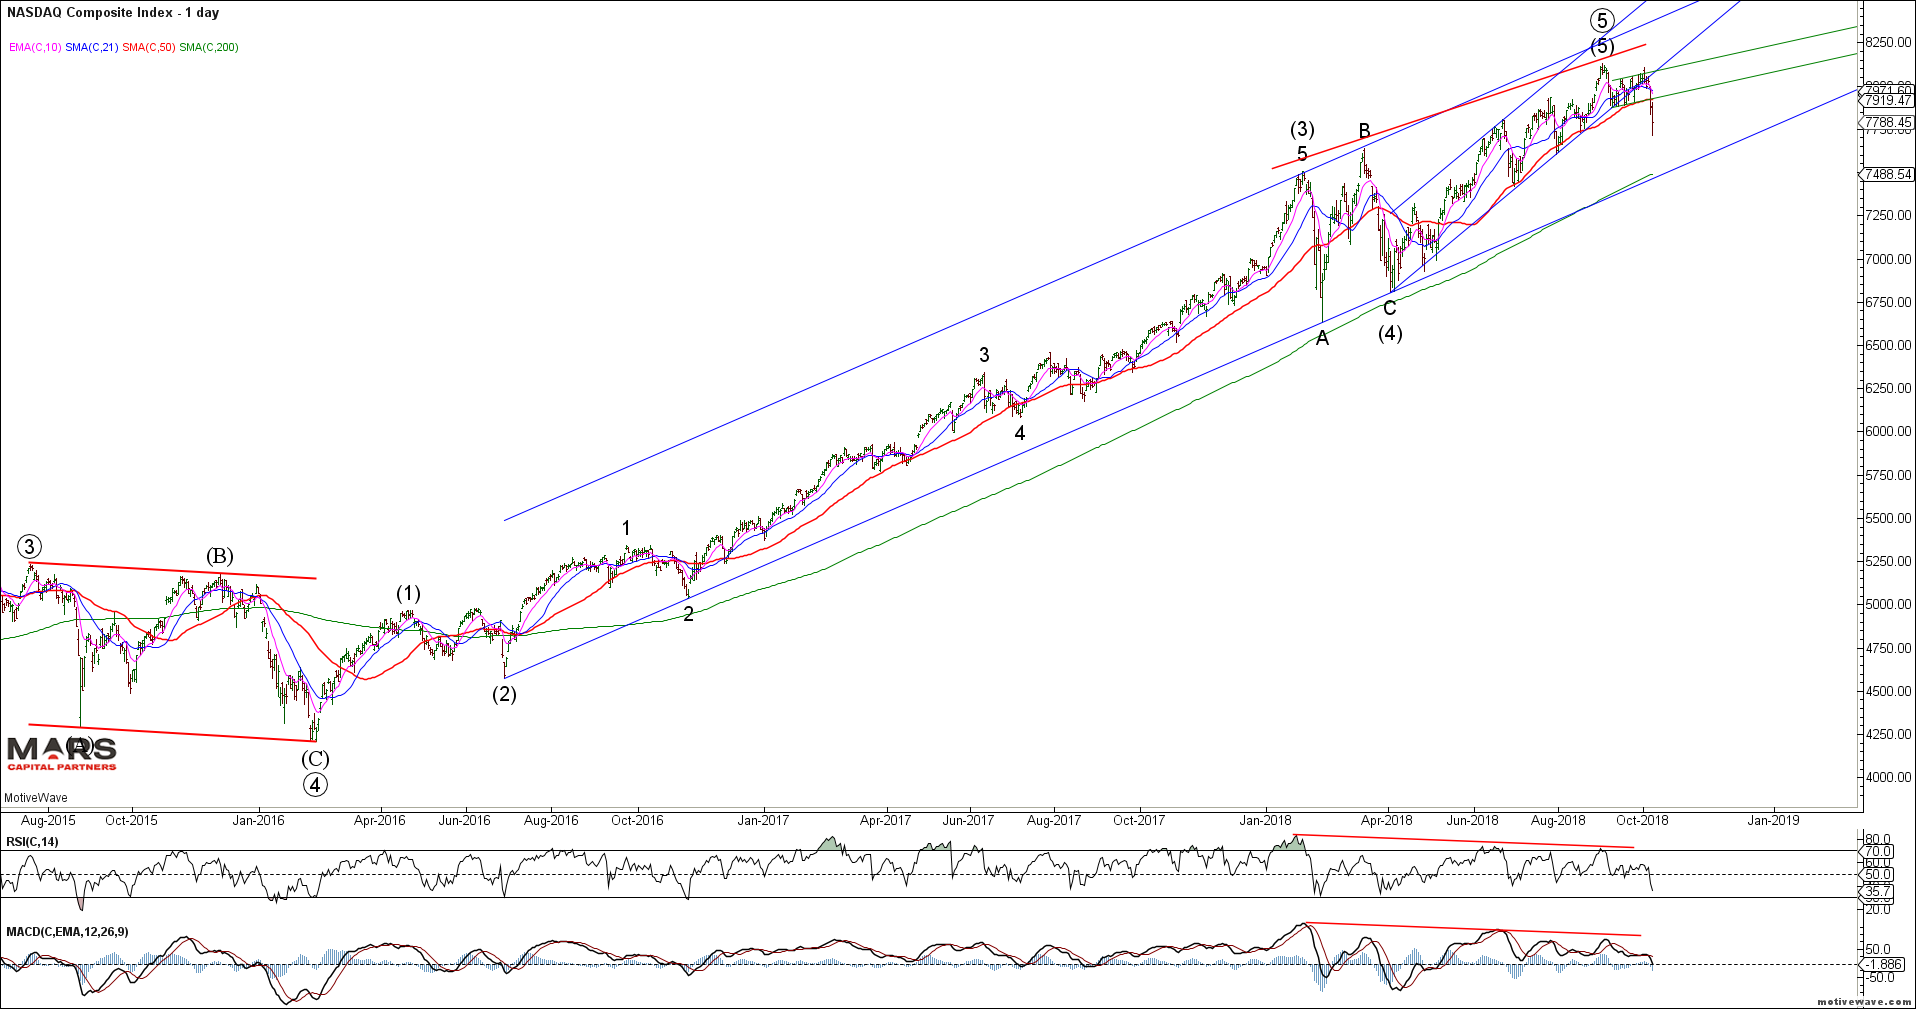
The Nasdaq also shows the potential for a completed wave (v) (red count) but more likely a wave (iv) correction in an ongoing bullish trend (green count). No reason to fight this bullish trend until we see evidence of a bearish reversal – not just a pause within a bullish trend.
NDX H1
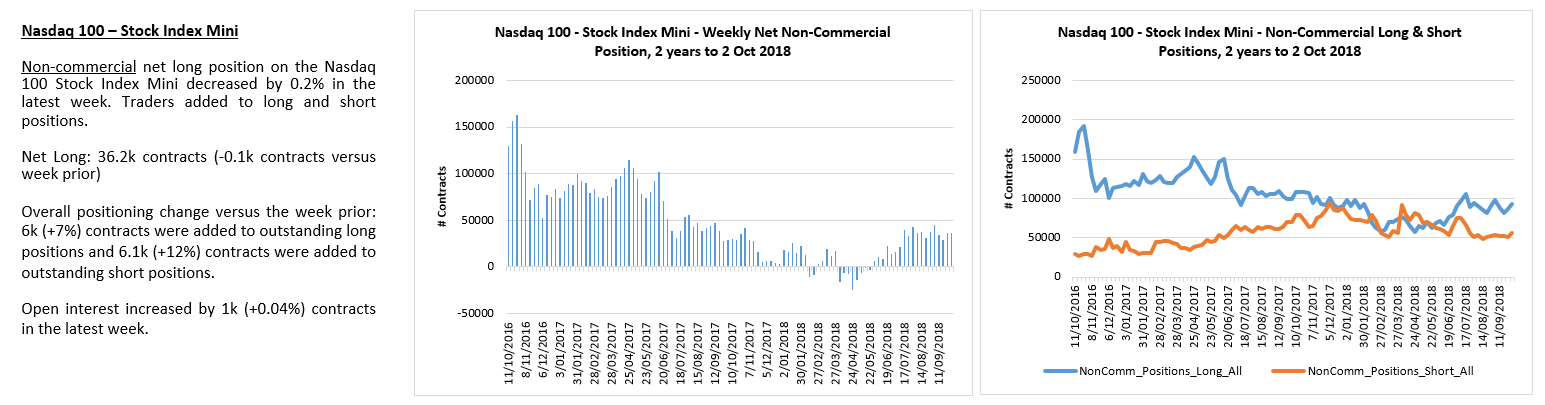
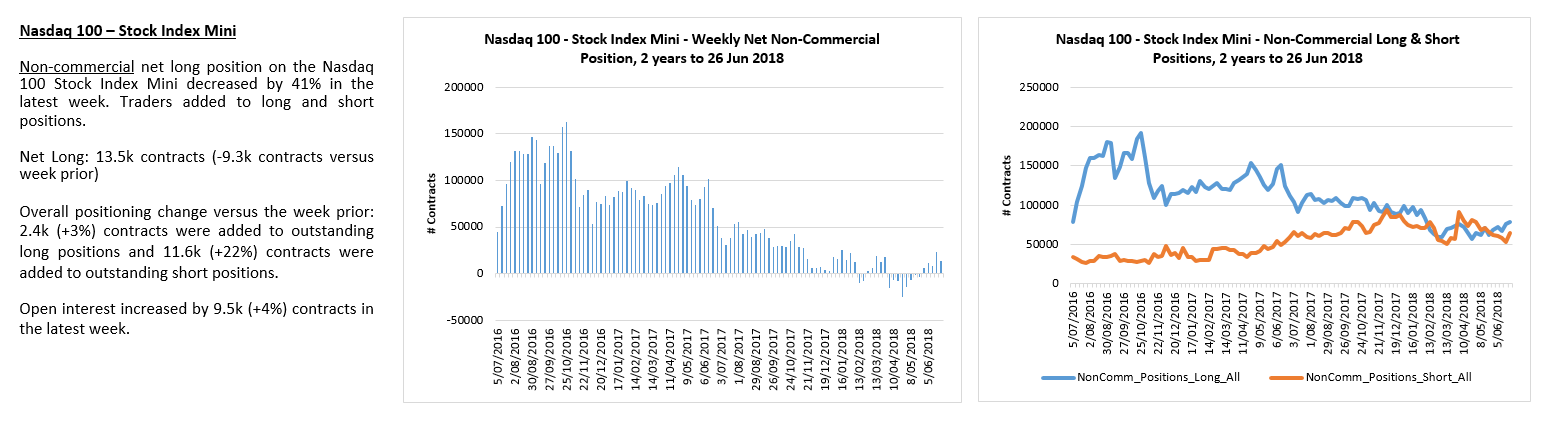
NQ traders paring back longs.
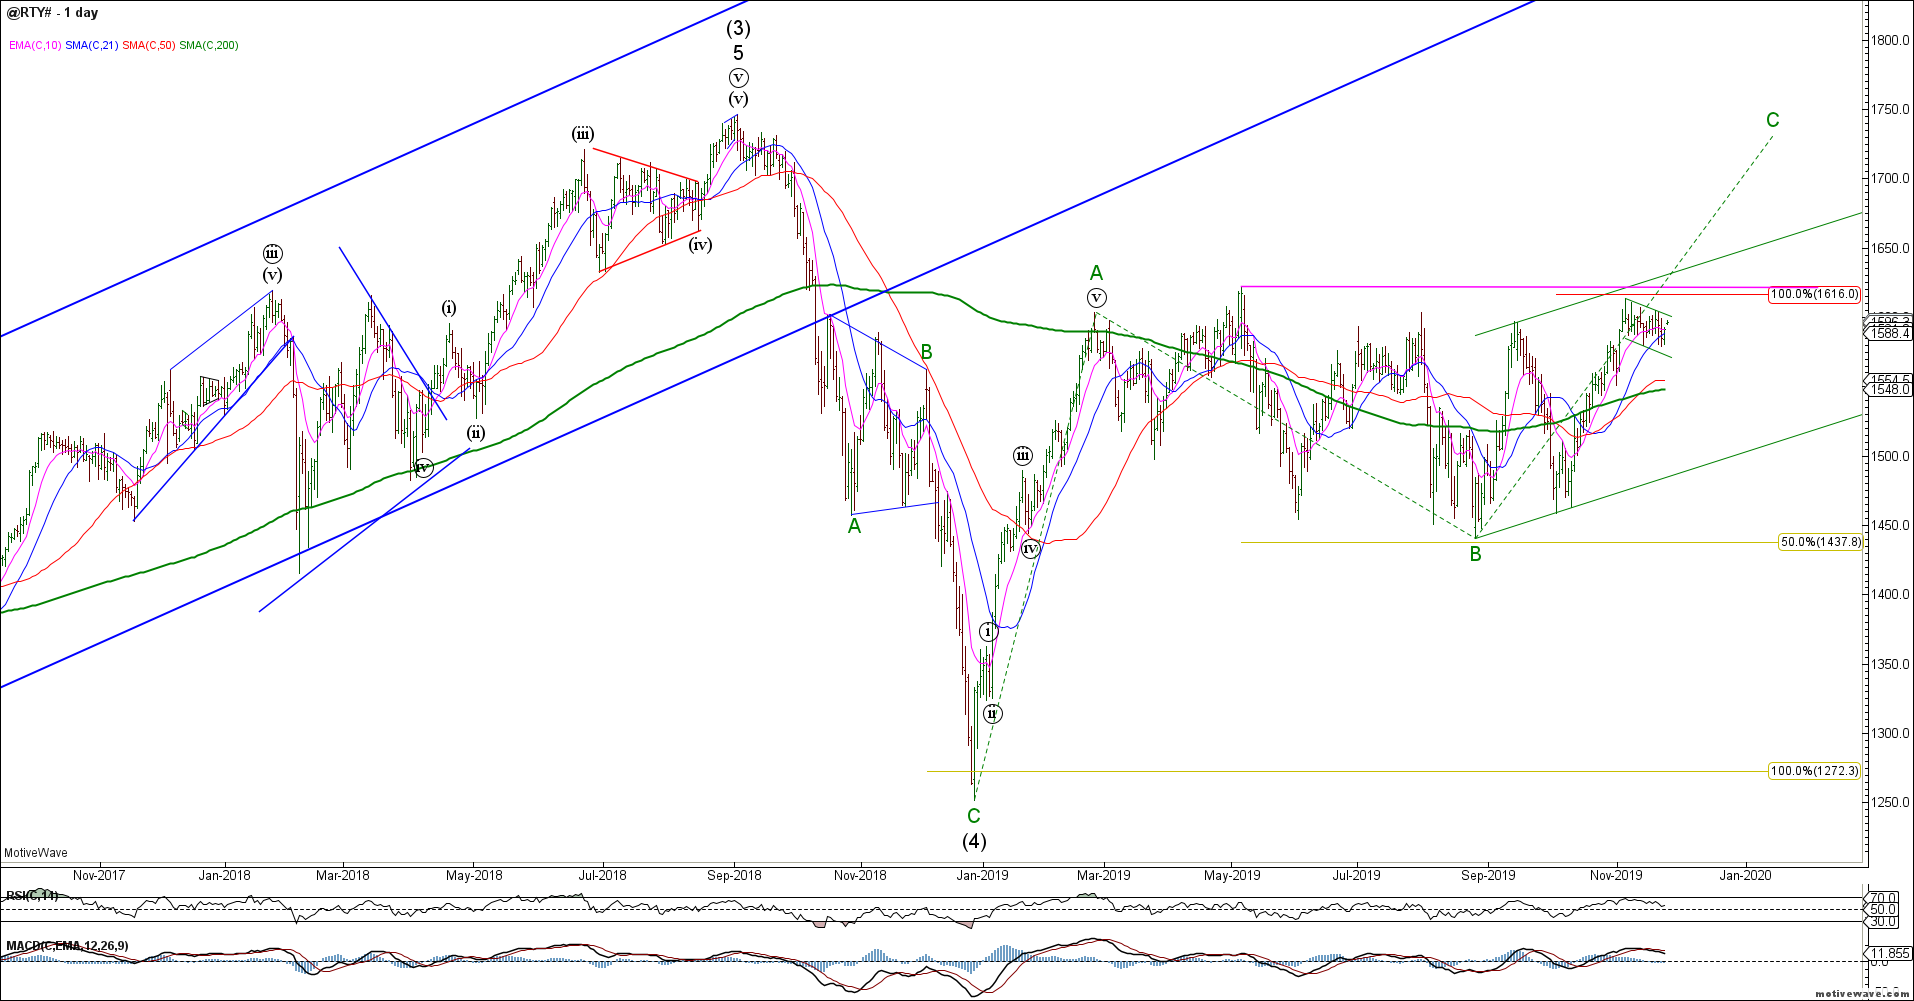
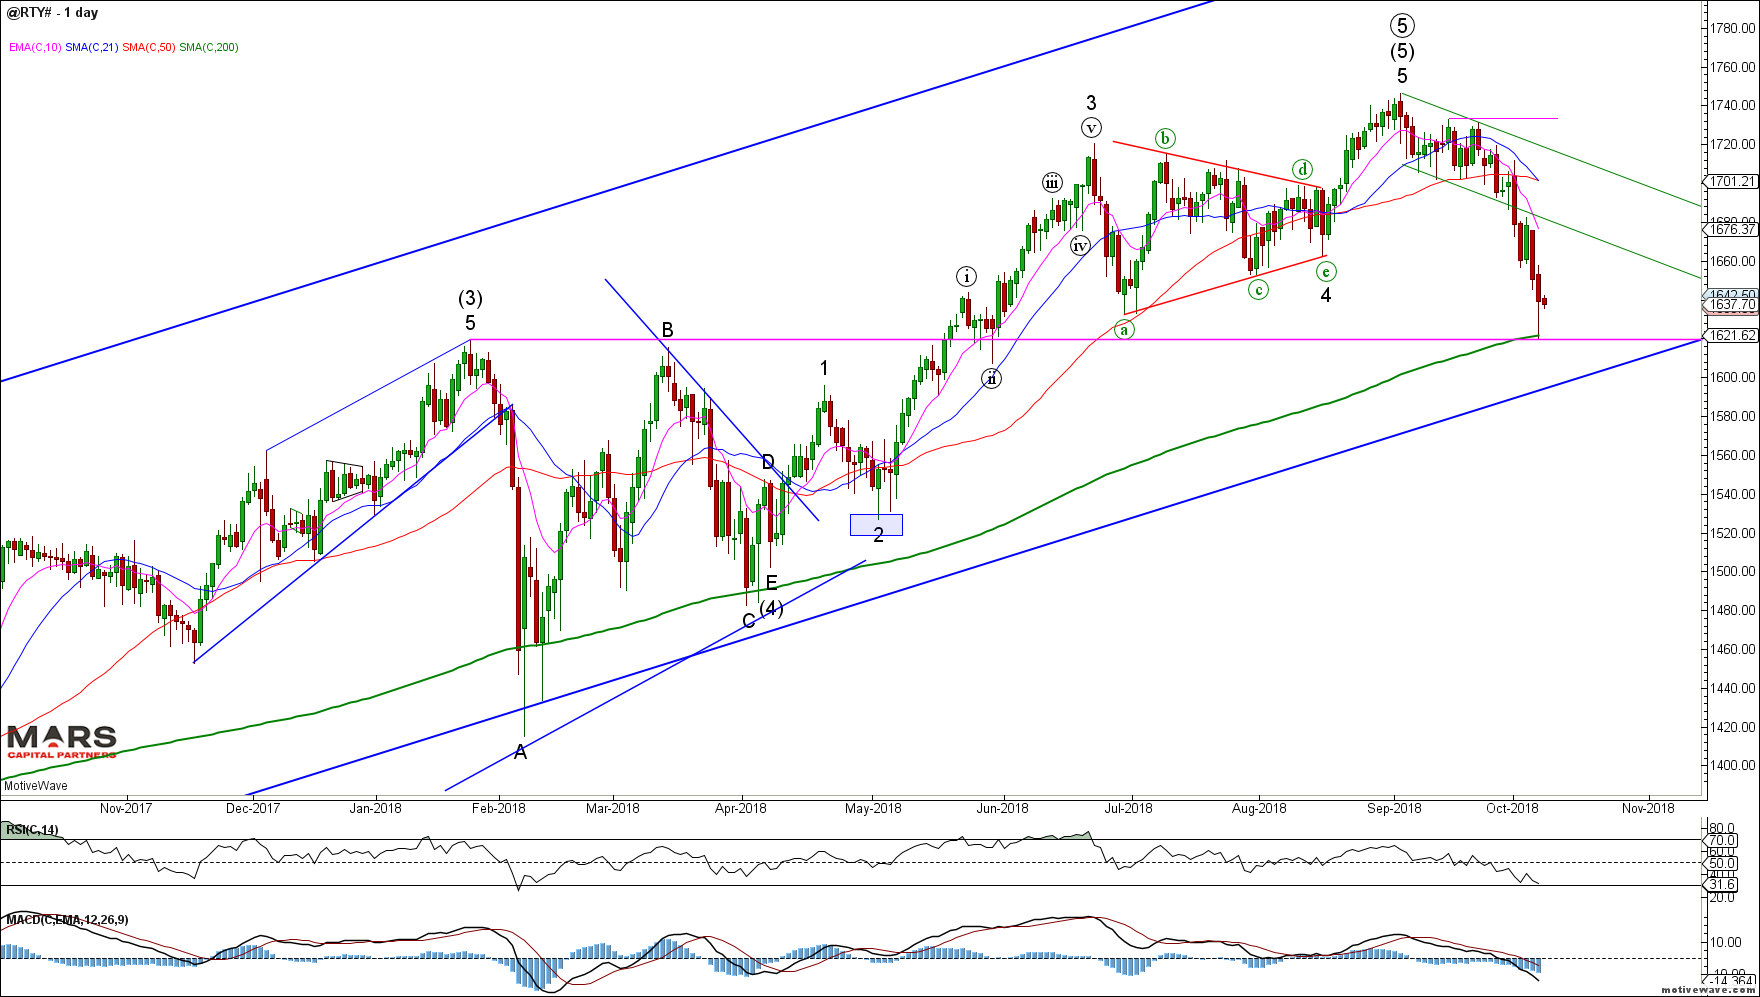
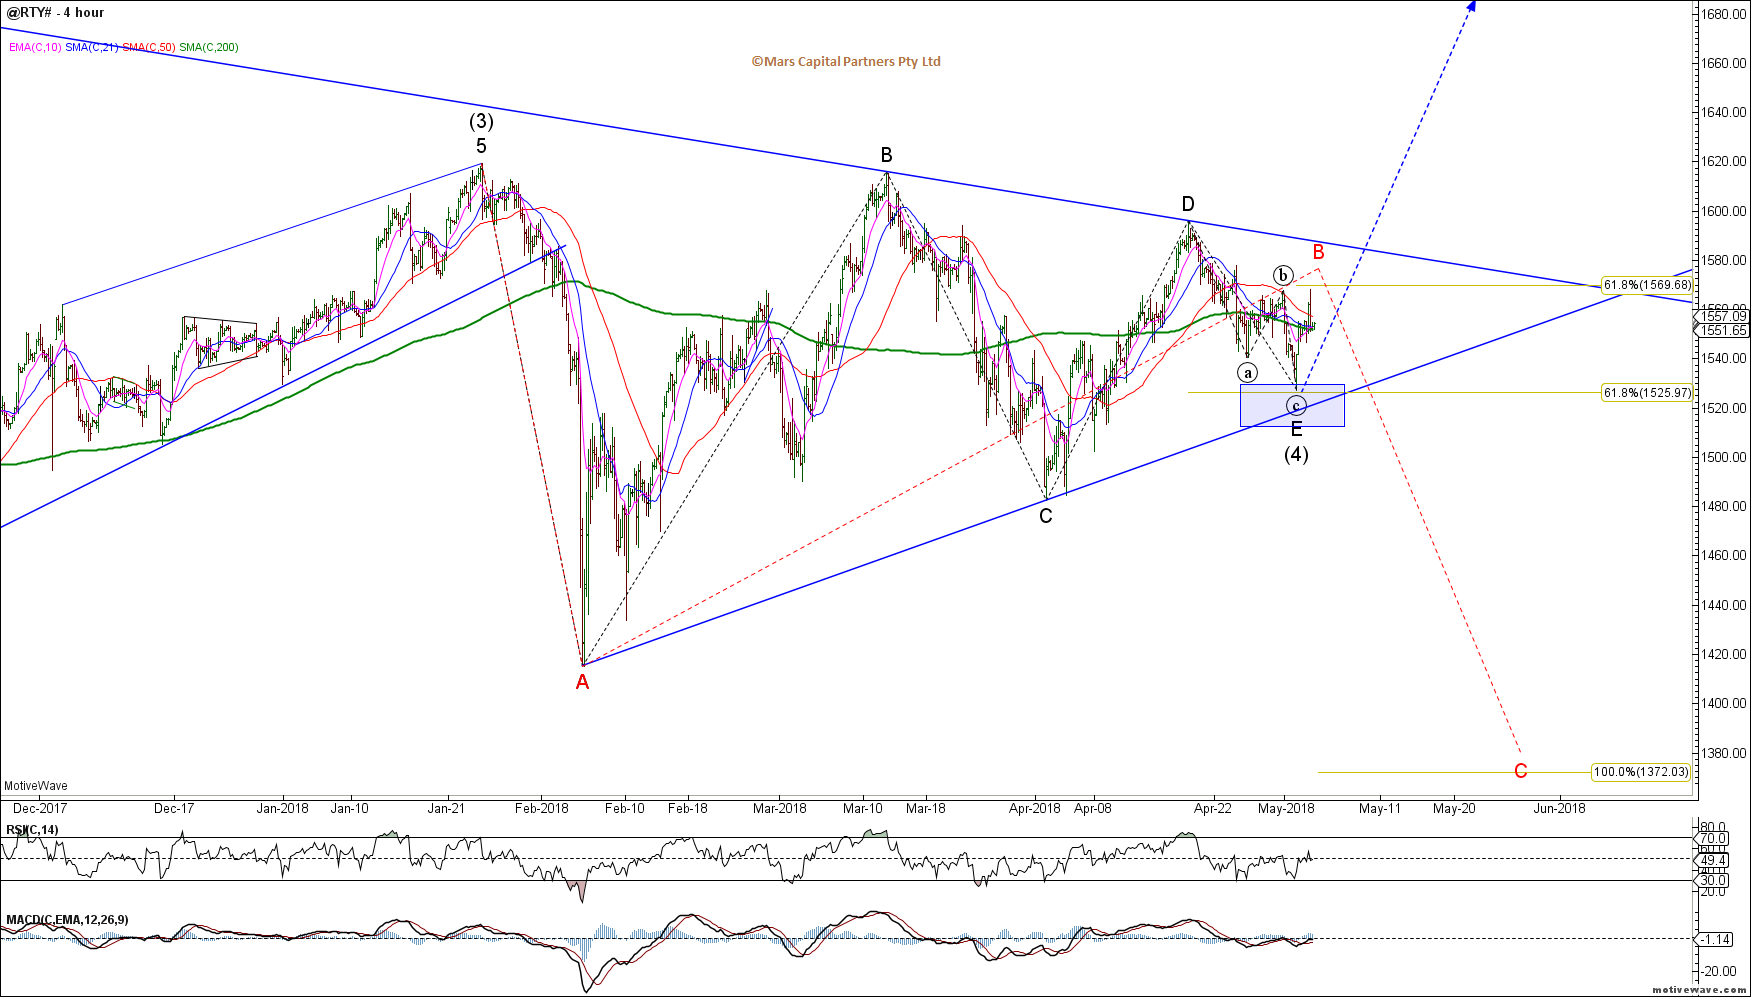
The Russell 2000 / RTY continues to trade sideways in what appears to be a bull flag prior to a range breakout. A strong close above 1616-25 resistance would likely trigger a chase higher for the small caps. In the meantime, resistance continues to hold.
RTY Daily
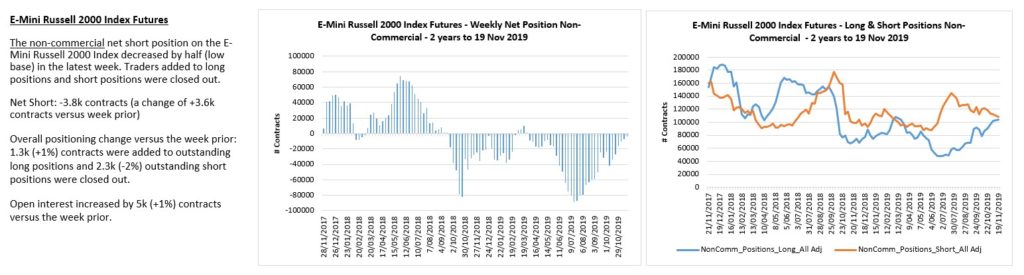
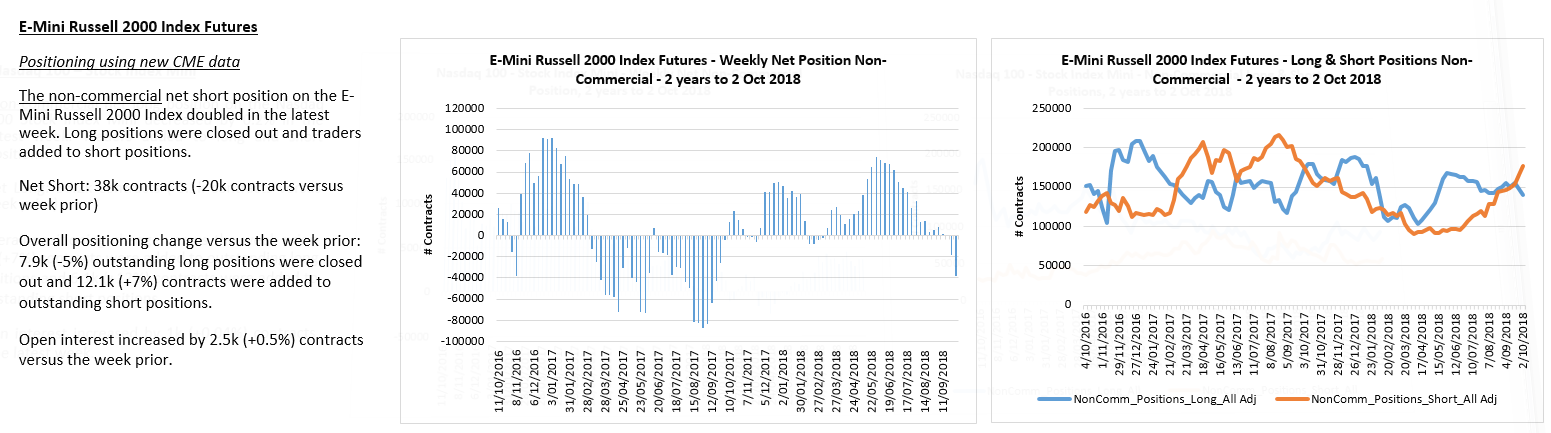
RTY traders are flat.
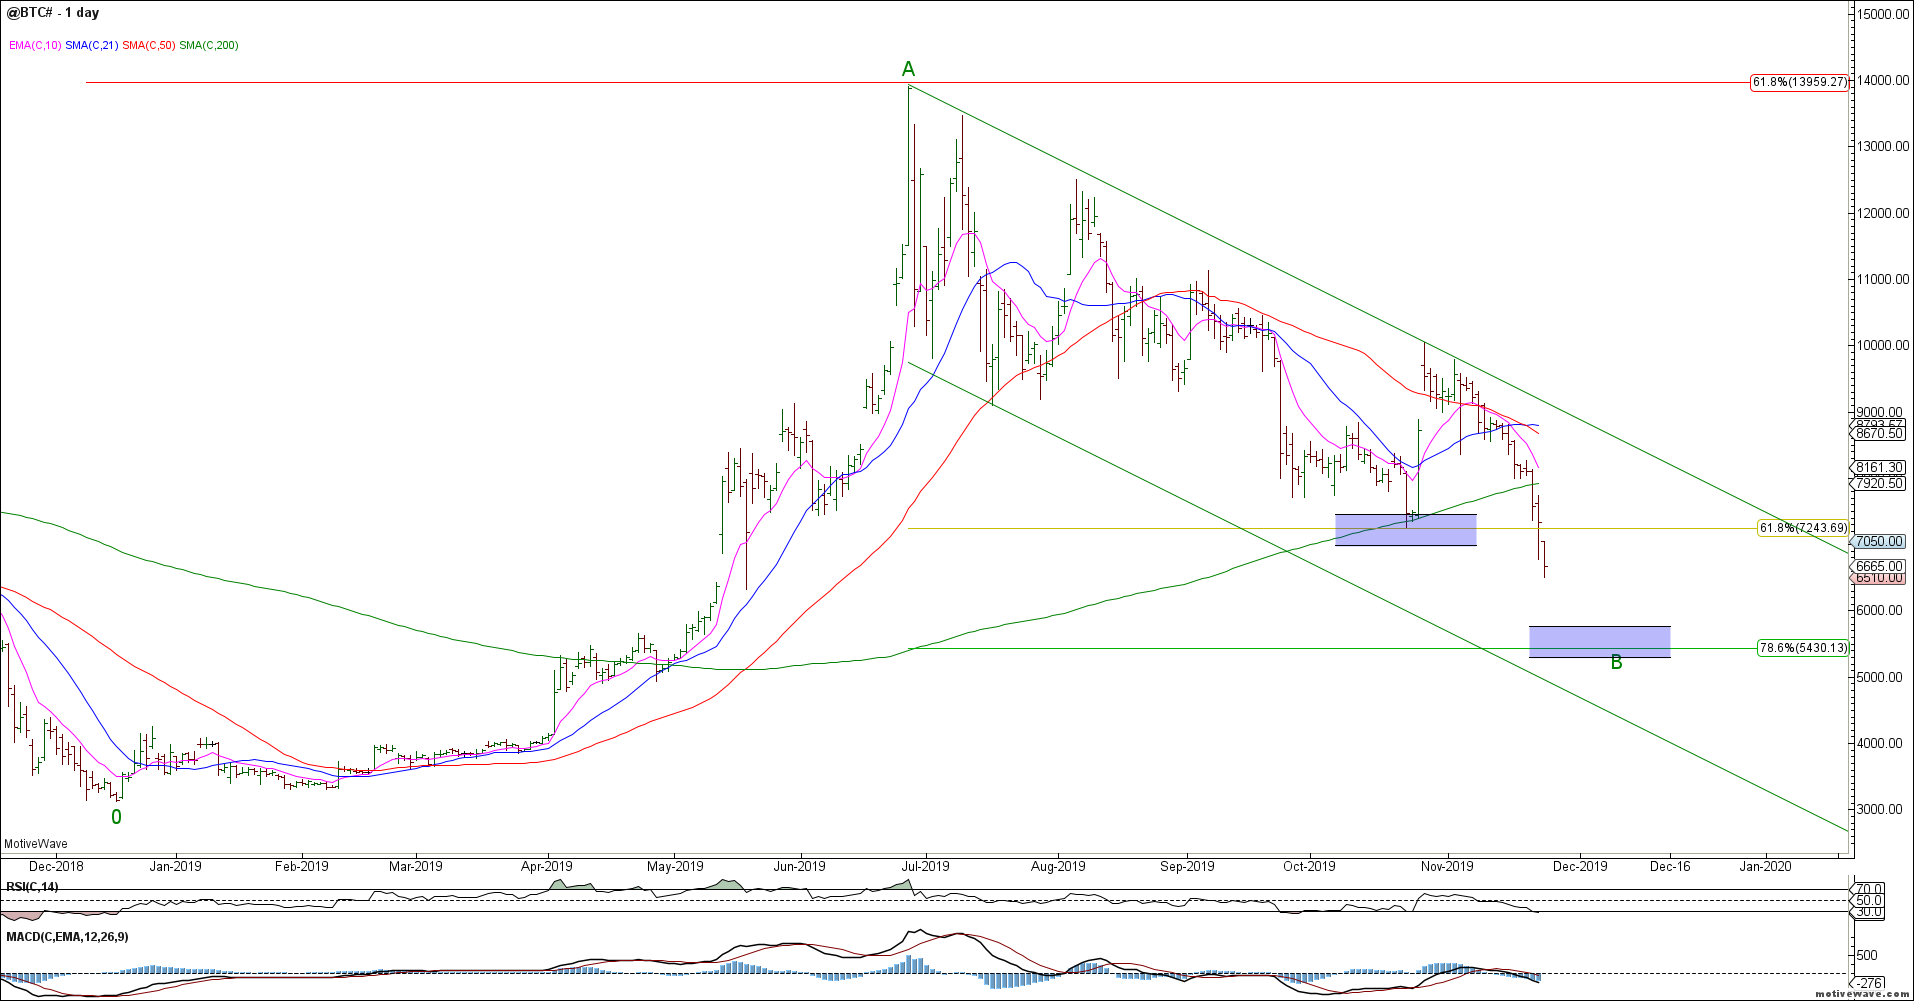
Bitcoin broke our Fib and 200 day sma support and puked lower. This decline invalidated our near term bullish count. We no longer have a clear corrective count for BTC but the next ideal downside support targets reside in the 5400 area.
BTC Daily
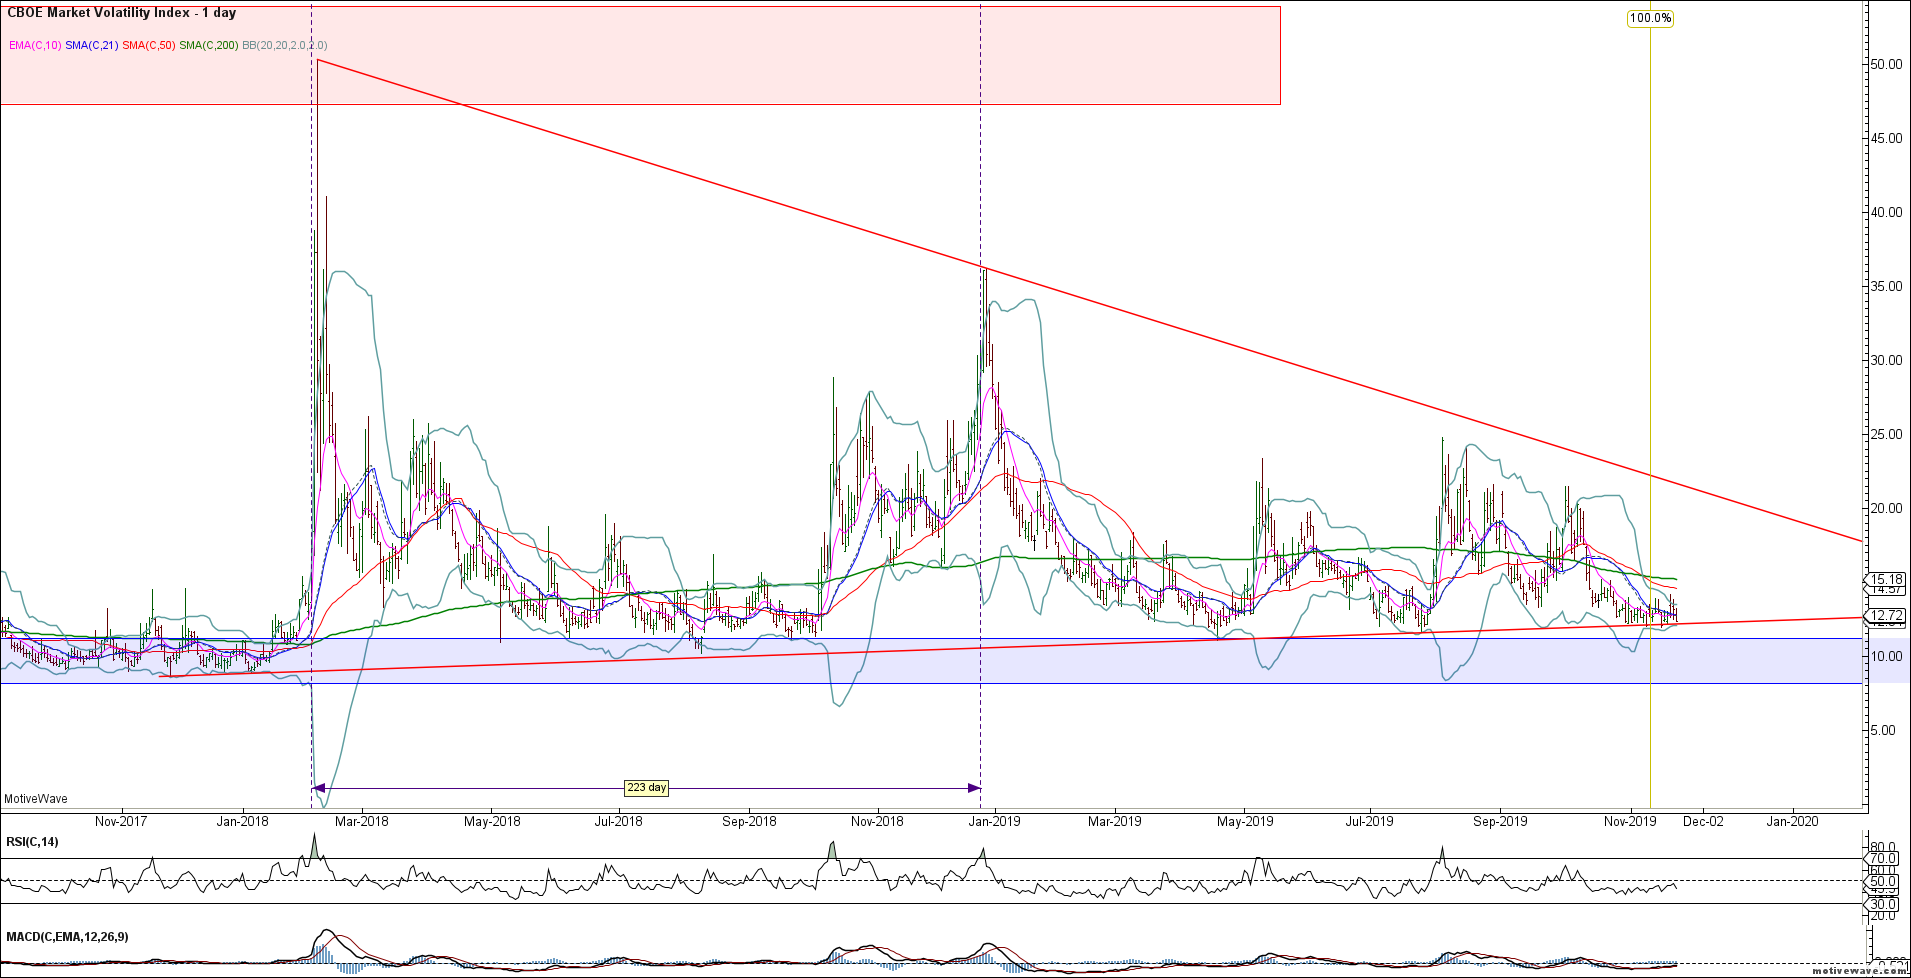
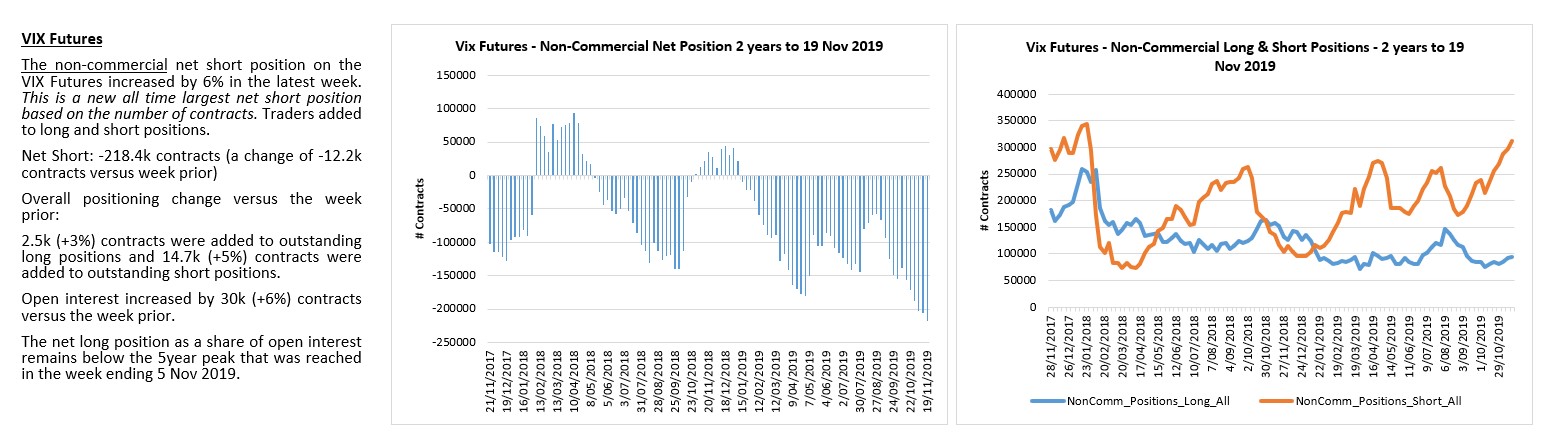
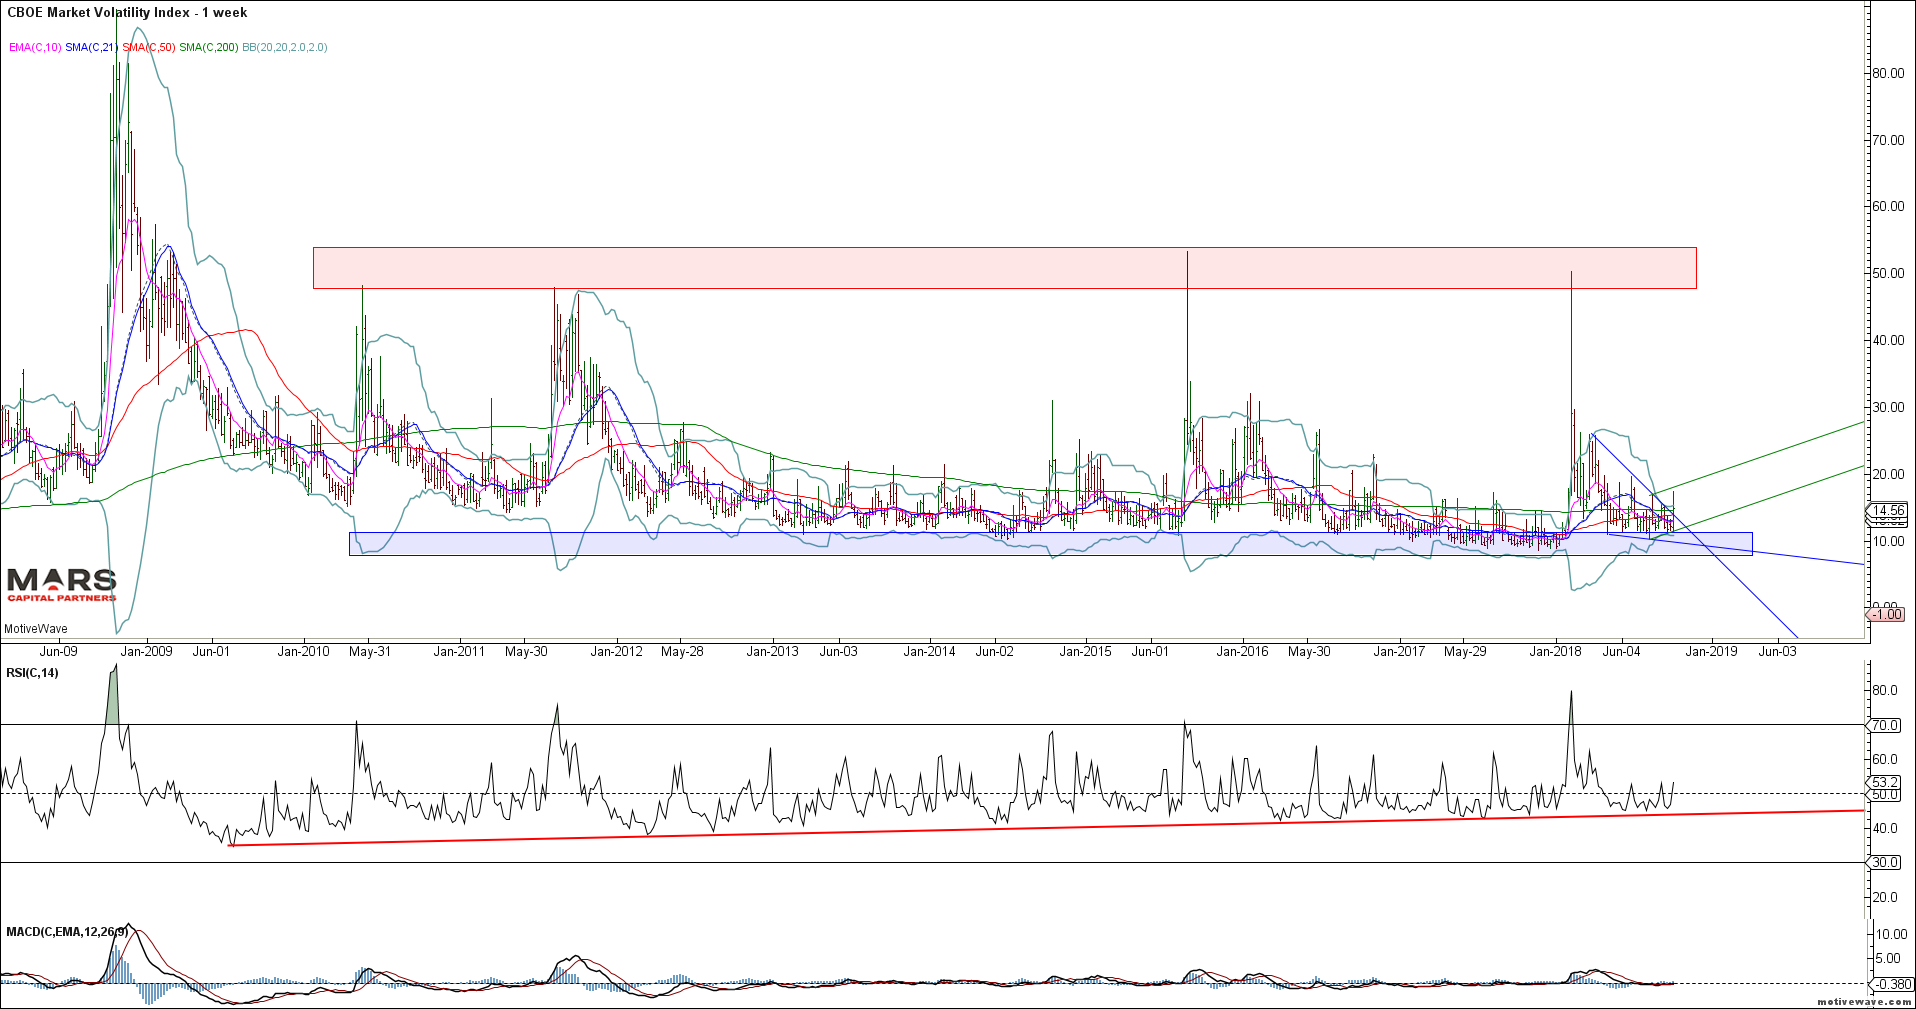
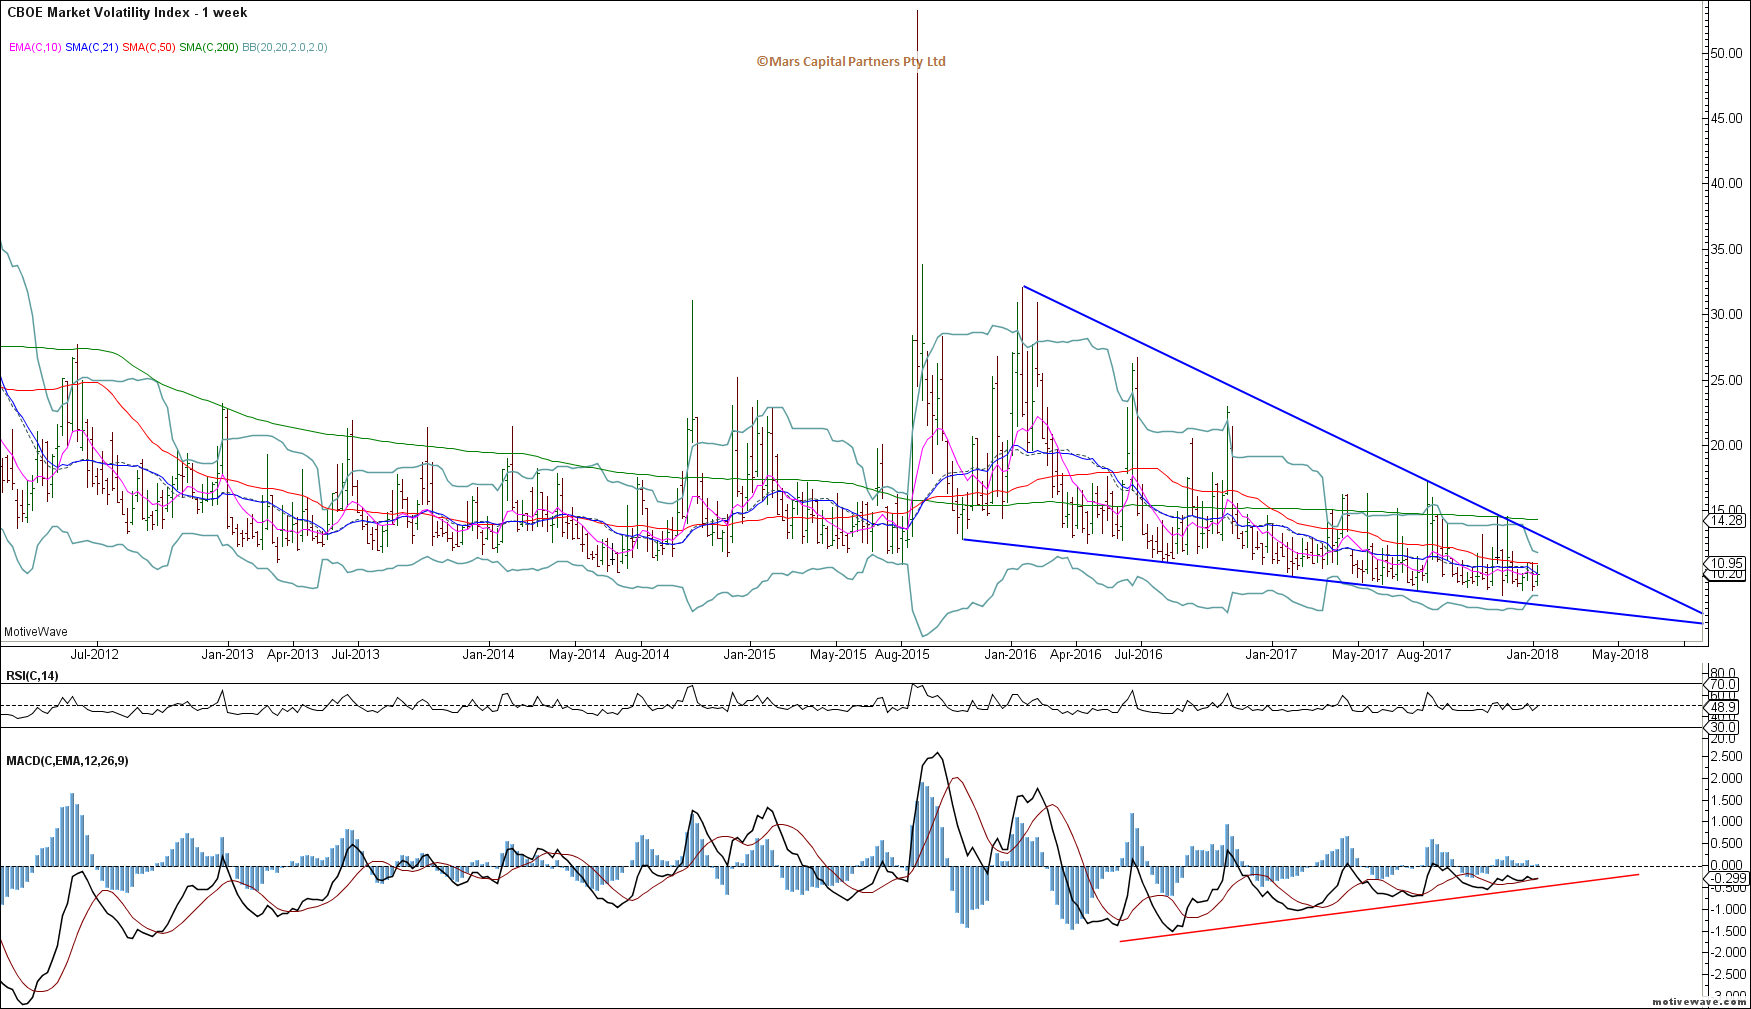
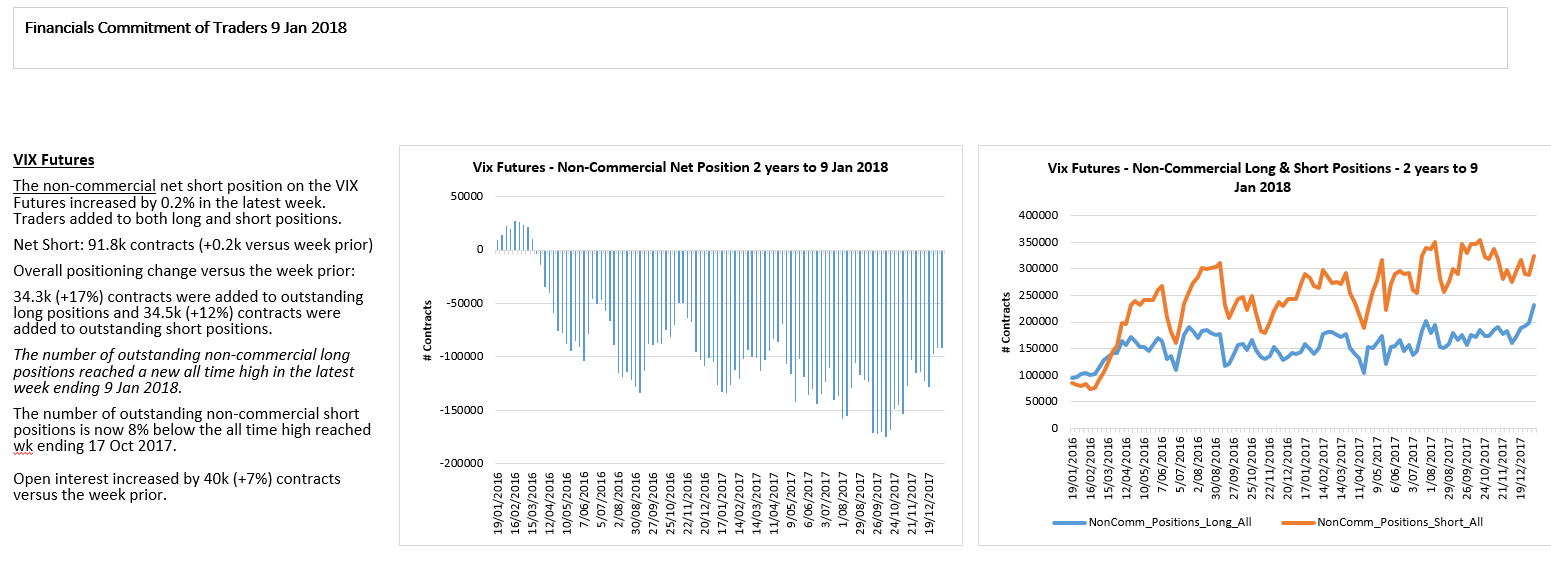
The VIX has shown no evidence of a bullish reversal and is threatening to break lower. With net short positioning at extremes the VIX is vulnerable to a short squeeze but the market has shown no evidence of trend exhaustion.
VIX Daily
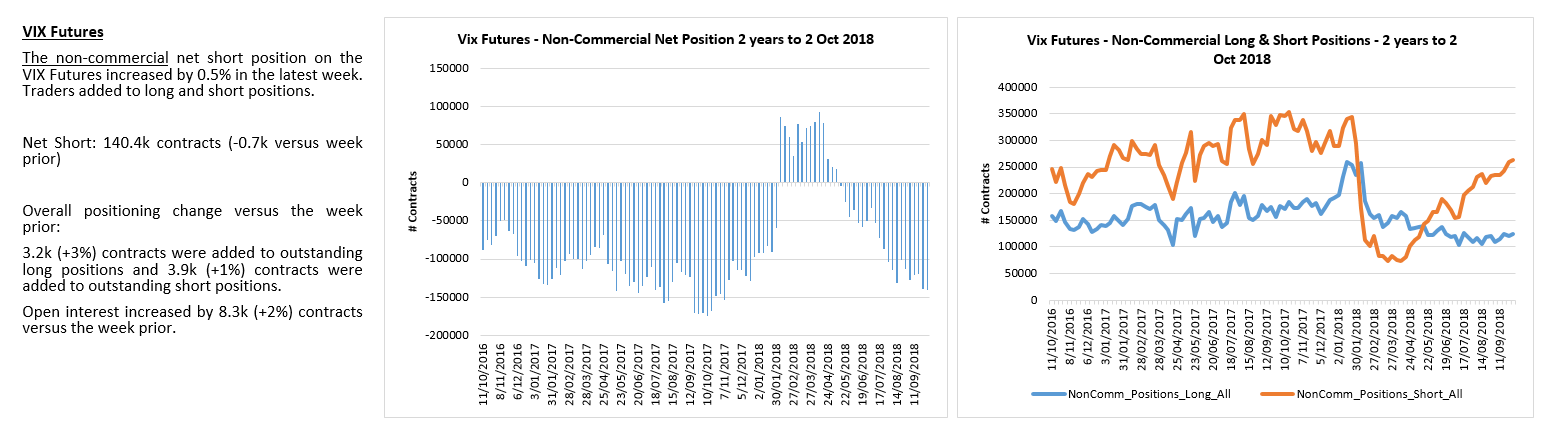
Net VIX shorts continue to press into extremes.
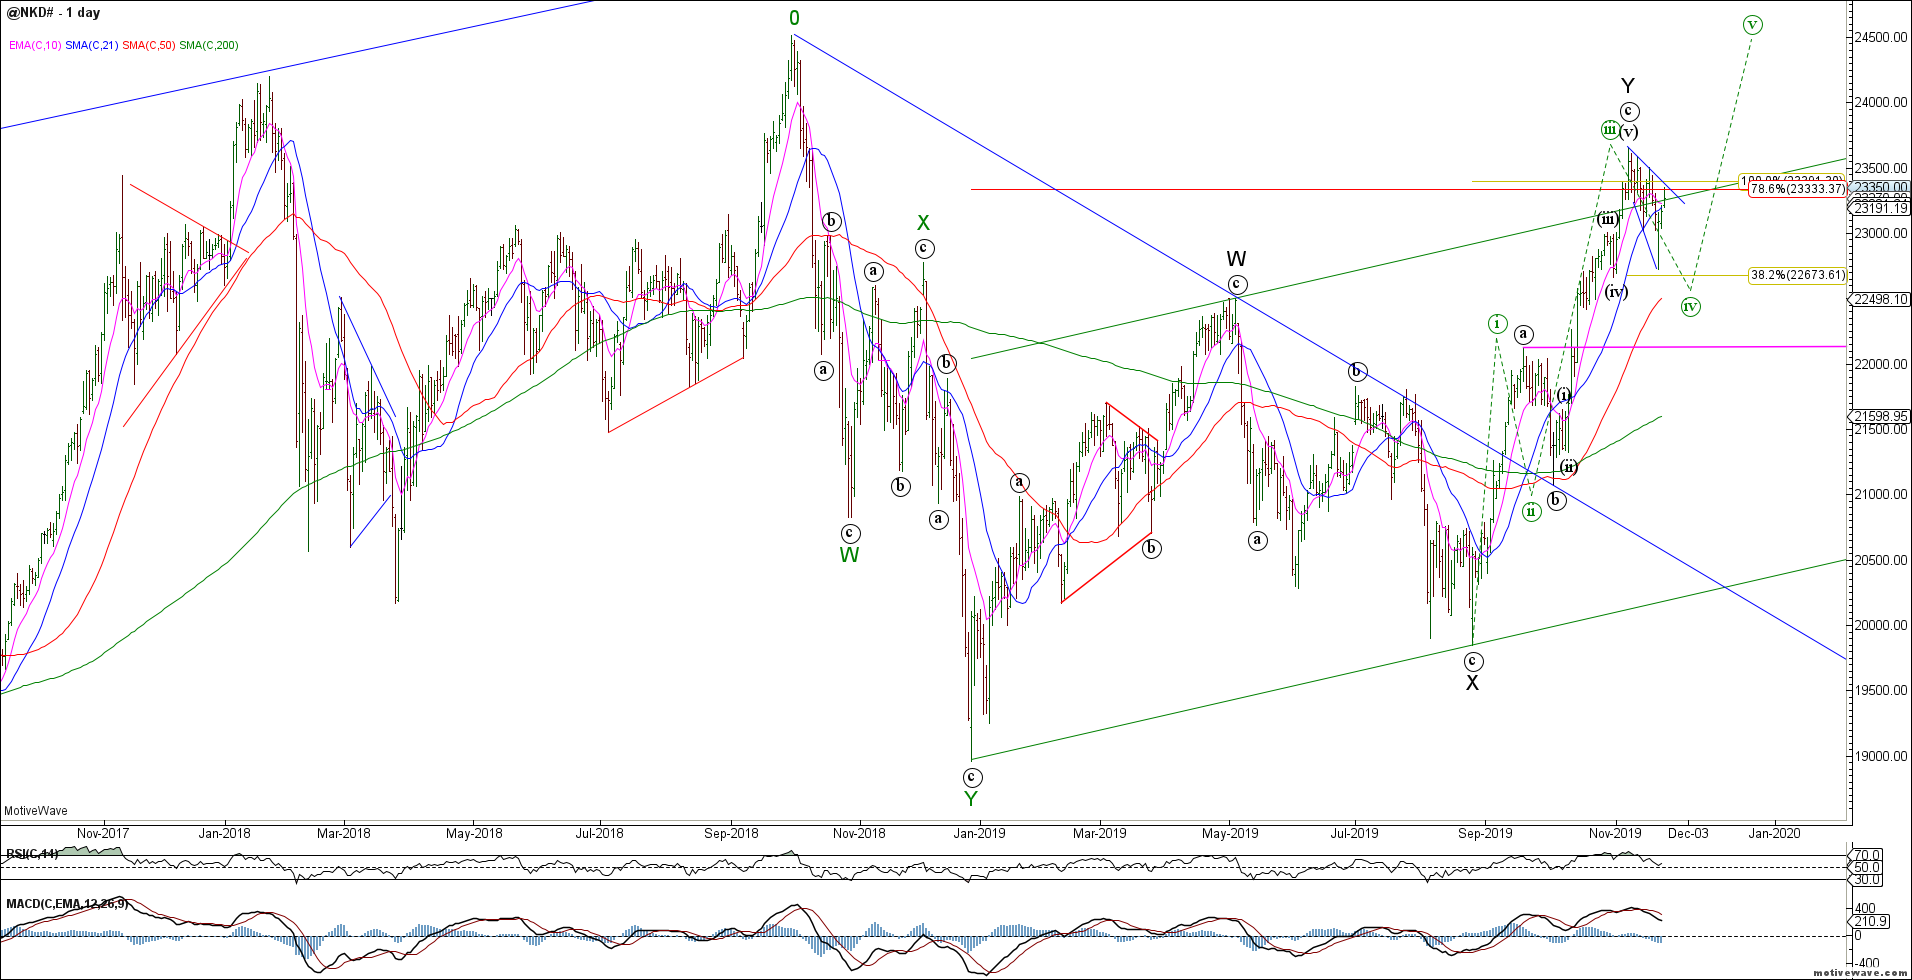
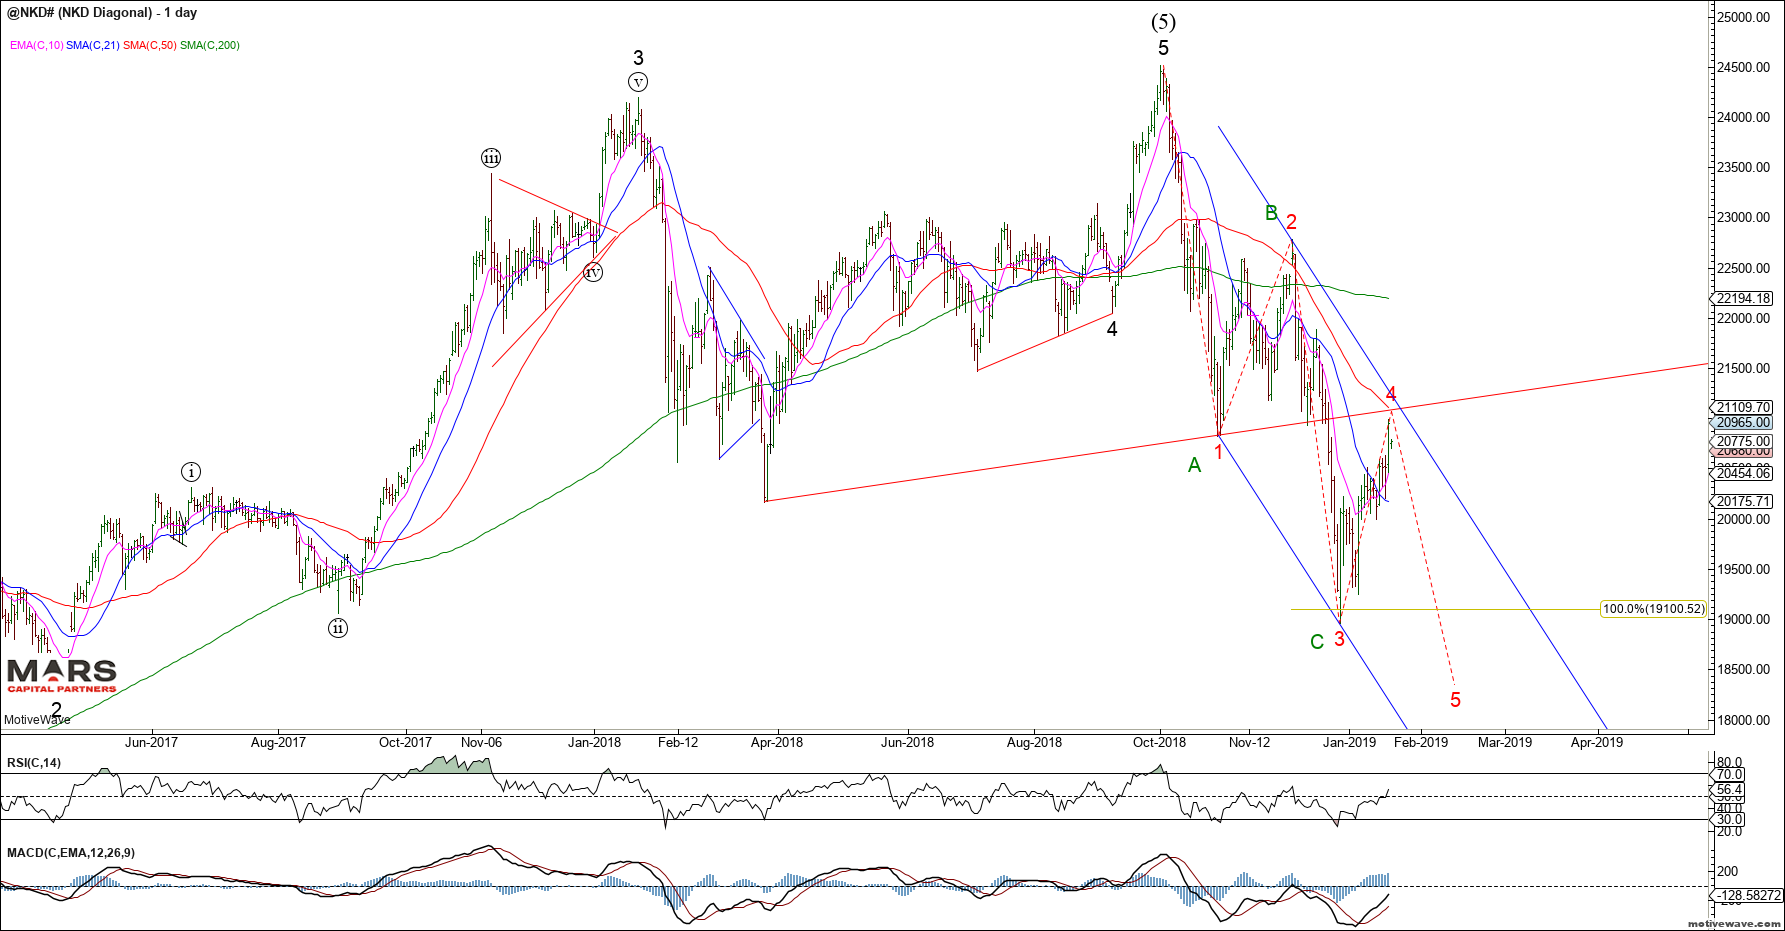
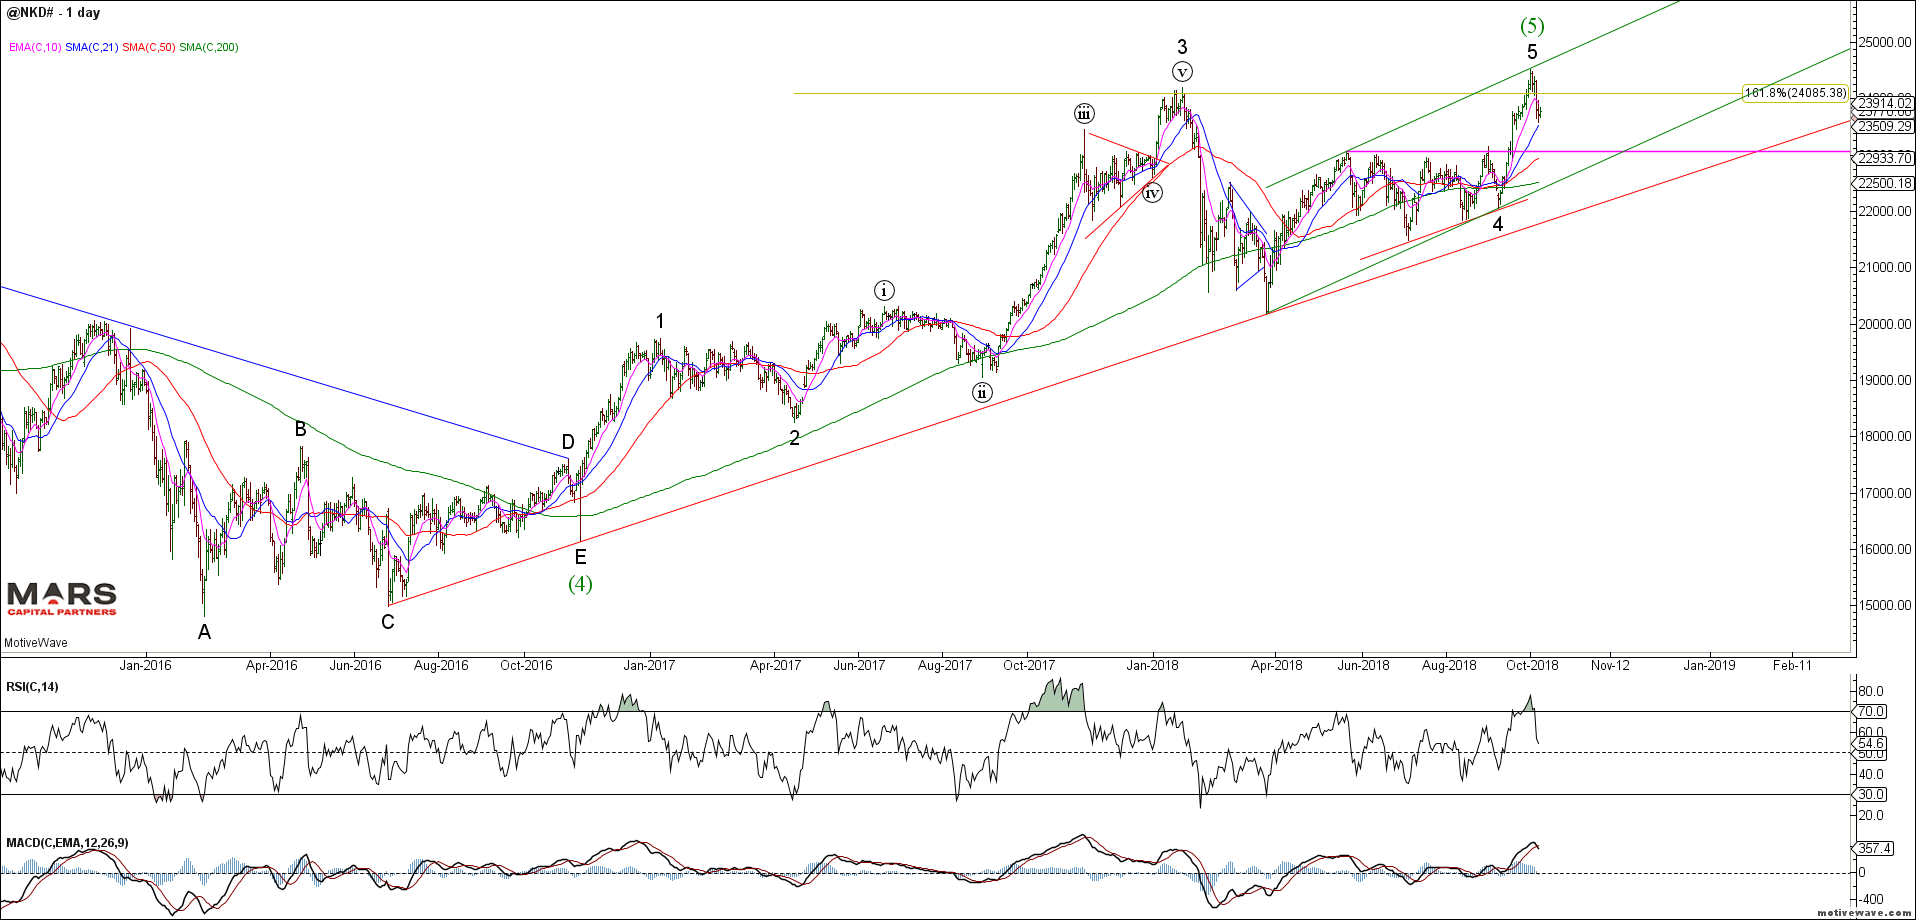
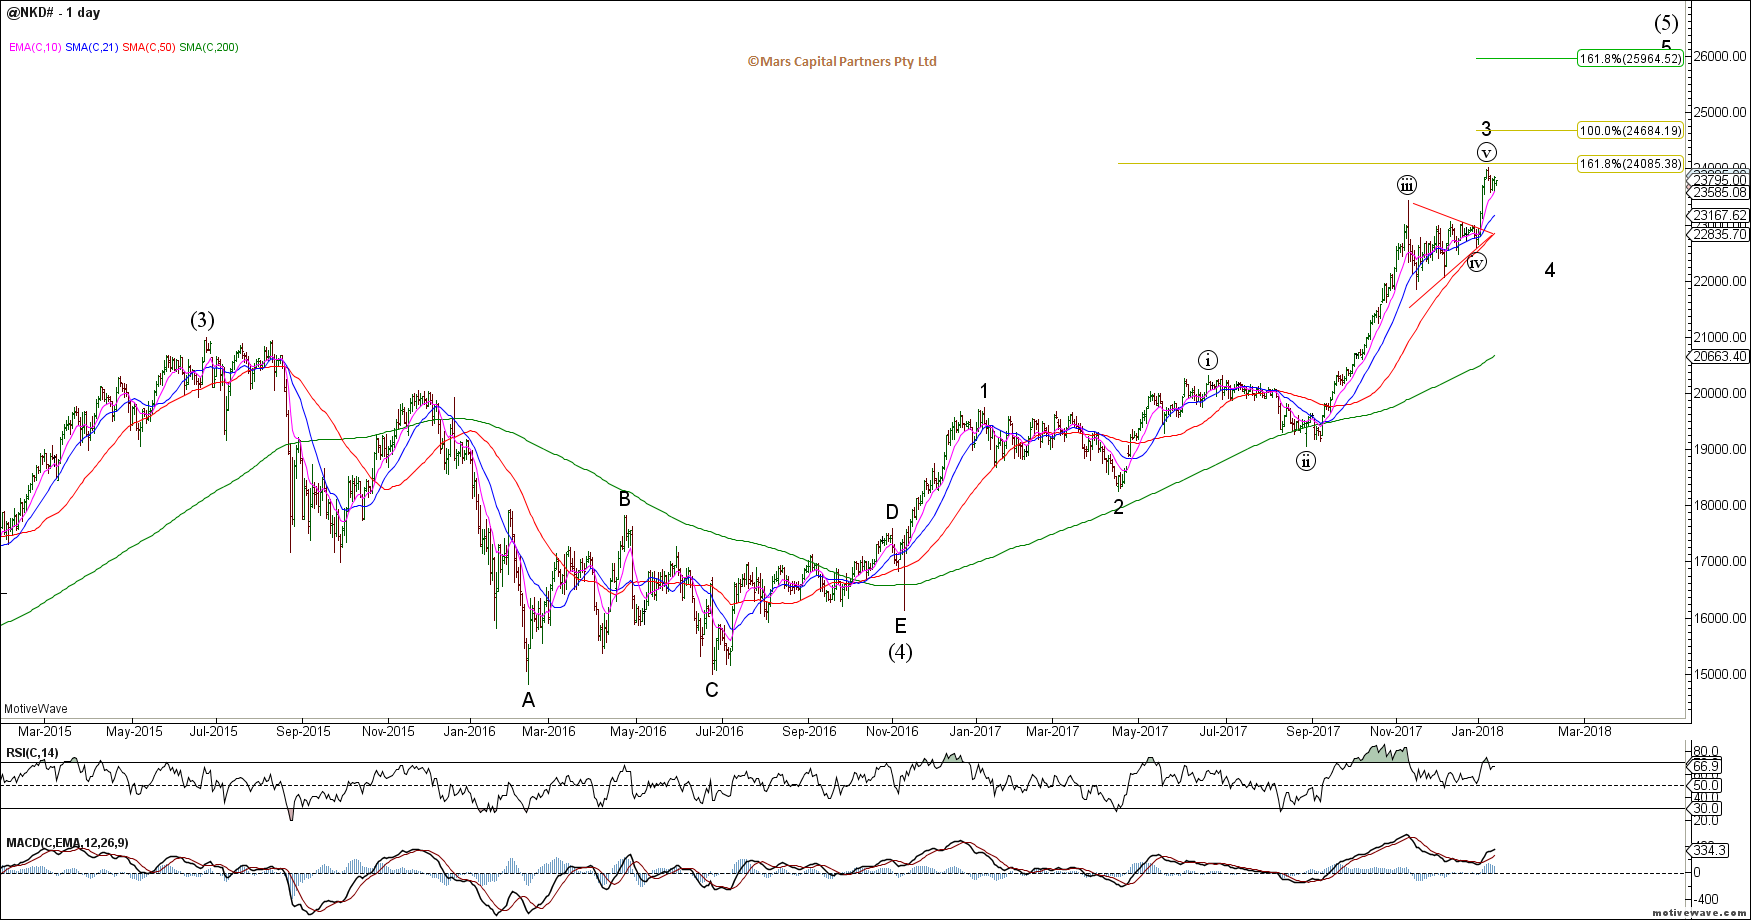
The global equity markets corrected lower last week but there is no strong evidence of a bearish reversal. The NKD declined into previous wave (iv) support then reversed higher. This opens the door to a more bullish interpretation of a wave (iv) correction before wave (v) pushes higher to retest swing highs.
NKD Daily
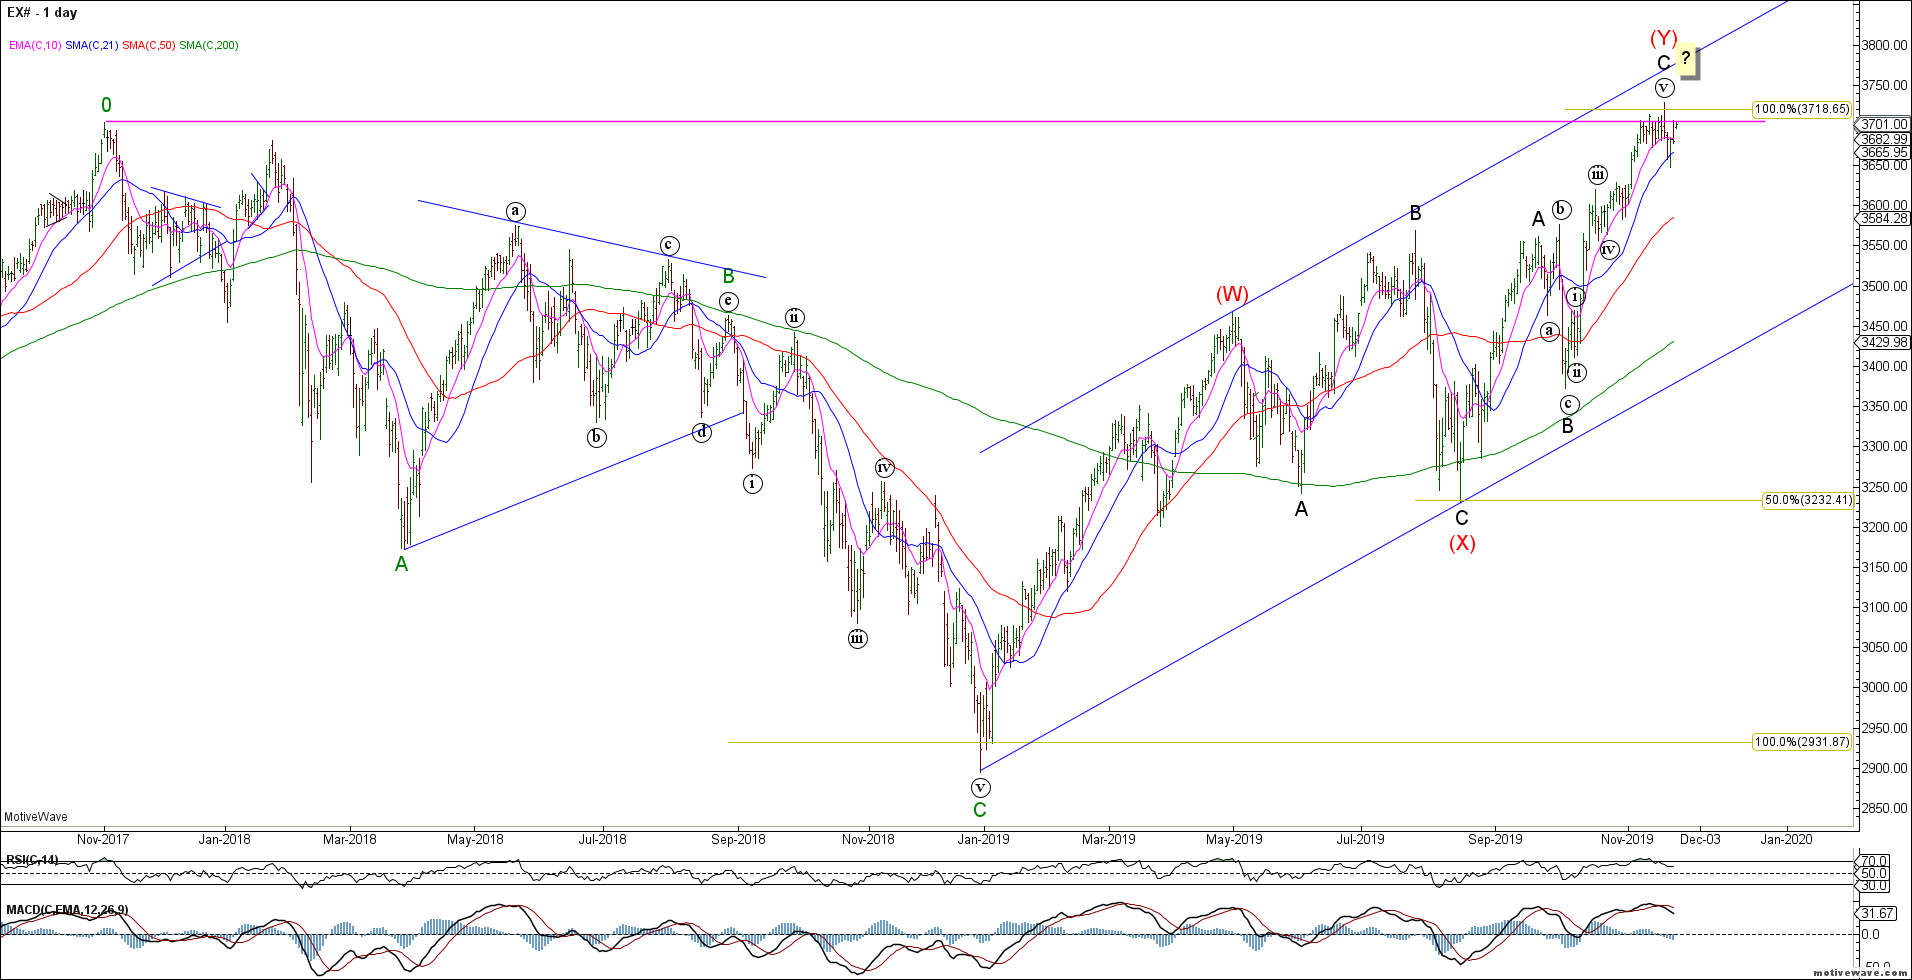
The ESTX achieved upside measured targets but failed to sustain a reversal lower. The bullish trend remains in tact until we see a clear impulsive 5 wave decline to reverse this trend. Either way, longs should be very cautious here because at best any new cycle high will likely be a final 5th wave.
ESTX Daily
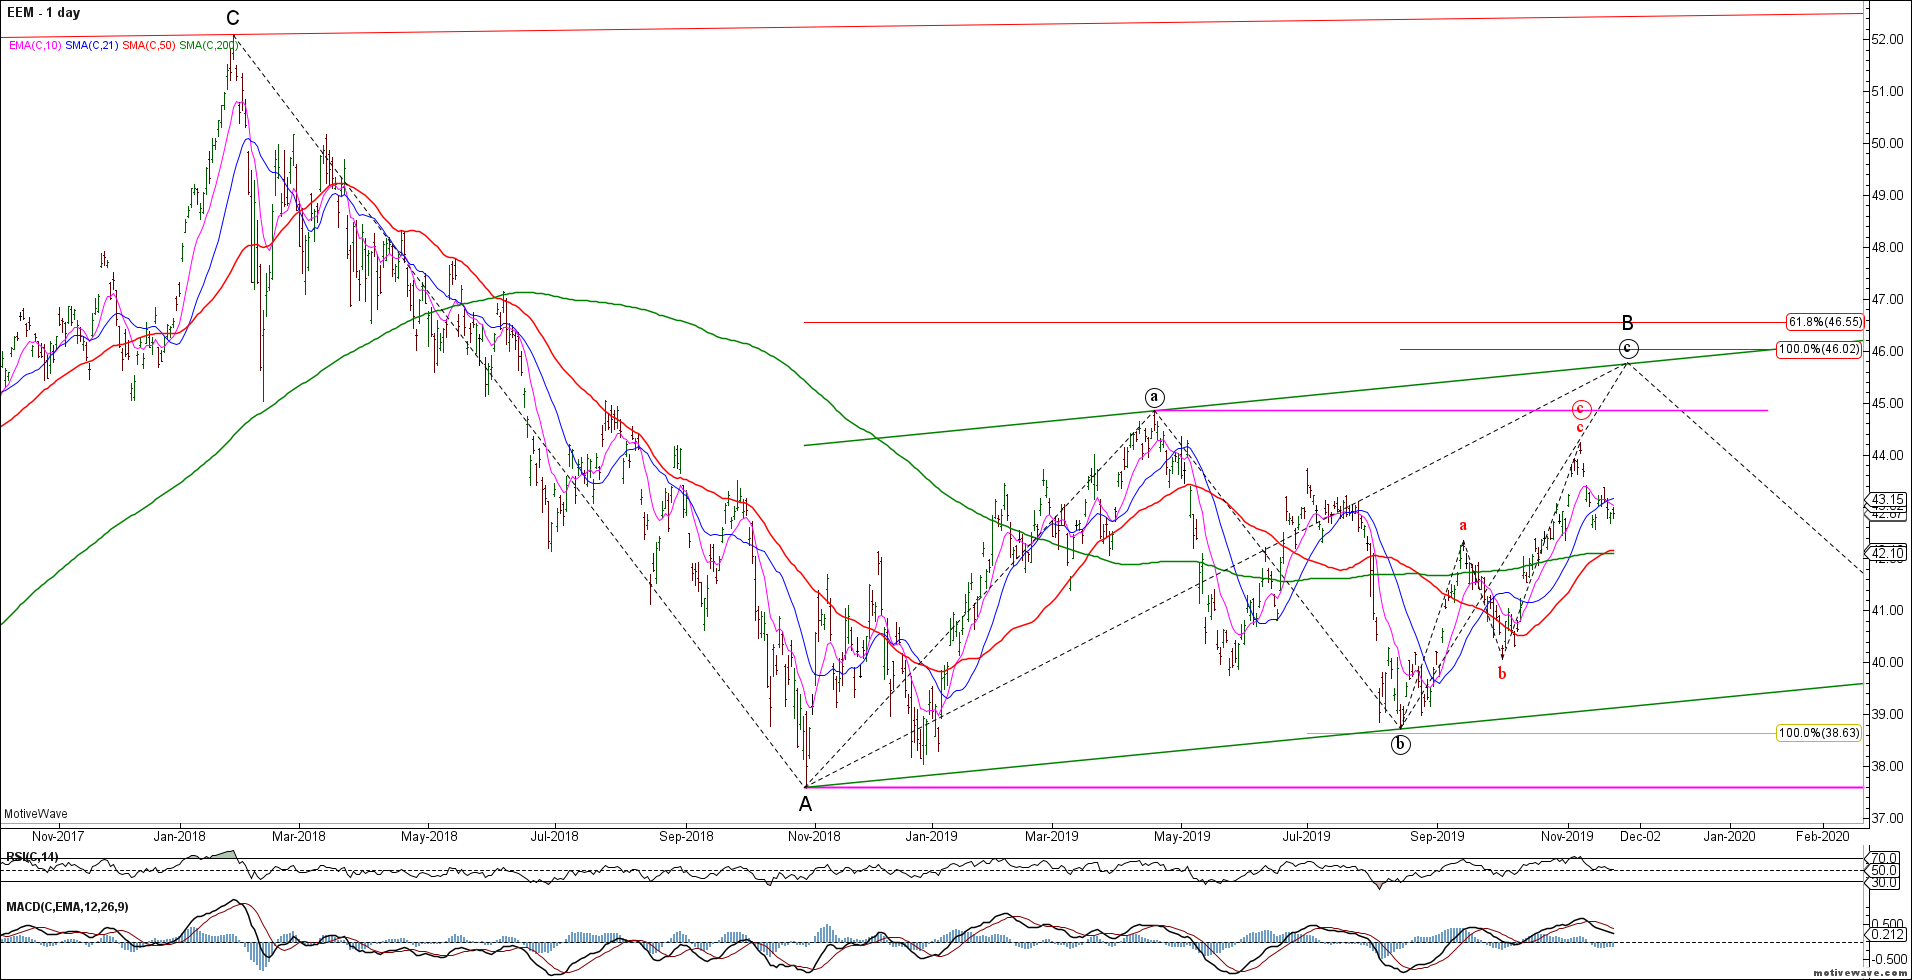
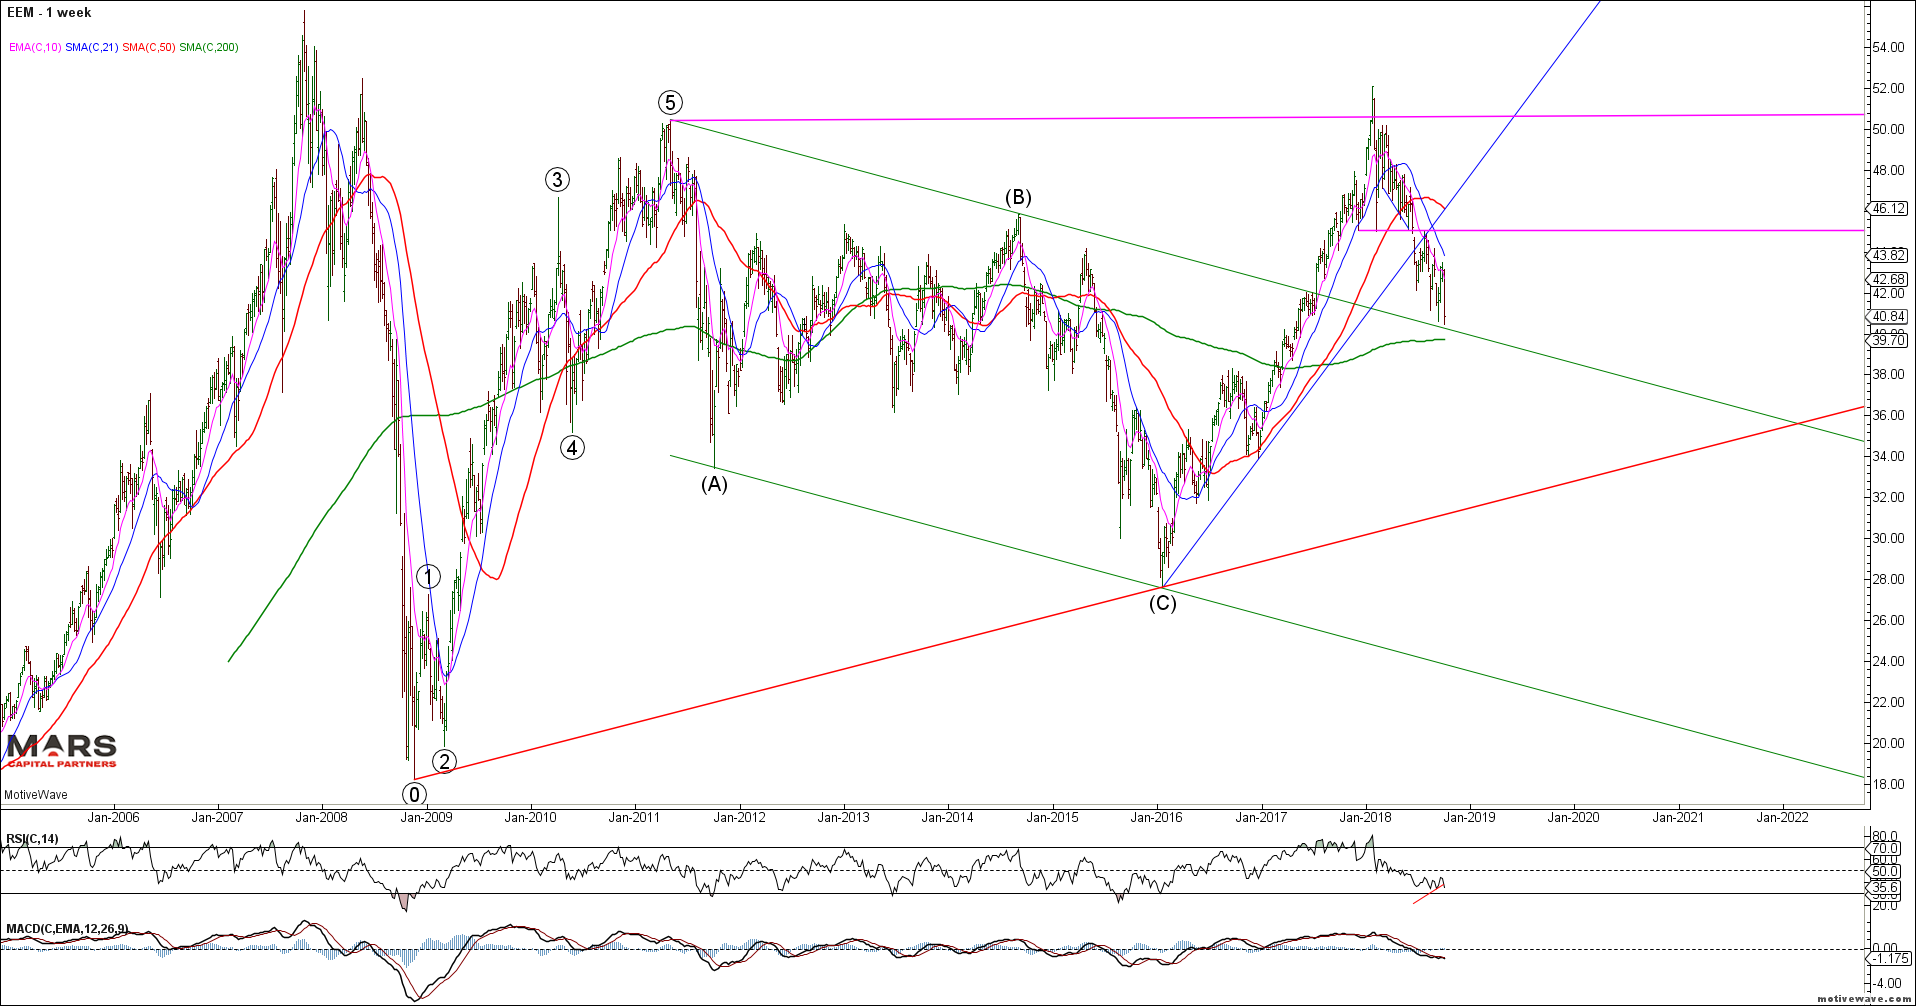
The Emerging Markets (EEM) continues to underperform and with only 3 waves up so far, it is unclear whether we get a final push higher towards ideal 46 targets. The EEM will continue to underperform while the US$ remains strong. Risks failure here given our bigger picture bearish outlook.
EEM Daily
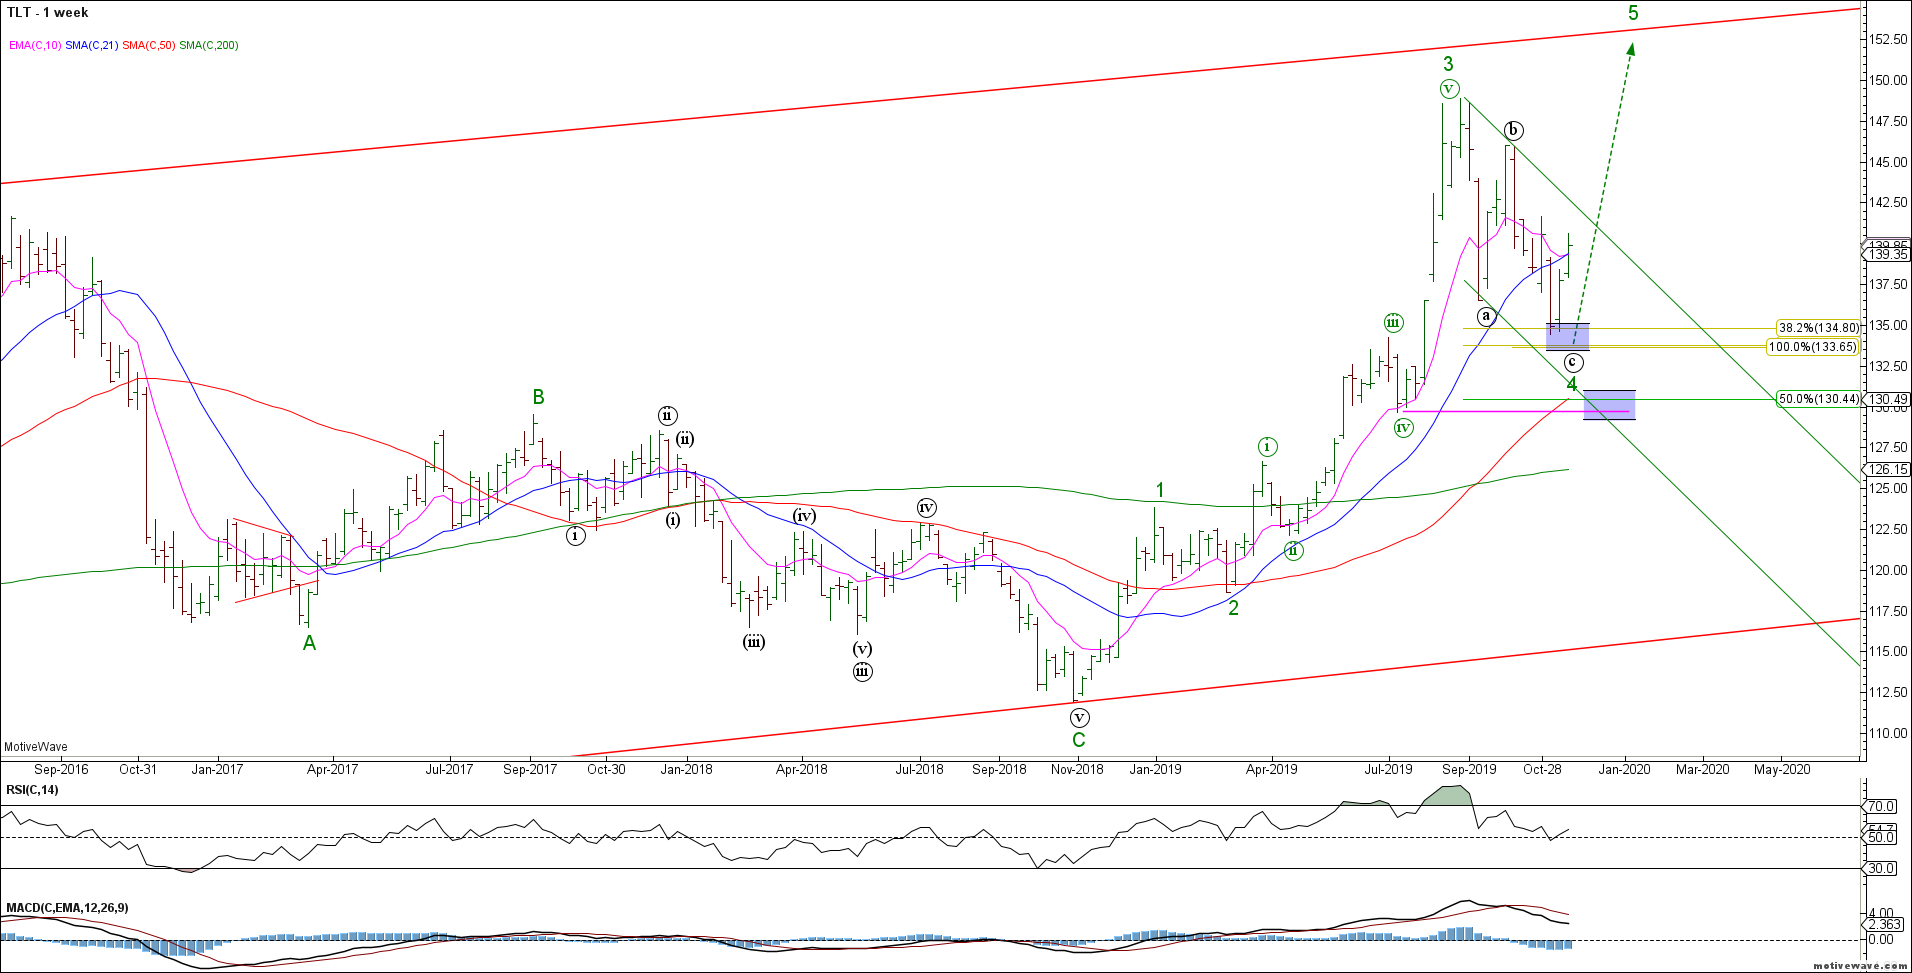
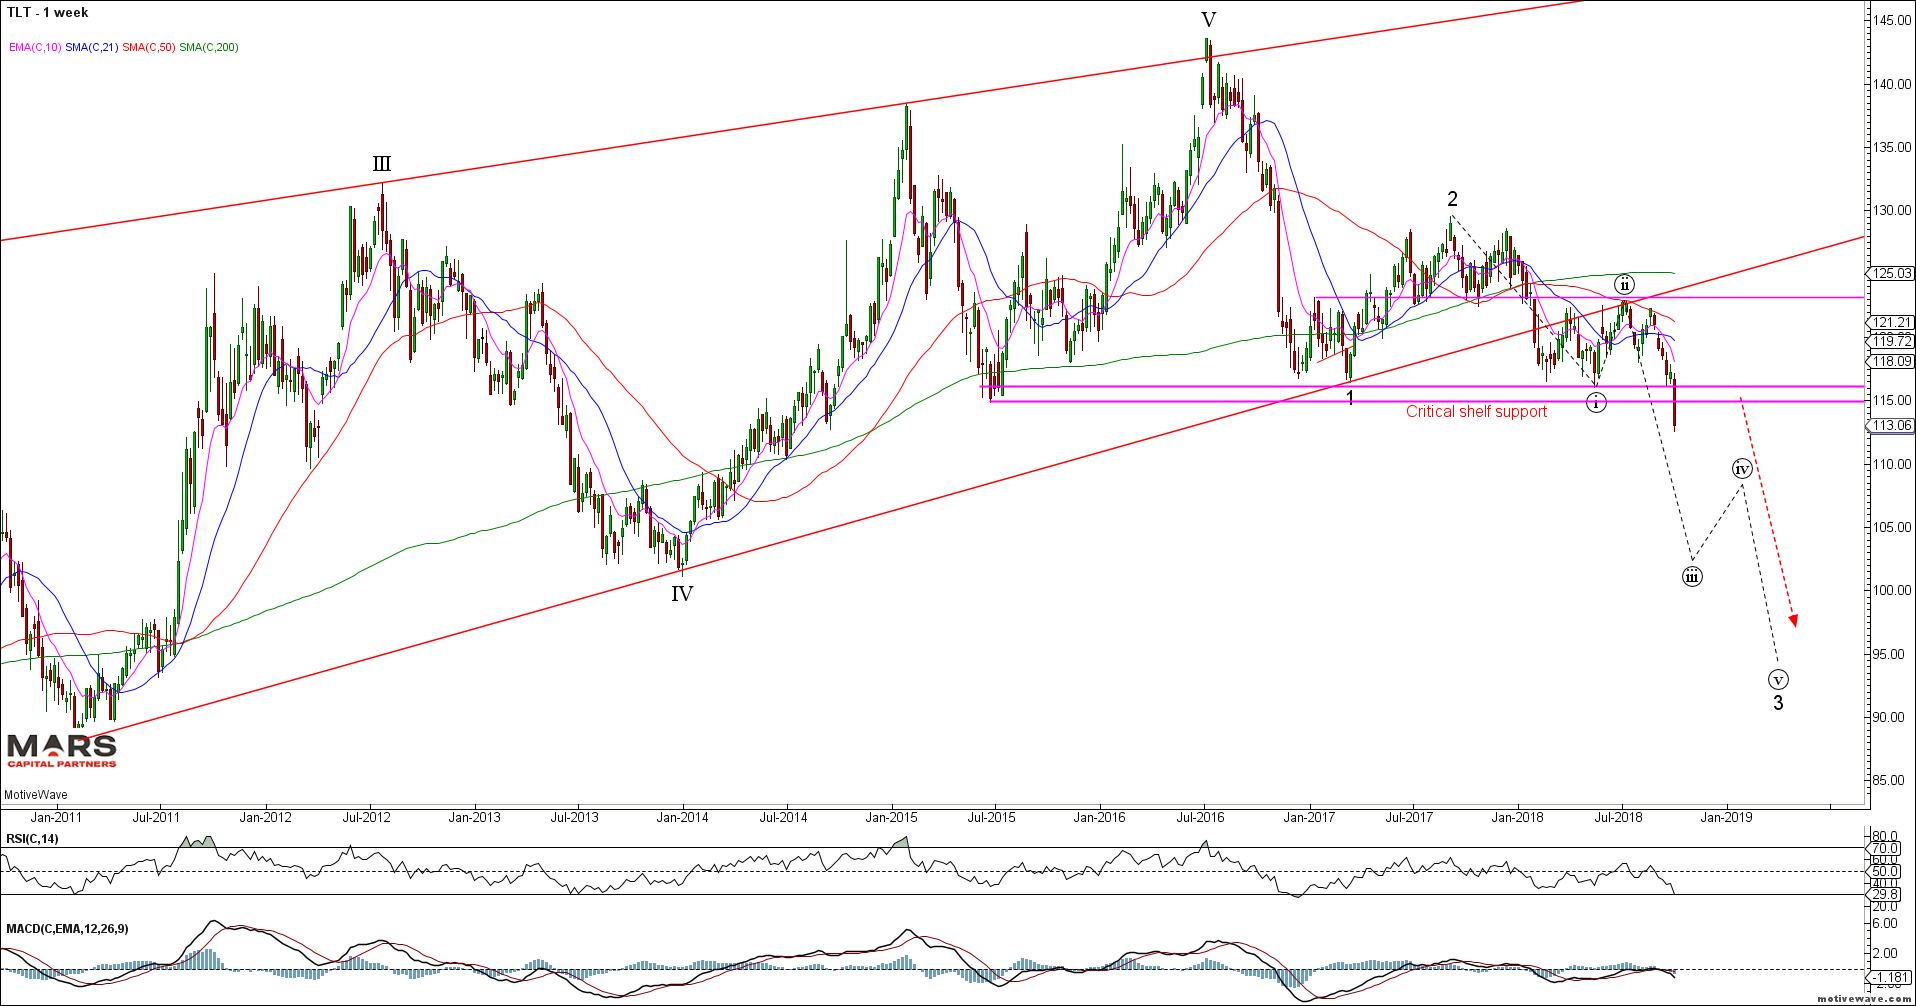
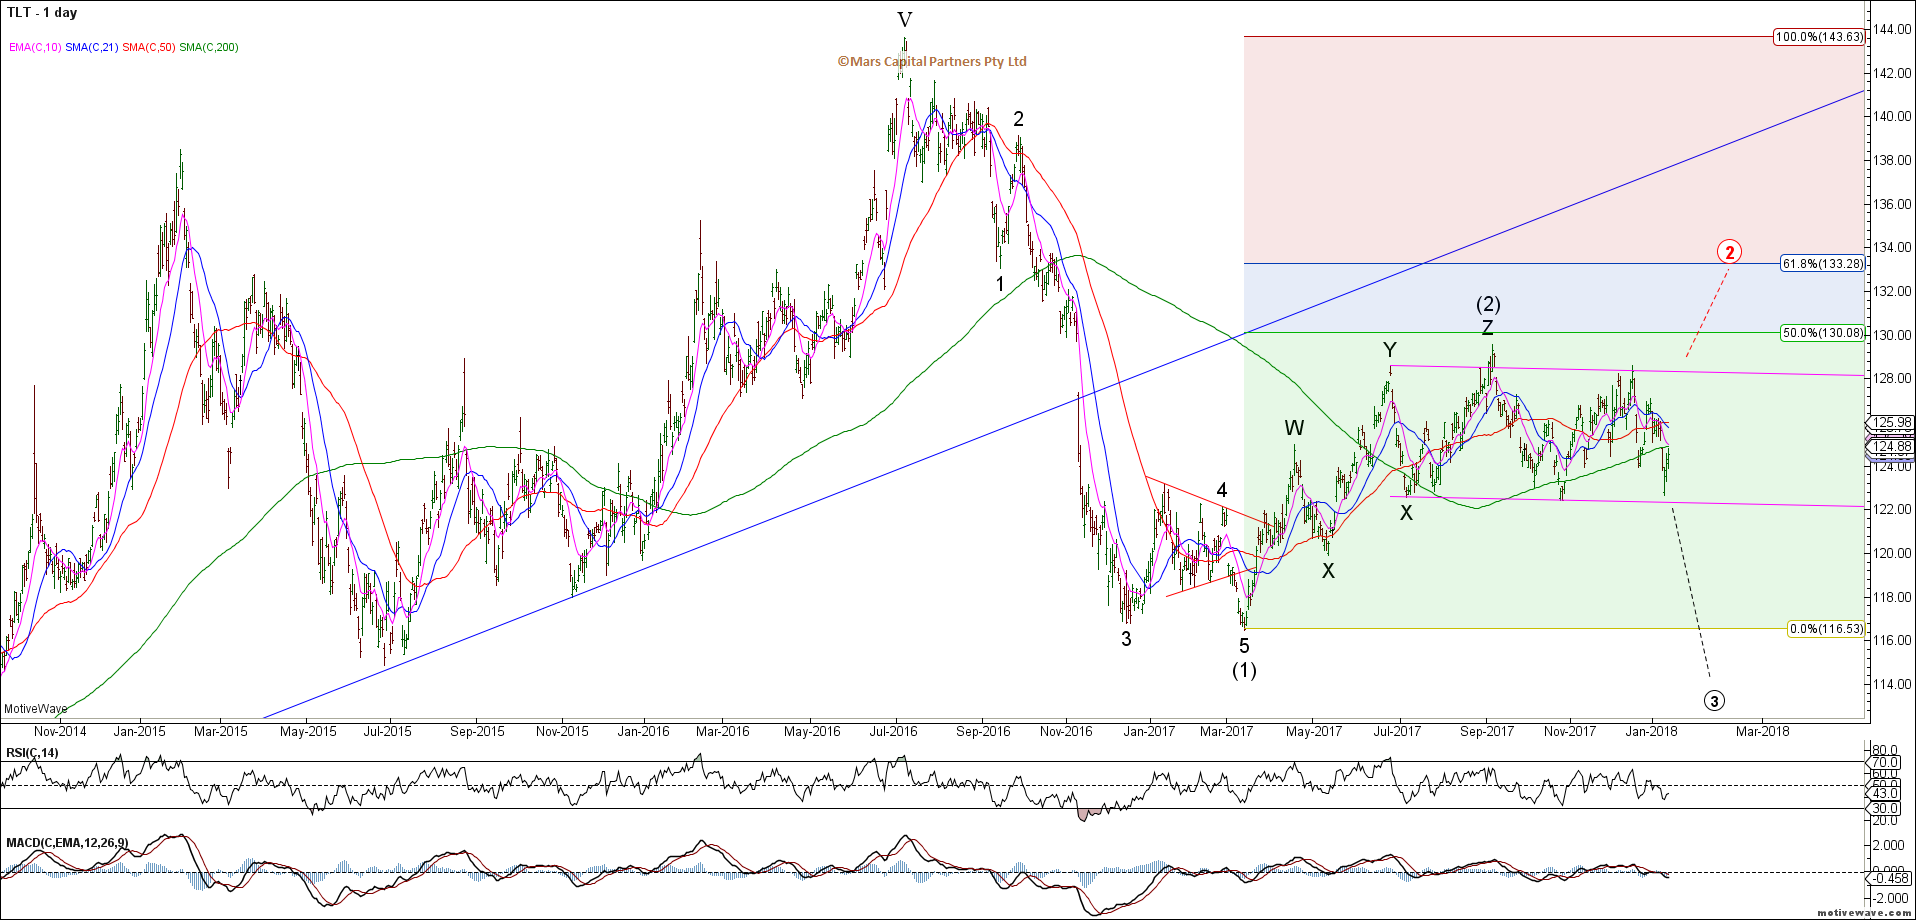
To the Bond markets and the TLT rally continued higher as expected from wave 4 support. Bulls remain in control while swing lows hold. Near term we should see evidence of a corrective decline this week.
TLT Weekly
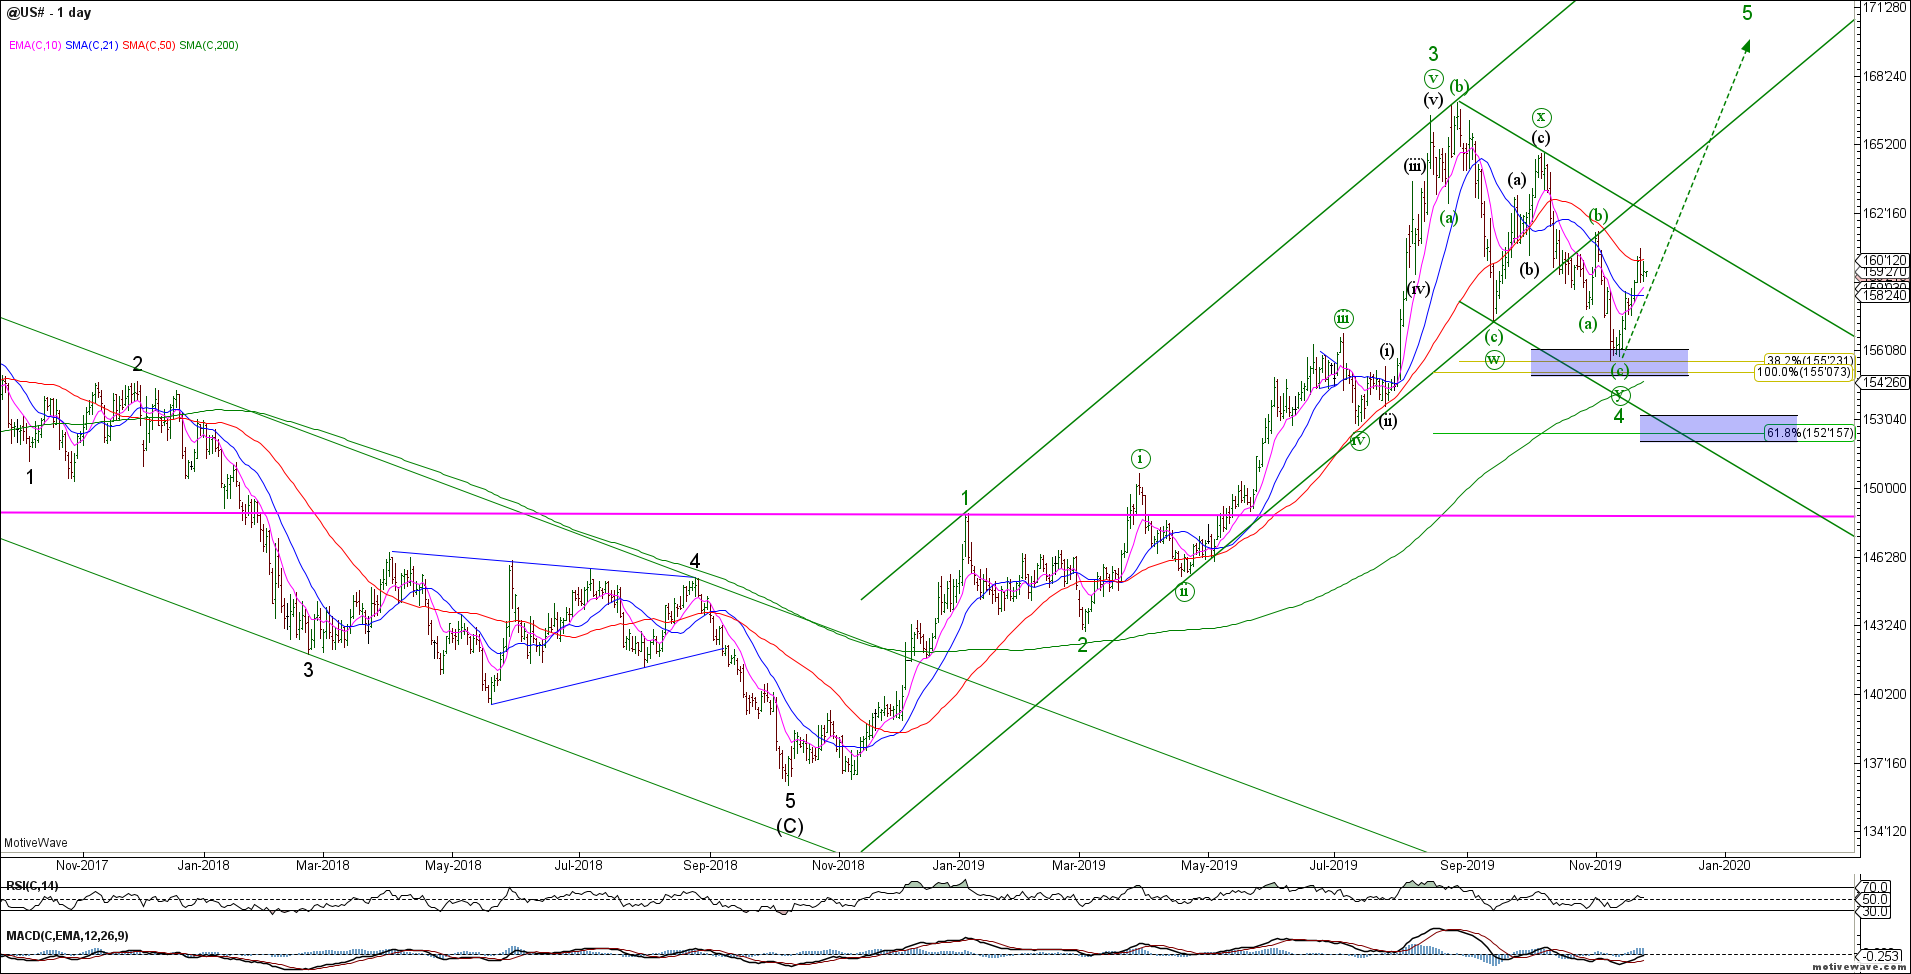
The 30yr ZB shows an impulsive rally from recent swing lows. We remain bullish from a big picture perspective looking for wave 5 to new cycle highs.
ZB Daily
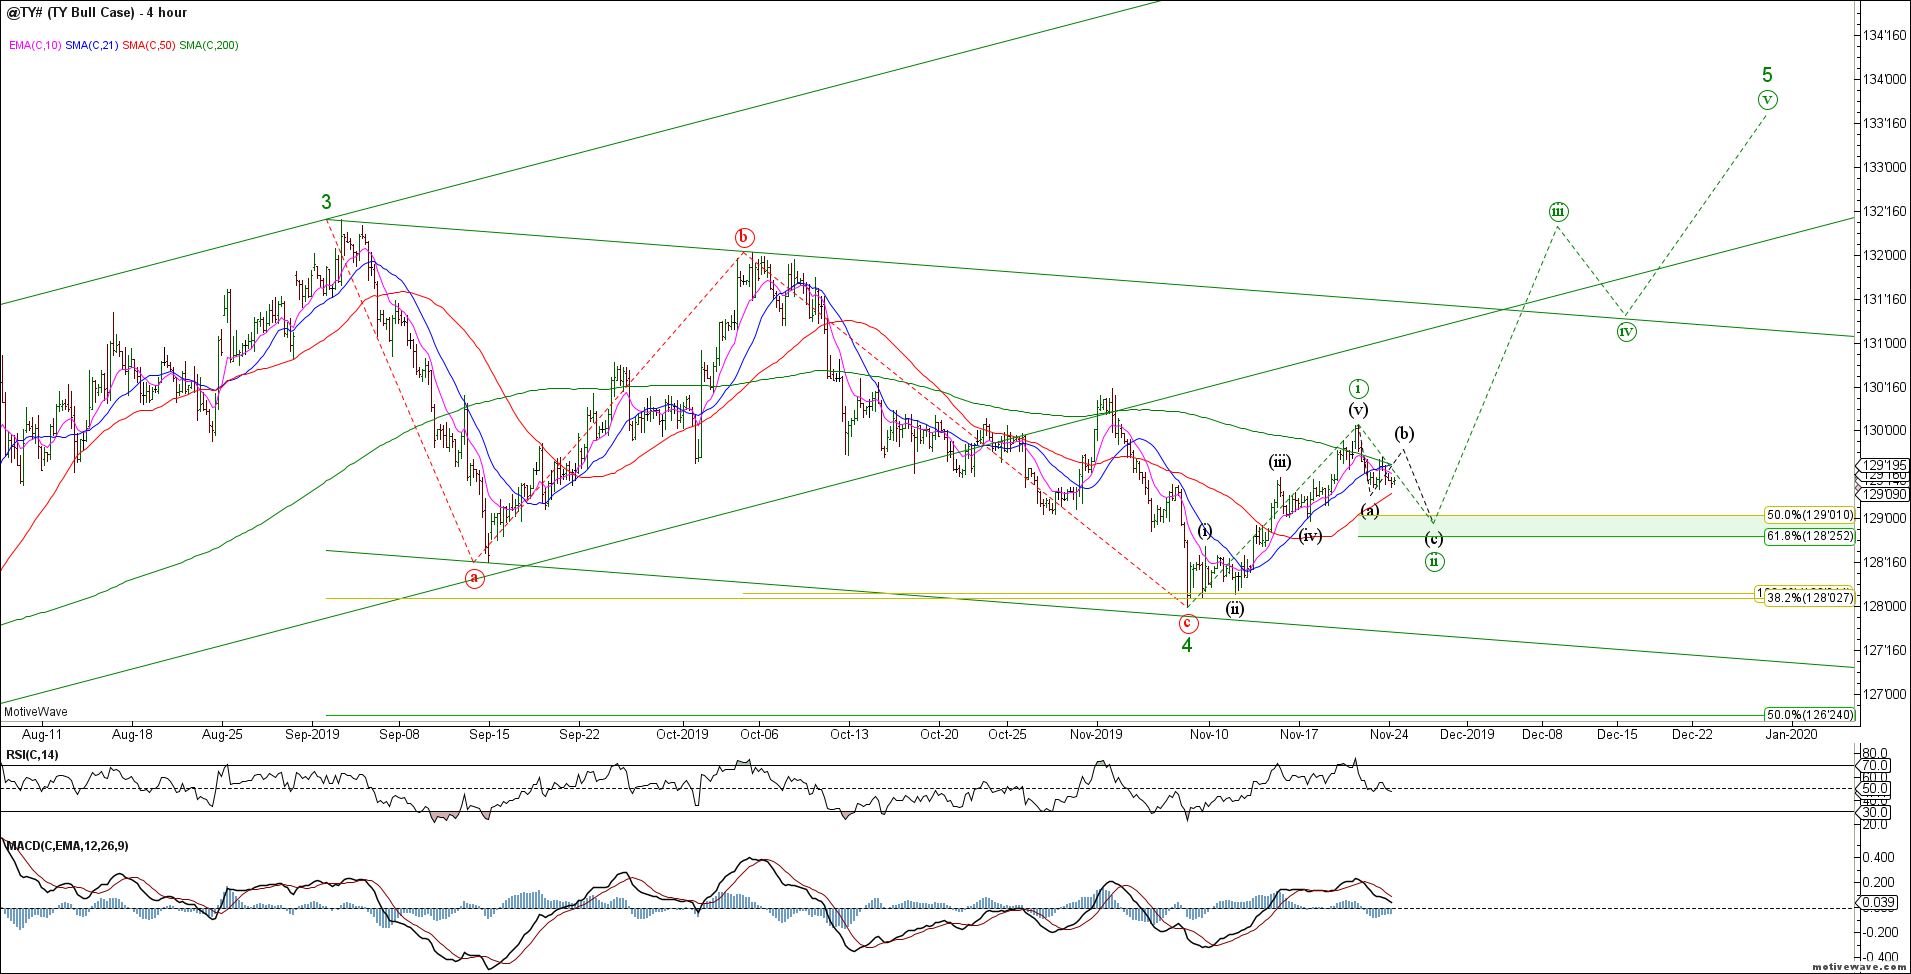
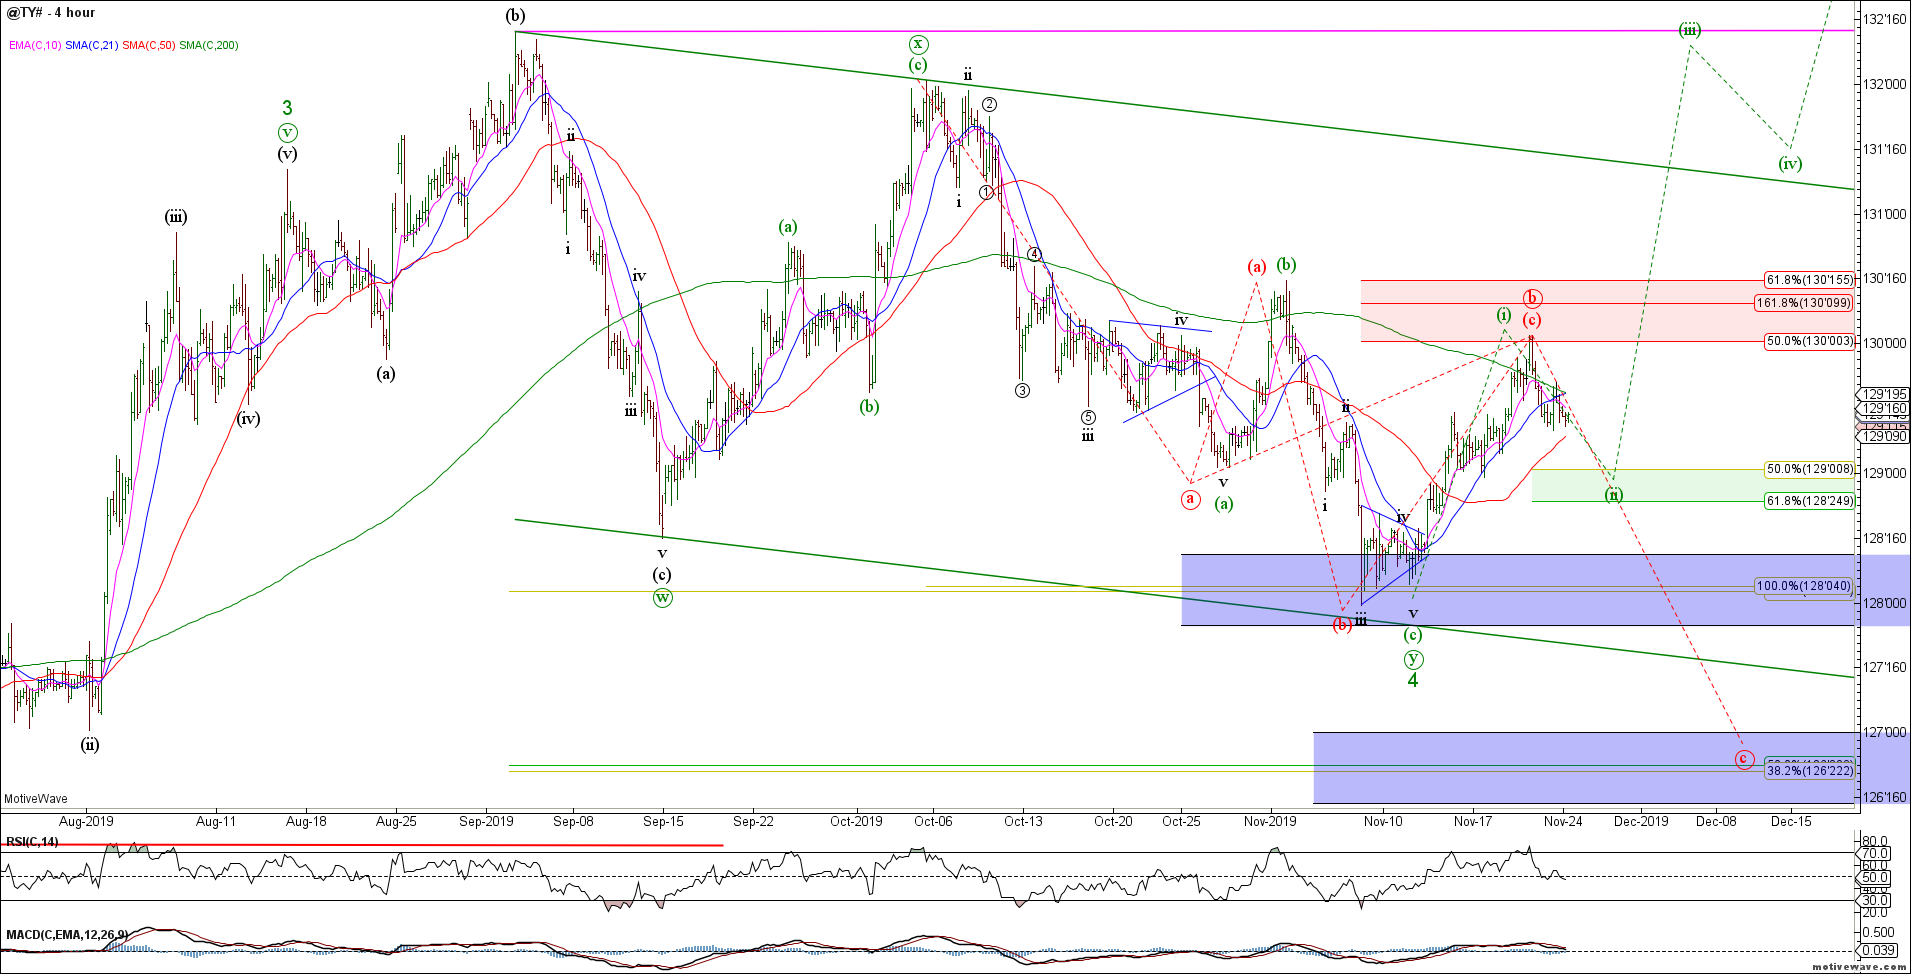
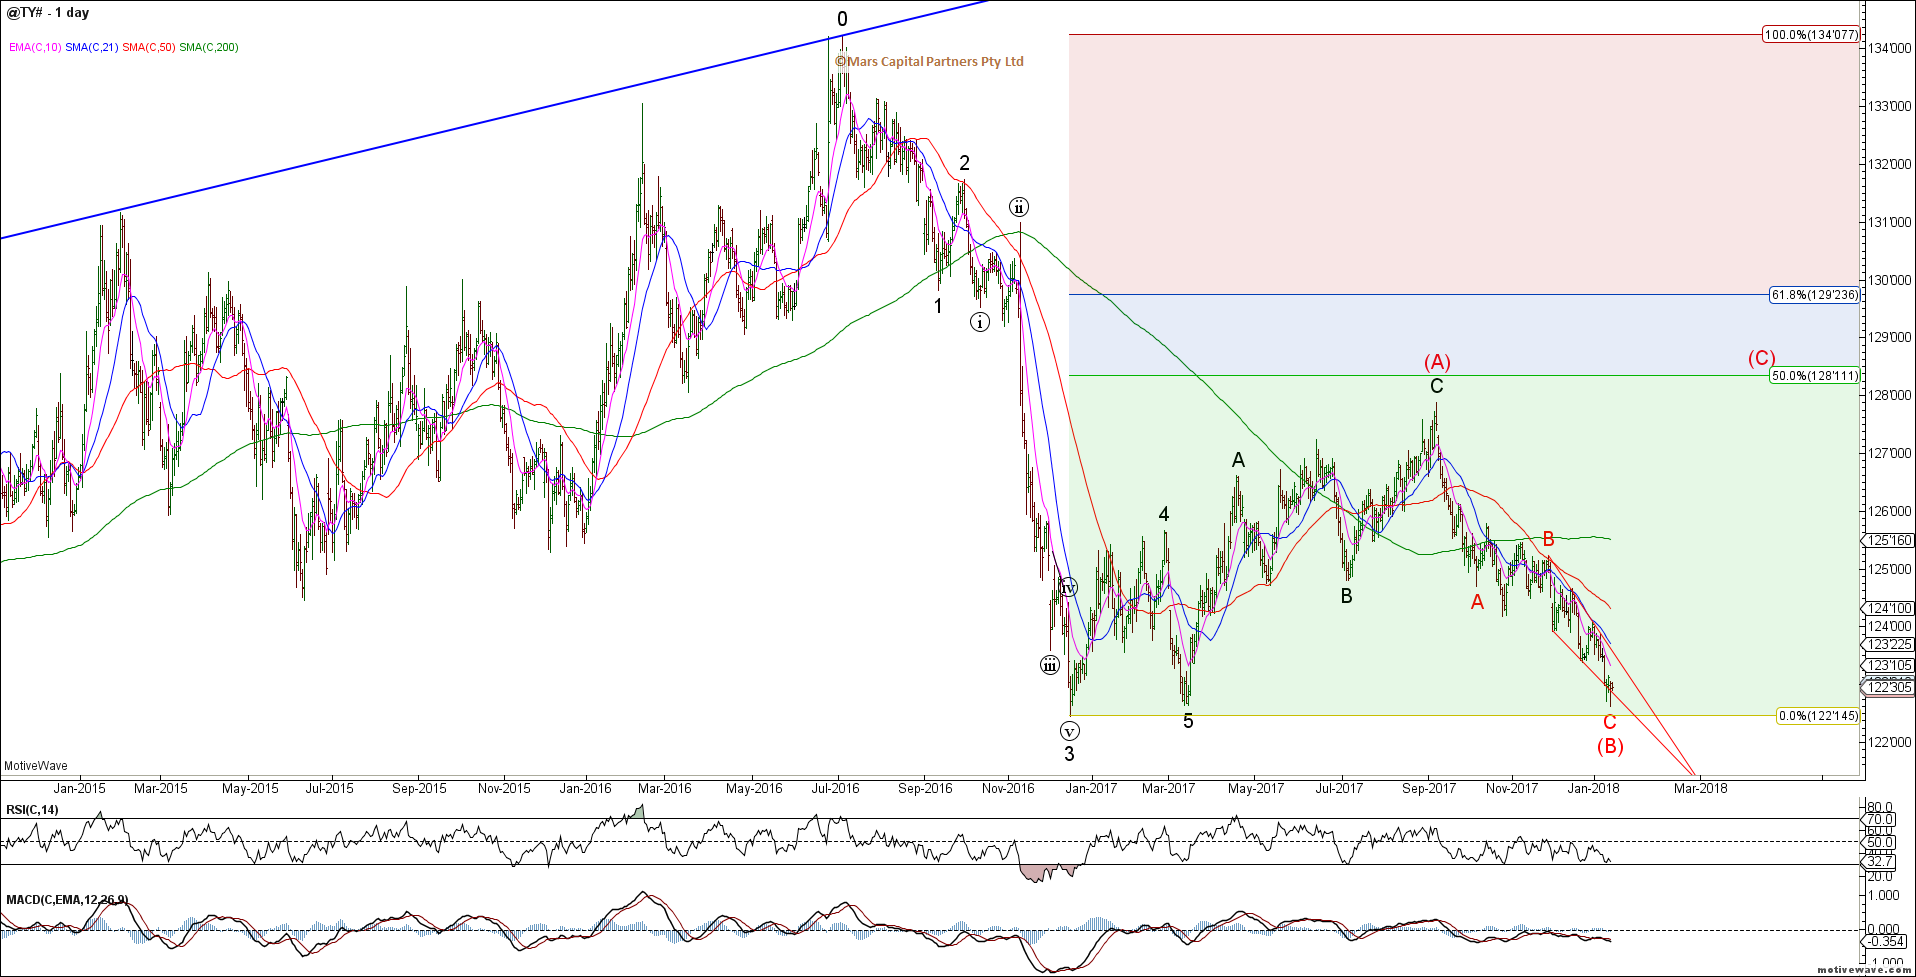
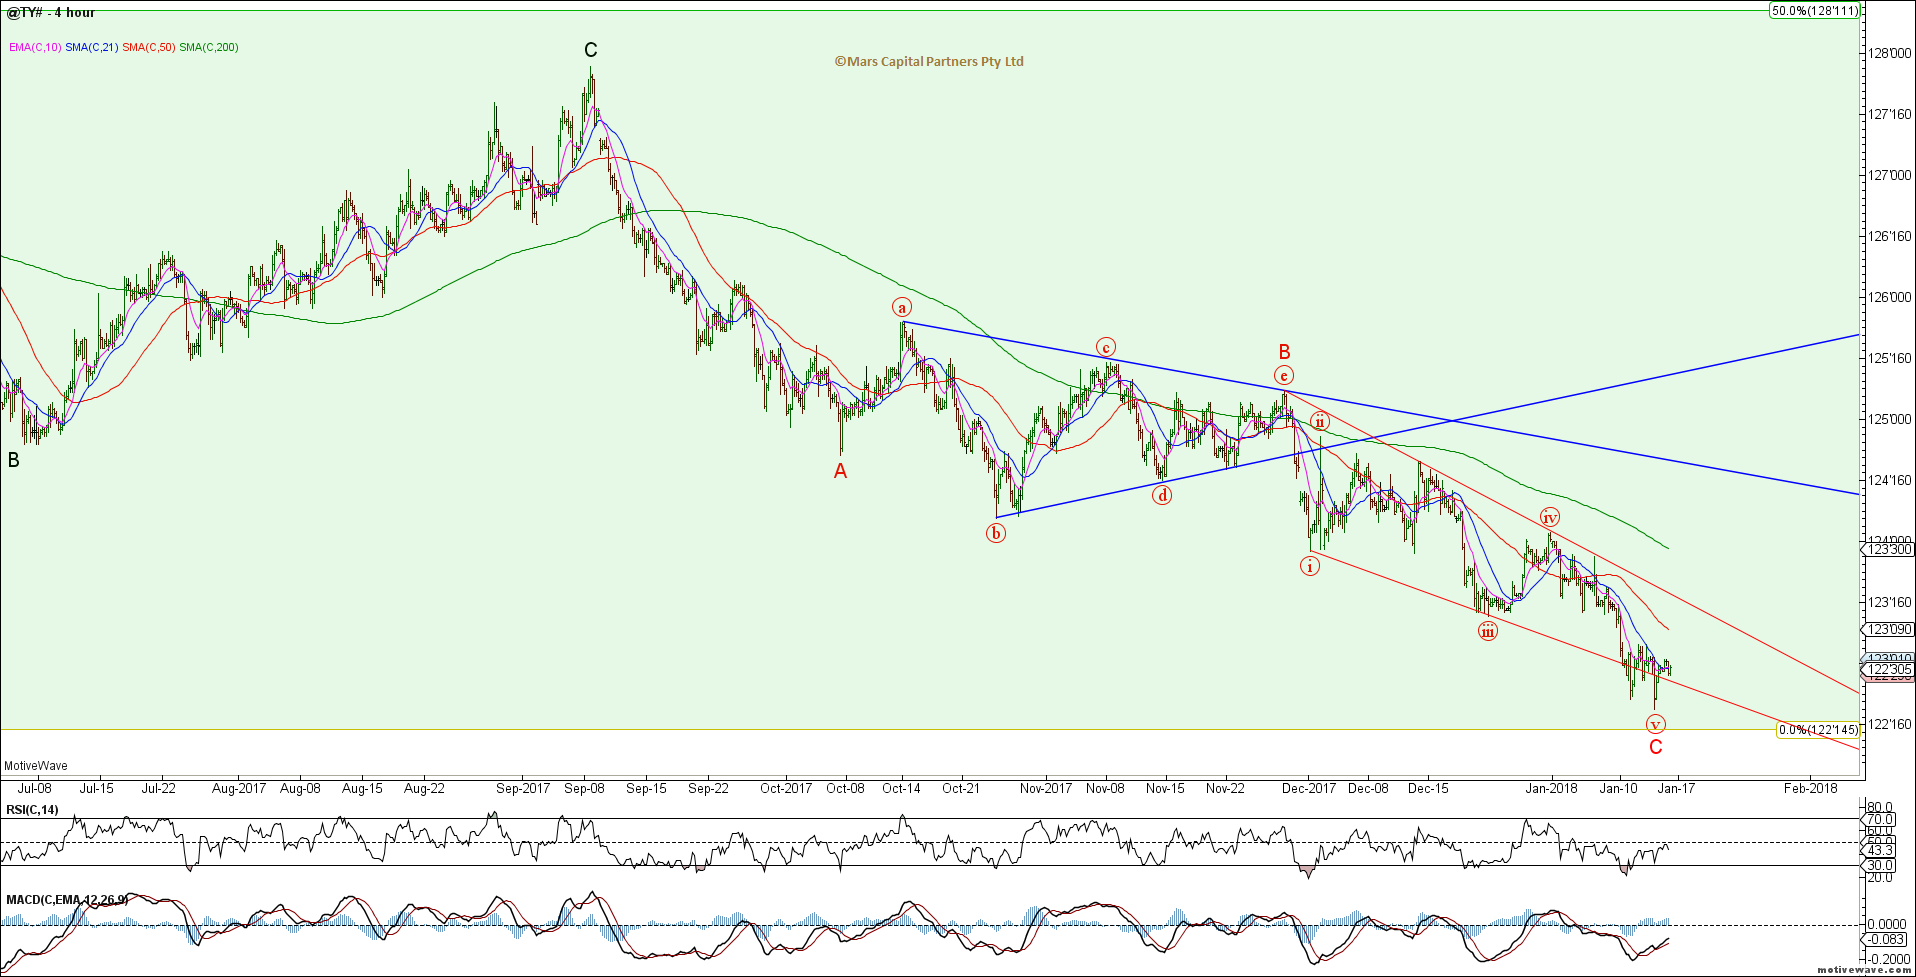
The TY shows the same bullish potential with a potentially complete 5 waves up from recent swing lows. Near term bulls should hold the 128’25-129’00 support zone for wave (ii) of the bull count.
TY H4
The TY also has a potentially bearish interpretation (red count) that while lower probability we should not ignore. That is because of the irregular swing low from an Elliott Wave perspective. Be aware of this potential if we see evidence of an accelerating decline.
TY H4
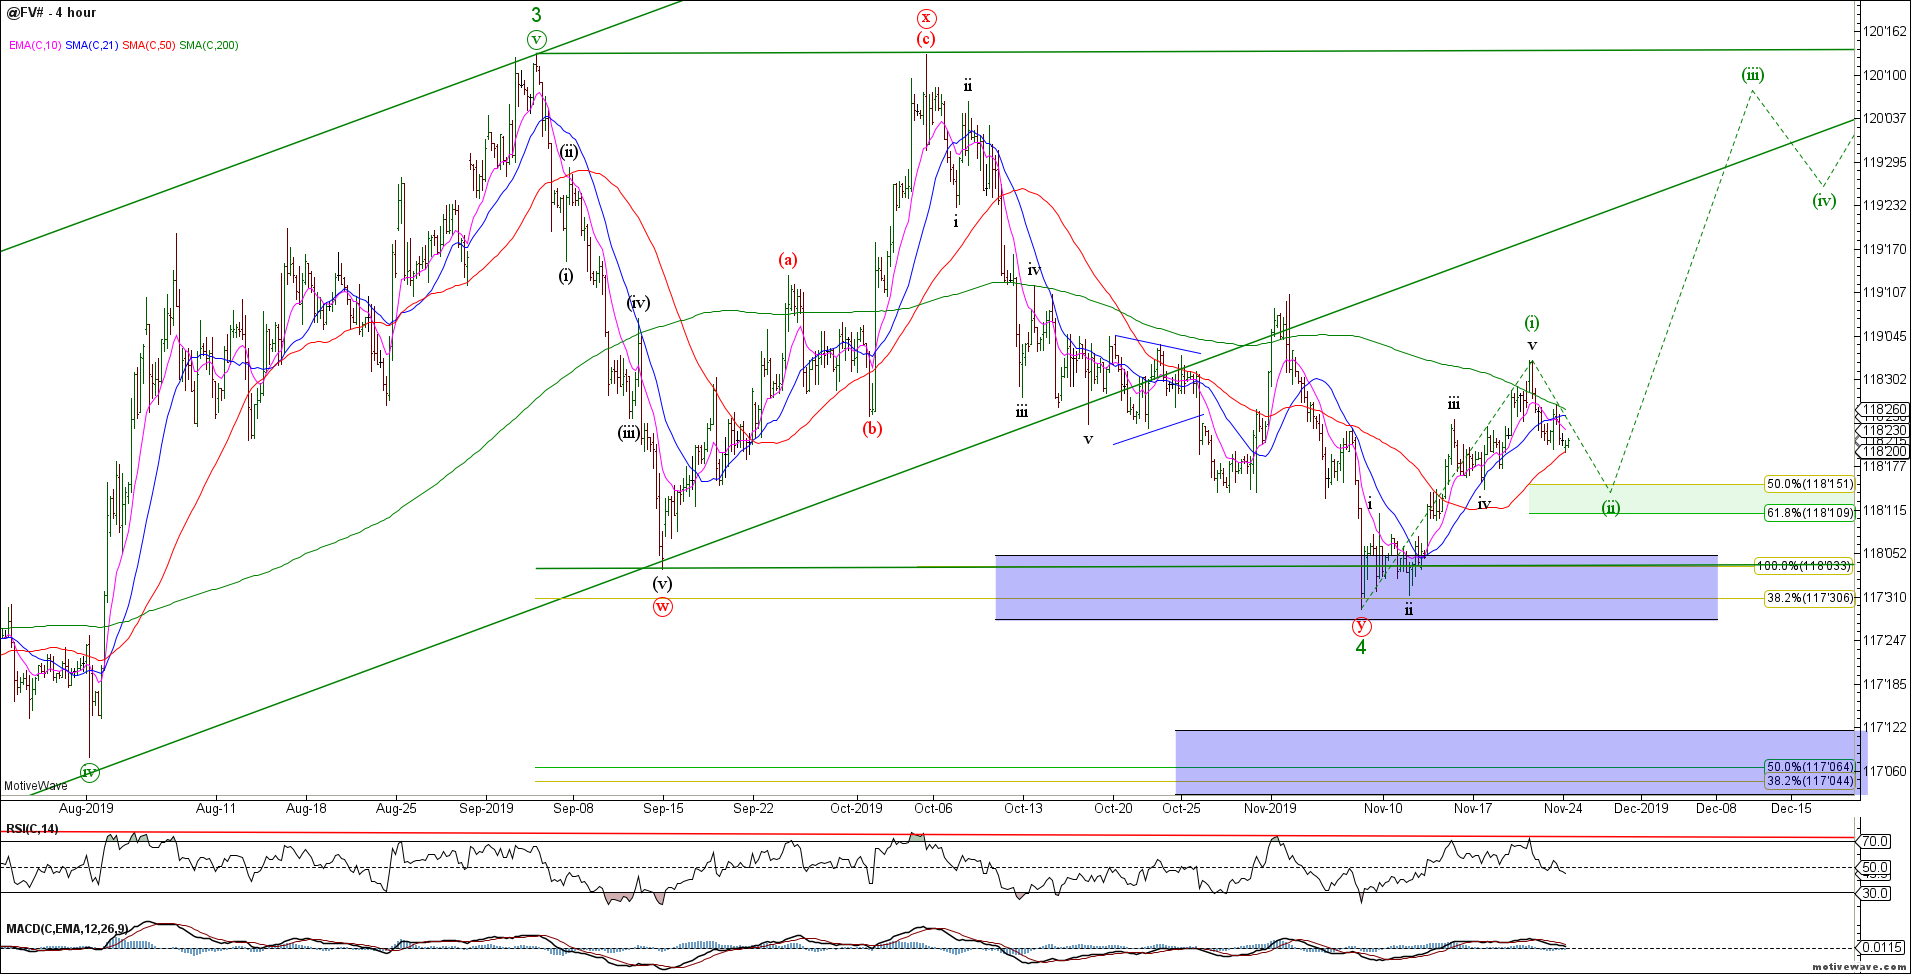
The 5yr FV shows an impulsive 5 wave rally from the recent swing lows. Bulls need to hold the 118’10 area for wave (ii) of the bull count.
FV H4
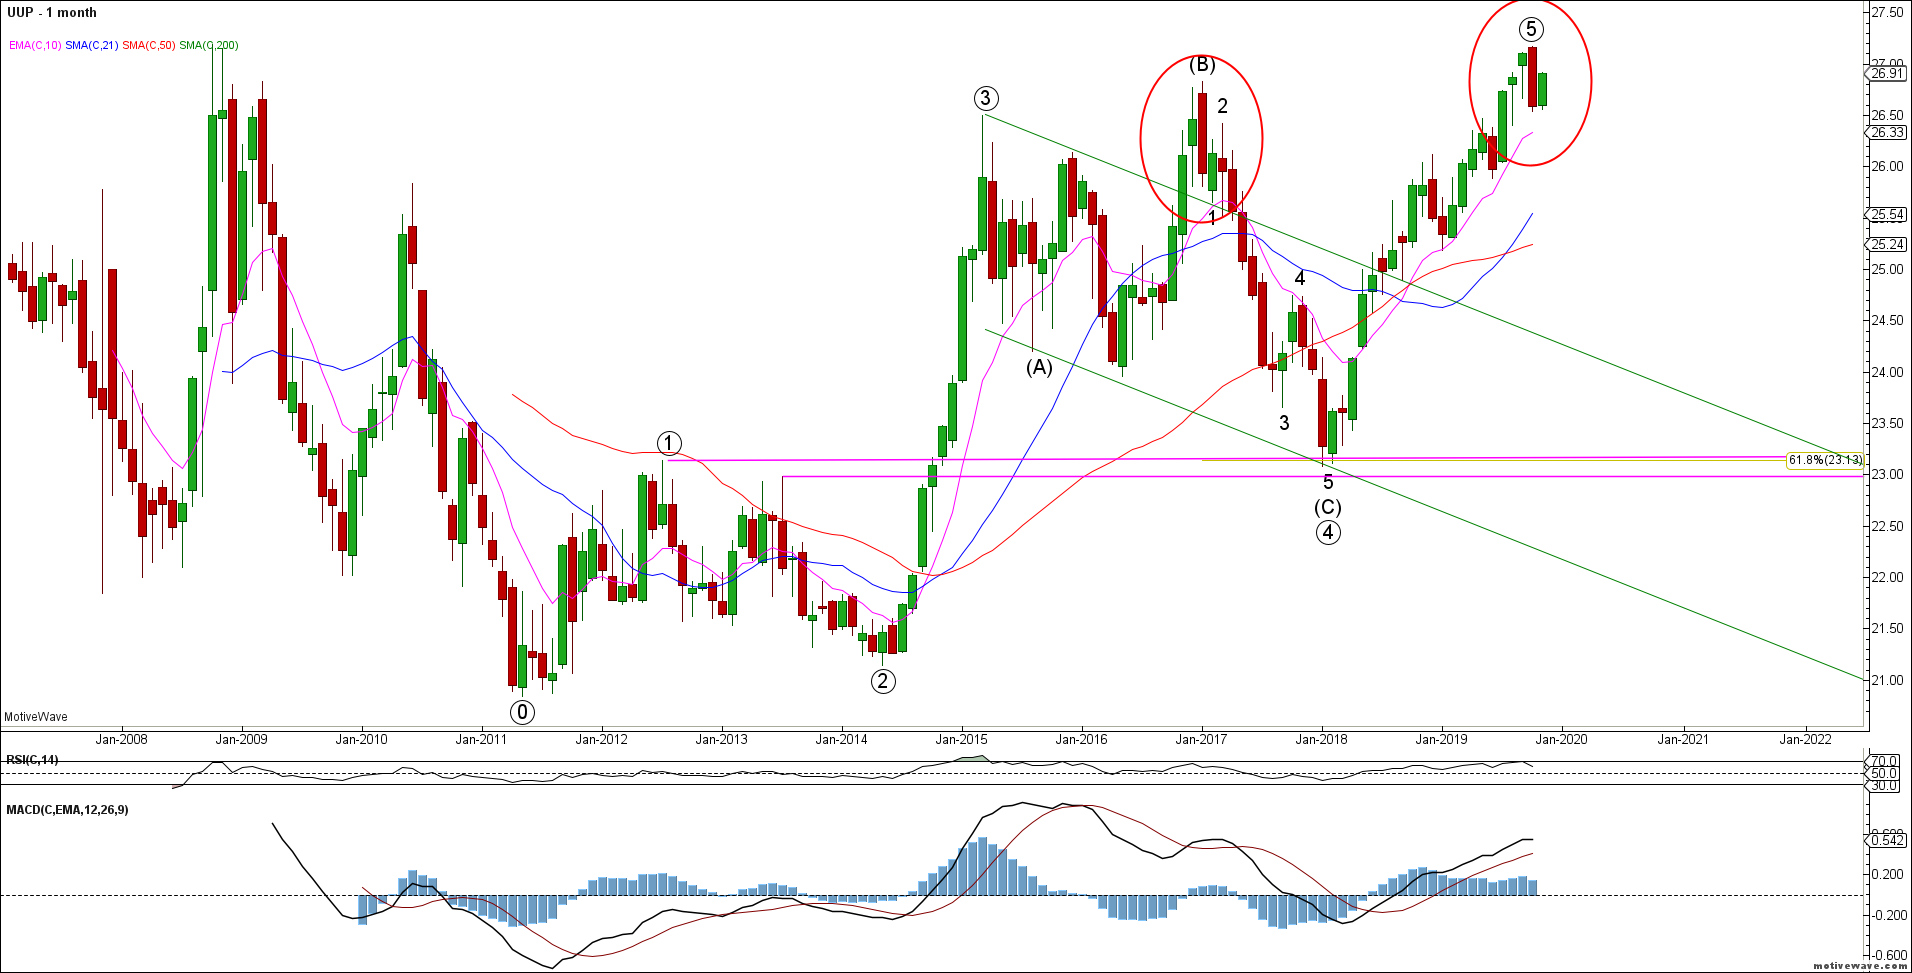
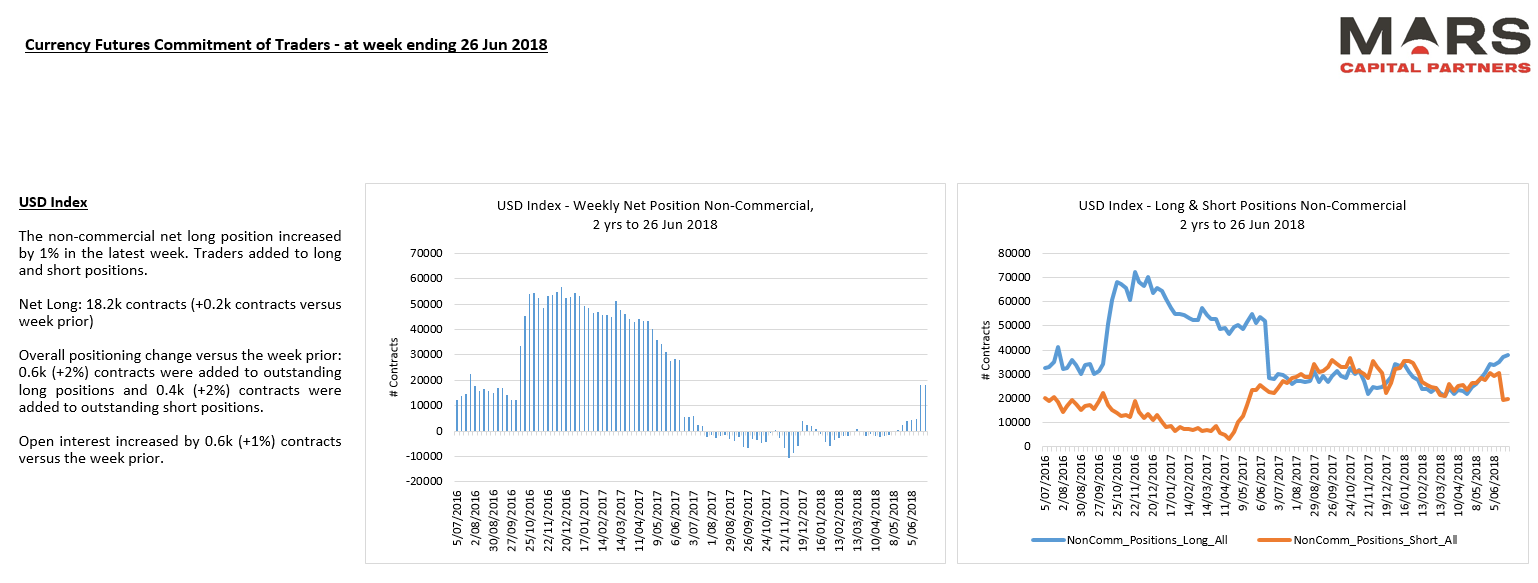
To the FX markets and the US dollar refuses to roll over. The monthly UUP chart is illustrative of the bigger picture field position of the dollar. October’s monthly bearish reversal is yet to see any downside follow through. We need to see a break of the October lows to gain any downside momentum.
UUP Monthly
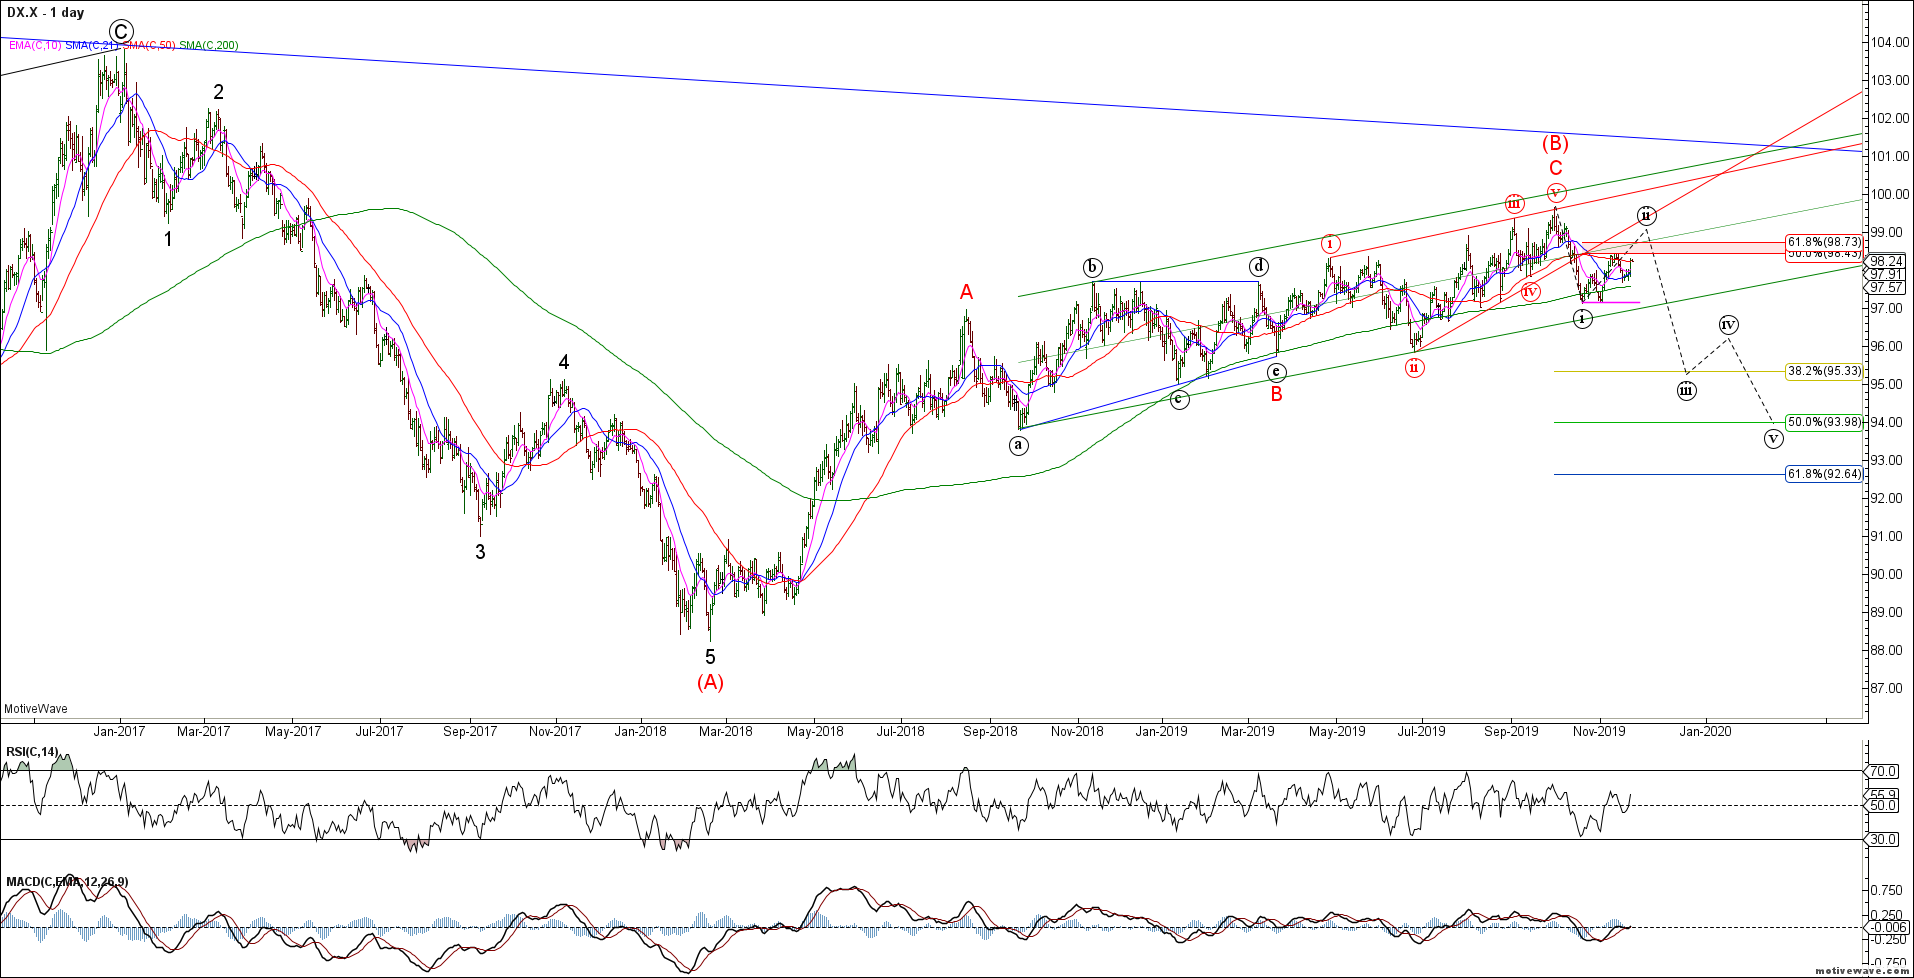
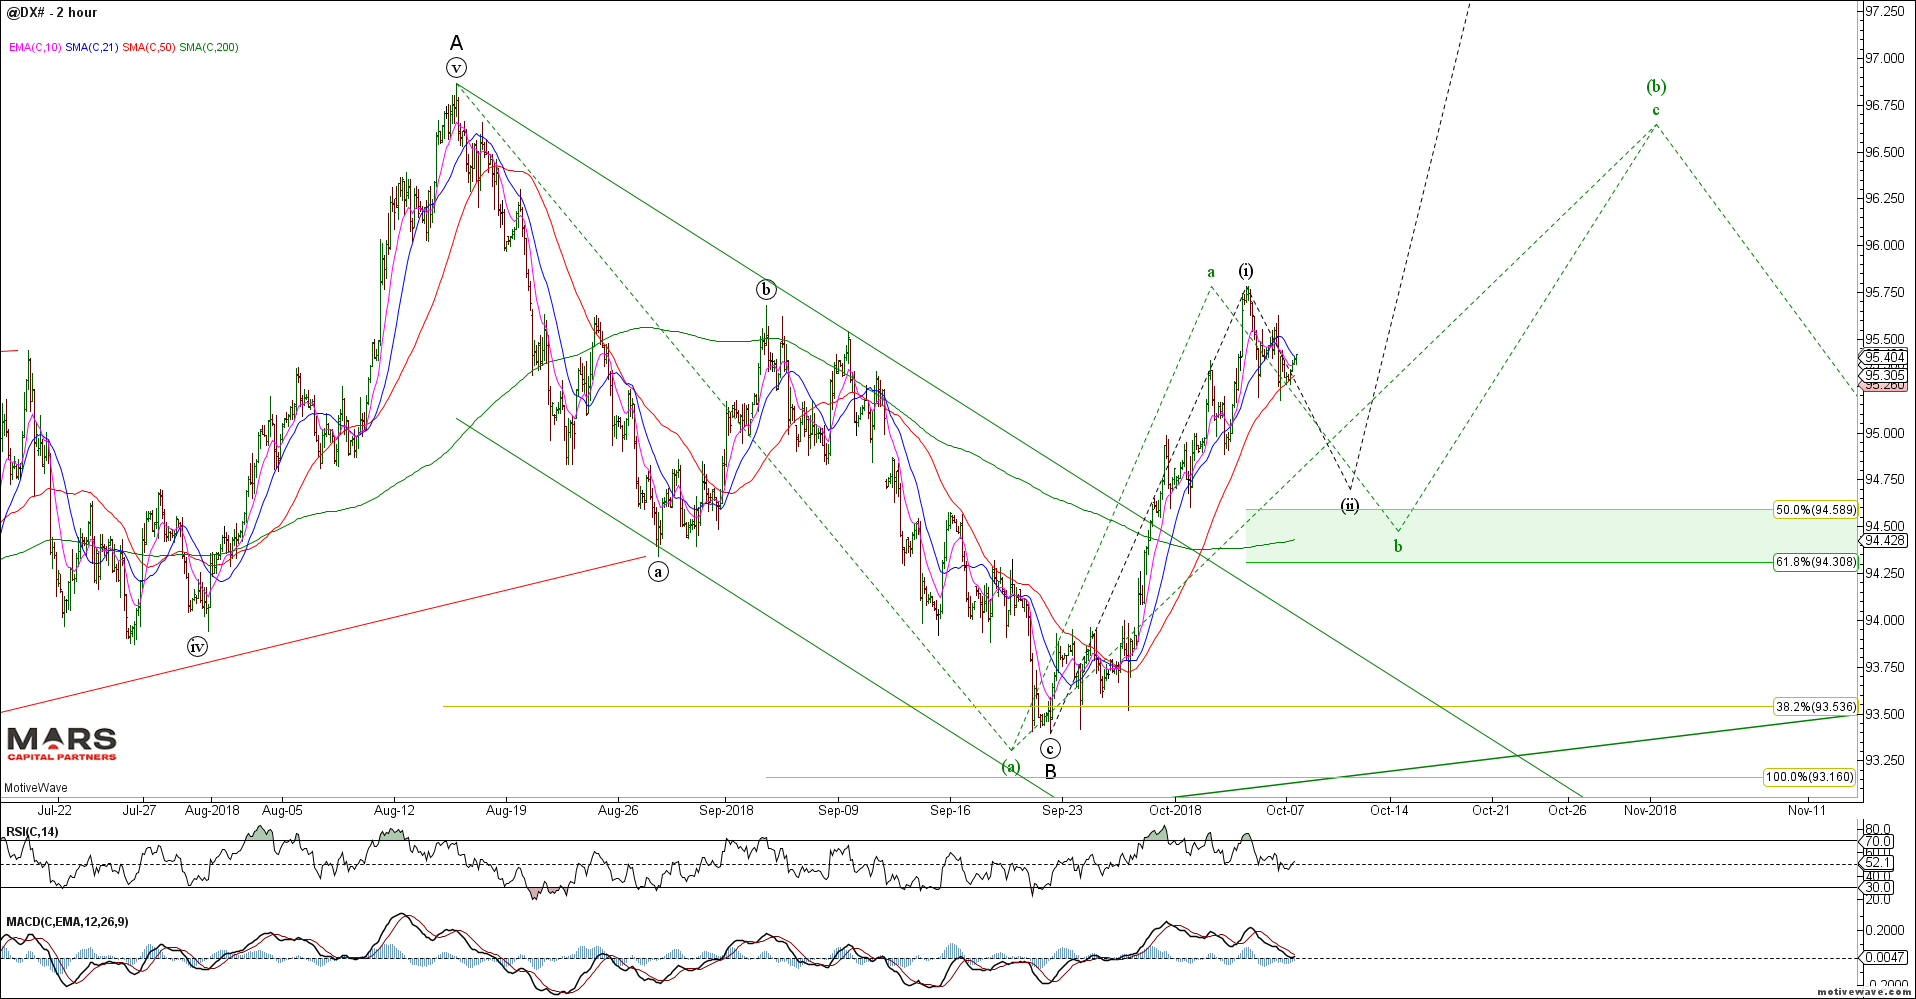
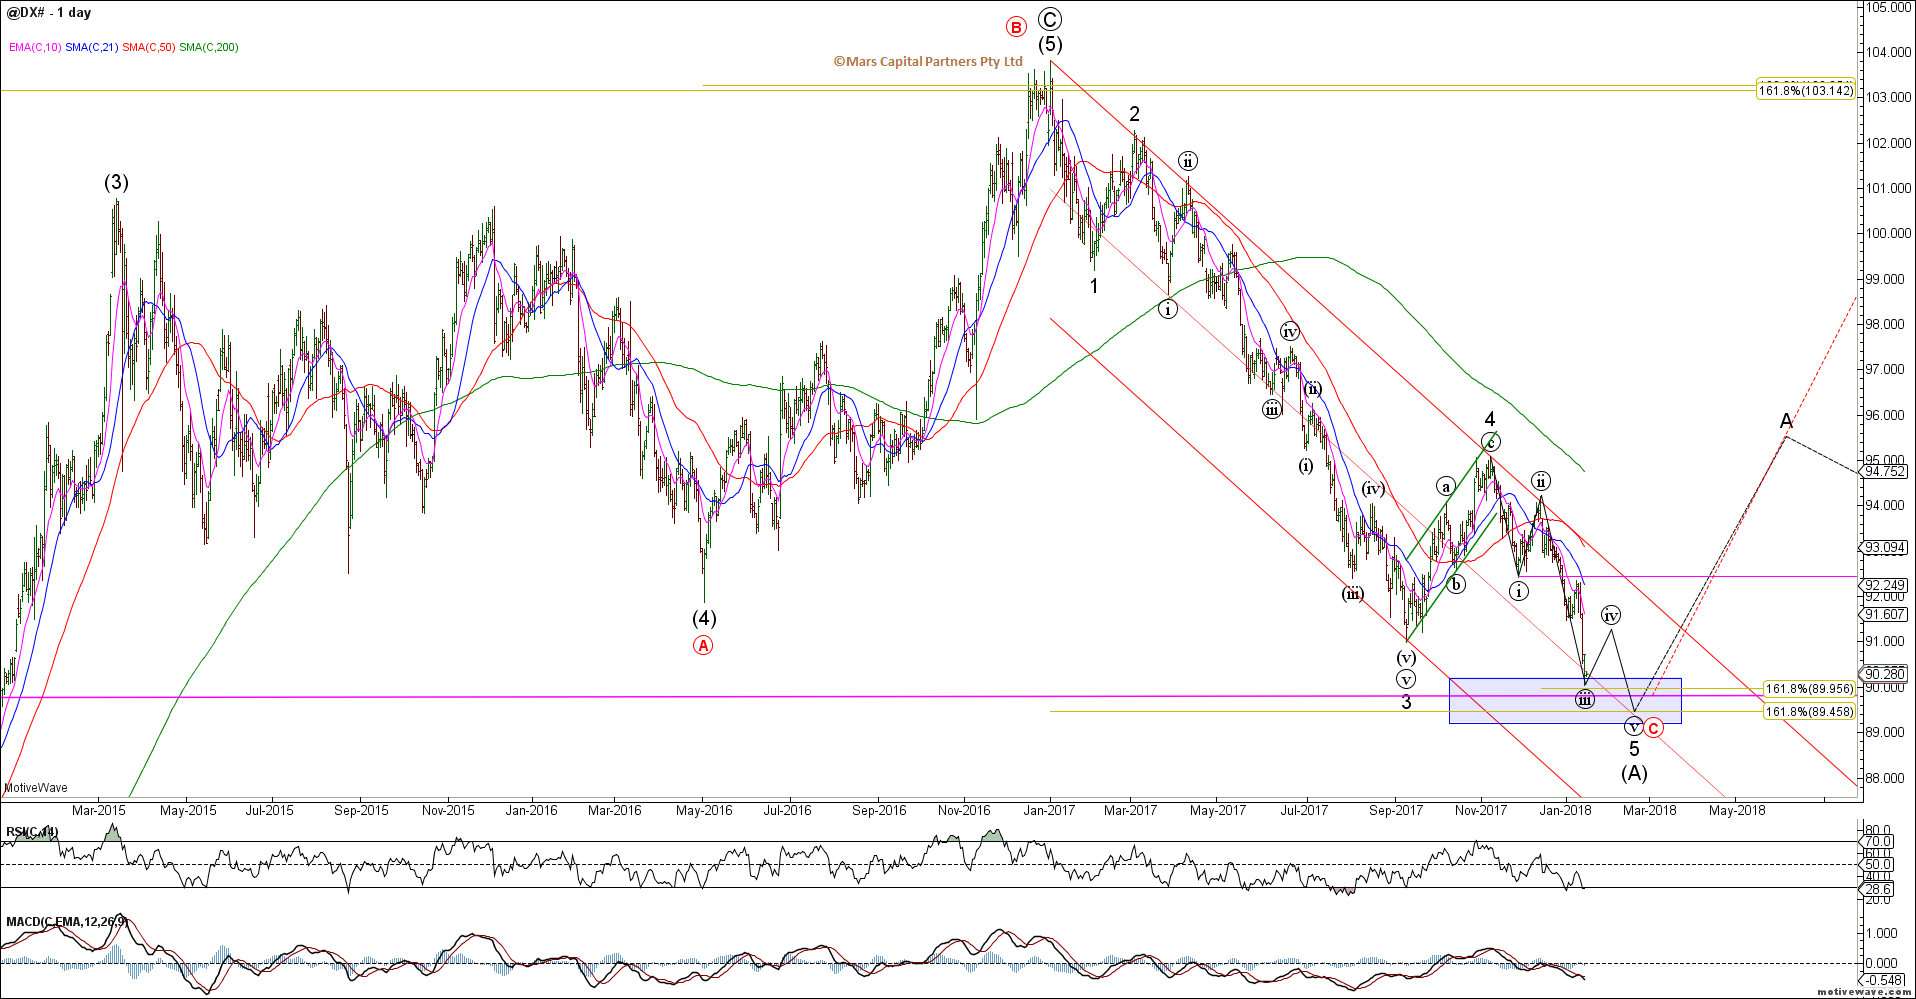
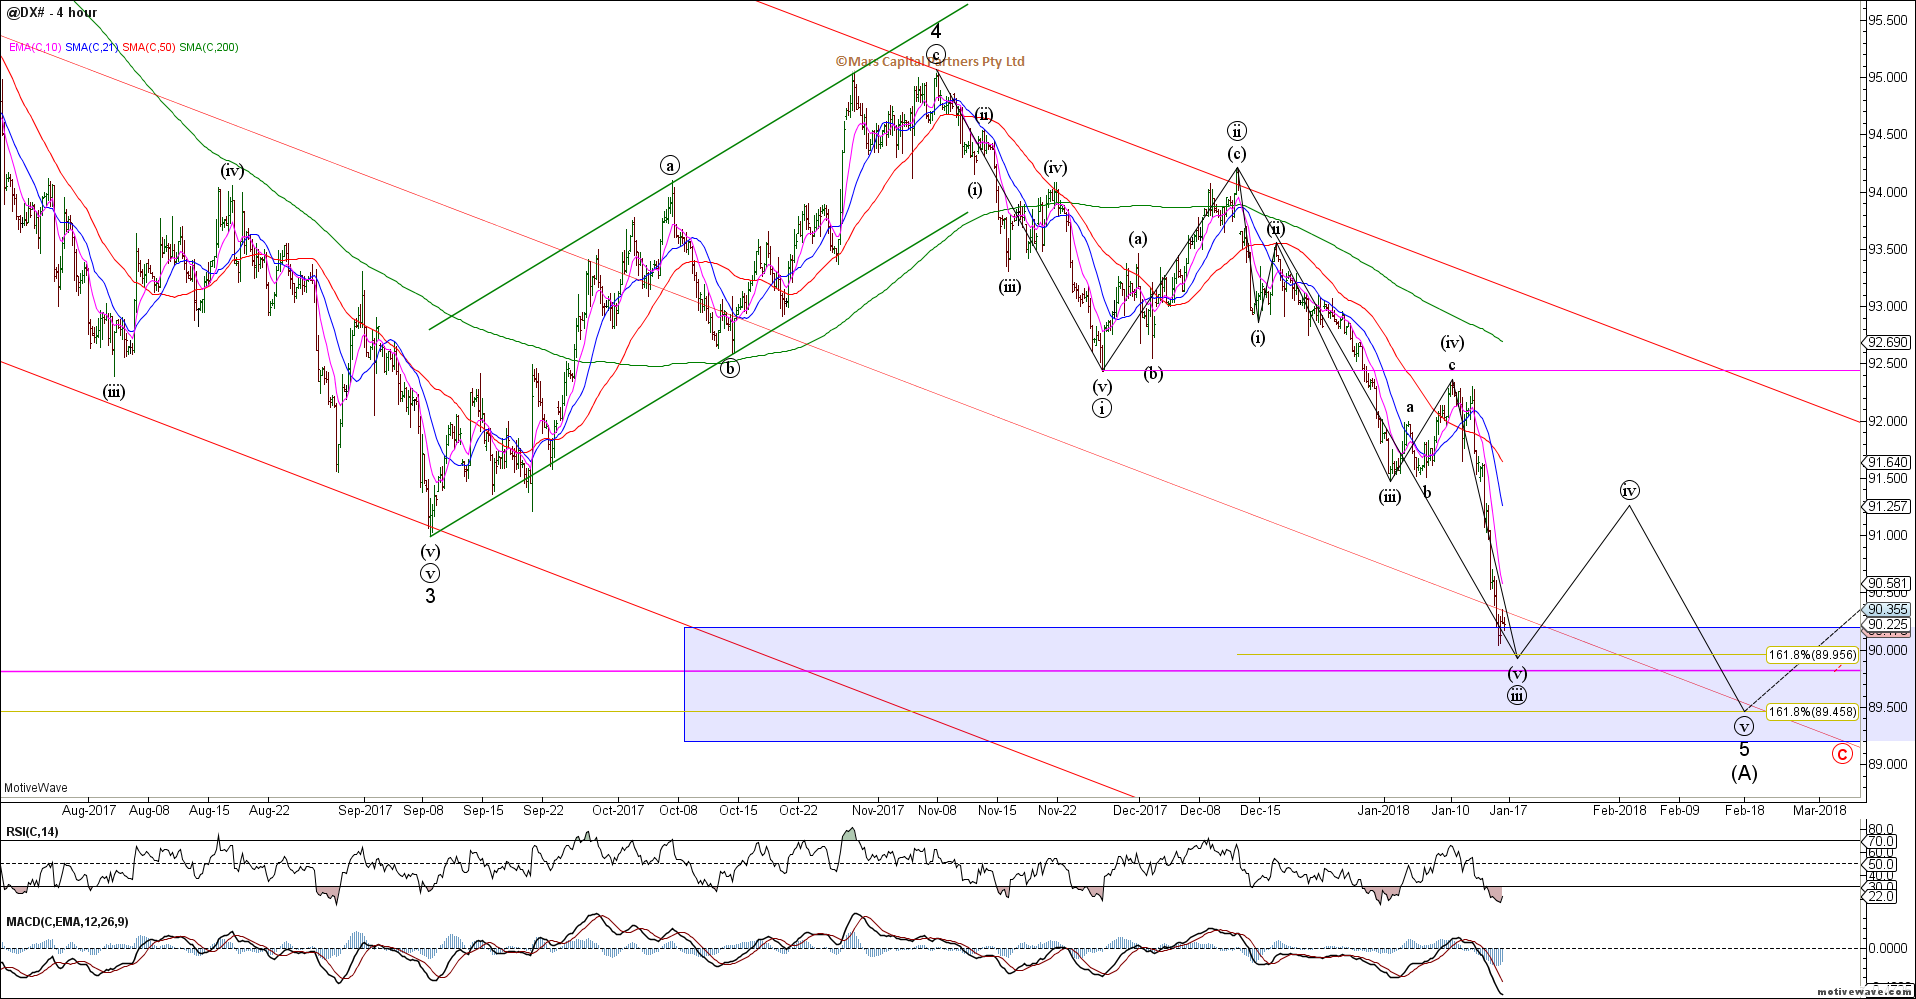
The DXY was unable to break lower last week and remains range bound. The near term structure is unclear and while we maintain a bearish bias against the October highs, our confidence level is low as no key support has been broken. Maybe another push higher to complete wave (ii)? Risky
DXY Daily
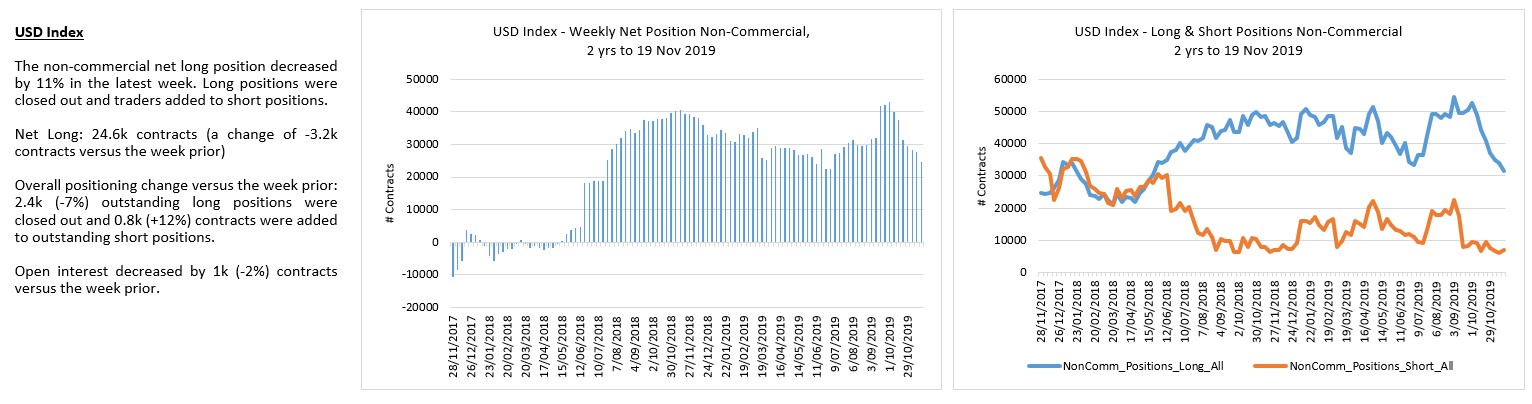
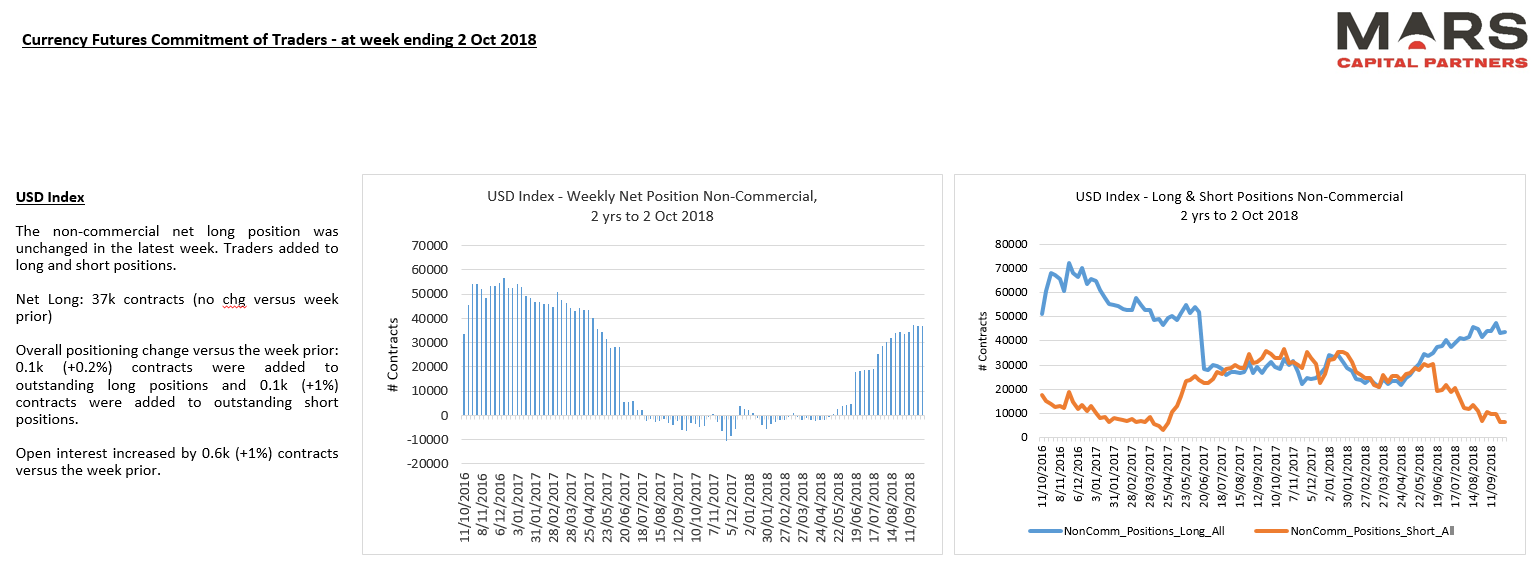
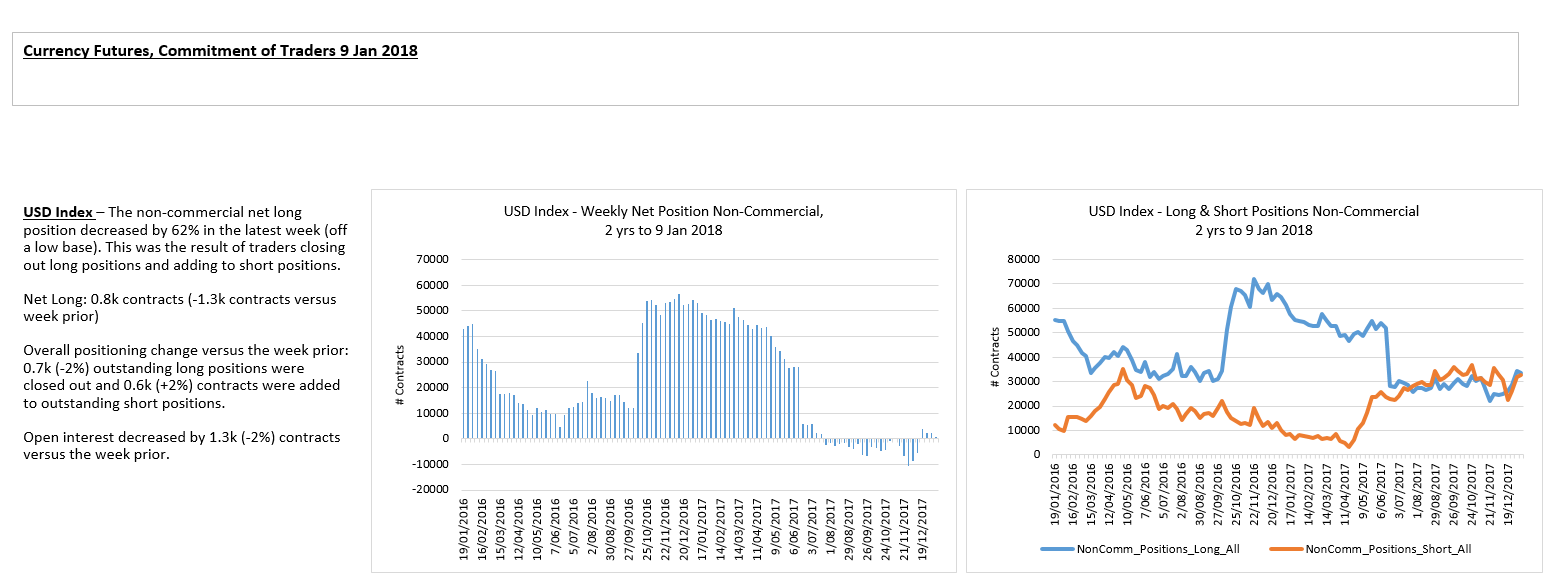
DXY longs have left the building.
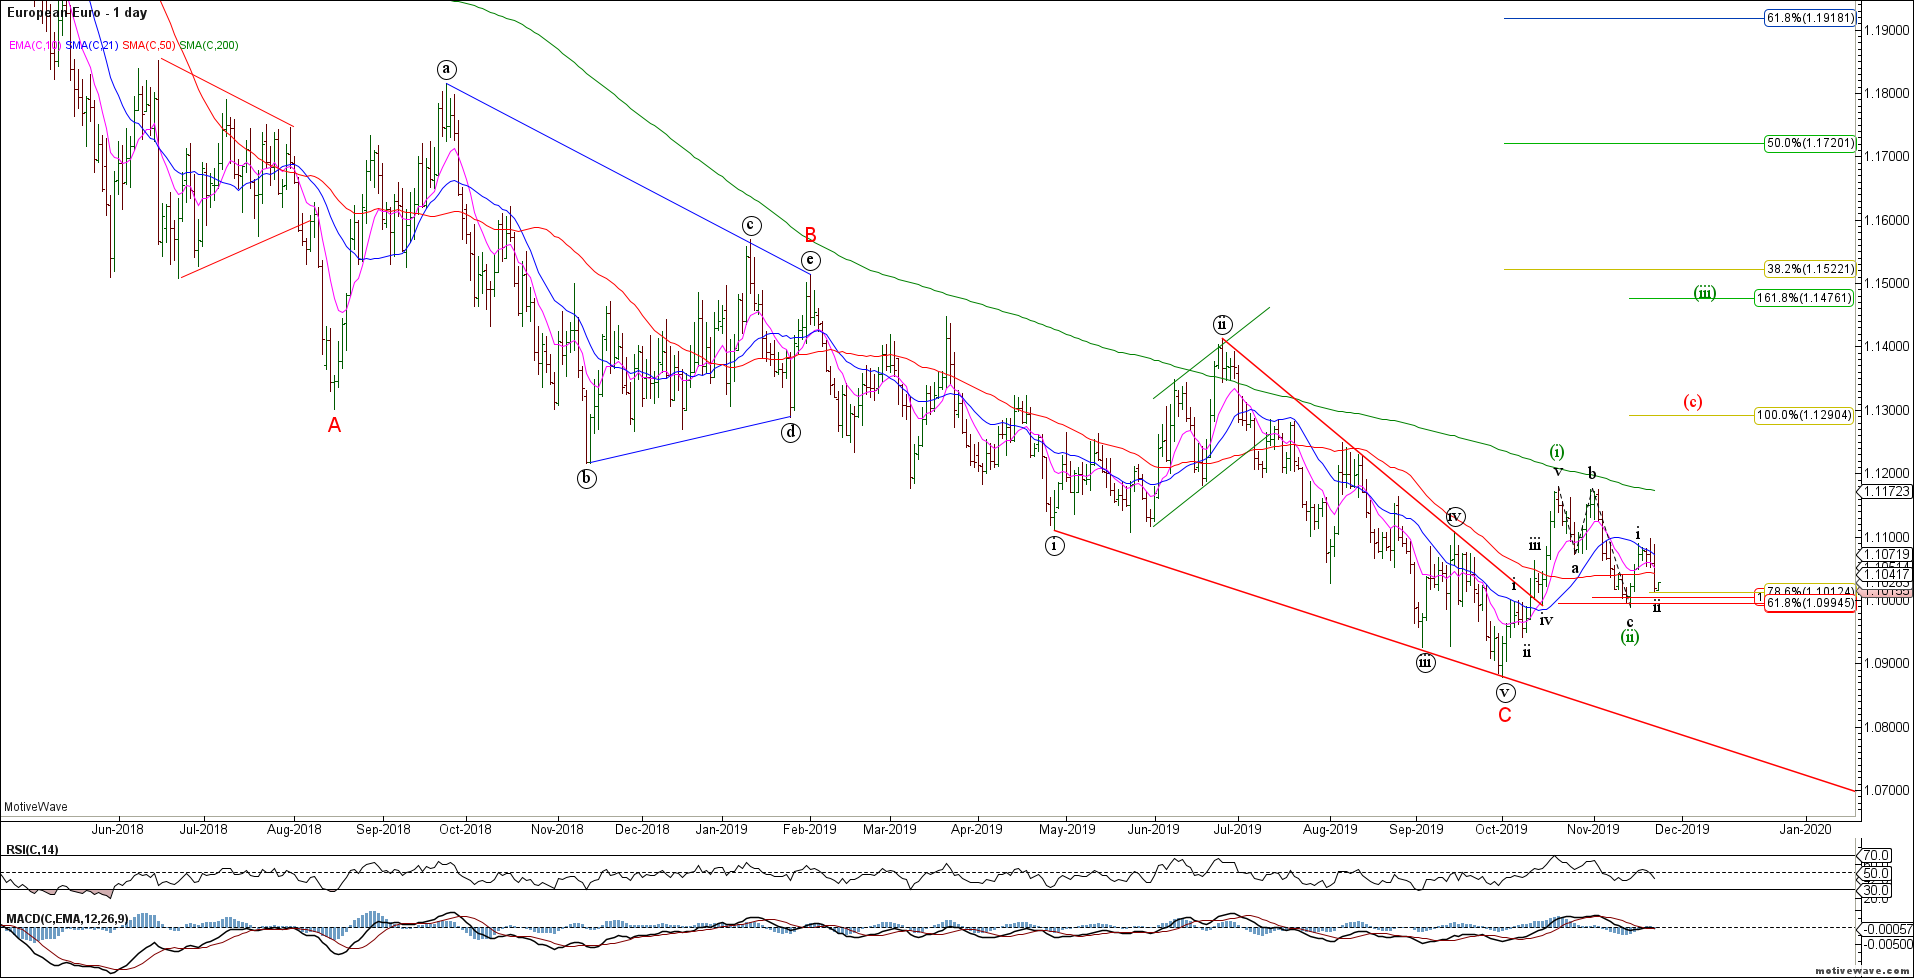
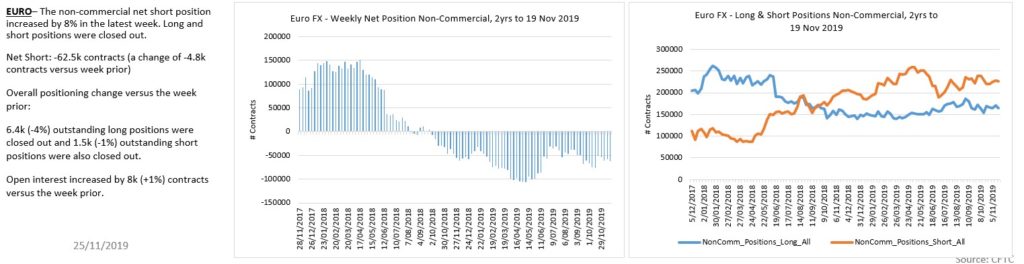
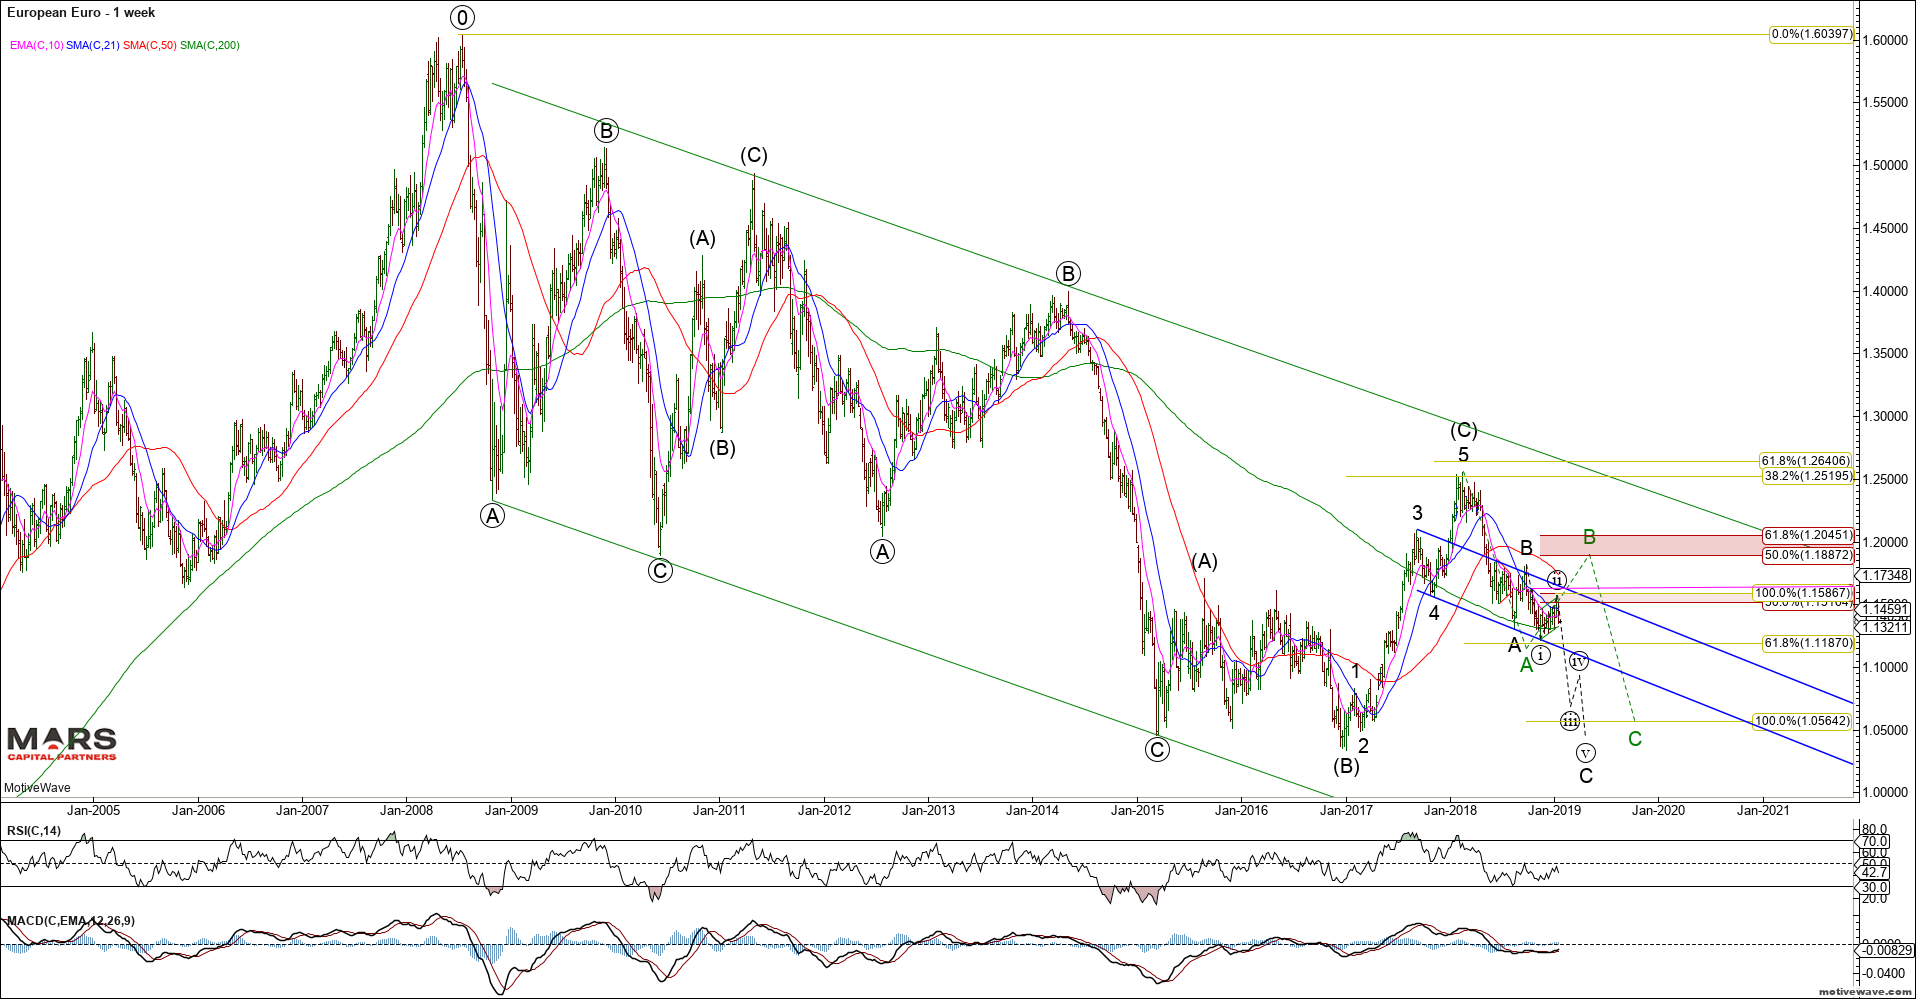
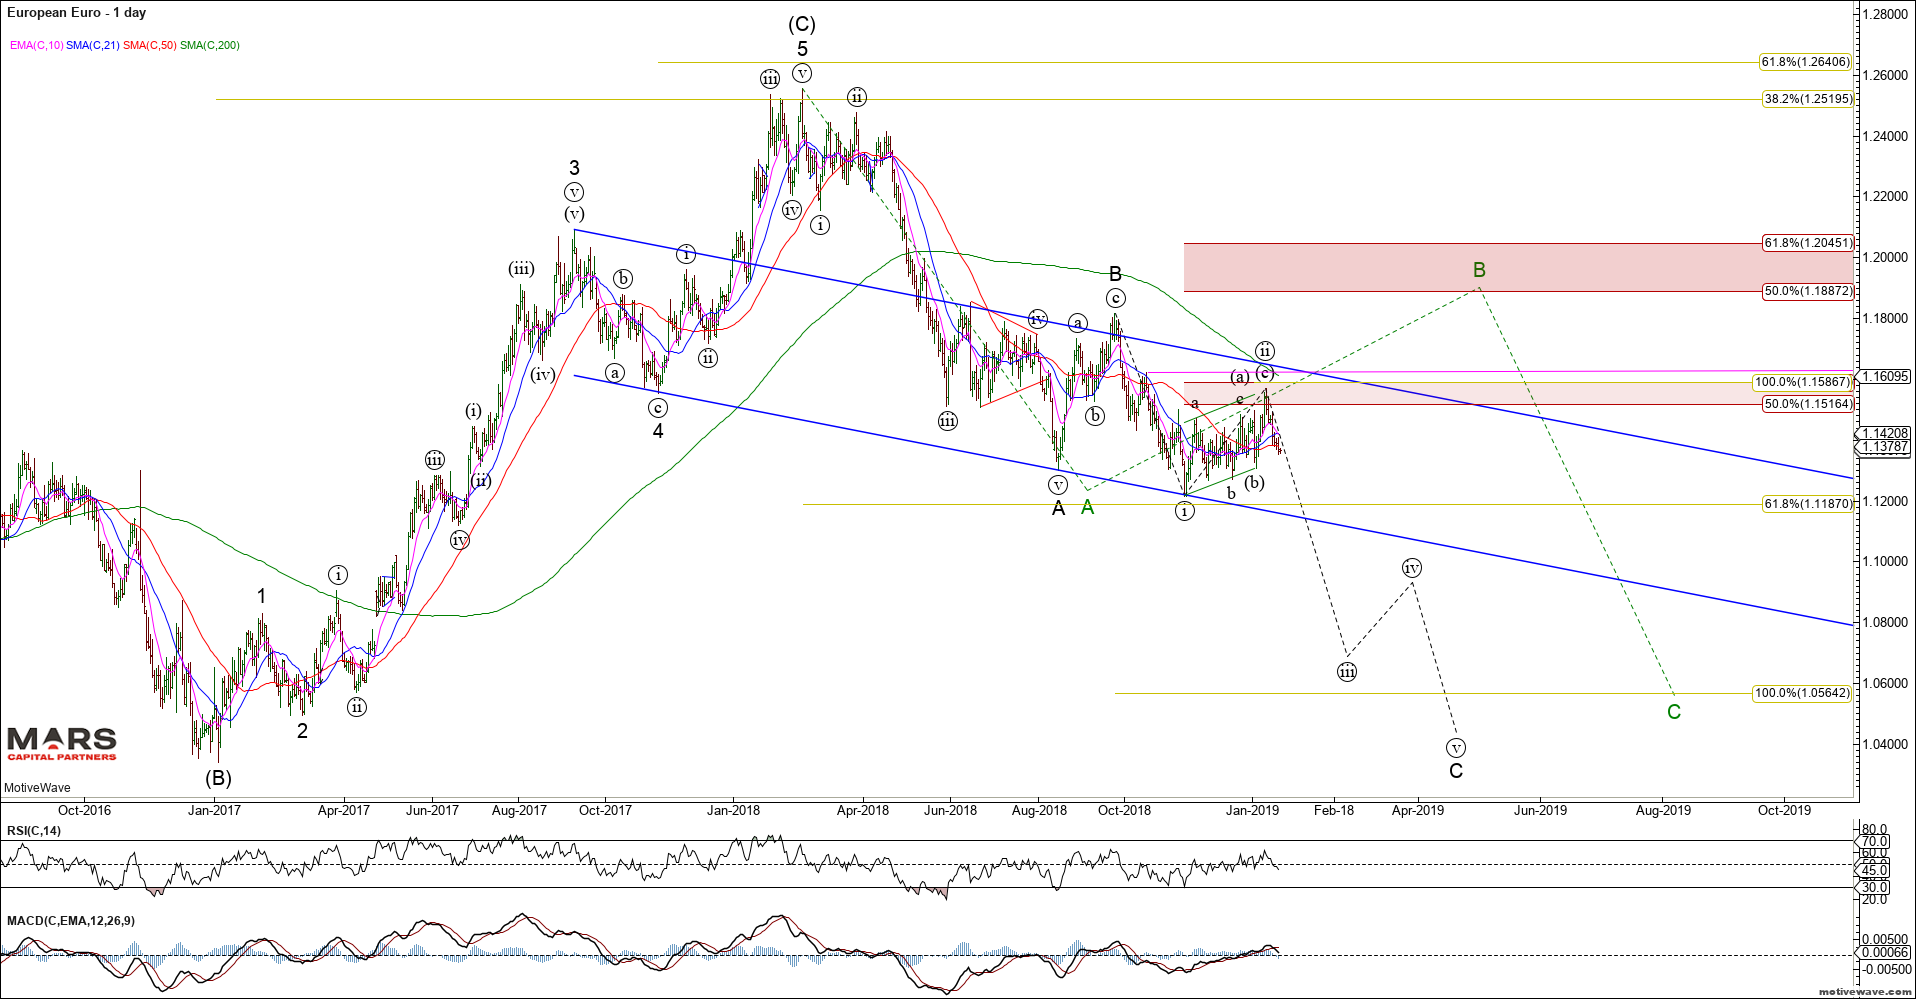
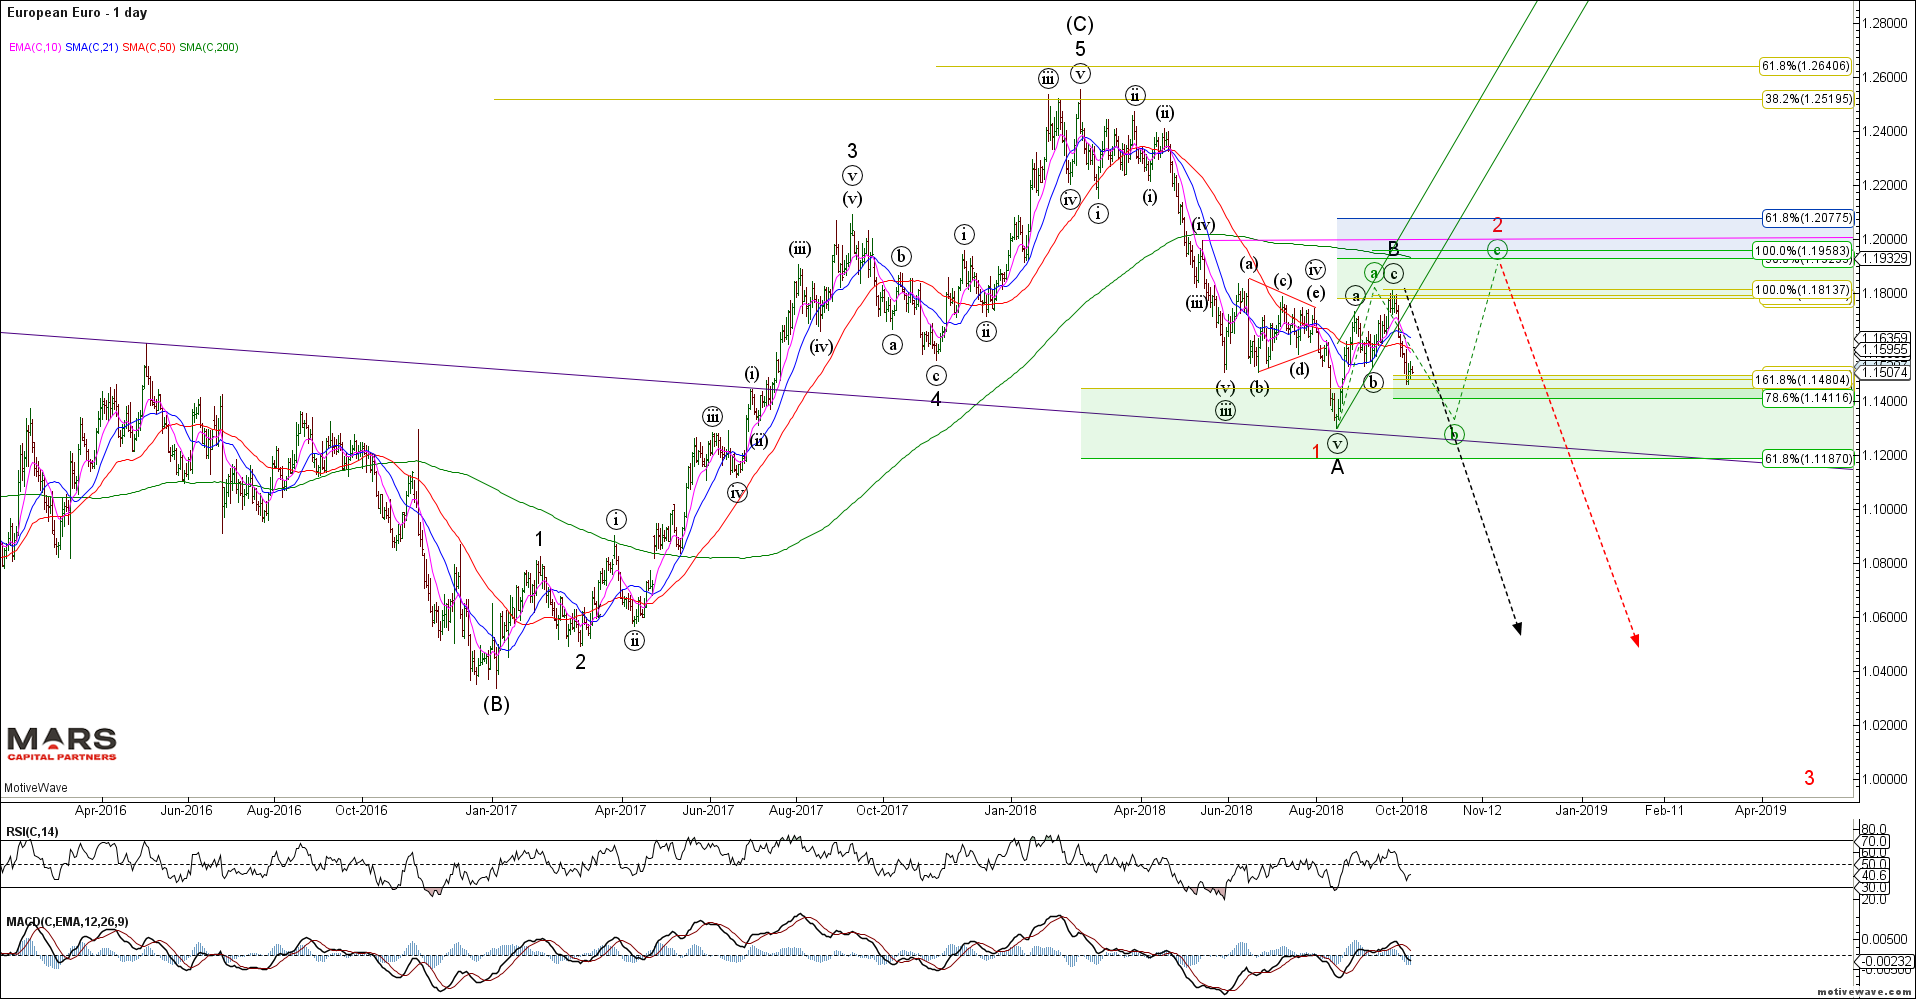
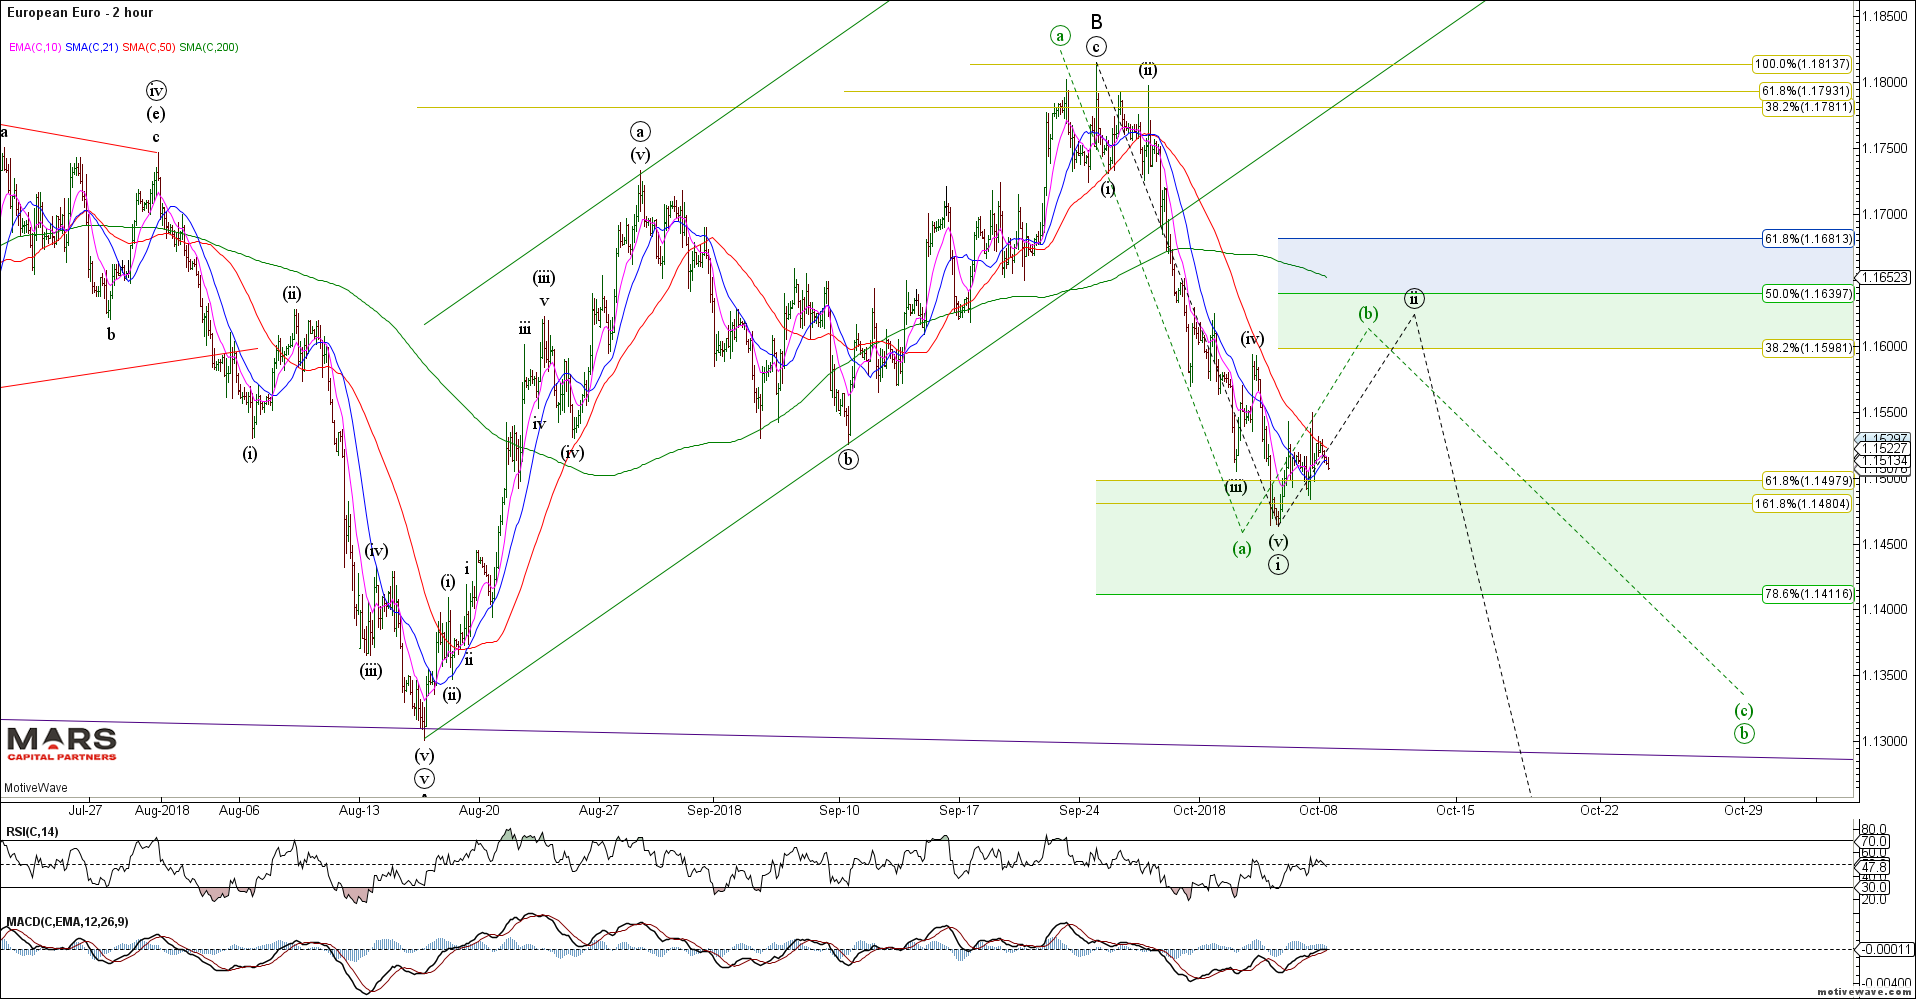
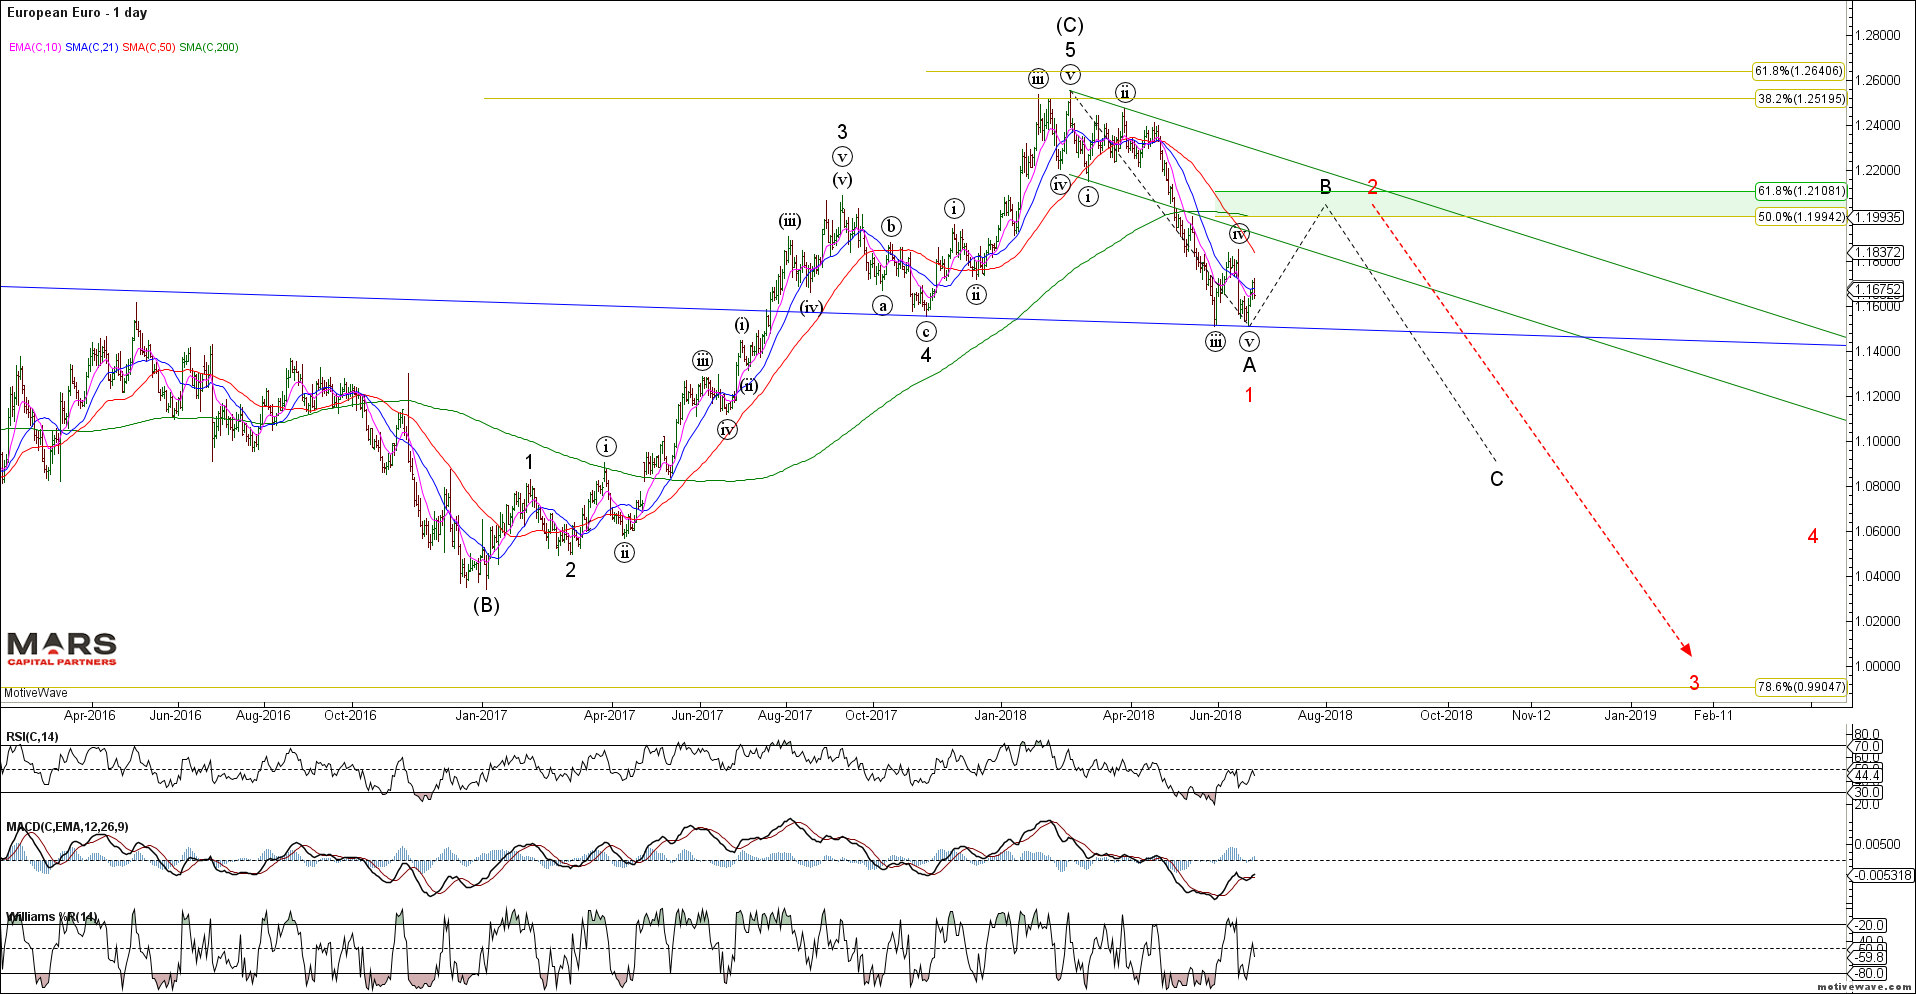
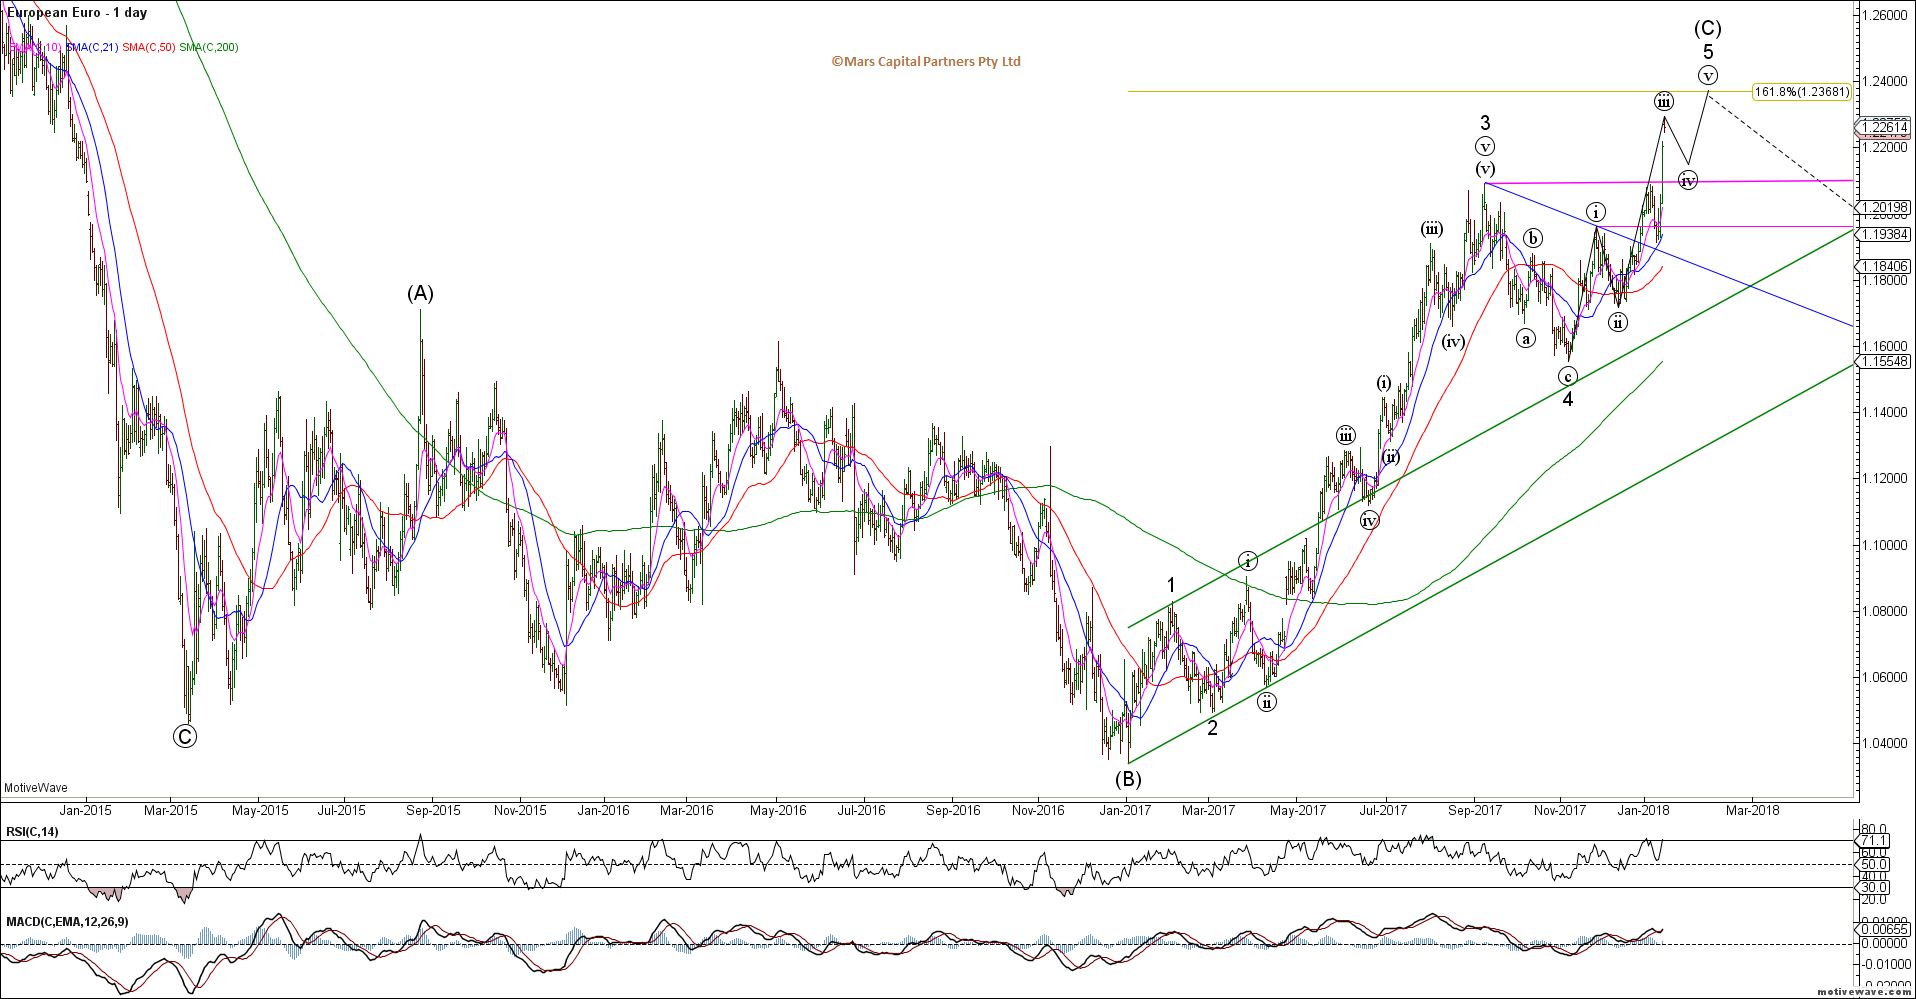
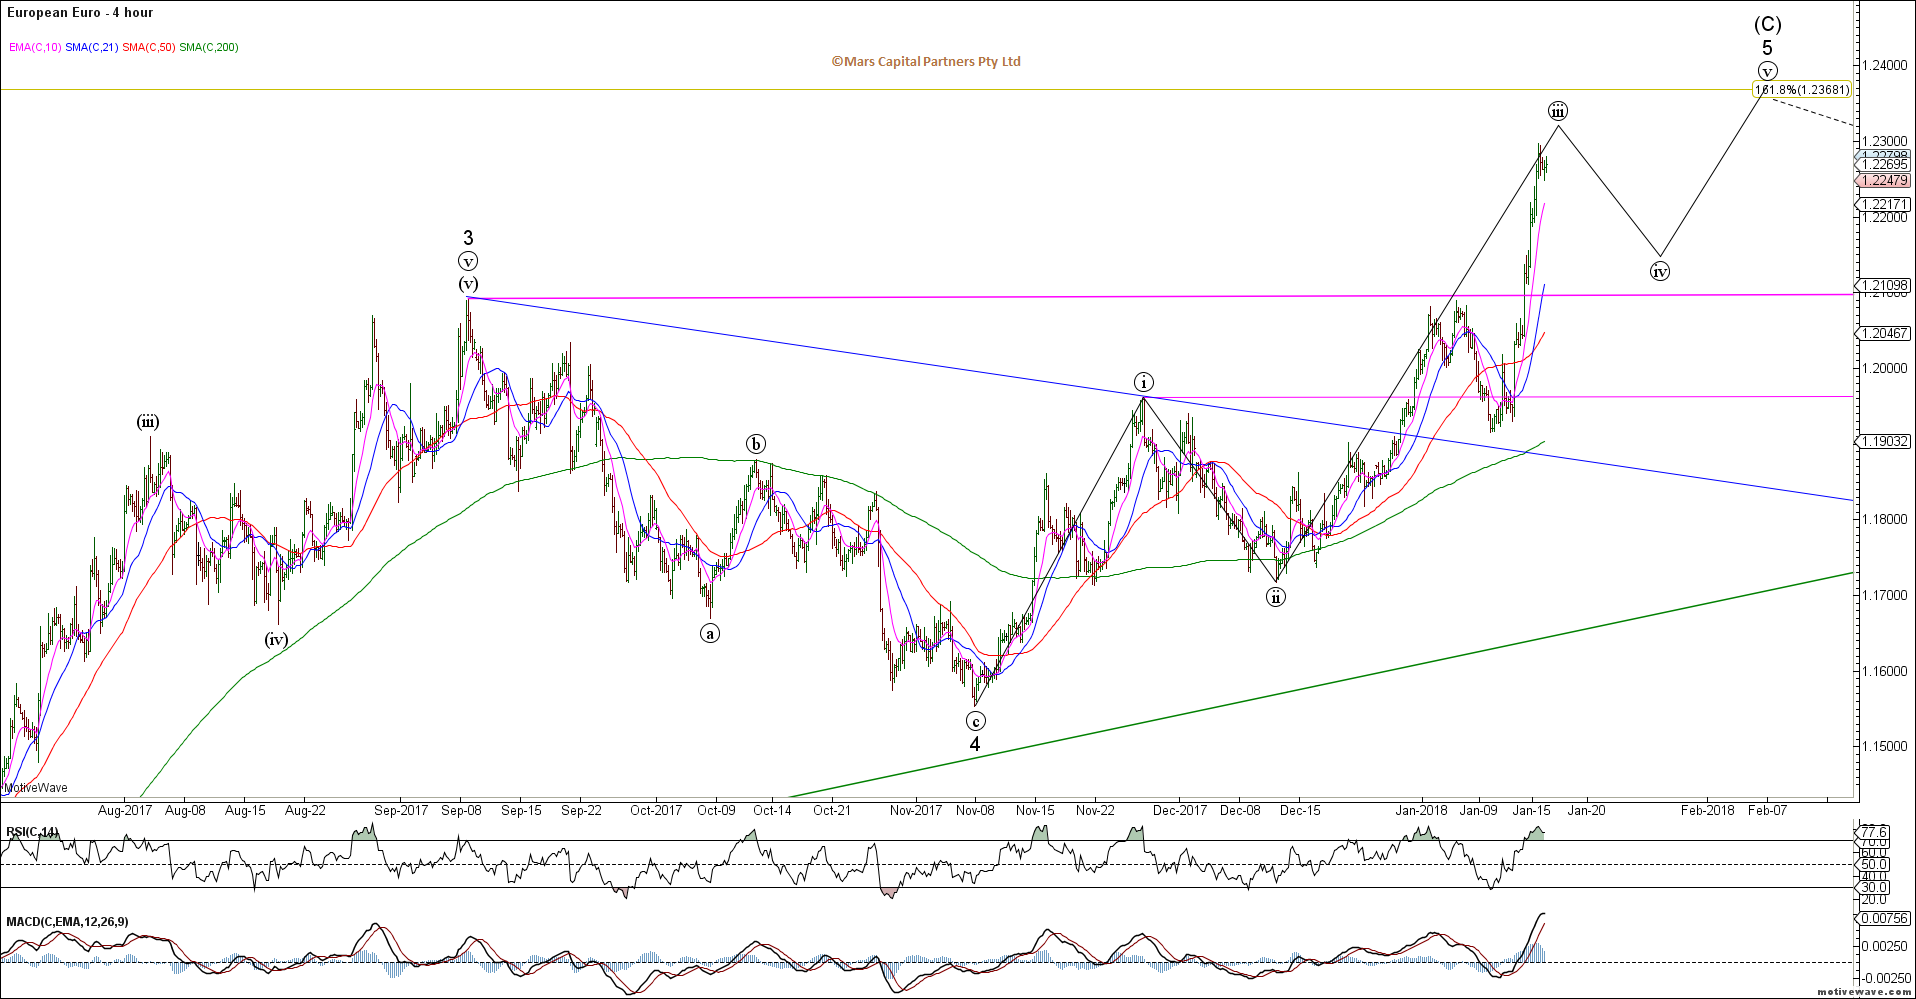
The Euro bullish potential remains in tact but the recent deep retracement calls this count into question. The Euro has not been able to maintain any of its bullish reversals as yet – risky as the bigger picture bear trend remains unbroken.
EURUSD Daily
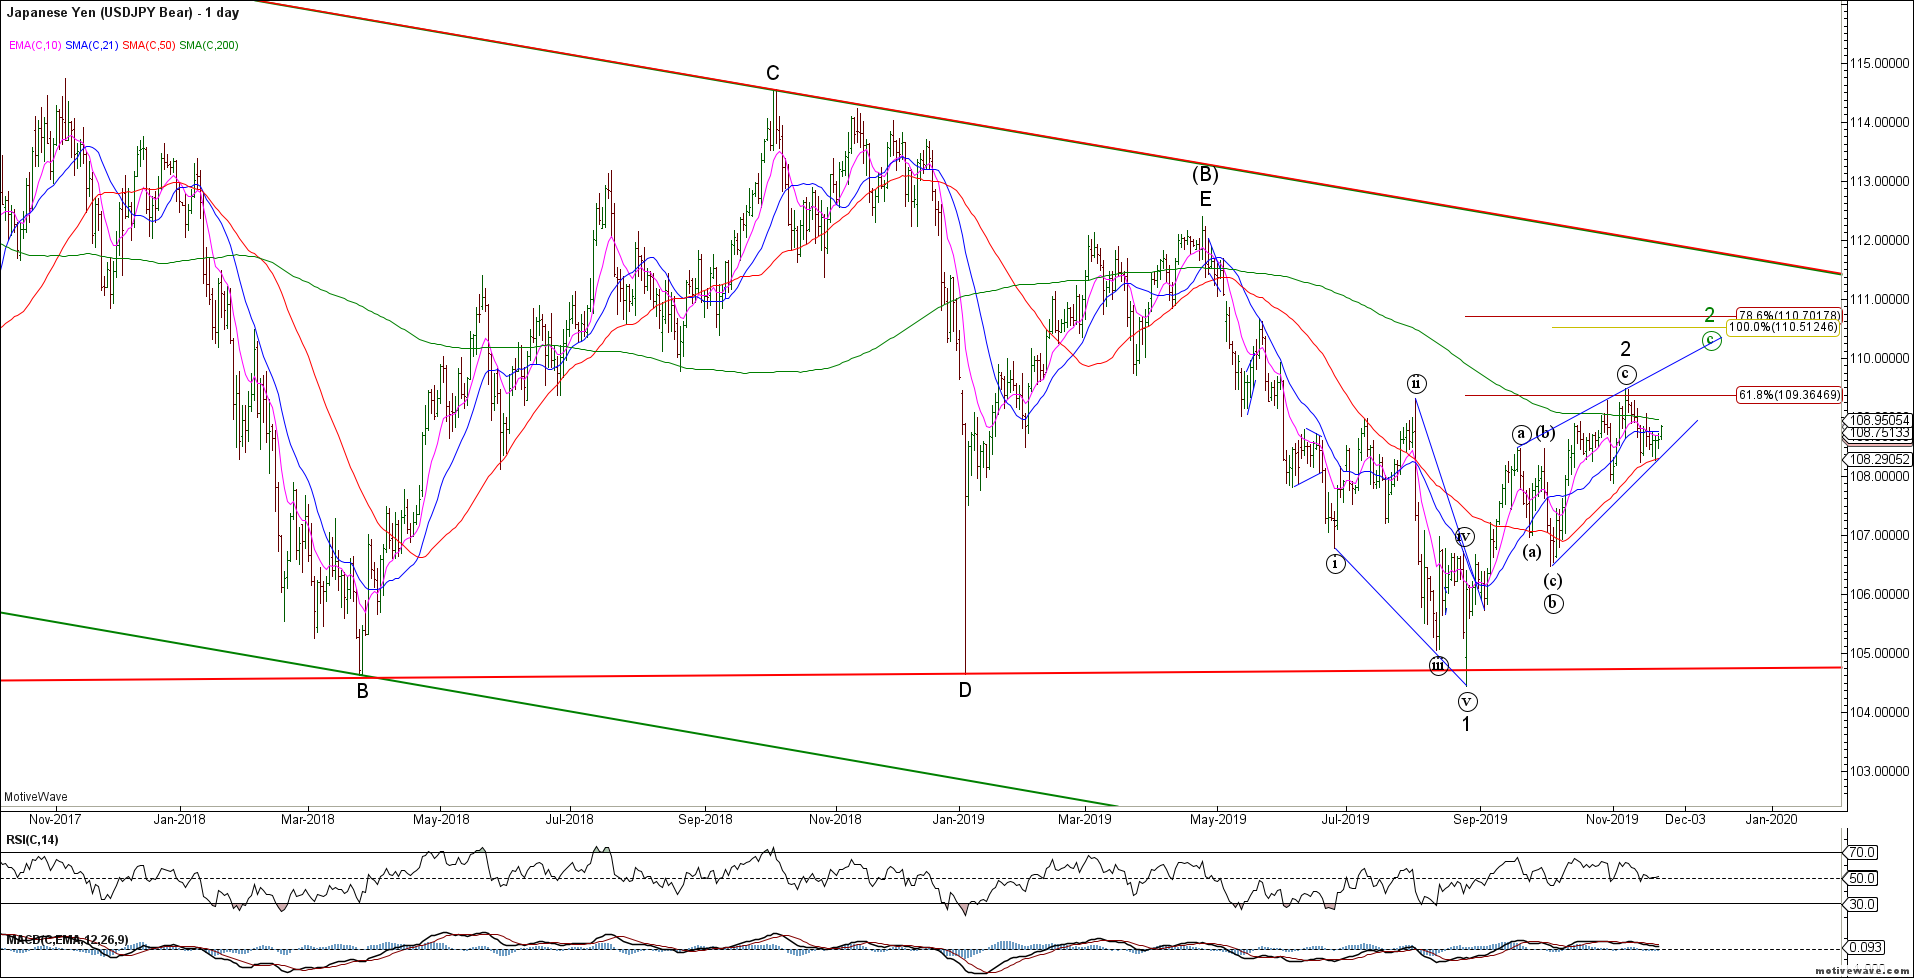
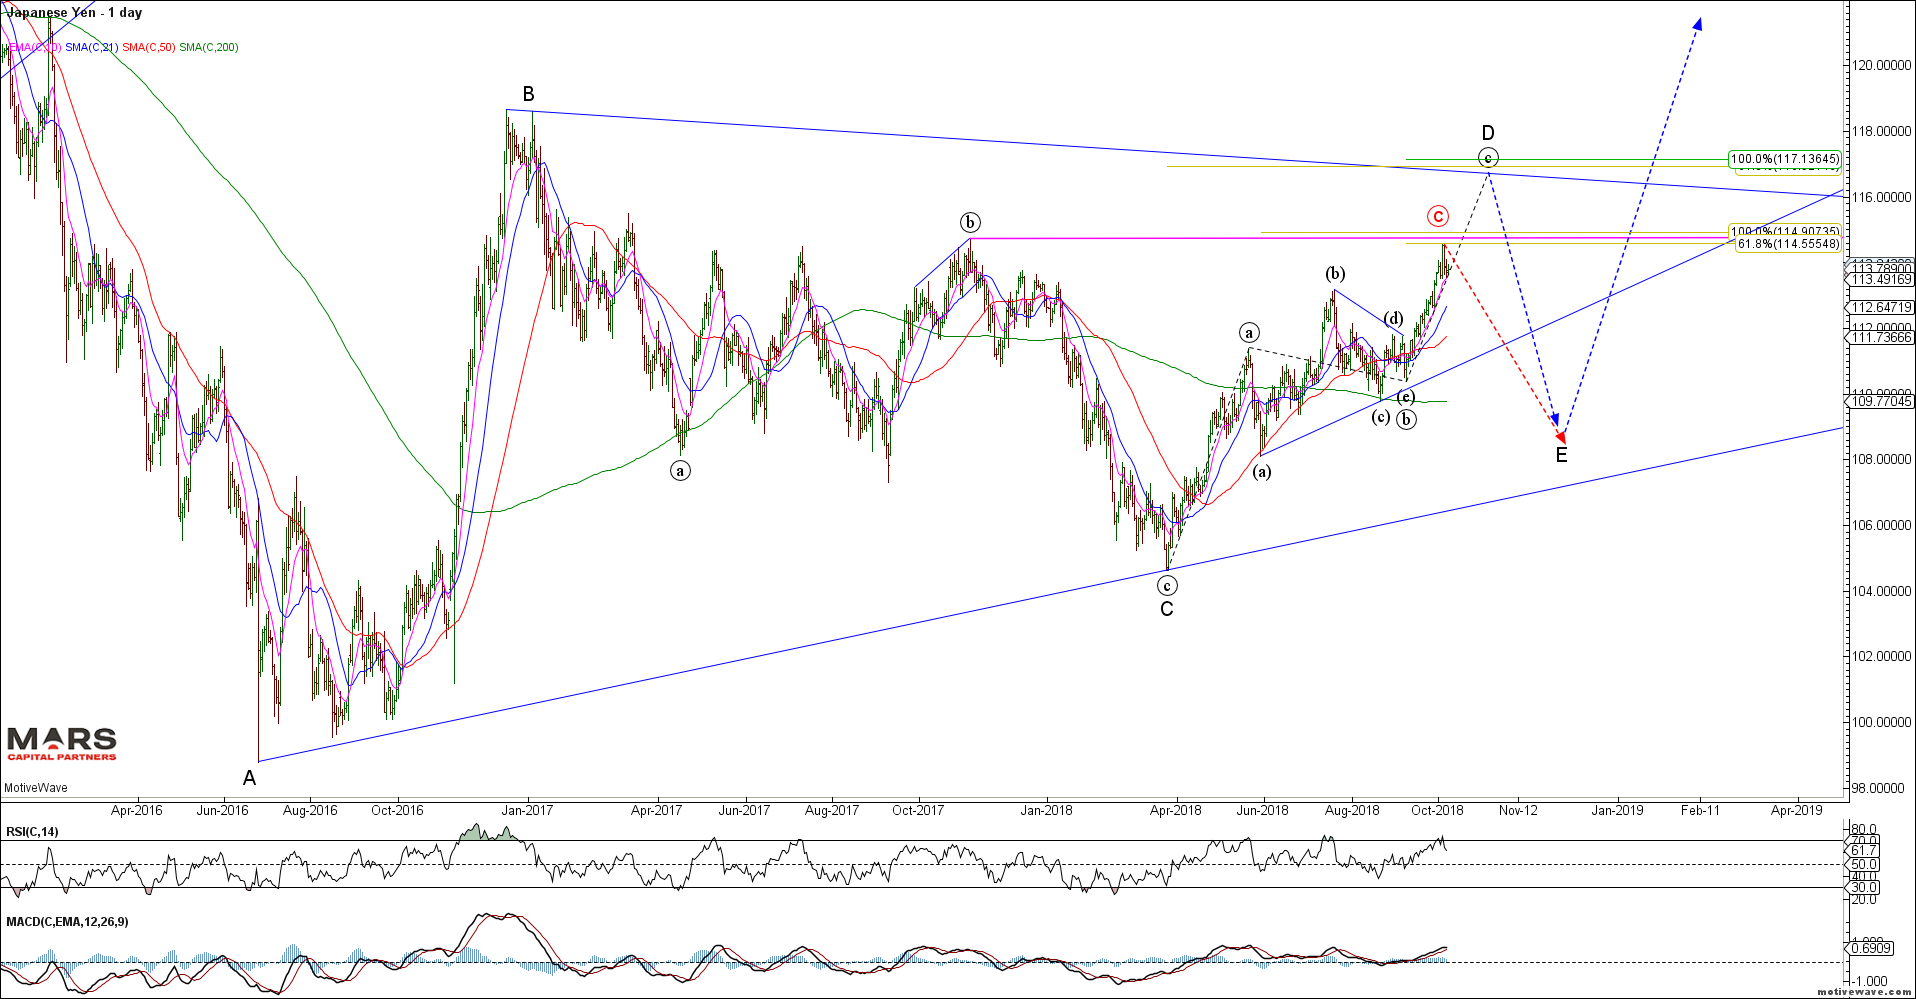
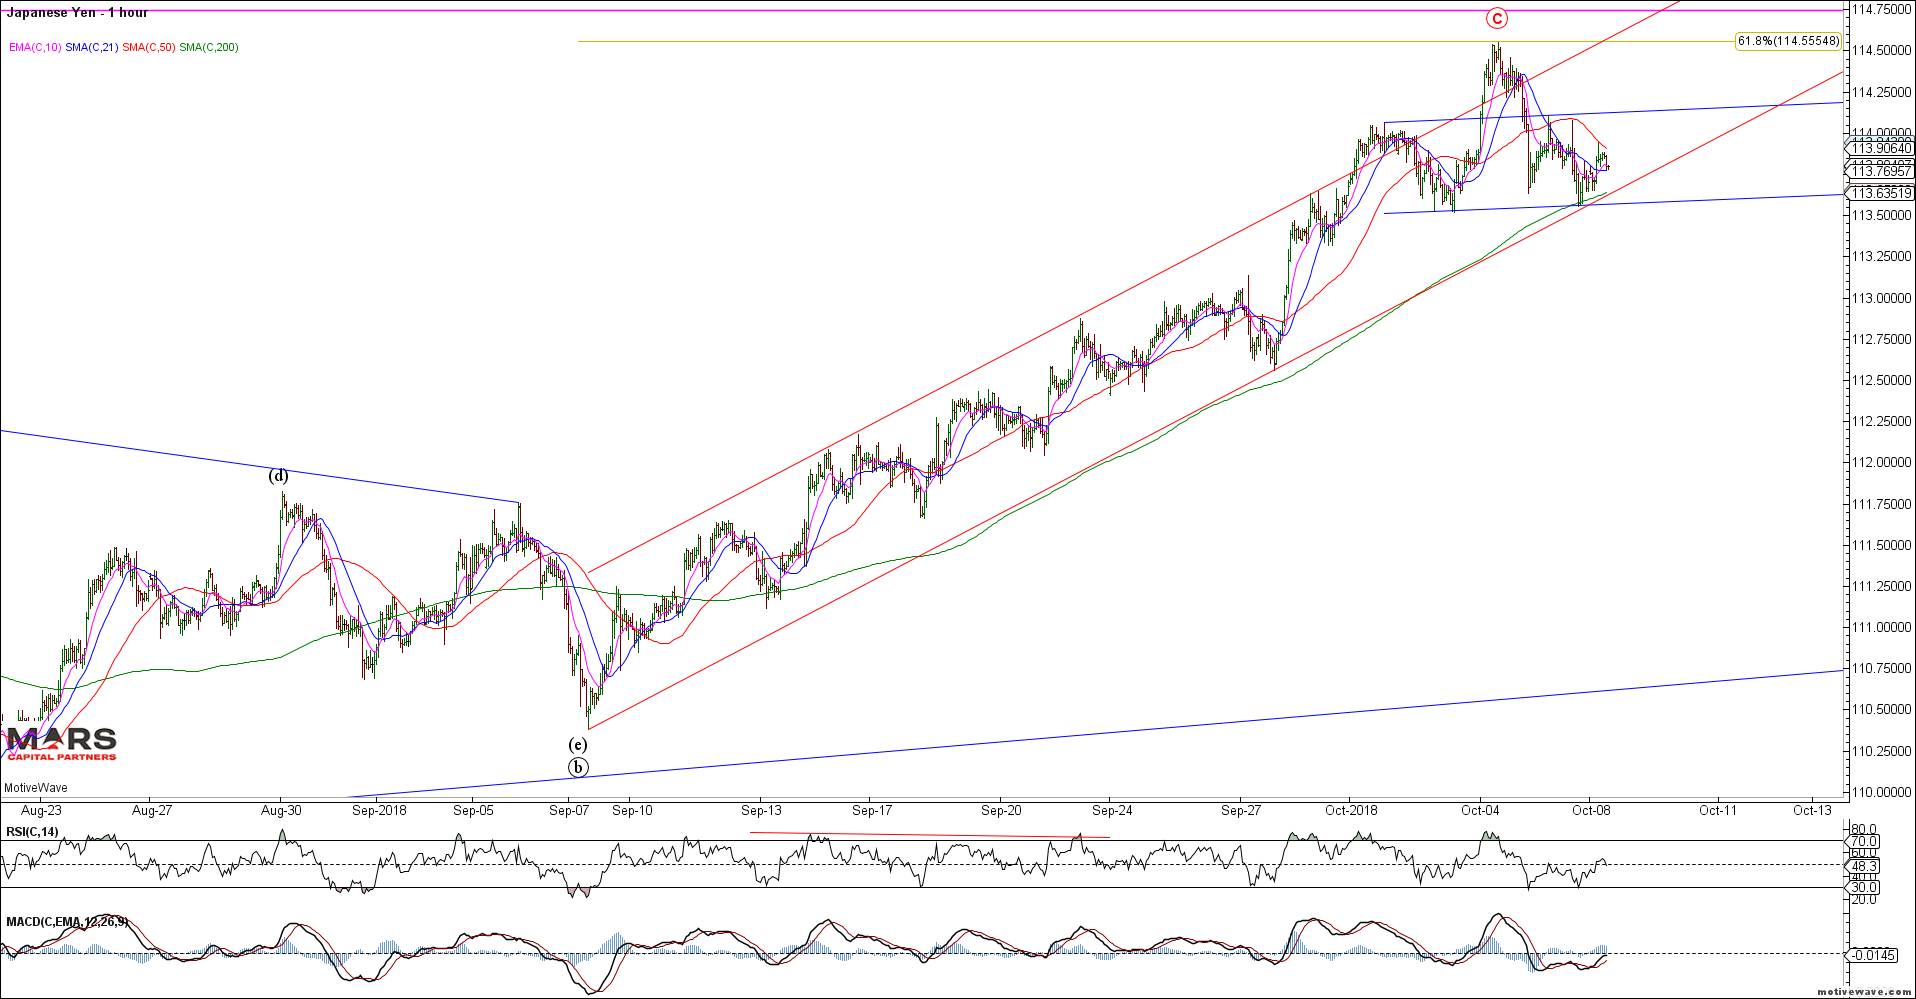
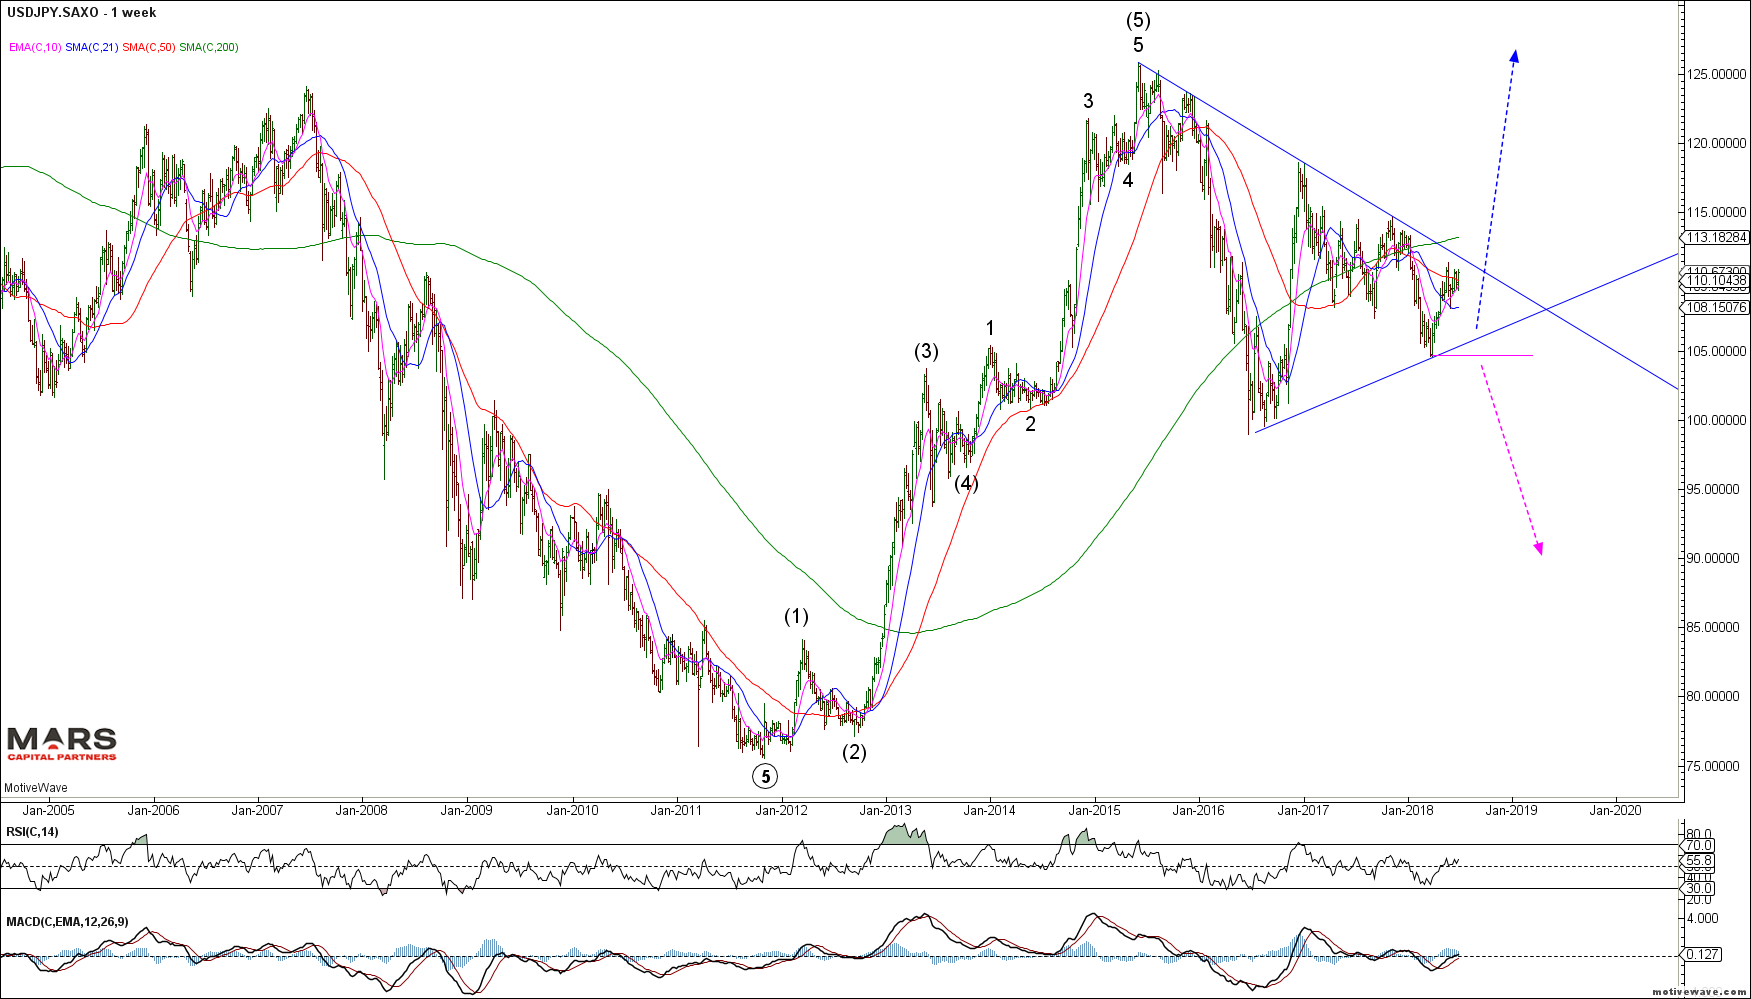
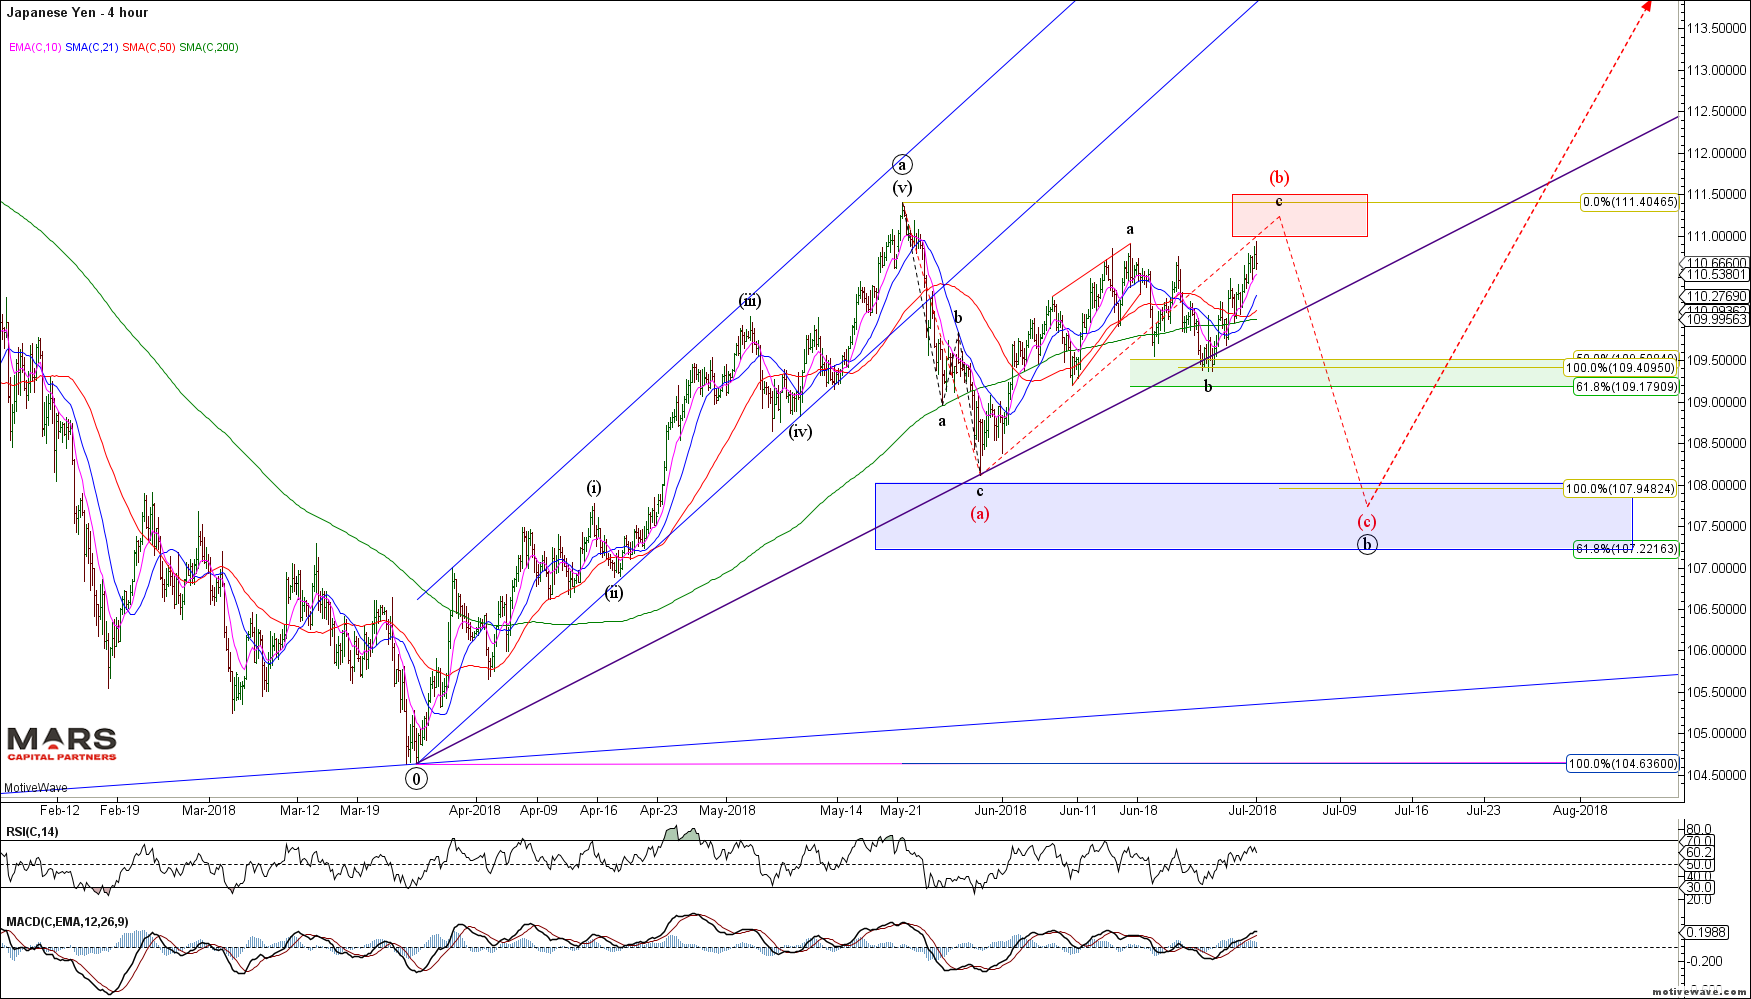
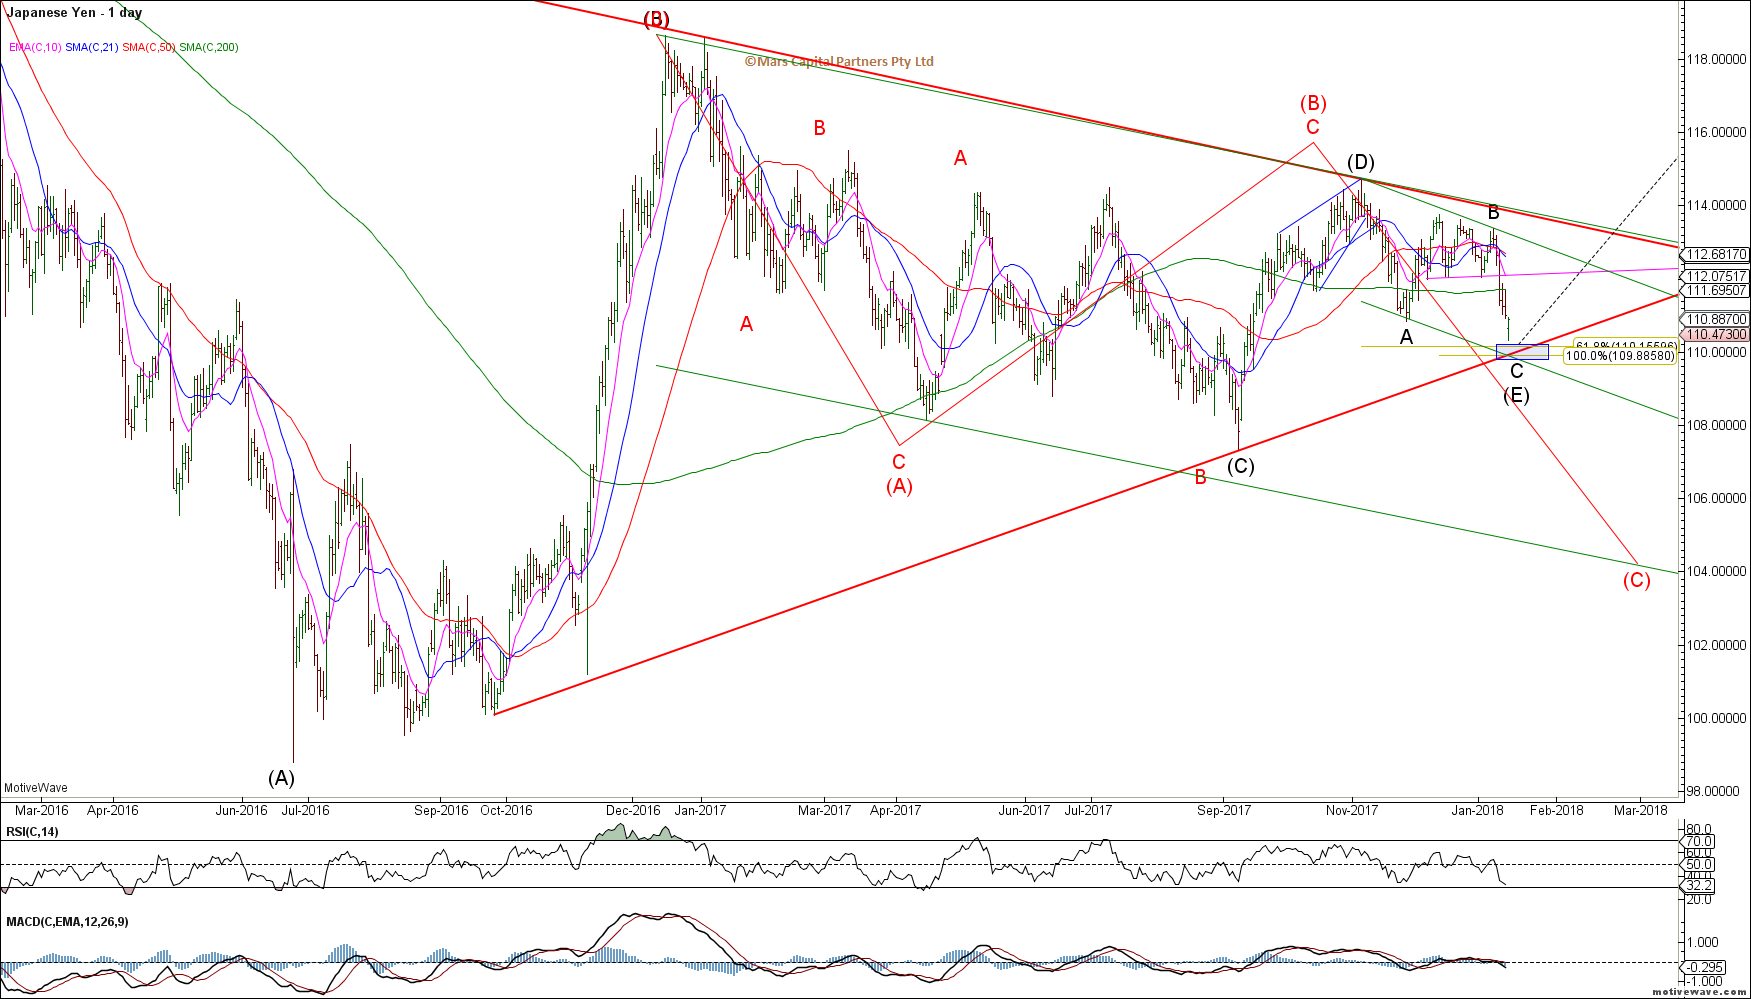
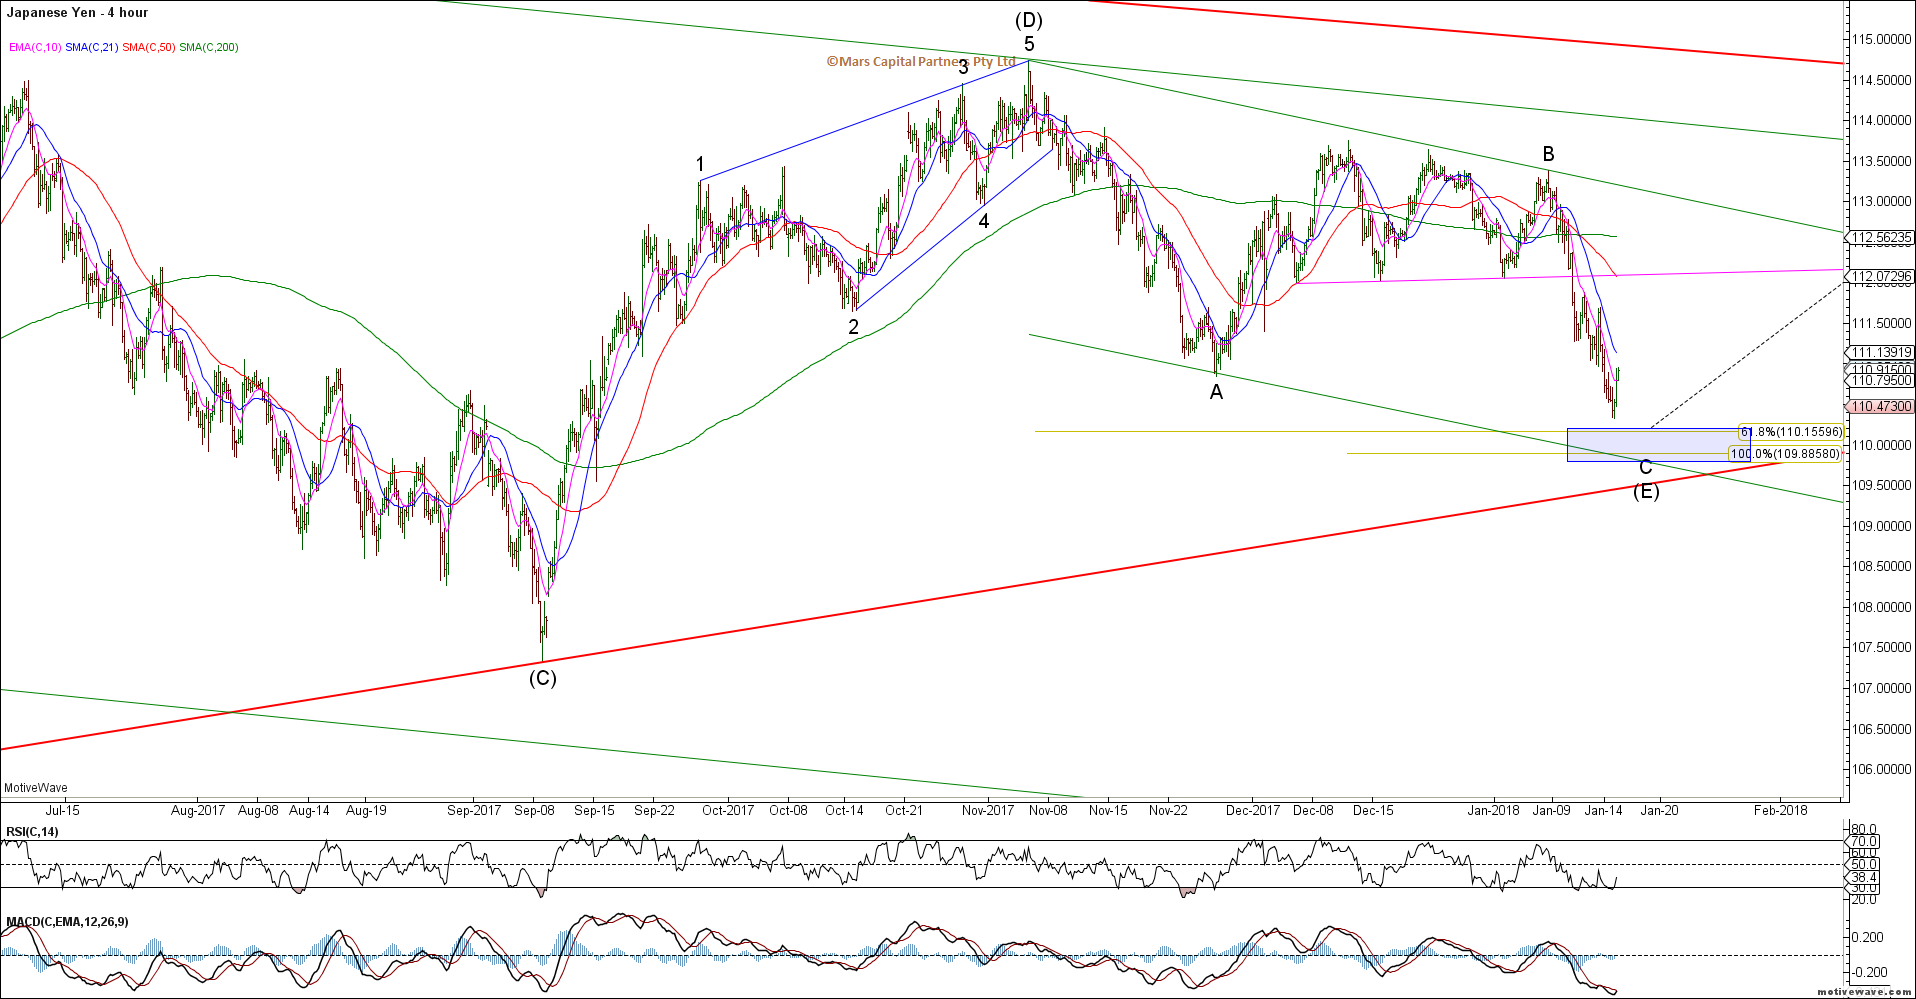
The USDJPY also refuses to break down and held its 50 day sma. We do not have confirmation of a bearish reversal so the risk is another wave higher in what appears to be a wedge / diagonal. If in doubt stay out.
USDJPY Daily
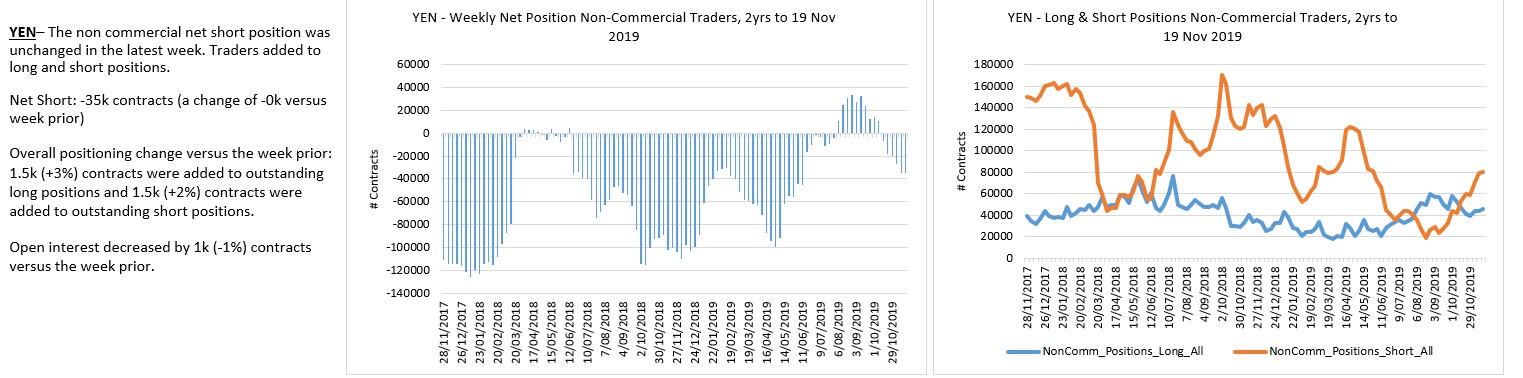
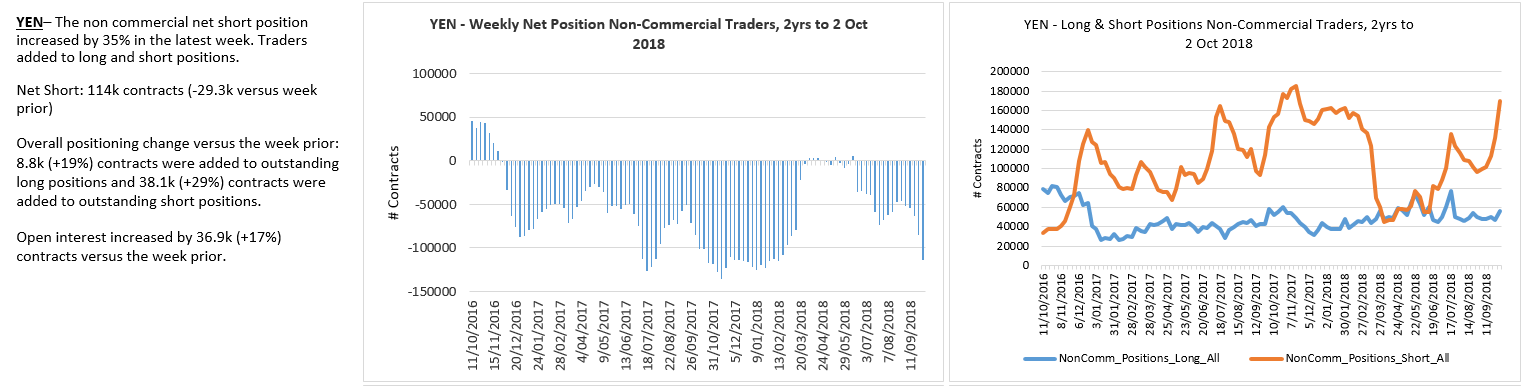
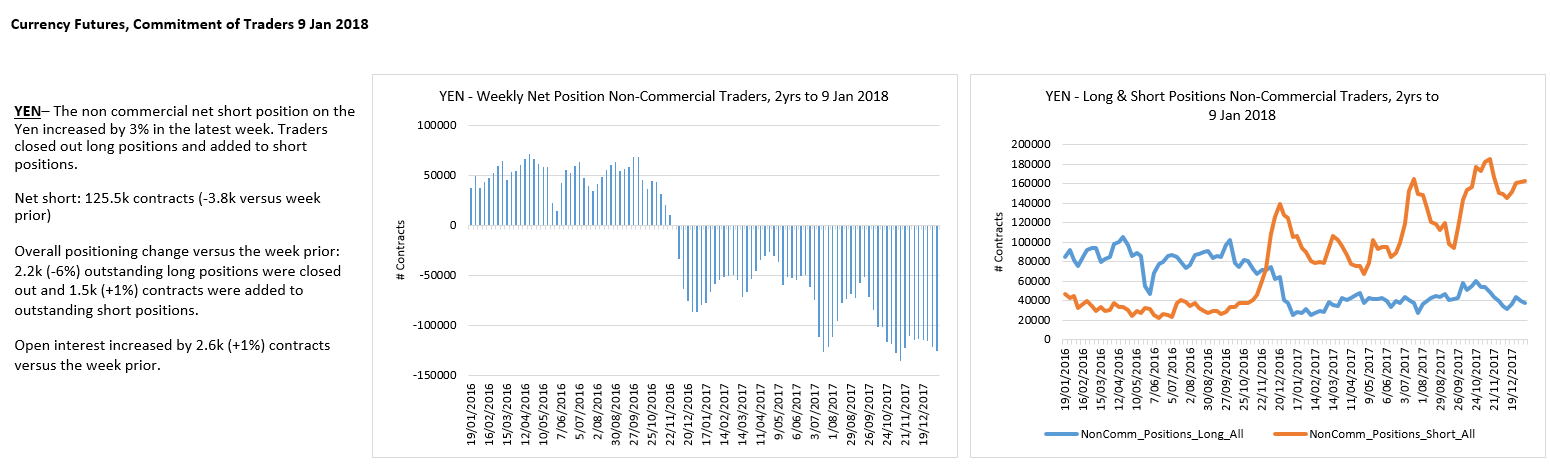
Yen traders only marginally short.
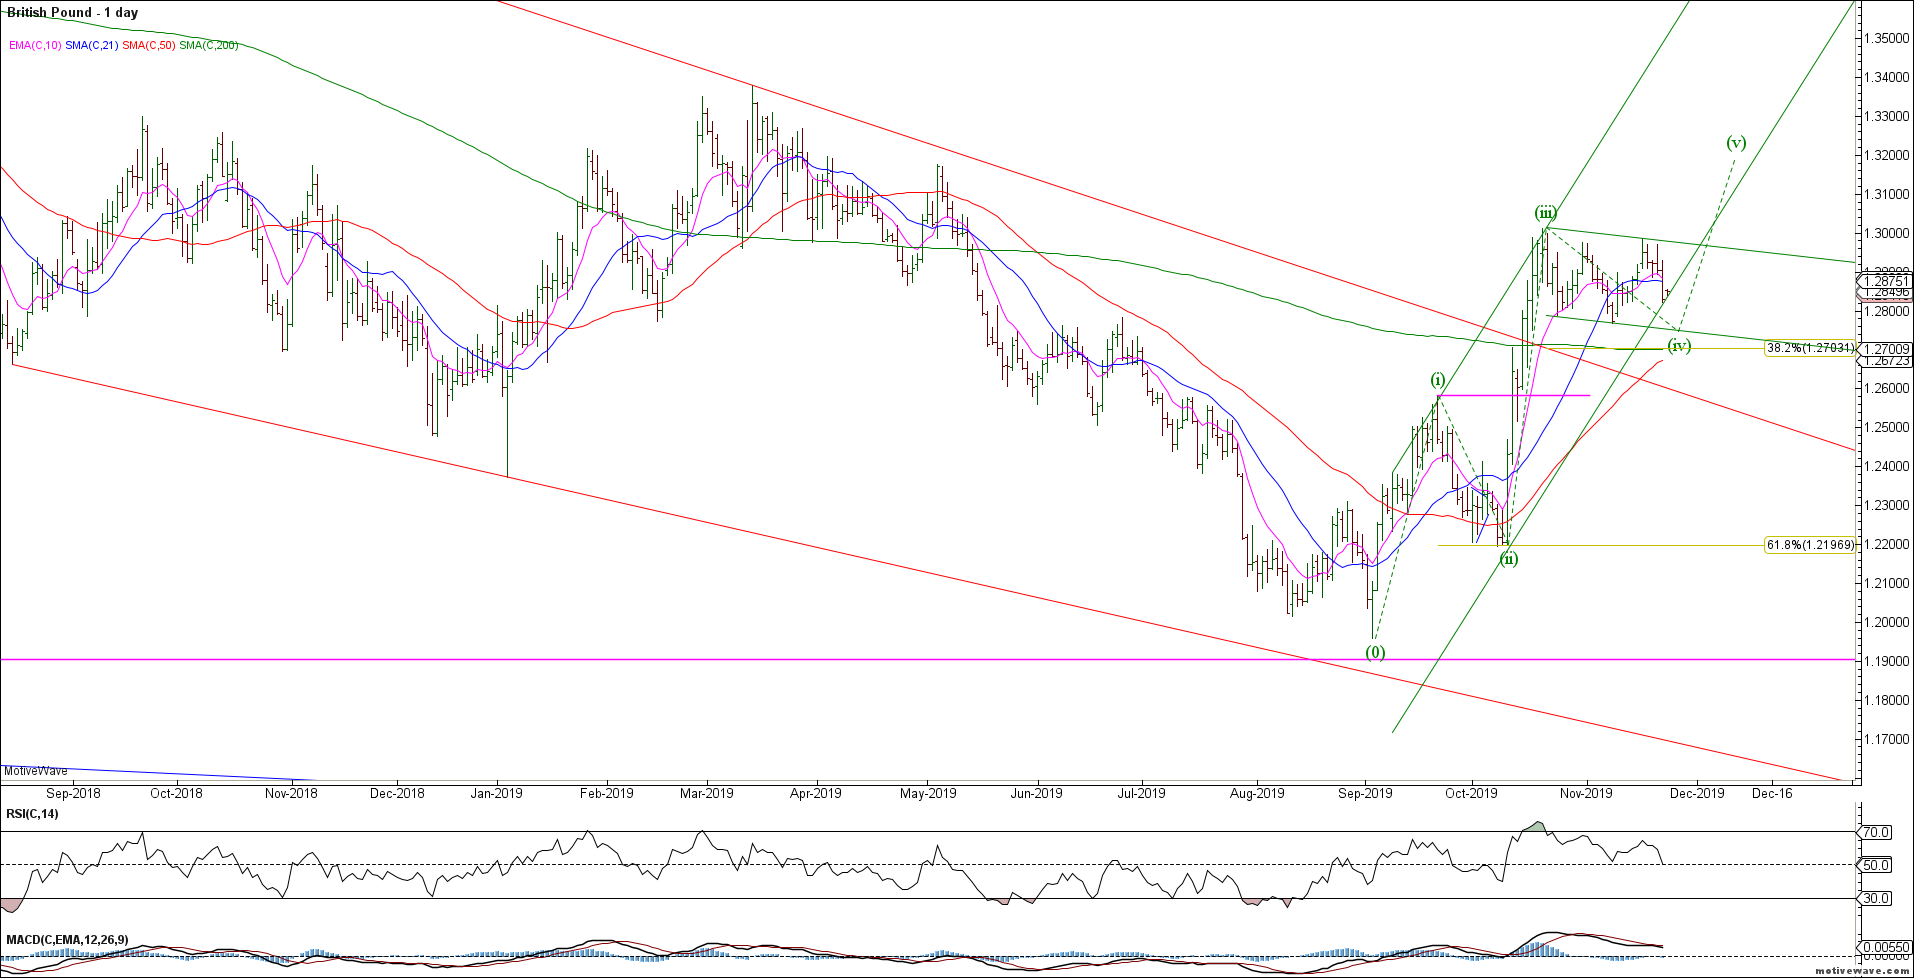
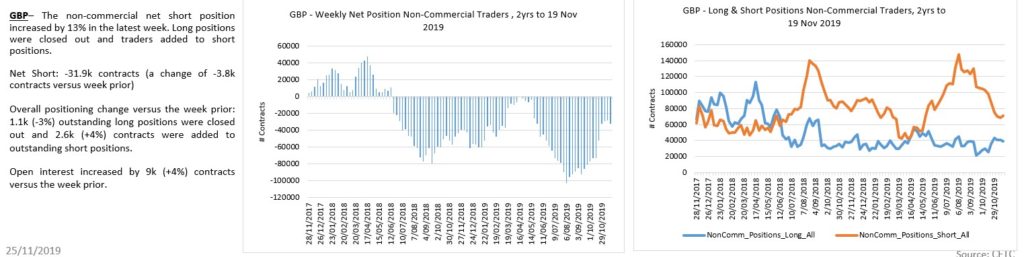
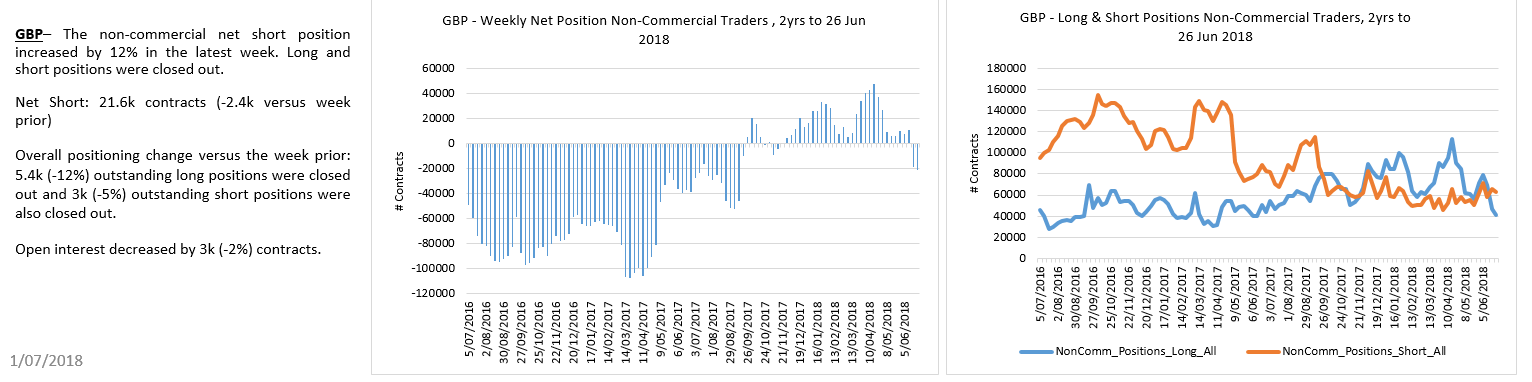
The GBPUSD failed to break out to new highs in wave (v) – bulls need to hold the 1.2700-50 area on any continued pullback and push higher to complete wave (v) for an impulsive rally. Remains bullish while above the 1.2580 wave (i) overlap.
GBPUSD Daily
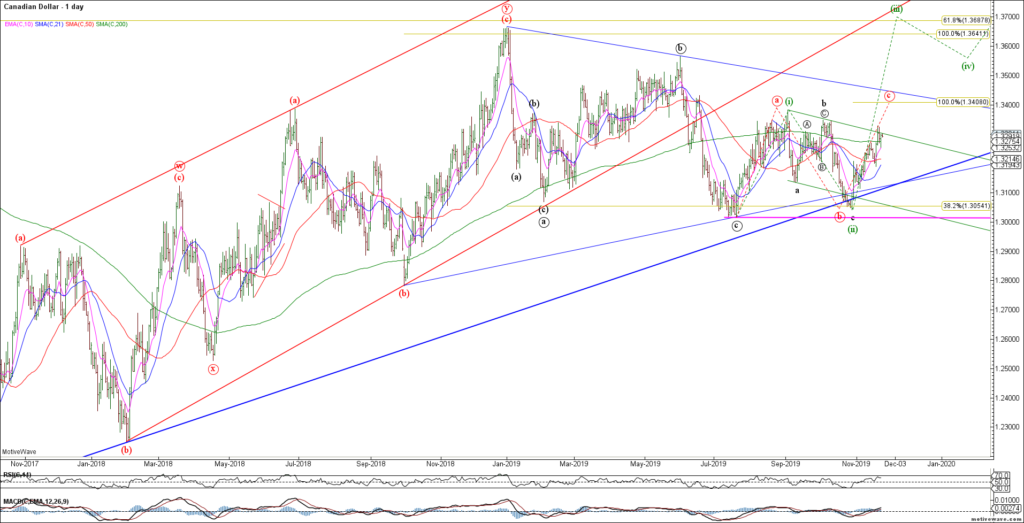
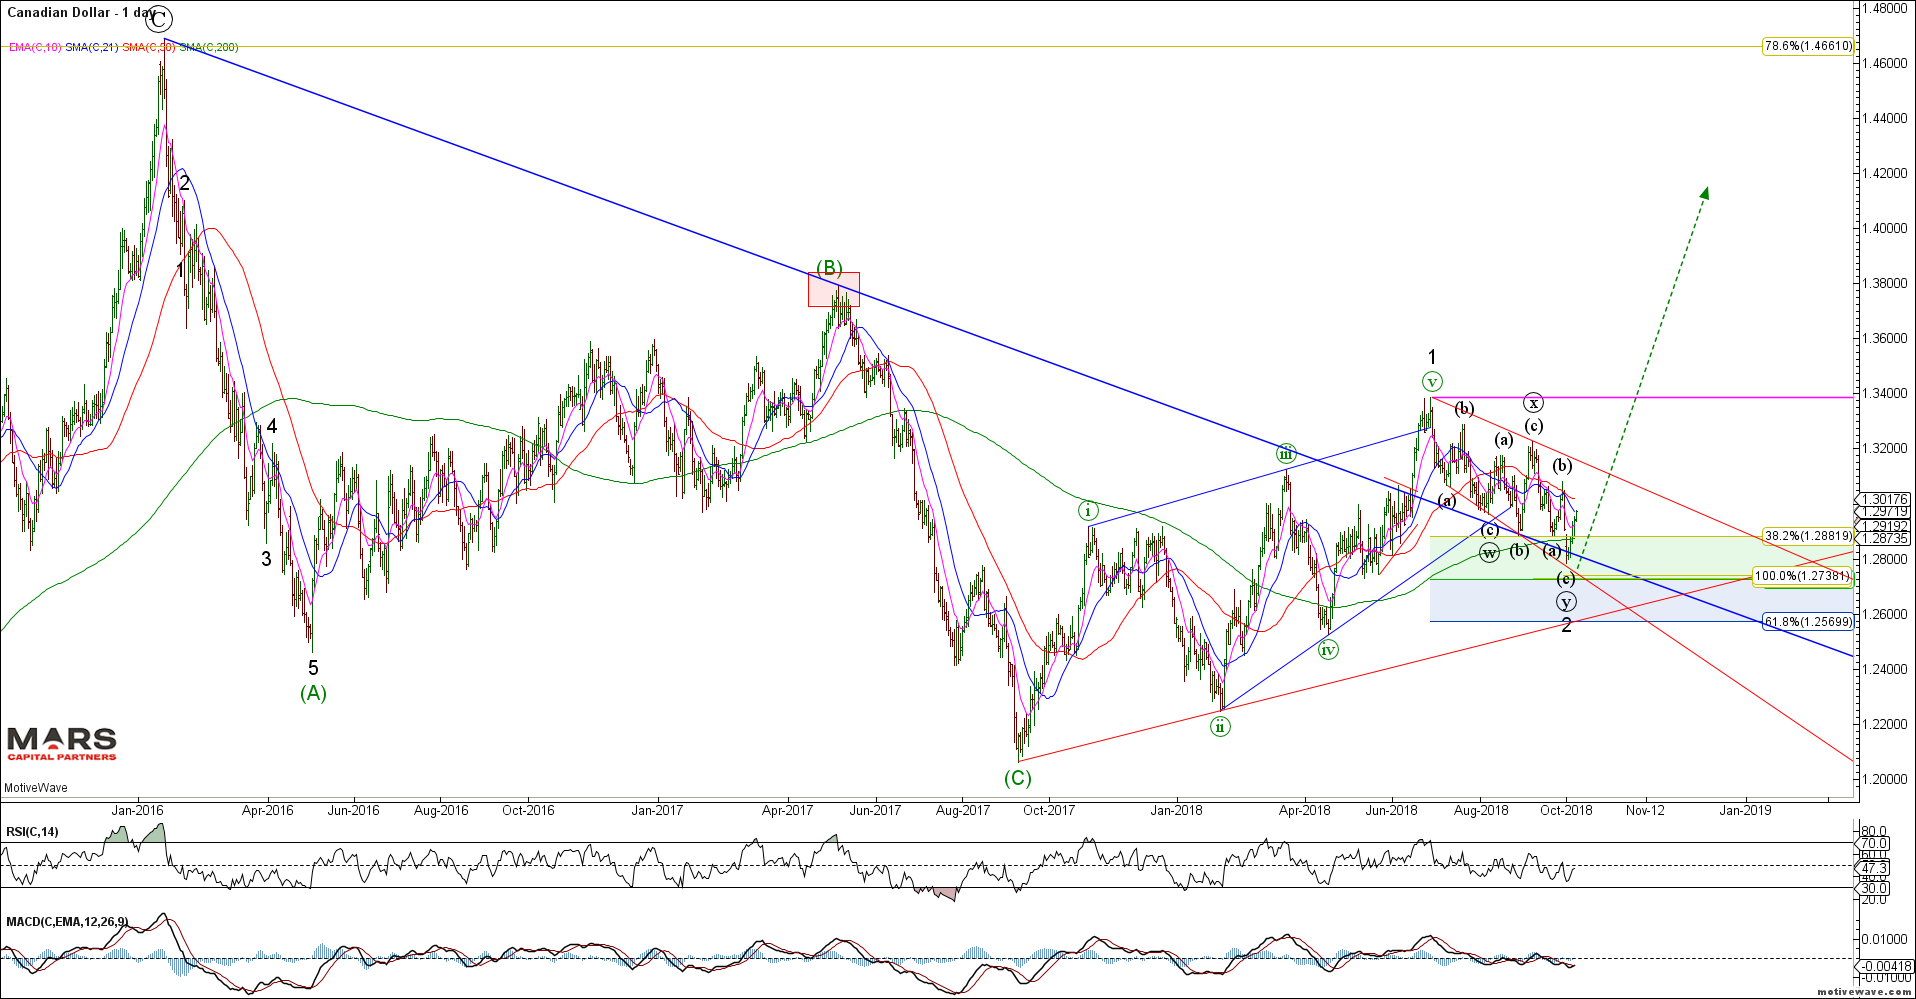
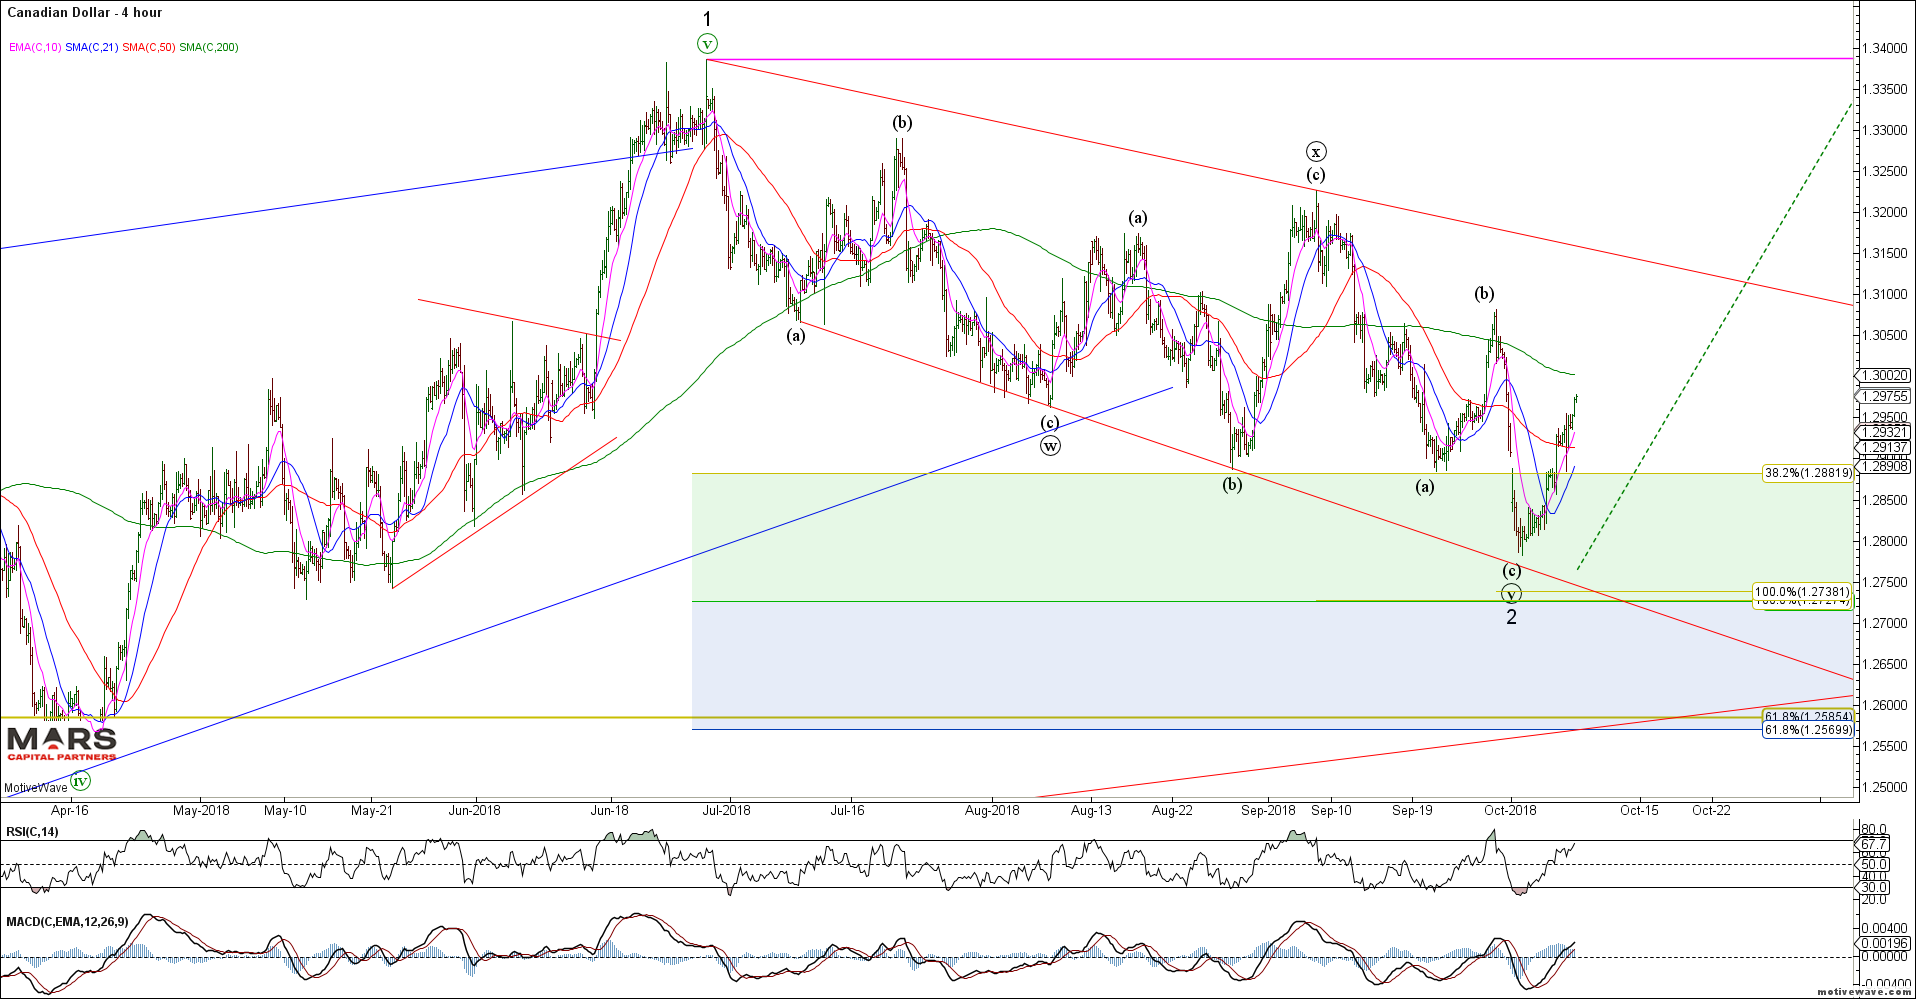
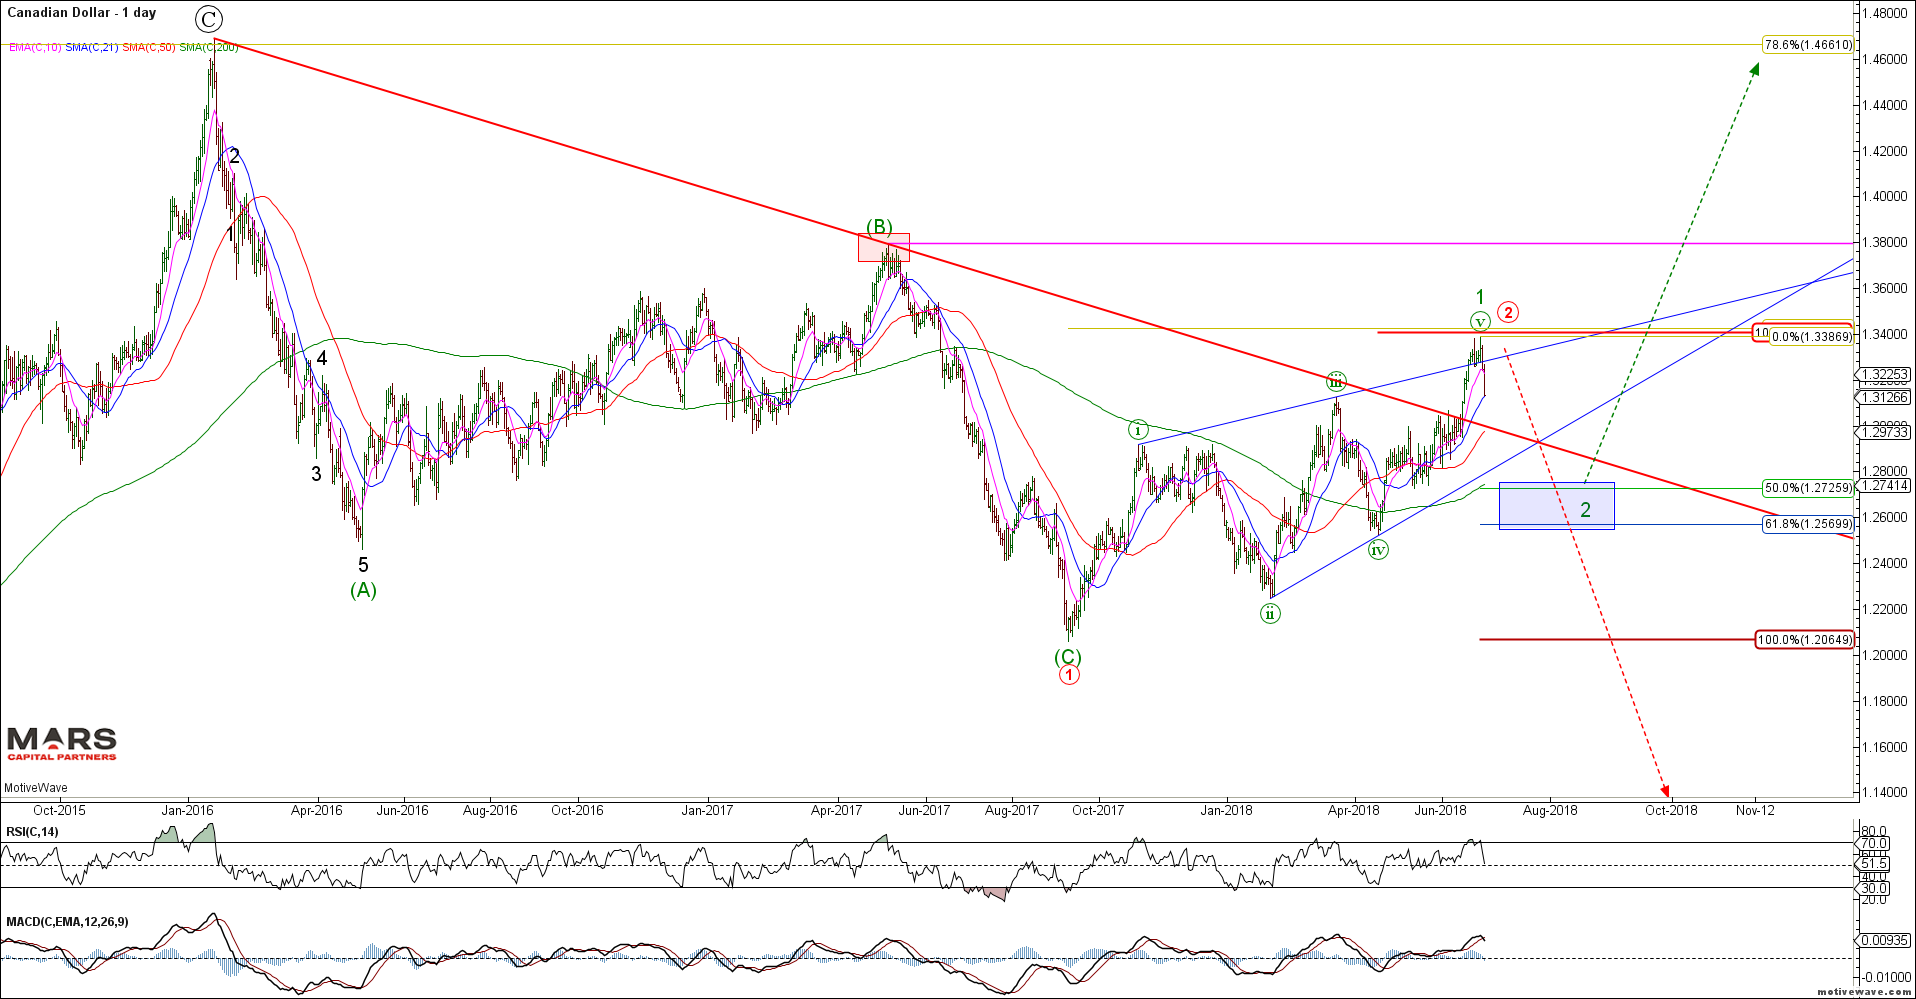
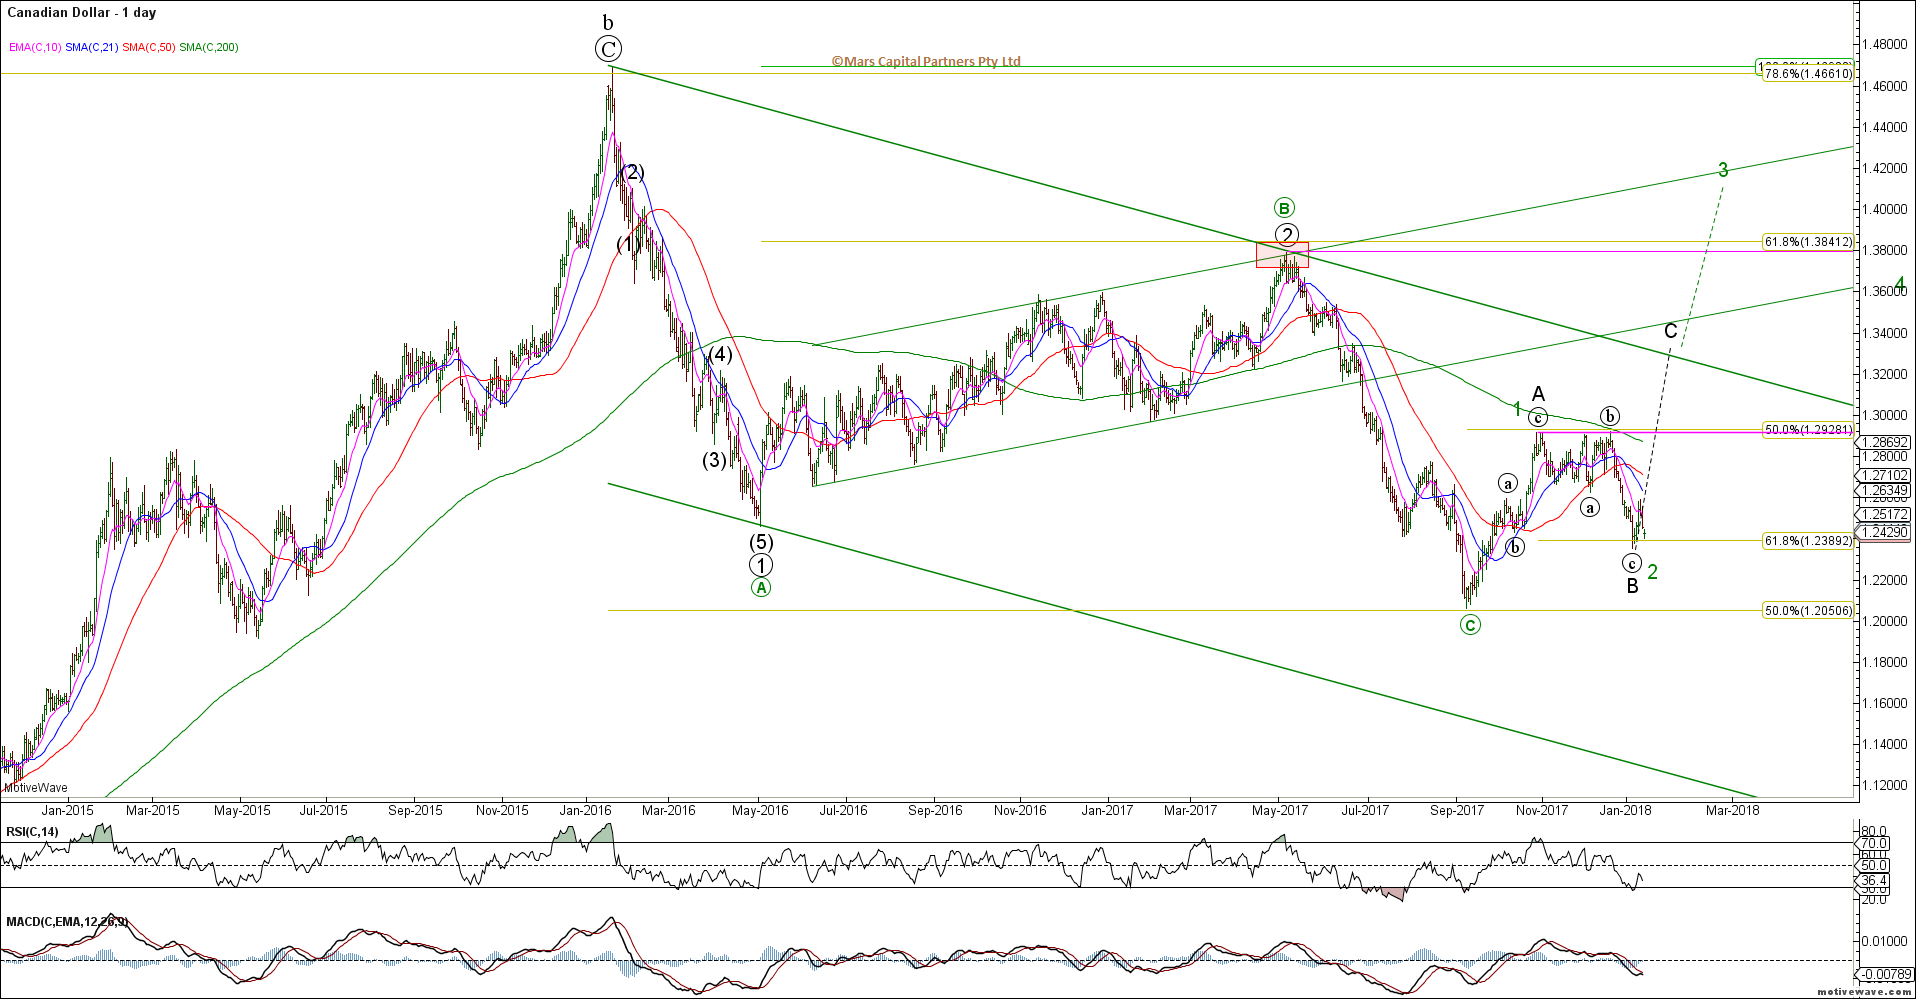
The rally in USDCAD remains constructive but remains range bound from a bigger picture perspective. Our near term target remains 1.3400 but it has been unable to break through overhead resistance so far. We’ll be patient.
USDCAD Daily
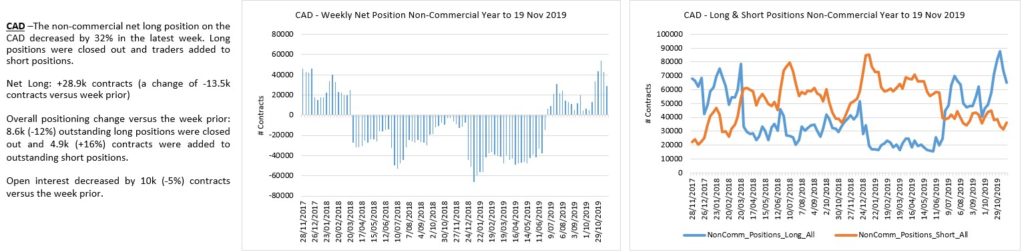
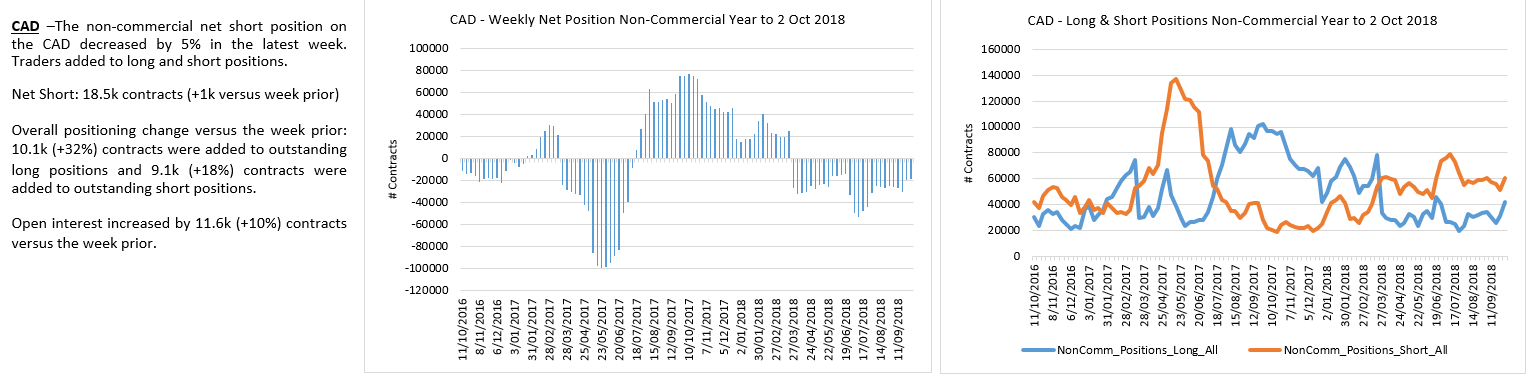
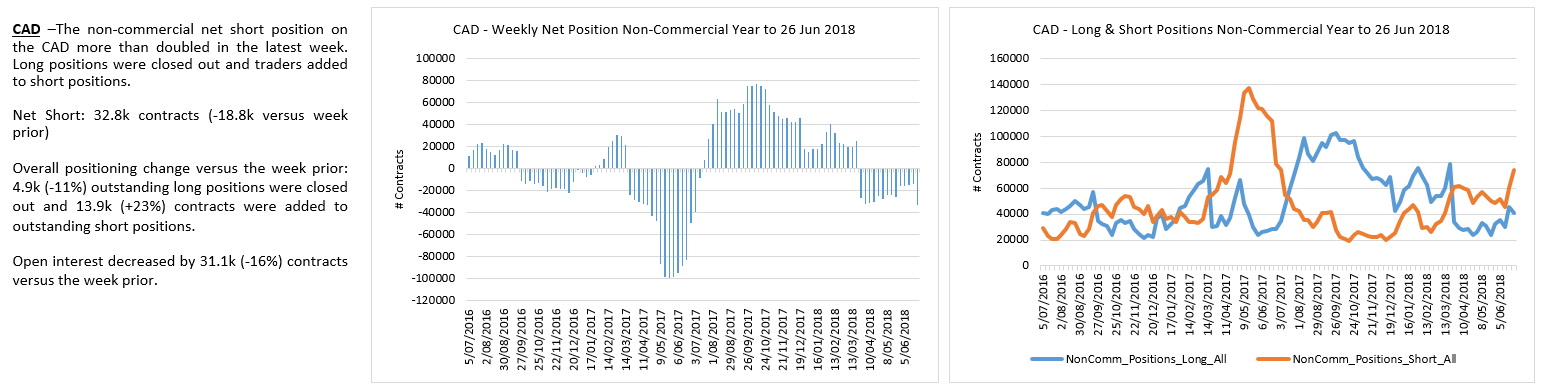
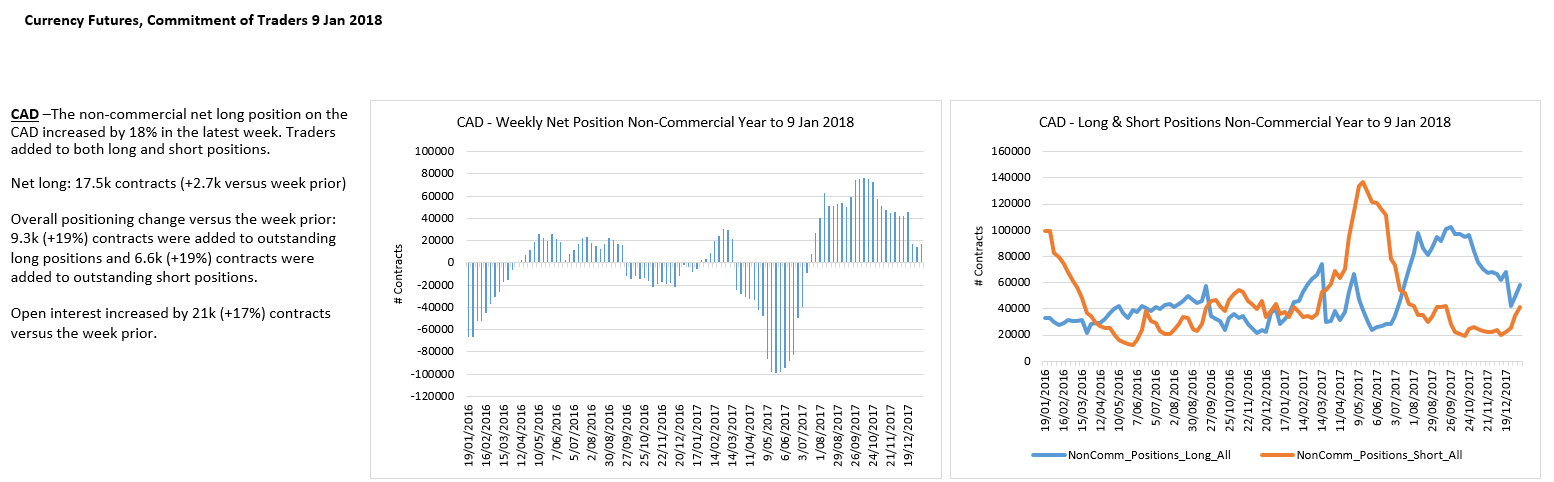
CAD longs getting nervous.
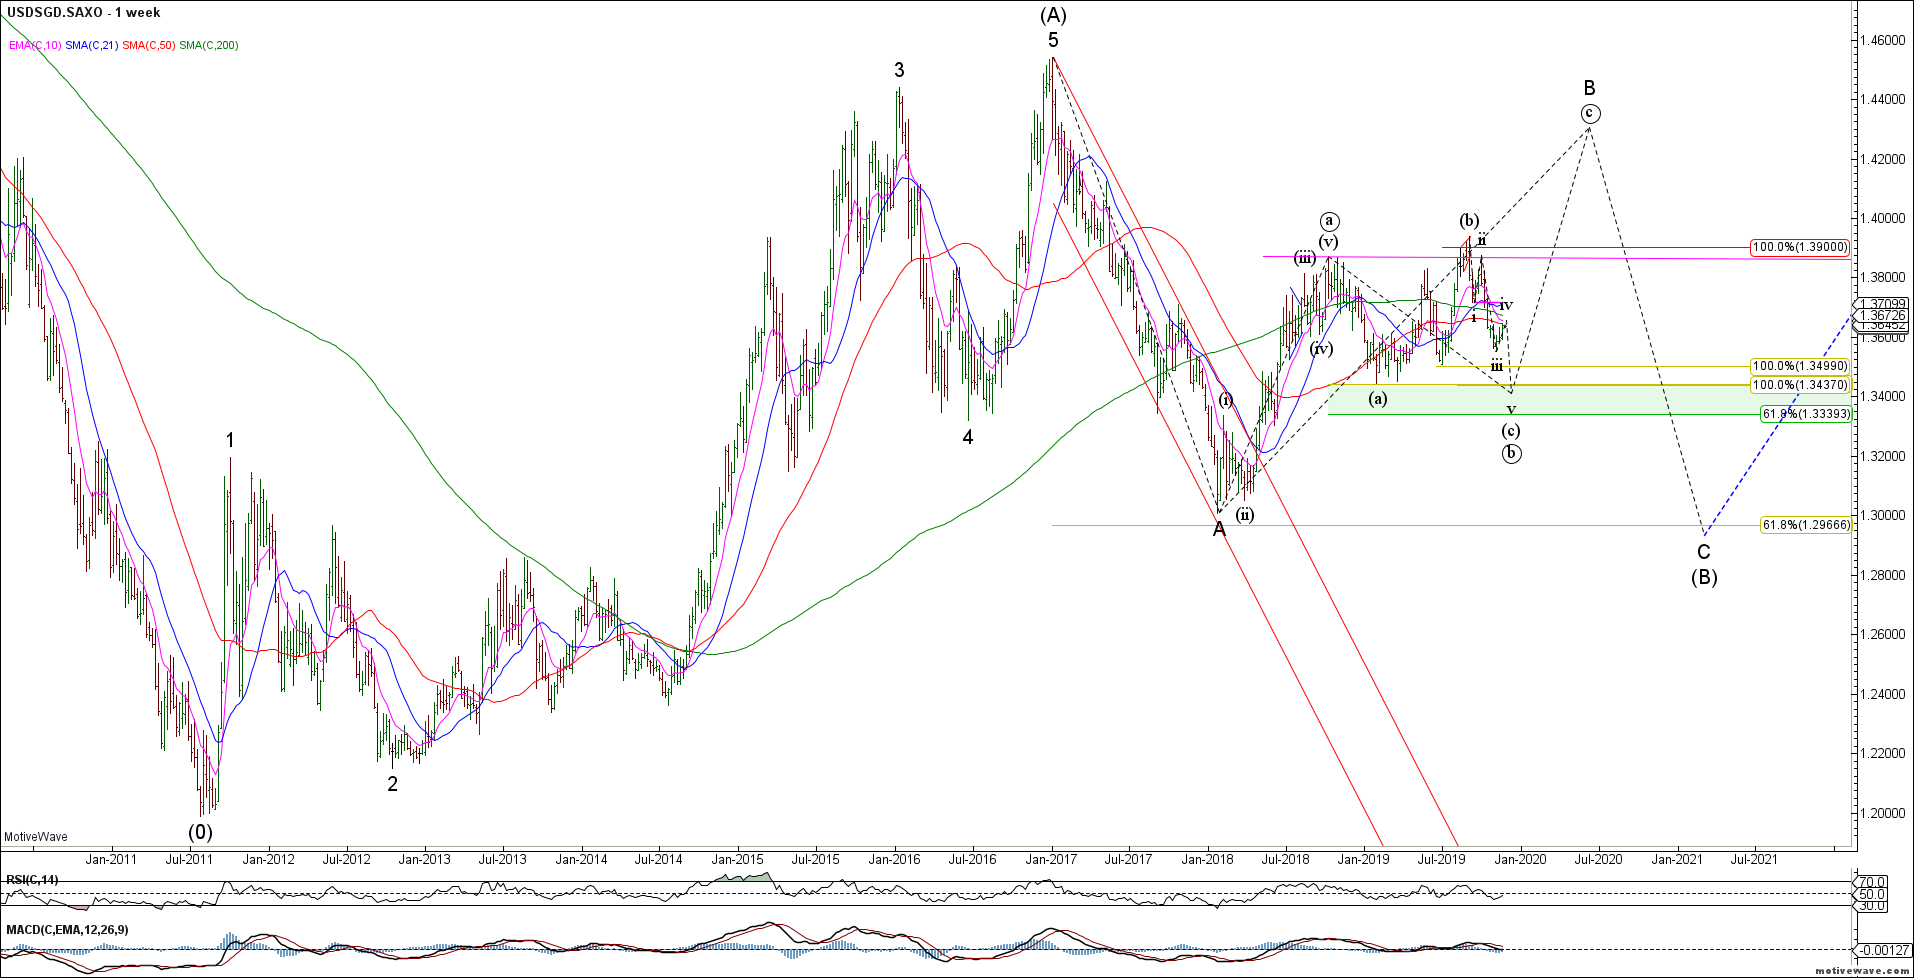
We continue to track the Singapore Dollar (USDSGD) as a proxy for the China trade deal. The structure would look best with another wave lower towards 1.34 to potentially set up a bullish trade.
USDSGD Weekly
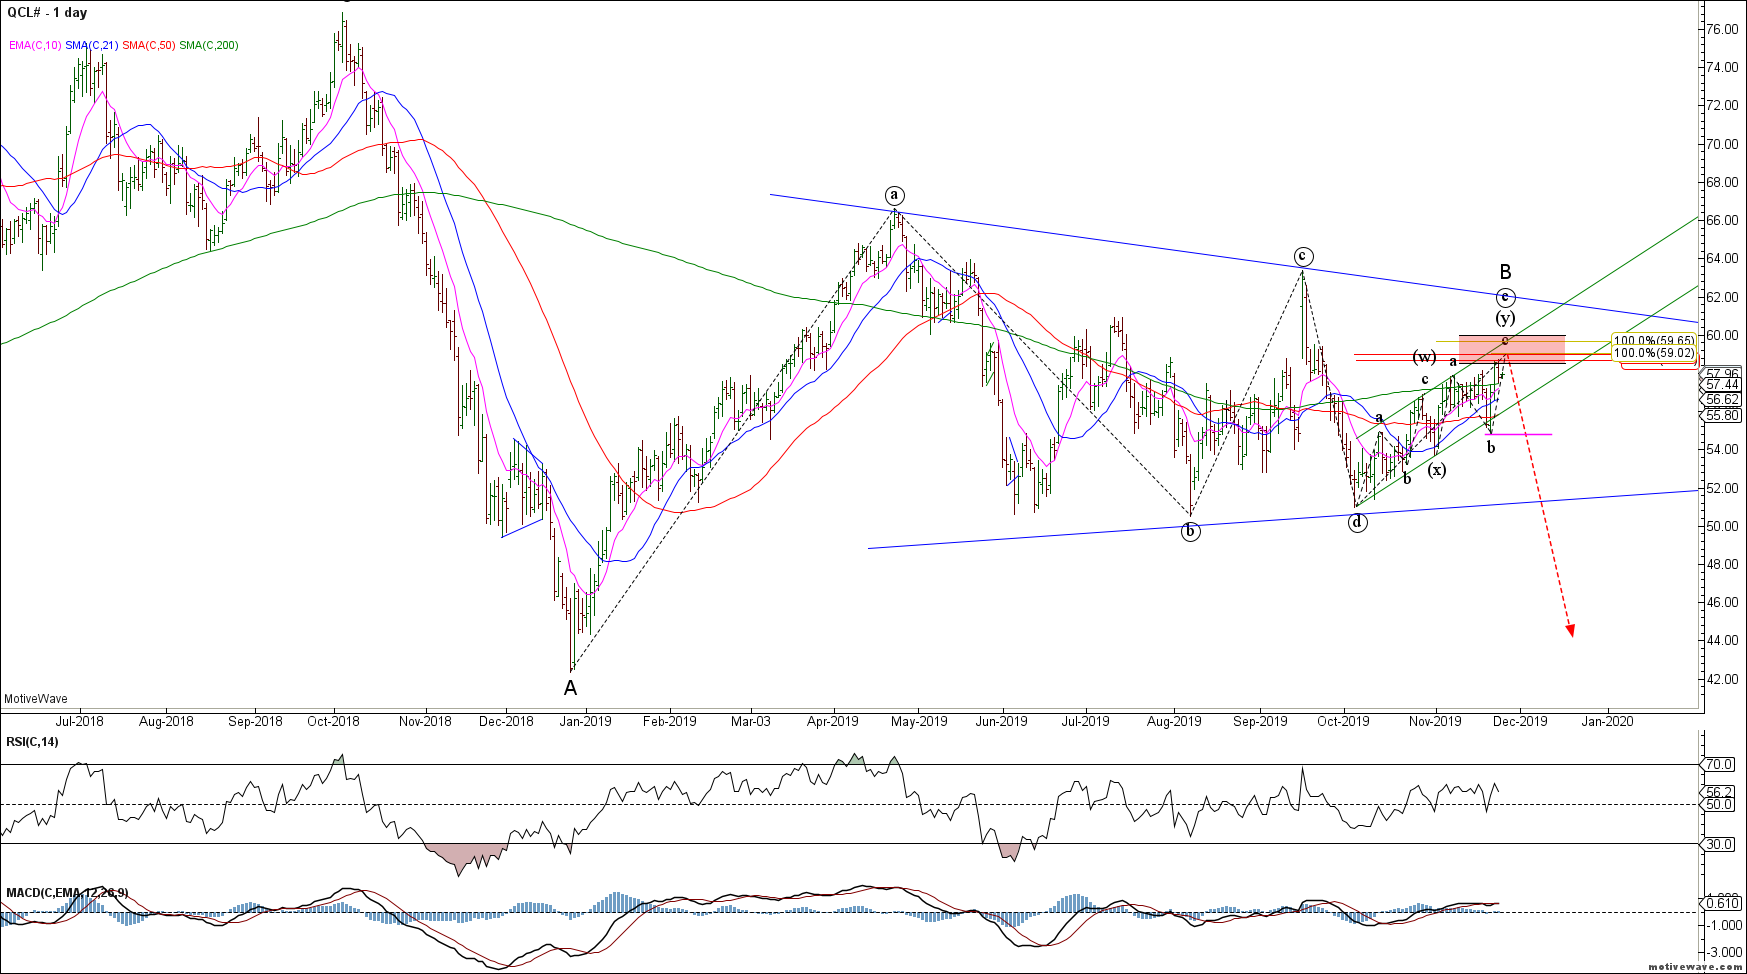
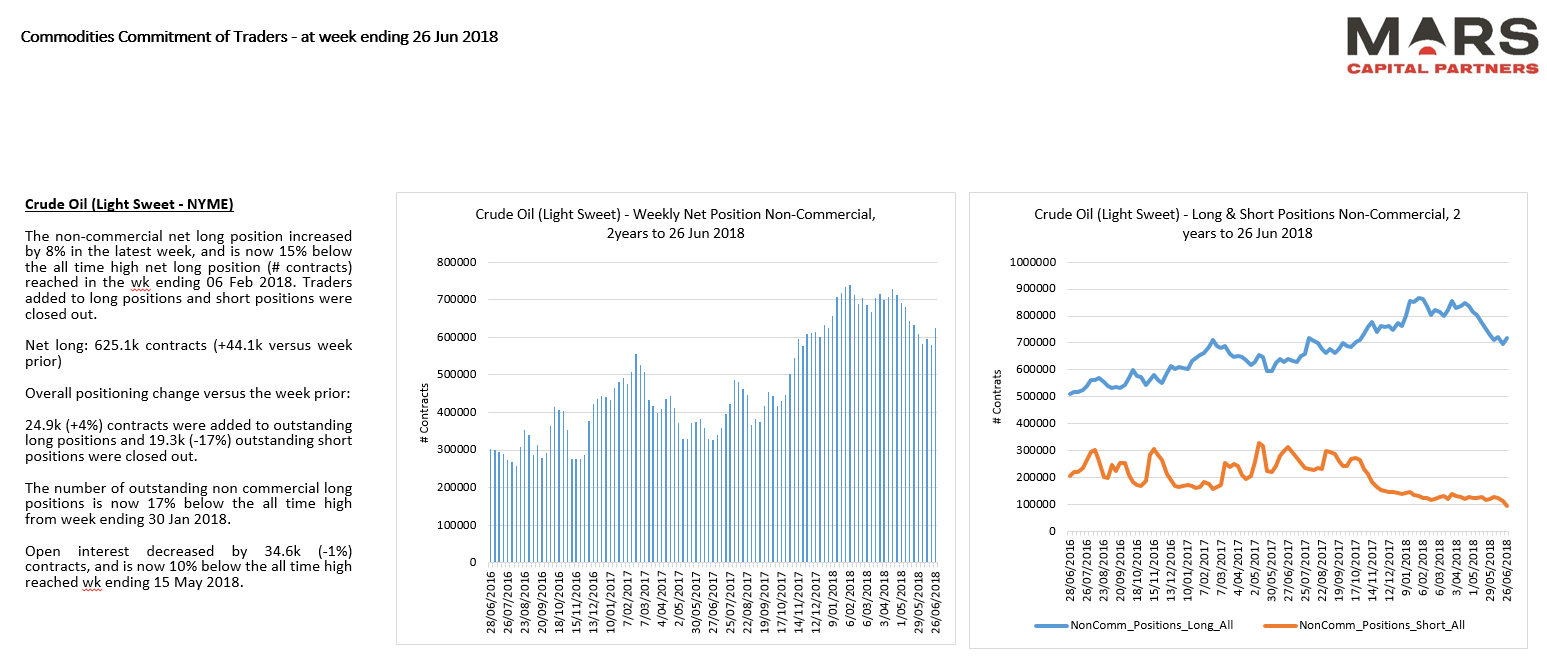
To the commodity markets and Crude Oil continues to rise correctively. Strong resistance remains in the 59-60 area as we look for evidence of a bearish reversal. Bears need to break the sequence of higher highs and higher lows with trade below last week’s low.
CL Daily
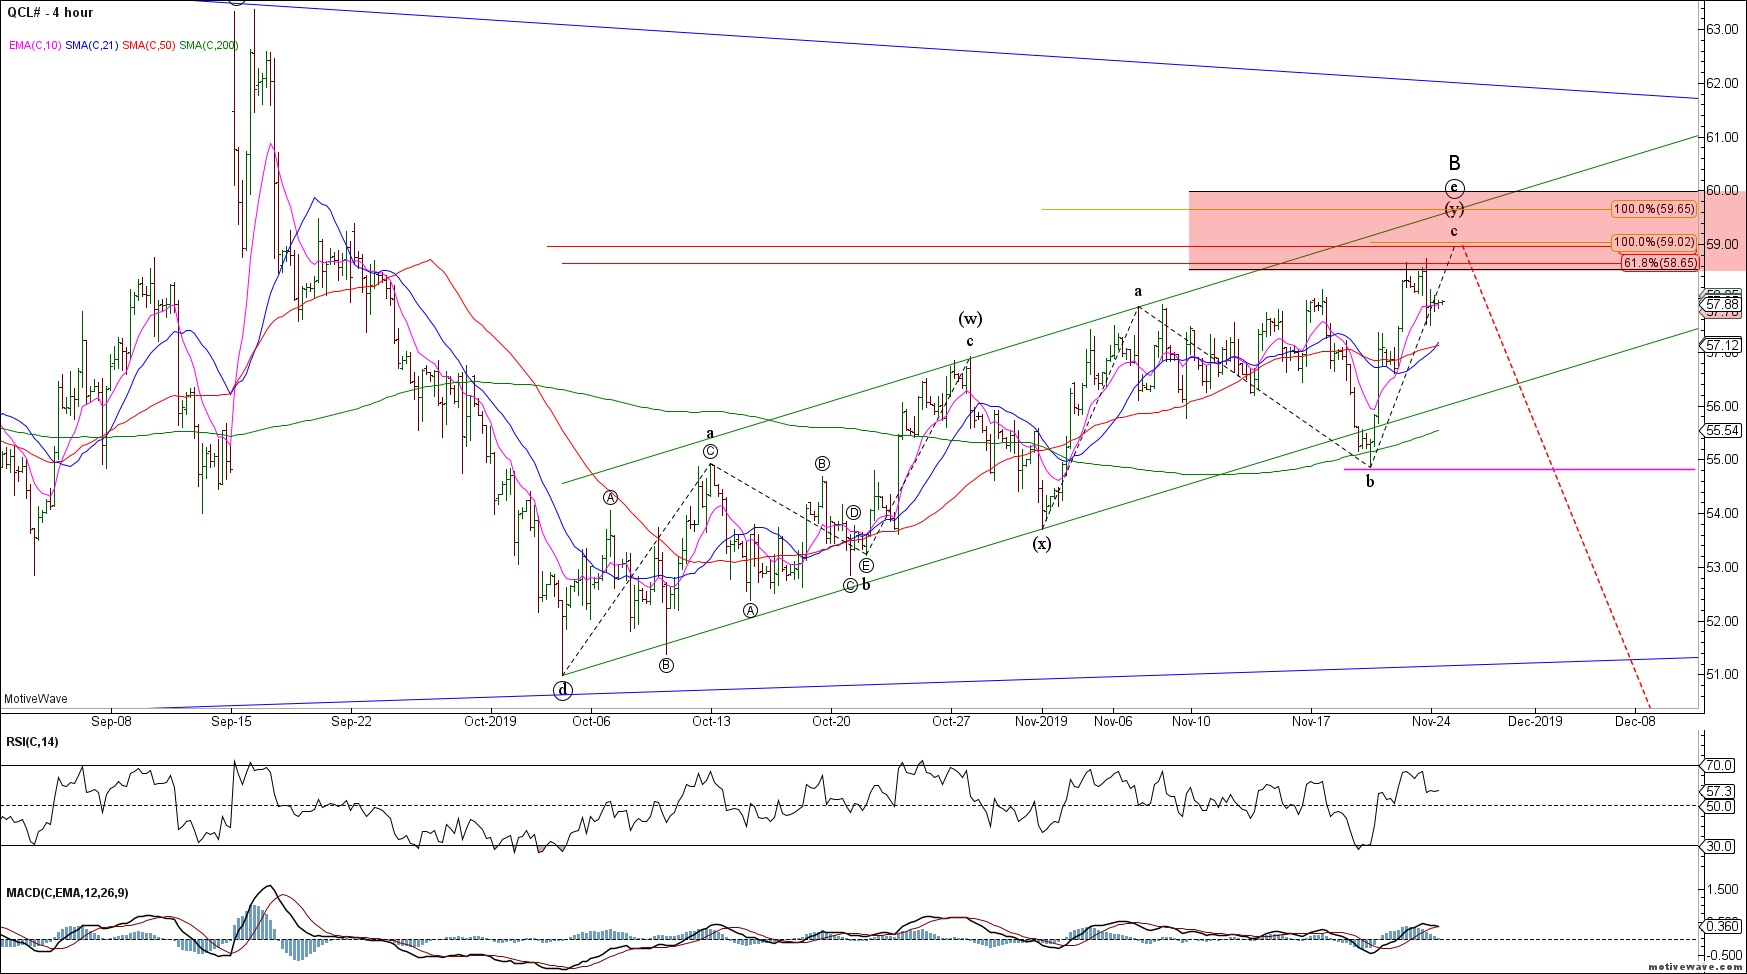
The near term CL count continues to look like a complex correction. No strong evidence yet of a bearish reversal.
CL H4
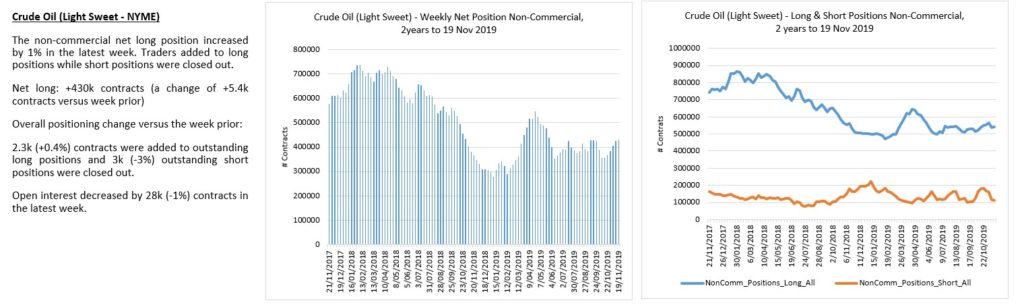
CL shorts squeezed.
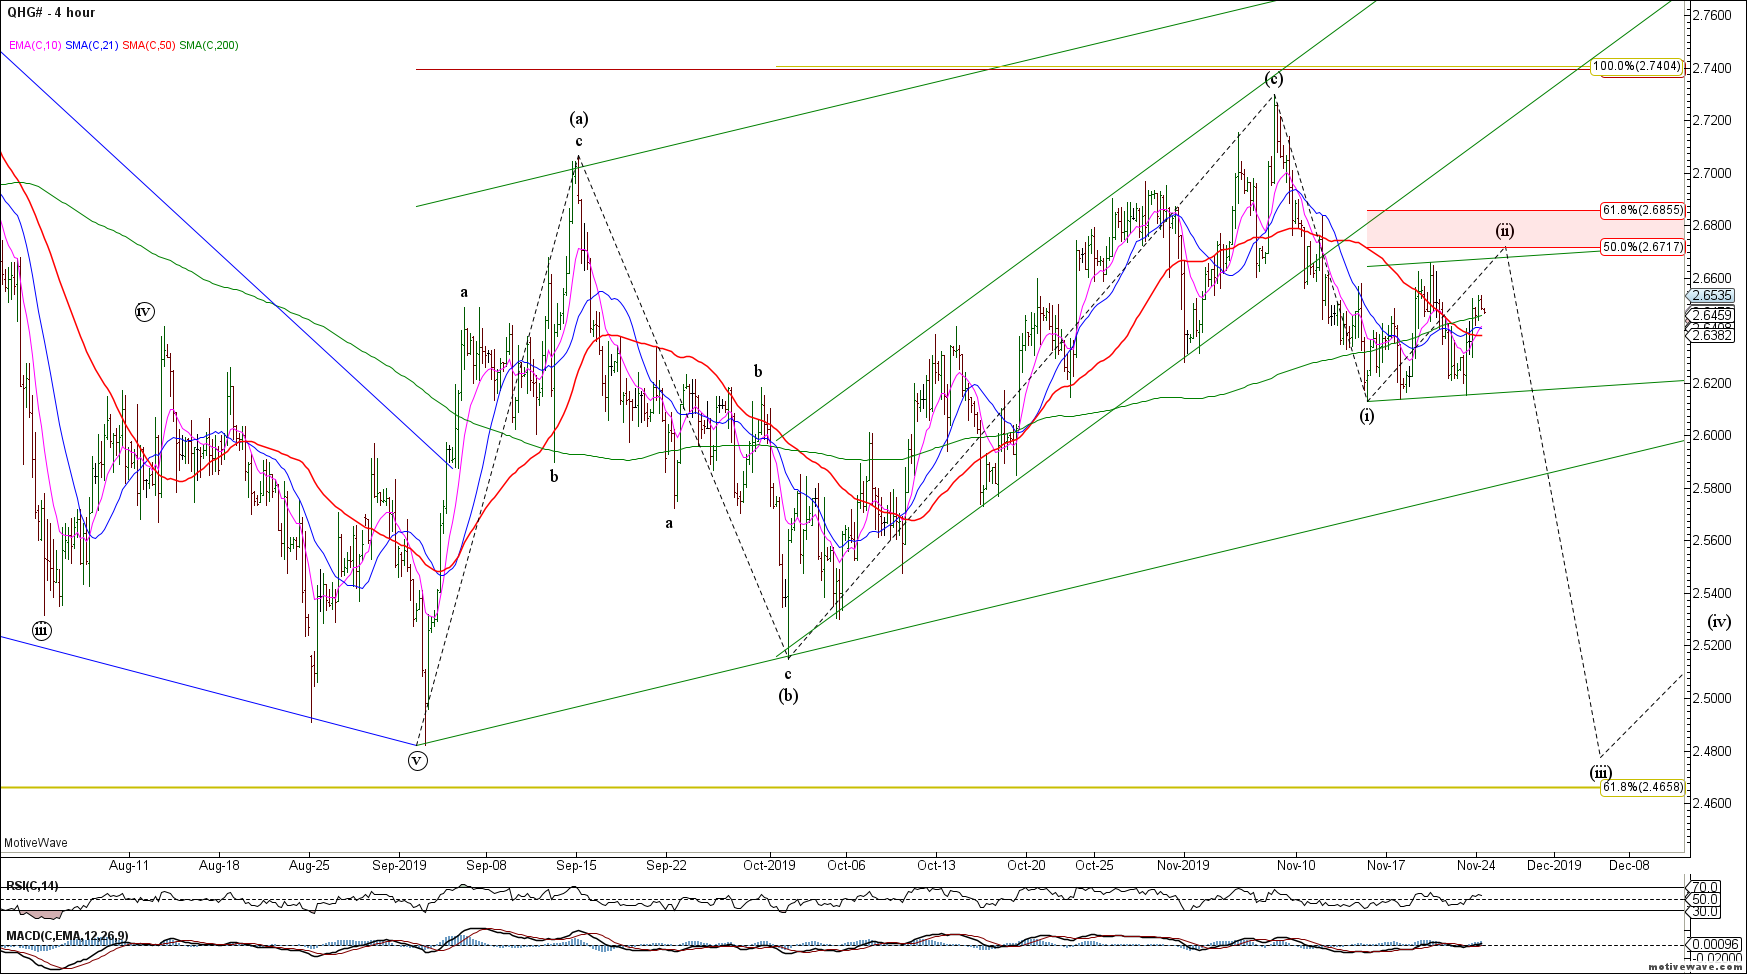
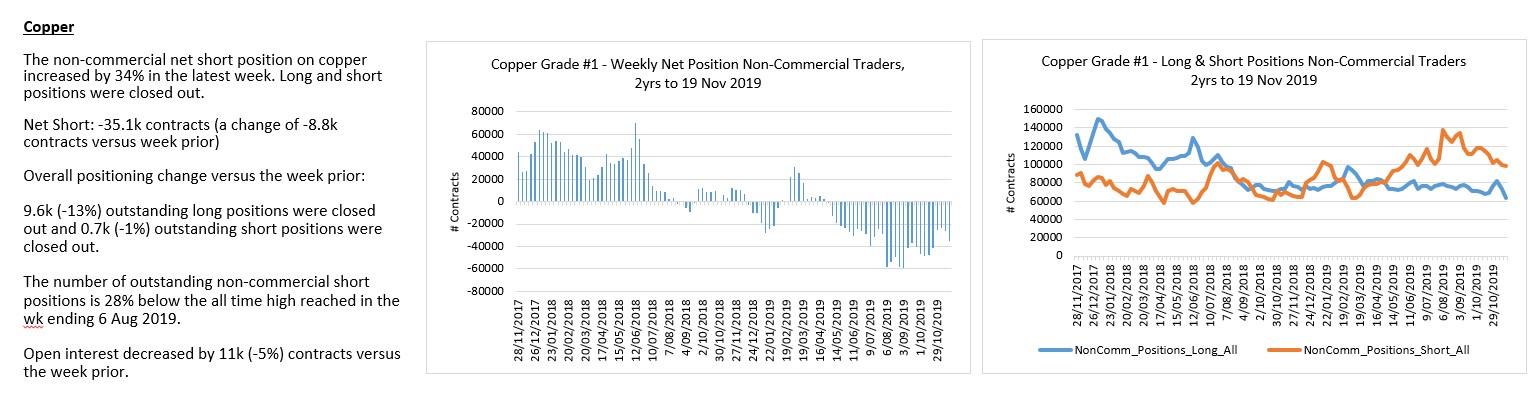
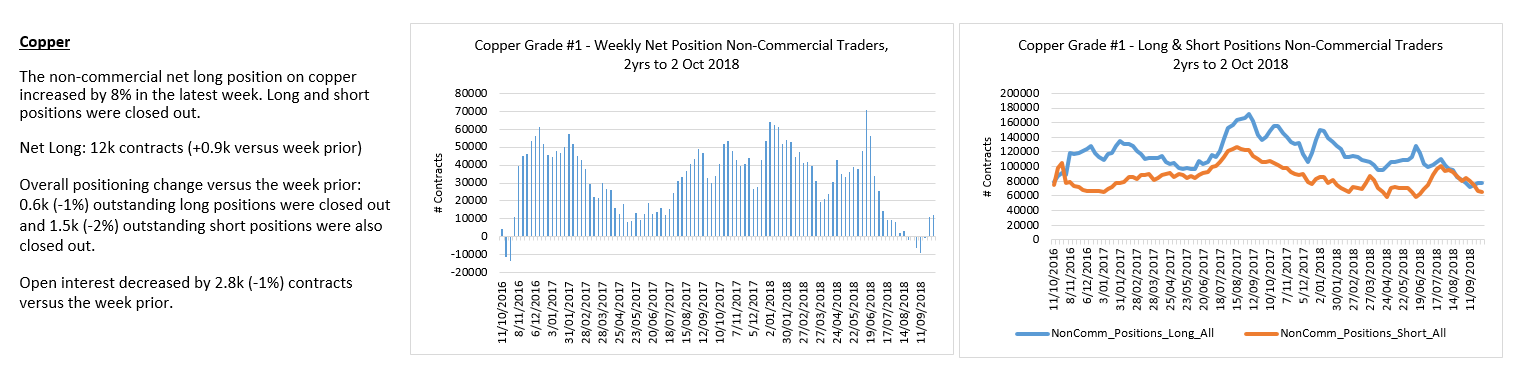
Dr Copper appears to be in a near term wave (ii) correction before the next impulse wave lower. We remain bearish.
HG H4
Copper traders closing shorts and longs.
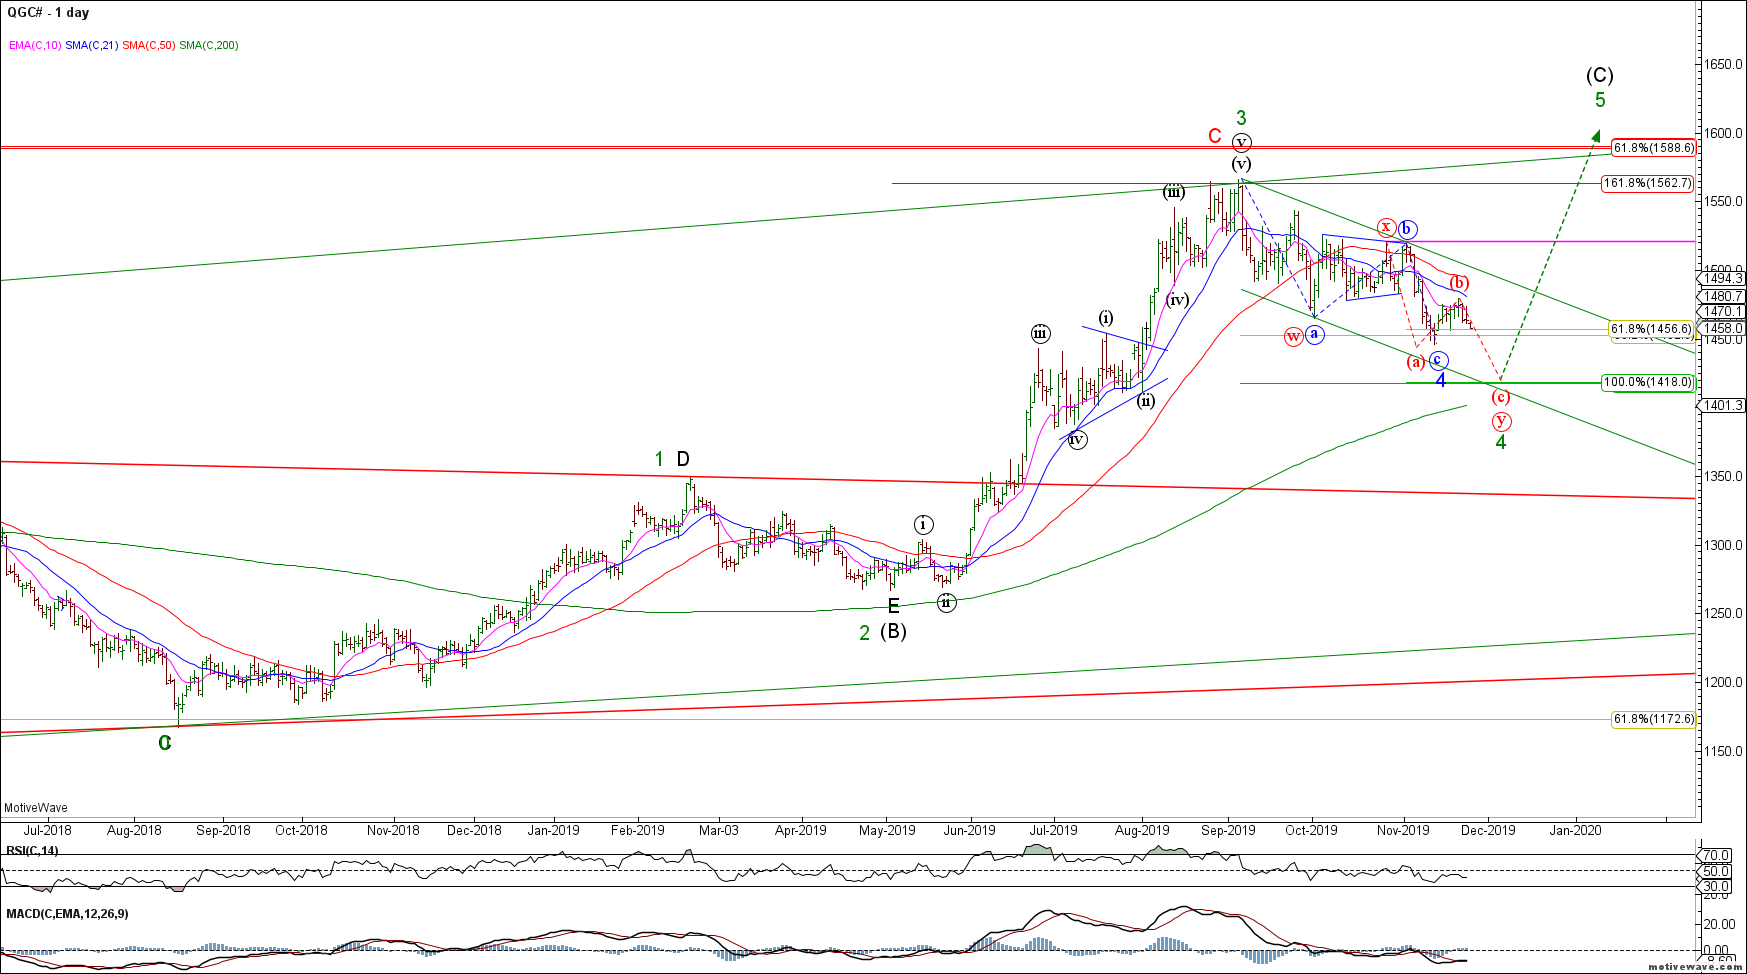
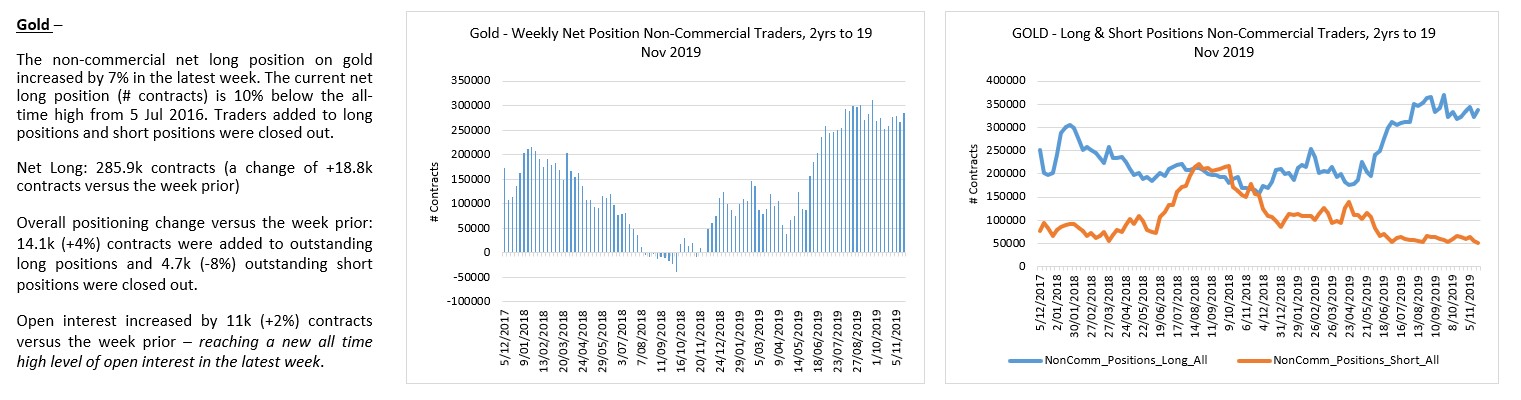
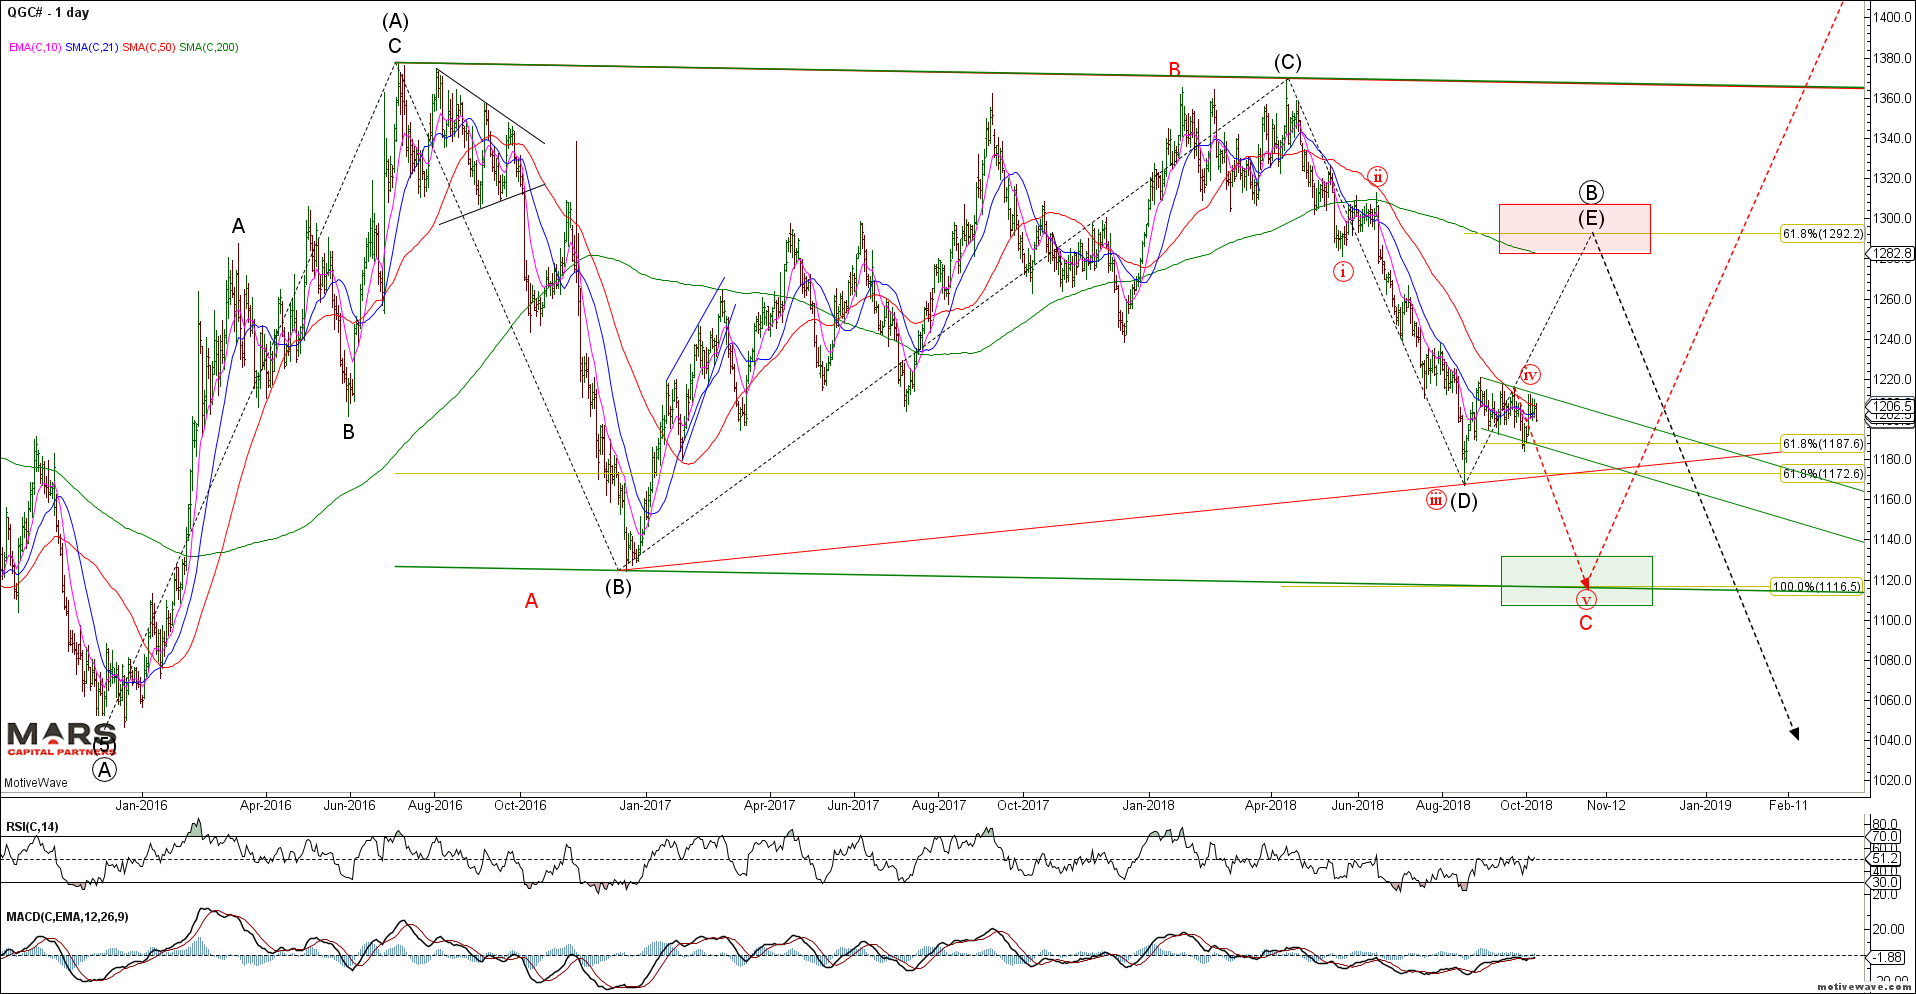
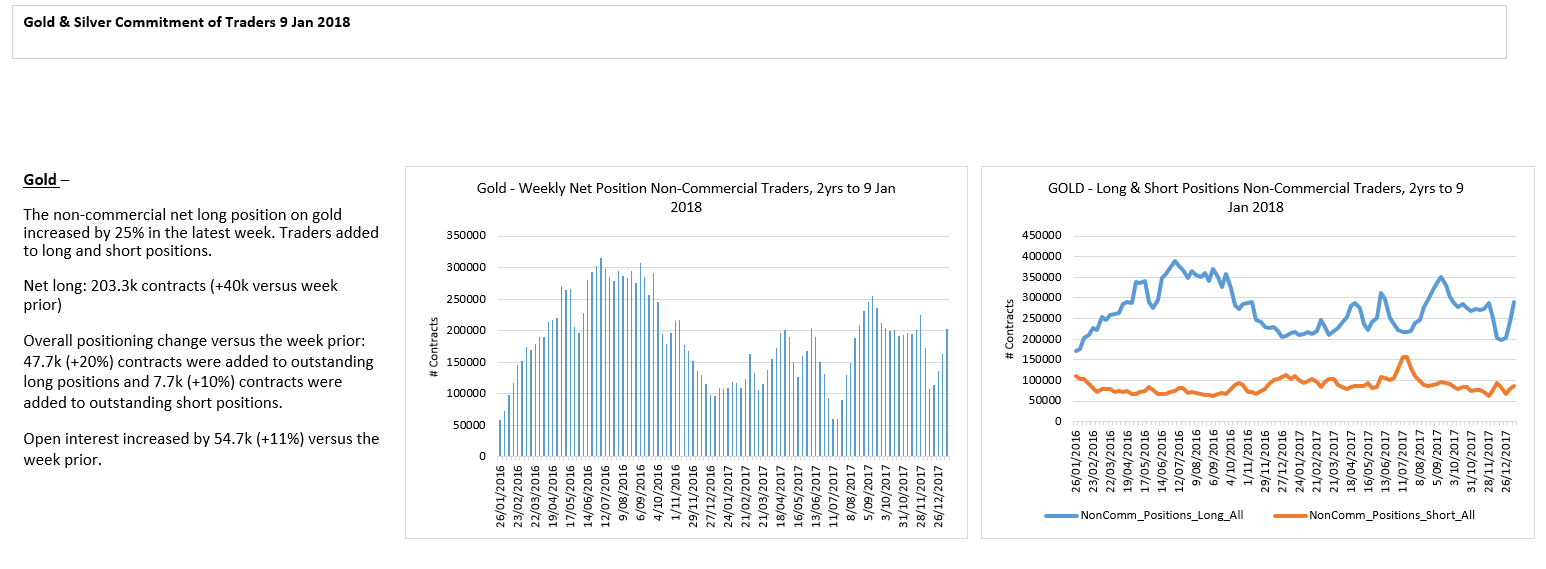
To the PM’s and the recent rally from swing lows appears corrective and likely to fail.Gold risks another wave lower towards 1418 (red count) to flush out more of the gold bugs.
Gold Daily
Gold traders remain too bullish for my liking – long side is crowded and risky.
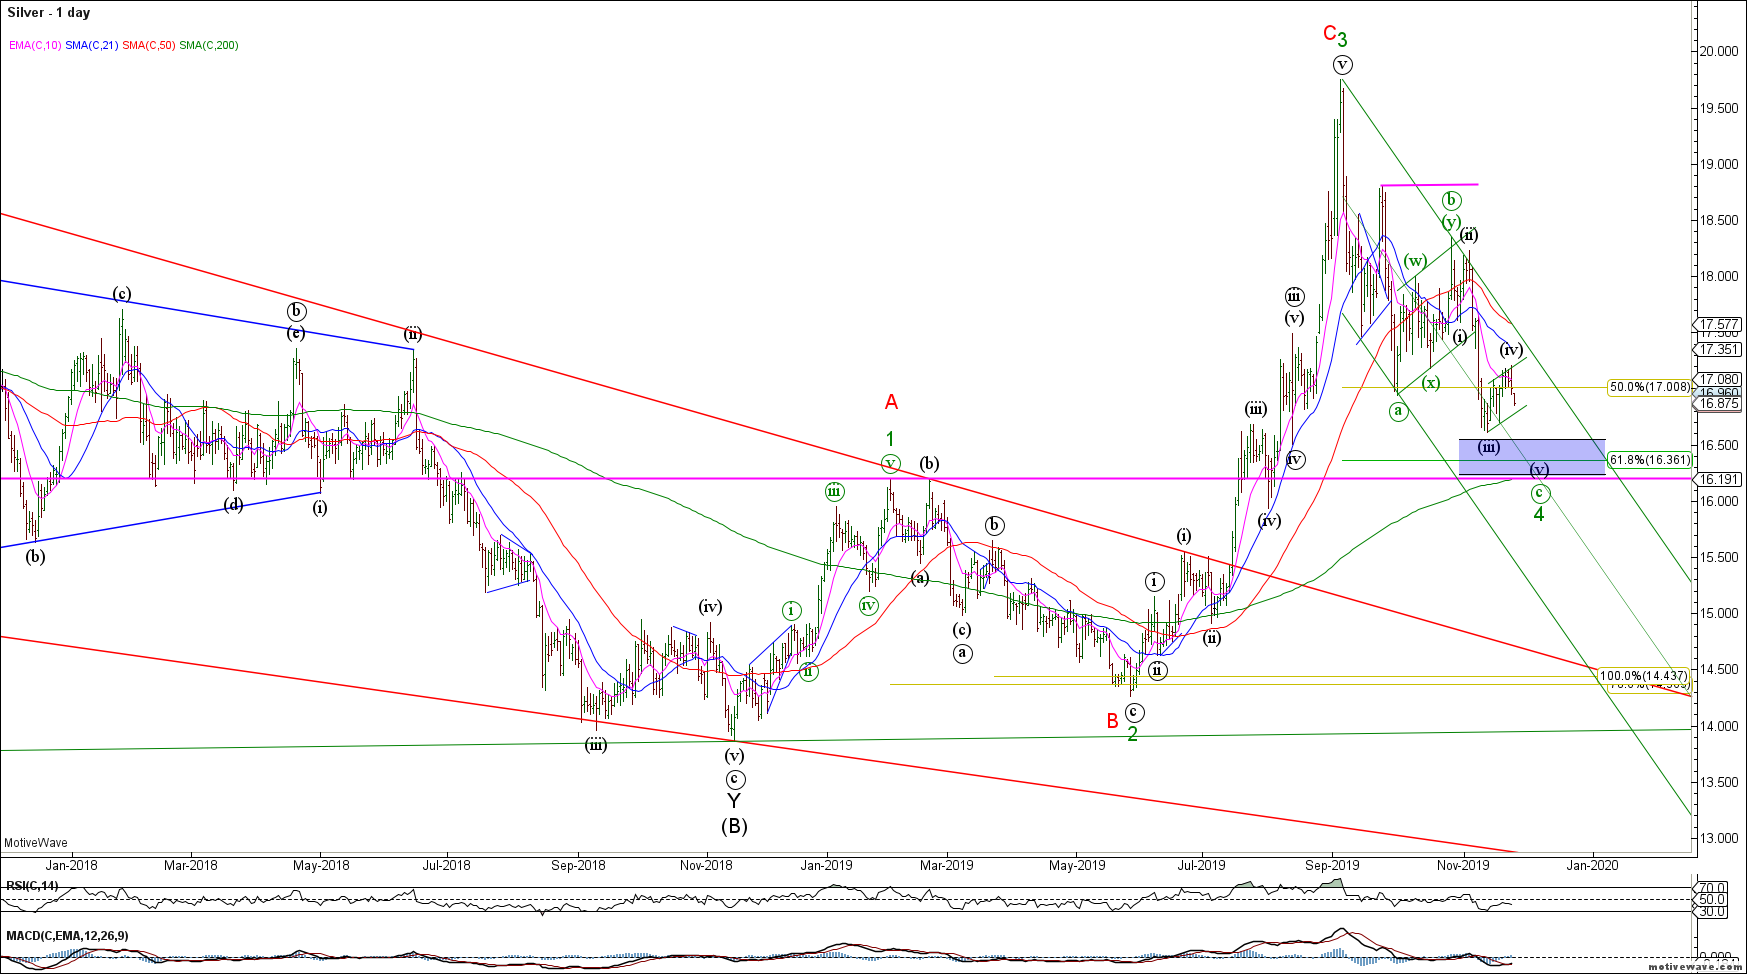
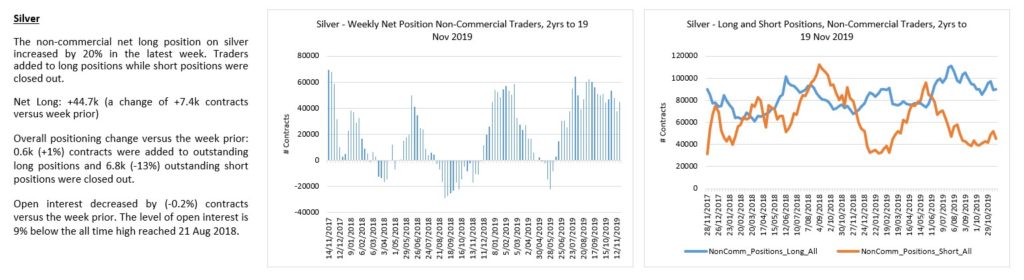
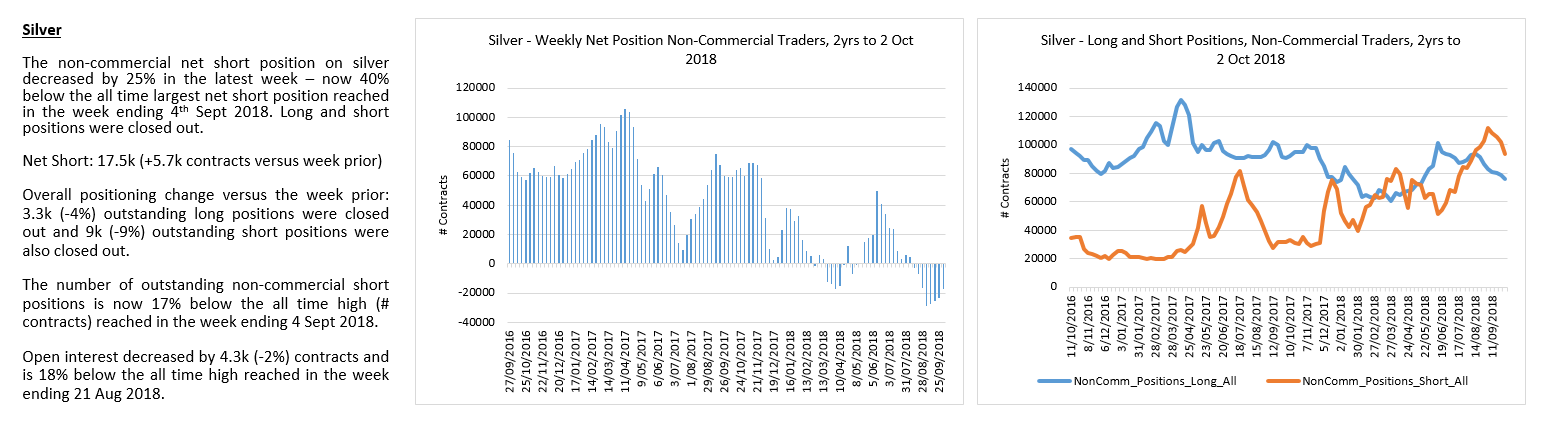
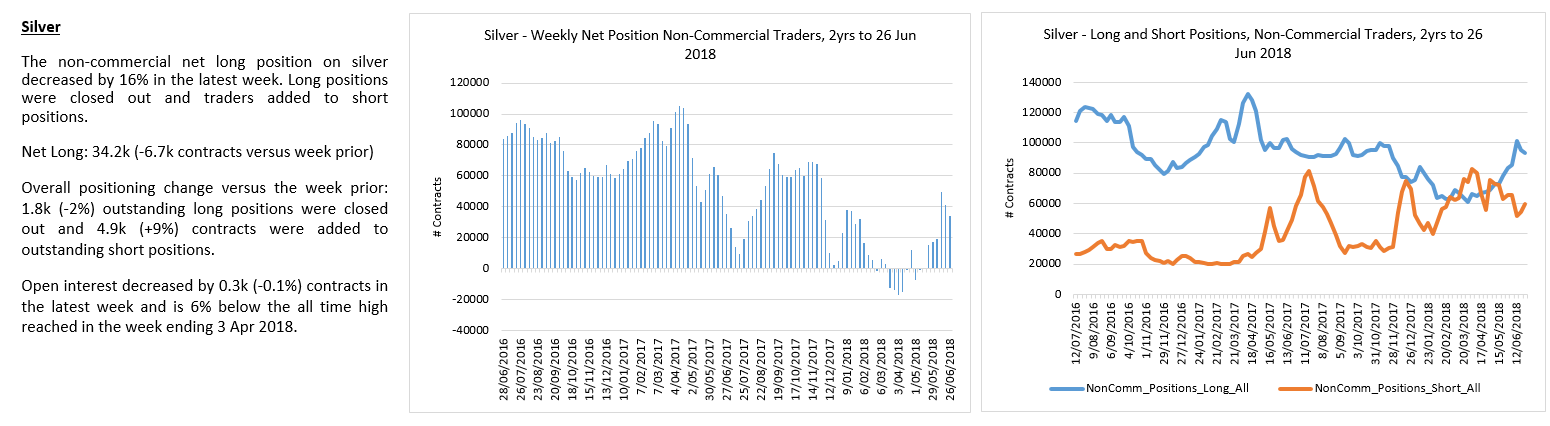
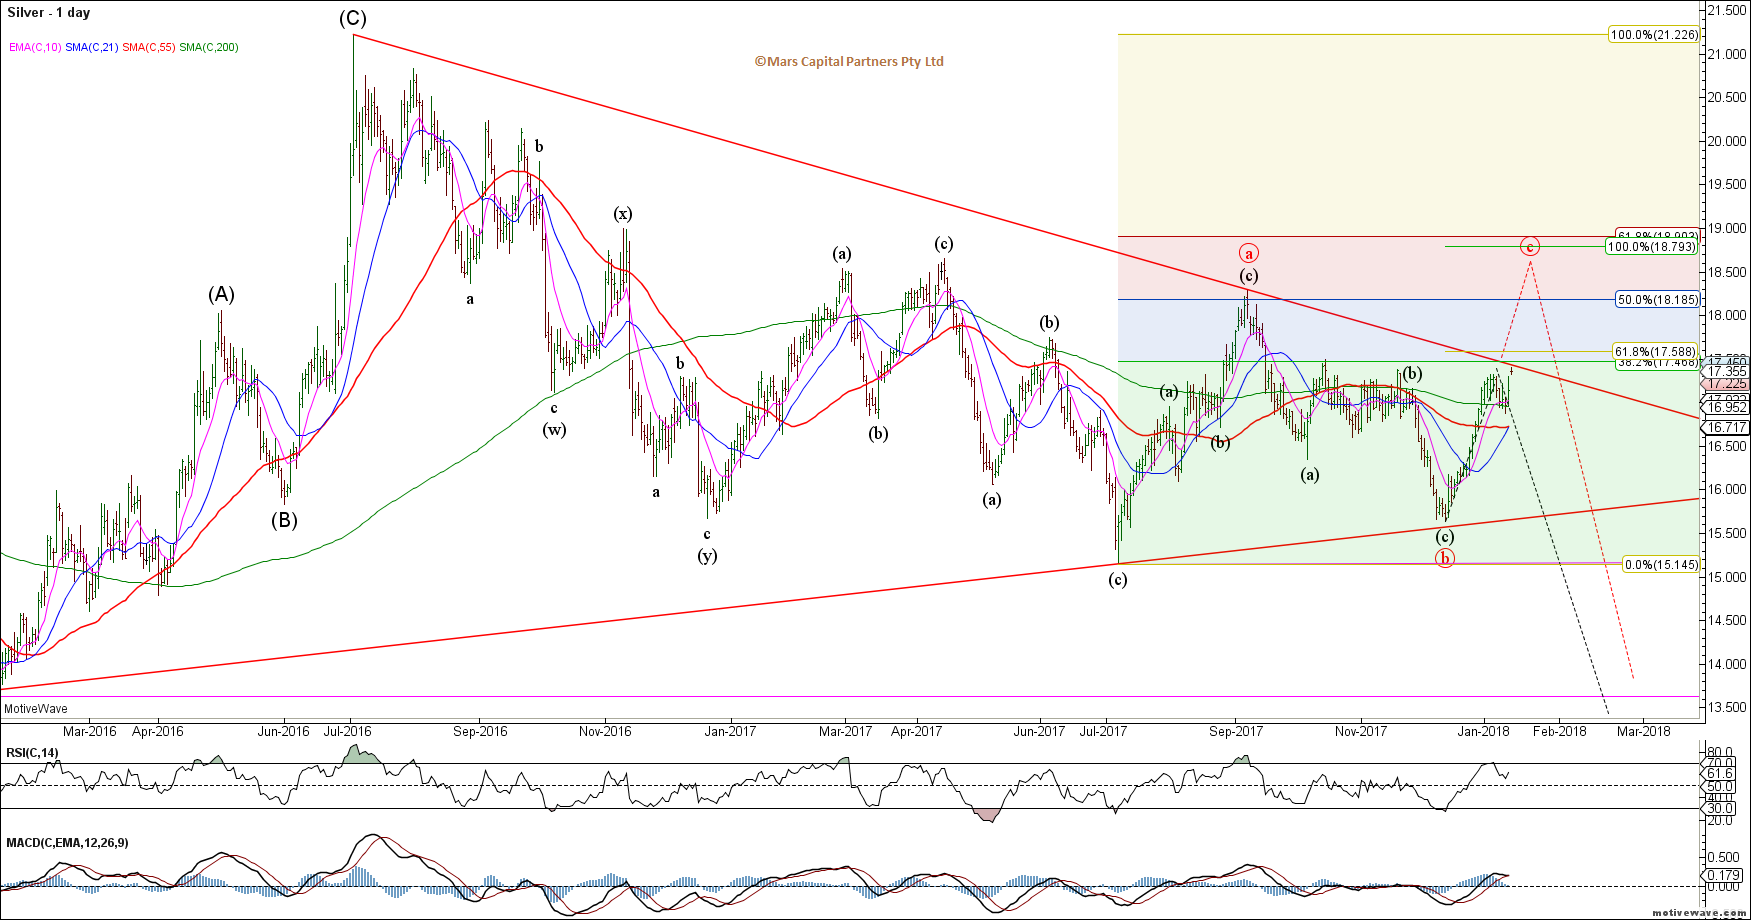
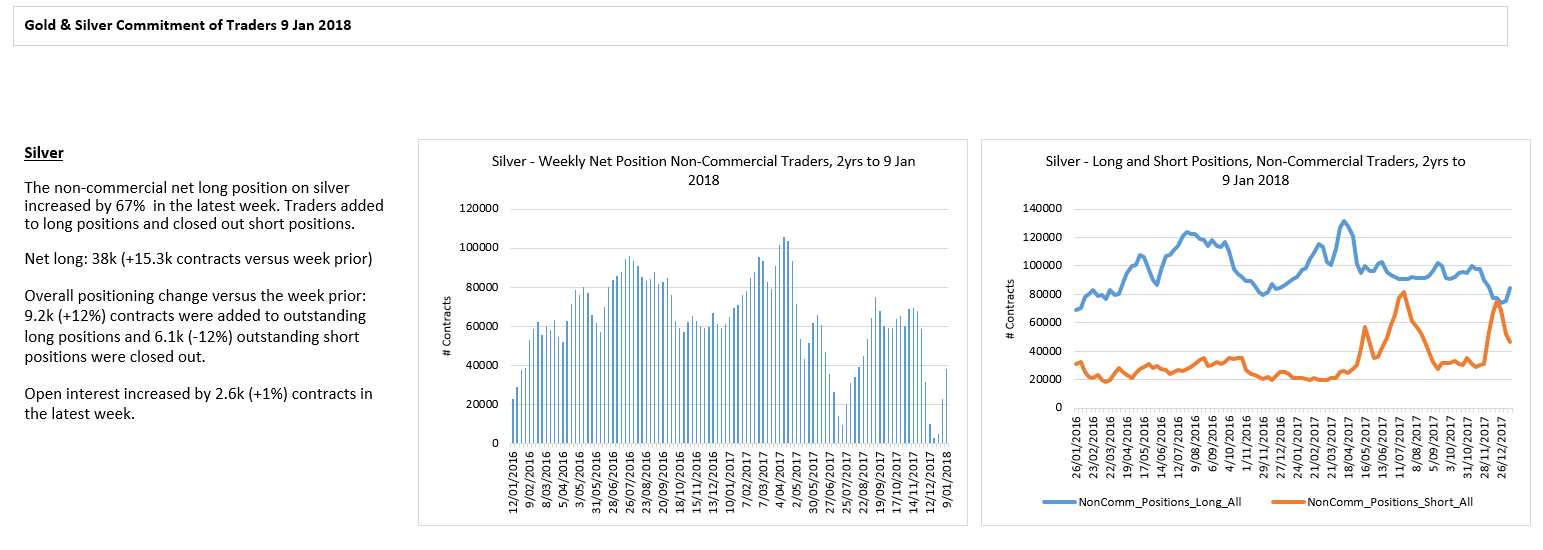
Silver continues to look bearish near term as we look for wave (v) of C lower towards the 16.30-50 area.
Silver Daily
Silver traders also too bullish here.
That’s all for now. Wishing all a happy Thanksgiving 🙂
In 2018, we were looking for a topping equity market, rising rates and strengthening US dollar as central banks reduced liquidity. Global fundamentals of debt, deflation and slowing growth will continue to provide headwinds throughout 2019.
The question is how long can the CB’s kick the can down the road? At what point do global markets call their bluff as market maker in chief? One thing is clear, central banks are manufacturing a world of increased societal acrimony through financial repression – how long can they continue to support the banking hegemony with disregard for societal inequality?
Key Macro Themes for 2019:
Global equity markets either topped in 2018 or are in the process of topping. We have a potentially complete 5 wave impulsive rally from the 2009 lows that terminated in September 2018. However, due to the corrective looking 3 wave pullback into major support, we cannot confirm with confidence that the bigger picture rally is over. We expect a year of increased volatility as investor hope and faith in central banks is tested by the headwinds of debt, deflation and slowing economic growth in a distorted market.
In summary, 2019 is likely to be a trader’s market with high volatility across macro asset classes. – we remain defensive equities and swing trading tactically; – bullish bonds in a deflationary environment; – bullish the US dollar (except against the Yen); – bearish the Swiss Franc; – bearish commodities; and – longer term bearish gold and silver
I’ll start with equities – namely the S&P. I’ll spend some detailing what I see as the key scenarios to watch. The Dow, Nasdaq and Russell are likely to follow similar patterns, so these scenarios will apply more broadly to equity markets.
Our long term outlook is that the entire post 2009 rally in equities will be fully retraced. While I am bearish the longer-term, at this time, a bull and a bear case both remain possible. Both cases and potential roadmaps are outlined below.
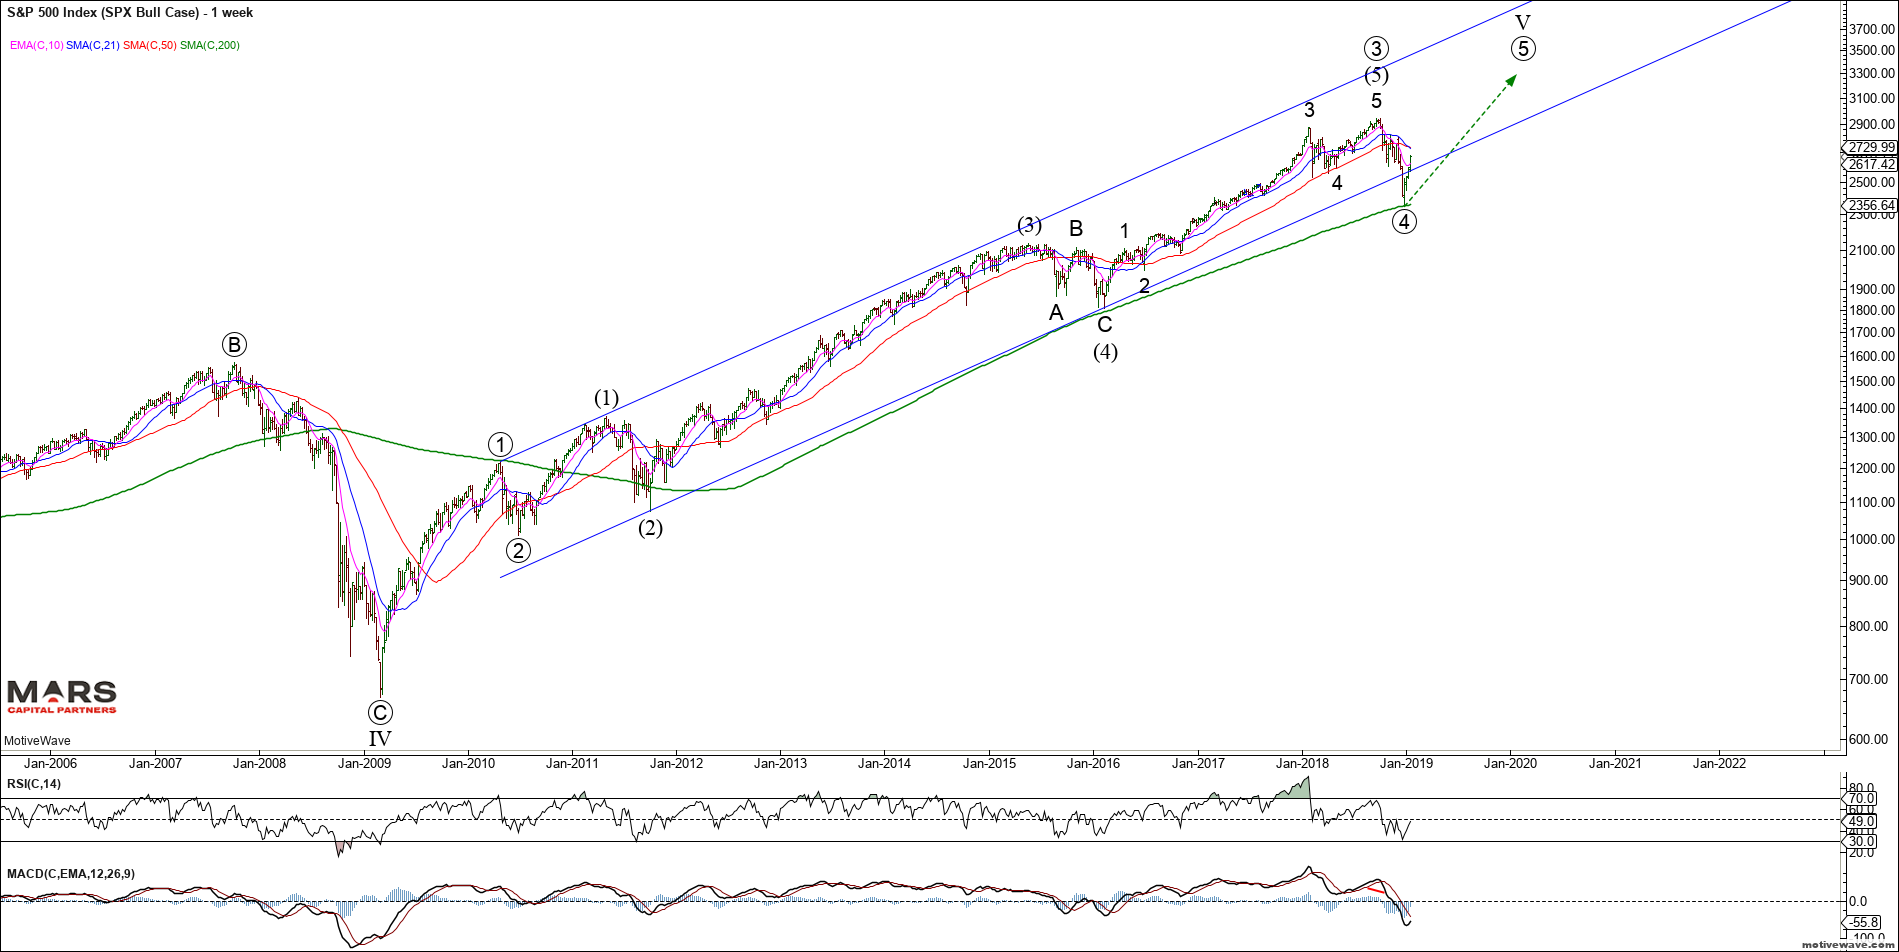
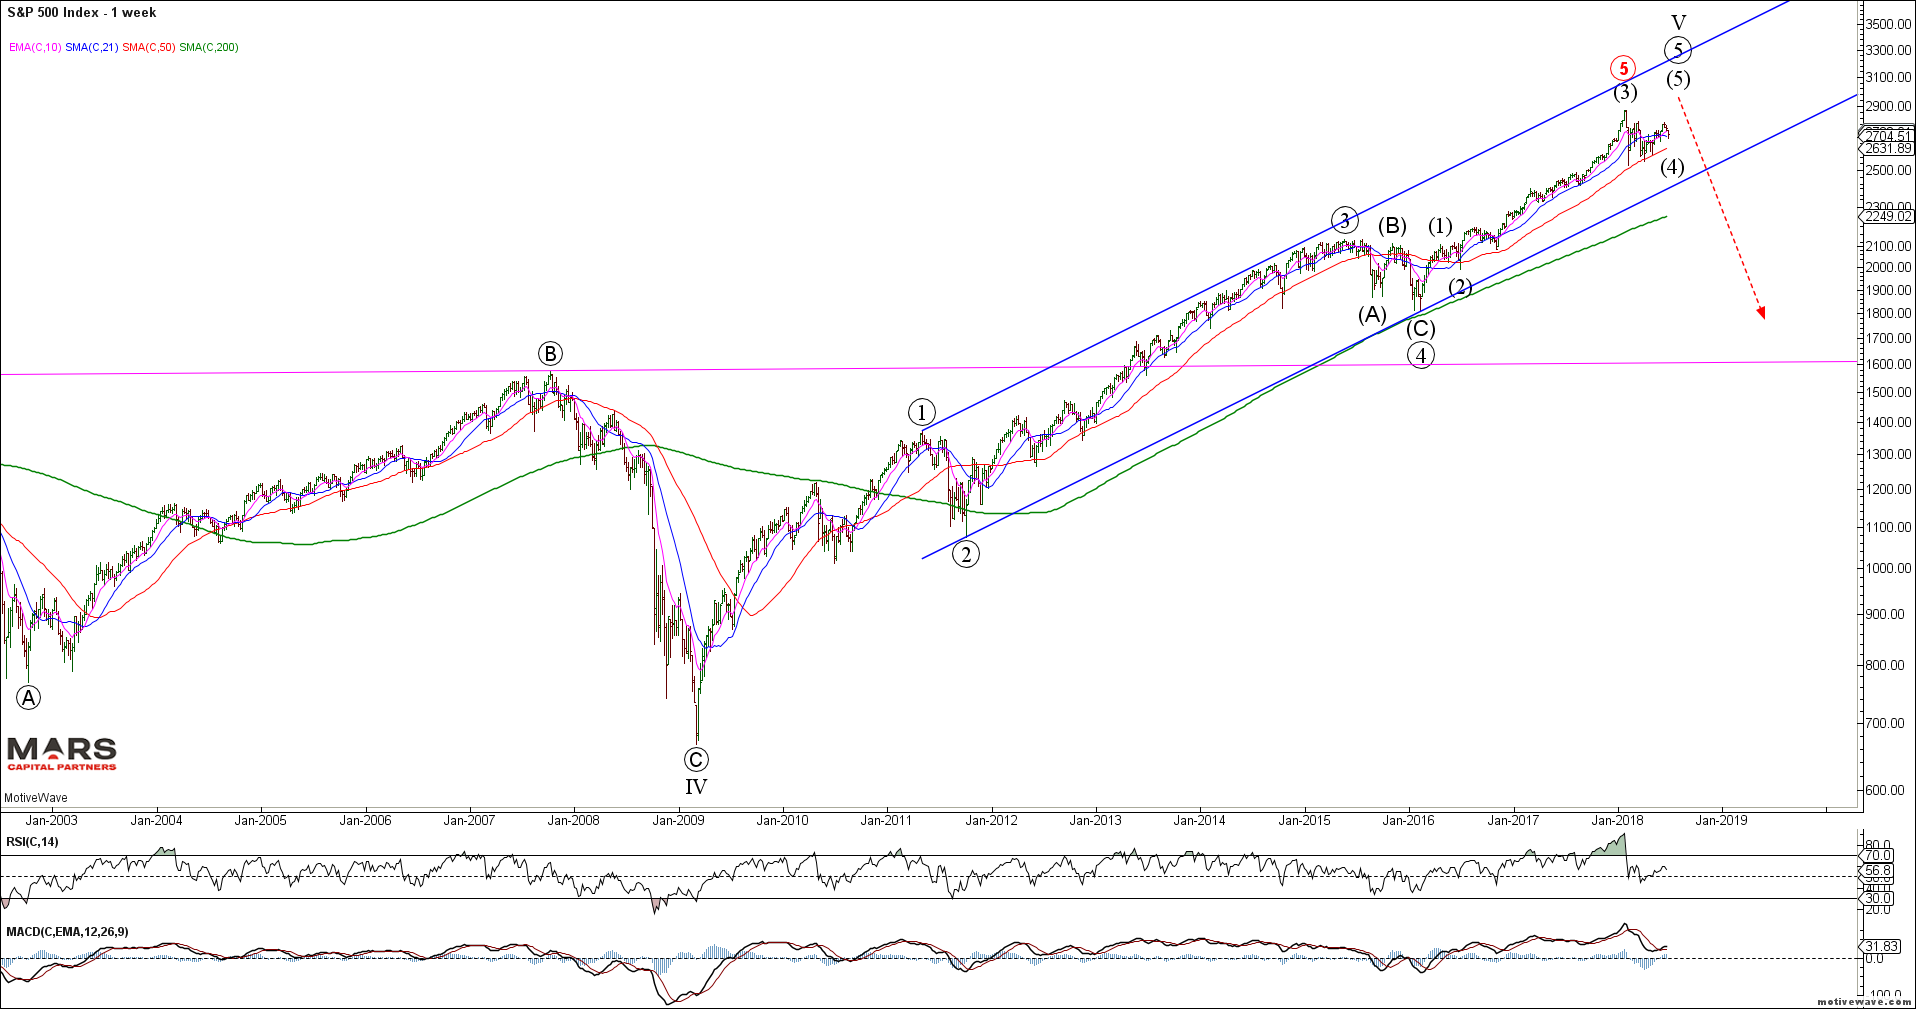
Firstly, the bull-case. This will likely be more of a traders’ market than an investors’ market with increasing volatility. Our benchmark SPX has a potentially completed 5 waves up from the 2009 lows. What we do NOT have is confirmation of a change in trend so the potential remains for new ATH’s as shown below. As previously stated, we need to see 5 waves down from the highs to confirm a change in trend to DOWN.
SPX Bull Case Weekly
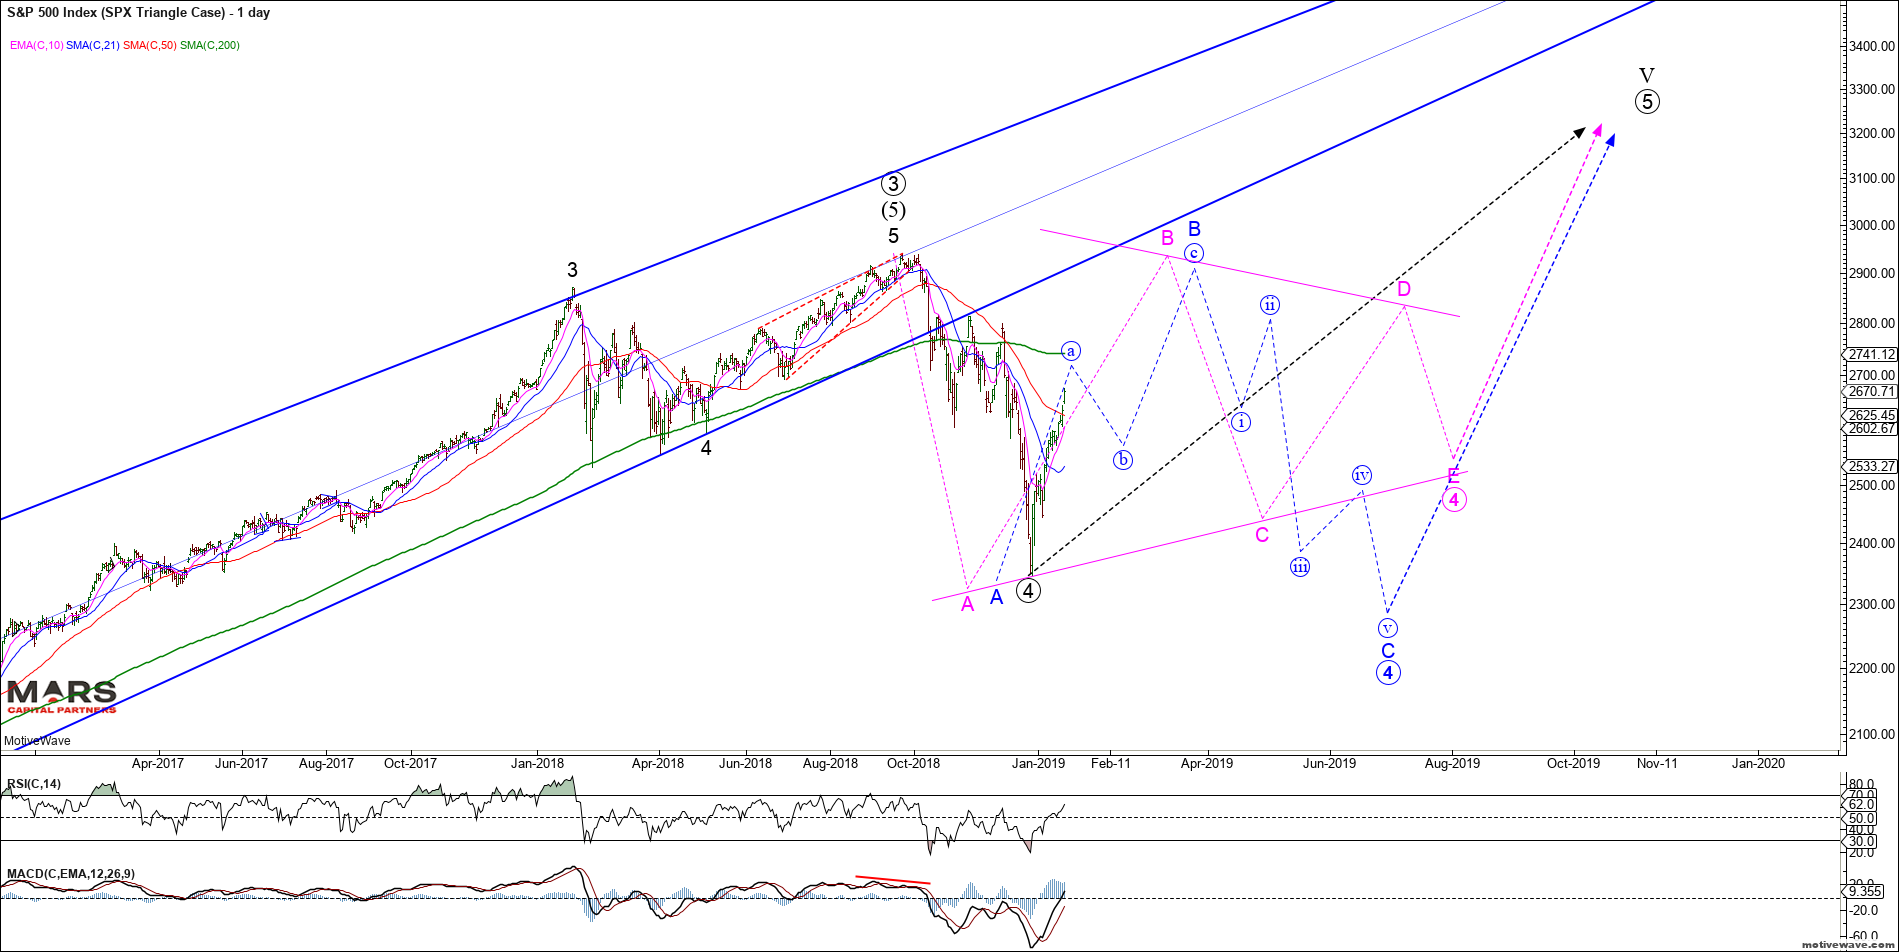
So far the SPX bull case has 3 waves down of equality into structural support and what appears to be an impulsive rally off the lows. This implies either a completed 3 wave corrective decline for ALL of wave 4 or “part” of a larger corrective decline in a bull market. So in the bull-case, there are three possible paths to new ATH’s. In Elliott Wave terms, a correction in 3 waves is either: – Black count: a completed zigzag correction for all of wave 4 and we push directly to new ATH’s in wave 5; or – Blue count: completed wave A of a 3-3-5 (A-B-C) corrective Flat where we are now in wave B to test the ATH’s; or – Pink count: completed wave A of a multi week / month 3-3-3-3-3 (a-B-C-D-E) triangle before a final thrust to new ATH’s in wave 5
SPX Bullish Options Daily
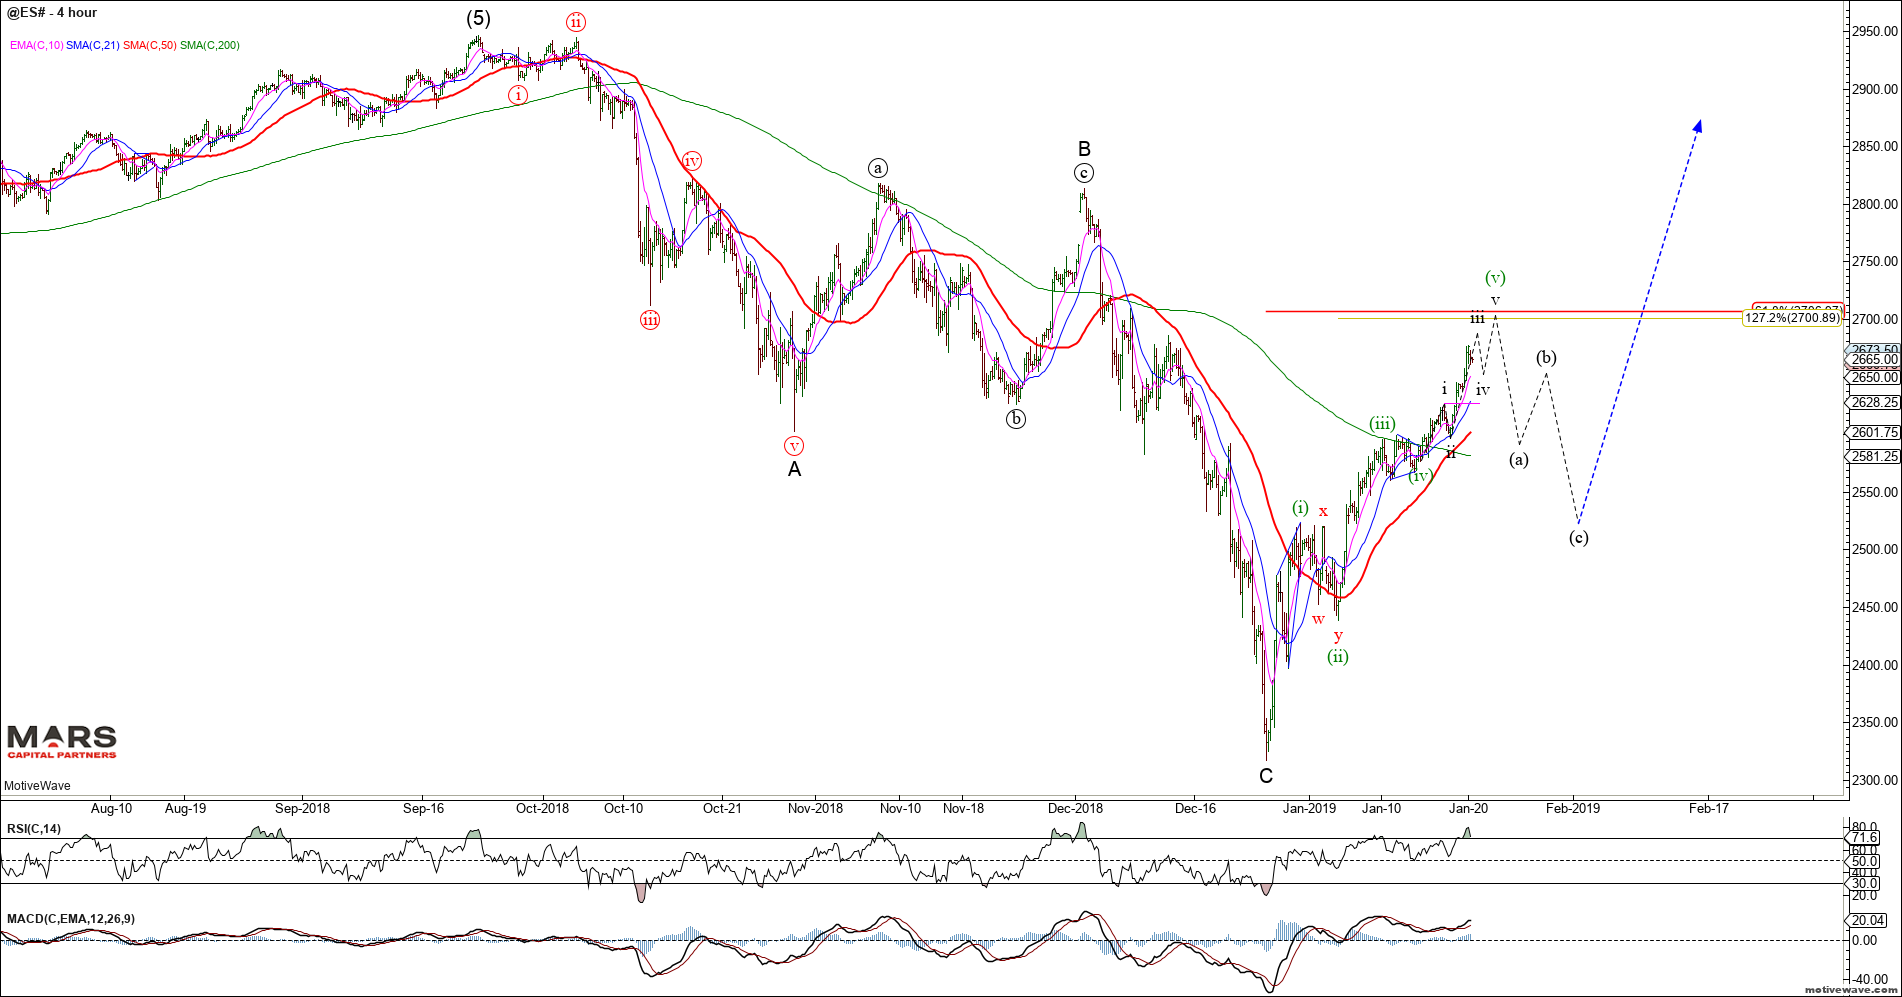
From a near term perspective, the ES appears to be in an extended 5th wave after breaking above our 2645 resistance last week with targets in the 2700-10 area. Once this impulse wave completes for wave 1 / A, we should expect a corrective 3 wave decline prior to the next move higher to retest ATH’s. We are not chasing this rally but rather looking for a turn, the nature of which (impulsive or corrective) will setup our next swing.
ES H4
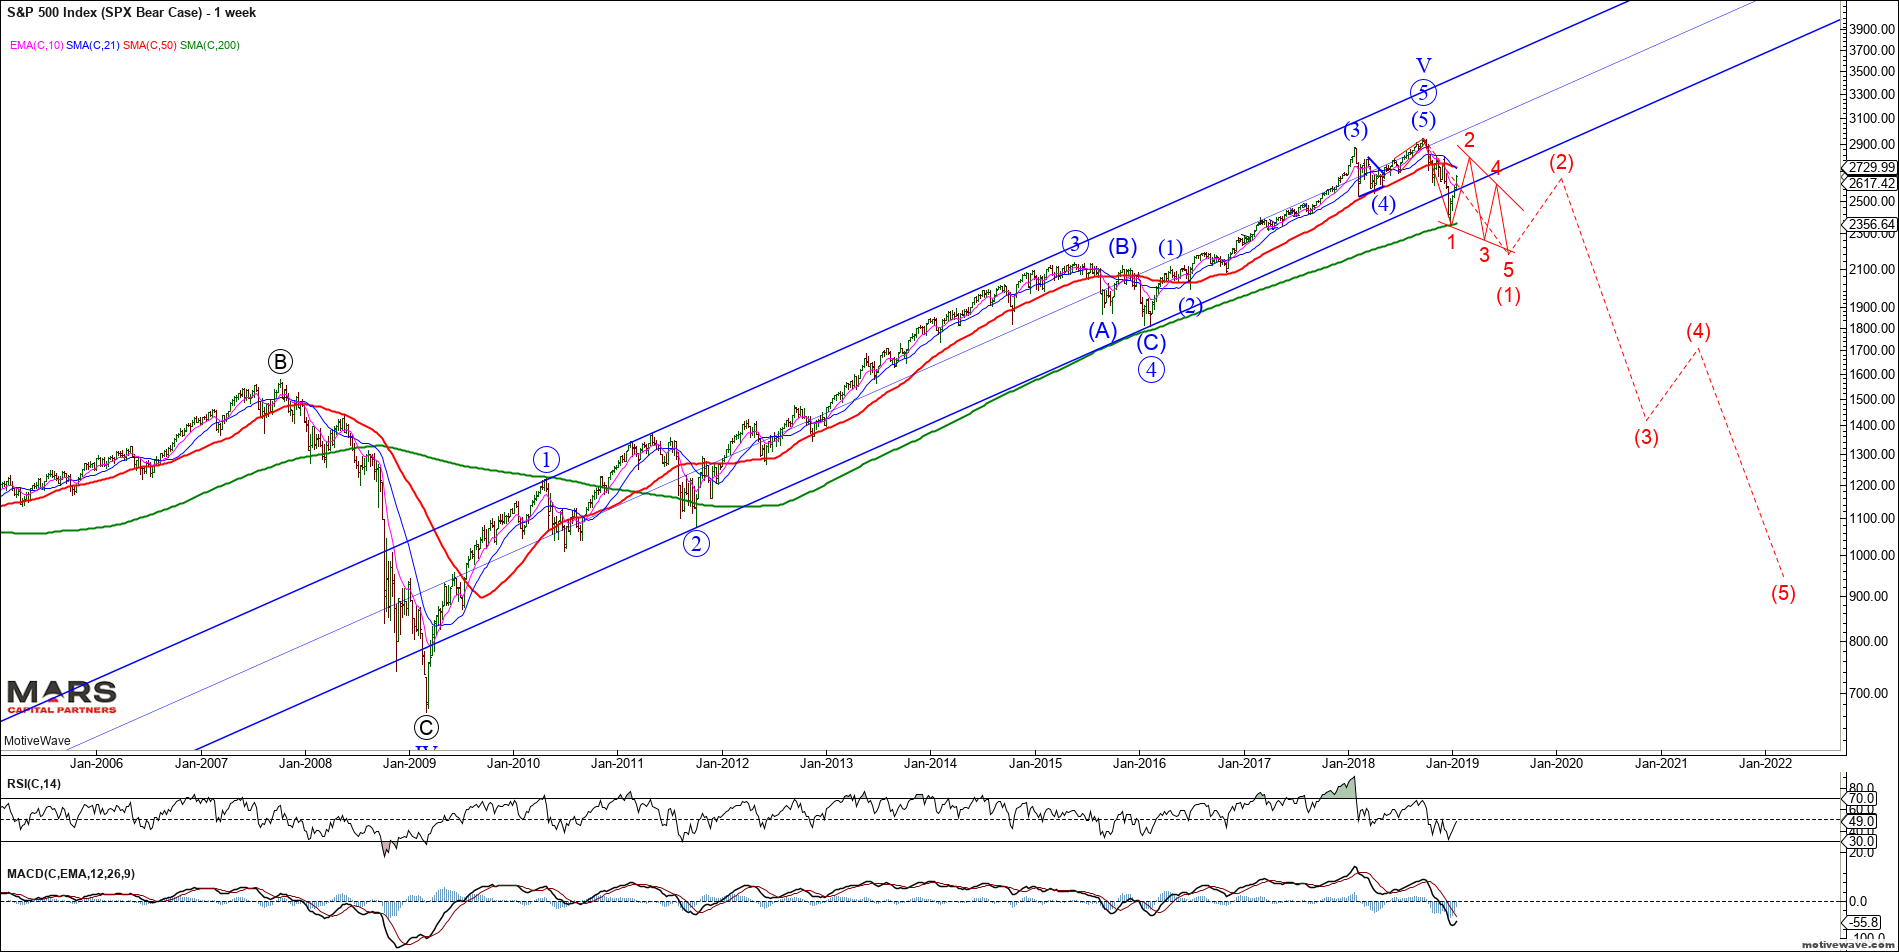
The SPX Bear Case assumes that the 5 wave rally from the 2009 lows is complete and we have begun a bear market. There is little evidence to support this structure unless markets trade back below the December lows.
SPX Bear Case Weekly
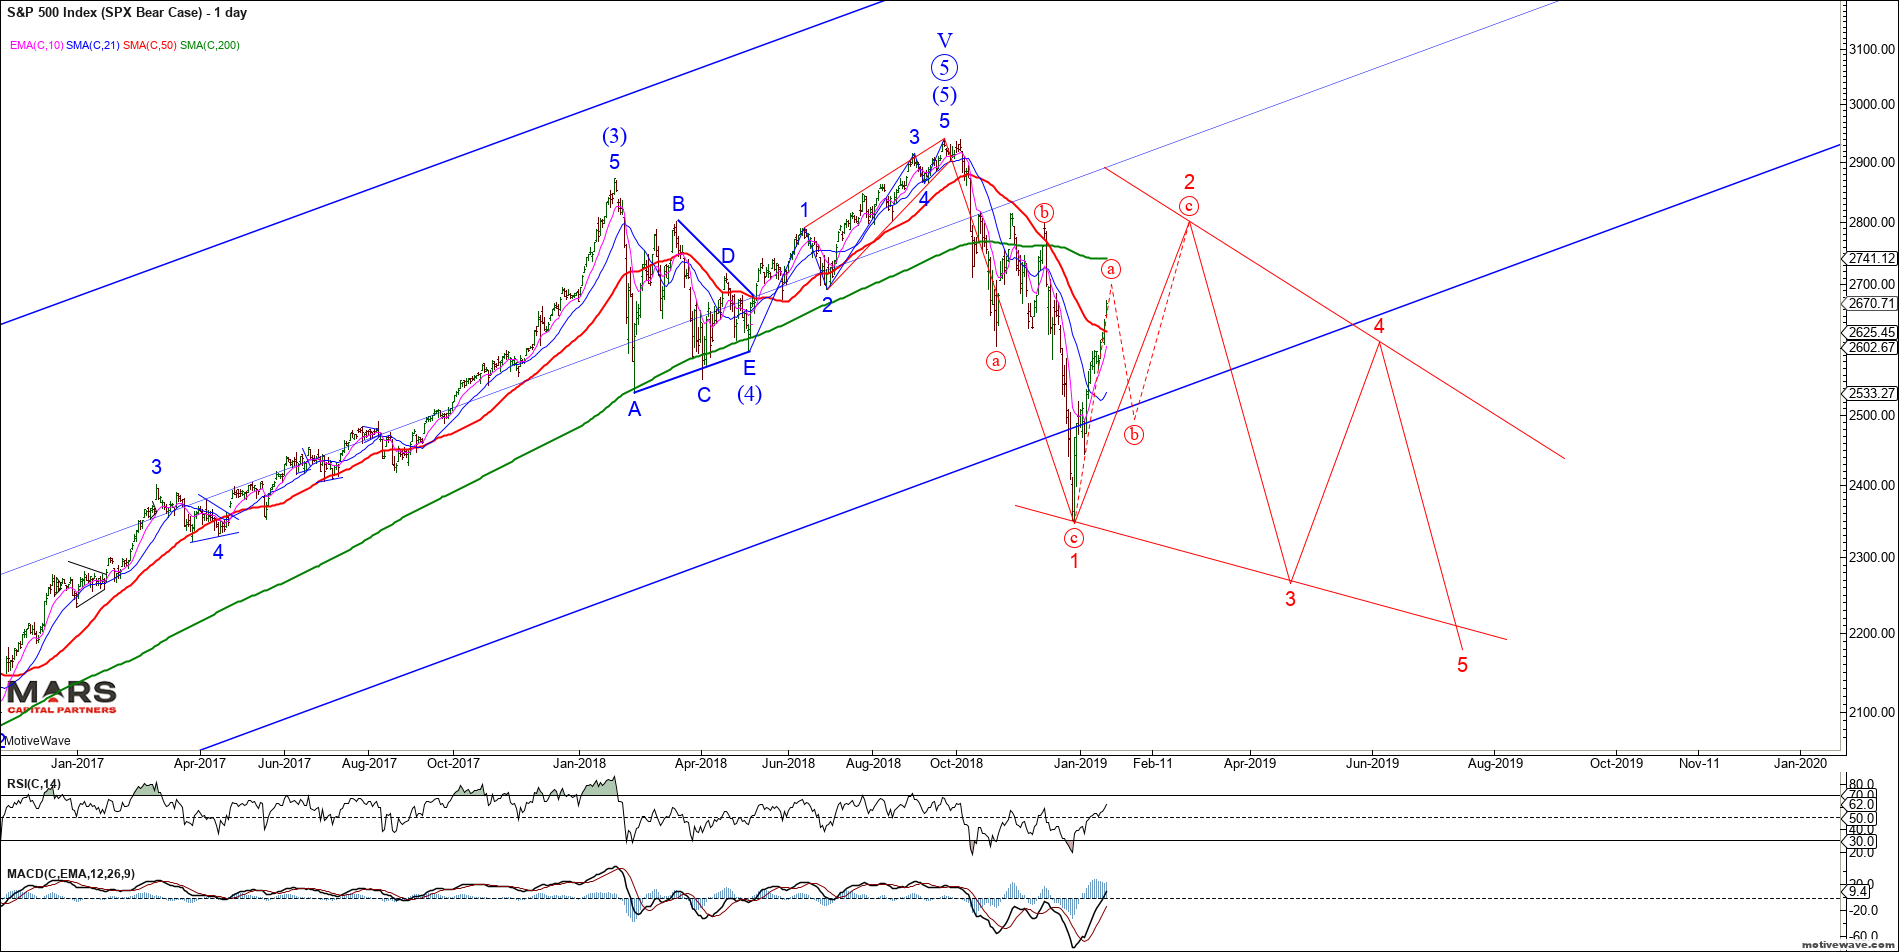
Given the initial 3 wave decline, the most likely bearish structure is a “leading diagonal – falling wedge” as shown below. The lack of 3rd wave price action suggests even this decline would be highly volatile (read choppy whipsawing) and take months to play out – this potential structure is invalidated at new ATH’s.
SPX Bear Case Daily
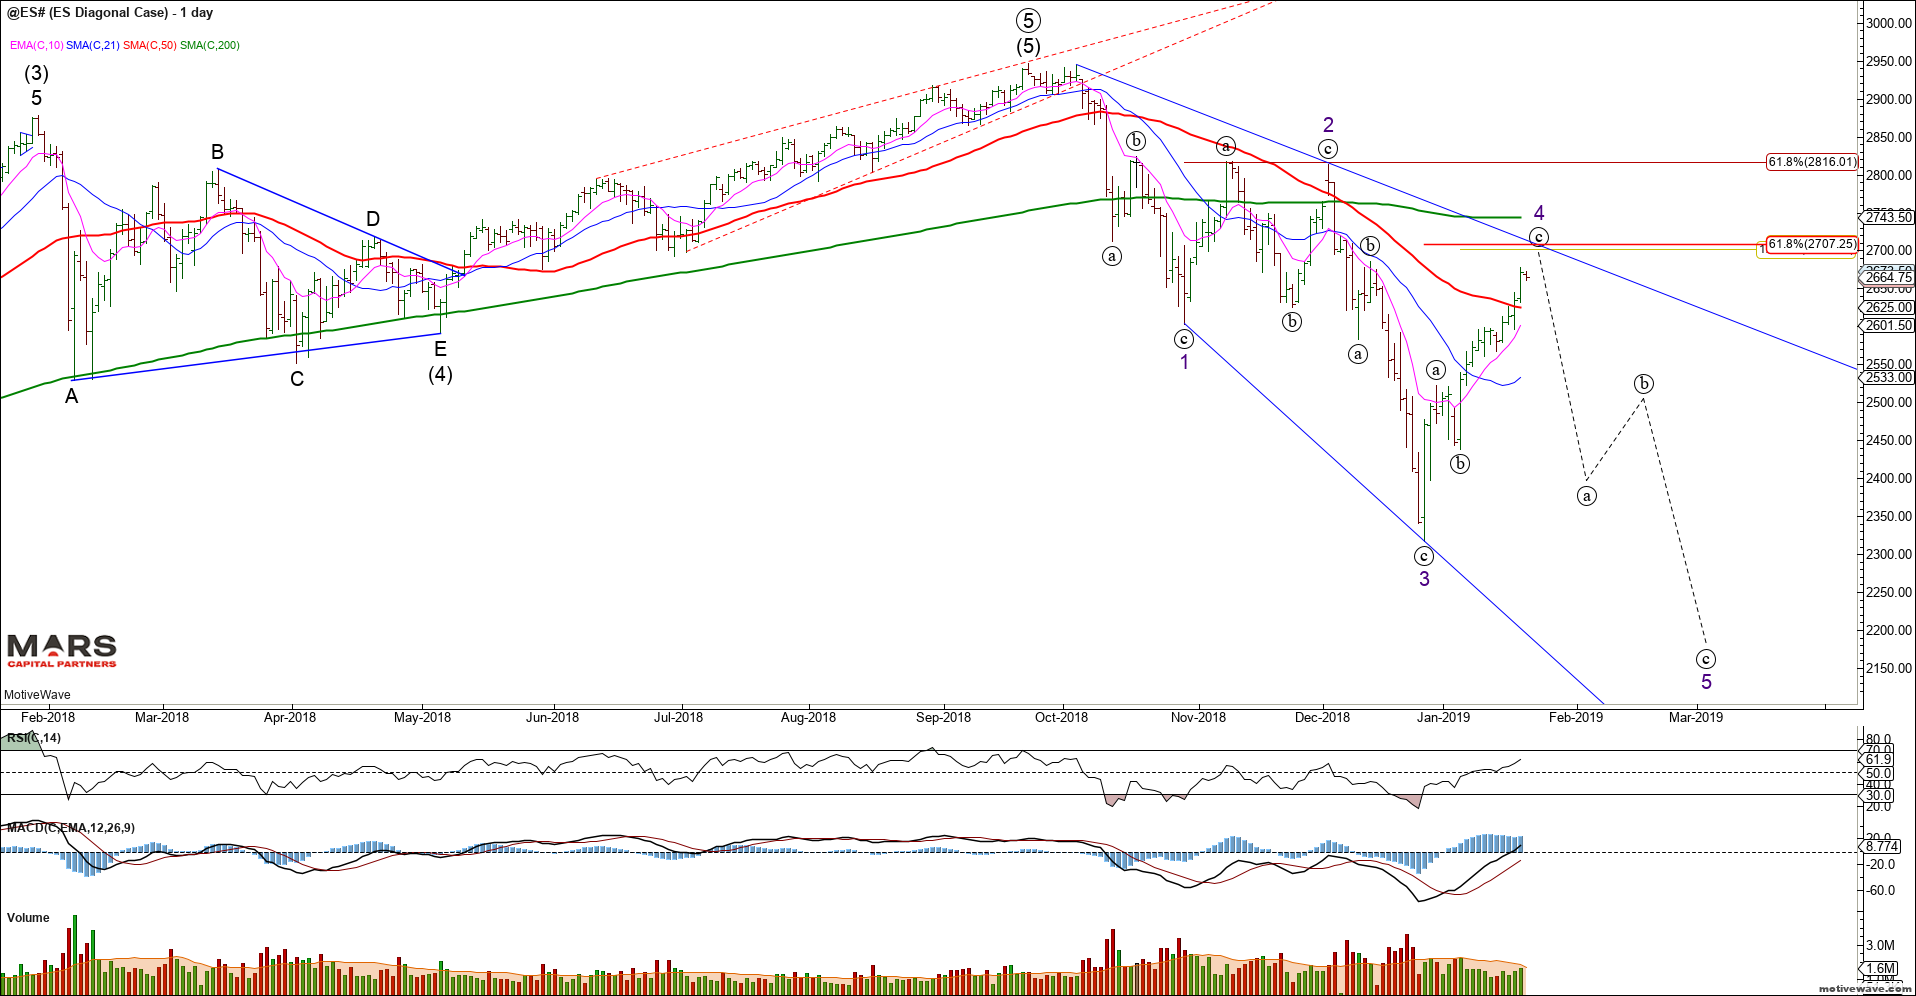
Another potential bearish SPX / ES structure (lower probability) is a rare expanding leading diagonal which requires an immediate bearish turn from the 2700 resistance area.
ES Diagonal Daily
Given the number of price paths that are still valid/possible at this point in time, we expect volatility and traders should remain nimble and trade tactically.
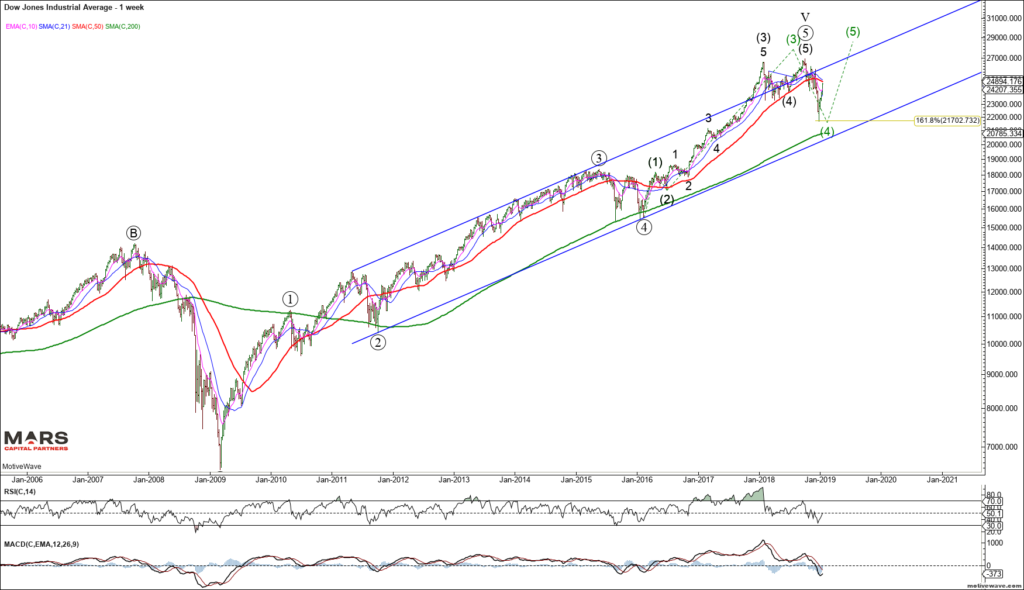
The Dow shows the same structure from a big picture perspective. With only 3 waves down from the highs, we must allow for a potential push to new ATH’s while December’s lows remain in place.
DJIA Weekly
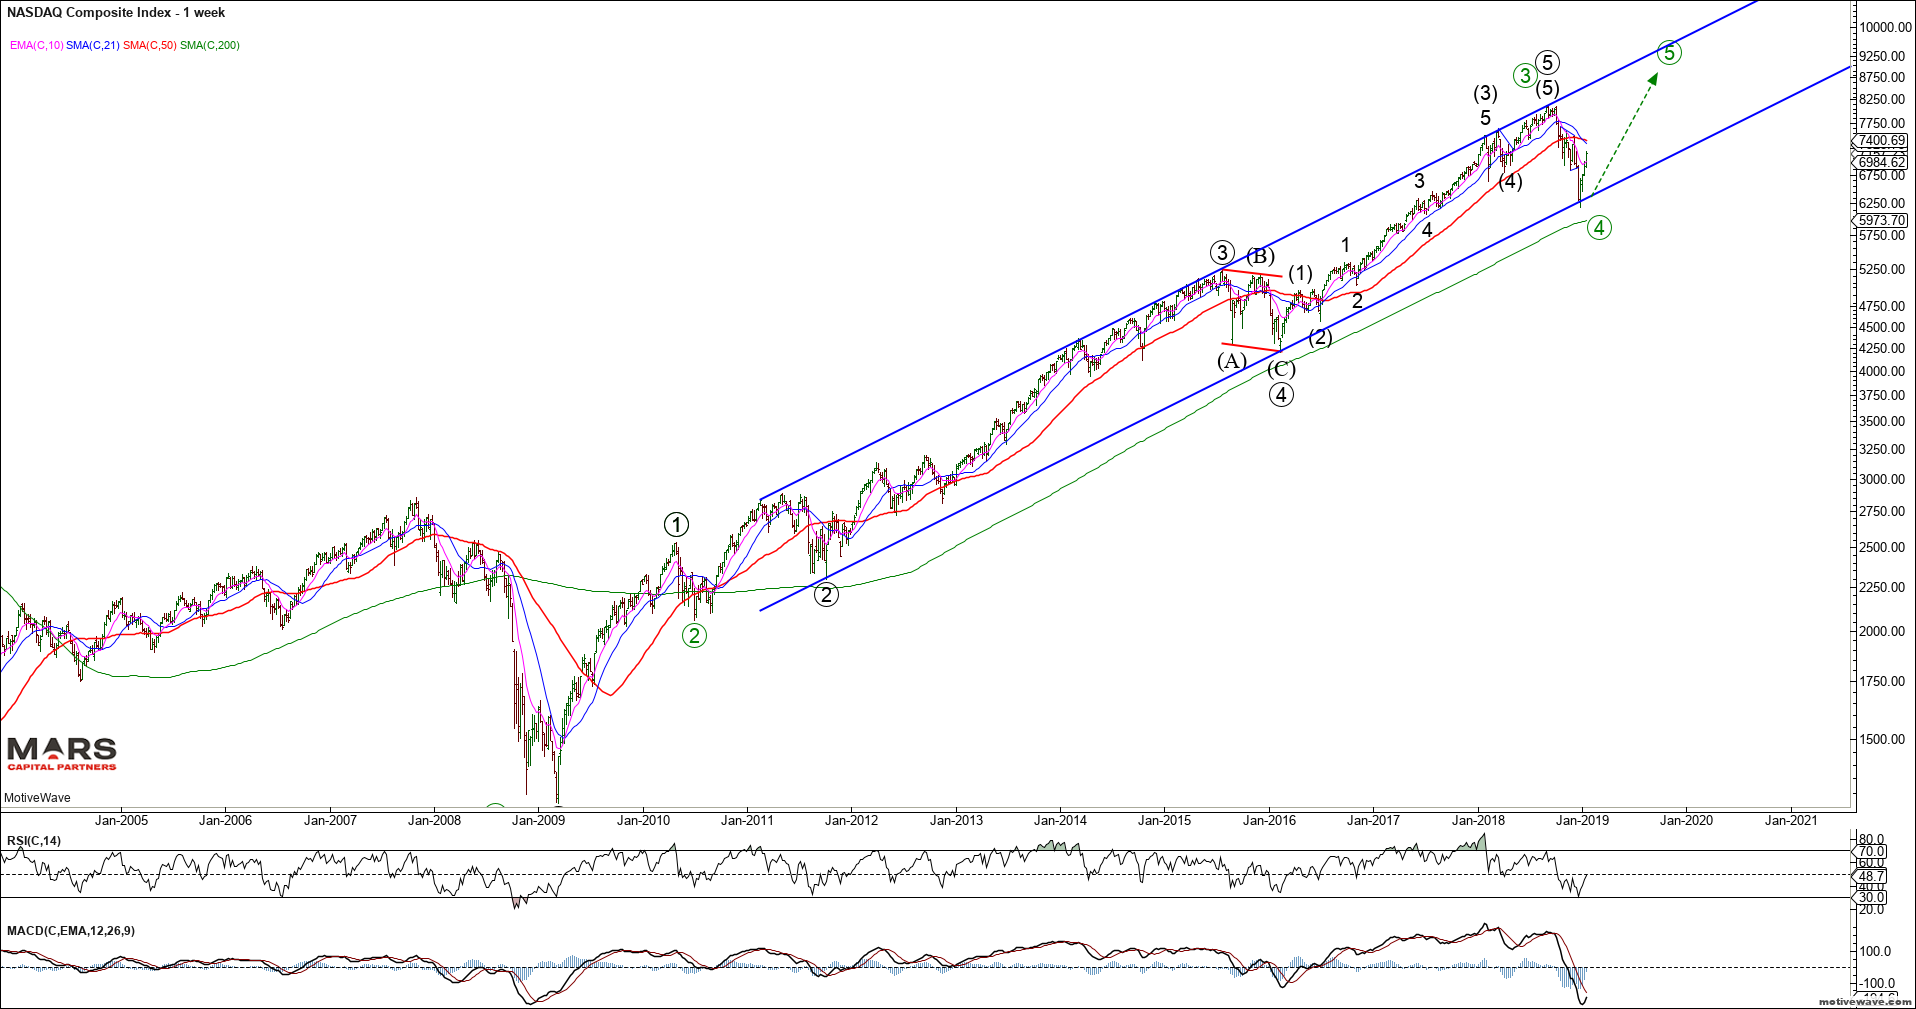
Similarly, the Nasdaq indices only declined in 3 waves of equality into structural support opening the door for an eventual push to new ATH’s. The rally from recent swing lows appears impulsive for a direct push to new ATH’s or part of a more complex correction for wave 4 as per the SPX.
Nasdaq Weekly
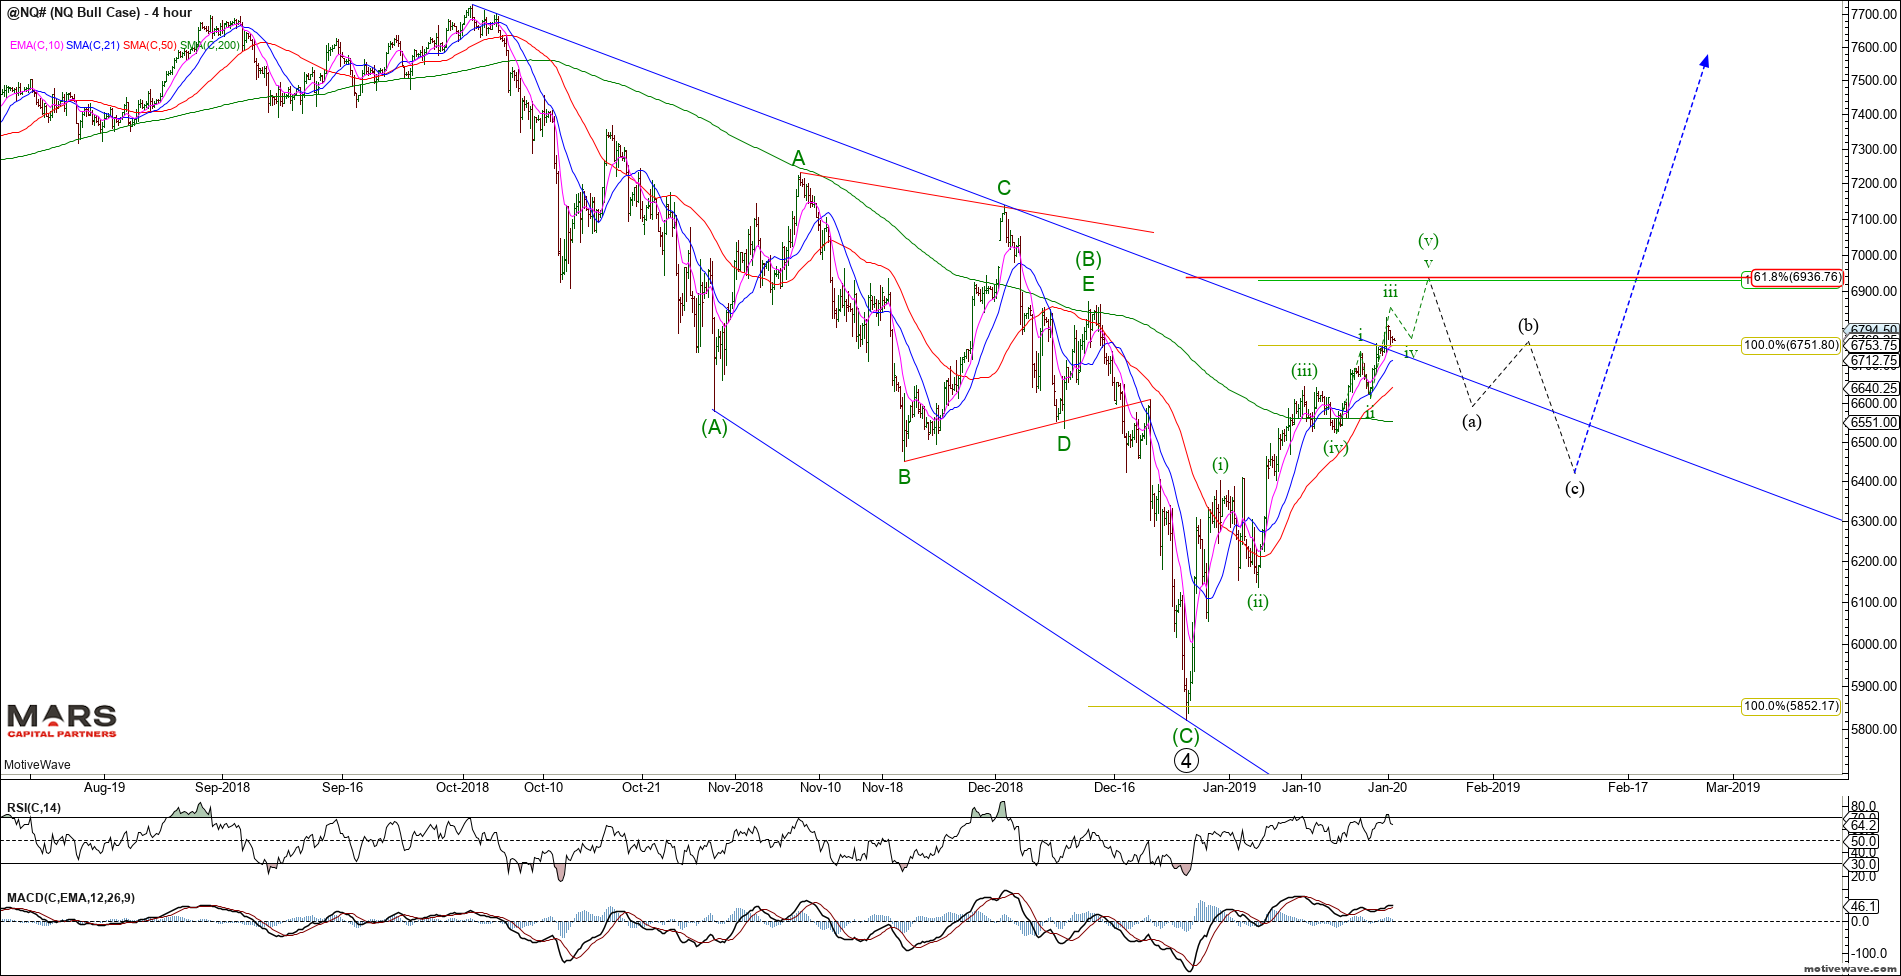
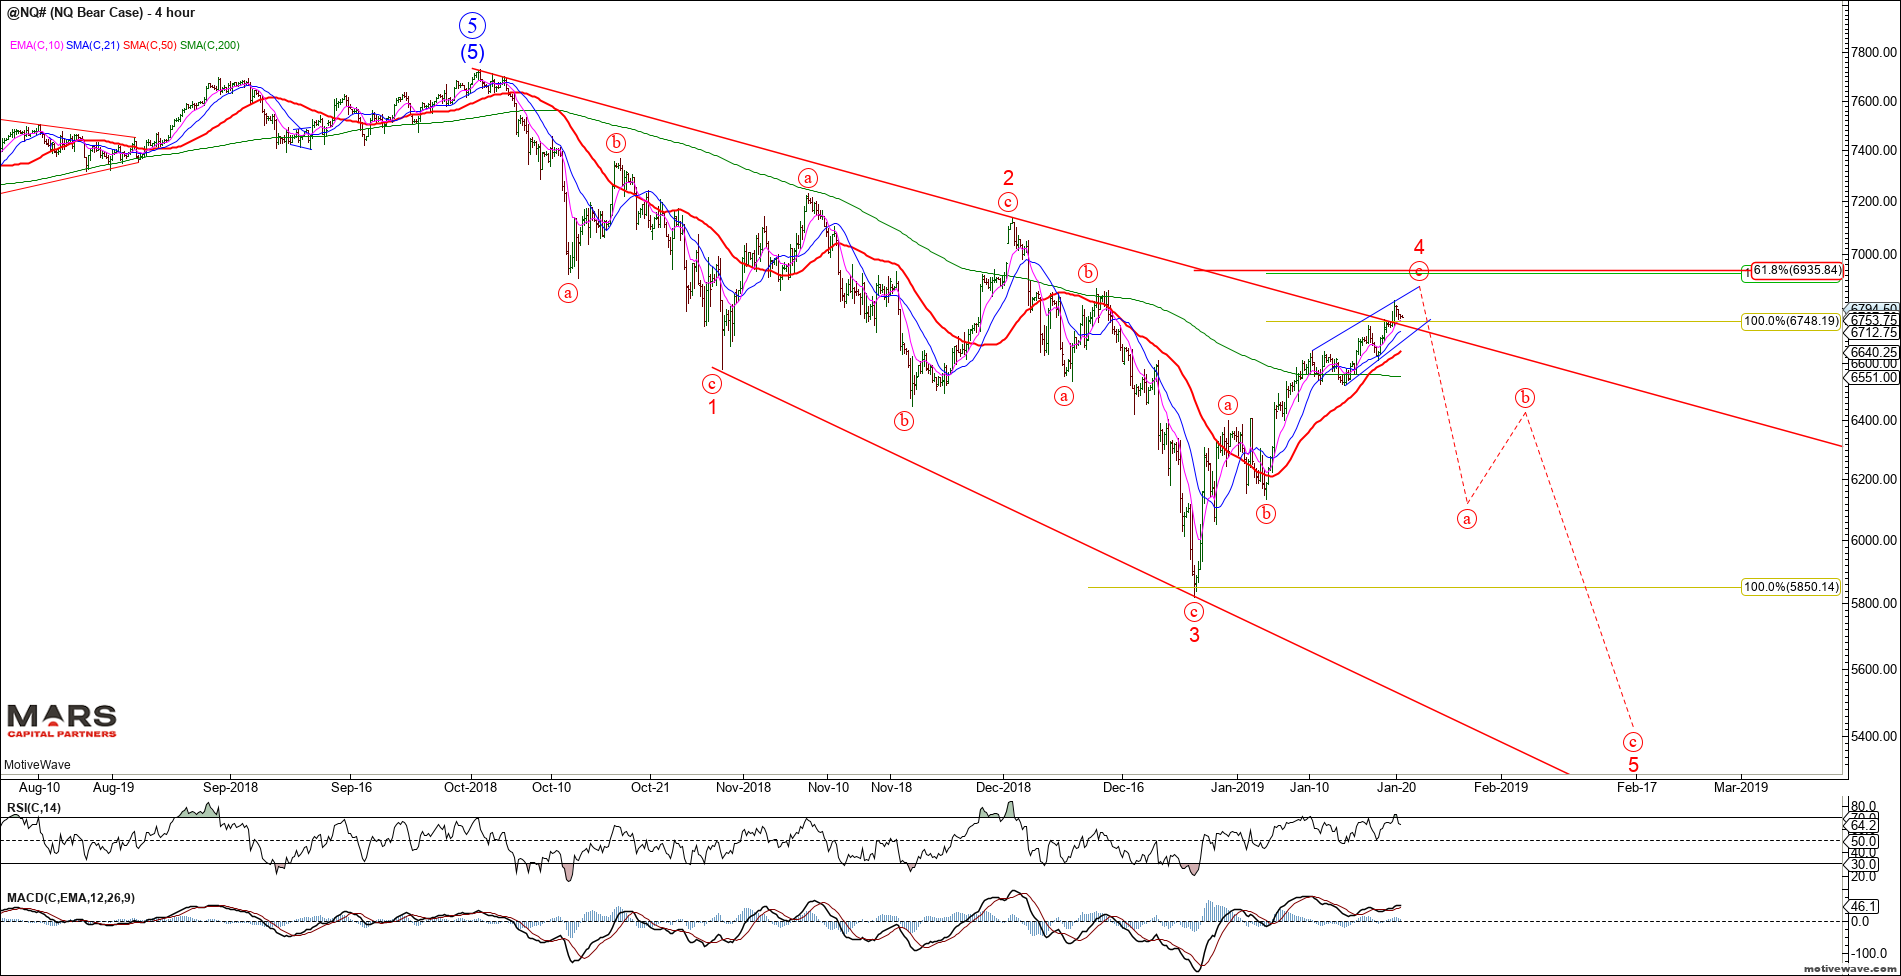
From a near term perspective, the NQ is tracing out what appears to be an extended 5th wave approaching resistance in the 6936 area (61.8% Fib retracement). The near term structure counts best as an impulse up from the lows as shown in the bull count. There is the potential for an extended wave (c) as shown in the red bear count but this appears lower probability. Either way, we should be fast approaching a near term correction so buyers beware.
NQ Bull Case H4NQ Bear Case H4
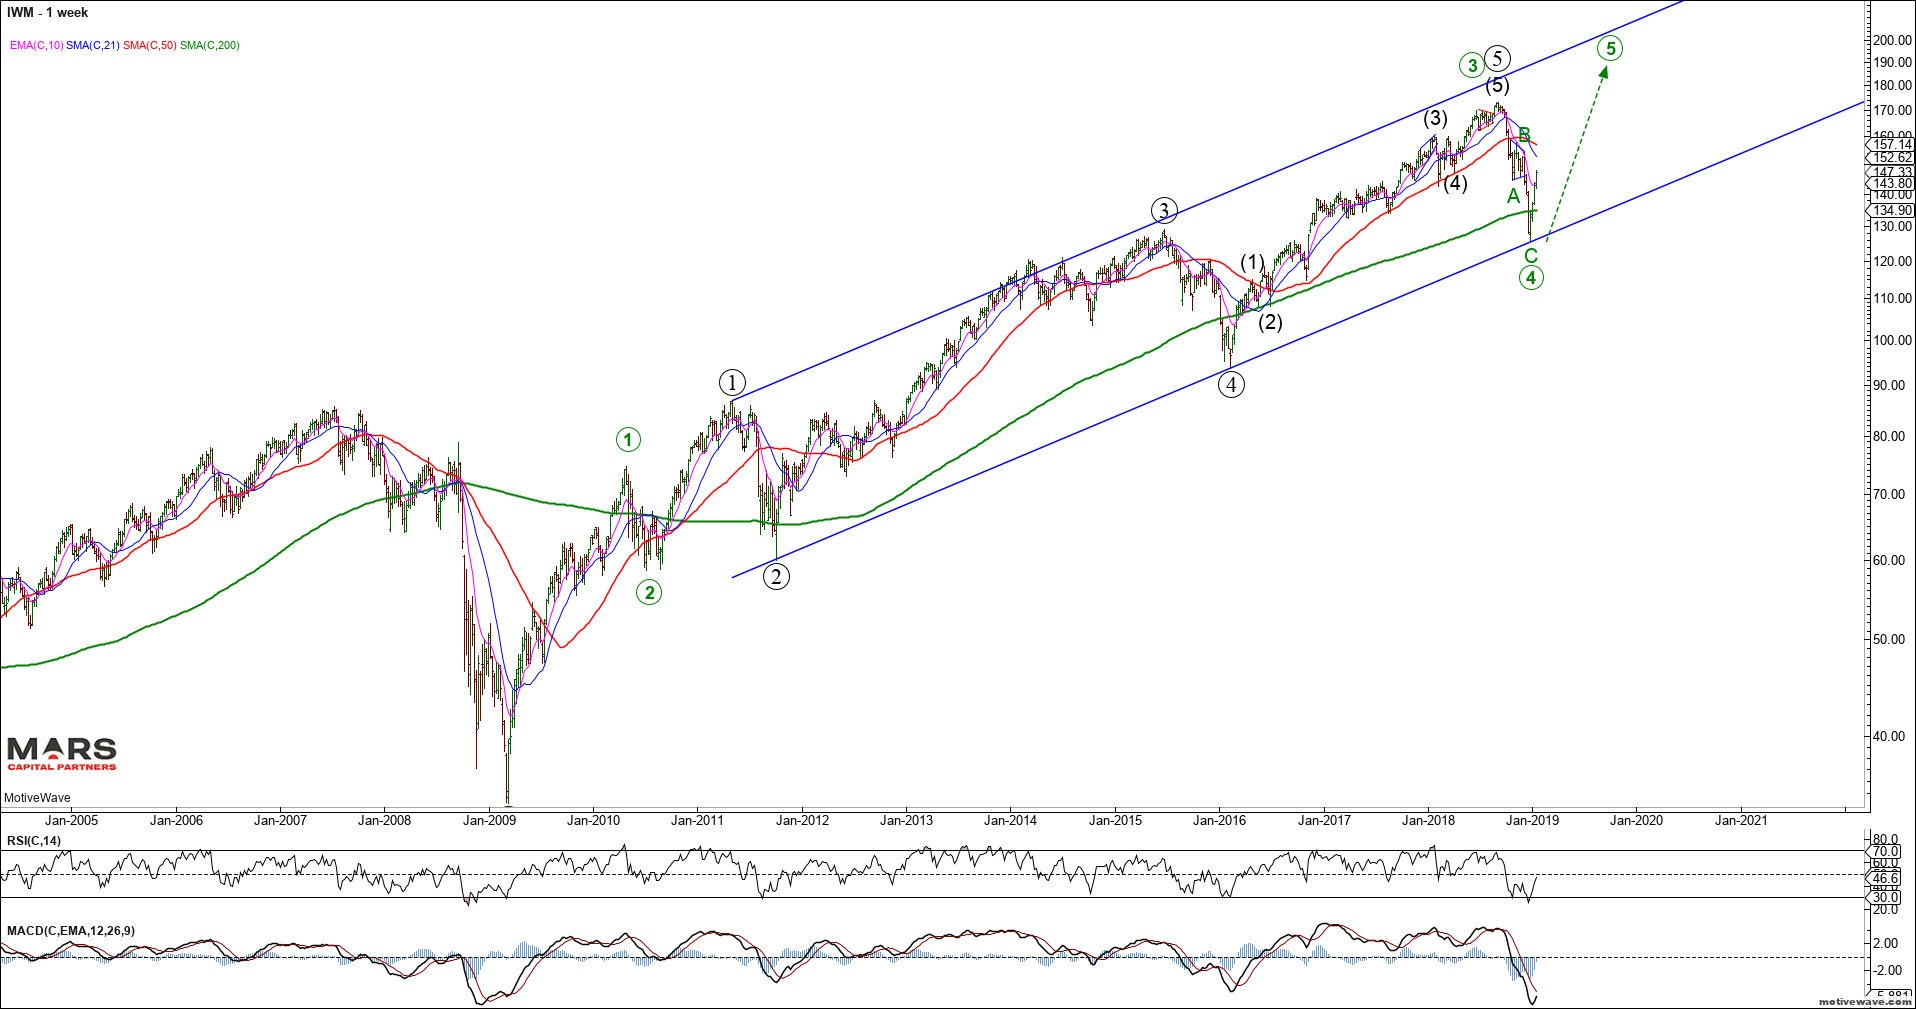
The Russell 2000 also declined in 3 waves of equality into structural support. While there are enough waves to complete the post 2009 impulsive rally, we must allow for the potential of another push towards new ATH’s (green count).
IWM Weekly
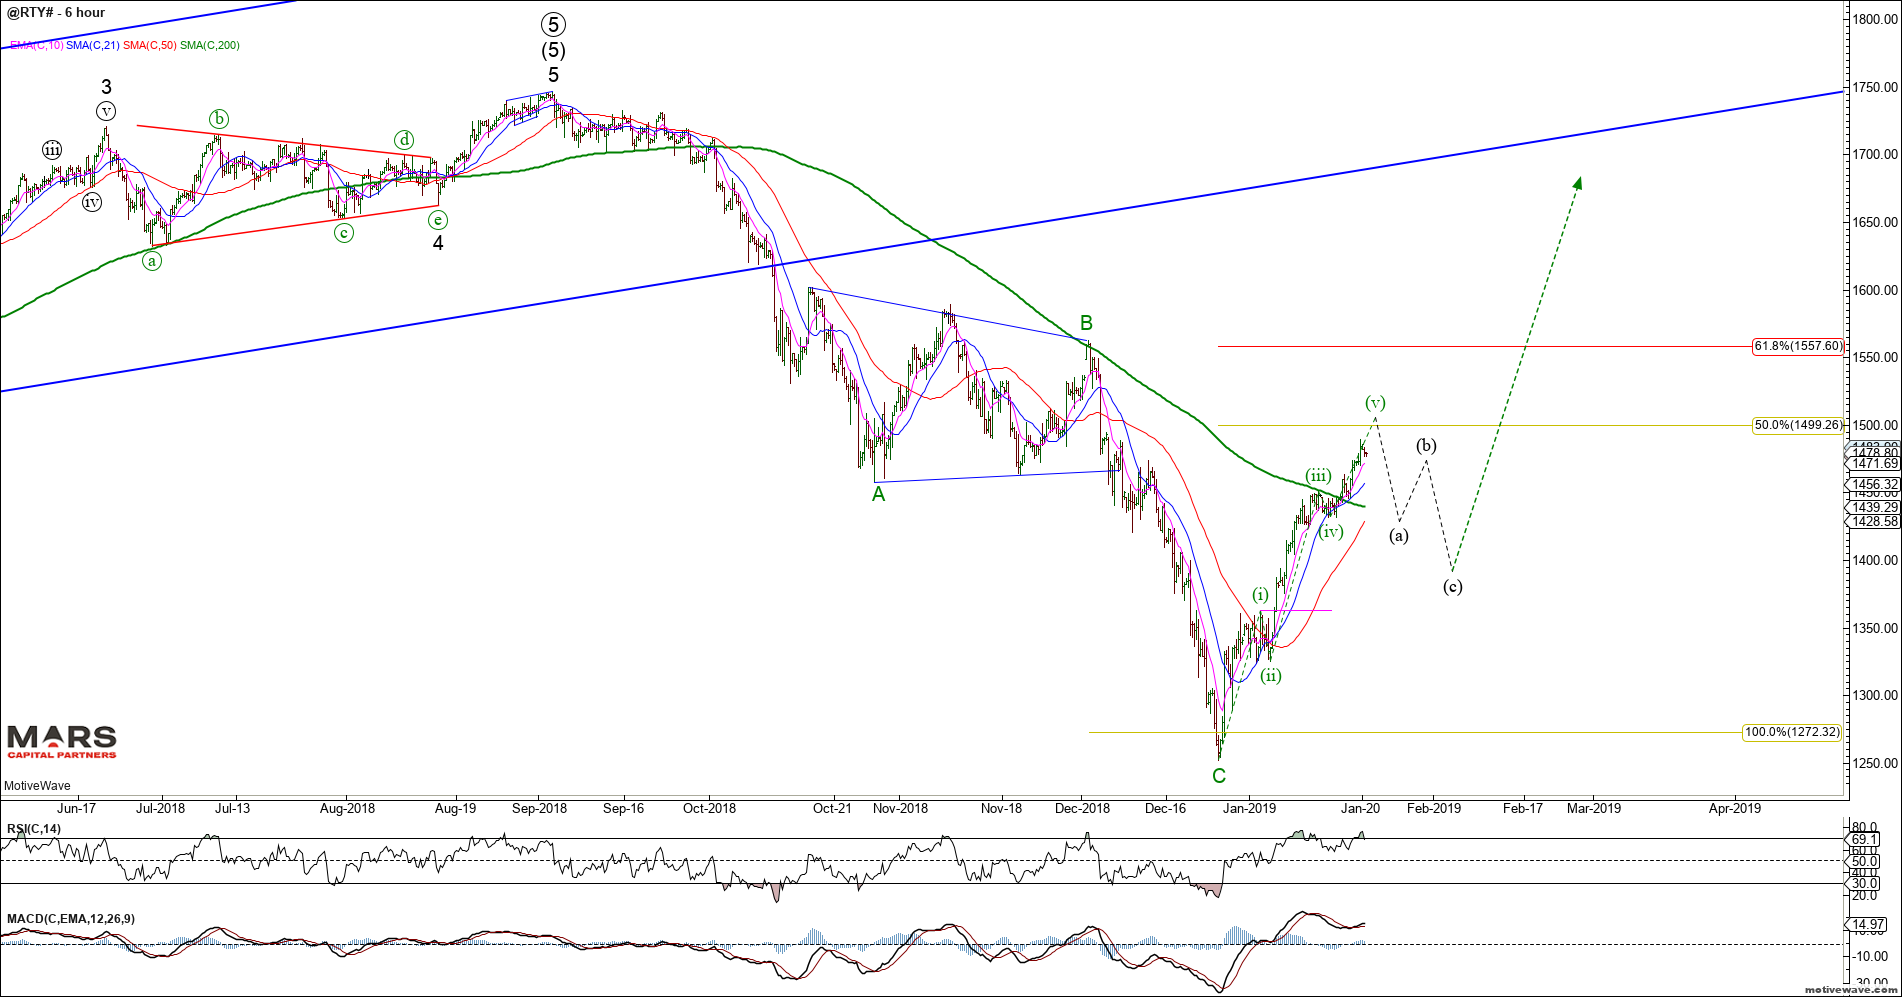
Near term, the RTY appears to be tracing out the final waves of an impulsive rally from the cycle lows. Near term resistance resides in the 1500 area. The impulsive nature of this rally suggests it is either wave 1 or A of a larger rally to retest the ATH’s once its corrective decline is complete.
RTY H6
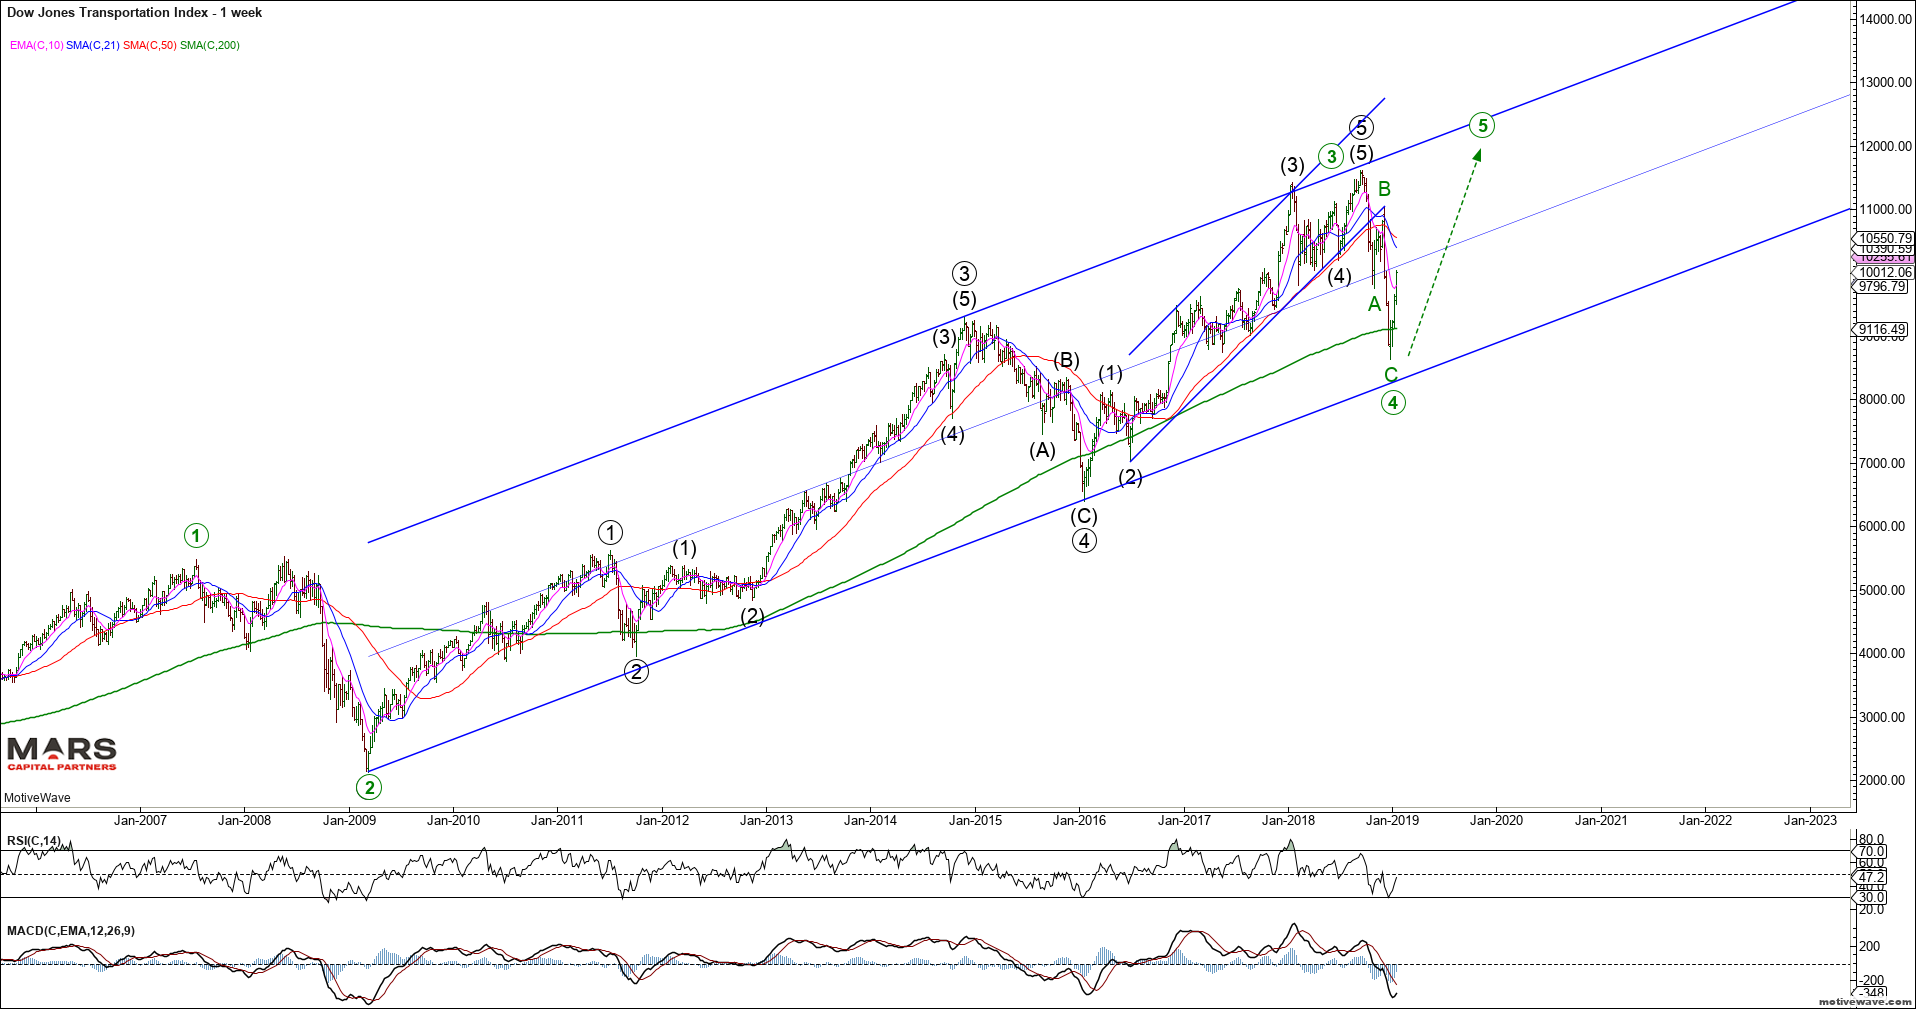
Another index we track closely is the Transports. It suffered a sharp 3 wave decline into structural support before rebounding strongly. Once again, given the corrective nature of the decline, we cannot discount the potential for new ATH’s as shown by the green count. This bullish count is likely invalidated below the December lows.
DJT Weekly
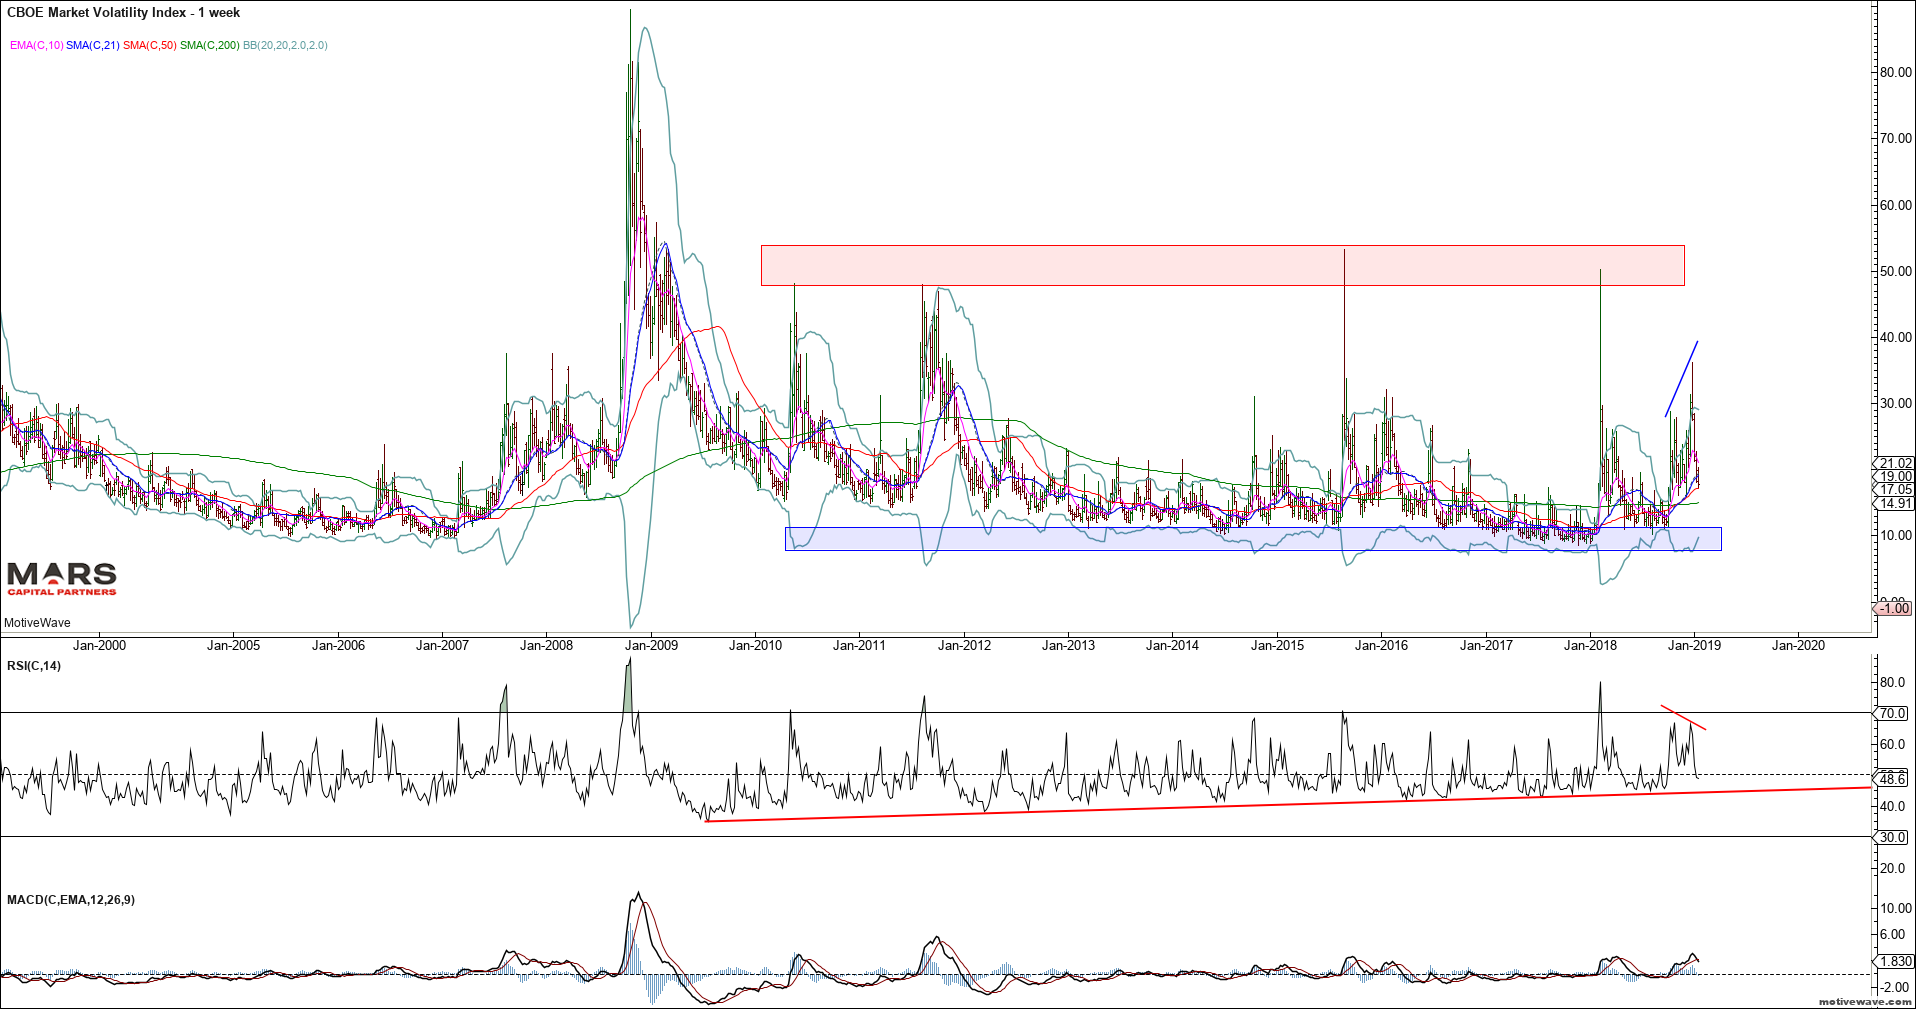
The VIX has been crushed since the Powell Pivot. Given the 3 wave nature of the most recent rally, it is likely that volatility continues to decline towards cycle lows.
VIX Weekly
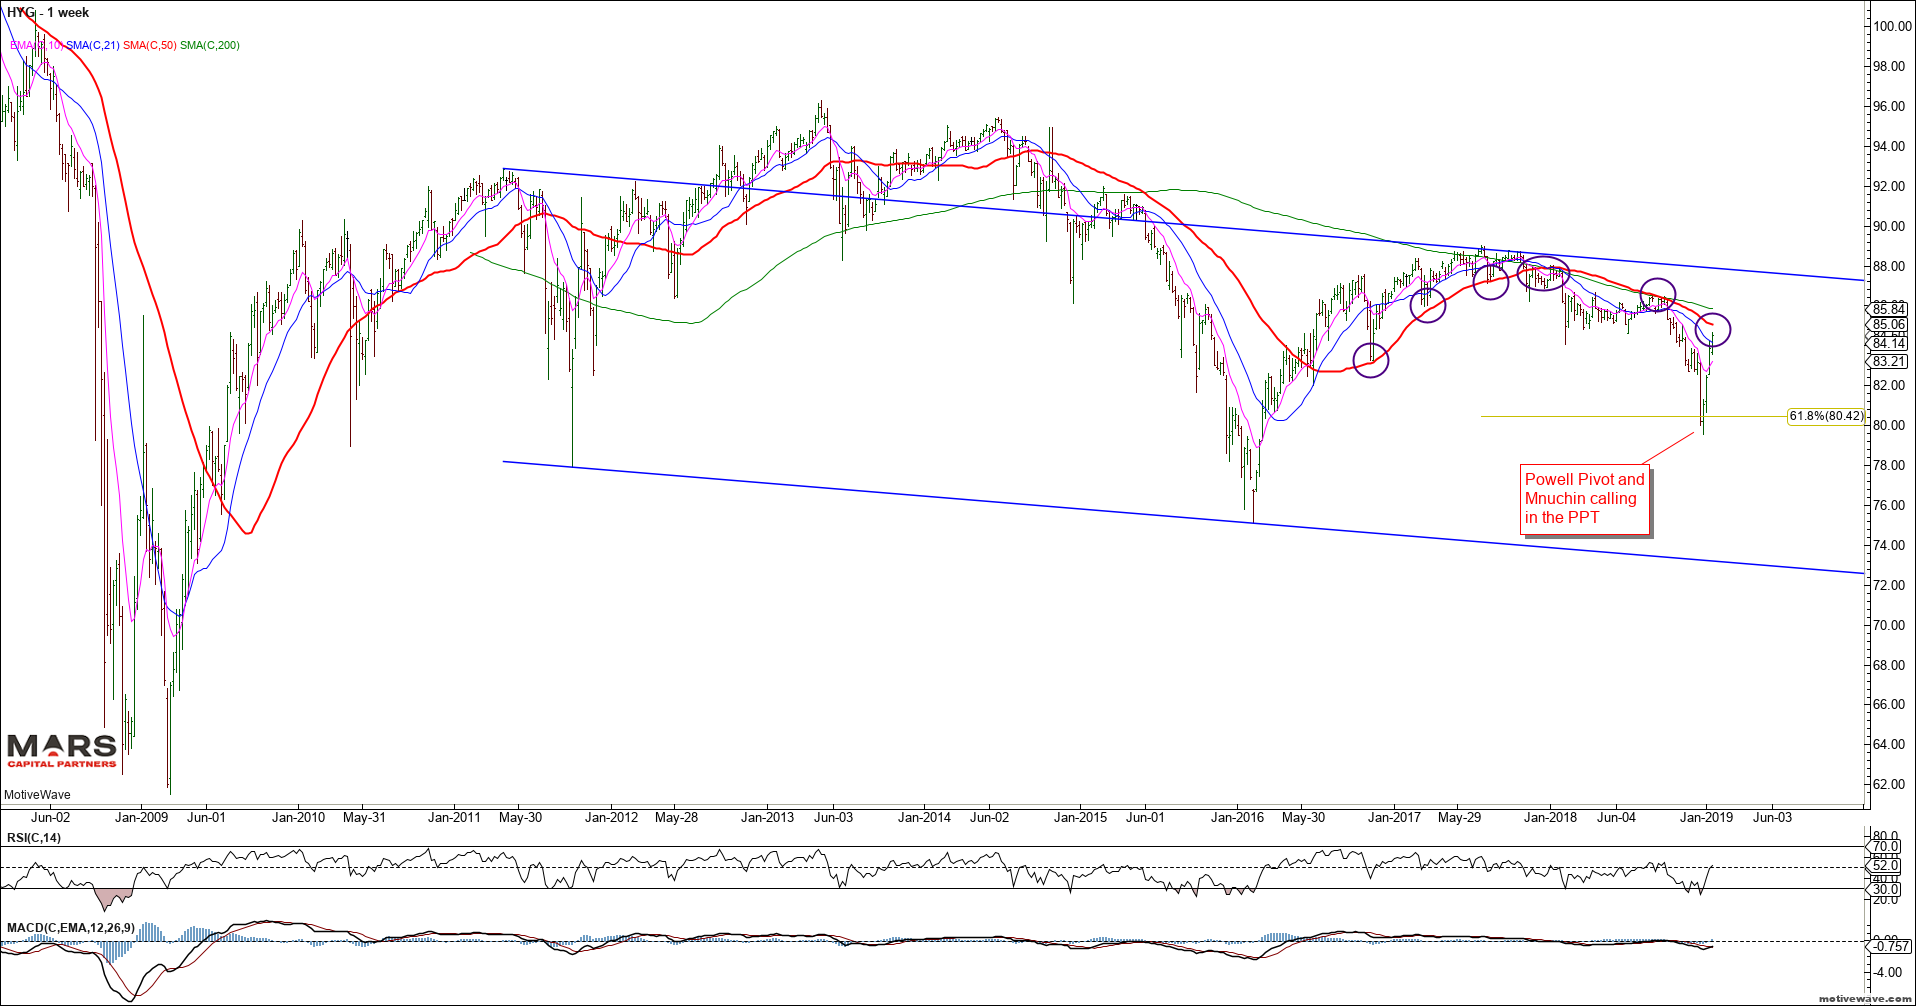
We have been tracking the HYG and JNK indices for risk sentiment. Note the sharp rally since the Powell Pivot – this warns us that investor’s “faith” in central banks remains undiminished. We are fast approaching the weekly 50 sma which has held all rally attempts – key near term inflection point but the rally off the lows appears impulsive (bullish).
HYG Weekly
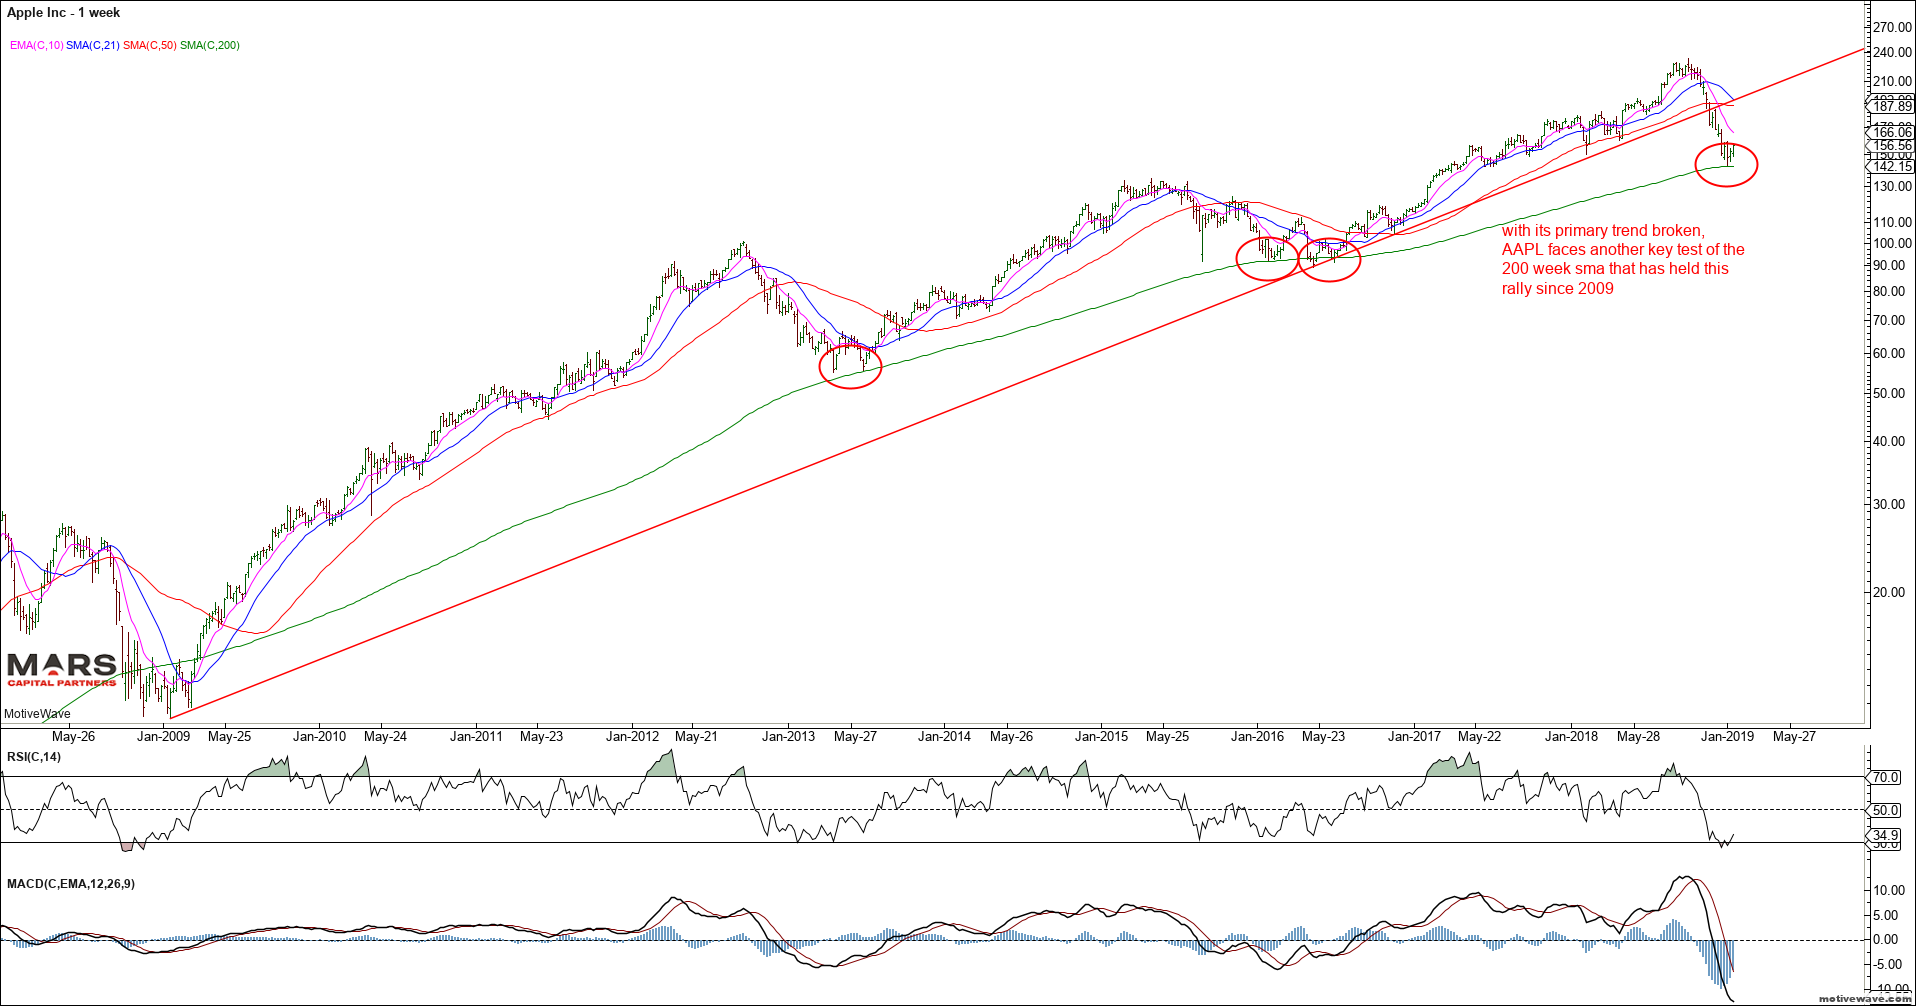
AAPL may provide an important tell for global growth – we have an impulsive (bearish) decline from the September highs that broke trend support but held its 200 week sma from where it is attempting to rotate higher. We should expect at least a counter-trend rally in AAPL here. A break below the December lows would be very bearish.
AAPL Weekly semi-log
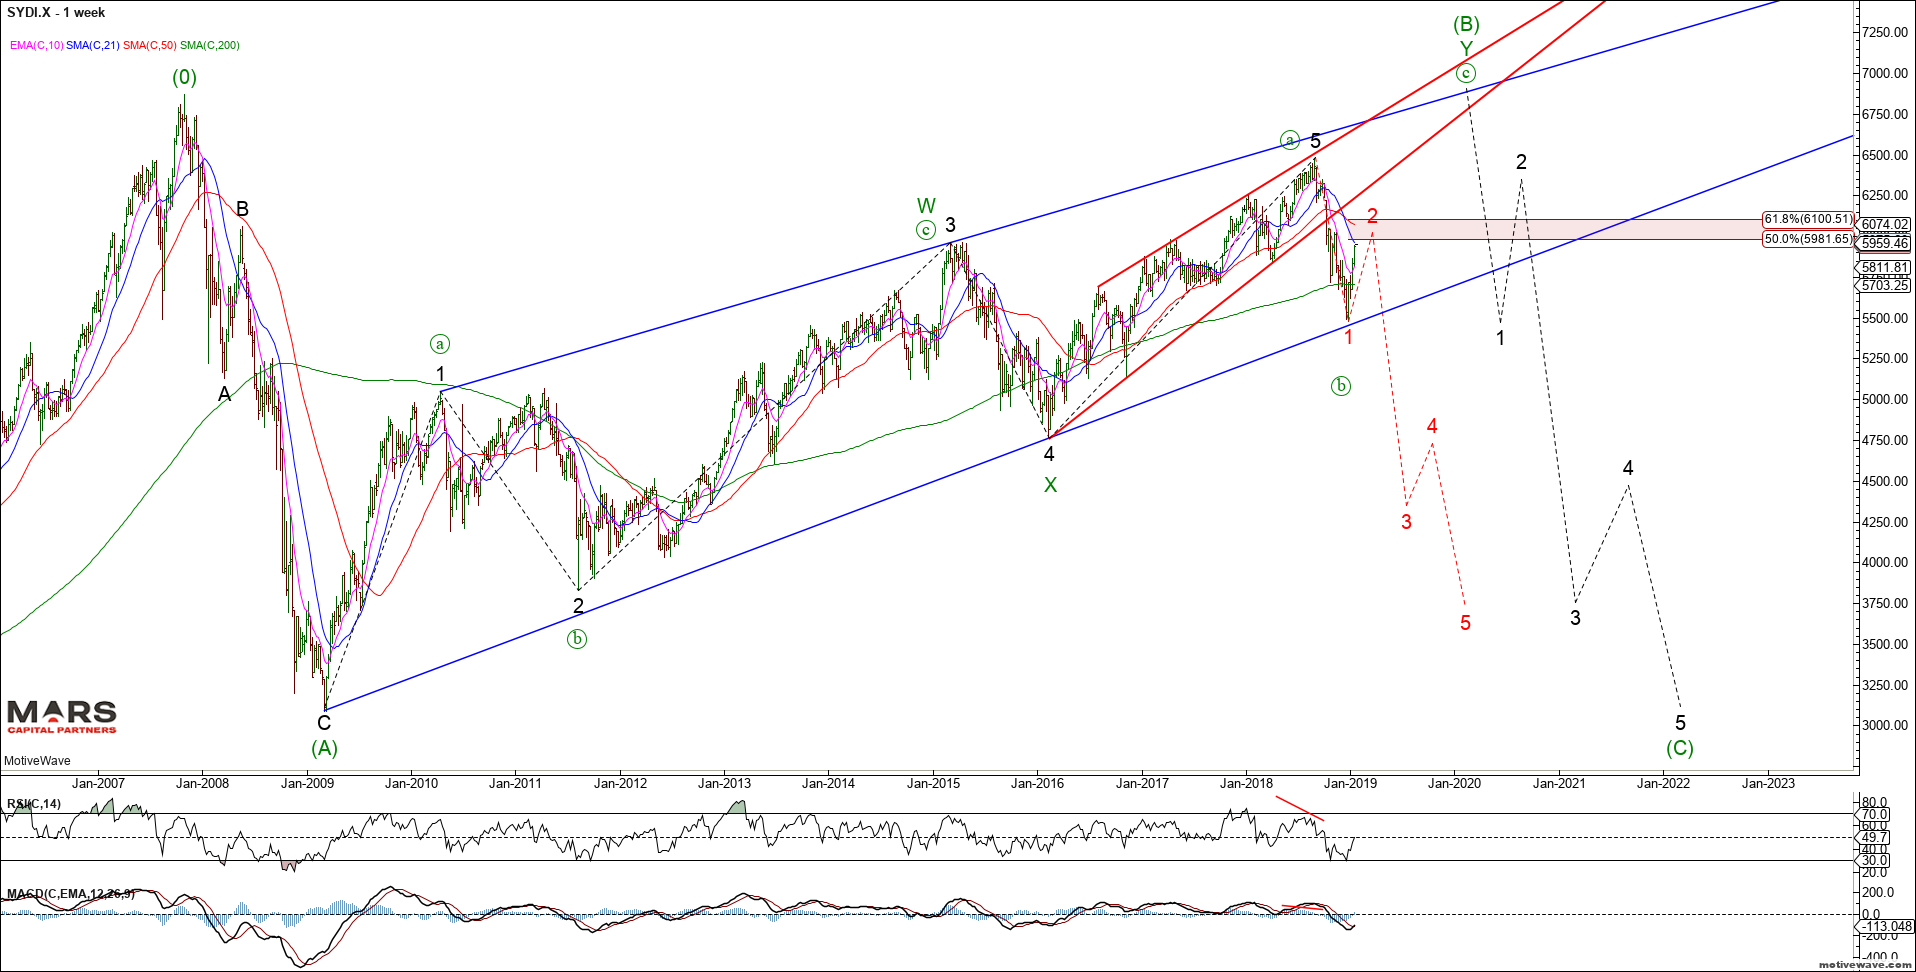
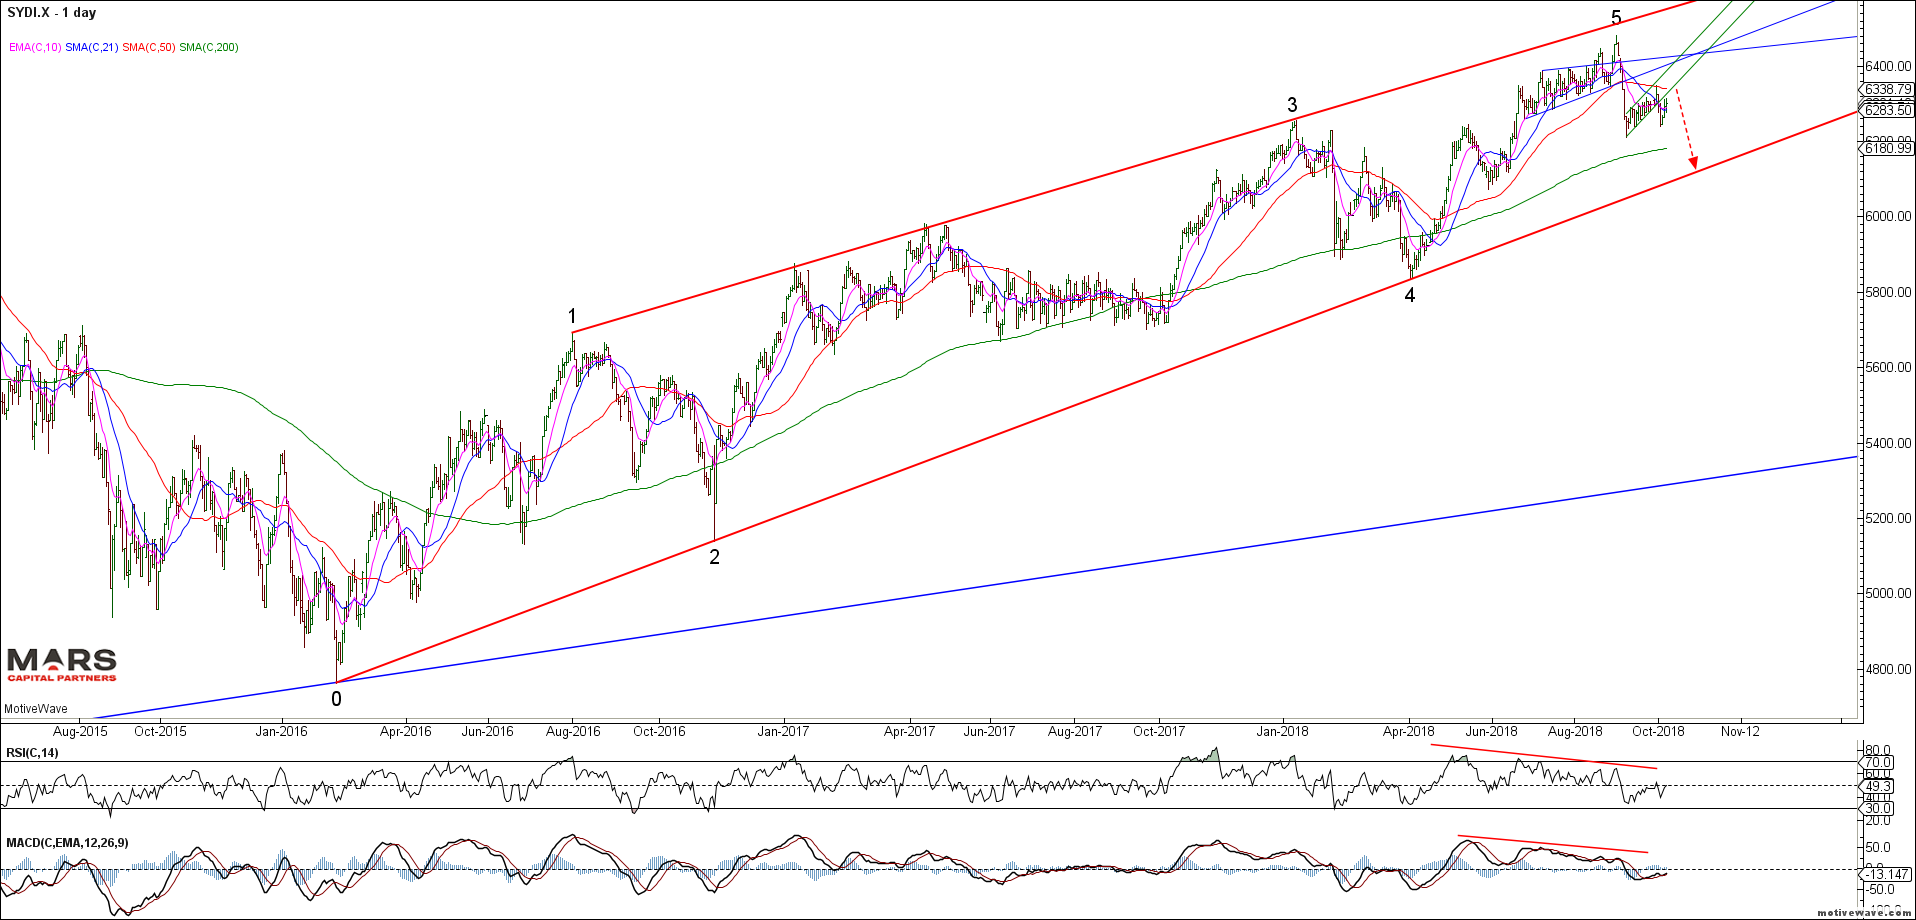
To the global equity markets and the ASX200 has two primary counts. Like the SPX, we have enough waves in place to complete 5 up from the 2009 lows and the decline appears impulsive into structural support. We are now entering the Fib retracement range from where the bears will need to make a stand. The bullish count is more complex and allows for a retest of the ATH’s before reversing sharply lower. This is not a time for complacency – the big picture risks far outweigh the upside potential for the Aussie stock market.
ASX200 Weekly
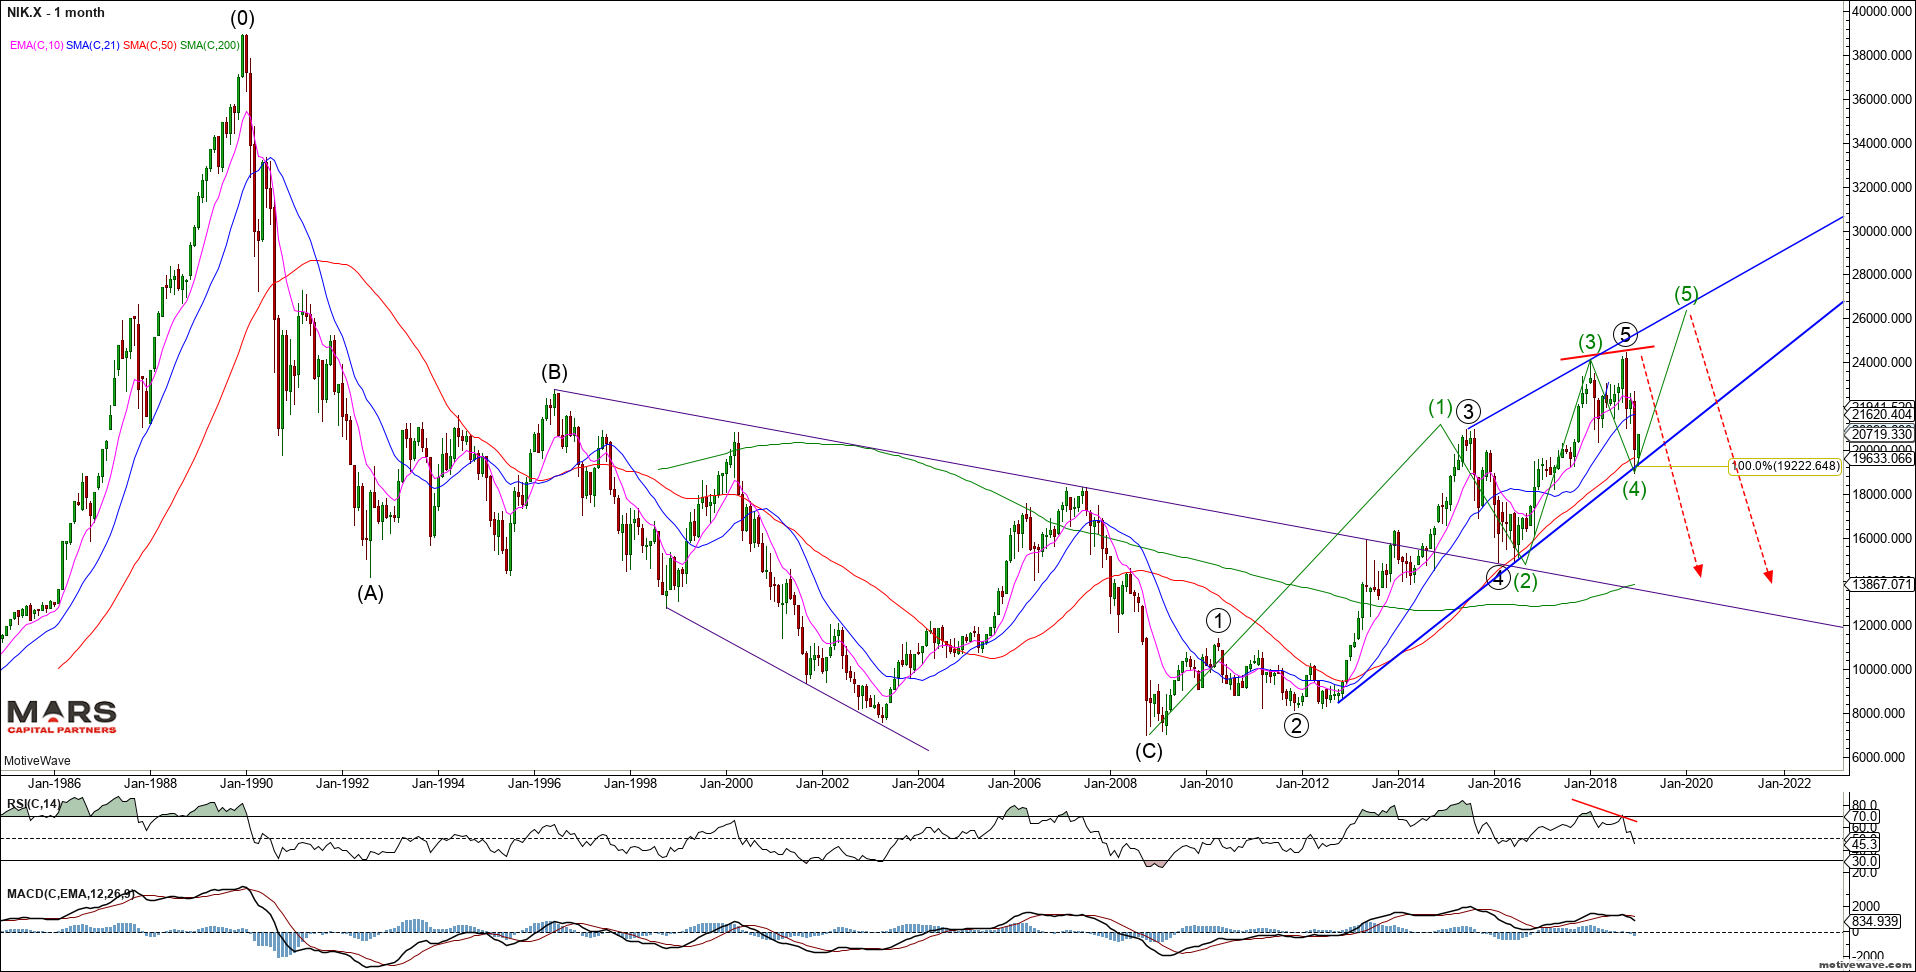
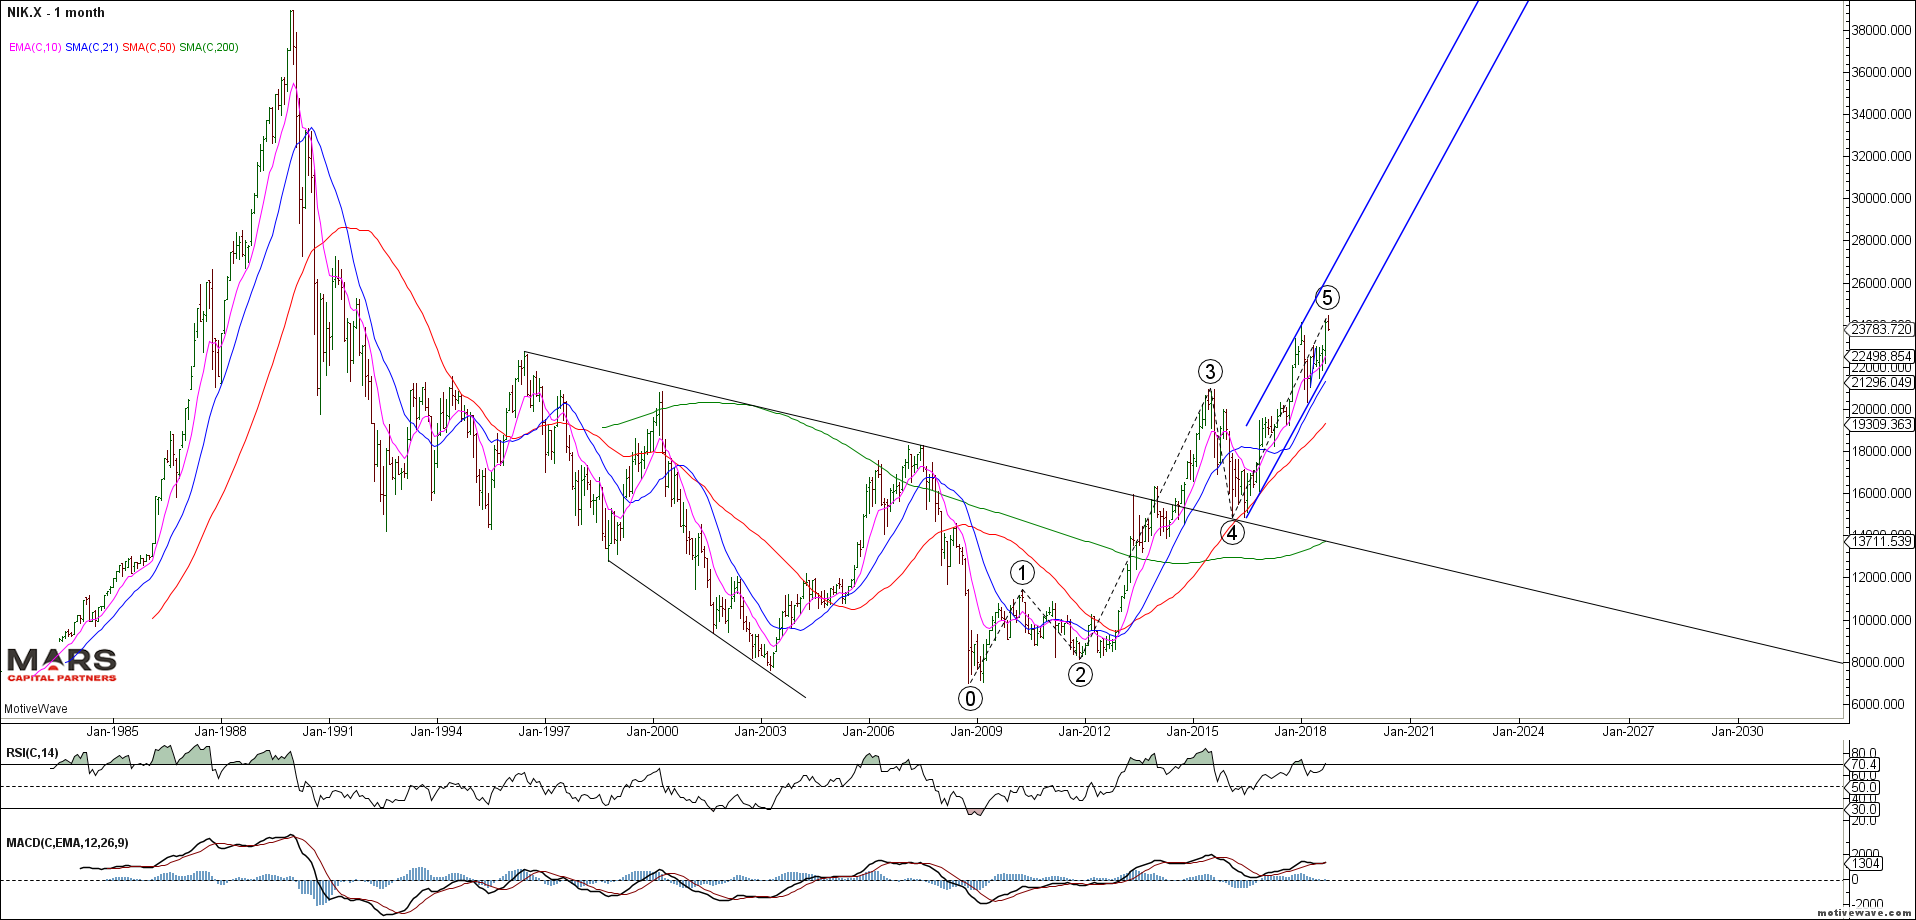
The Nikkei 225 appears to have completed 5 waves up from the 2009 lows. The decline from the highs is only in 3 waves of equality so far. While there is a small possibility of a push to marginal new highs, risks remain to the downside for the Japanese stock market.
Nikkei 225 Monthly
The NKD is currently backtesting its break of support and 50 day sma. So far the decline from the highs is a corrective 3 waves of equality and bears need to extend this down into 5 waves to avoid new highs. The price action is too choppy for clear near term direction.
NKD Daily
The European markets also bounced off structural support. So far we only have 3 waves down from the highs and this needs to extend to 5 waves down for a bigger picture change in trend. The DAX has strong resistance in the 11400-500 area from where the bears will need to make a stand. Immediate trade back above 12000 would invalidate the impulsive bear count.
DAX Weekly
To the Bond markets and we are a very important inflection point. So far we have a corrective 3 wave rally in rates from the July 2016 lows across 10’s and 30’s. Rates need to extend higher immediately into 5 waves up above the November highs to invalidate the bearish potential. I have highlighted both bull and bear cases for reference. Due to the impulsive nature of the recent decline from the highs, the probability is that rates are likely going to new lows consistent with the deflationary outlook. We are bearish rates (bullish bonds) until proven otherwise by a rally above the November highs.
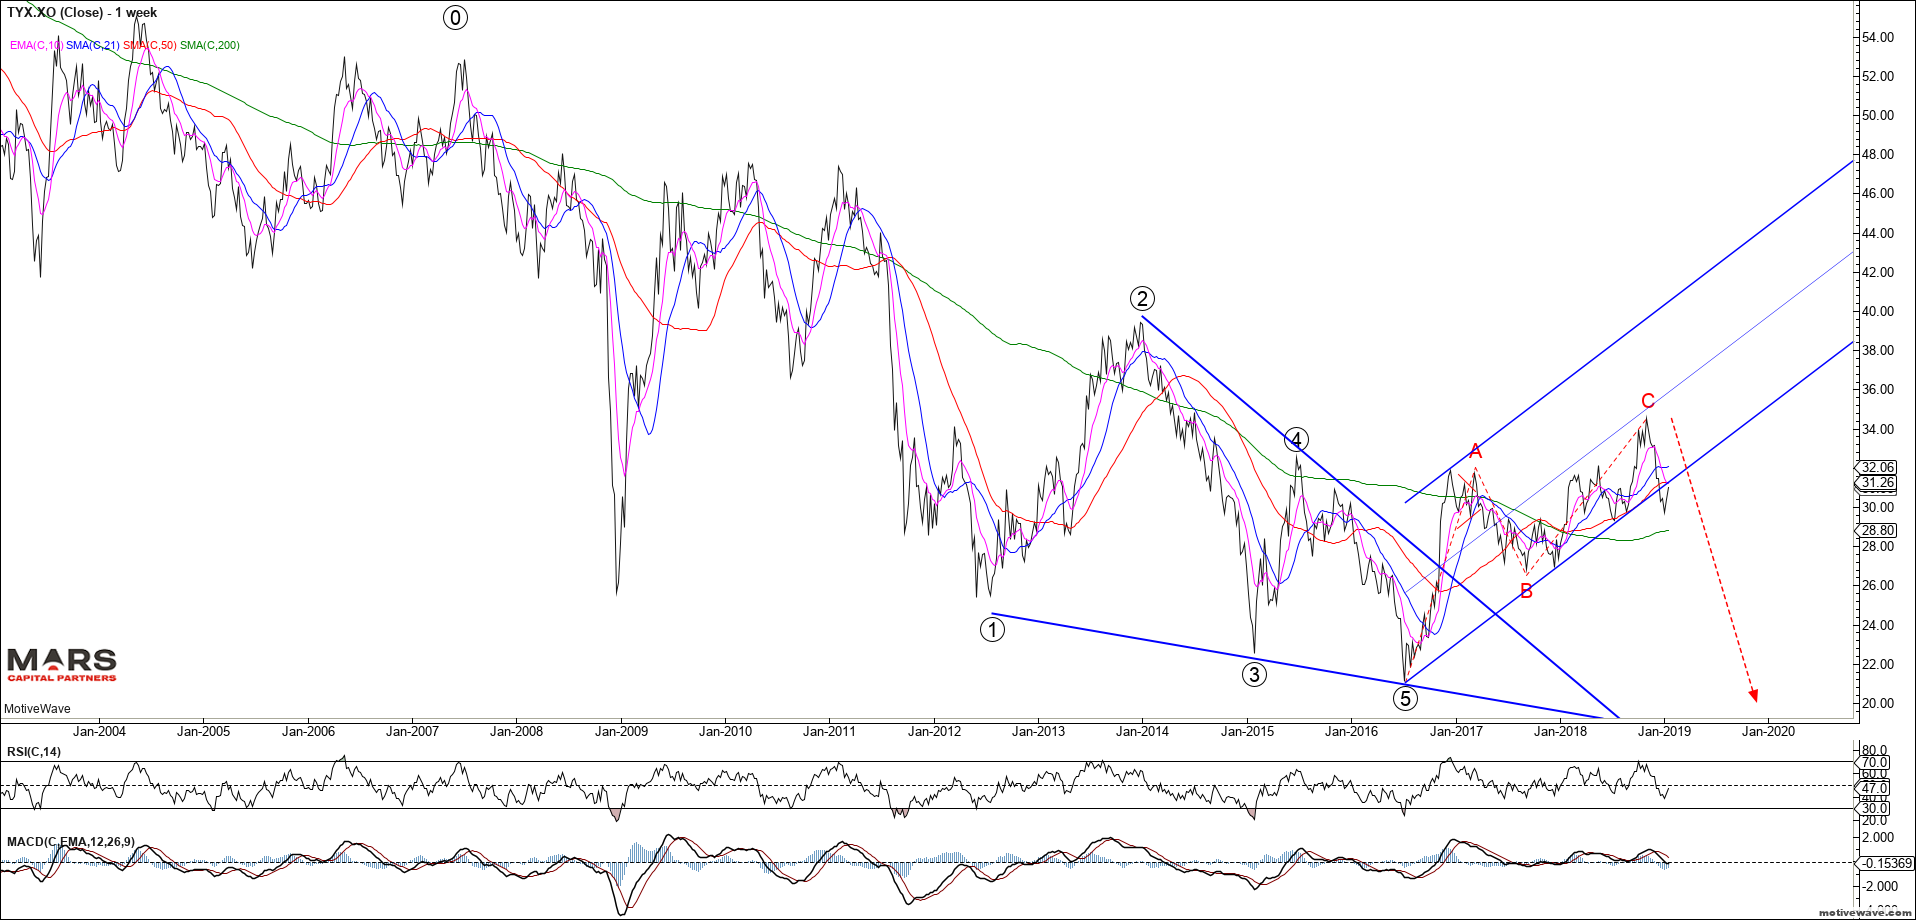
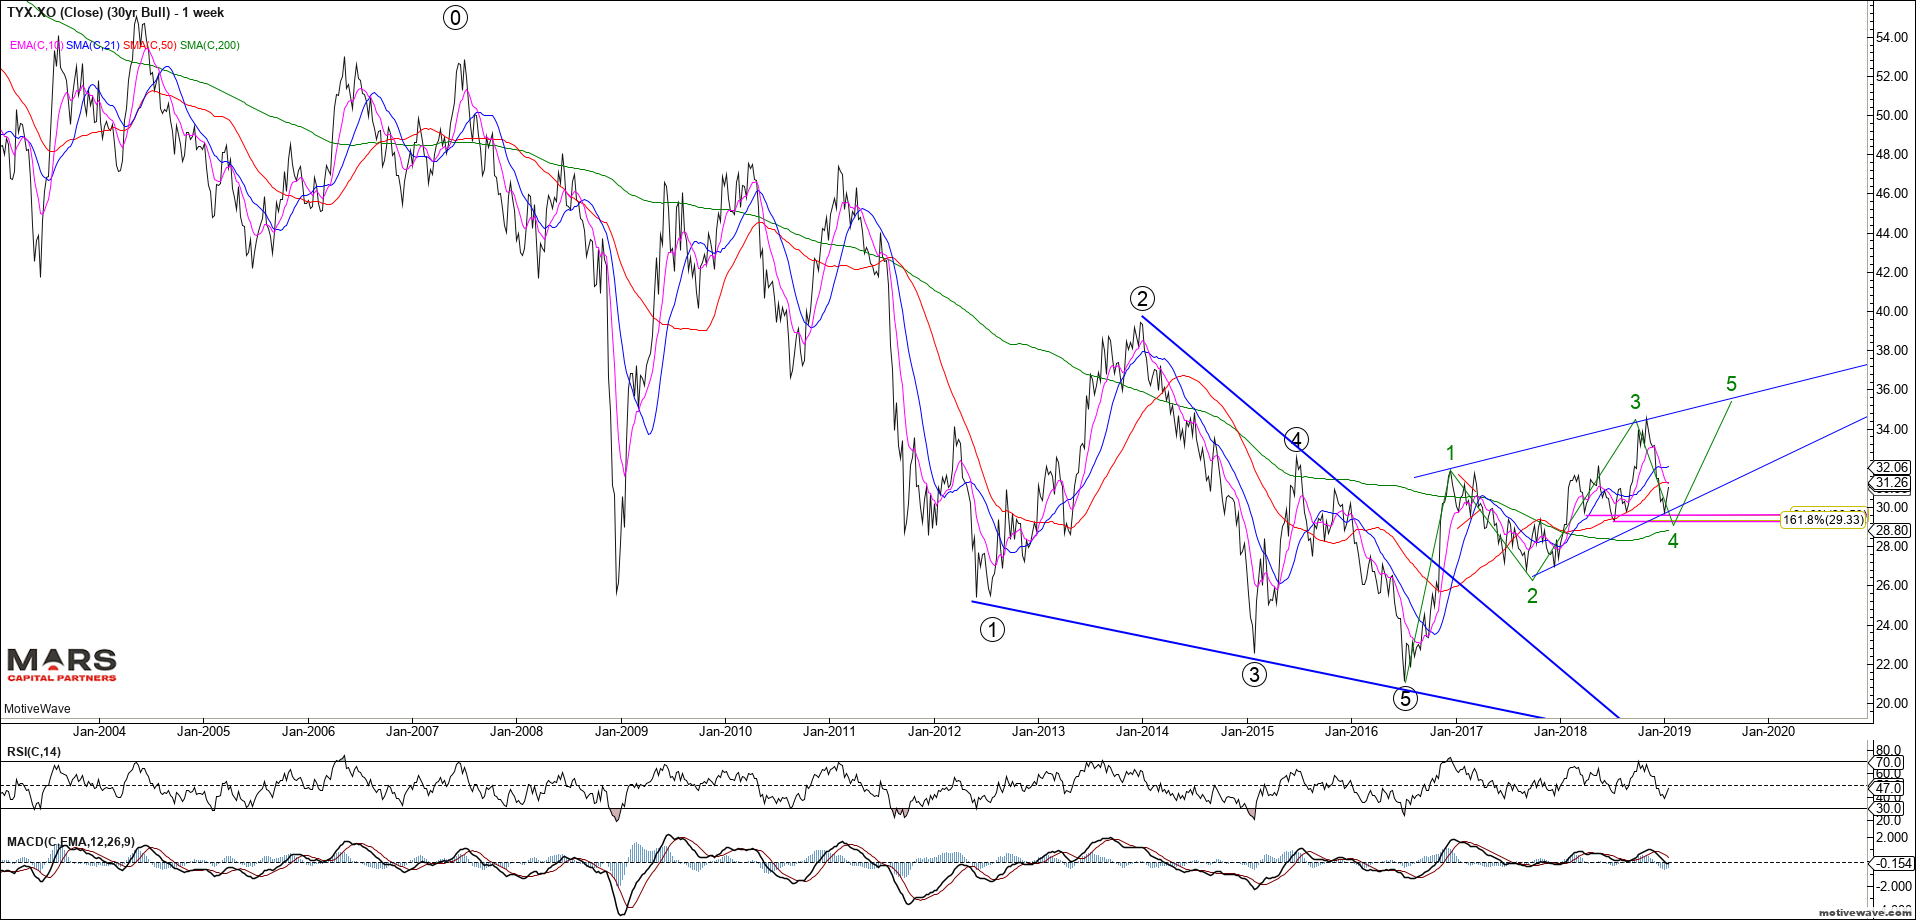
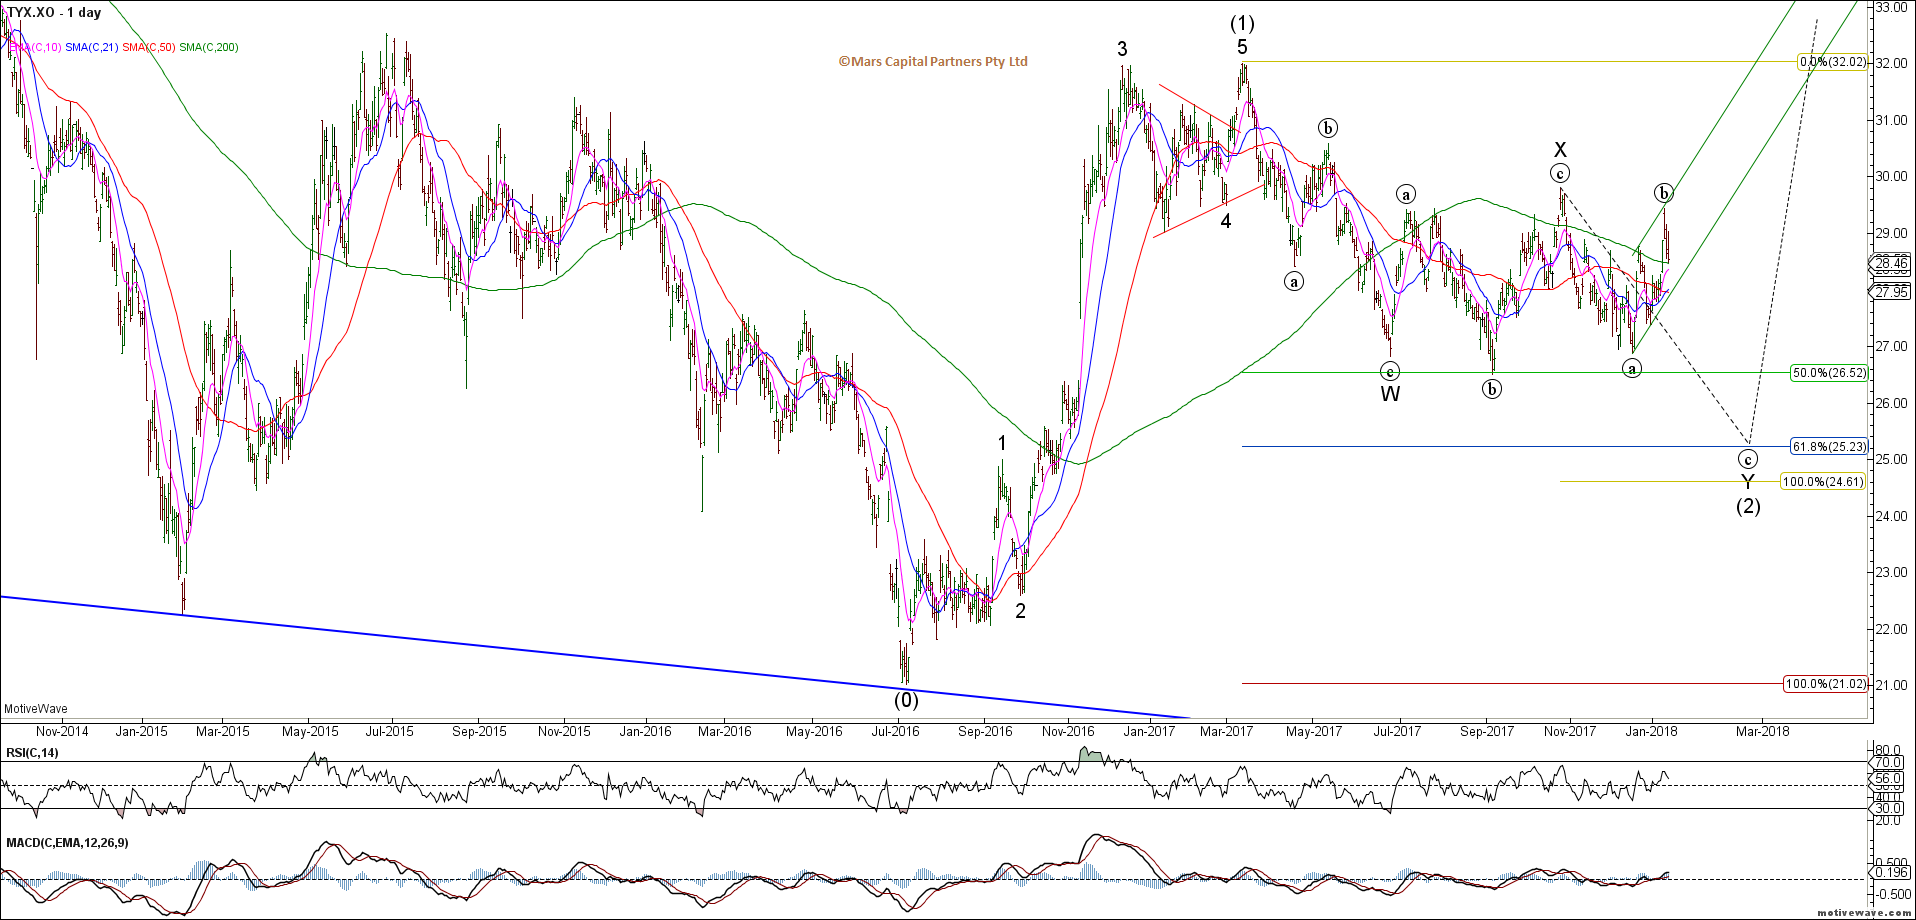
The 30yr highlights the muted rally from the September 2017 lows and impulsive decline from the wave C highs consistent with a more bearish outlook.
TYX Bear Case WeeklyTYX Bull Case Weekly
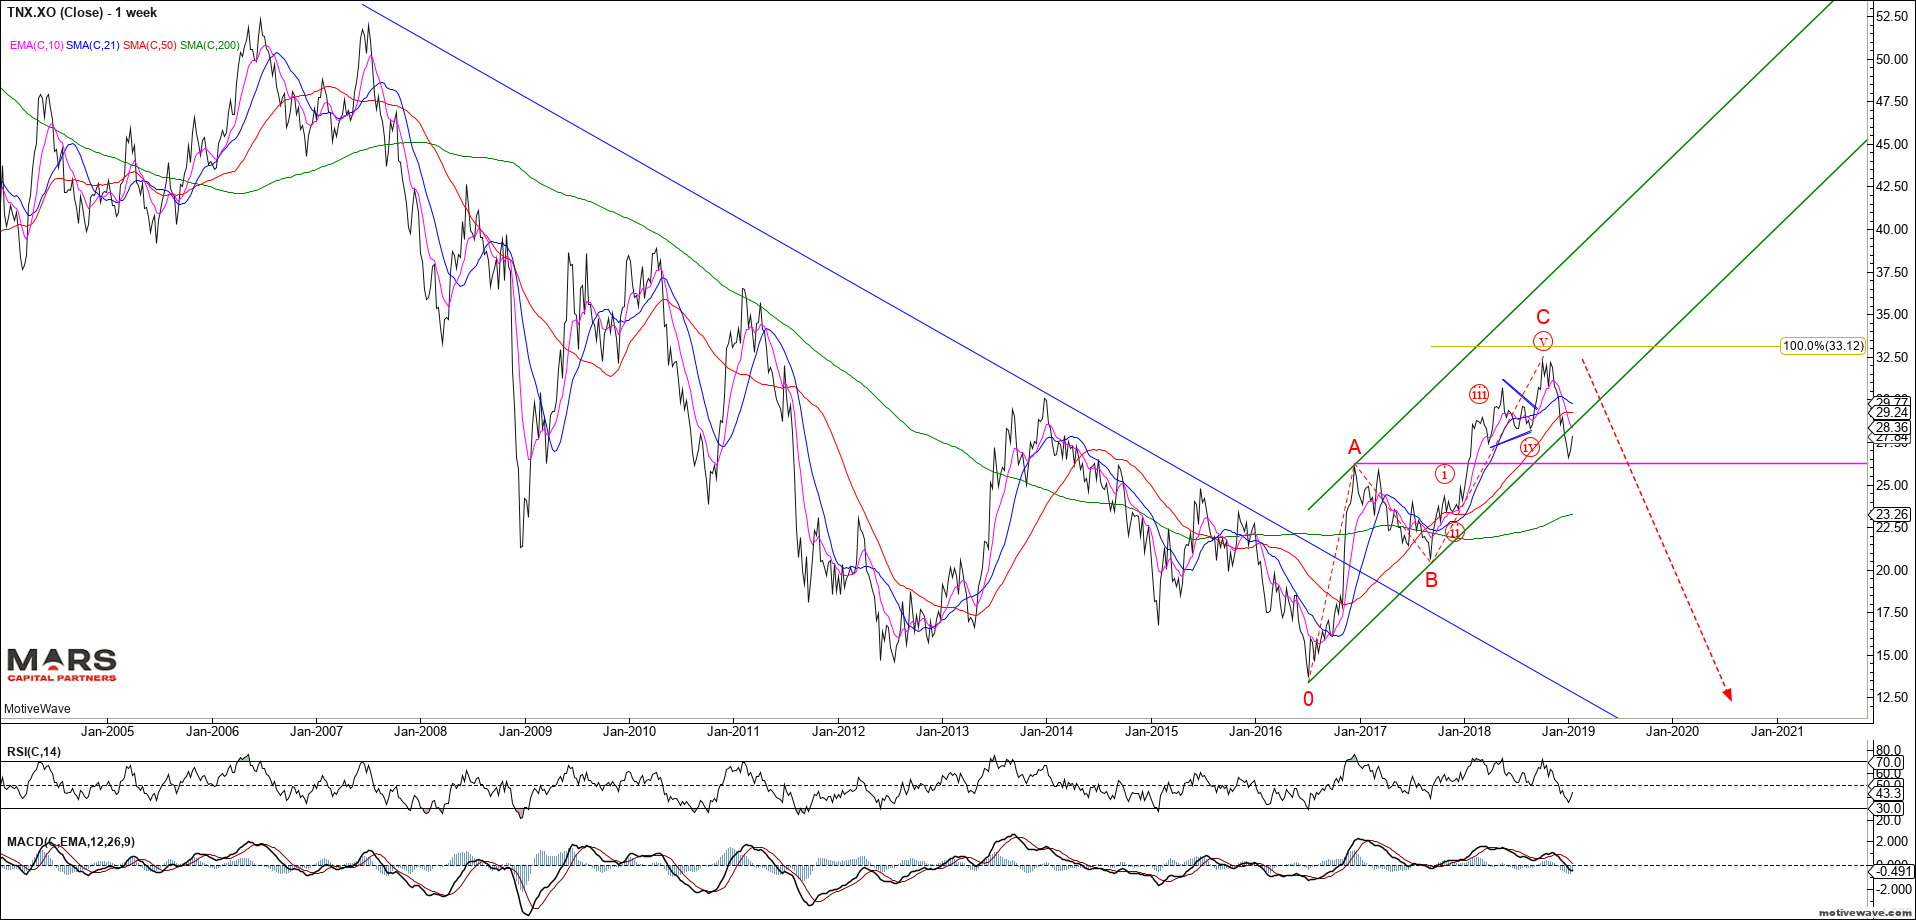
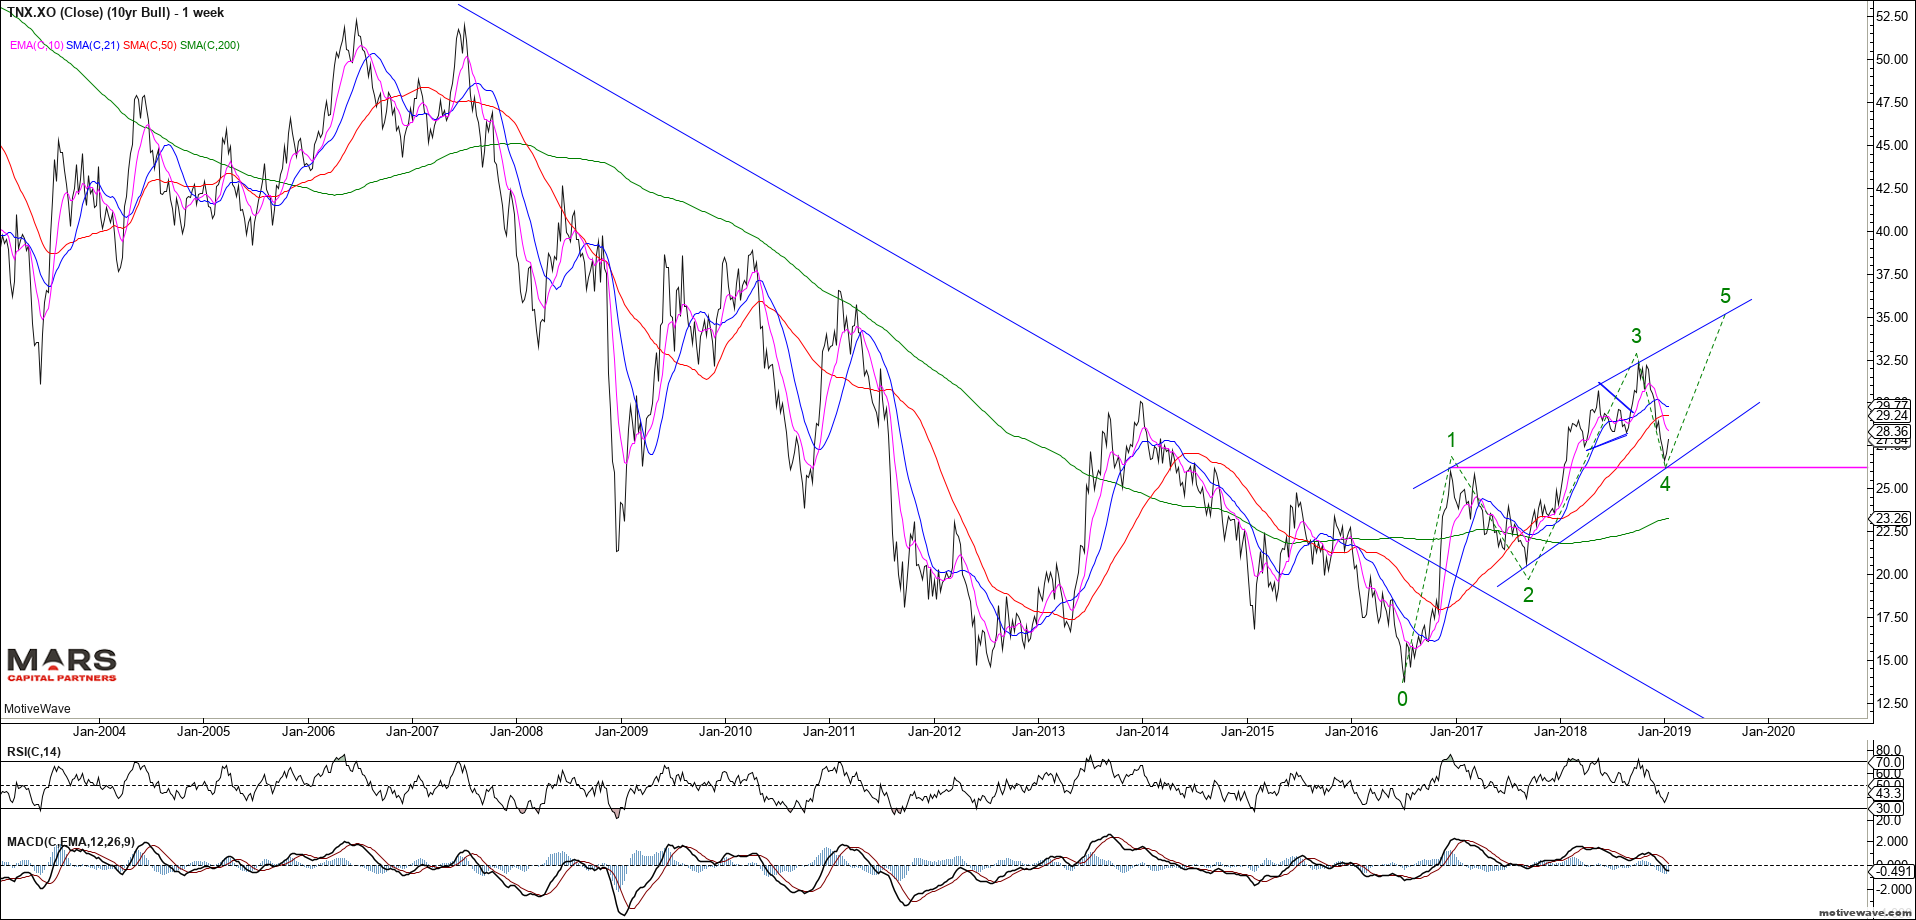
The 10yr shows the same potential wave counts with 3 waves up of equality from the July 2016 lows. A strong close below 2.60 would be consistent with the more bearish rates outlook. The bearish count is wrong at new cycle highs which would indicate the bigger picture trend had turned UP for the long term.
TNX Bear Case WeeklyTNX Bull Case Weekly
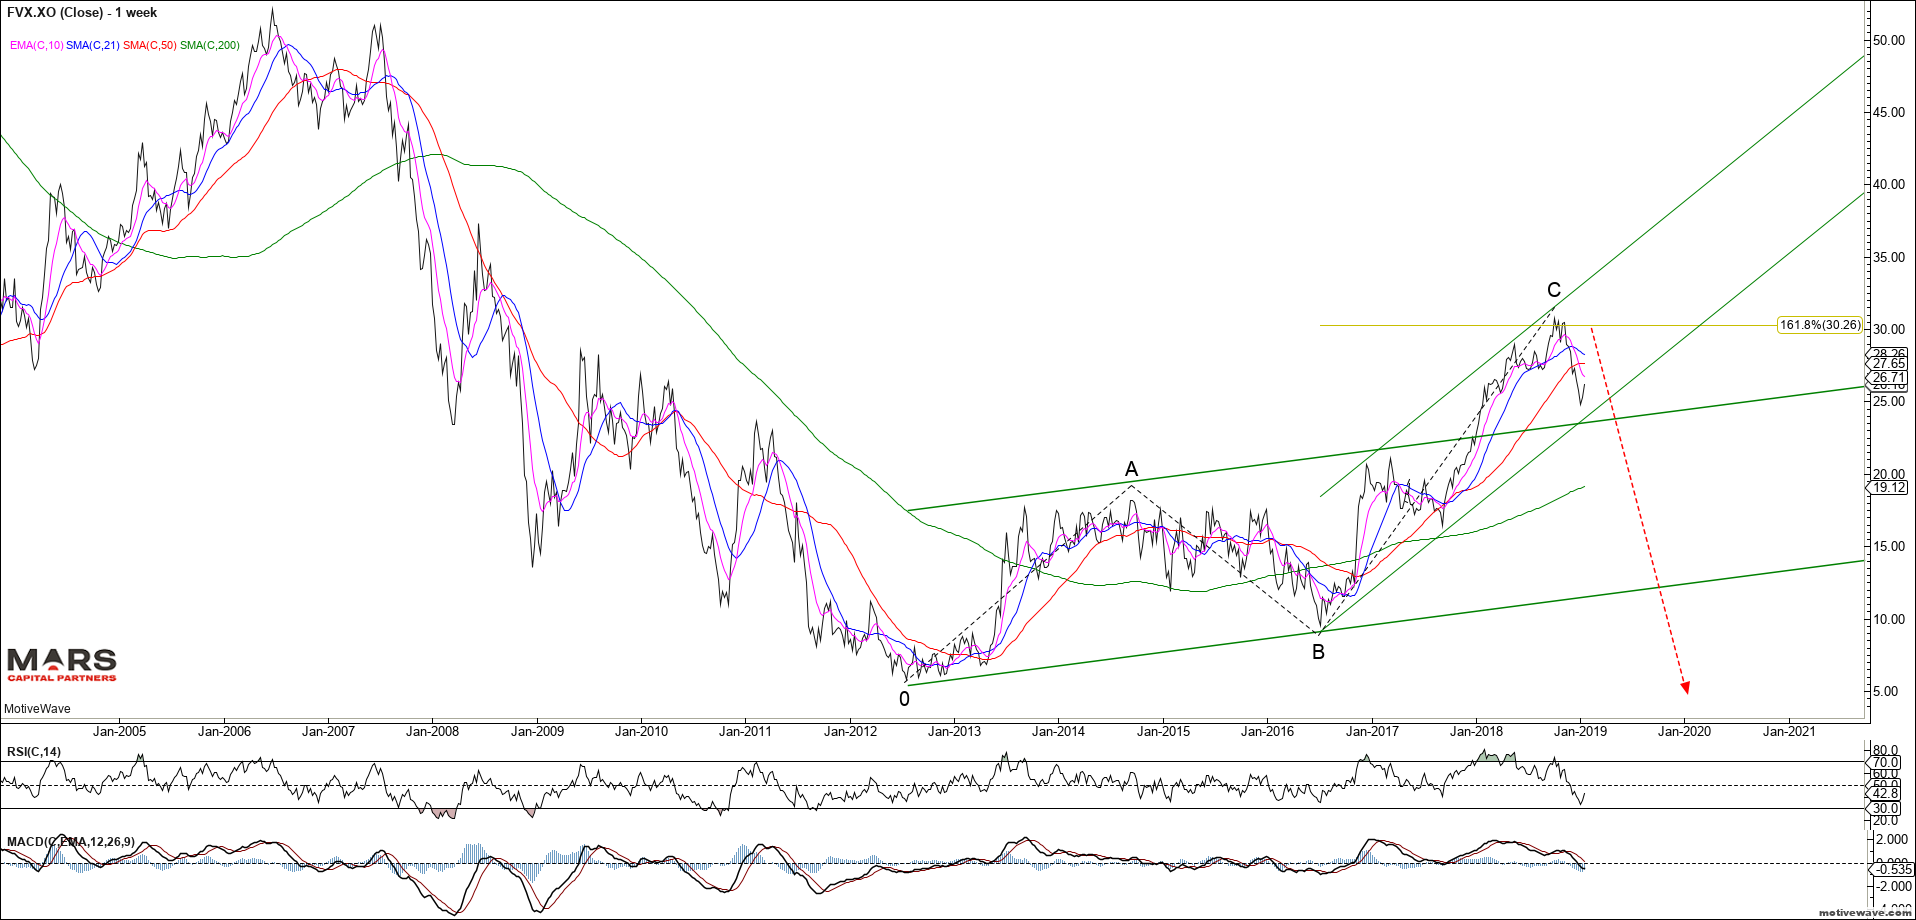
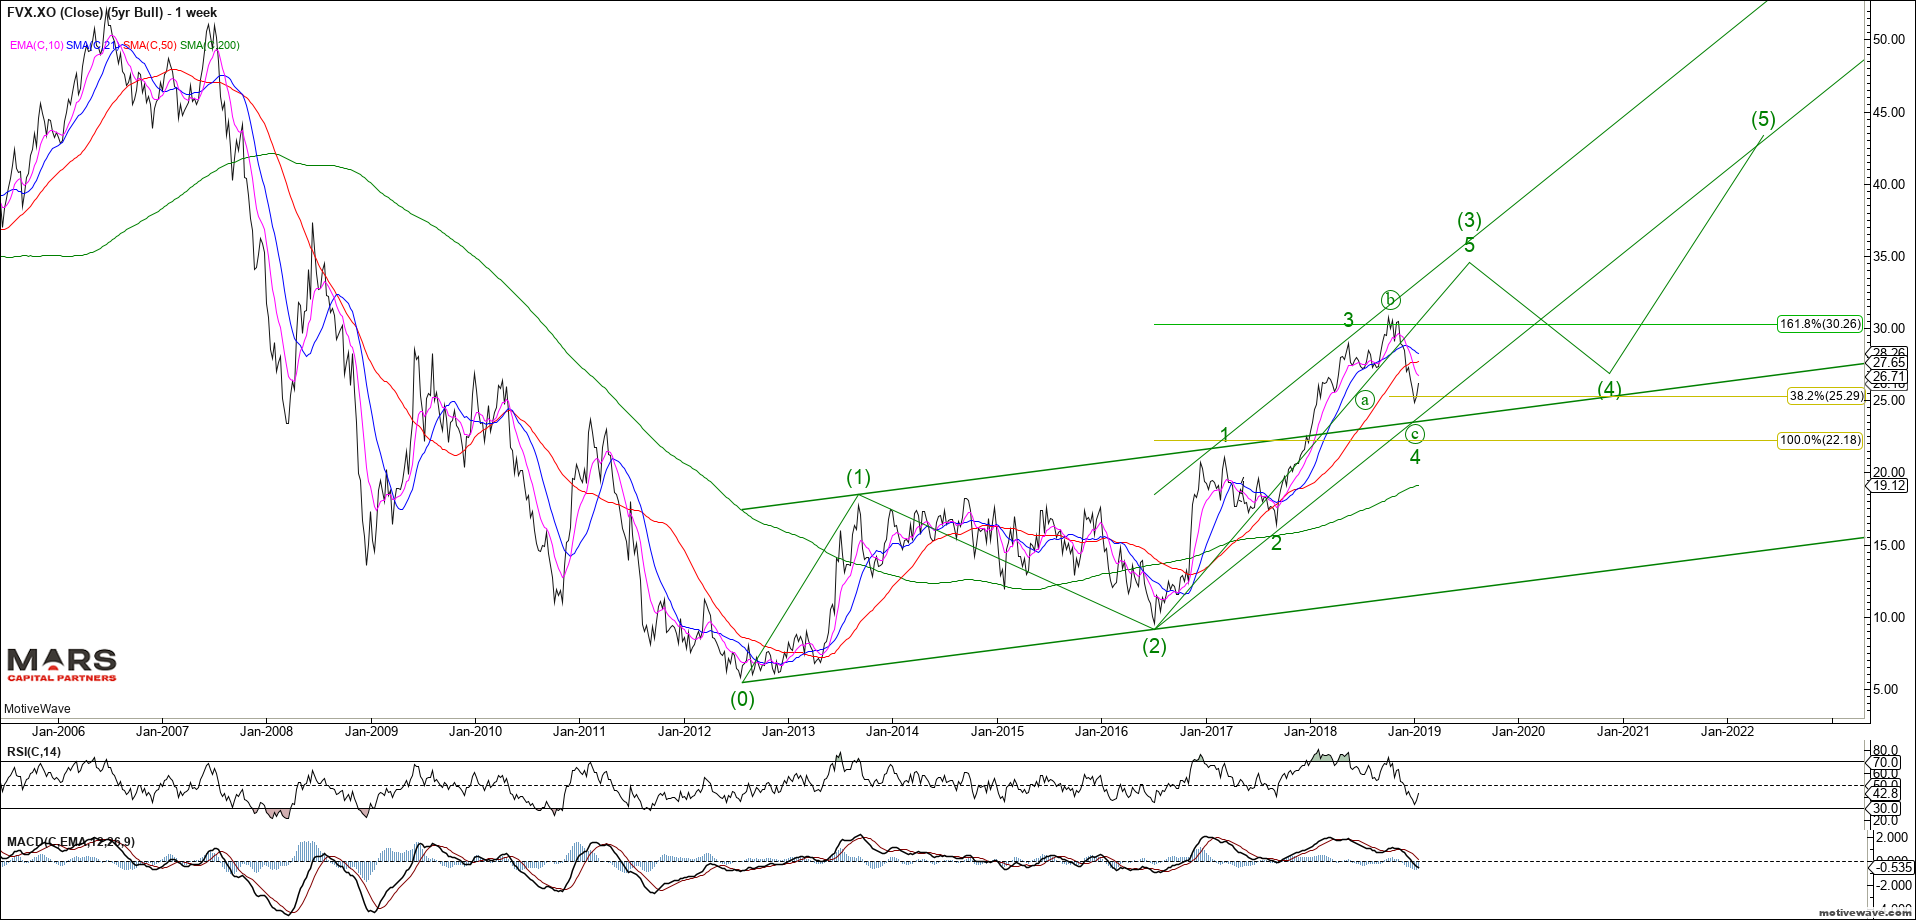
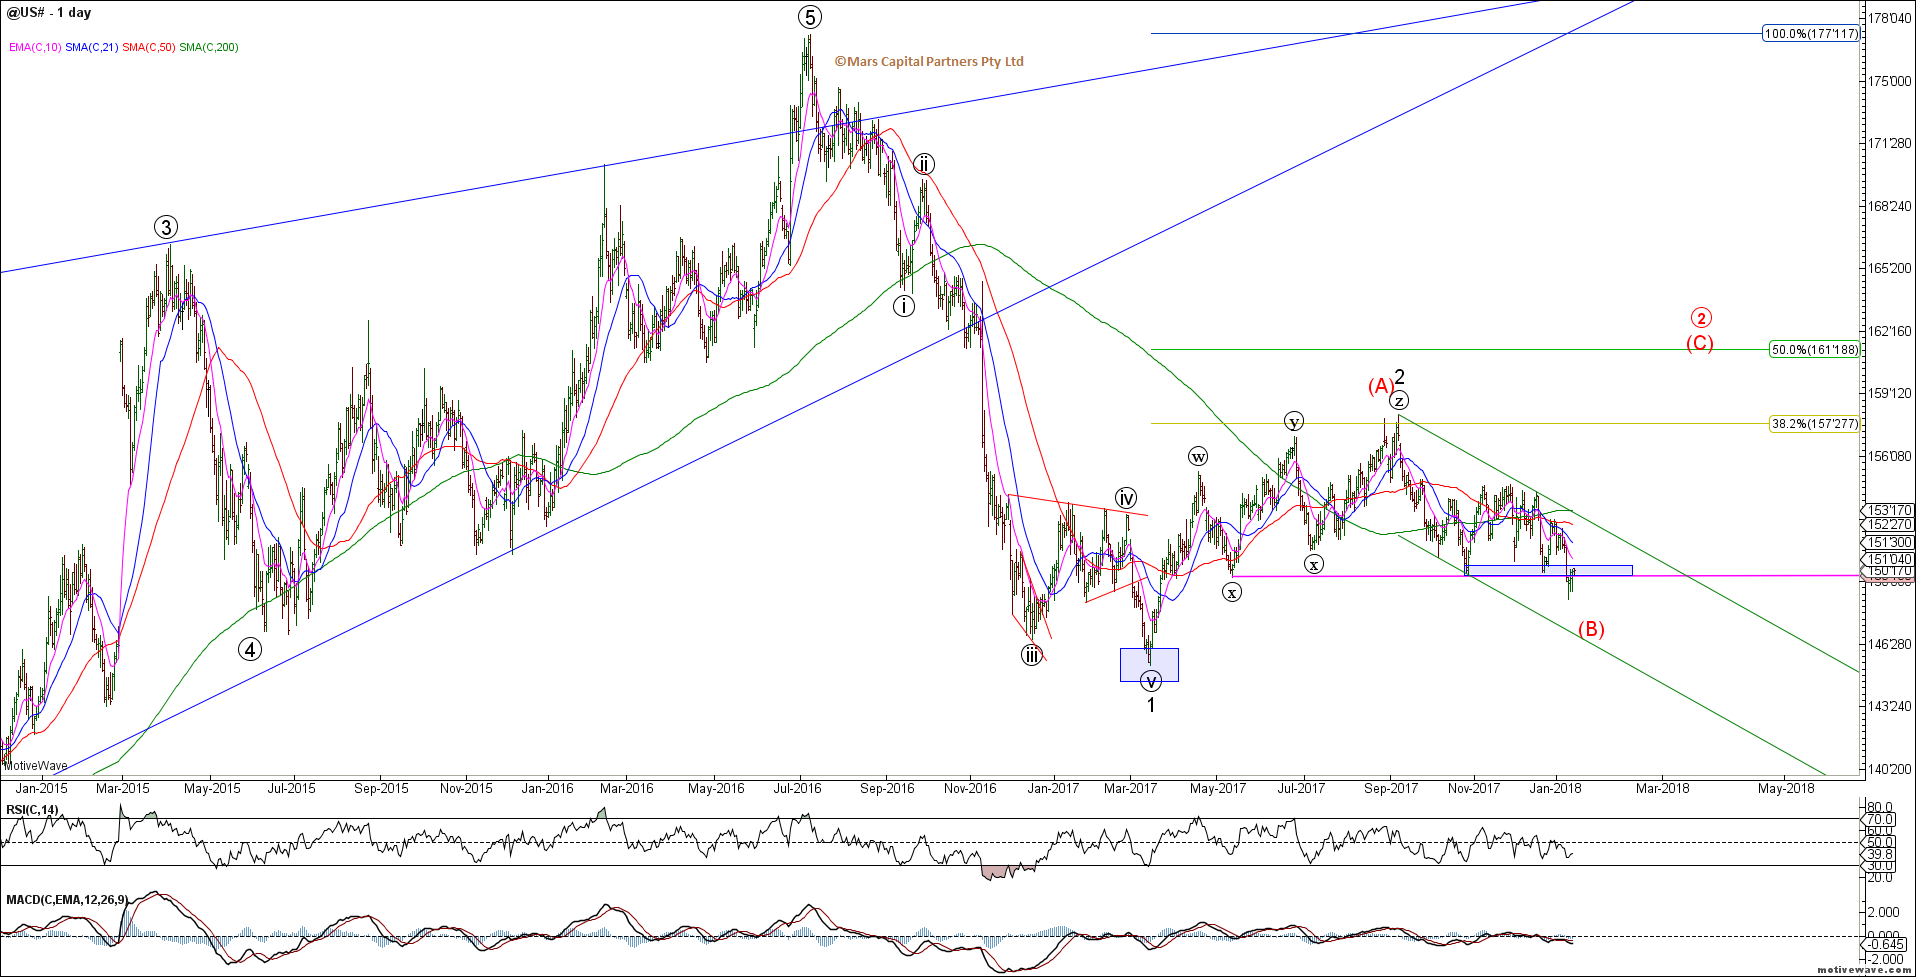
The 5yr is more complicated as the rally in rates failed at our 161.8% Fib extension followed by an impulsive decline. Rate Bears have control while we remain below the September highs.
FVX Bear Case WeeklyFVX Bull Case Weekly
The bond futures tell the same story. The ZB shows a corrective 3 waves down from the ATH’s. This structure remains very bullish bonds while the October cycle lows hold. Ideal buying levels are closer towards 141-142’20 against cycle lows.
ZB Daily
The ZN (TY) shows the same structure with 3 waves down from ATH’s and an impulsive rally from the lows. This implies that the bigger picture trend is up for bonds with support in the 119’23-120’15 area. Trade below the October lows would invalidate the bearish count.
ZN (TY) Daily
To the FX markets and the US dollar strength continues. We remain bullish the DXY looking for a retest of the 2017 highs. The question is whether we rally immediately while holding recent wave (ii) lows (blue count) or we need a deeper correction towards the 92-93 area (red count) before the wave C higher can reassert itself.
DXY WeeklyDXY Daily
The Euro shows the same structure having turned down from our initial 1.16 resistance as we target a break of 1.12 that should lead to a retest of the 2017 lows. The alternate green count requires a push higher towards 1.19-1.20 before the bear trend can reassert itself. We remain bearish the Euro.
EURUSD WeeklyEURUSD Daily
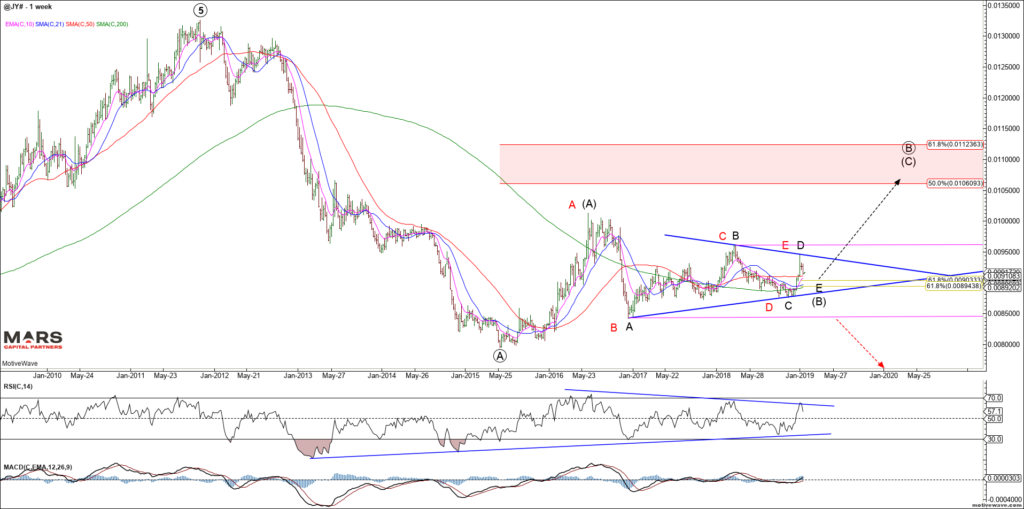
The Yen remains trapped within its triangle consolidation since its 2015 lows. Note the compression in the weekly RSI below. Despite historic levels of QE and asset purchases, the BOJ hasn’t been able to move the needle on the Yen. As we’ve seen many times in the past, volatility compression ultimately leads to volatility expansion. Ideal targets for black wave E of (B) are in the 89.50-90.50 area for the Yen. We expect this triangle to break (likely higher) in early 2019.
Yen Weekly
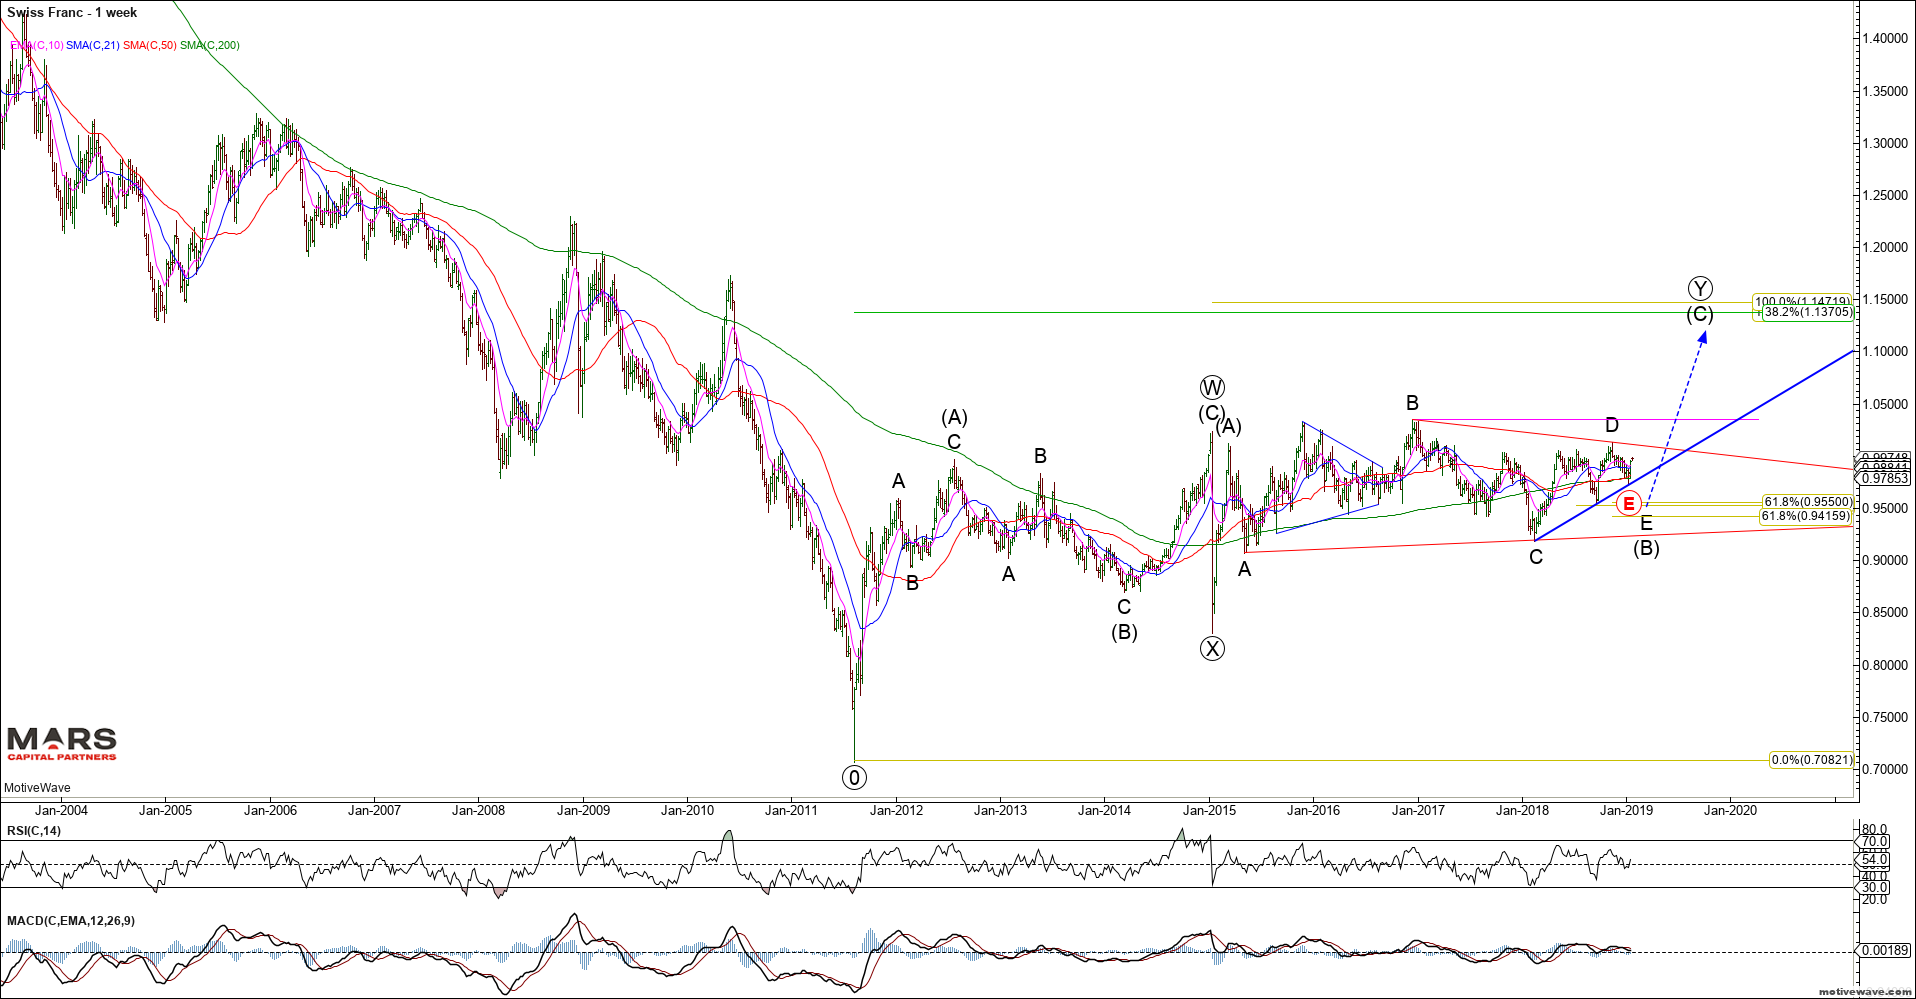
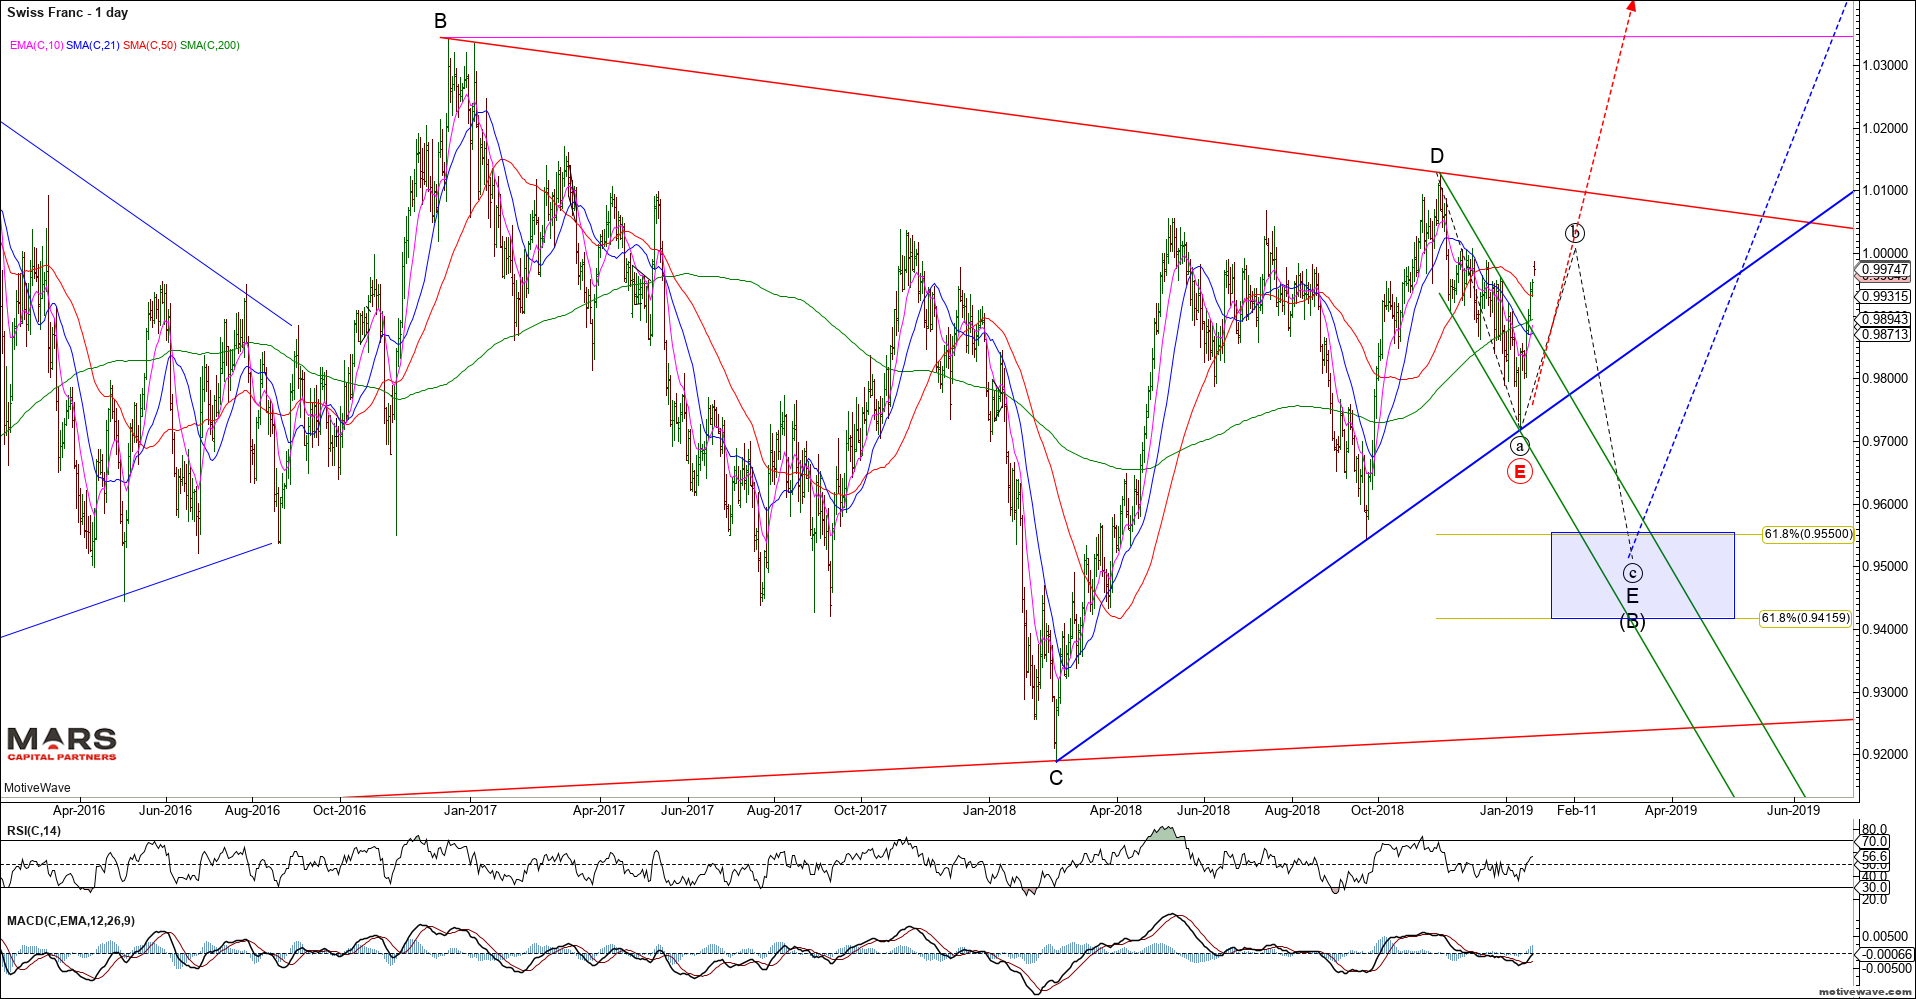
Similarly, we are very bearish the Swiss Franc as we look for a break out of its 8 year consolidation. We are bullish the USDCHF near term against recent swing lows (red E). A break of recent lows targets the 0.94-0.955 secondary support zone from where we would look to get bullish once again.
USDCHF WeeklyUSDCHF Daily
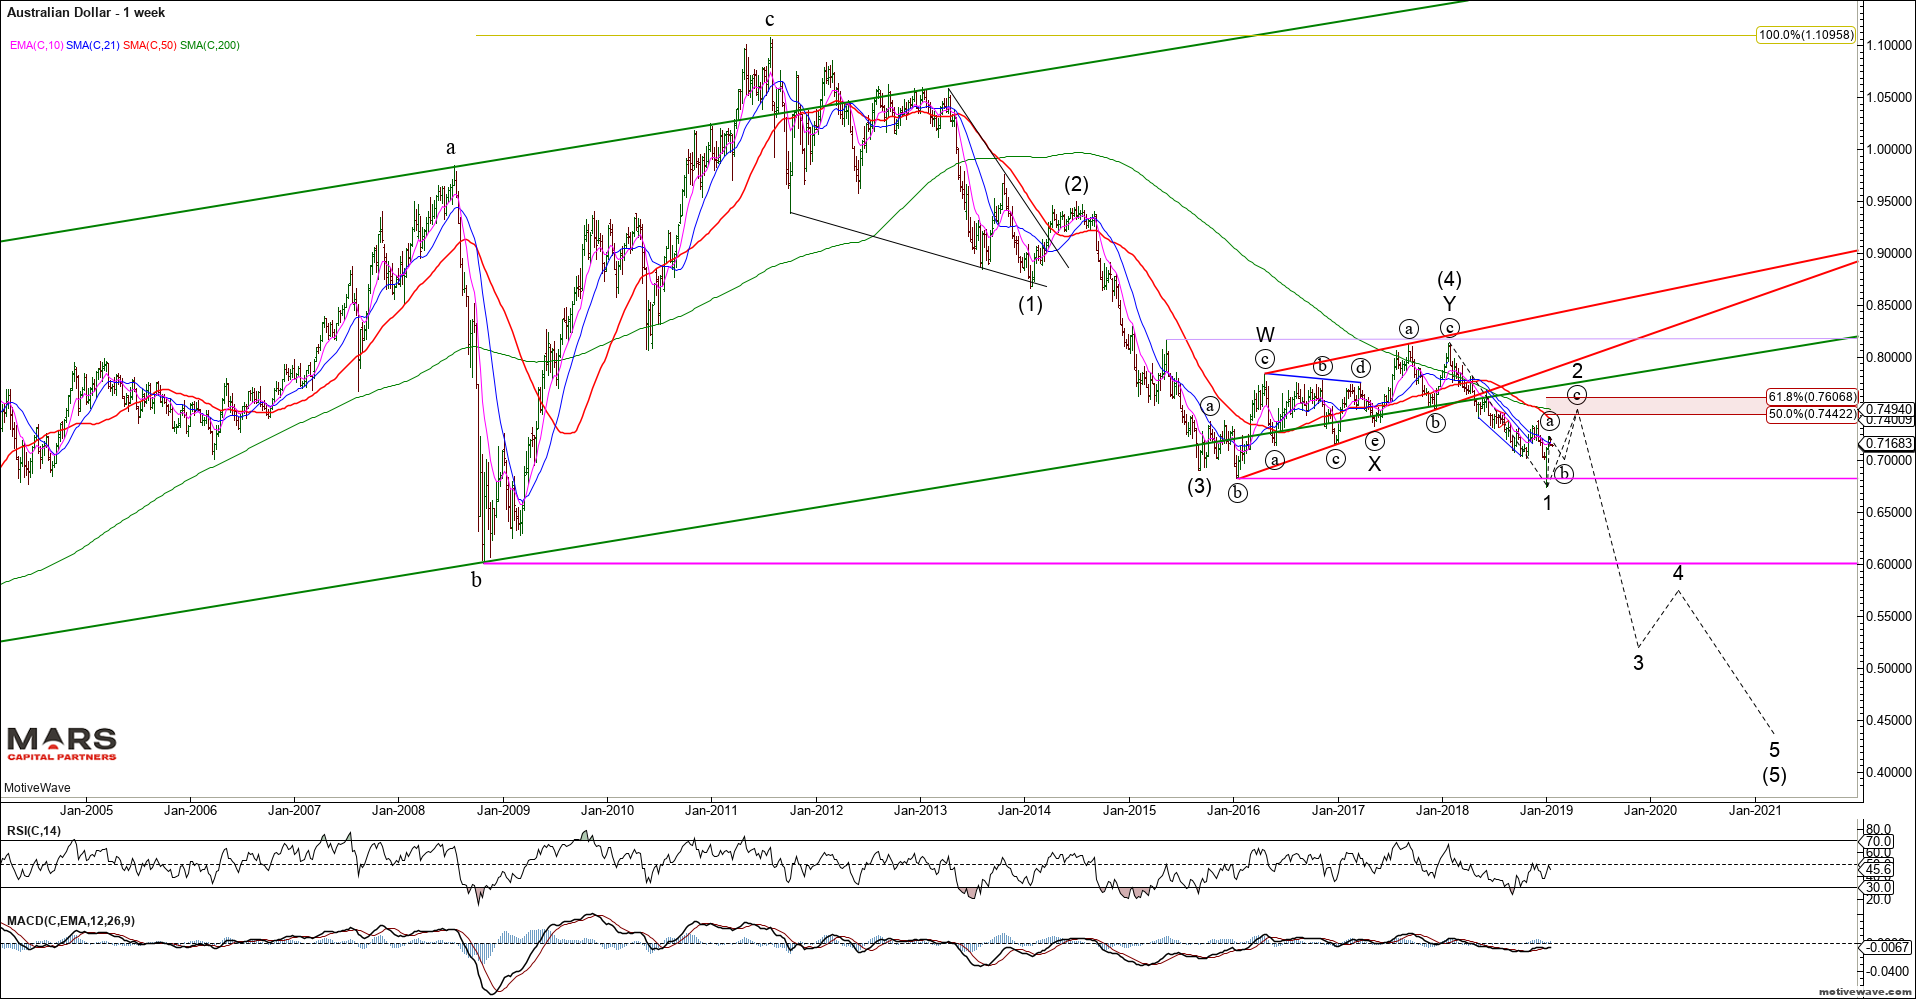
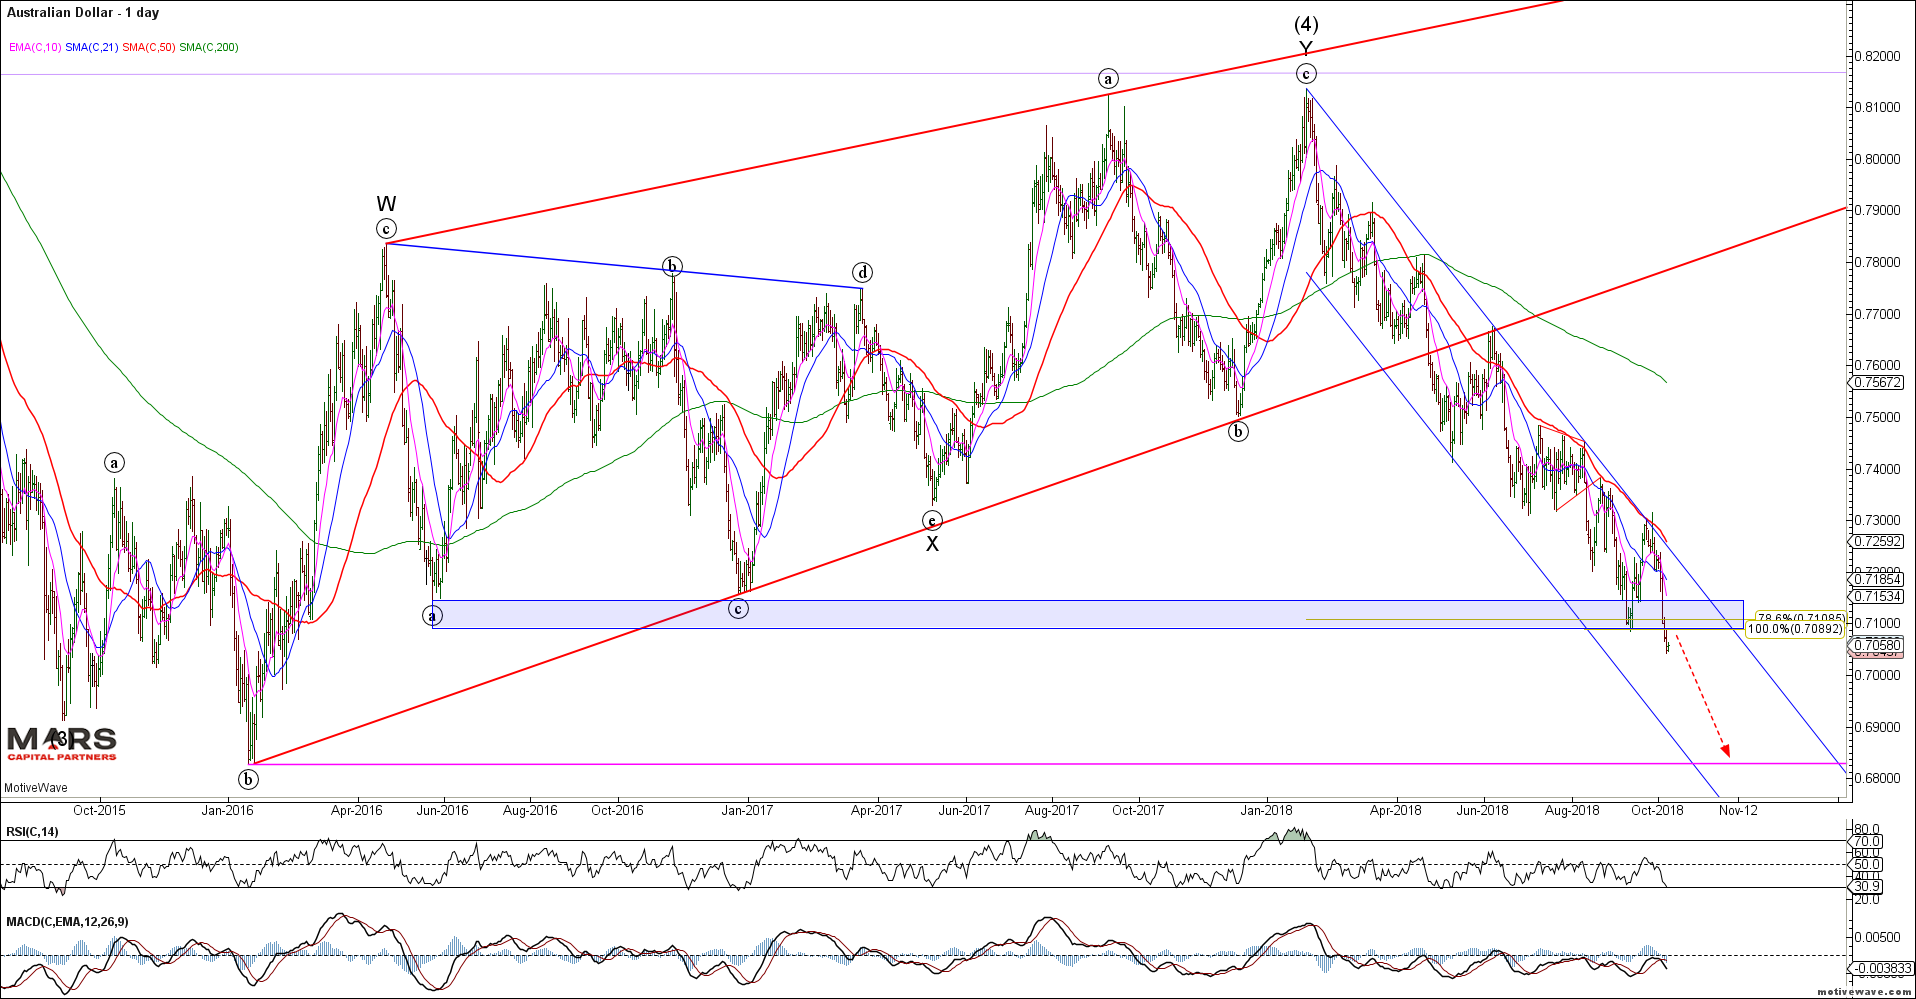
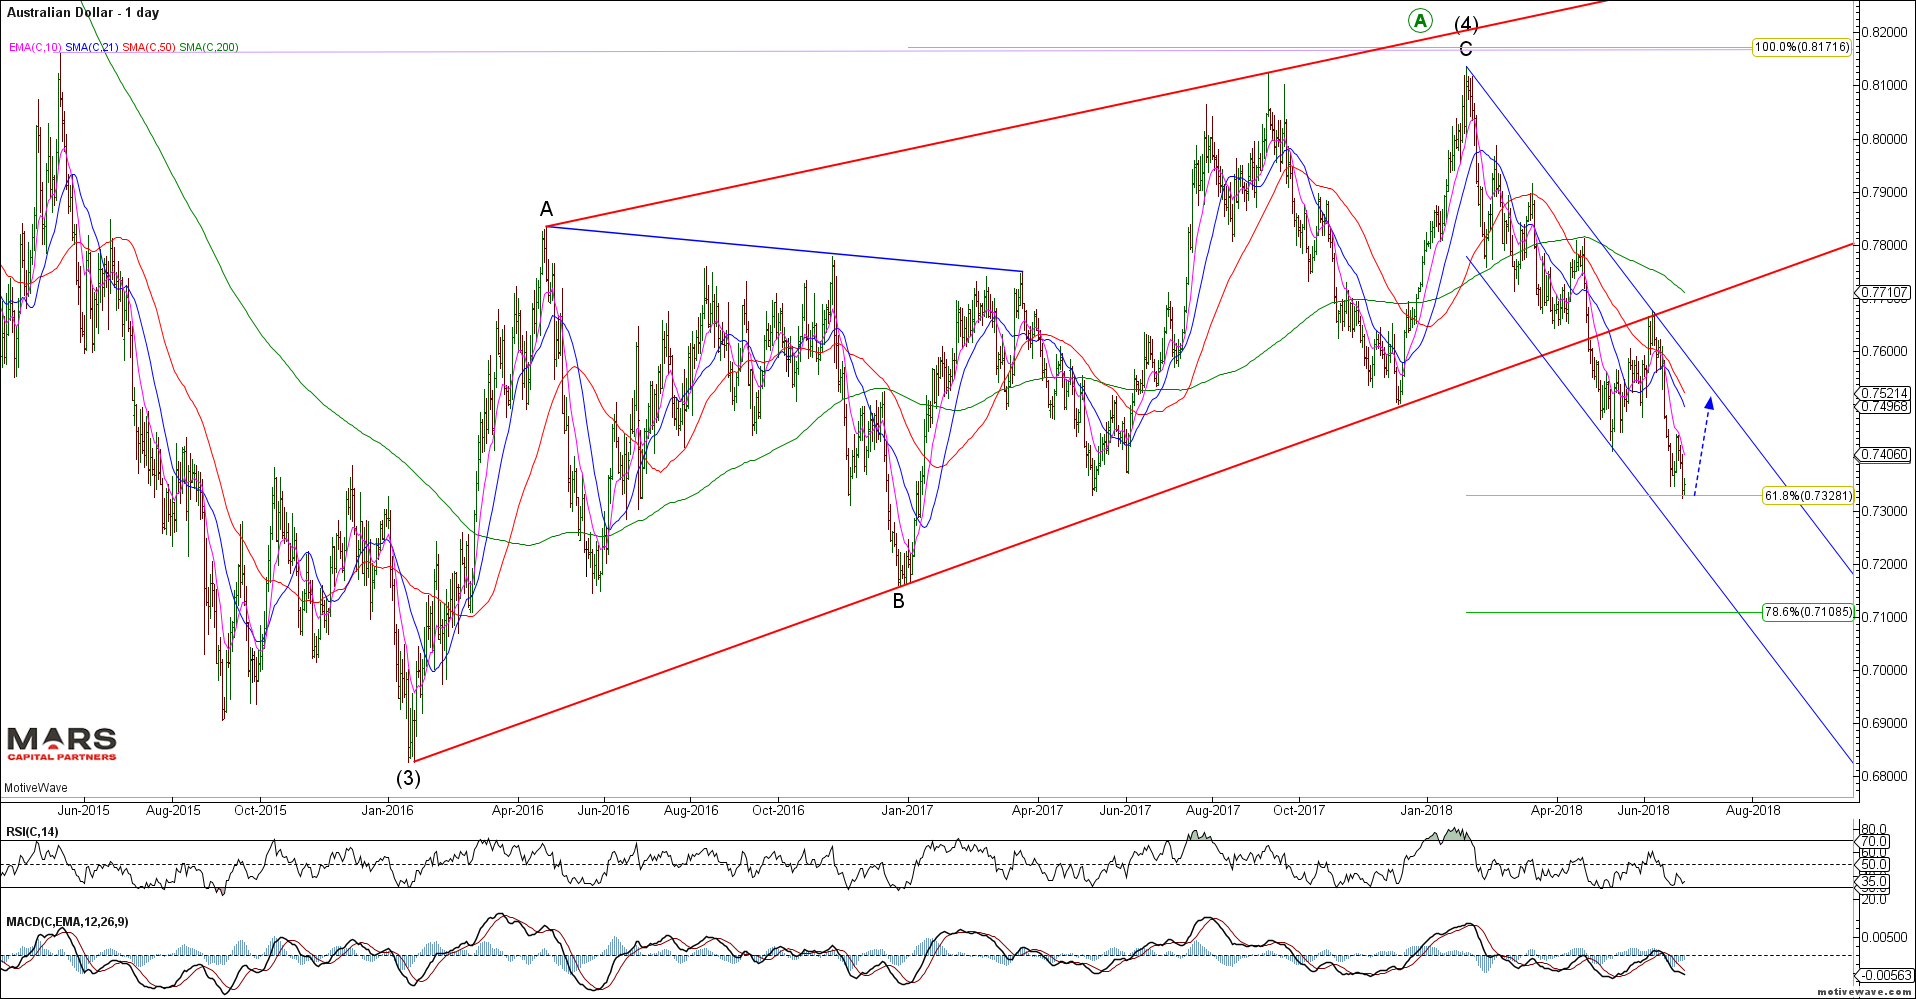
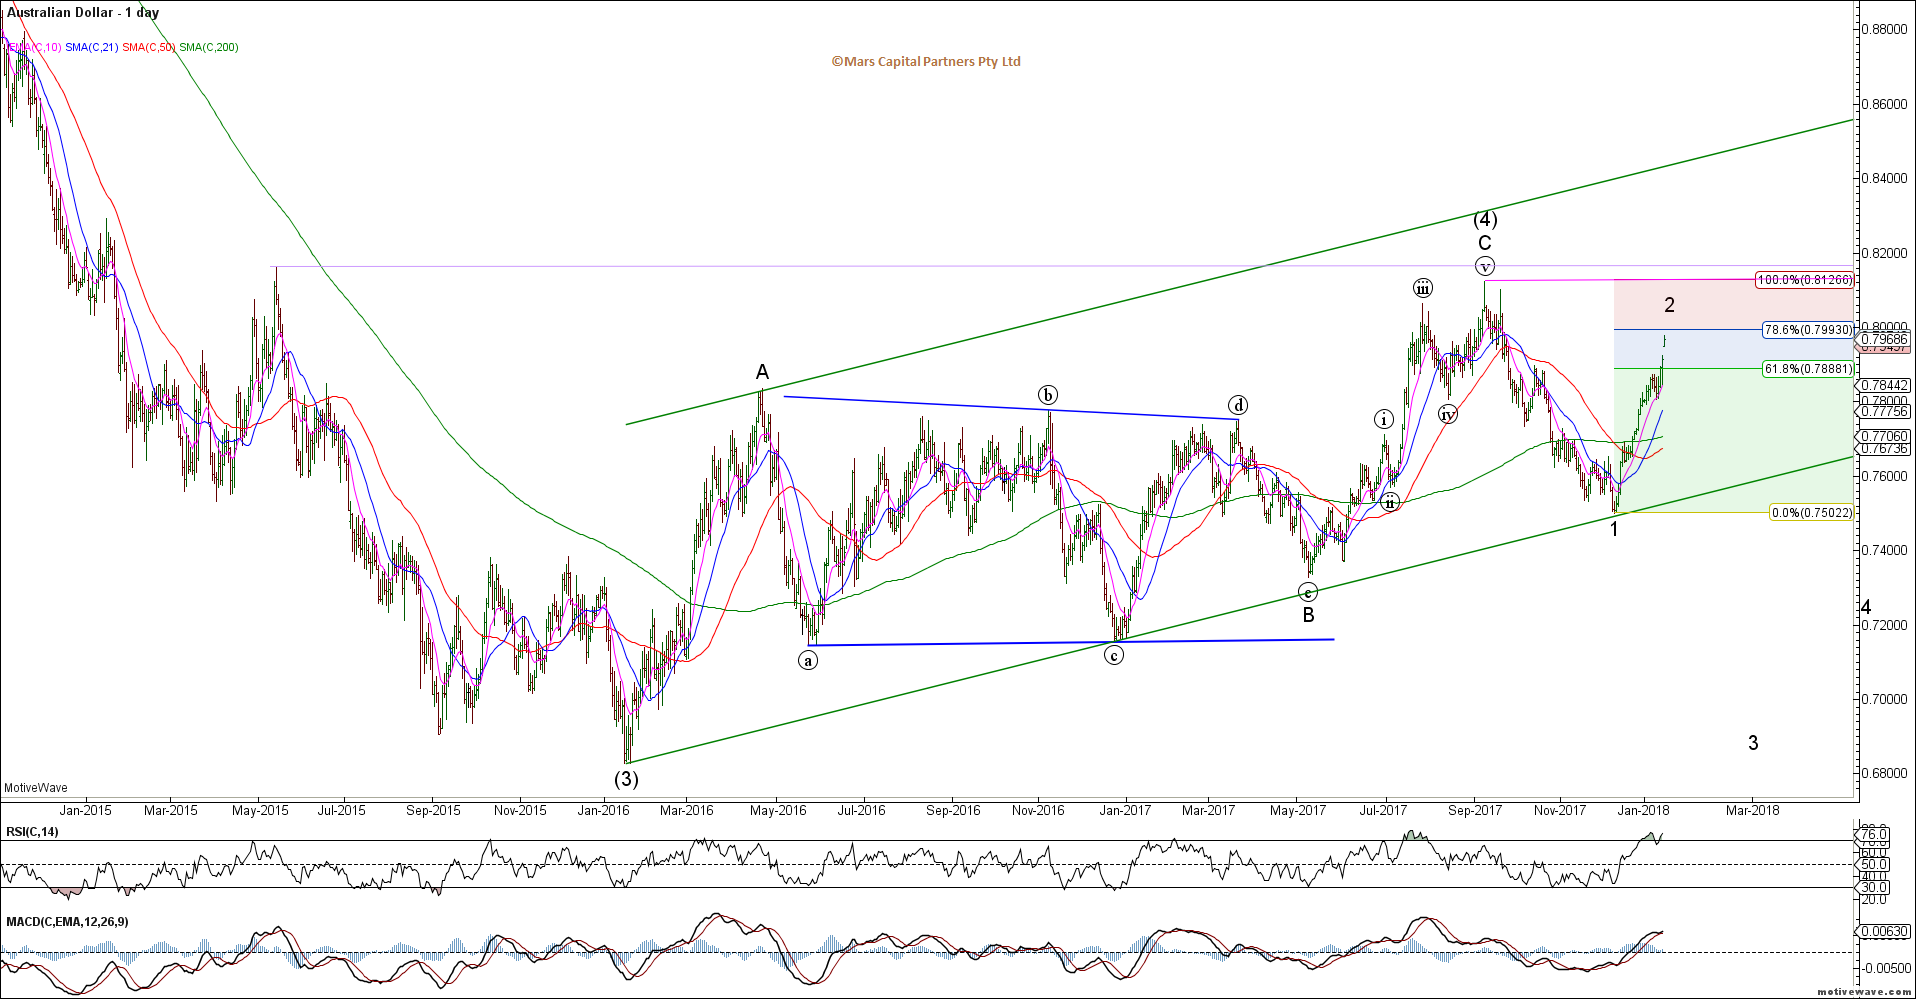
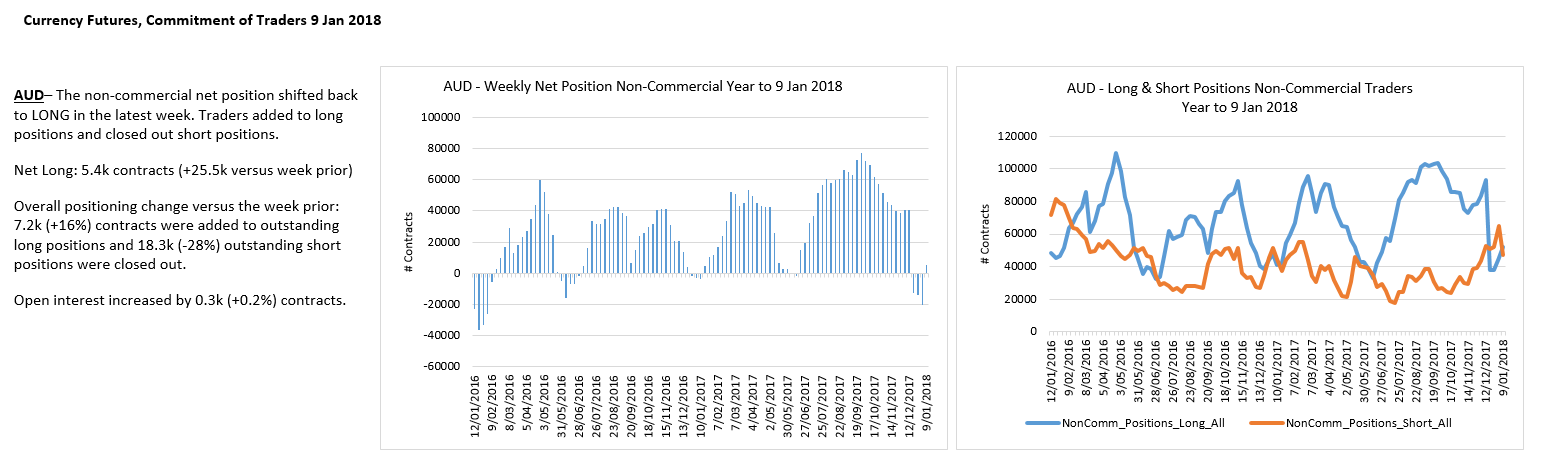
The Aussie dollar has rallied nicely since its flash crash lows. Our upside targets for this counter-trend rally remain higher towards 0.744-0.760 as we look for the bear market to reassert itself. The only thing that is likely to reverse this decline is China Stimulus and trade war resolution. Until these themes change the Aussie$ remains bearish from a big picture perspective.
AUDUSD Weekly
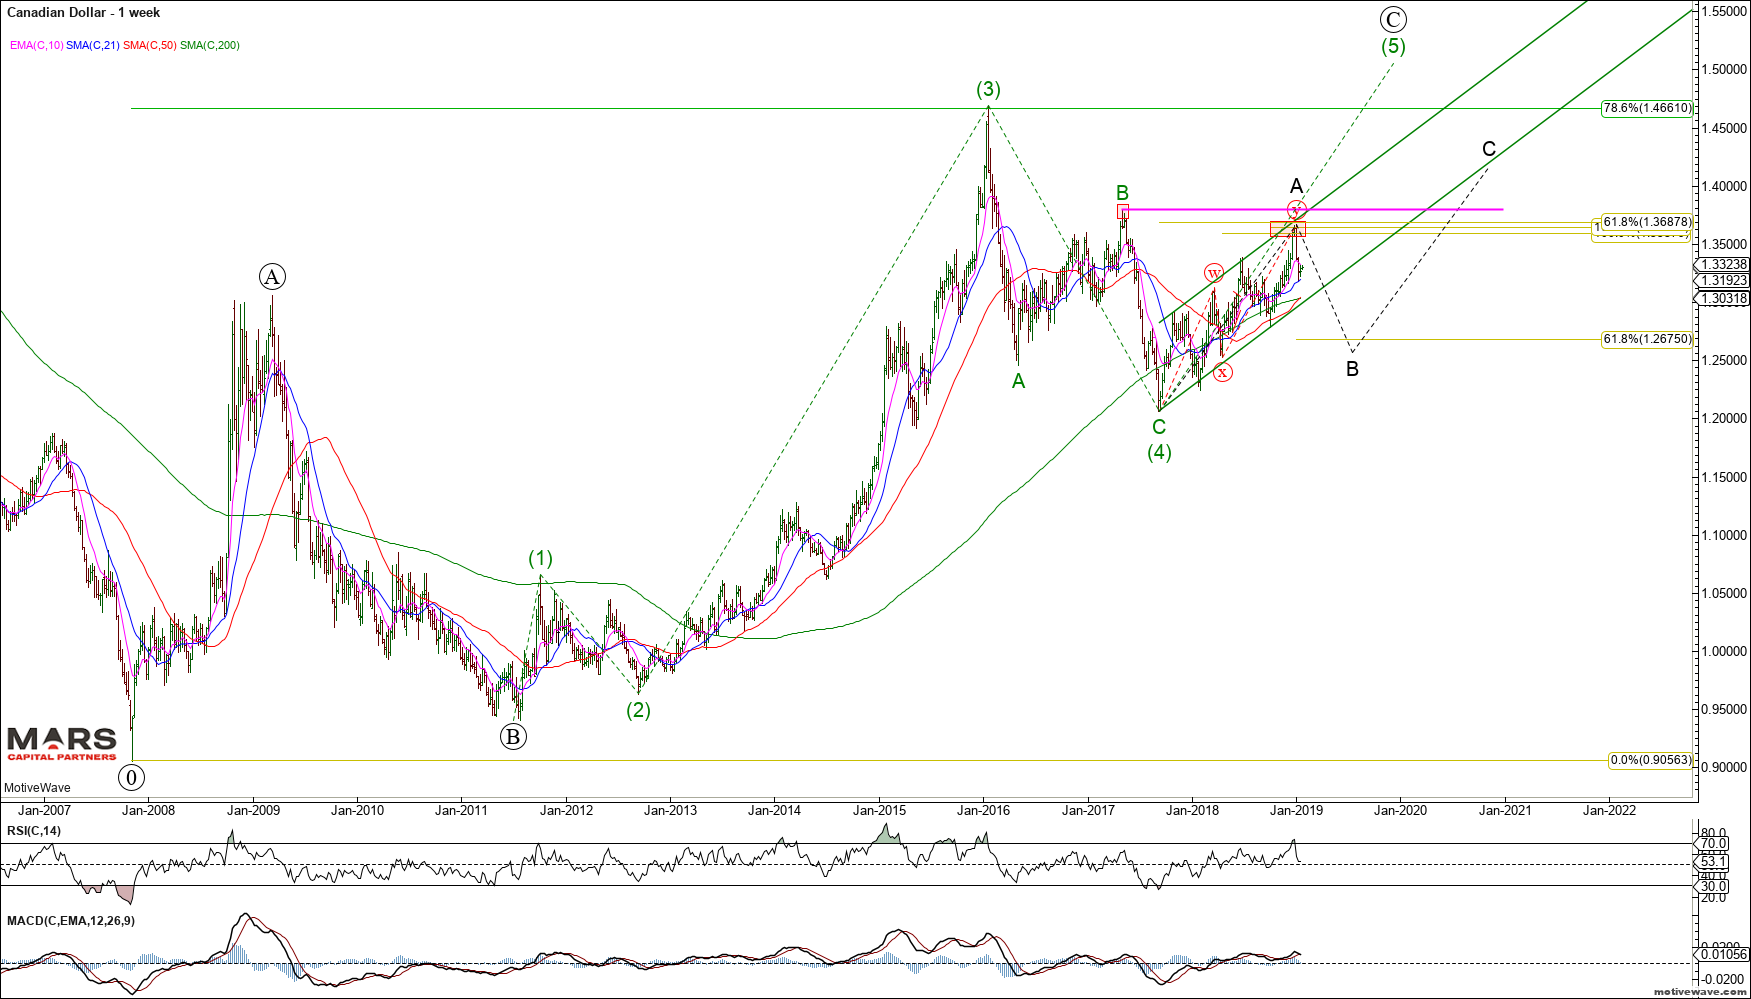
The USDCAD has rallied correctively from the wave C lows in what we expect to be wave A of an A-B-C advance. We are near term bearish against recent swing highs but not with a great deal of confidence. This pair has been range bound since the 2016 highs. With only 3 waves down from the 2016 highs we must assume the decline was corrective and new highs is likely (green count). Trade back above 1.38 will “lock-in” a corrective 3 wave decline implying a push to new multi-year highs.
USDCAD Weekly
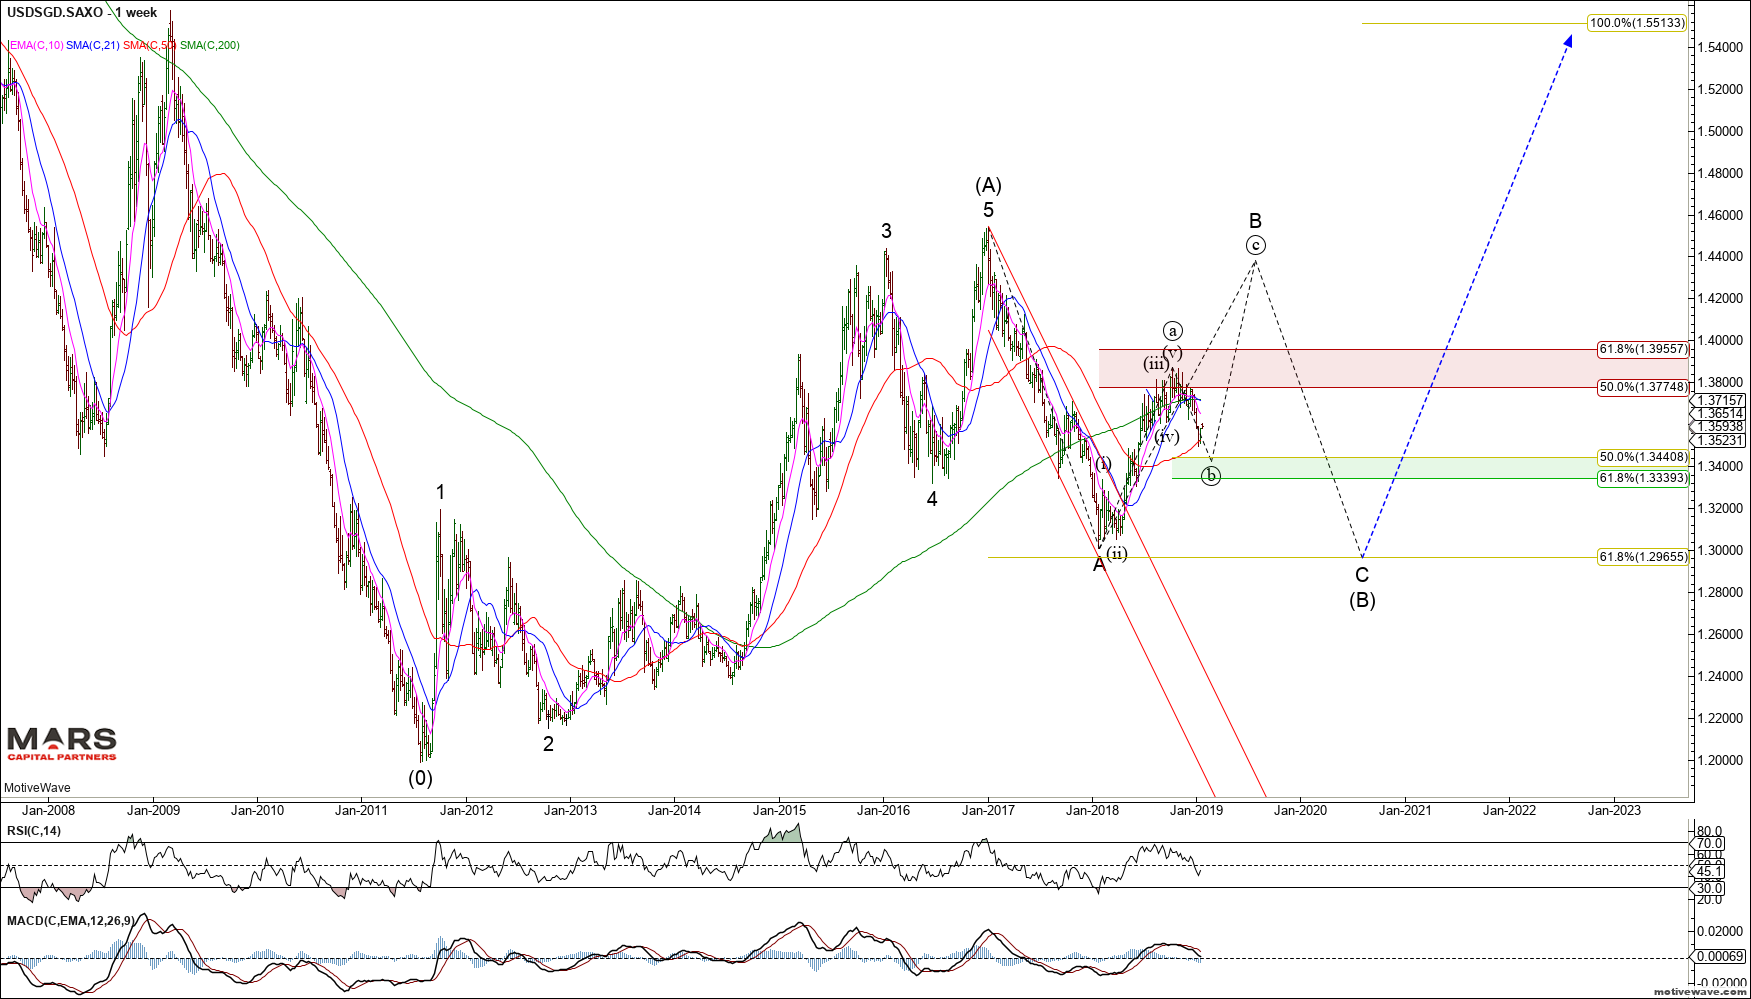
The Singapore Dollar provides the clearest Elliott Wave structure with 5 waves up from the 2011 lows terminating into the 2016 highs. We are looking for evidence of a bullish turn for the USDSGD for wave (c) of B up to retest the 2016 highs. Strong support resides in the 1.334-1.344 area for a turn.
USDSGD Weekly
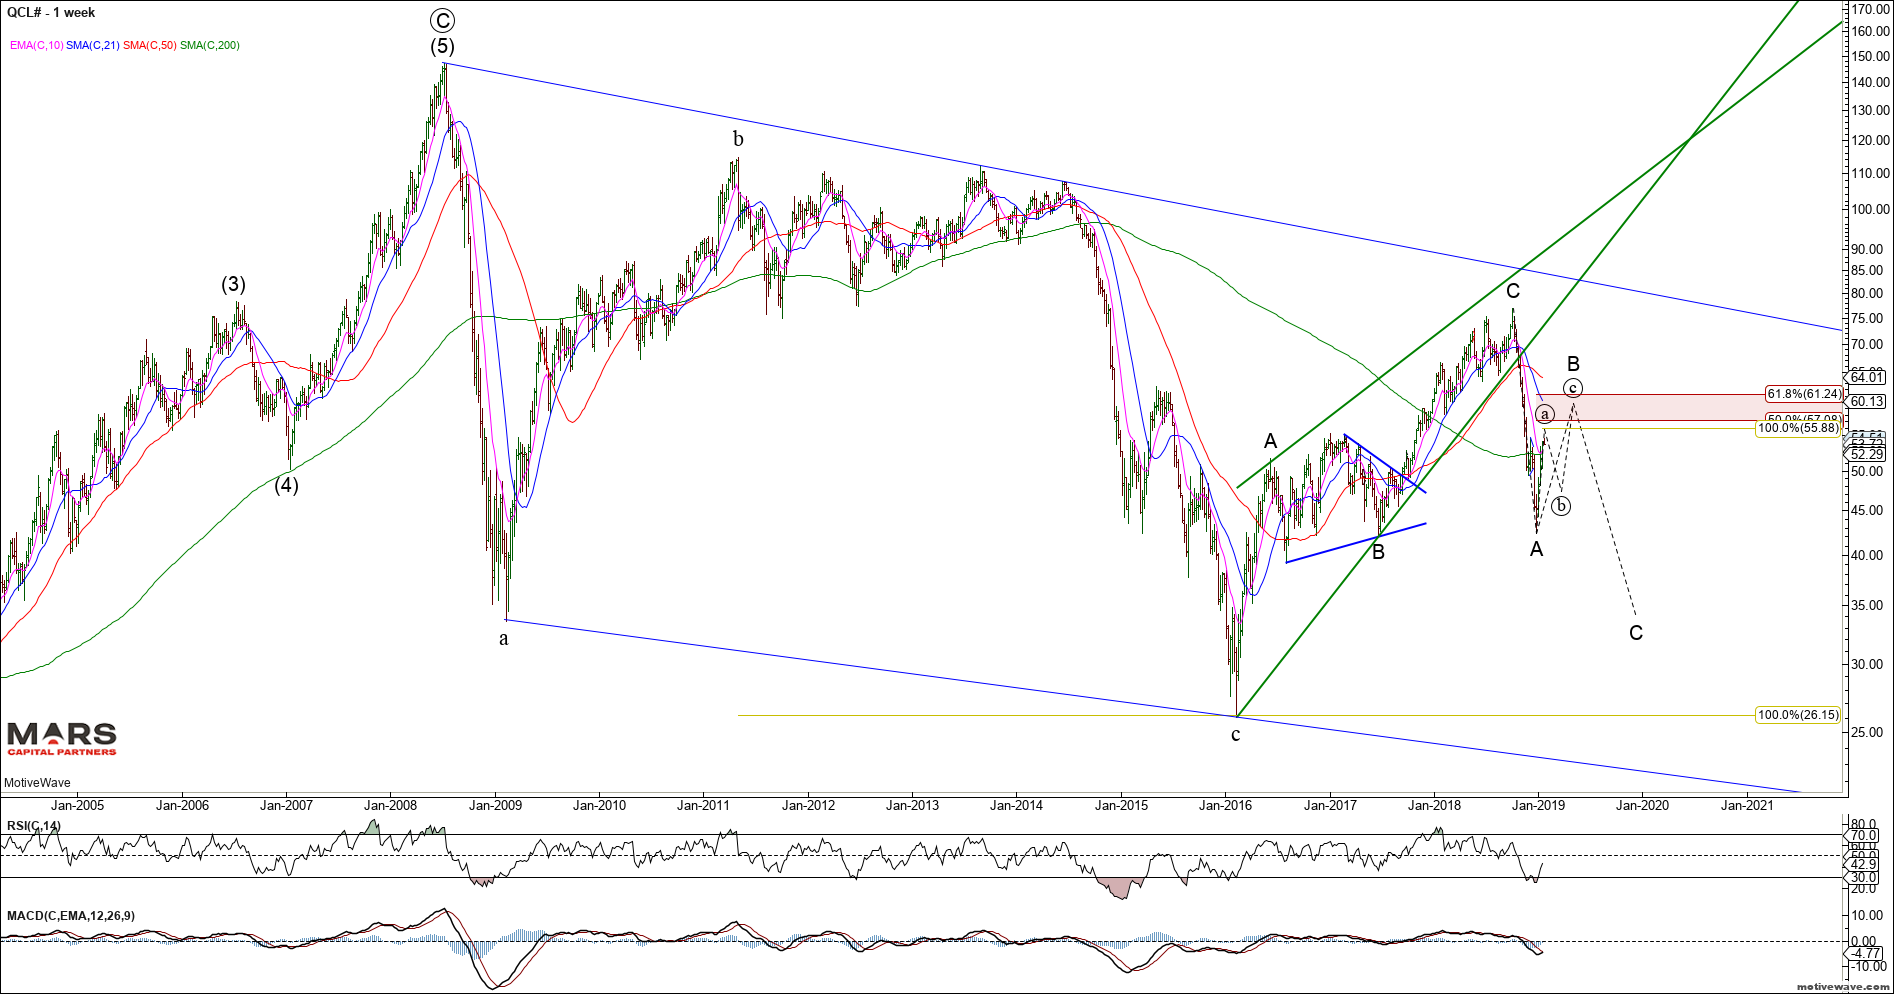
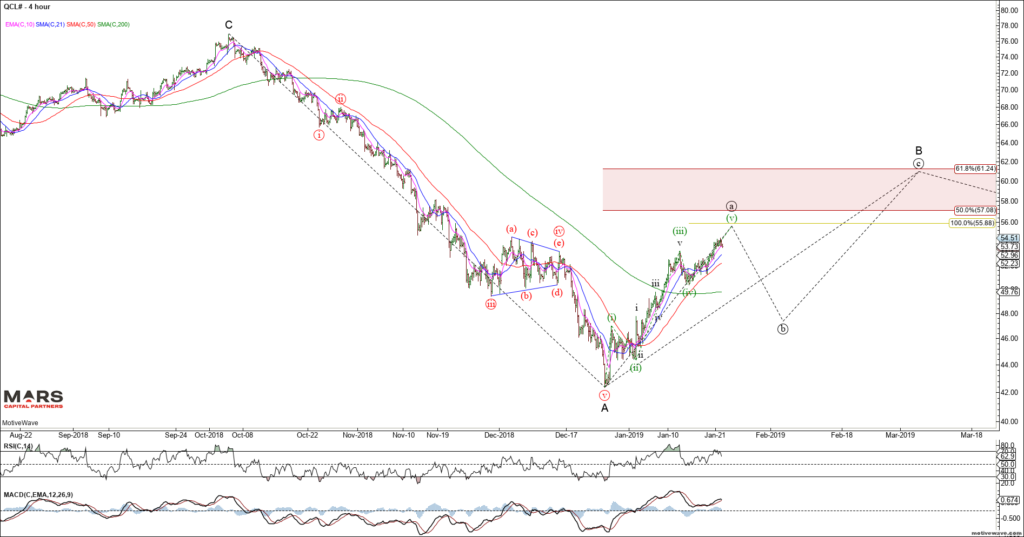
To the commodity markets and Crude Oil has pushed higher in wave (a) in what we expect to be part of a counter-trend rally. We expect this rally to be part of a larger wave B correction before wave C down. Ideal wave (c) of B targets remain in the $61 area. The rally off the 2016 lows is clearly corrective in 3 waves. The decline for the September 2018 highs is clearly impulsive so we would expect another wave lower of similar magnitude. We remain bearish CL from a bigger picture perspective.
CL Weekly
Near term, the recent CL rally from the low is clearly impulsive and likely only wave (a) of an a-b-c correction higher. Ideal upside targets for wave (a) are 56-57.
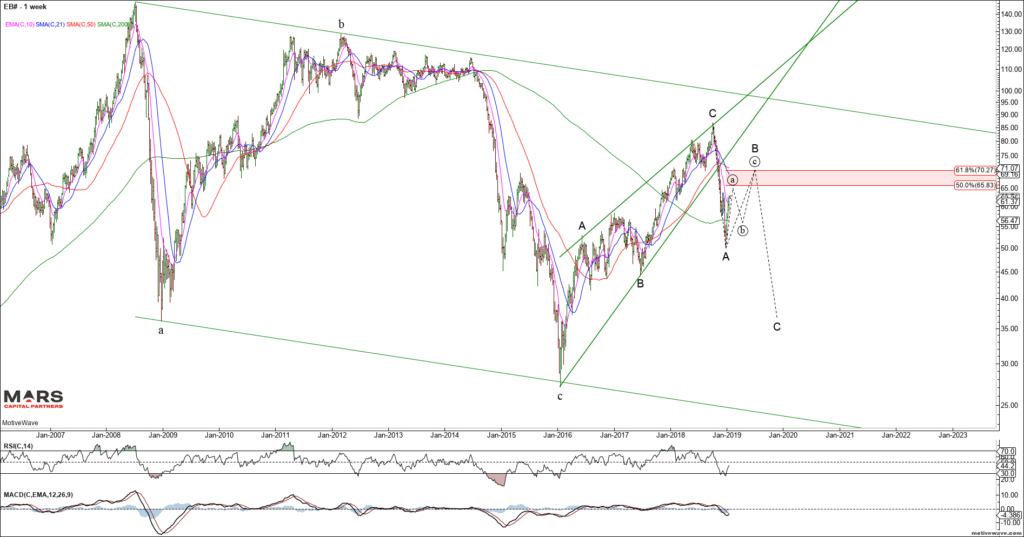
Brent Crude shows the same overall structure as we appear to be completing wave (a) of an a-b-c rally for B in the $70 area before wave C down commences.
Brent Crude Weekly
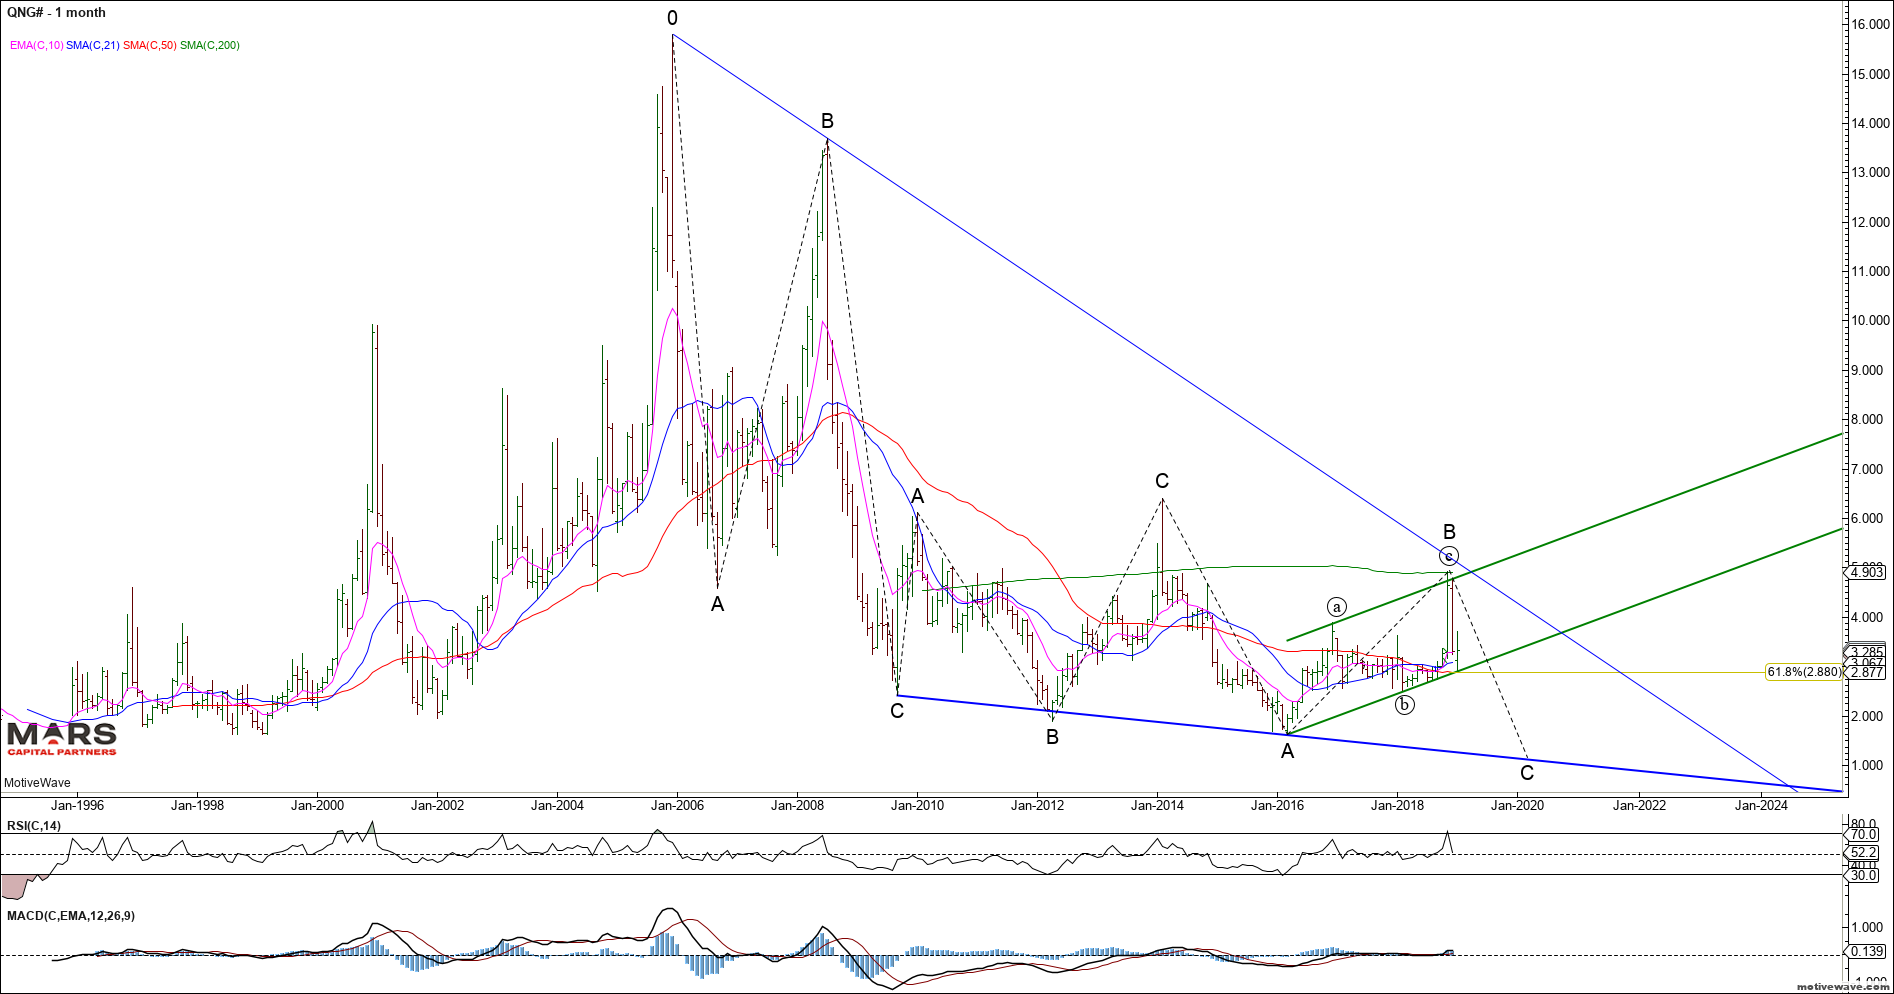
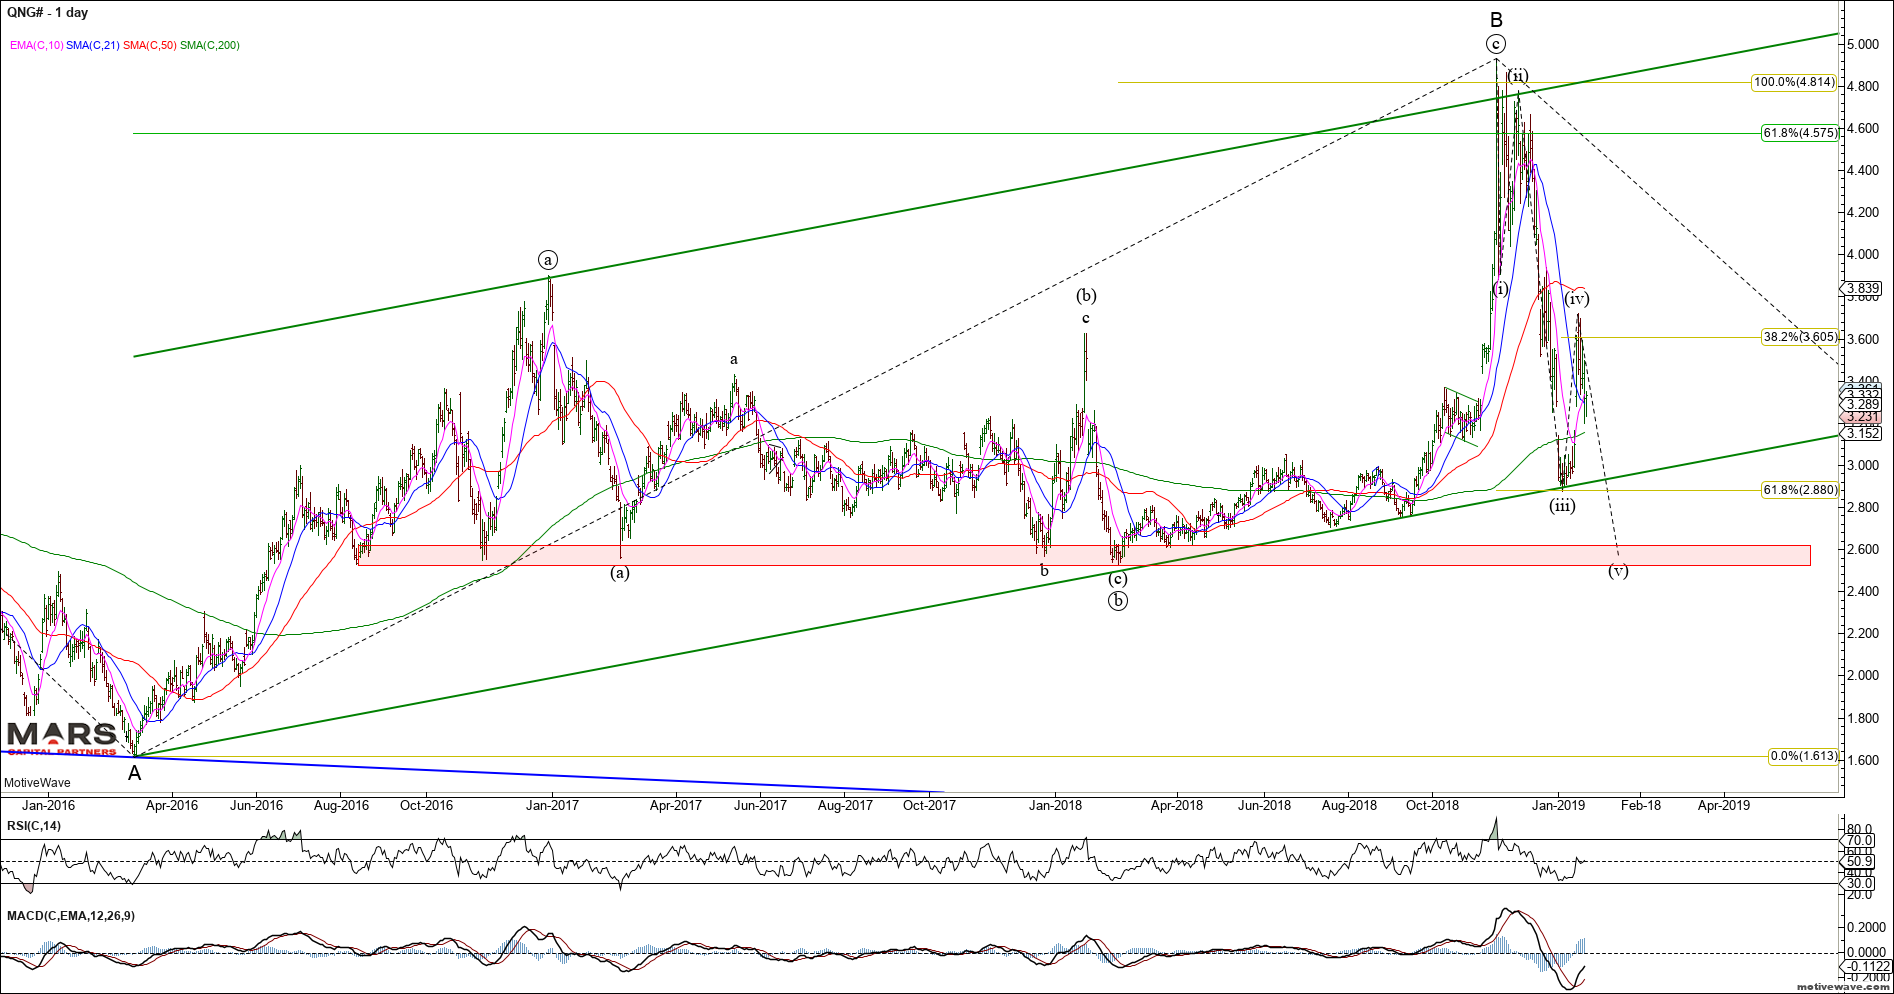
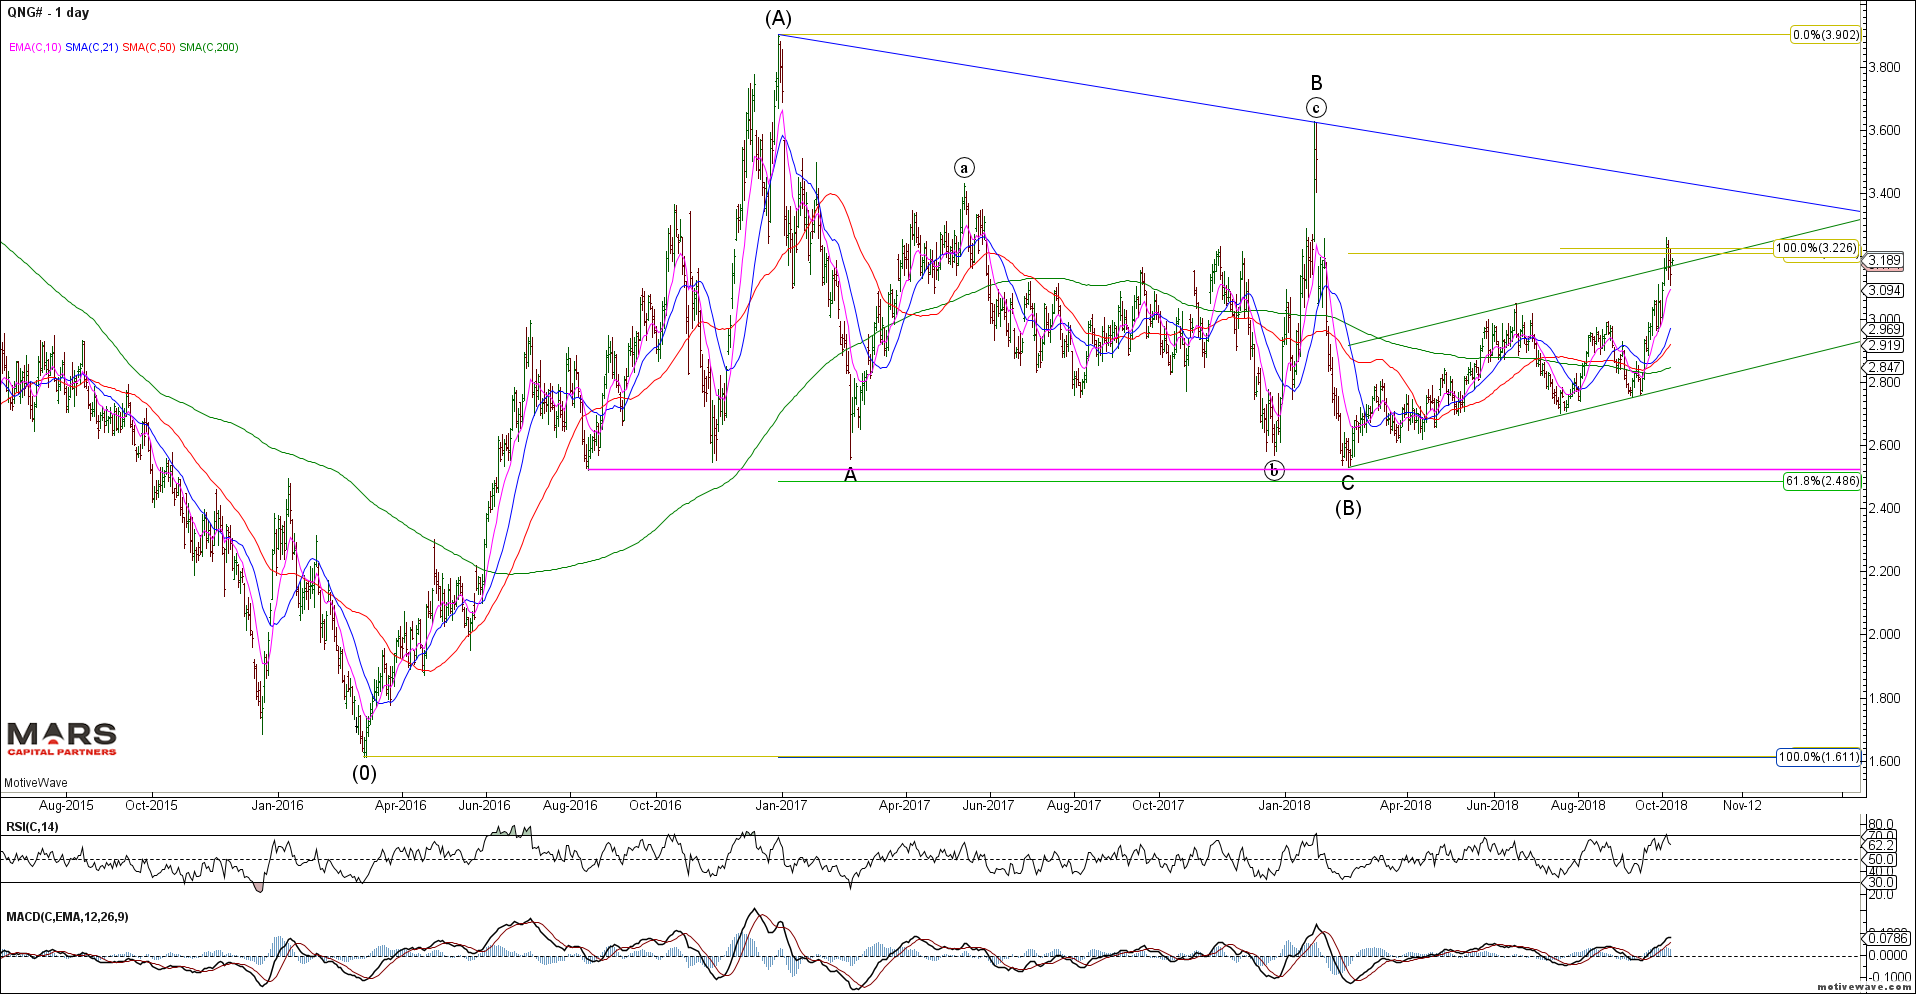
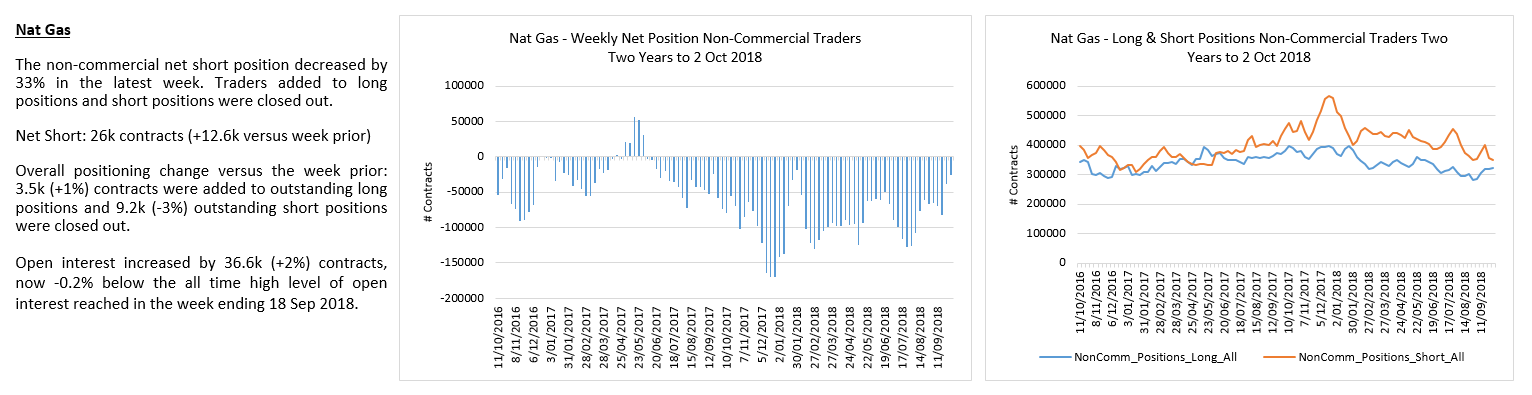
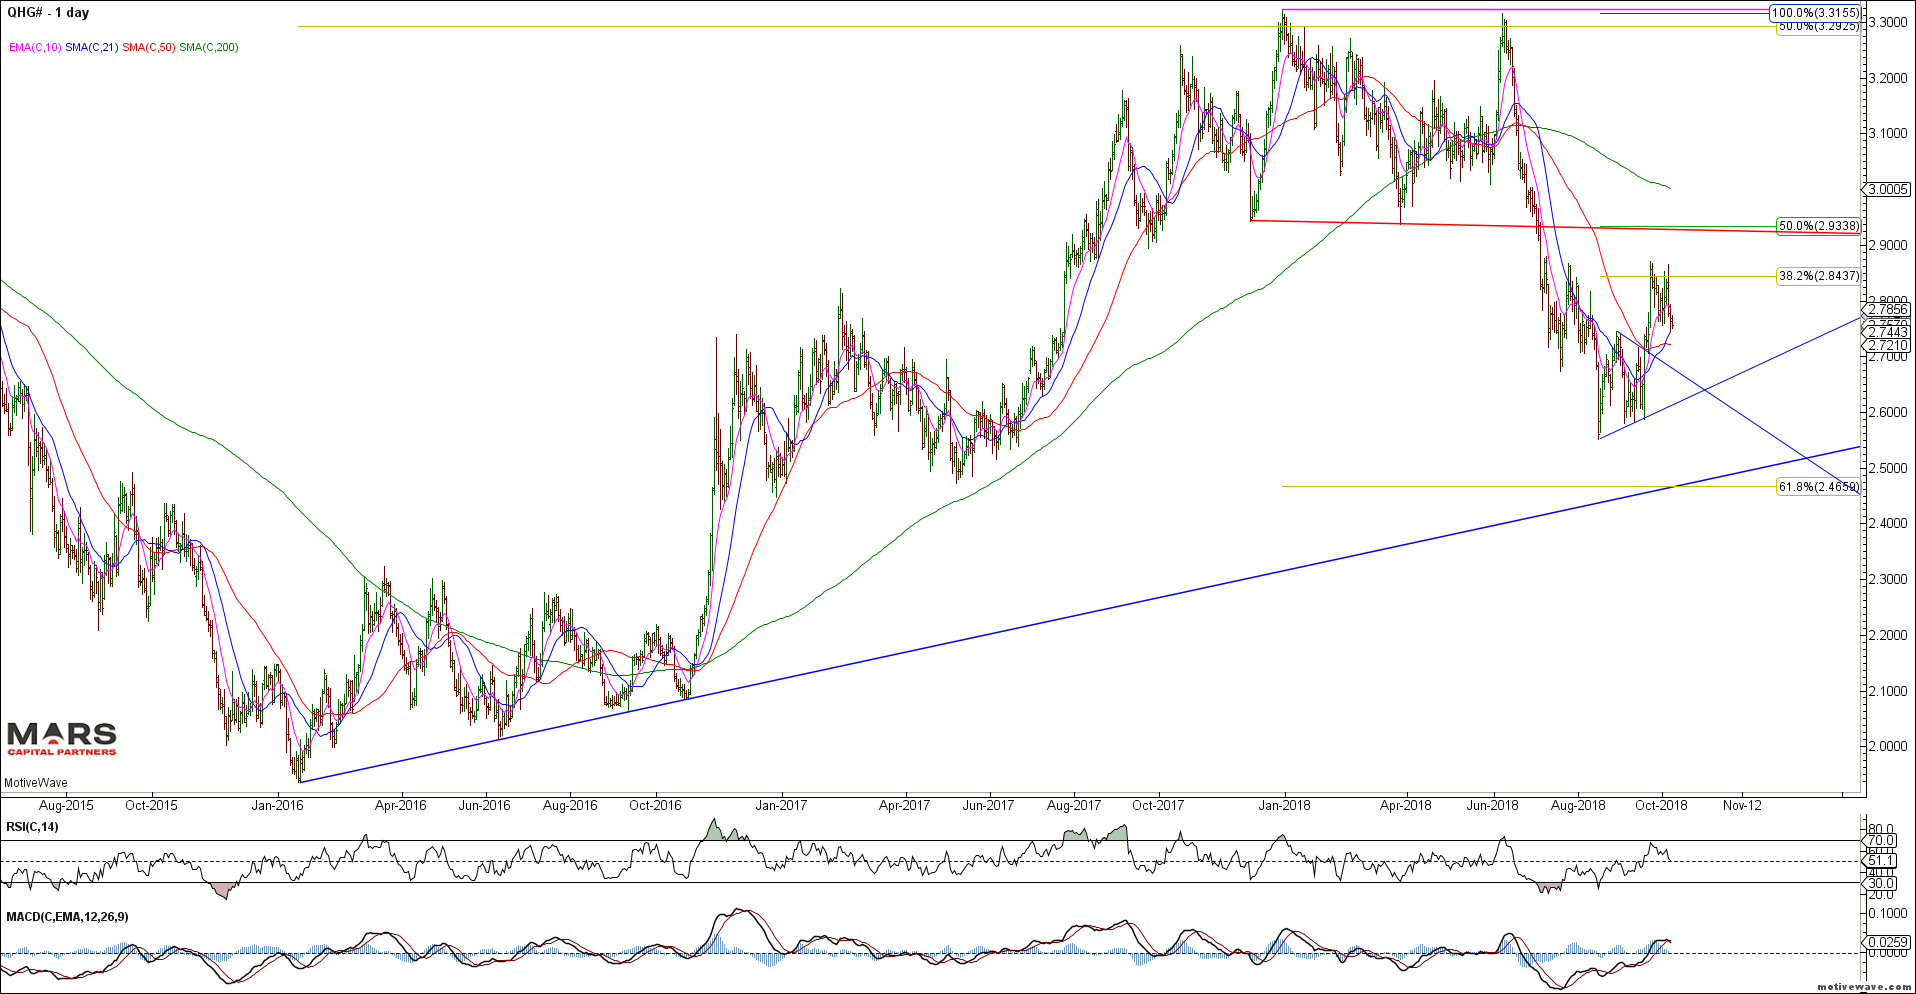
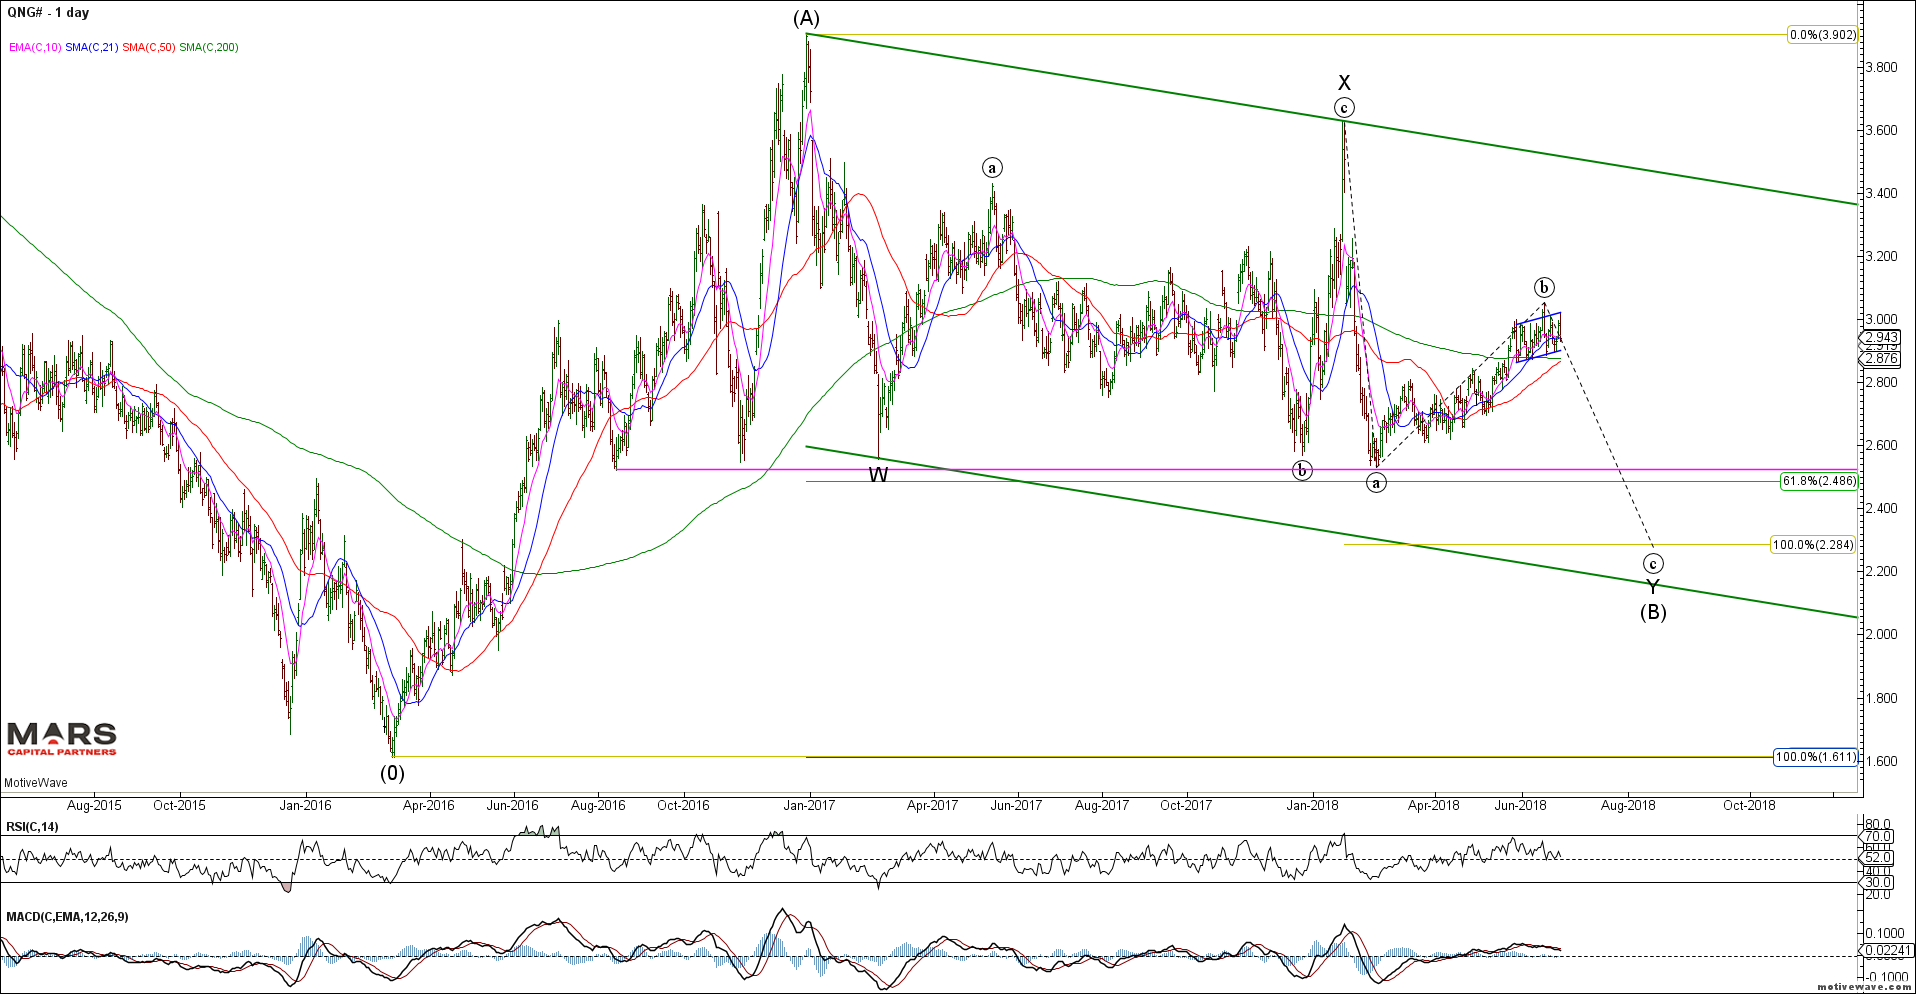
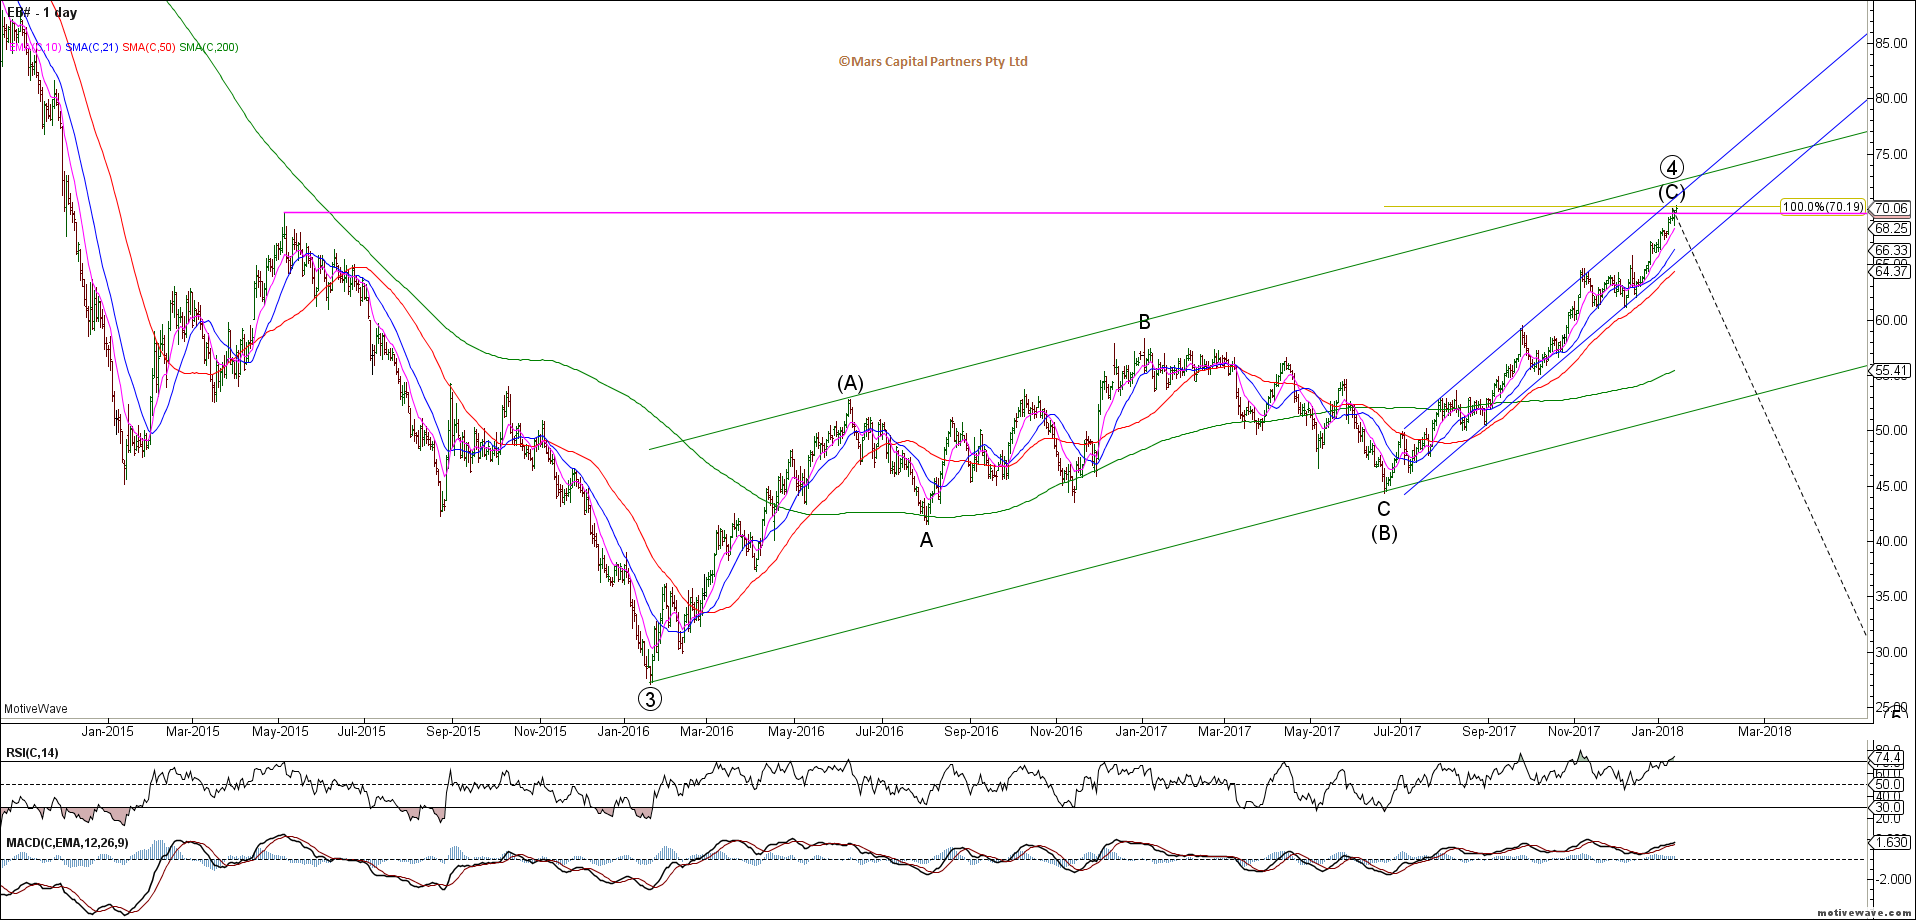
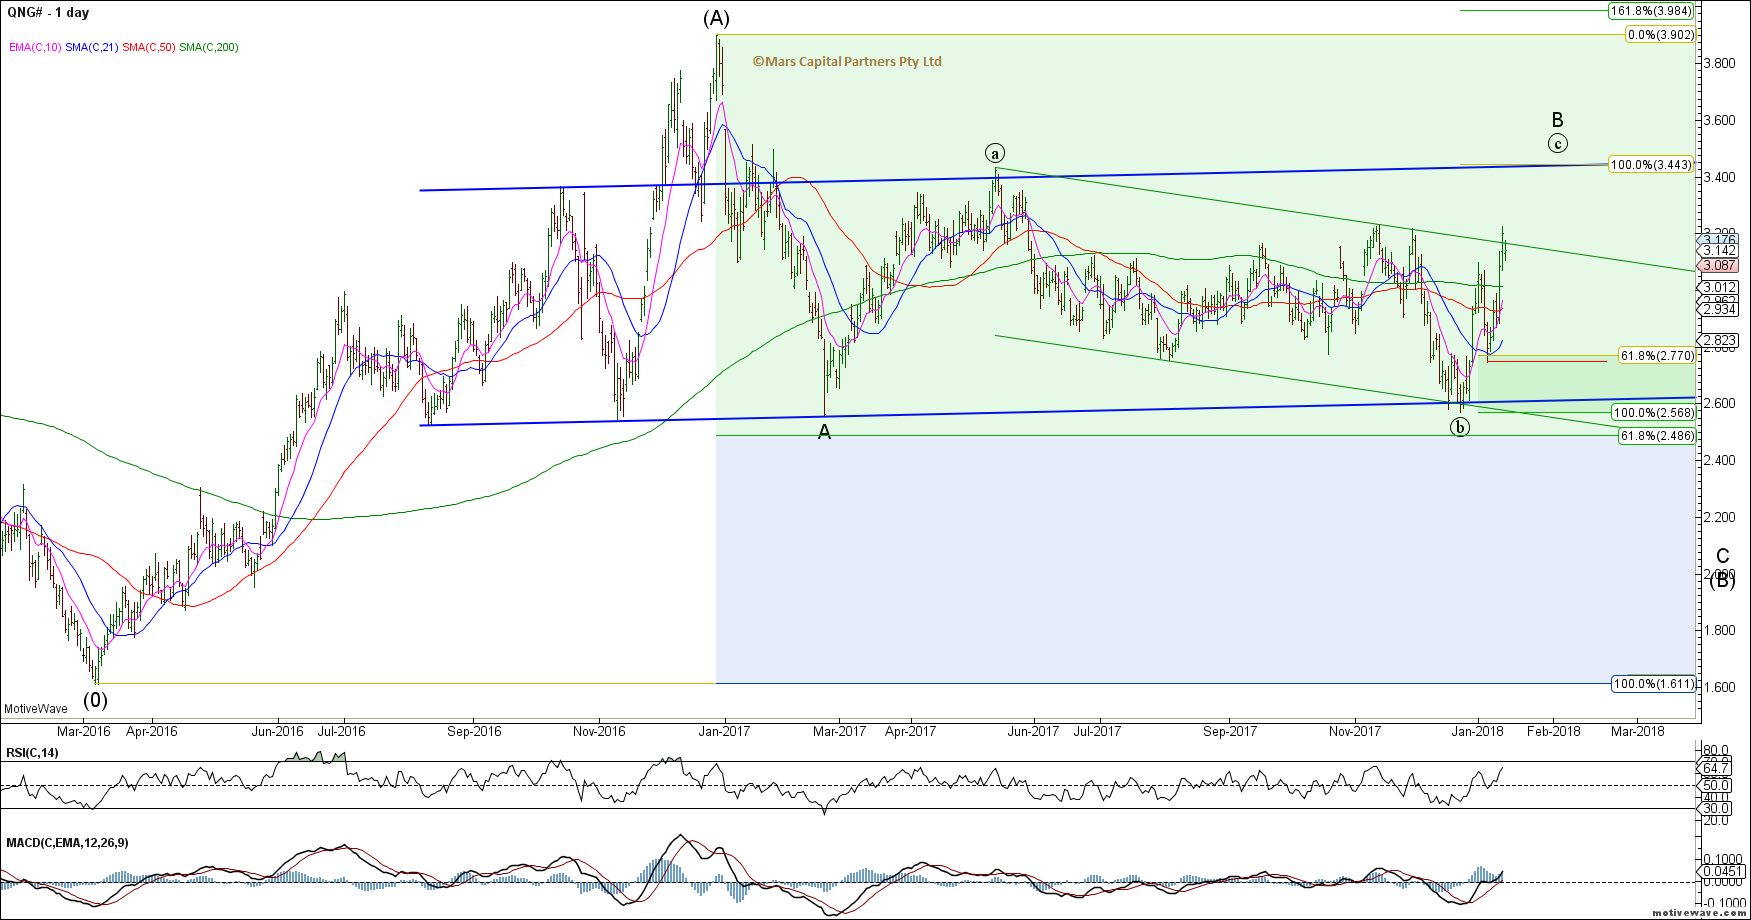
Natty Gas continues to trade within a larger decline with a corrective 3 waves up since the 2016 lows. We remain bearish from a bigger picture perspective and continue to look for new cycle lows in NG as long as the wave C highs hold to the upside. A break below 2.50 support would likely confirm our bearish view.
NG Weekly
Near term, the NG bears need to break below the trend channel and ideally trade below 2.50 to confirm a change in trend to down.
NG Daily
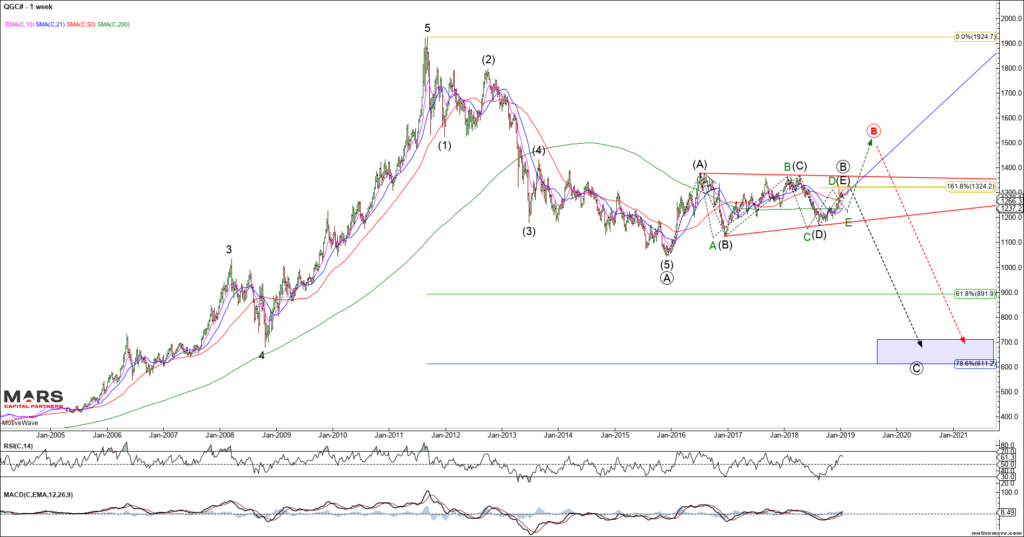
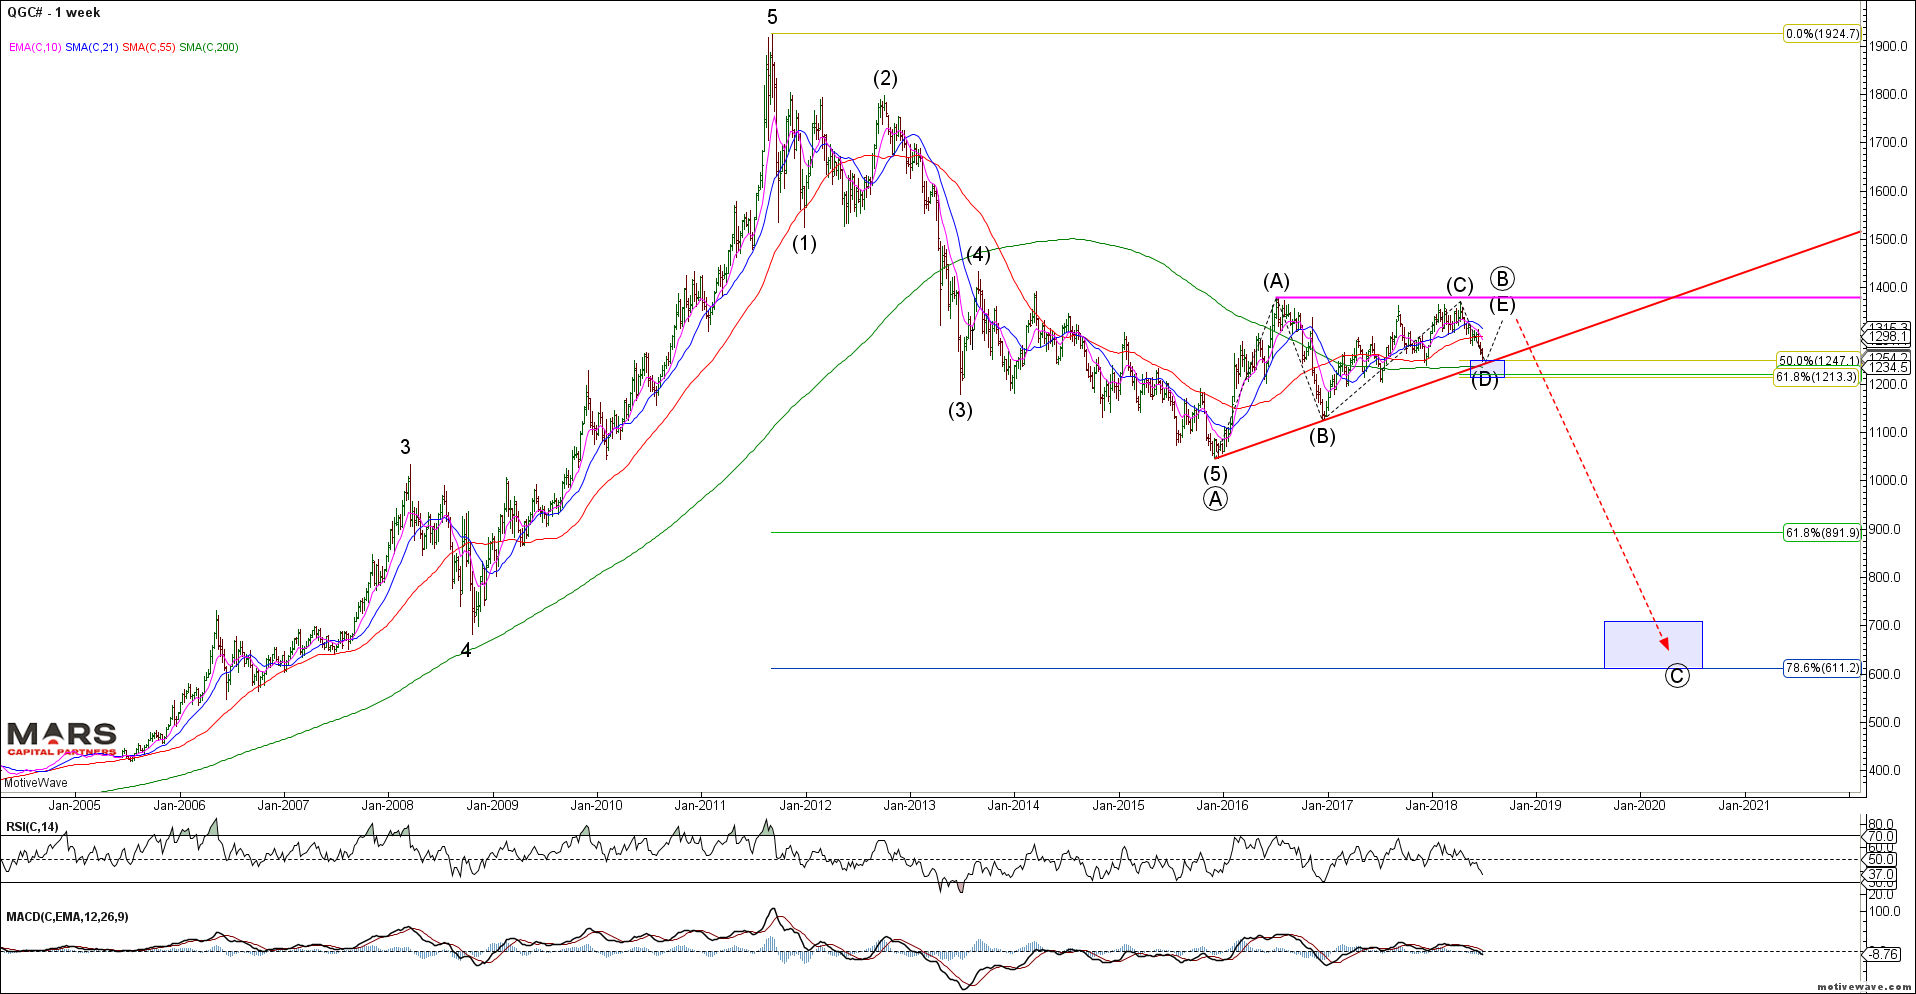
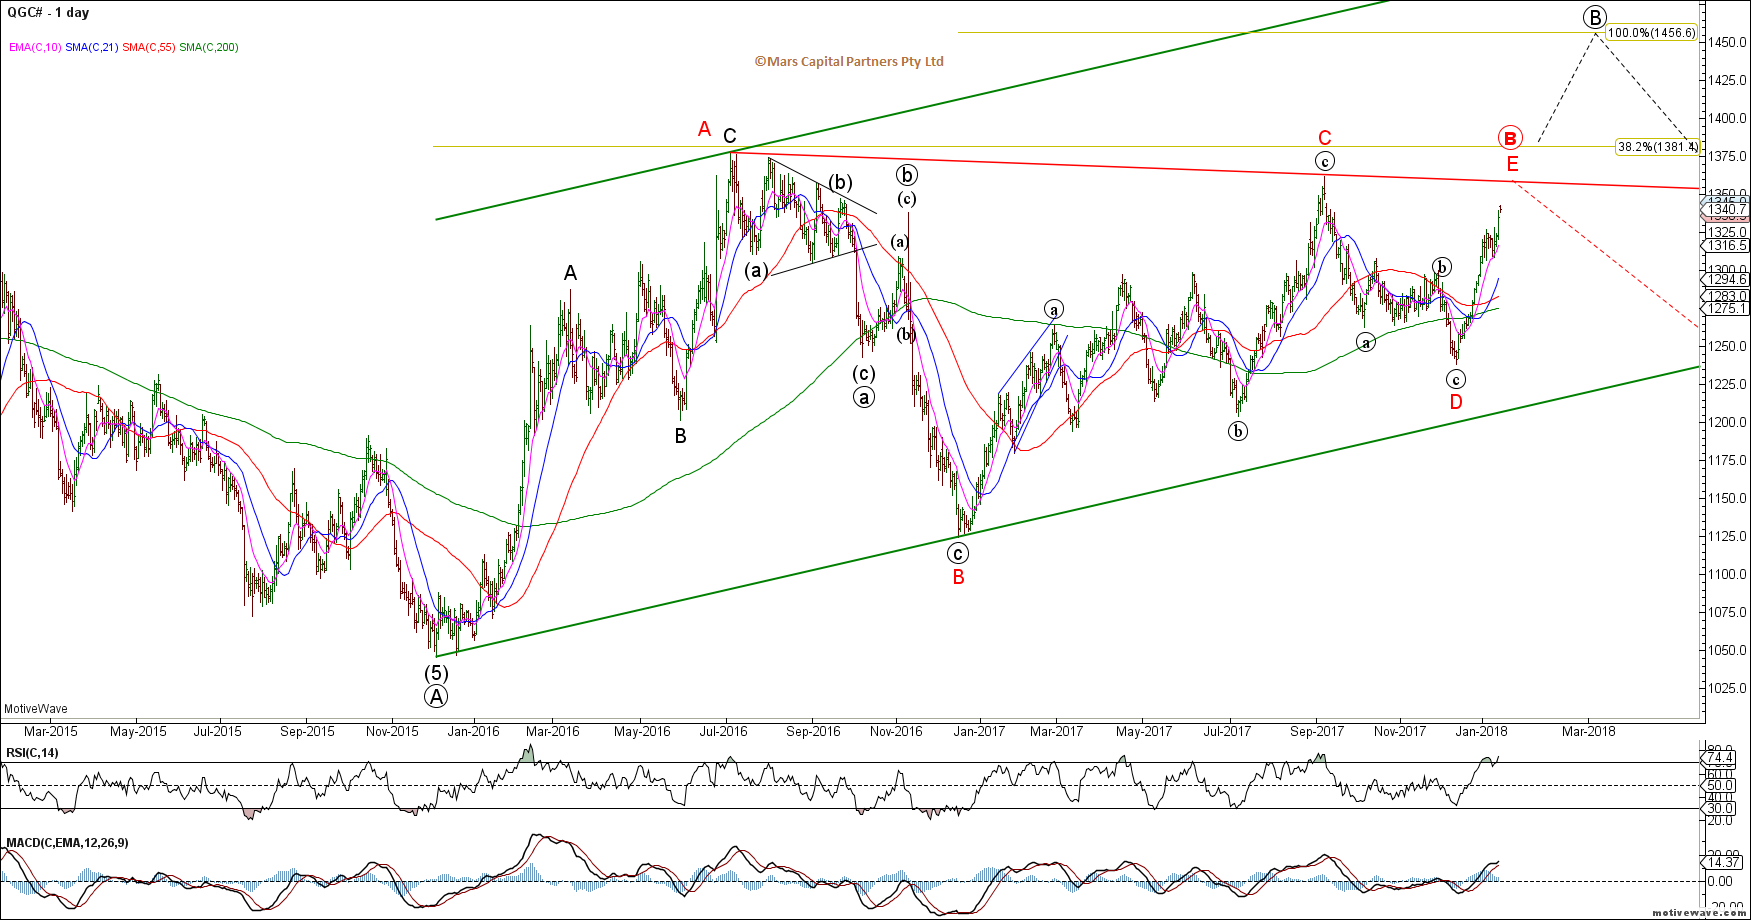
To the PM’s and Gold remains trapped in its multi-year triangle. Our long term price objective remains in the $600-700 area for Gold. The question is only whether we go directly down from our $1380 resistance (black count) or push higher first towards $1500 for red wave B.
Gold Weekly
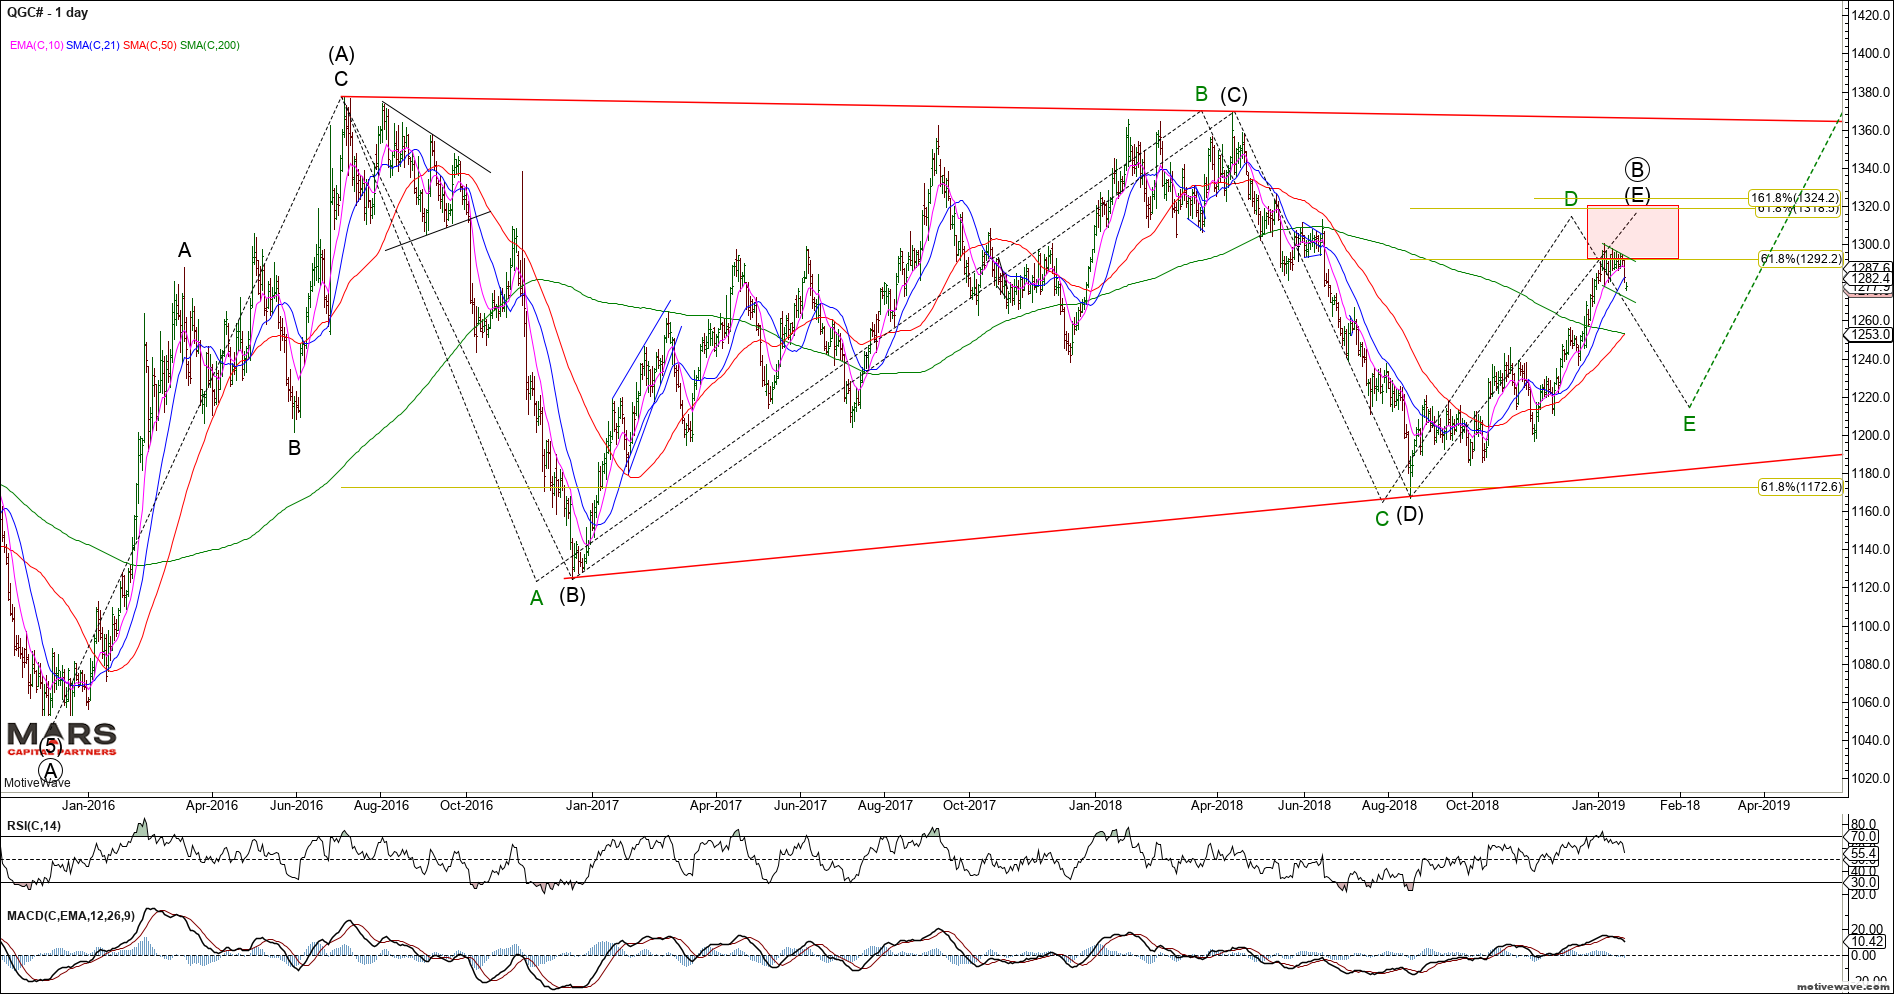
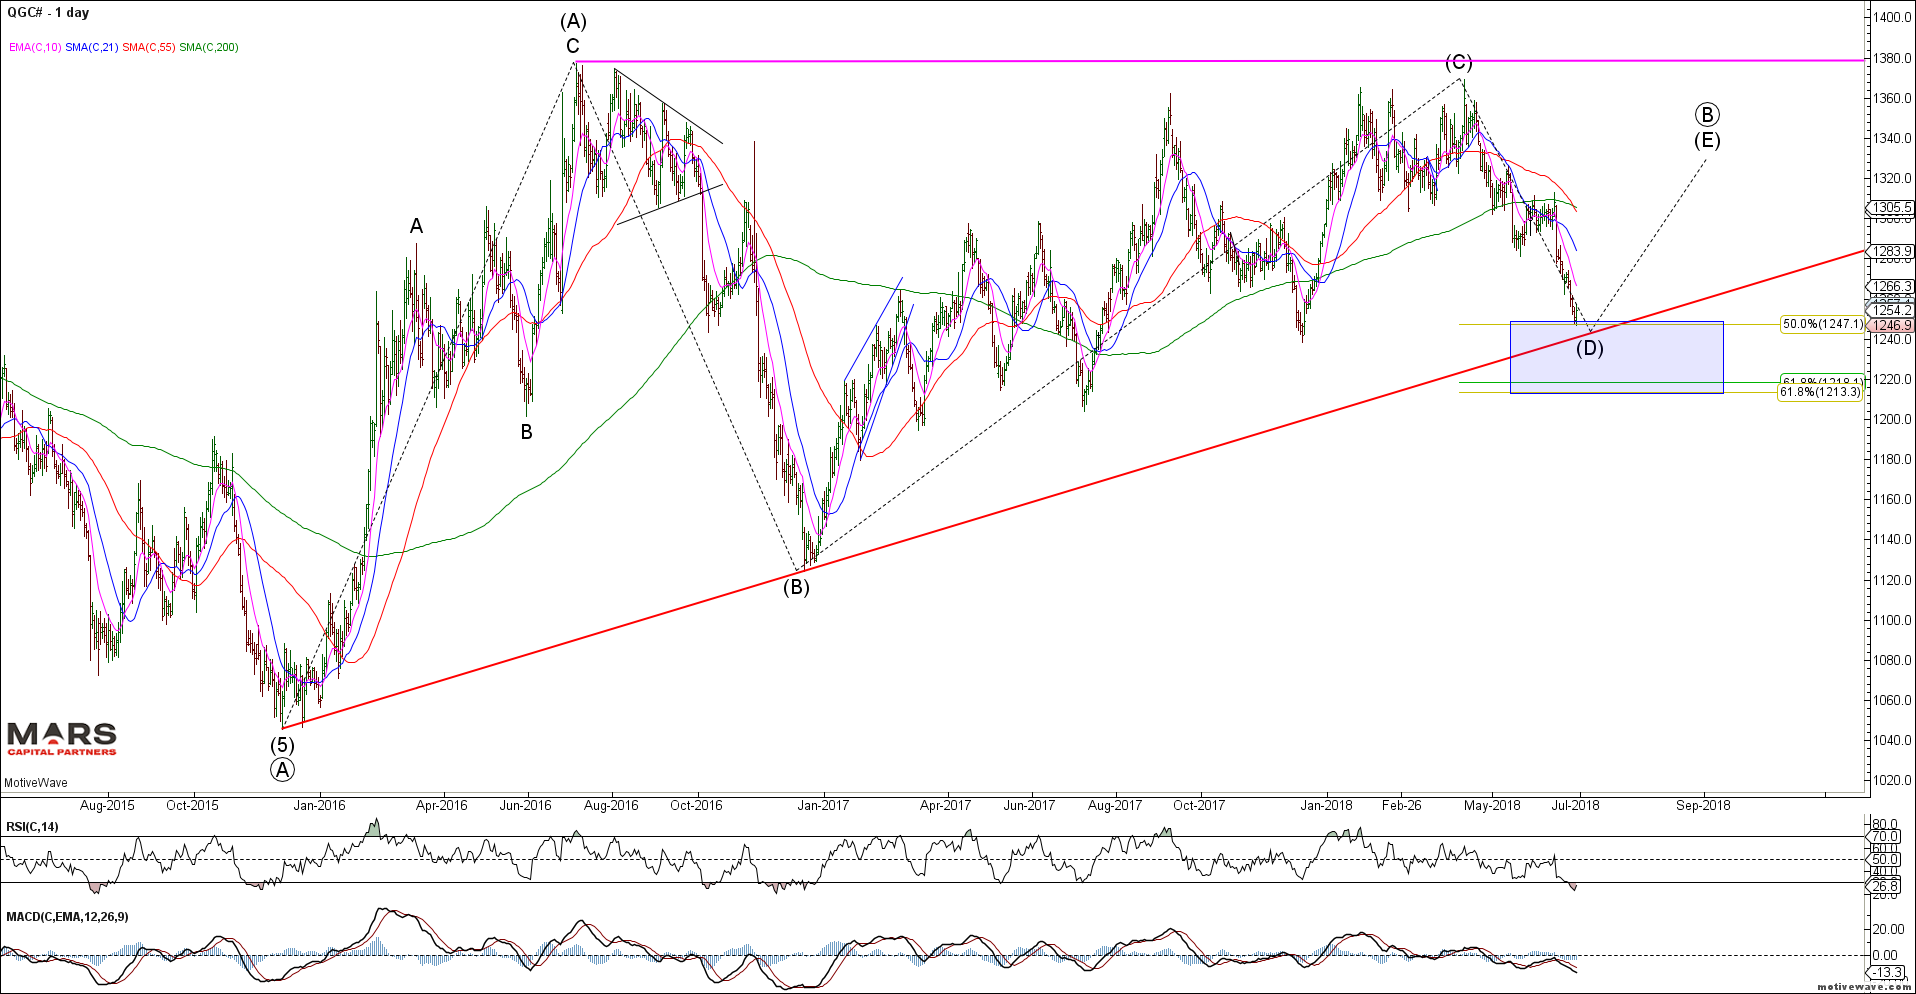
Near term, Gold turned down from the low end of our sell zone as it broke down from its triangle. It could still be a bull flag with ideal upside targets in the 1320-25 area. We do not yet have confirmation of a change in trend.
Gold Daily
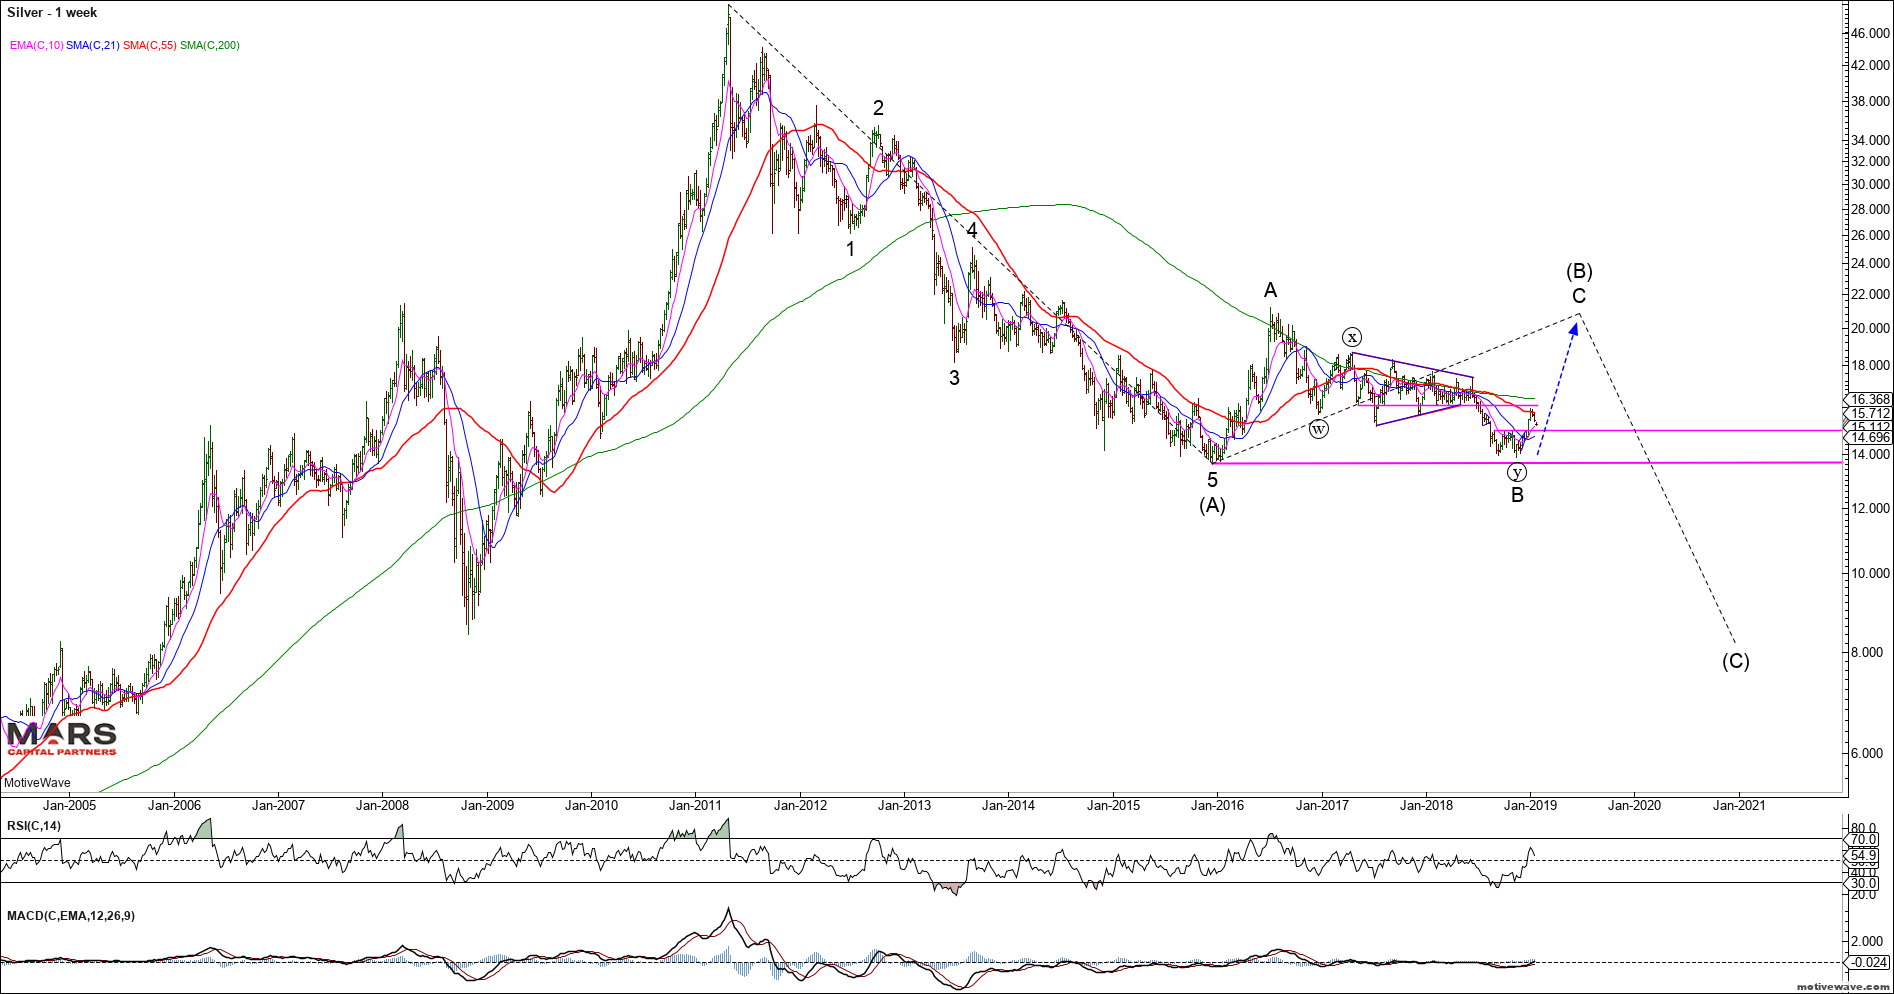
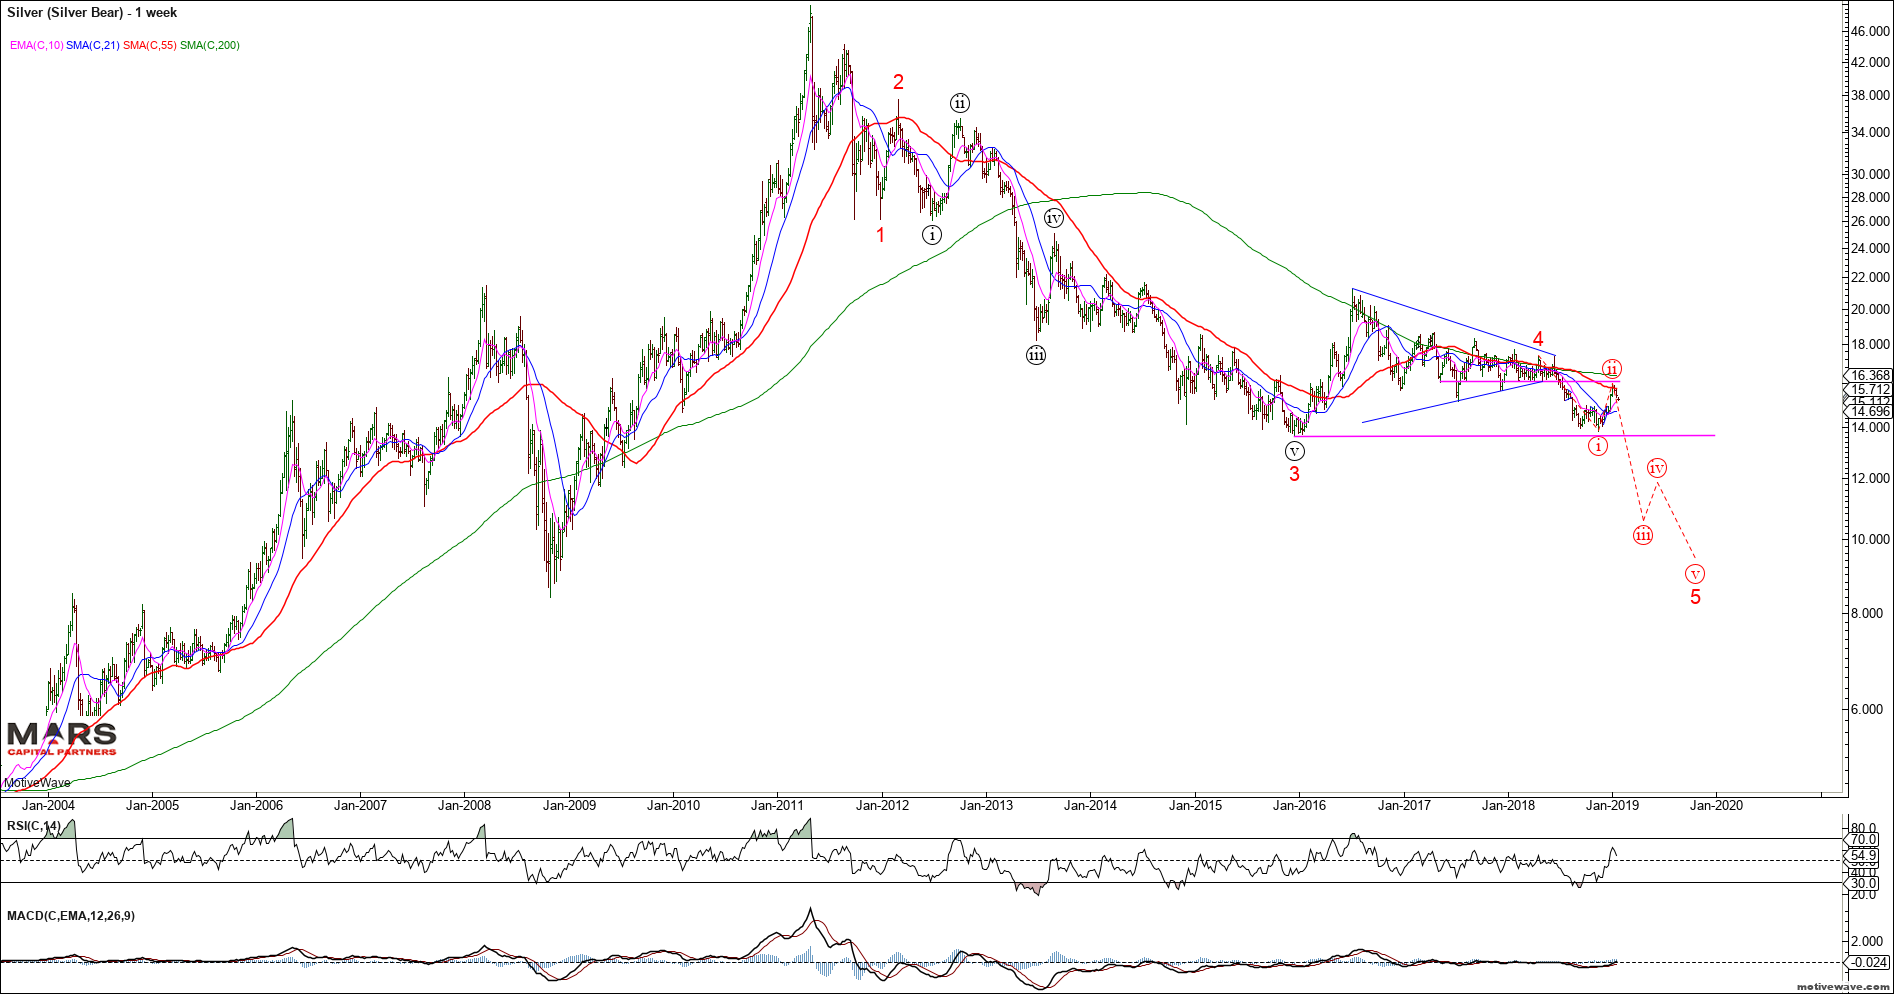
Silver also broke down from our 16.00 near term resistance and the rally is only in 3 waves so far. Trade back below 15.00 would imply the trend remains down with new lows on deck. Bulls need to hold the 13.60 support area or risk a breakdown towards the $8-10 area in an impulsive 5th wave decline. The bullish case is looking for a wave C higher towards the $20-22 area. Near term bulls need to reclaim $16 first.
Our bigger picture Silver buy zone targets remain in the $8-10 area.
Silver WeeklySilver Bear Weekly
In summary, 2019 is likely to be a trader’s market with high volatility across macro asset classes. – we remain defensive equities and trade tactically; – bullish bonds in a deflationary environment; – bullish the US dollar (except against the Yen) – bearish the Swiss Franc – Longer term bearish gold and silver
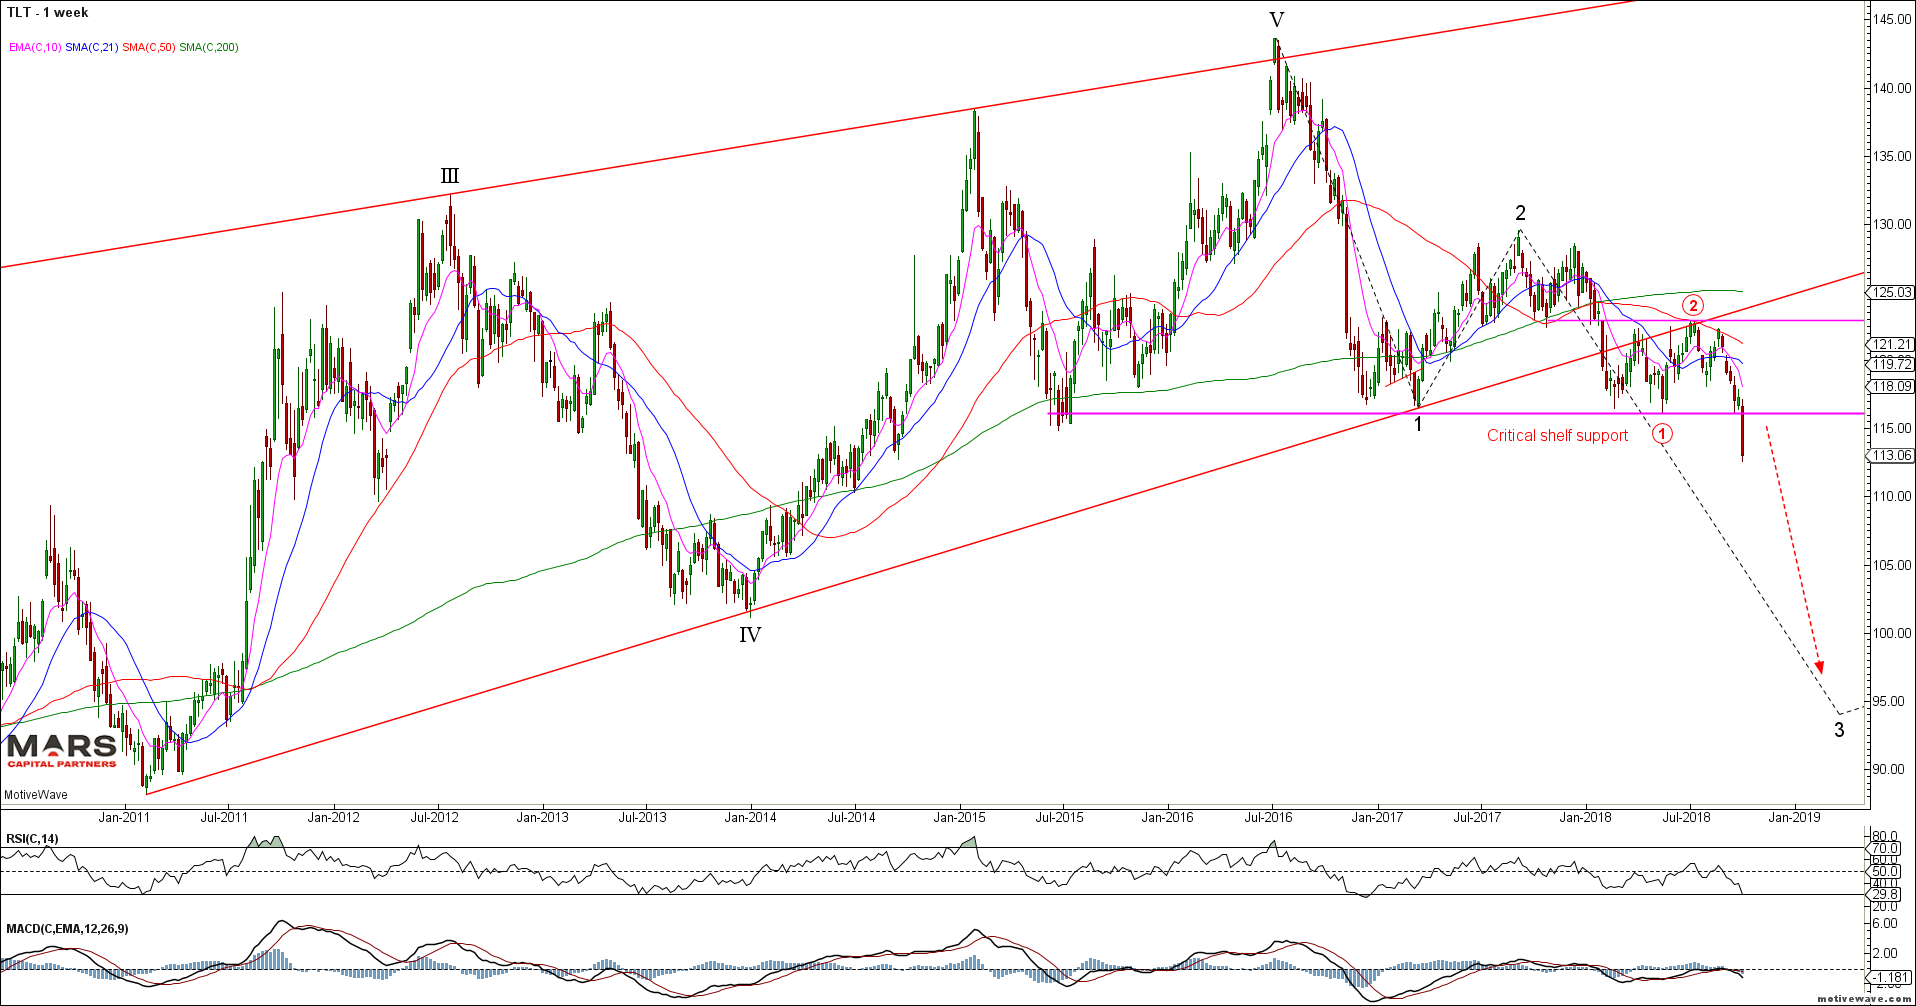
Last week we finally saw US bonds break major support (TLT 116) that we have been watching closely. This is a major turning point for risk assets in a debt fuelled world and in particular, its effect on Emerging Market debt which when combined with a strengthening US dollar bodes further trouble ahead. Also of note was the Nasdaq’s bearish reversal on a failed retest of the ATH’s as warned last week. All in all it was a bad week for risk parity strategies.
The TLT broke critical 116 shelf supportand accelerated lower as expected invalidating the near term bullish counter-trend potential. We have long been bearish bonds (since the July 2016 highs) and we expect this trend to continue. While we may see a re-test of the 116 break-down level the trend remains down from a bigger picture perspective.
TLT Weekly
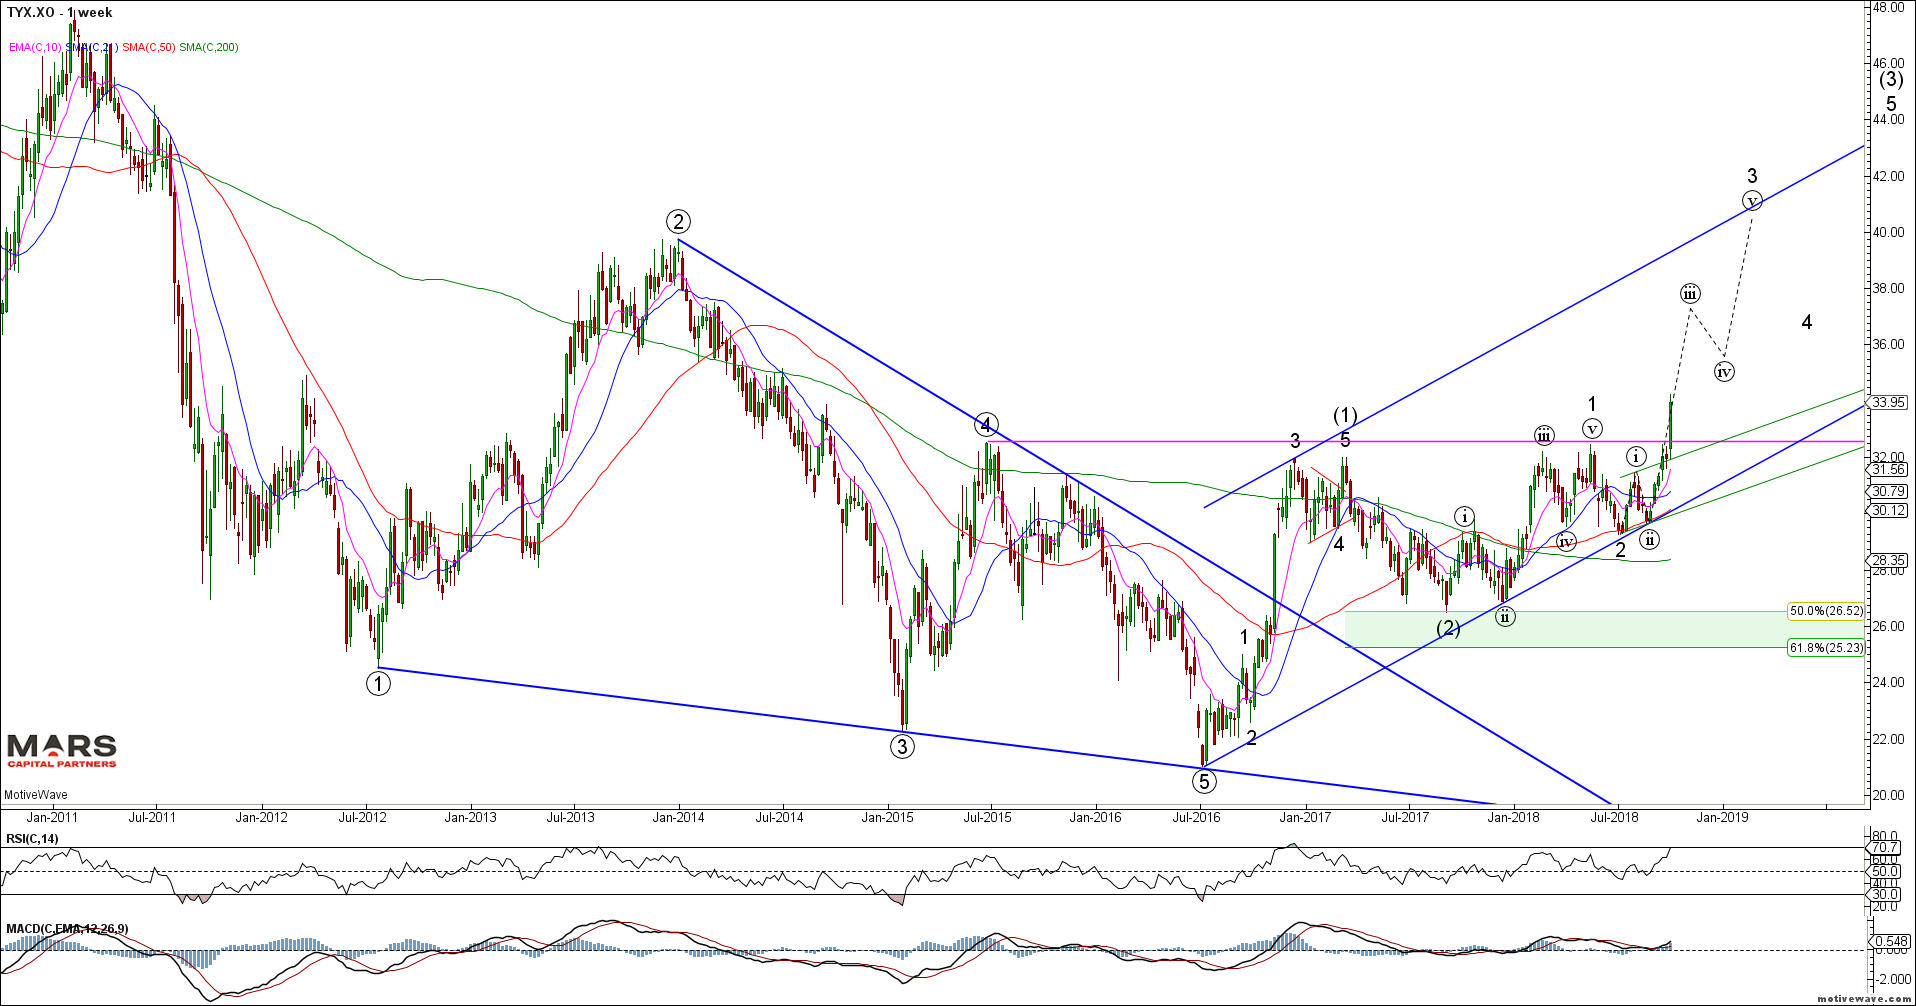
Yields broke higherabove key resistance in what should be a powerful wave (iii) of 3 rally shown below. Only a strong close back below last week’s break-out would alter this bullish yield count.
TYX Weekly
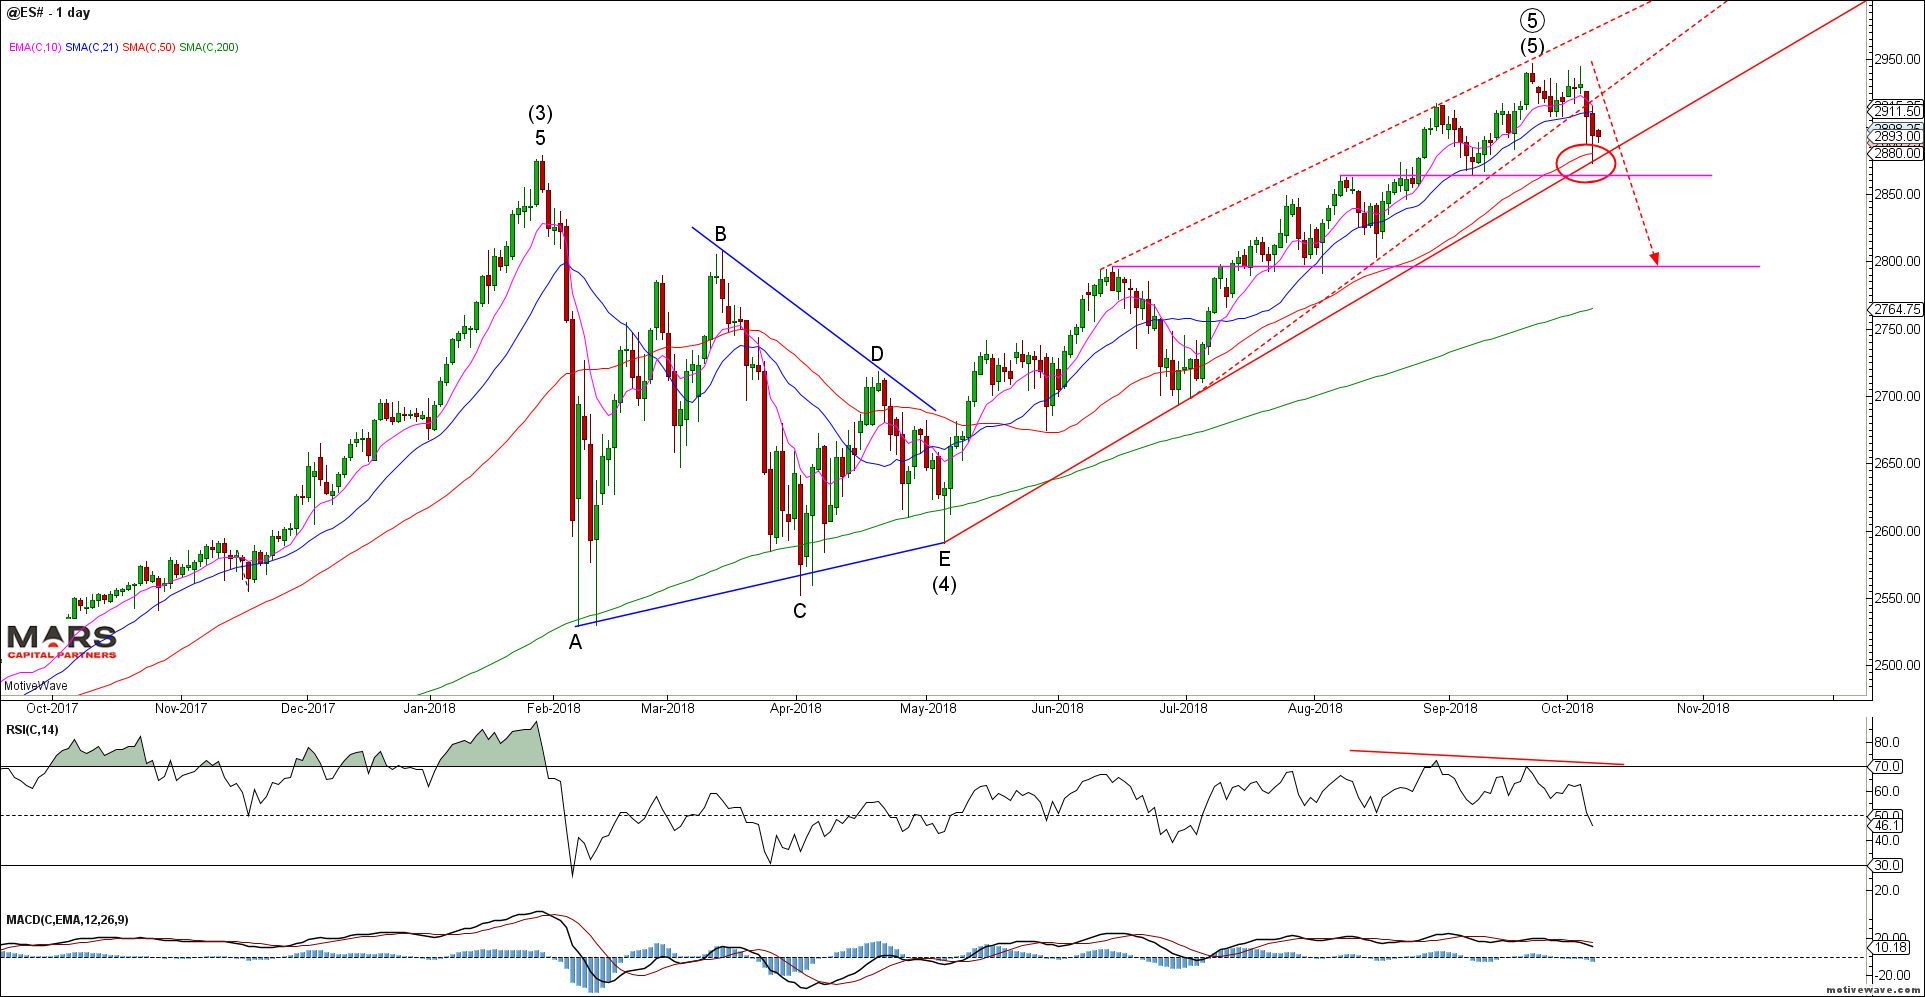
The SPX / ES broke near term trend support and declined directly to our intermediate support in the 2865-75 area posted last week. While we could see a near term counter-trend bounce early this week the intermediate trend remains down – confirmed with a close below 2865.
ES Daily
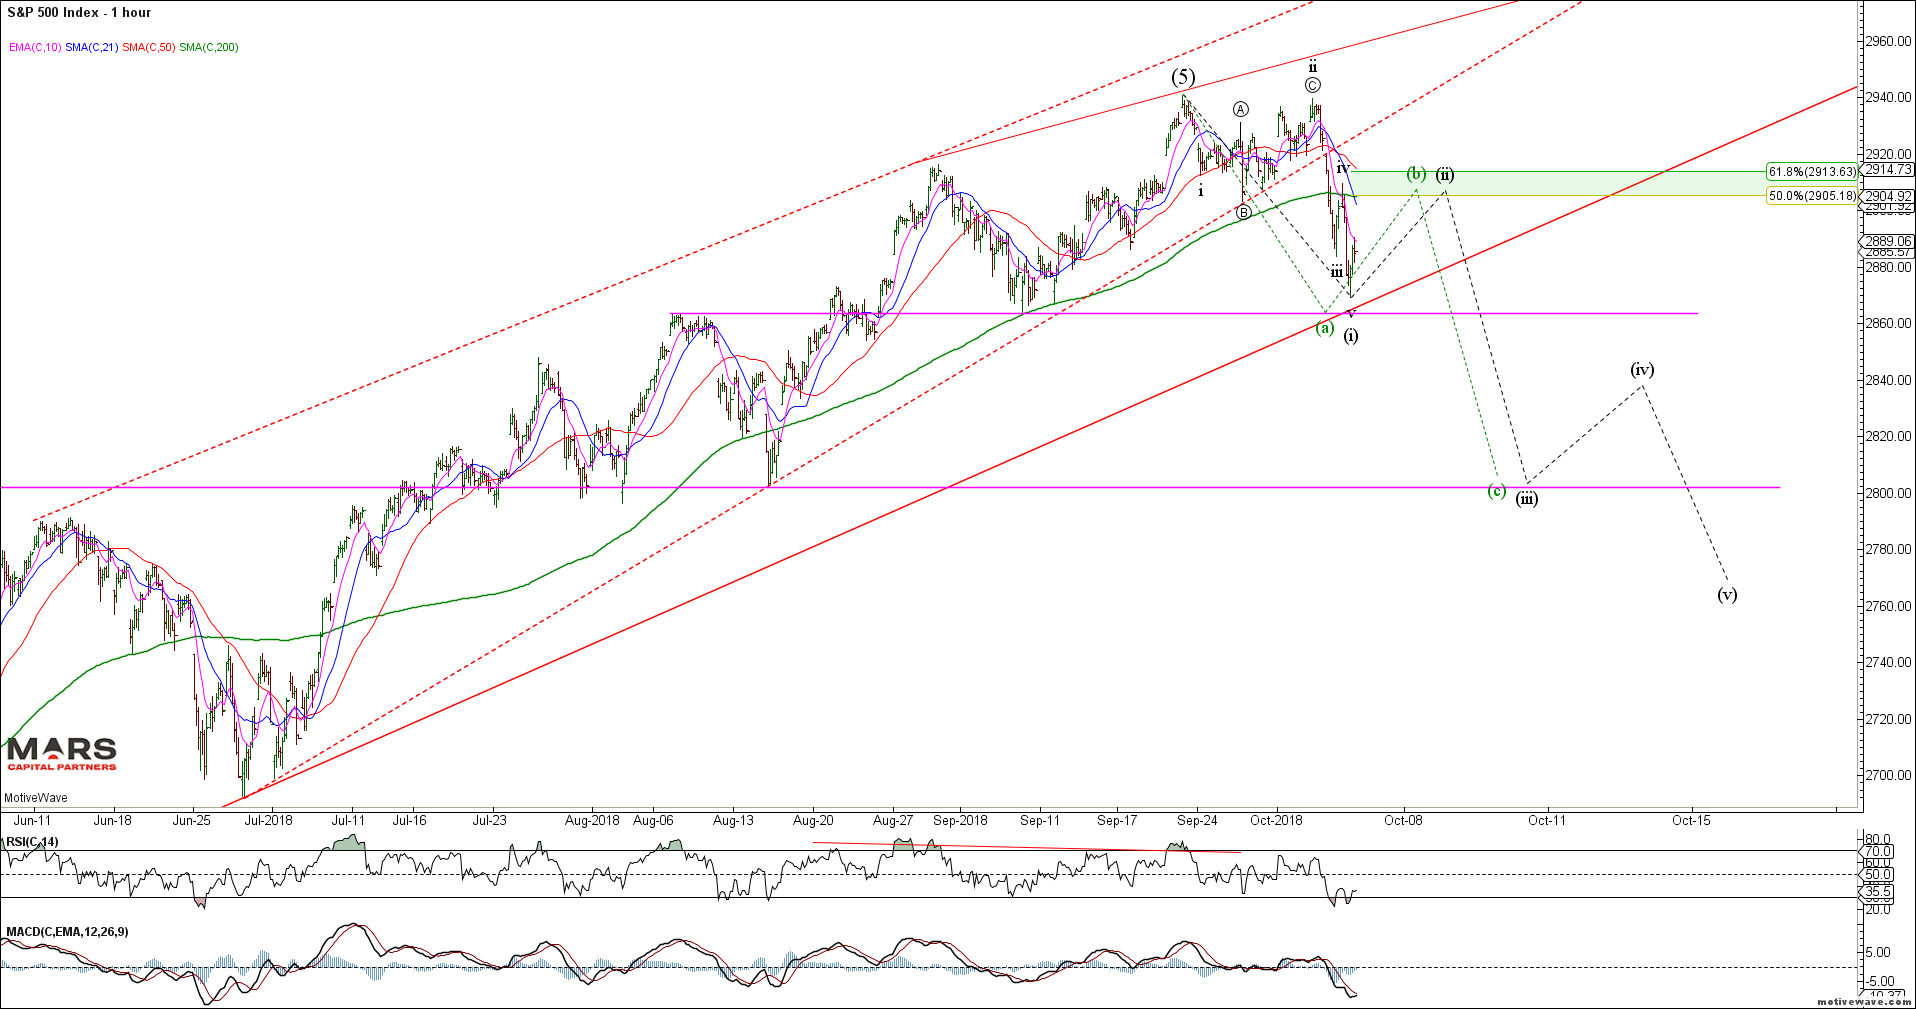
The near term SPX count appears to be an impulsive decline into support to complete either wave (a) or (i) down. Any counter-trend rally should be limited to resistance in the 2905-15 area before another wave lower as shown below. However, support remains support until broken so a close below 2863 will help trigger the next wave lower towards 2800.
SPX H1
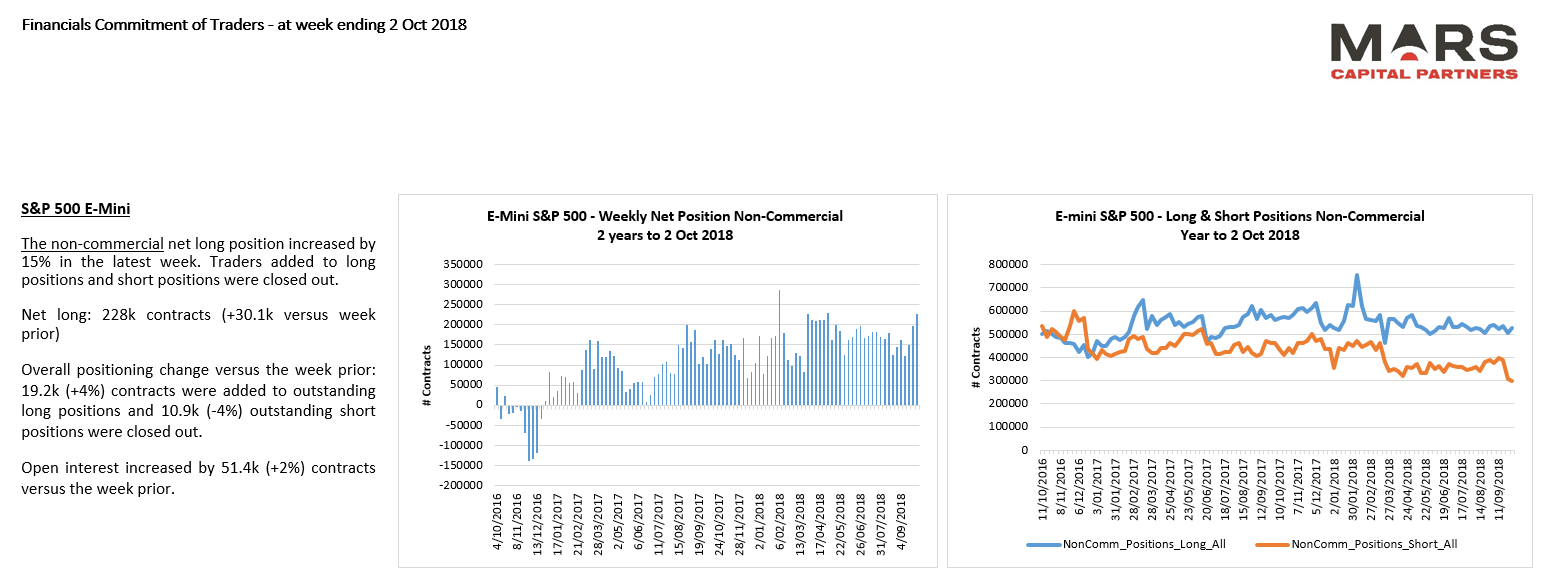
ES shorts are at new cycle lows – warning sign as bulls embrace the highs.
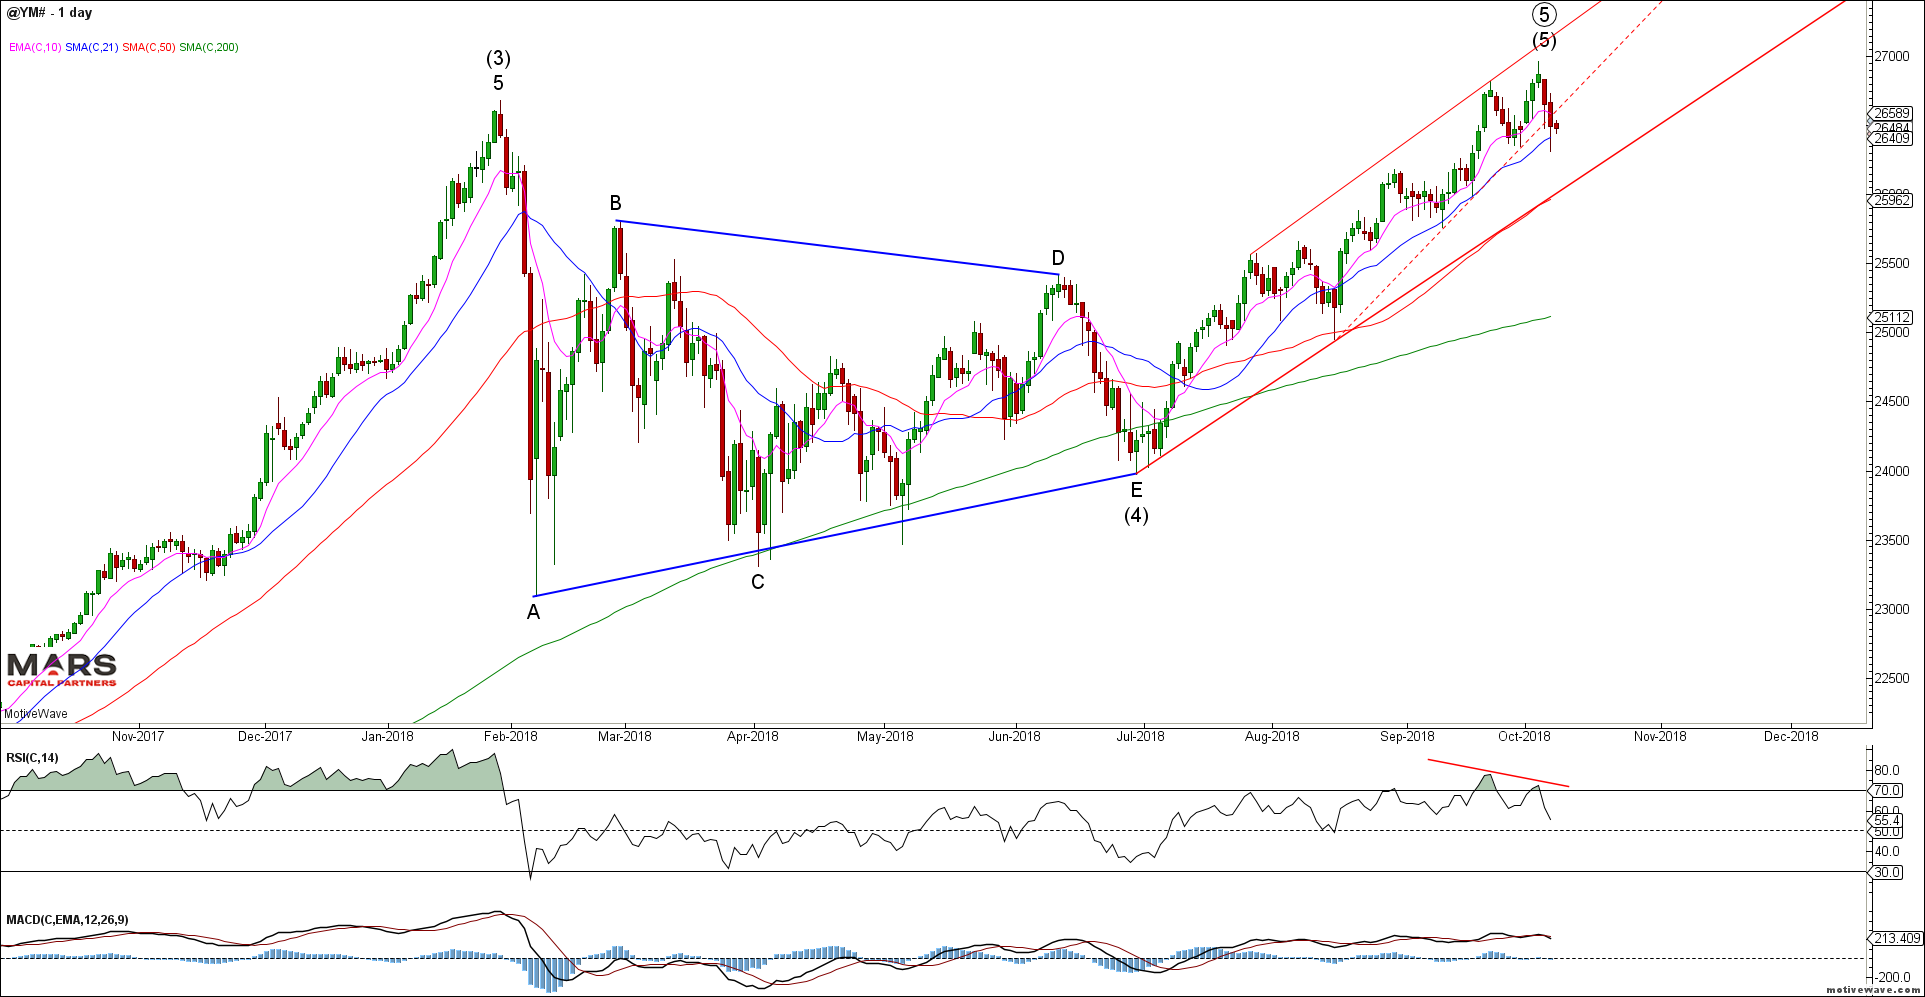
The Dow / YM also broke near term trend supportbut remains well above key trend and 50 day sma support in the 26000 area. Of note is the bearish momentum divergence at last week’s new ATH’s.
YM Daily
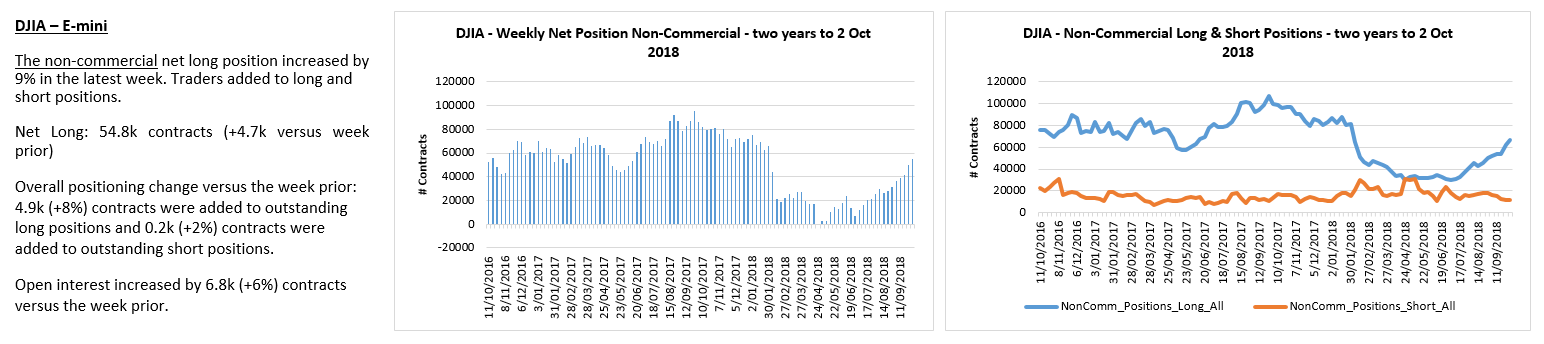
YM traders also embracing the rally…
The Nasdaq indices formed non-confirmation highswith the NDX making marginal new highs which was NOT confirmed by the broader Nasdaq Composite index. Last week we warned… “The near term NQ_F bear case (lower probability but great R/R) is that we are completing a retest of the swing highs in an ending diagonal wave (c) of B/2 red count – it may be worth buying some cheap puts on a retest of the highs. A strong close at new ATH’s will invalidate this count.”
The NQ made marginal new ATH’s but was unable to sustain the break higher and reversed 350pts lower last week as expected breaking the 50 day sma long term support in the process. This break in structure suggests a retest of the 200 day sma.
NQ Daily
Our near term NQ count held up well knowing that we should allow for a marginal new high and hence the focus on near term puts. Any counter-trend bounce should be capped by the 50 day sma and Fib resistance in the 7540 area. We remain bearish given this break of key trend support with targets near the 200 day sma. While it is unclear whether this initial decline is complete we should be aware of the potential for a counter-trend rally within the larger bear market.
NQ_F H1
The Nasdaq Composite did NOT make new highsand broke key near term support. Major trend and 200 day sma support resides in the 7500 area. Note that there are enough waves in place to count the rally from the 2016 lows as complete – note the bearish momentum divergence at the recent swing highs.
Nasdaq Composite Daily
The Russell 2000 / RTY provided early warning to the market weakness as it quickly declined below bullish 1686 support highlighted last week. The bulls were unable to reclaim the 1733 resistance and quickly broke down towards the 200 day sma and wave (3) breakout support from where you would expect buyers to emerge. A close below the 200 day sma would add to the bearish structure.
RTY Daily
Russell shorts continue to pile in which helps explain recent relative weakness.
As noted previously, the VIX is attempting to rotate higher from base support after breaking its near term declining wedge. The VIX really needs a close above 20 to gain upside momentum. Note the Weekly RSI continues to hold trend support and is attempting to rotate higher. We continue to expect higher volatility in the coming weeks and months.
VIX Weekly
VIX traders only know one way – short vol
To the global equity markets and the Nikkei 225 failed to sustain its new cycle highs. While the structure appears to be a 4th wave triangle thrust to new highs (ending 5th wave) we need a decline back below 23000 to confirm that this rally is not extending. Cautiously bearish against new swing highs.
NKD Daily
The question for me is whether this Nikkei 225 rally completes the bigger picture 5 wave rally from the 2008 lows. IF so, we could see a large decline back to the wave 4 extremes in the 15000 area. Too early to call but I am aware of the possibility.
Nikkei 225 Monthly
The ASX200 turned lower from the 50 day smaas expected but remains above previous swing support. We remain bearish looking for a test of the 200 day sma (6180) or rising red trend support (6130). A break of the rising red trend support would be very bearish.
ASX200 Daily
The European markets continue to stall at resistance as the major rounding top pattern remains possible. So far the near term DAX decline is only in 3 waves into 61.8% Fib support. I have no reason to own the European equity markets given the fundamental backdrop. The declining neck line support for the potential H&S resides in the 11500 area. The DAX has been unable to break back above its declining 50 / 200 day sma’s which should probably be our bull/bear line in the sand.
DAX Daily
The near term DAX count is more complex with the bearish red wedge challenging the impulsive looking rallies (green triangle count). This chart appears messy but the key message is that bulls need to make a stand here to avoid a larger breakdown towards 11700.
DAX H4
Not surprisingly, EEM continues to stair step lower towards a back-test of the green trend channel breakout. While it may find near term support here, the bigger picture trends of rising rates and a stronger US dollar will continue to pressure emerging market equities. Until something fundamentally changes (eg., resolution of China trade dispute) the bigger picture trend remains down. Trade back above $45 would be bullish.
EEM Weekly
To the Bond markets and we finally had a clear break of our 116 “line in the sand” support.Last week we said, “a strong close below the 115-116 shelf support will likely see an acceleration of the downtrend. Key inflection point here for US rates.” – we remain bearish bonds given this fast break lower with targets much lower. Only a close back above 116 would alter this immediately bearish wave count.
TLT Weekly
The 30yr (ZB) continues to impulse lower following its break of support. While we may see a re-test of the 140 breakdown area on a counter-trend bounce (not likely), the trend remains down until proven otherwise. Given the market’s general bearishness I will remain alert to a potential bullish reversal – in the meantime the trend is your friend. There is nothing bullish about this chart – lower lows and lower highs since the September 2017 counter-trend highs..
ZB Daily
The acceleration in ZB shorts is worrying but you can’t fight the trend until it bends.
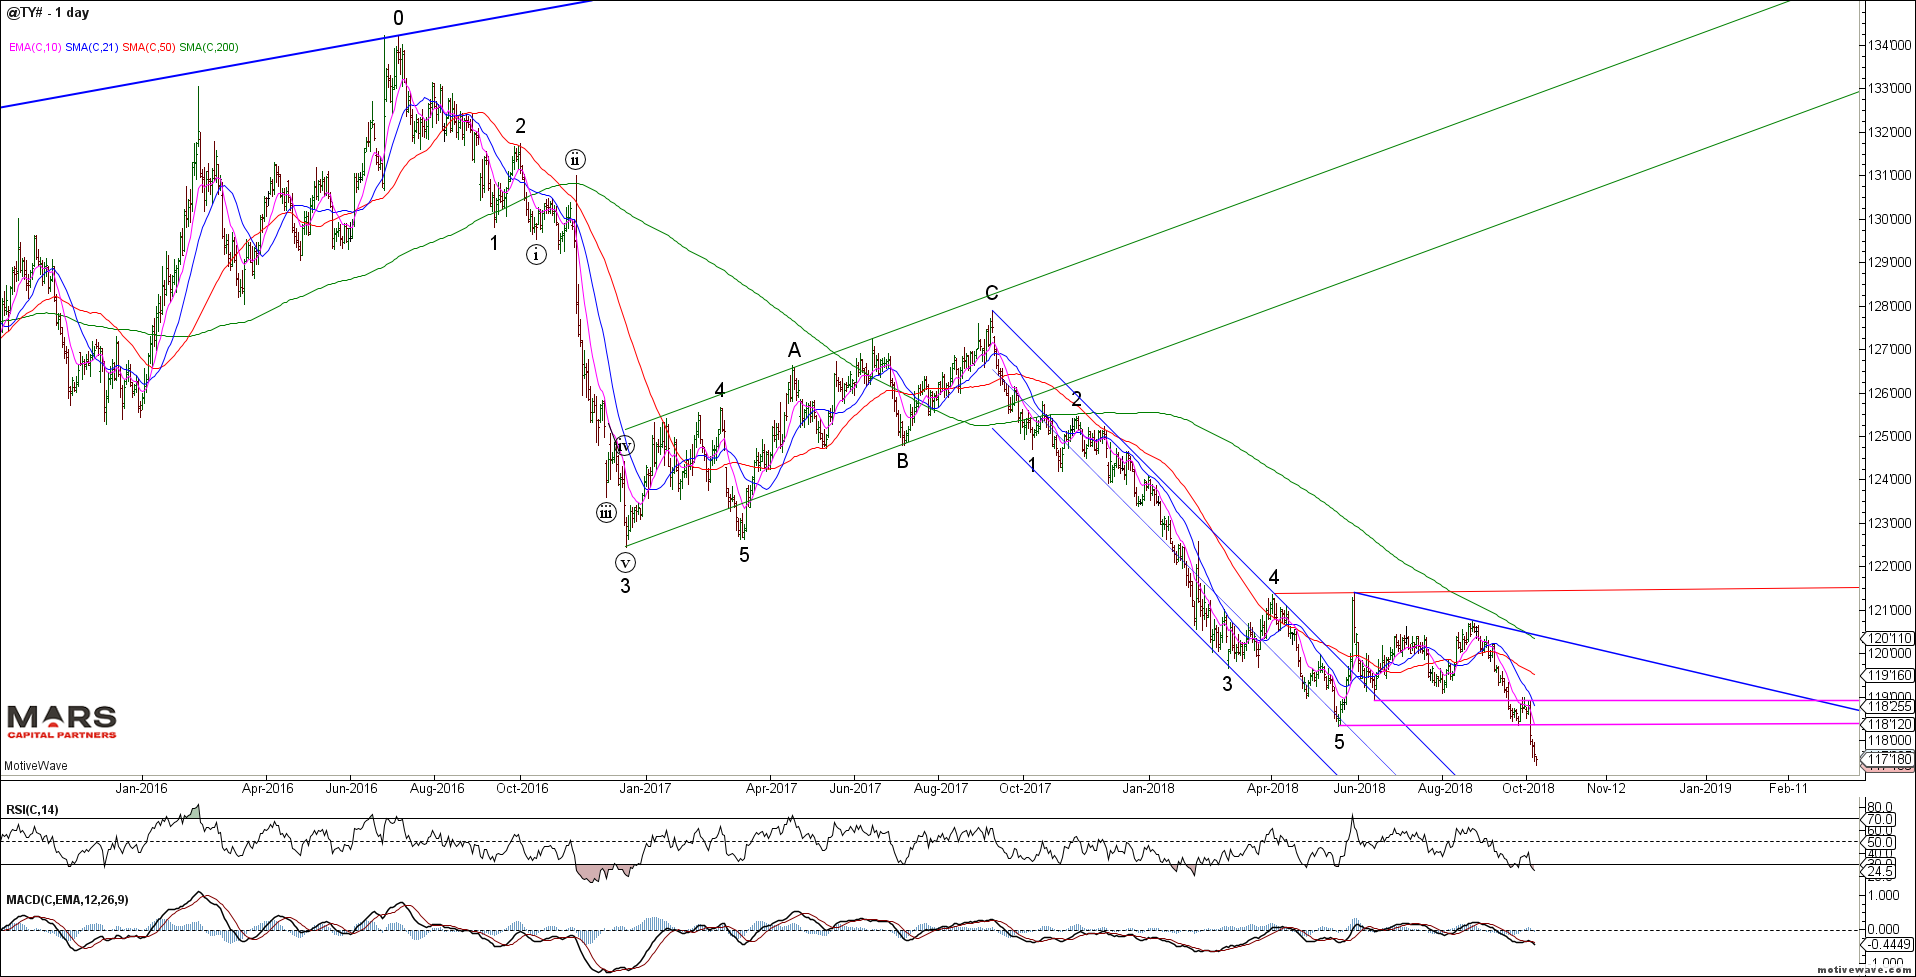
The TY continues to break lower in its downtrend as the decline extends. Only a strong close back above the breakdown area and 119’00 would invalidate our bearish outlook.
TY Daily
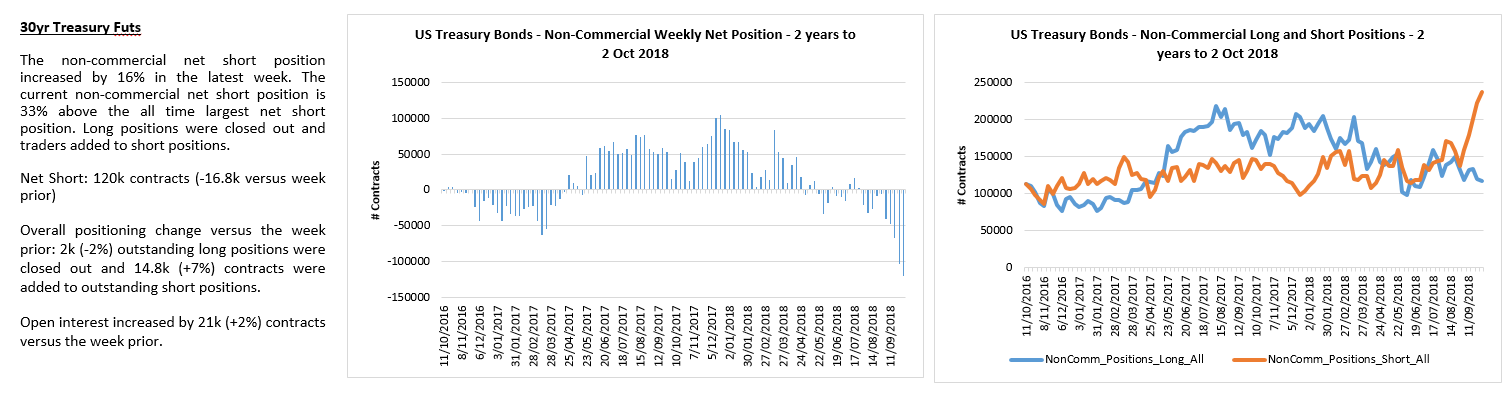
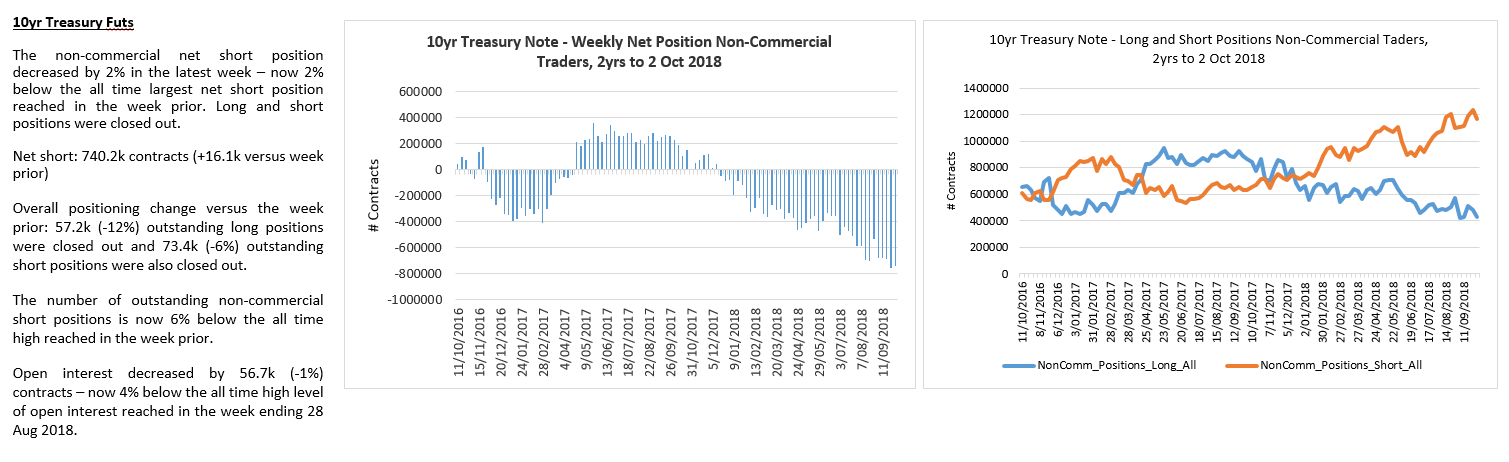
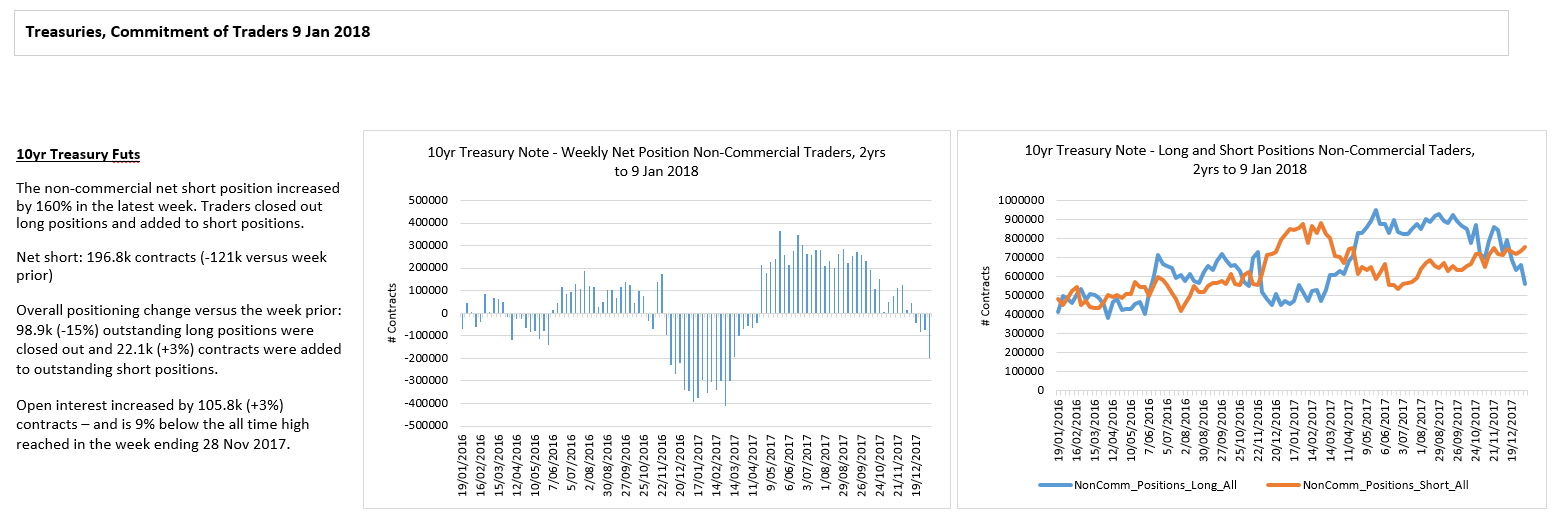
TY bond traders remain heavily net short.
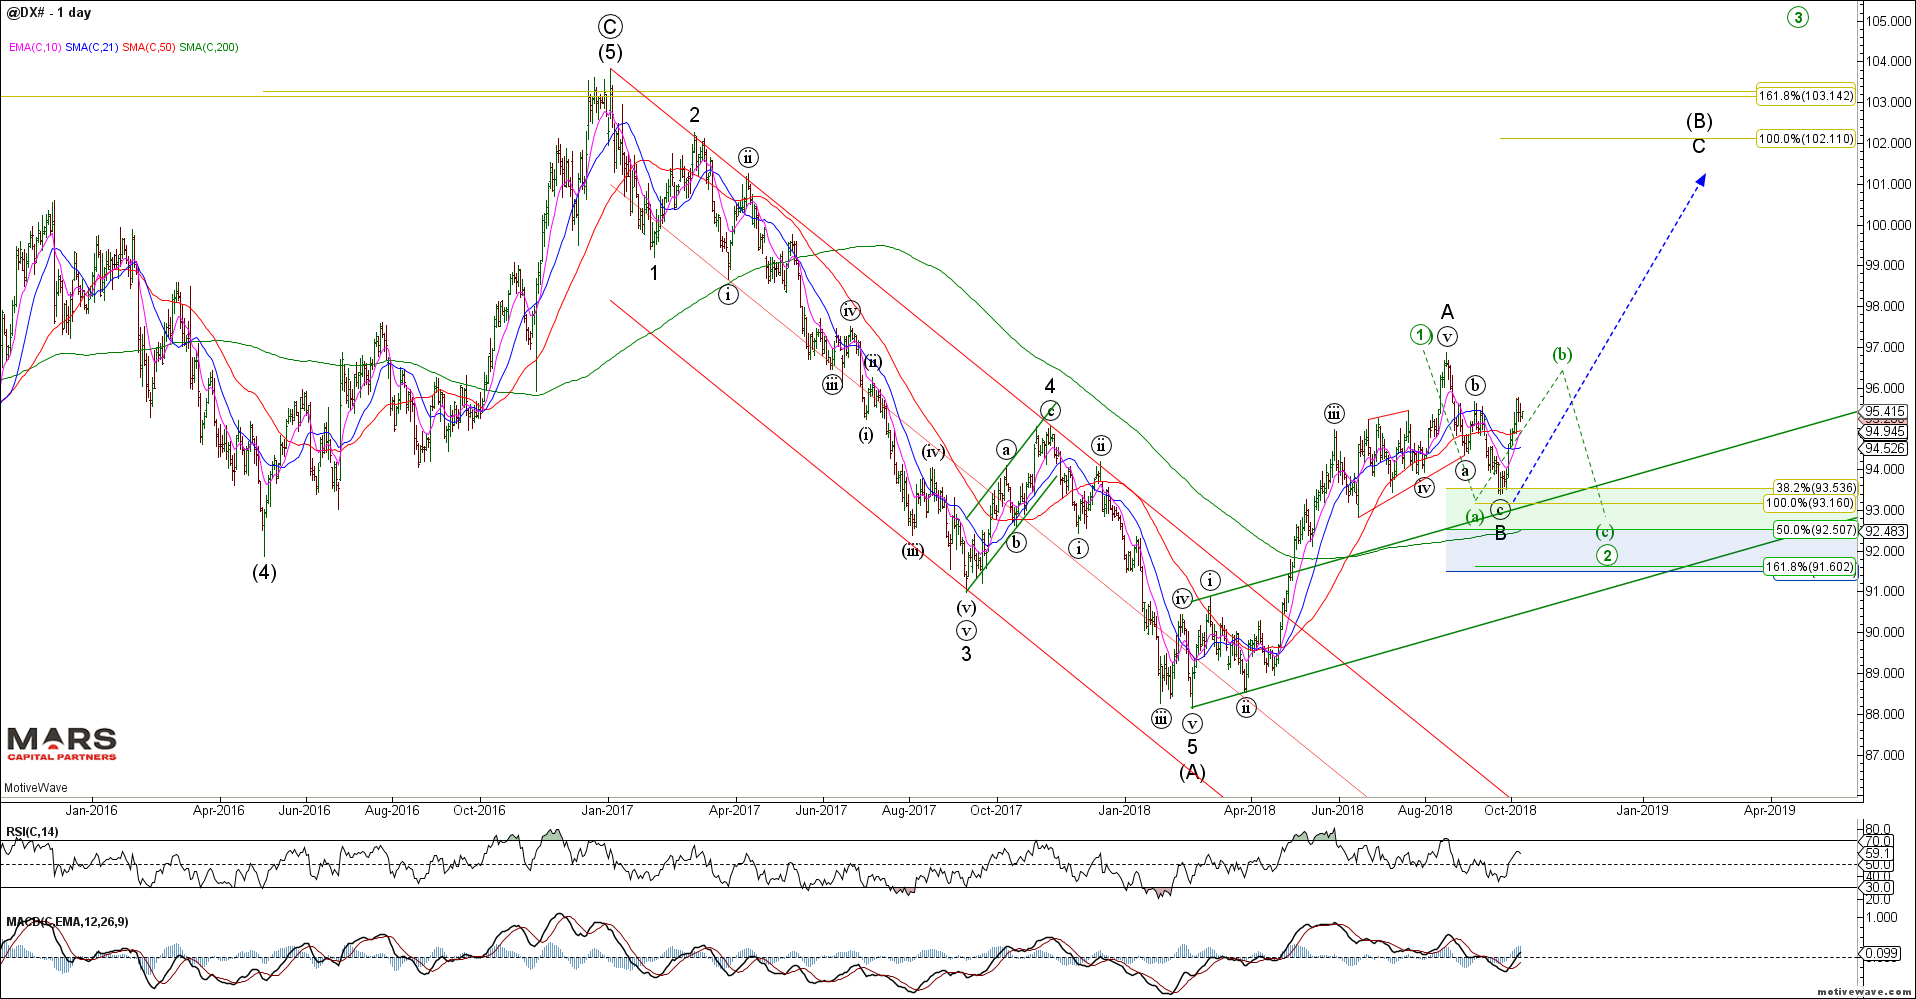
To the FX markets and US dollar strength continued as expected. The latest DXY rally appears impulsive so we remain bullish for at least a retest of the wave A/1 highs against recent swing lows. This is a very crowded trade.
DXY Daily
Near term the DXY trend has enough waves in place to potentially complete a smaller degree wave (i) / (a) but there are no strong signs of a top. Any decline back towards 94.30-94.60 would likely be an opportunity to add longs. The bigger picture trend remains higher.
DXY H2
The DXY appears to be another one-sided bet.
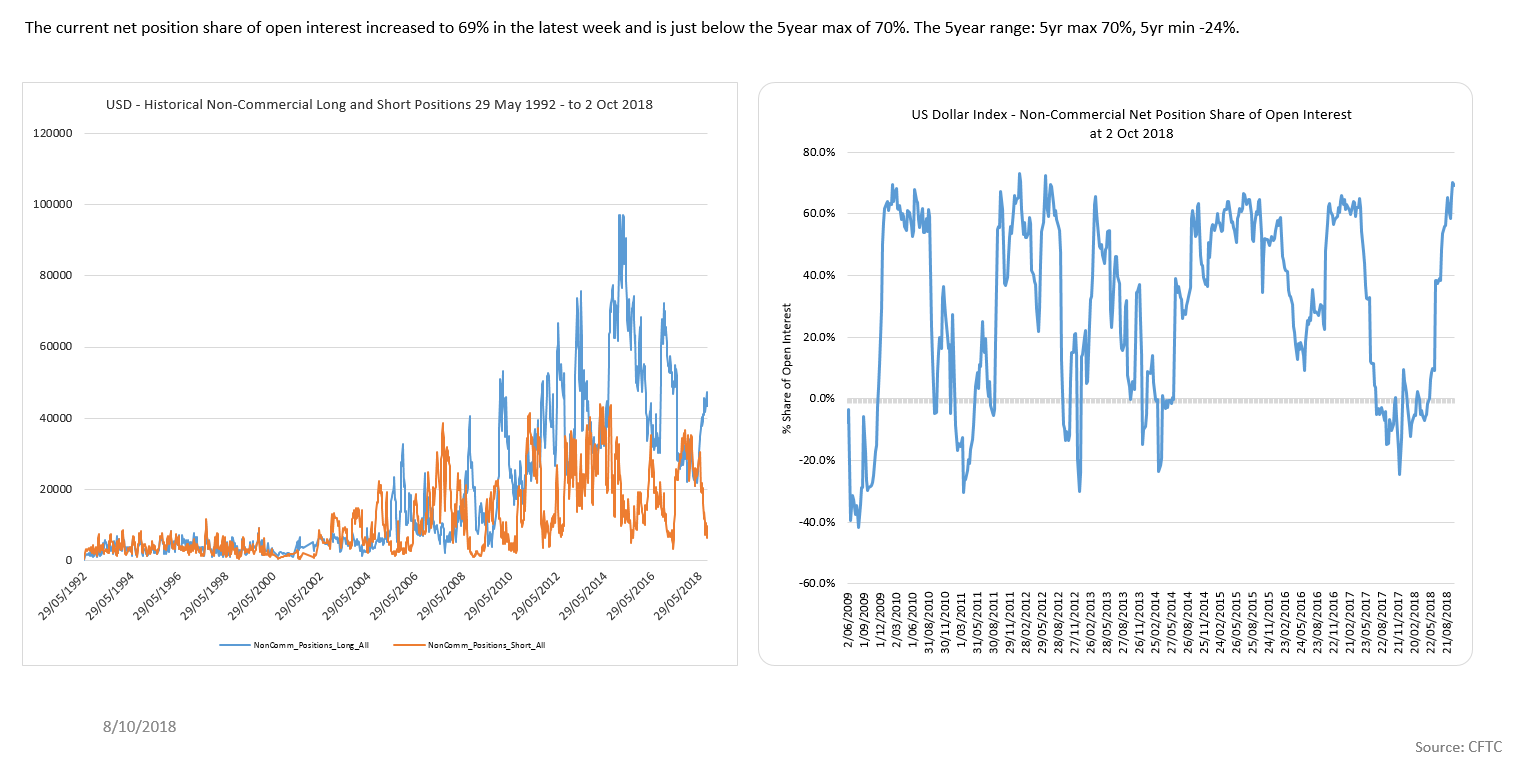
The DXY net position share of open interest is pushing multi-year highs once again.
Similarly, the Euro continues to decline impulsively from recent swing highs.The big picture trend remains down. The question is whether this recent decline is part of a larger corrective structure (green count) or something more immediately bearish.
EURUSD Daily
Near term the Euro has enough waves in place to complete its initial decline. Any counter-trend rally should find resistance in the 1.1600-1.1680 area before the next wave lower for (iii) / (c). We remain bearish the Euro as we look for a retest of the 1.1300 lows.
EURUSD H2
Surprisingly, Euro traders appear flat.
The USDJPY has stalled at our first resistance area (114.55-90)with enough waves to complete red wave (c). A close above 115 near term resistance likely sees a push higher towards our next targets in the 117 area.
USDJPY Daily
Near term the USDJPY may be forming a small degree H&S top likely confirmed on a break below 113.50 – this is highly speculative but I like the R/R for a potential near term top.
USDJPY H1
Yen shorts have spiked higher – prefer to fade this crowd.
The Aussie$ broke to new cycle lows last week after another failed rally attempt. The 50 day sma continues to act as strong resistance for this downtrend – there is no reason to buy the Aussie$ as it continues to trend lower into major 0.6830 support.
AUDUSD Daily
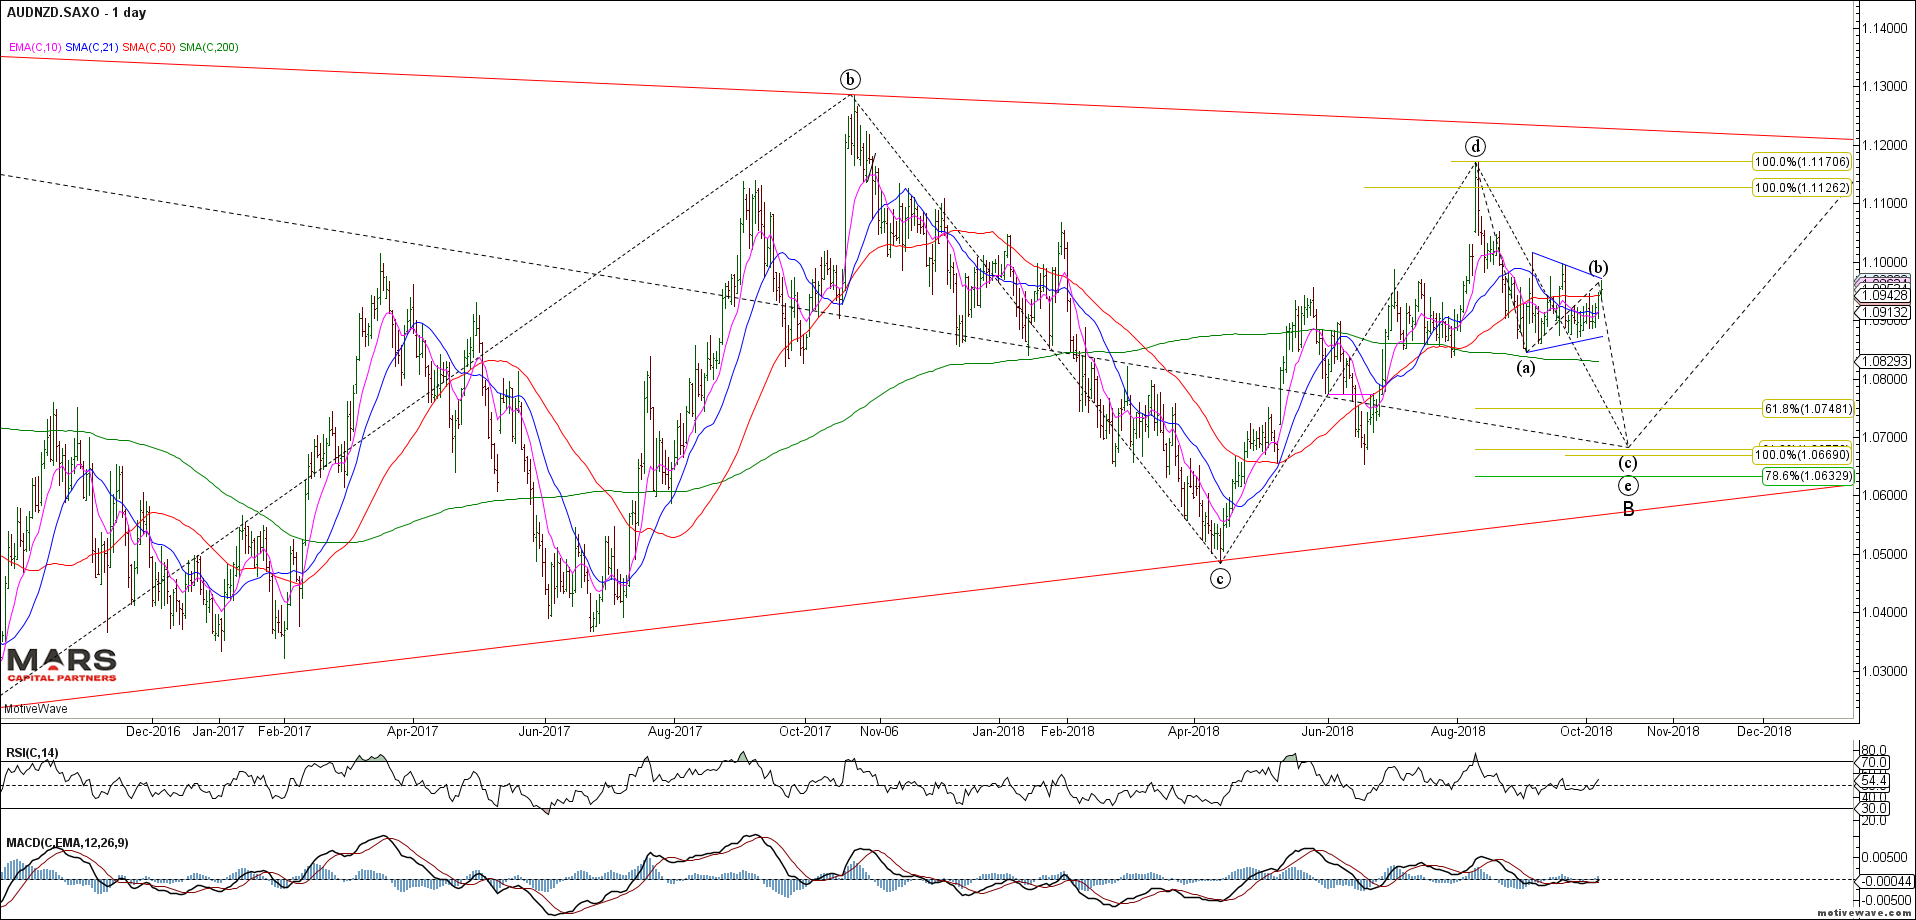
The AUDNZD should be completing a small degree wave (b) triangle prior to its wave (c) thrust lower towards 1.07 to complete its weekly wave B triangle correction – I continue to see this structure as bigger picture bullish with buy levels in the 1.07 area.
AUDNZD Daily
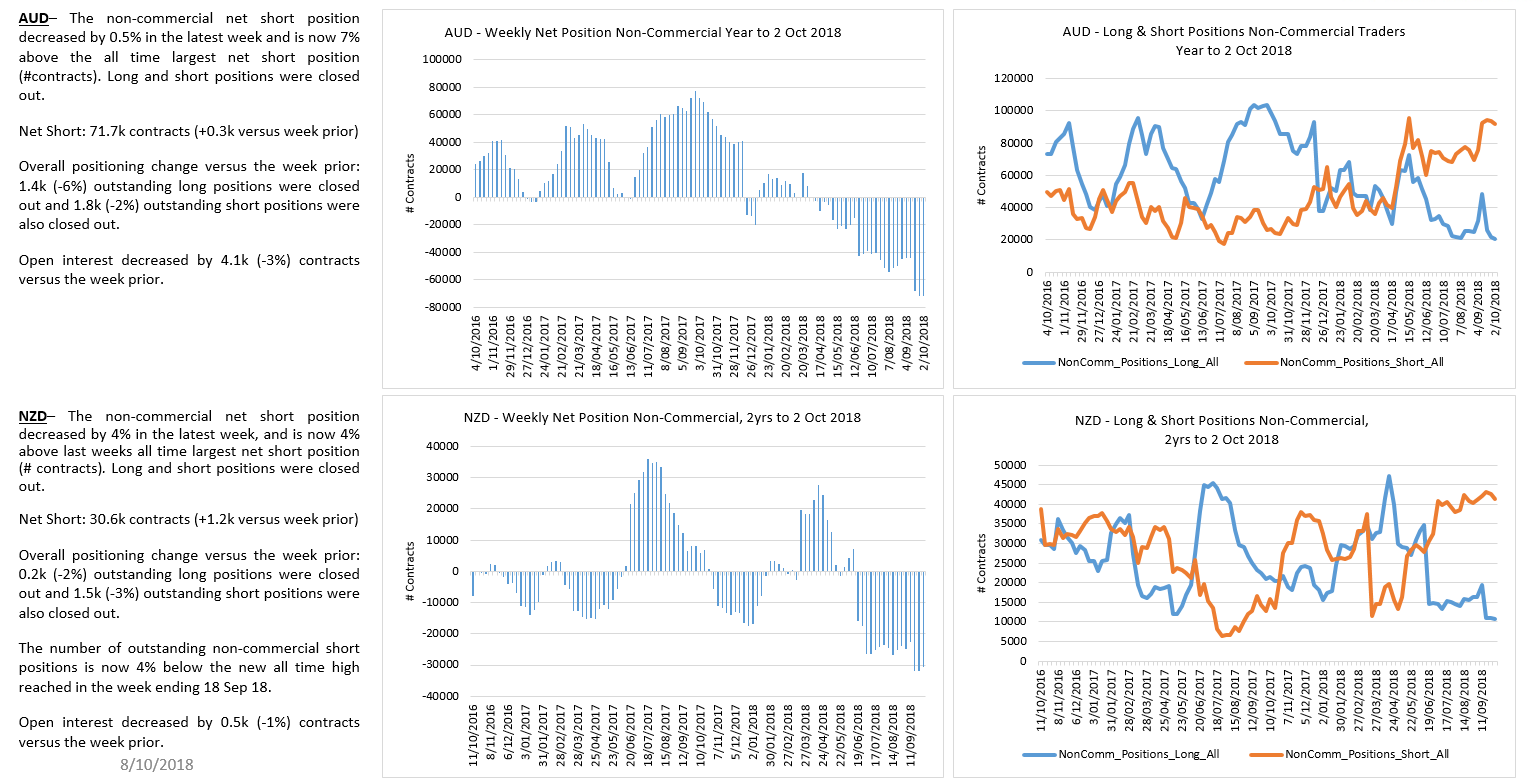
Both Aussie and Kiwi positioning remain at bearish extremes.
The USDCAD continues to frustrate as we fell short of our 1.2740 buy targets once again. What is becoming clear is that this decline from the June wave 1 highs is corrective (series of 3 wave counter-trend waves) so we will be looking for opportunities to get long this pair. I’m just not chasing it here. Bullish against recent swing lows.
USDCAD Daily
The near term USDCAD wave structure highlights the corrective nature of the decline within a broadening formation. Likely a very bullish structure on trade back above 1.3230
USDCAD H4
CAD traders have been whipsawed flat.
To the commodity markets and the precious metals pushed higher last week but Gold was unable to break out of near term congestion (1220-25 resistance) – it is difficult to be too bullish Gold given our stronger USDCNH outlook. May be best to allow for a decline towards our bigger picture 1120 buy zone.
Gold Daily
The recent Gold rally from Fib support does NOT look impulsive and could be forming a triangle.
Gold H2
I’d still prefer to see a capitulation in Gold longs.
Silver rallied more strongly than Goldbut was unable to clear $15 resistance. The structure of the rally is not clearly impulsive and failed at the 50 day sma. No position for me here.
Silver Daily
One bullish potential for Silver near term is a leading expanding diagonal (rare) – I just don’t like the idea of shorting into long term support here. Near term Silver needs to hold the 14.20-35 area and clear 15.00 to gain upside momentum. Very speculative but Silver calls are cheap.
Silver H2
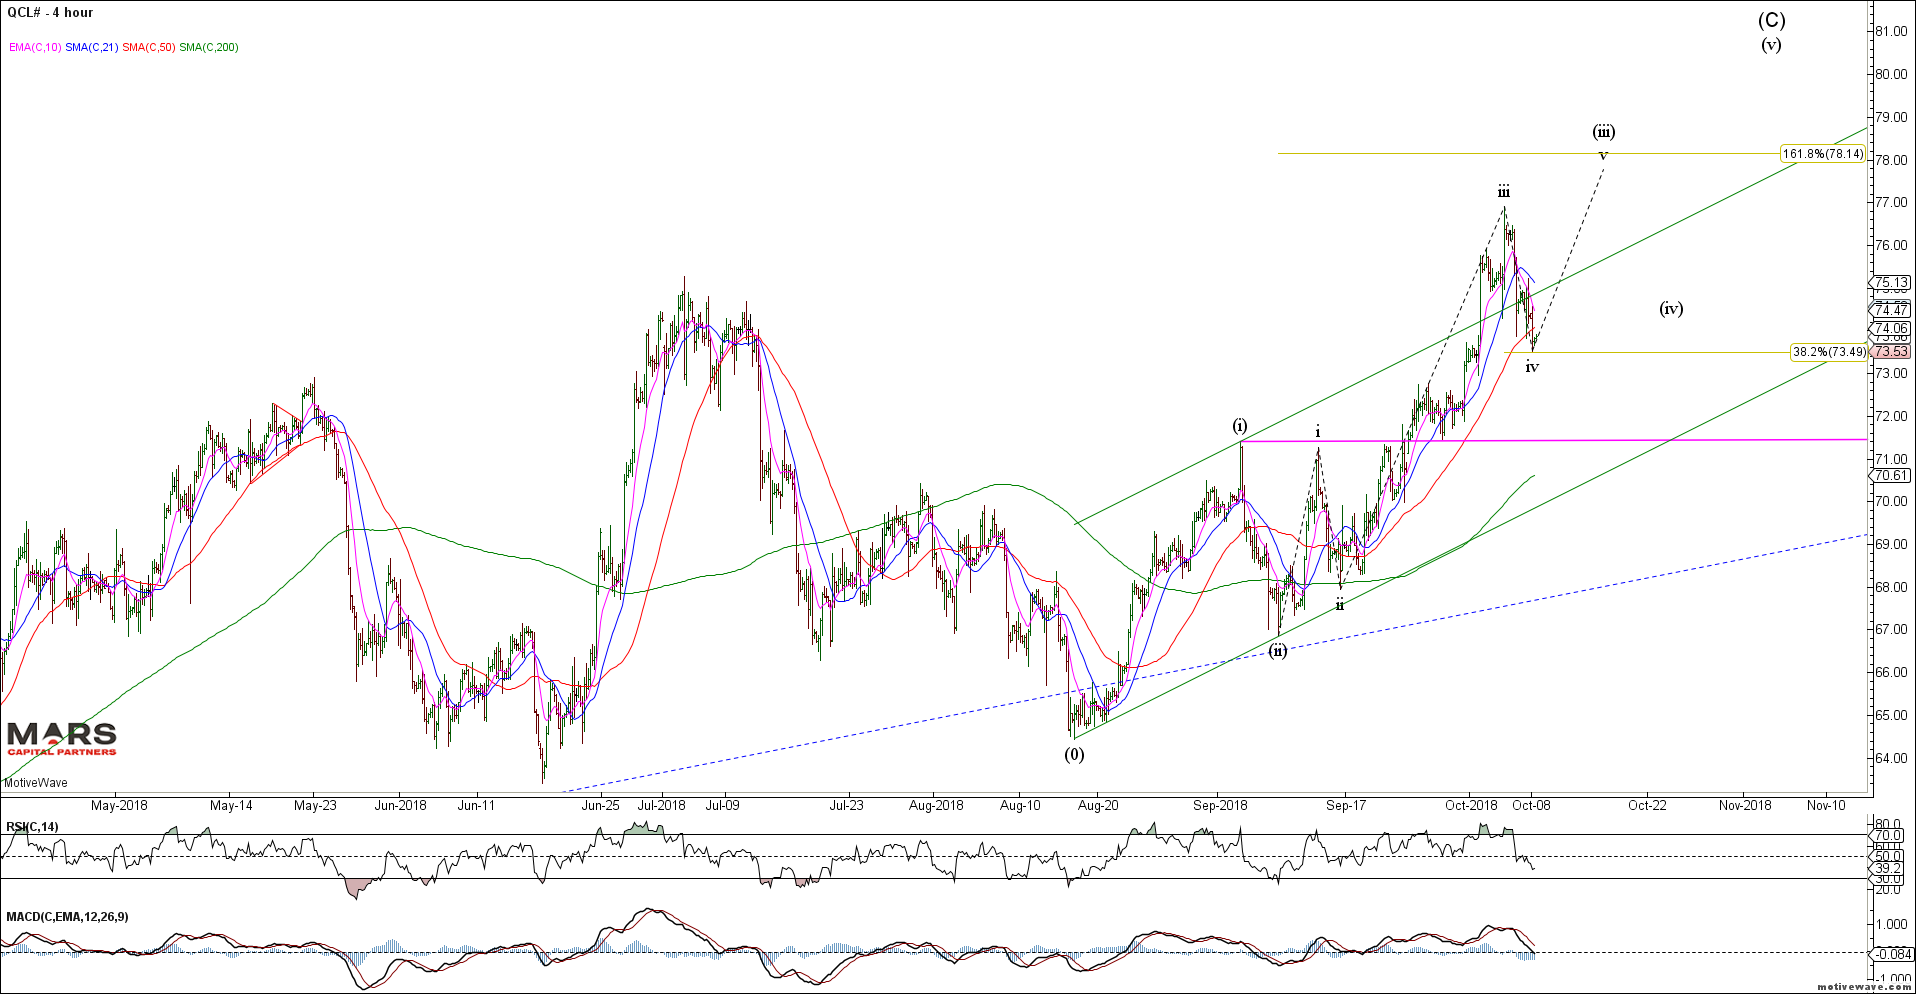
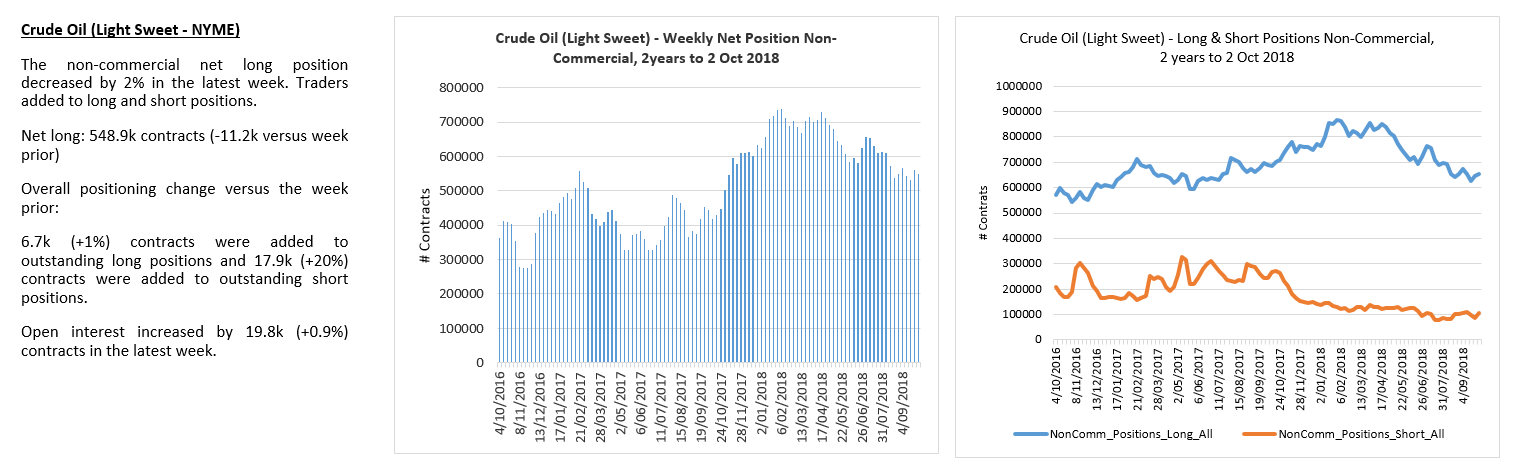
Crude Oil (CL) made new cycle highs following our impulsive rally structure and pulled back late last week for what should be a small degree wave iv within the larger bull trend. Trade back below 71.50 invalidates this near term bullish count and opens the door to more bearish potential.
CL H4
Natty Gas continued to extend its gains into Fib resistance as it attempts to break out of its corrective channel. Maybe a triangle? Still no interest for me here.
NG Daily
NG shorts slowly getting squeezed out.
Dr Copper continues to stall at Fib resistance – still no position or clear structure to trade against.
Last week we discussed our thesis for a potential market top in risk assets in “Has the Music Stopped?”.In Part 2 – “Calm before the storm” we examine in more detail the potential market structures unfolding in global equity markets. We remain tactically bearish equities as we start to see more evidence of a potential change in trend.
Last week, equity markets declined as expected with the market leaders (Nasdaq / Russell 2000) declining impulsively from new ATH’s providing further evidence of a tradable top in these markets. Bond markets continue to be range bound (within a larger bear market) while the US$ appears to be topping near term. This should provide near term support for the commodity complex within the context of a larger bear market.
From last week’s update…
“We now have a number of warning signs of a potential market top but we DO NOT yet have price confirmation of a change in trend (decline below the critical February low support).Our primary thesis remains that the bullish macro tailwinds that supported this post-GFC rally are turning into headwinds as liquidity is drained from the system, global debt is peaking while global growth is slowing. All the while, the Trump administration has engaged in a trade war with both its Allies (Europe / NAFTA) and Enemies (China / Russia). We see evidence of reduced liquidity as higher risk assets are being sold off (eg. Emerging Markets) and remaining liquidity being concentrated in the last bastion of “hope” of FAANG and the Russell 2000 – the problem is that technically, these “market leaders” are actually tracing out ENDING waves of the post-GFC equity market rally.”
We are now seeing increased evidence of a major market top where fundamentals, technicals and sentiment align… this is an important week for risk assets as tariffs on Chinese imports are expected to start July 6th – where Trump (the immovable) meets Xi (the unstoppable).
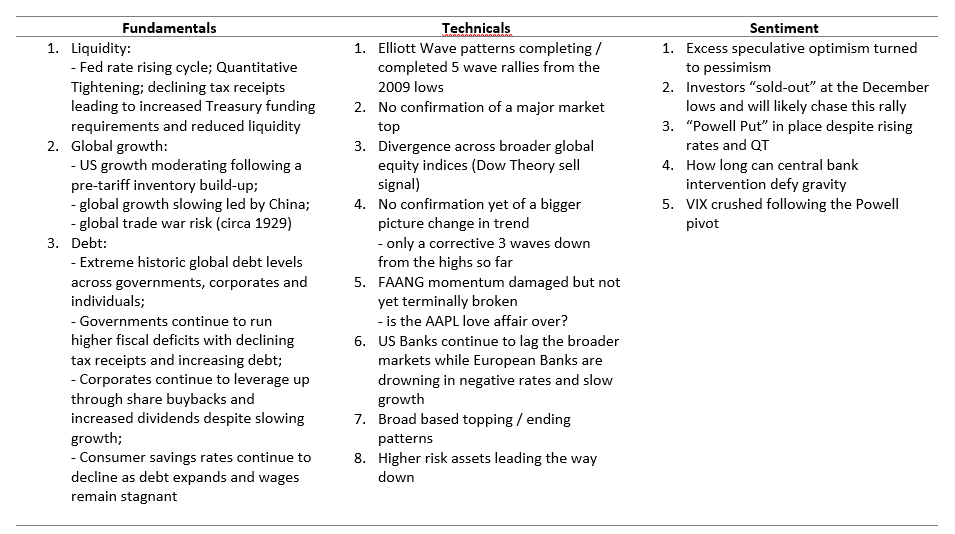
What we have:
What we do not yet have: Confirmed evidence of a change in trend – as defined by a broad based market decline (5 wave impulsive decline) that breaks the February lows.
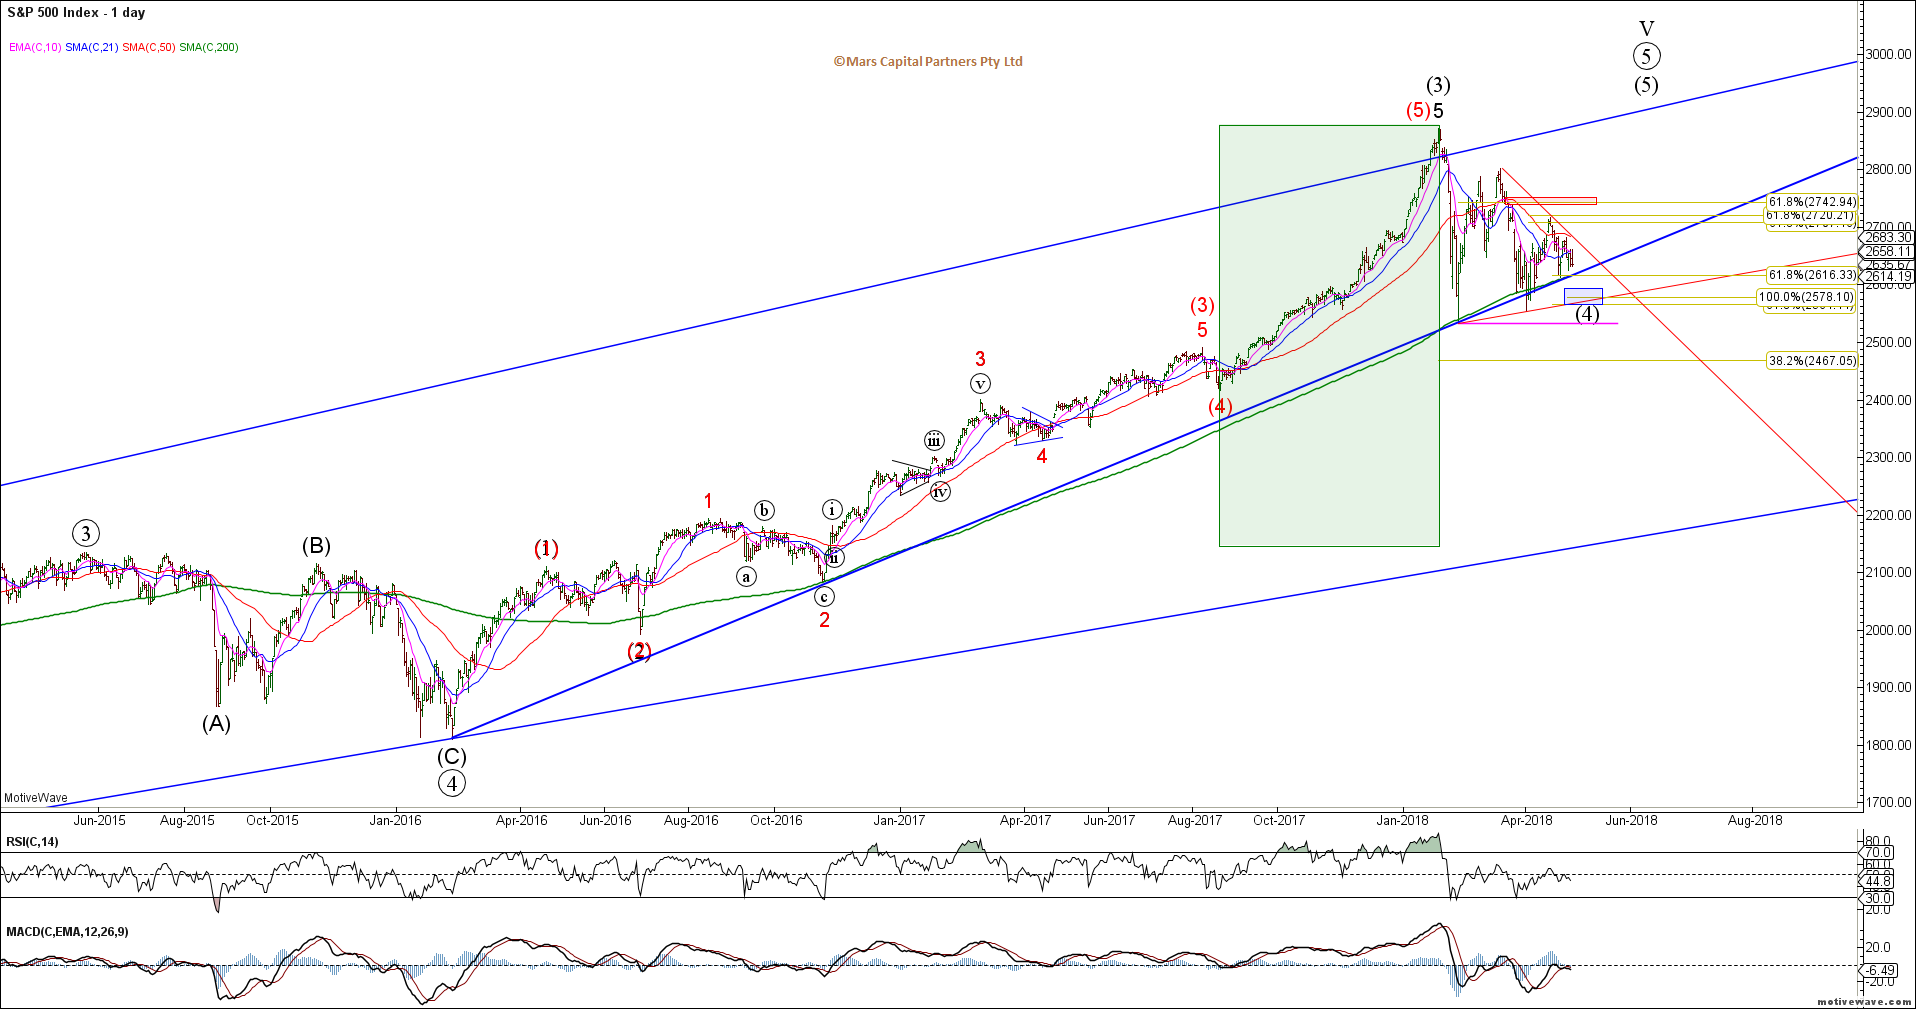
From a big picture perspective the SPX continues to trace out the final waves of this rally from the 2009 lows which we expect to be fully retraced in the years ahead. The question is whether this market topped In January 2018 (red count) or requires a marginal new high to complete the rally (black count) – either way, our contention is that this market is in the process of topping and downside risks abound.
SPX Semi-log Weekly
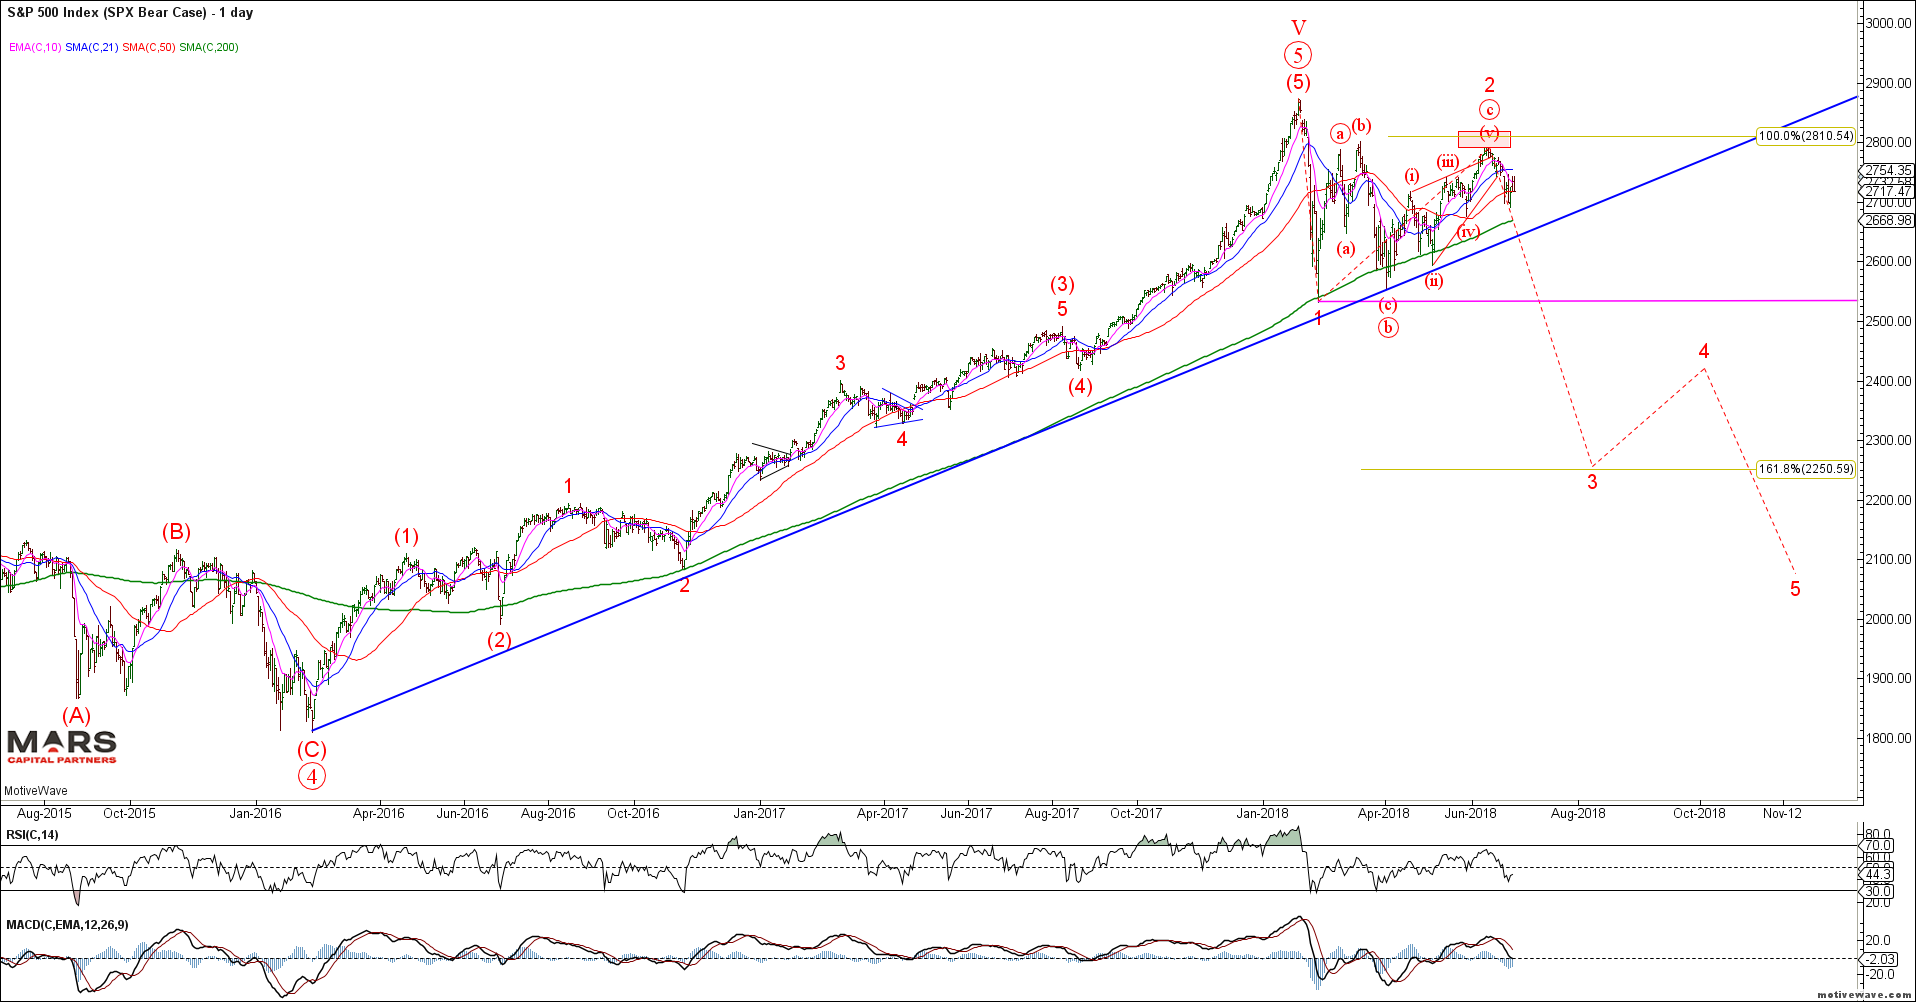
Our preferred SPX case is that the market topped in January 2018. The counter-trend rally likely topped in June and we should now see an accelerated decline through the February lows towards our 2250 measured downside target. This immediate bear case is wrong on a push to new ATH’s.
SPX Bear Case Daily
The alternate SPX case is that we are completing a wave (4) counter-trend decline prior to a FINAL push to new marginal highs. This structure assumes we are completing a wave (4) symmetrical Triangle prior to a final wave (5) push to new marginal ATH’s (blue case) or a false break of the February lows towards 2450-70 Fib support before a bullish reversal higher (green count). While not our preferred options, they remain possible so we must be aware of the potential. Either way, we remain bearish from a bigger picture perspective.
SPX Bull Case Daily
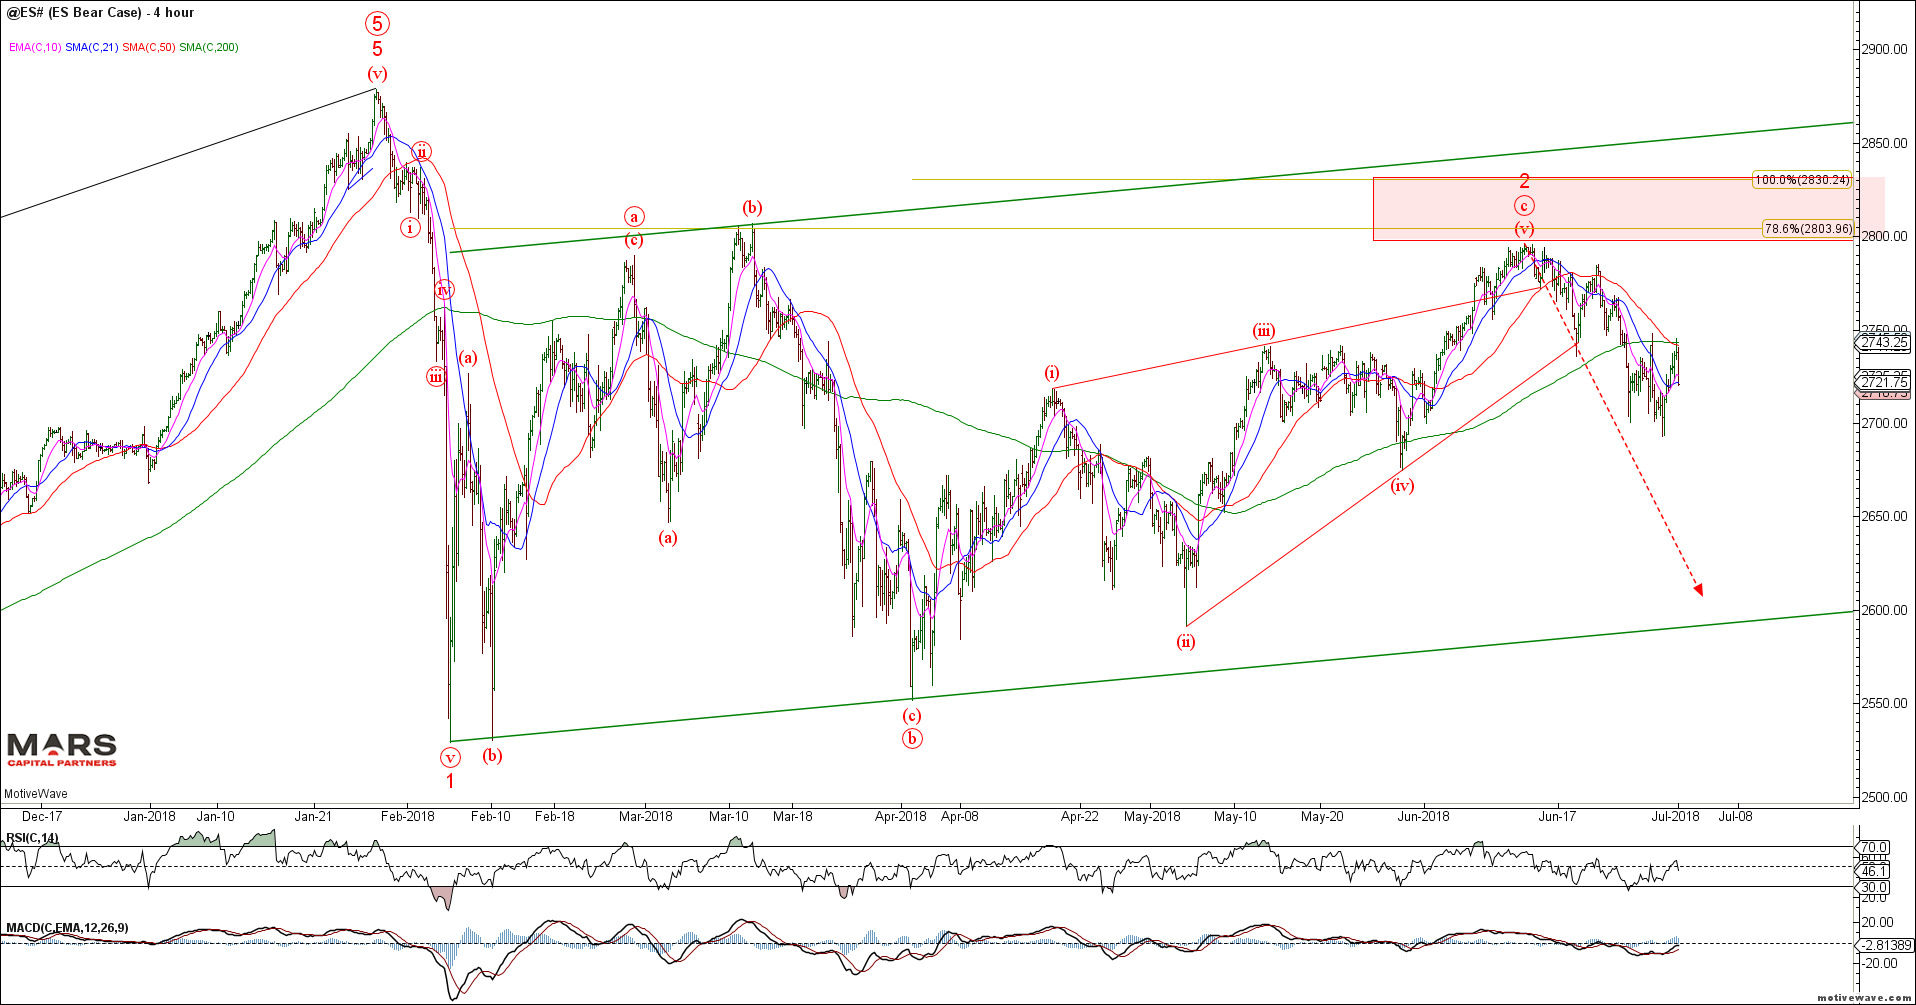
We continue to be tactically bearish ES looking for key resistance in the 2800-30 area to hold.We do NOT expect the SPX / Dow to confirm the Nasdaq / IWM rally to new ATH’s.
ES H4
Traders remain net long but shorts are increasing.
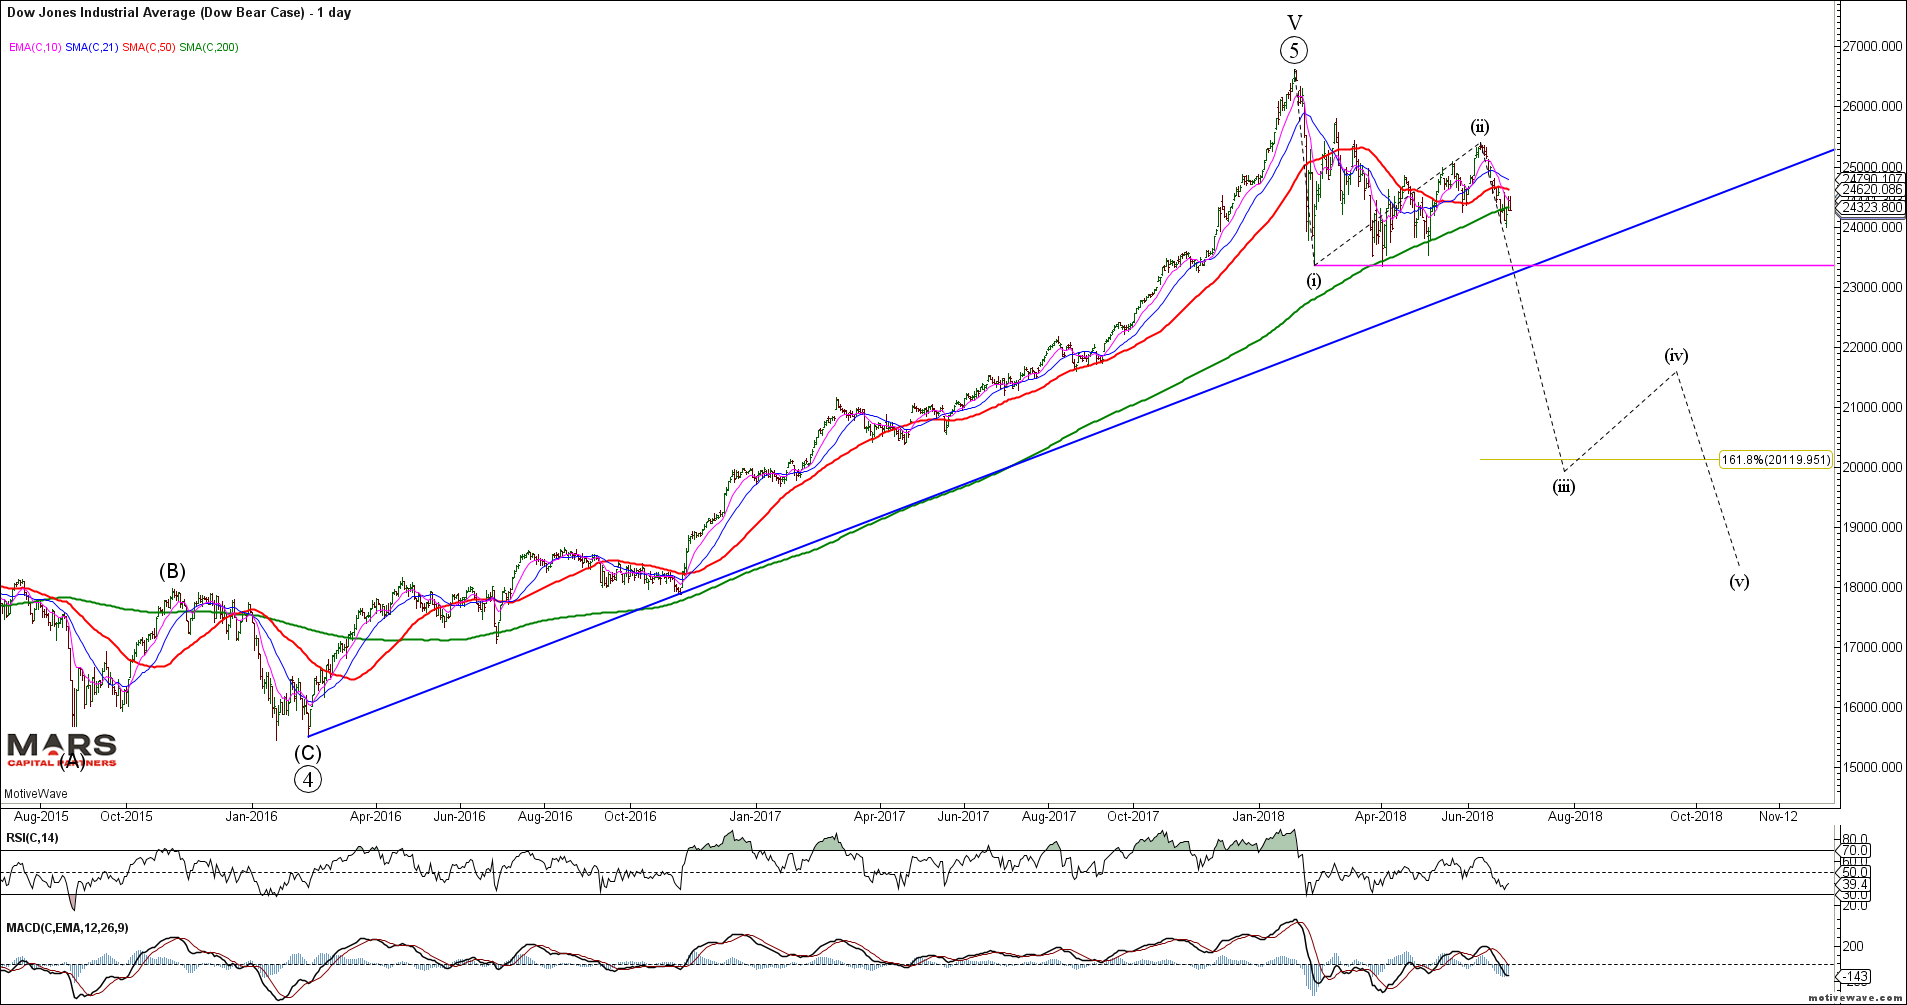
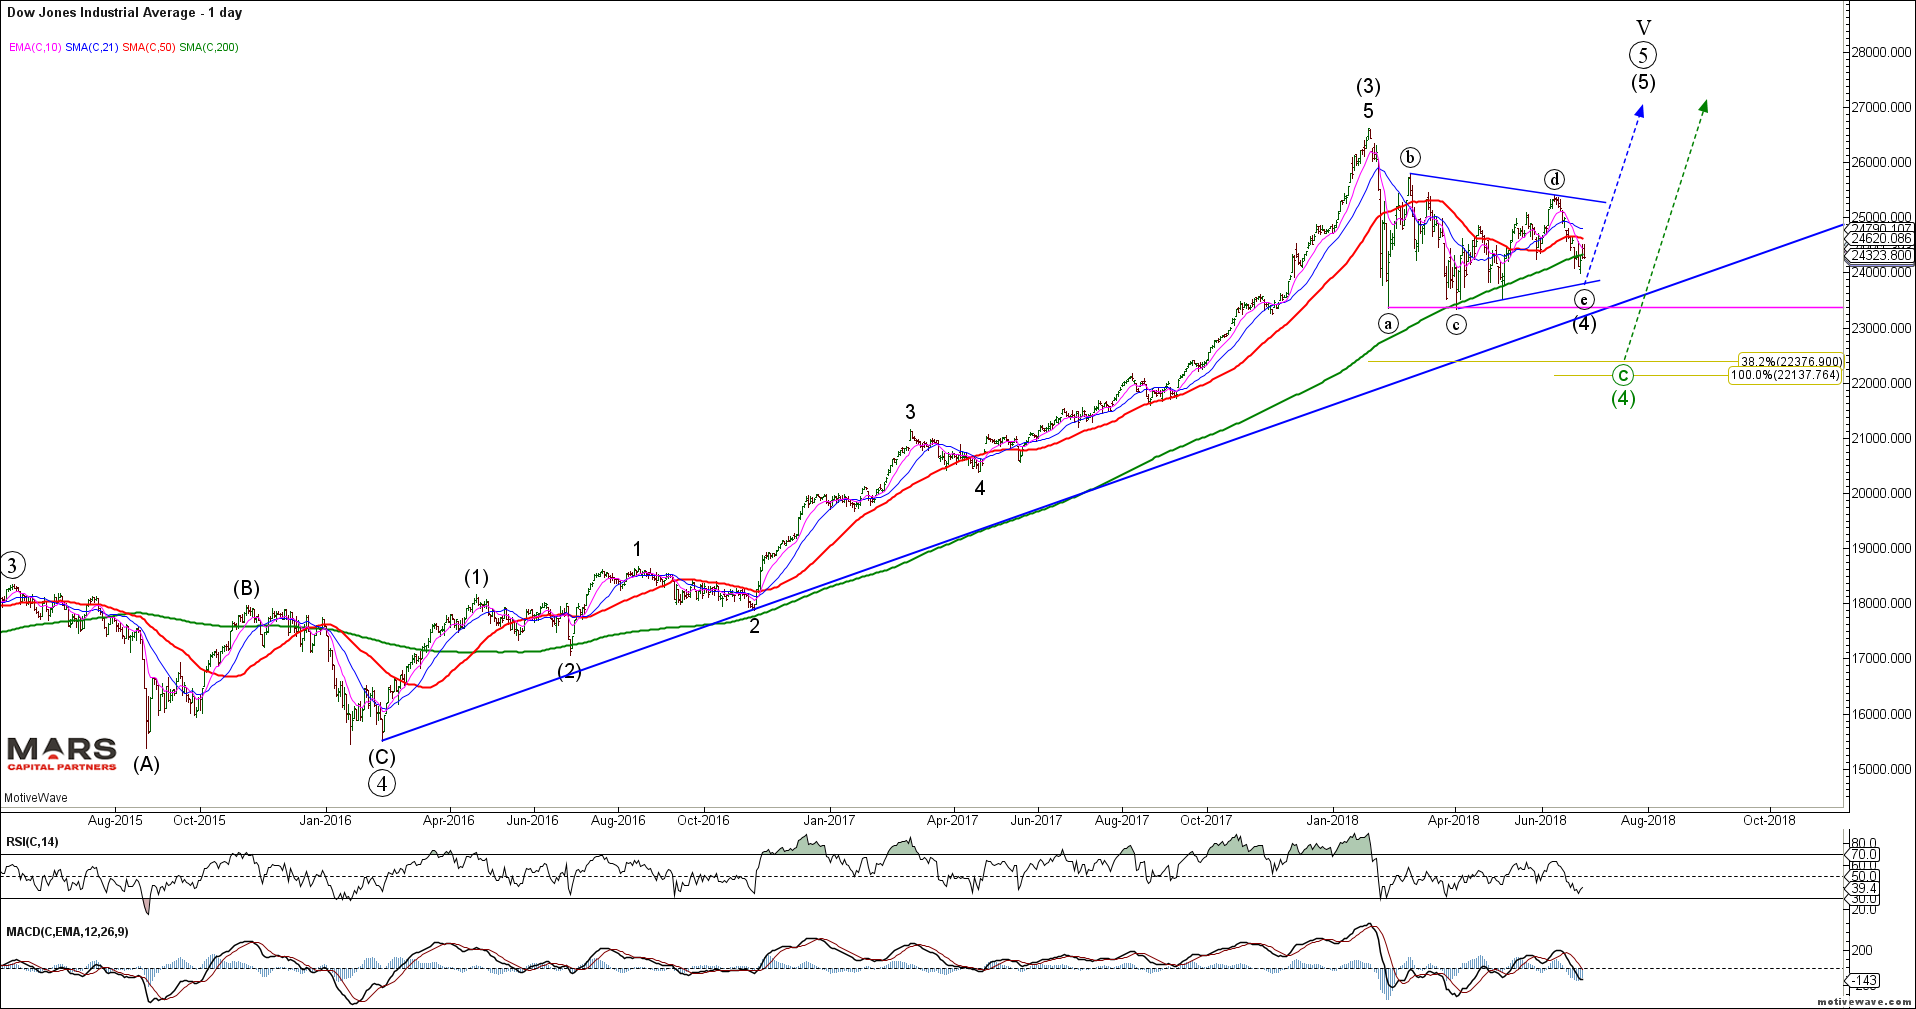
The Dow shows the same bull/bear structure potentials as the SPX but relatively weaker given its exposure to potential trade wars and rising US$.
Dow Bear Case Daily
DJIA Bull Case Daily
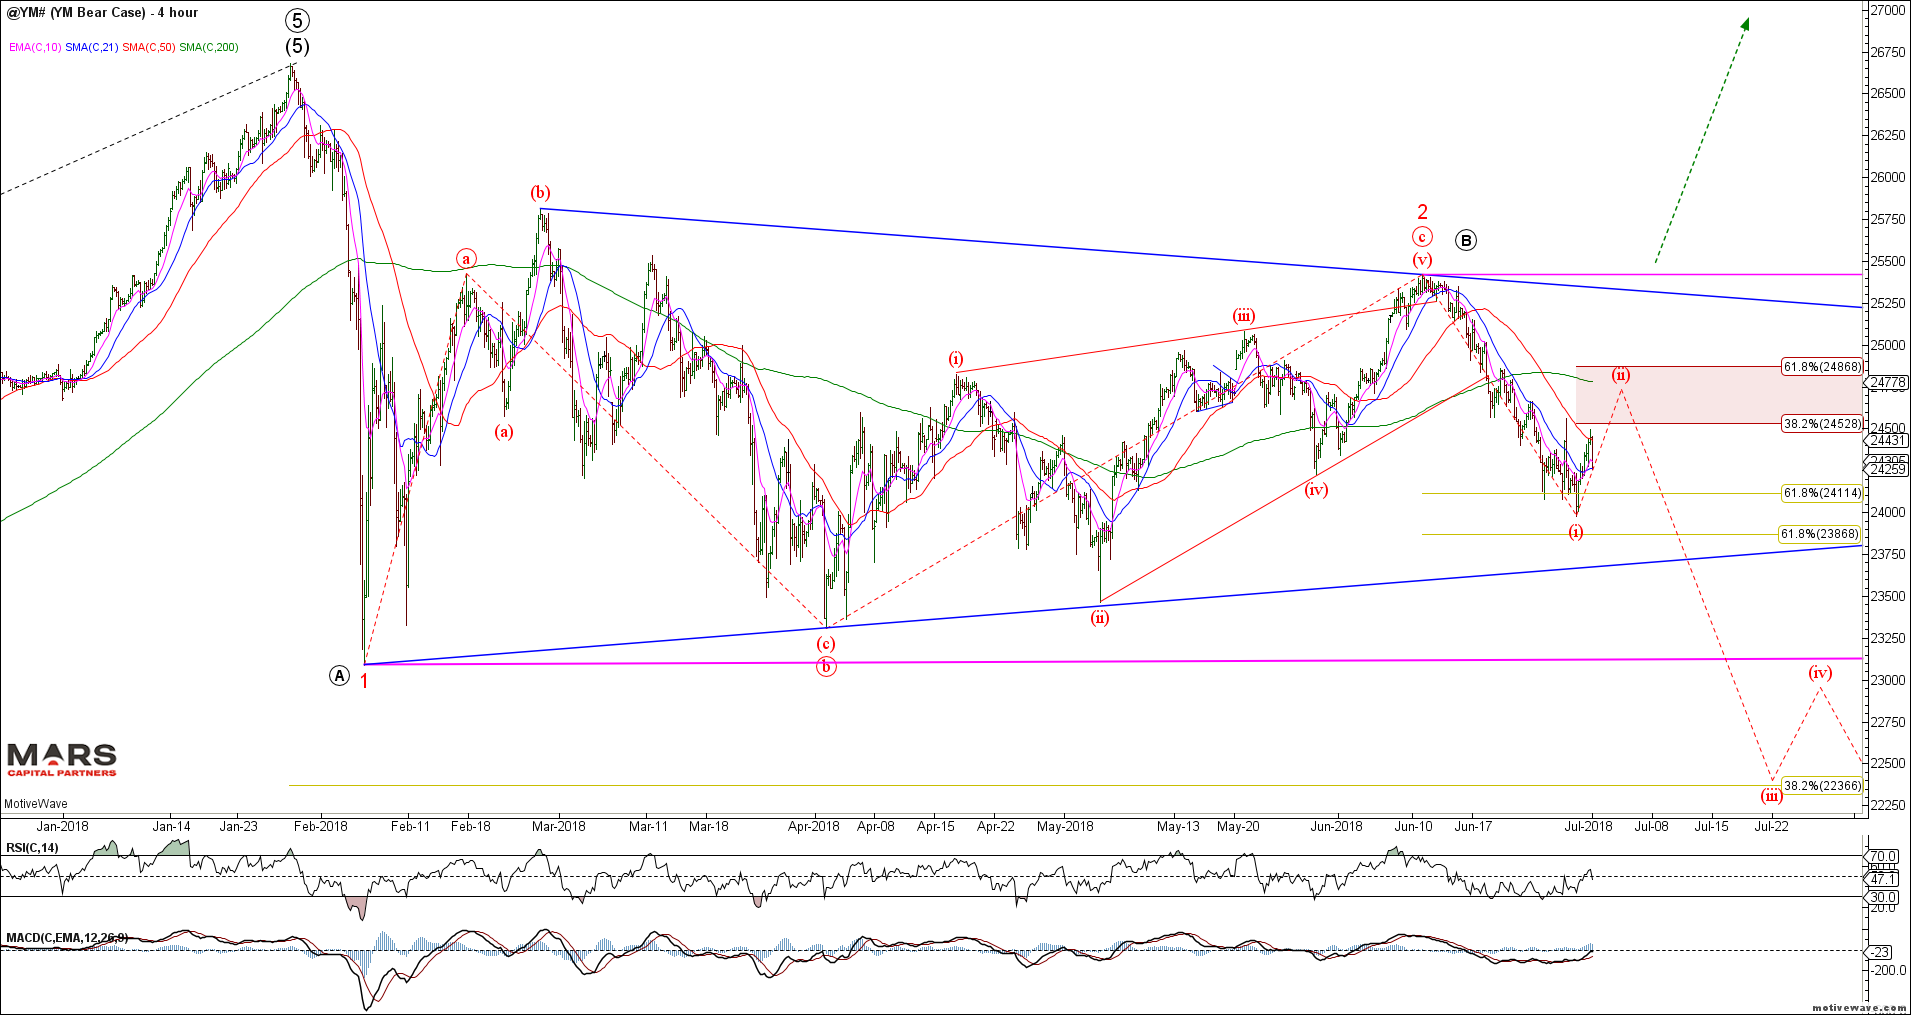
The Dow futures (YM) remain range bound within a contracting triangle. While we could see a near term counter-trend rally towards 24500-868, we remain bearish looking for a break of the February lows. Trade back above the June highs invalidates this bearish count and likely sees a test of the ATH’s.
YM H4
Shorts increasing at the low end of the trading range.
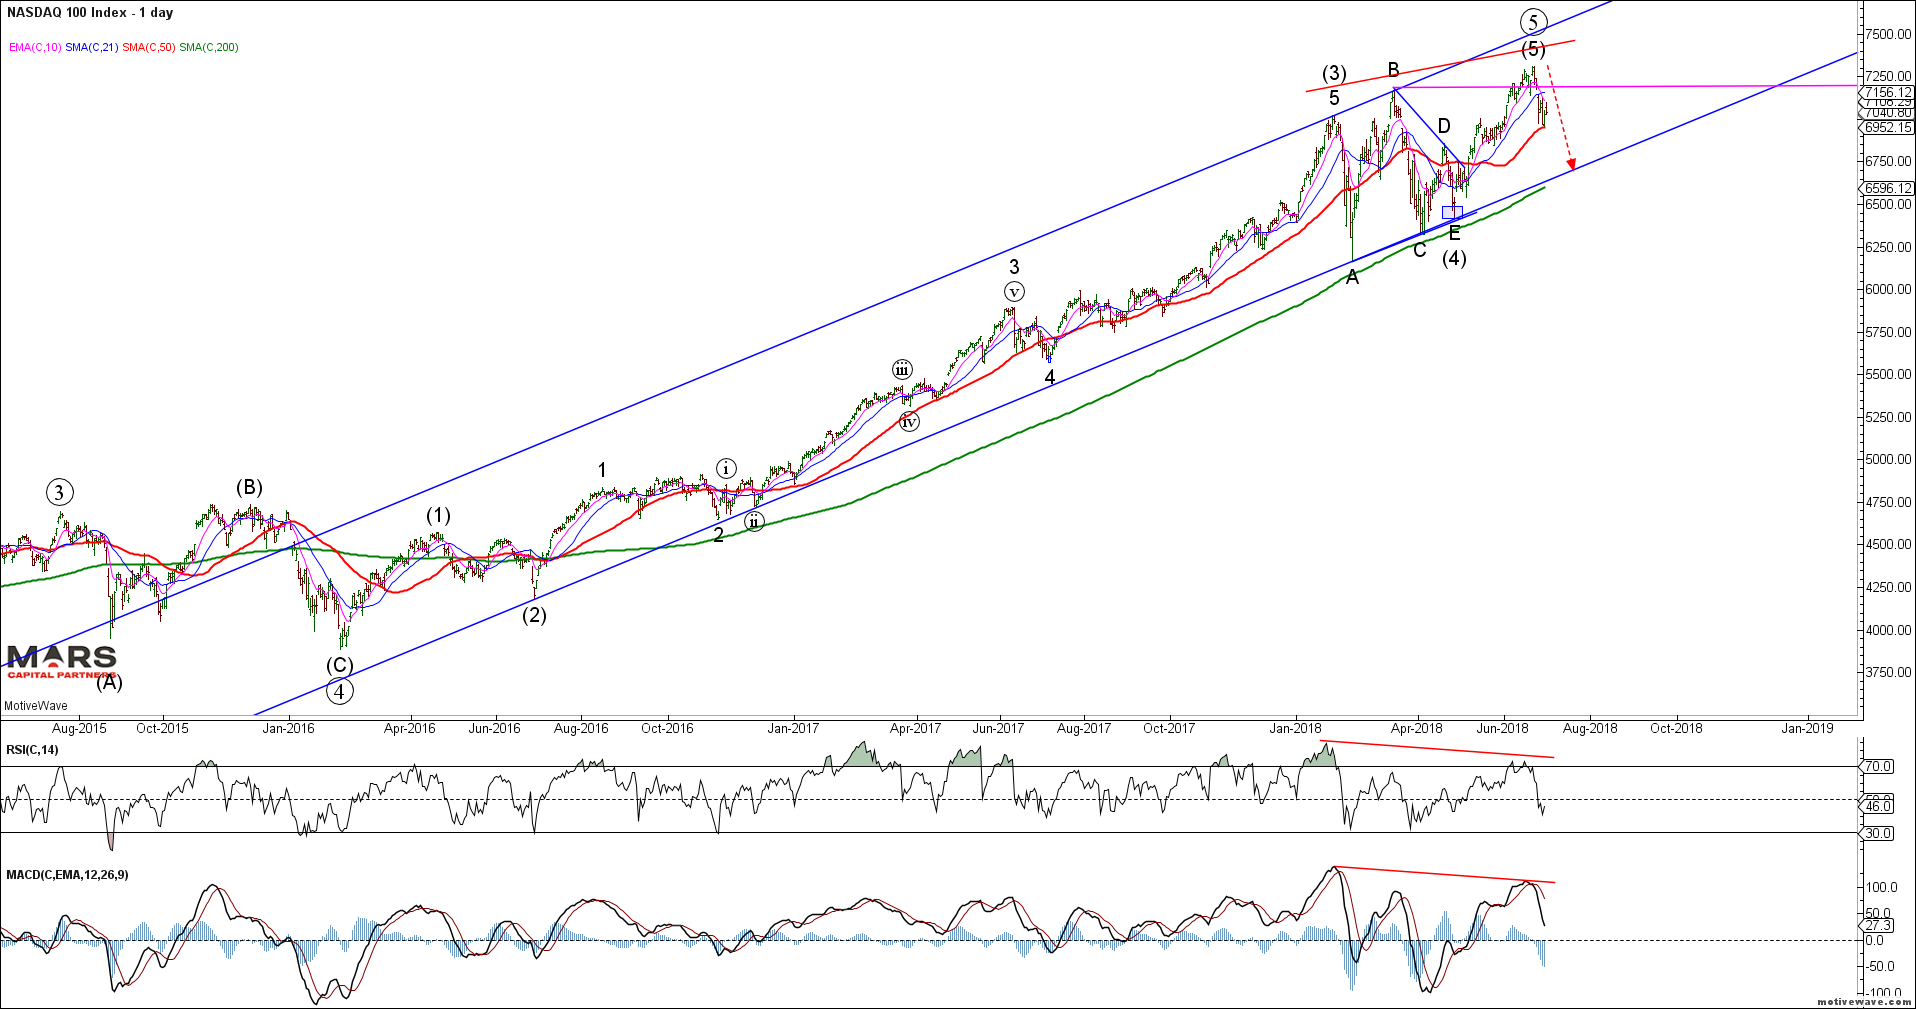
Importantly, as highlighted last week, the Nasdaq indices (NDX/Comp) now have enough waves in place to complete its rally from the 2016 lows – new ATH’s have not been confirmed by momentum and we now have a small degree impulsive decline signalling a change in trend to down.Wave 5 thrusts from wave 4 Triangles are ENDING moves. We are now bearish the Nasdaq Indices against recent swing highs. Bears need to break strong support at the rising trend line and 200 day sma around 6600.
NDX Daily
The near term NDX count now shows an impulsive 5 wave decline from recent highs(signifying a near term change in trend to down) followed by a bounce off the 50 day sma. We would expect any counter-trend rally to terminate in the 7130-7200 resistance area before turning lower once again to break the 50 day sma (6950). The bears then need to break strong support that resides in the 6600 area of the 200 day sma to continue its impulsive 5 wave decline shown below. The near term bear case is wrong above the June highs.
NDX H2
NQ shorts increasing off cycle lows.
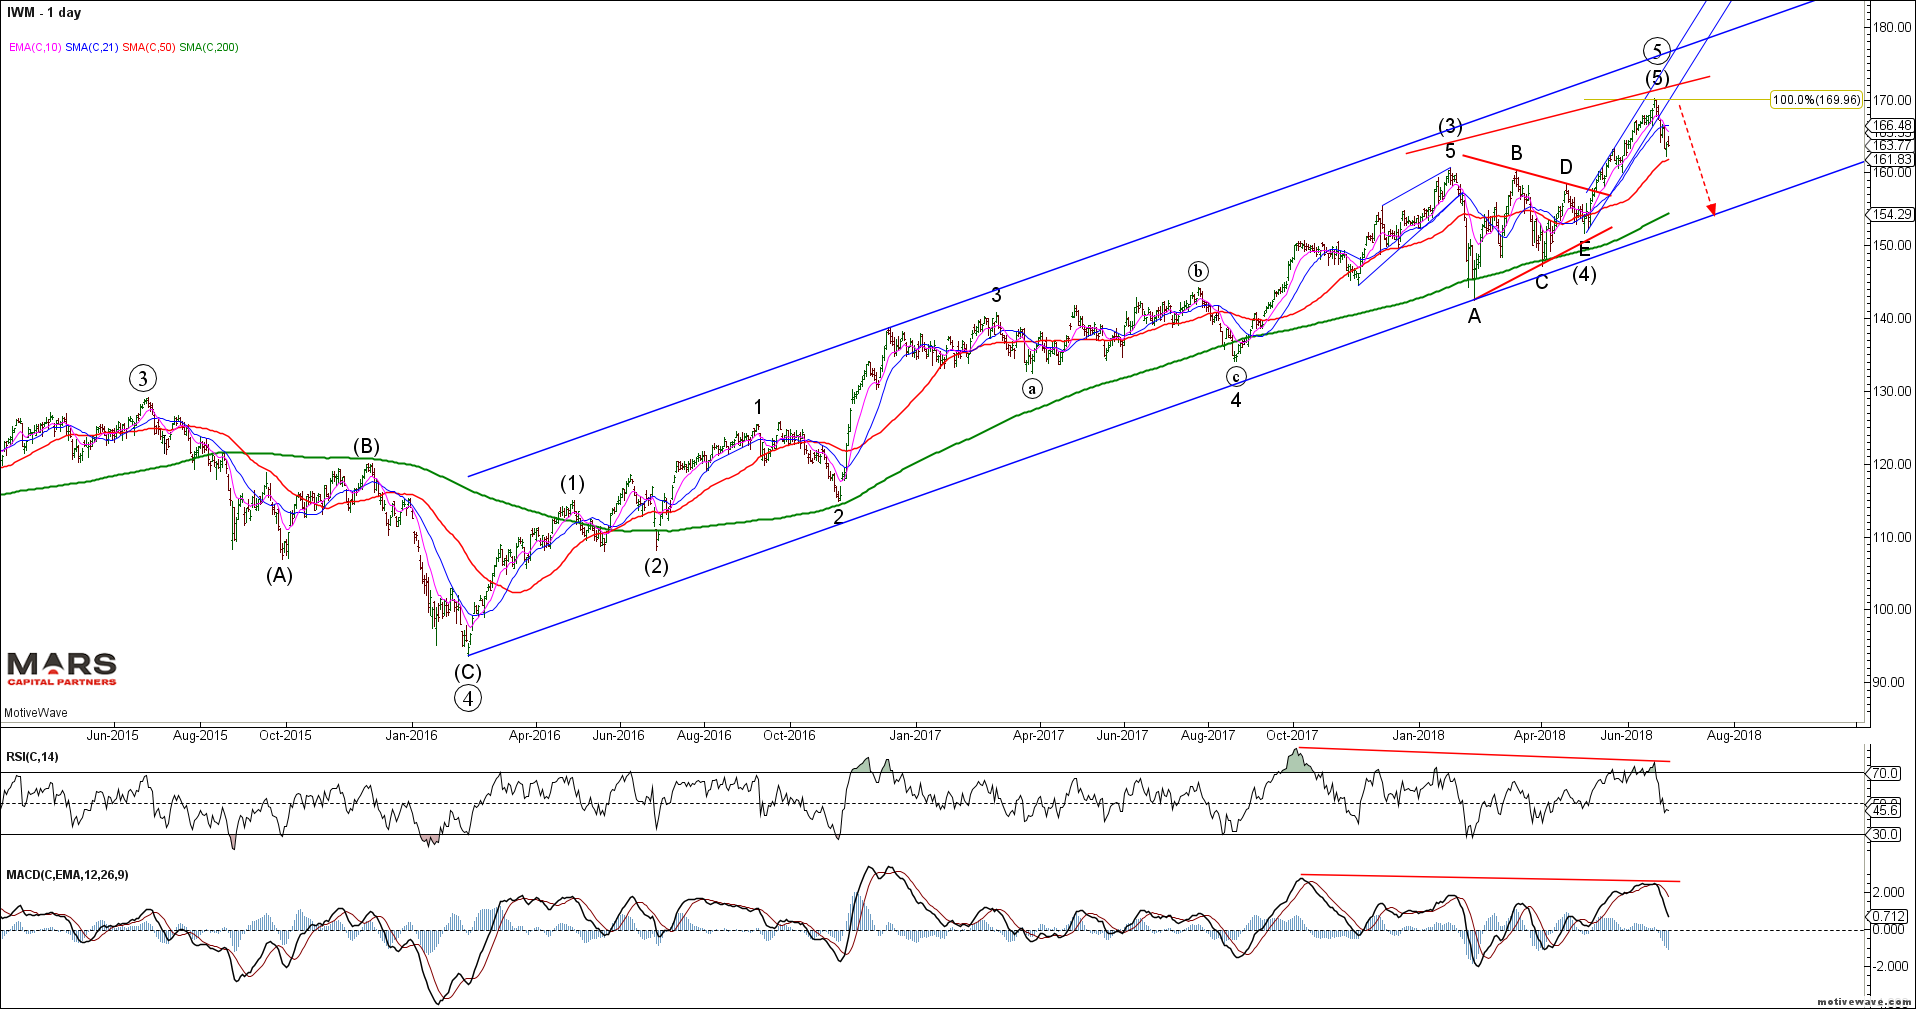
Like the Nasdaq, the Russell 2000 (IWM) looks to have completed its 5th wave triangle thrust to new ATH’s potentially ending the rally since 2016.Last week’s decline into the 50 day sma appears impulsive so we should expect further downside next week that targets the 200 day sma as strong support. Note that momentum peaked back in October 2017. We need to see a strong impulsive decline that breaks trend support to signify a bigger picture change in trend.
IWM Daily
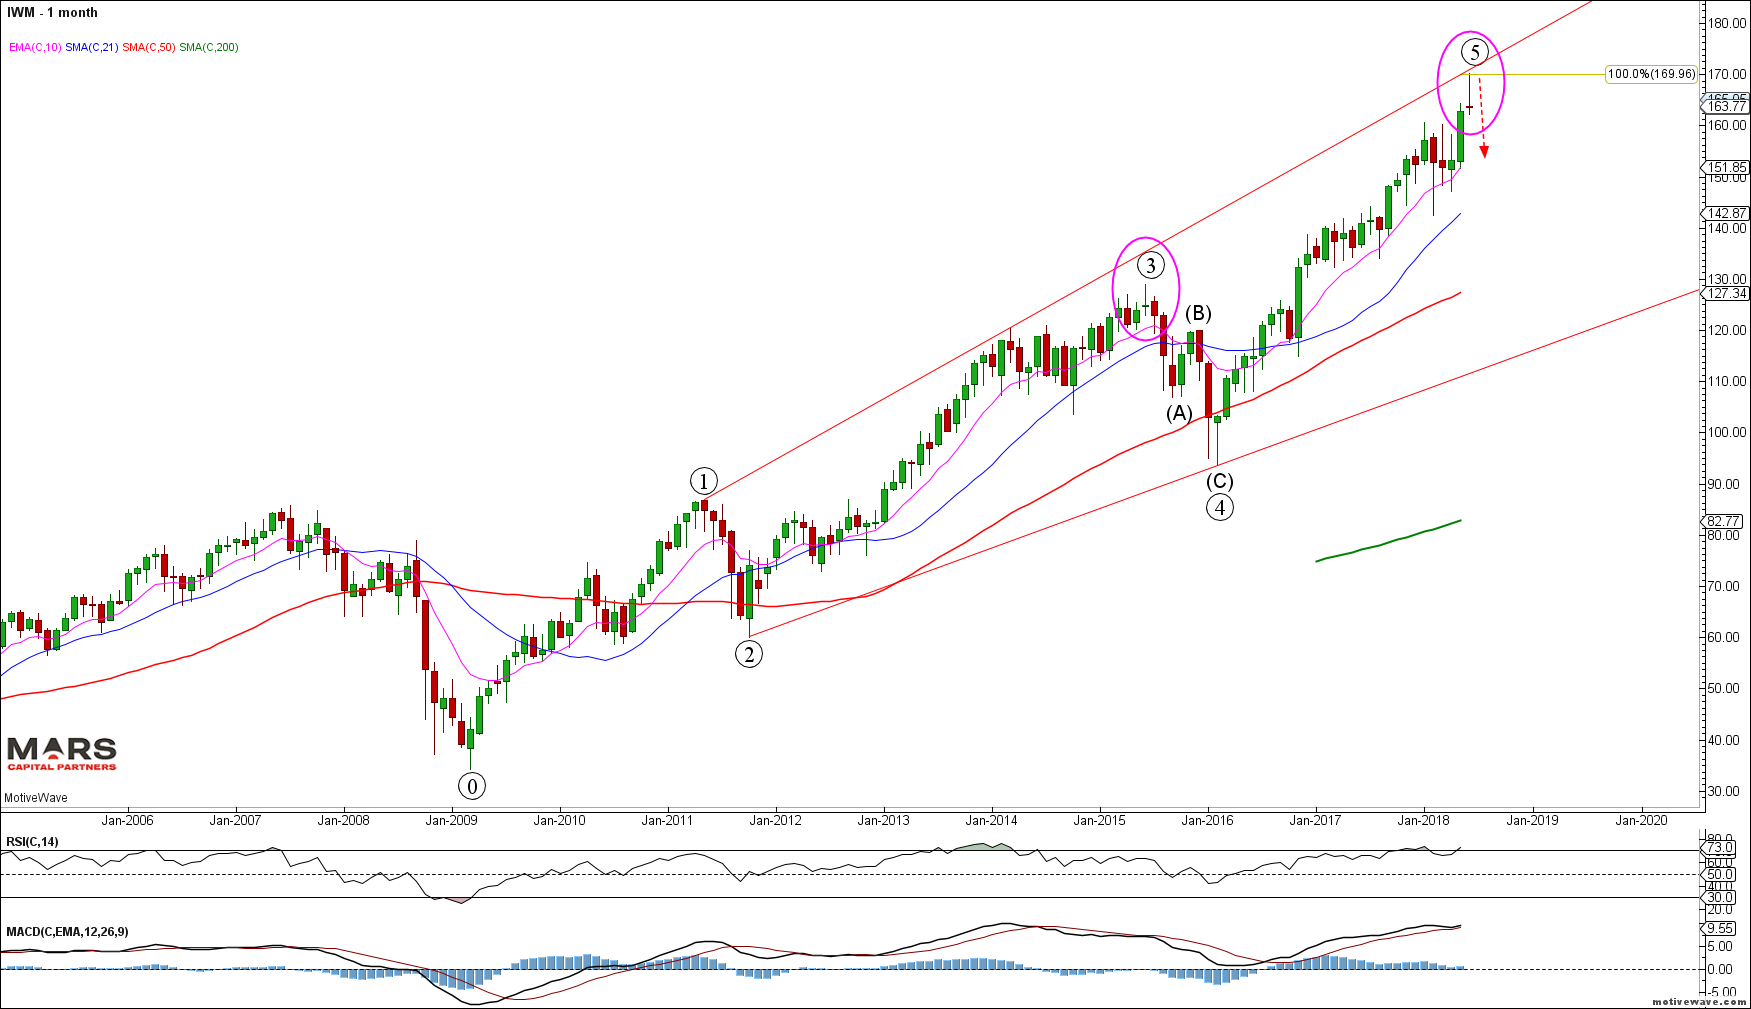
Interestingly, the IWM formed a monthly “shooting star” candle that requires downside follow-through next week to confirm the potential top… the Russell formed the same top in June 2015 as highlighted below.
IWM Monthly
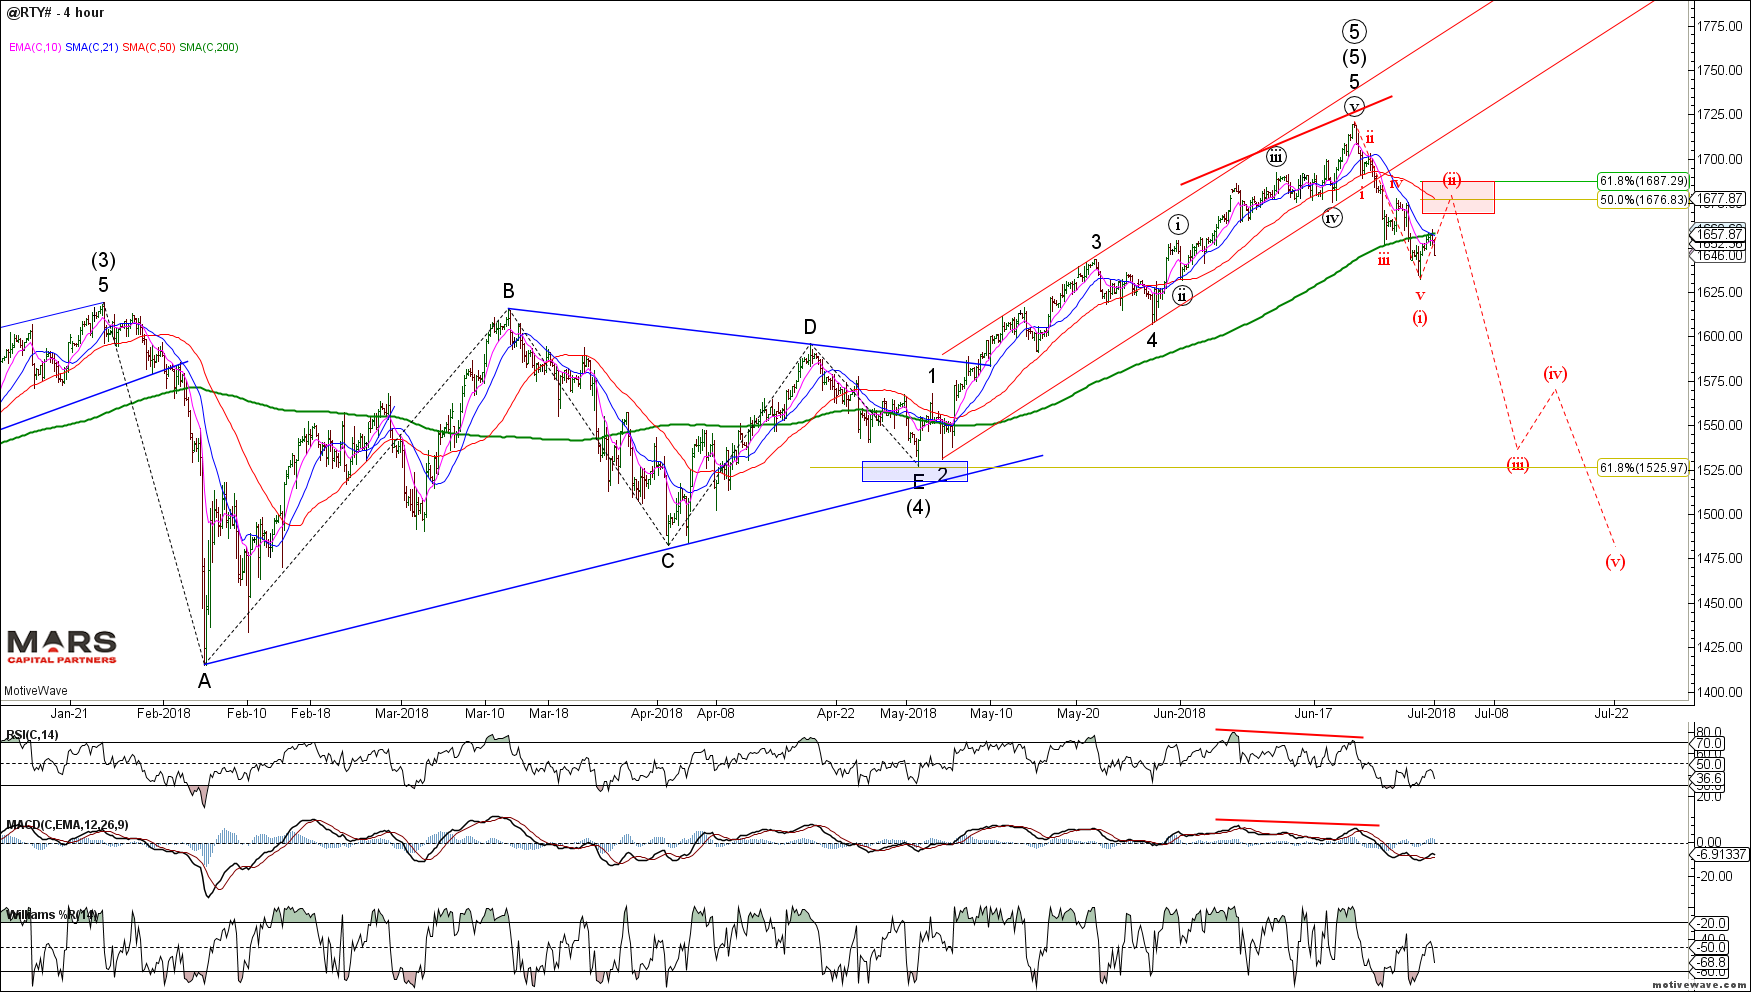
The near term RTY count shows a completed 5 wave rally into new ATH’s followed by a small degree 5 wave decline into the 50 day sma support. Expect any counter-trend rally to find strong resistance in the 1675-90 area as we look for this market to turn down next week. The near term bear case is wrong above the June highs.
RTY H4
RTY traders remain very long at the highs – no shorts to be found
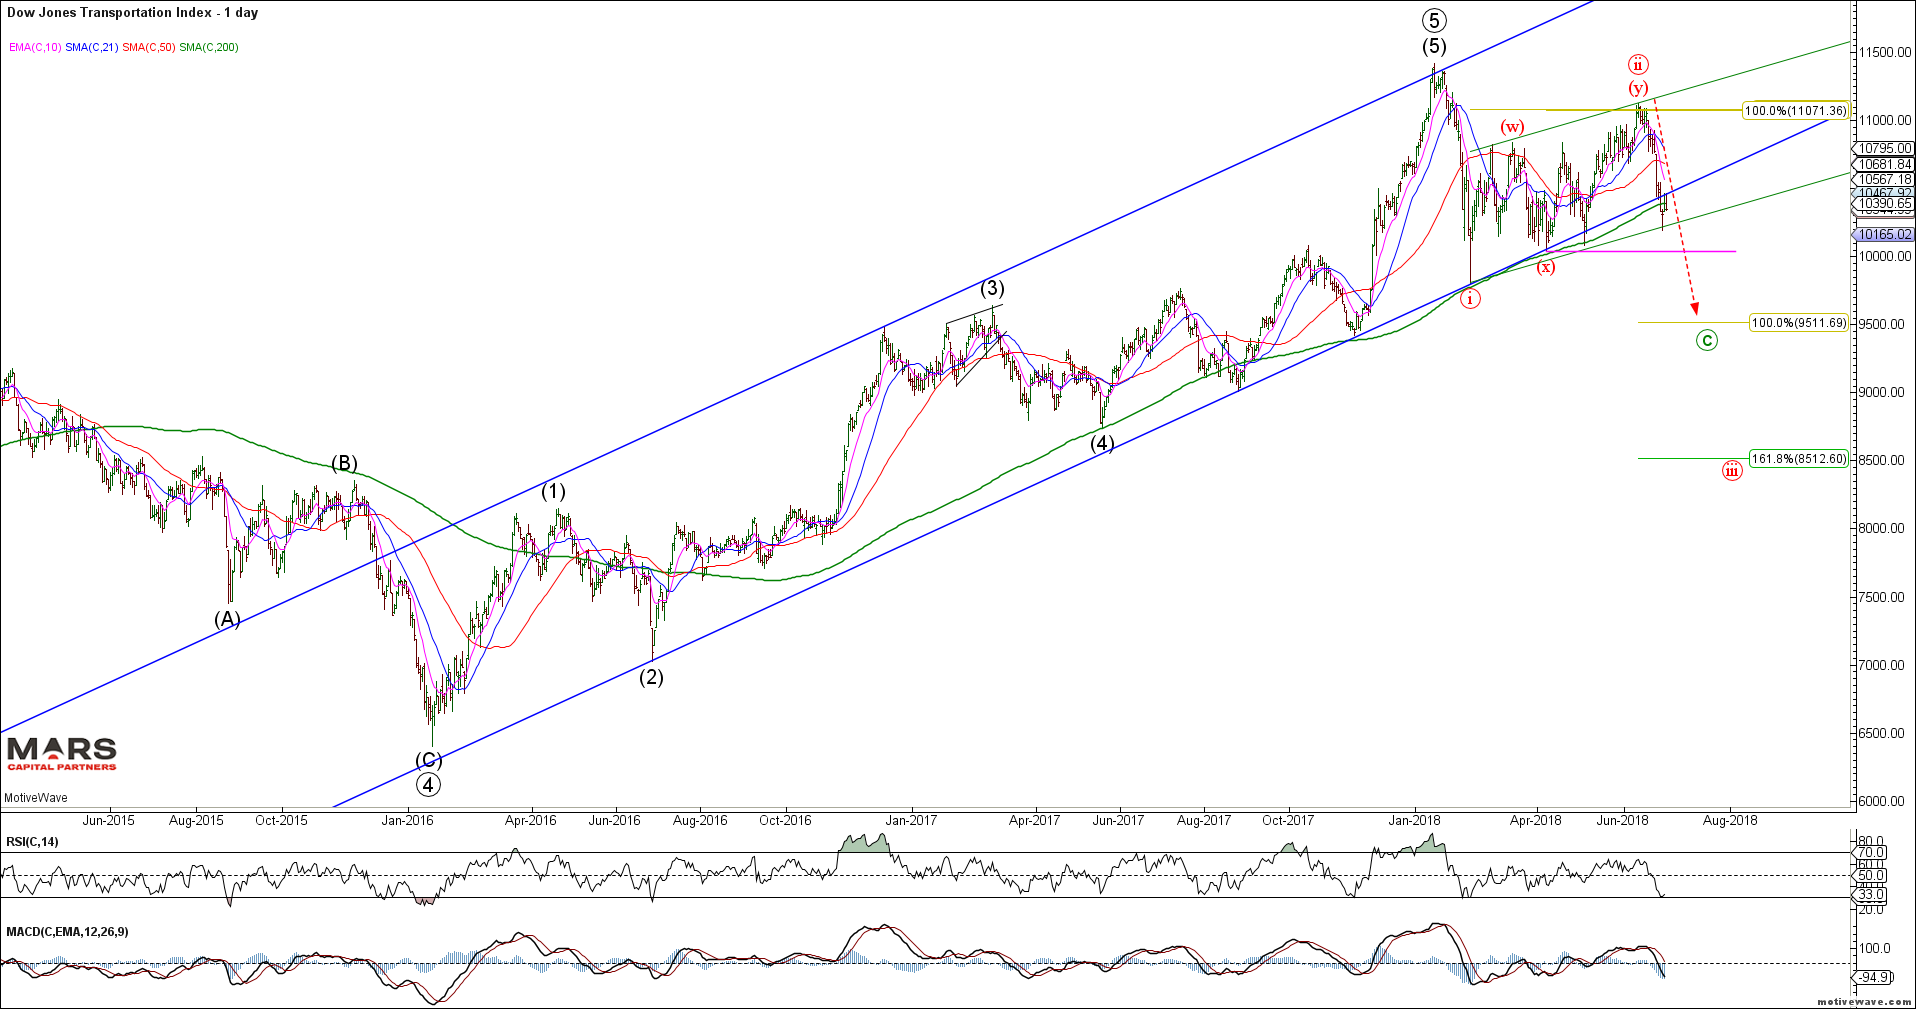
The DJ Transports continued to decline from our upside targets as expected. A break below 10000 likely targets 9500 (for green wave (c)) or potentially much lower towards 8500-8750 for wave (iii).
DJ Transports Daily
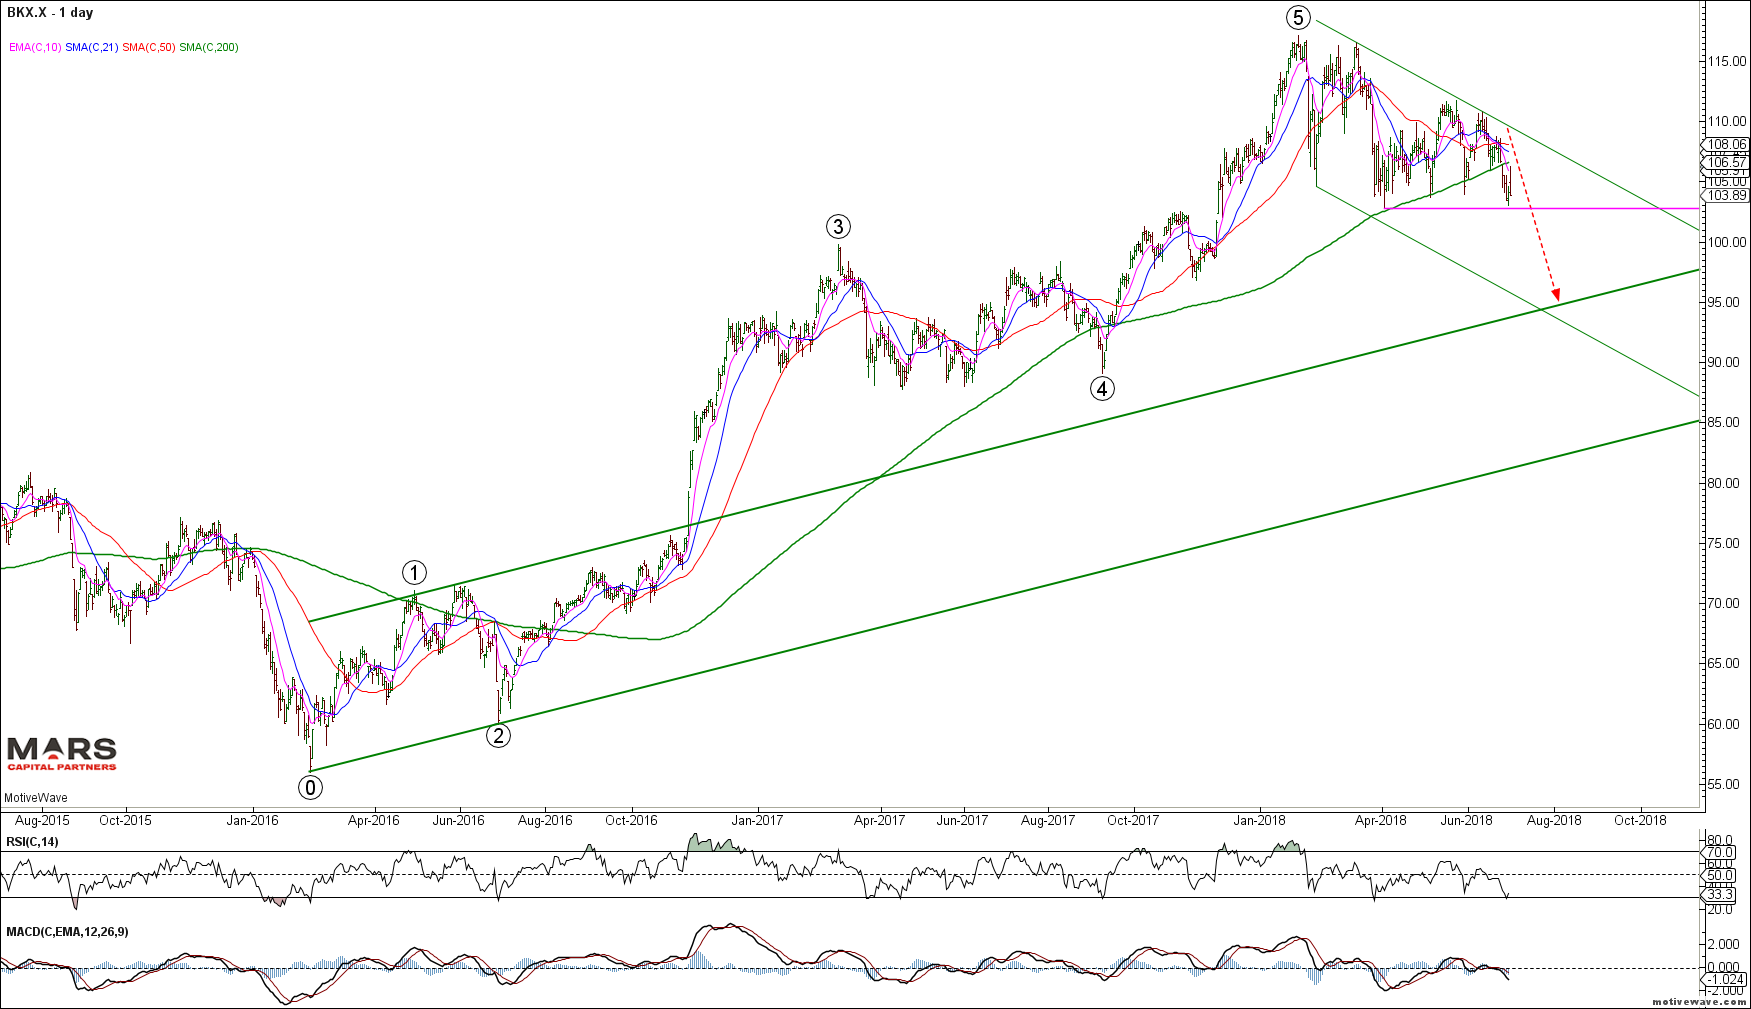
The Banks (BKX) continue to hold shelf support but are threatening to break down – still trading heavily (now below the 200 day sma) and warning of further downside to come.
BKX Daily
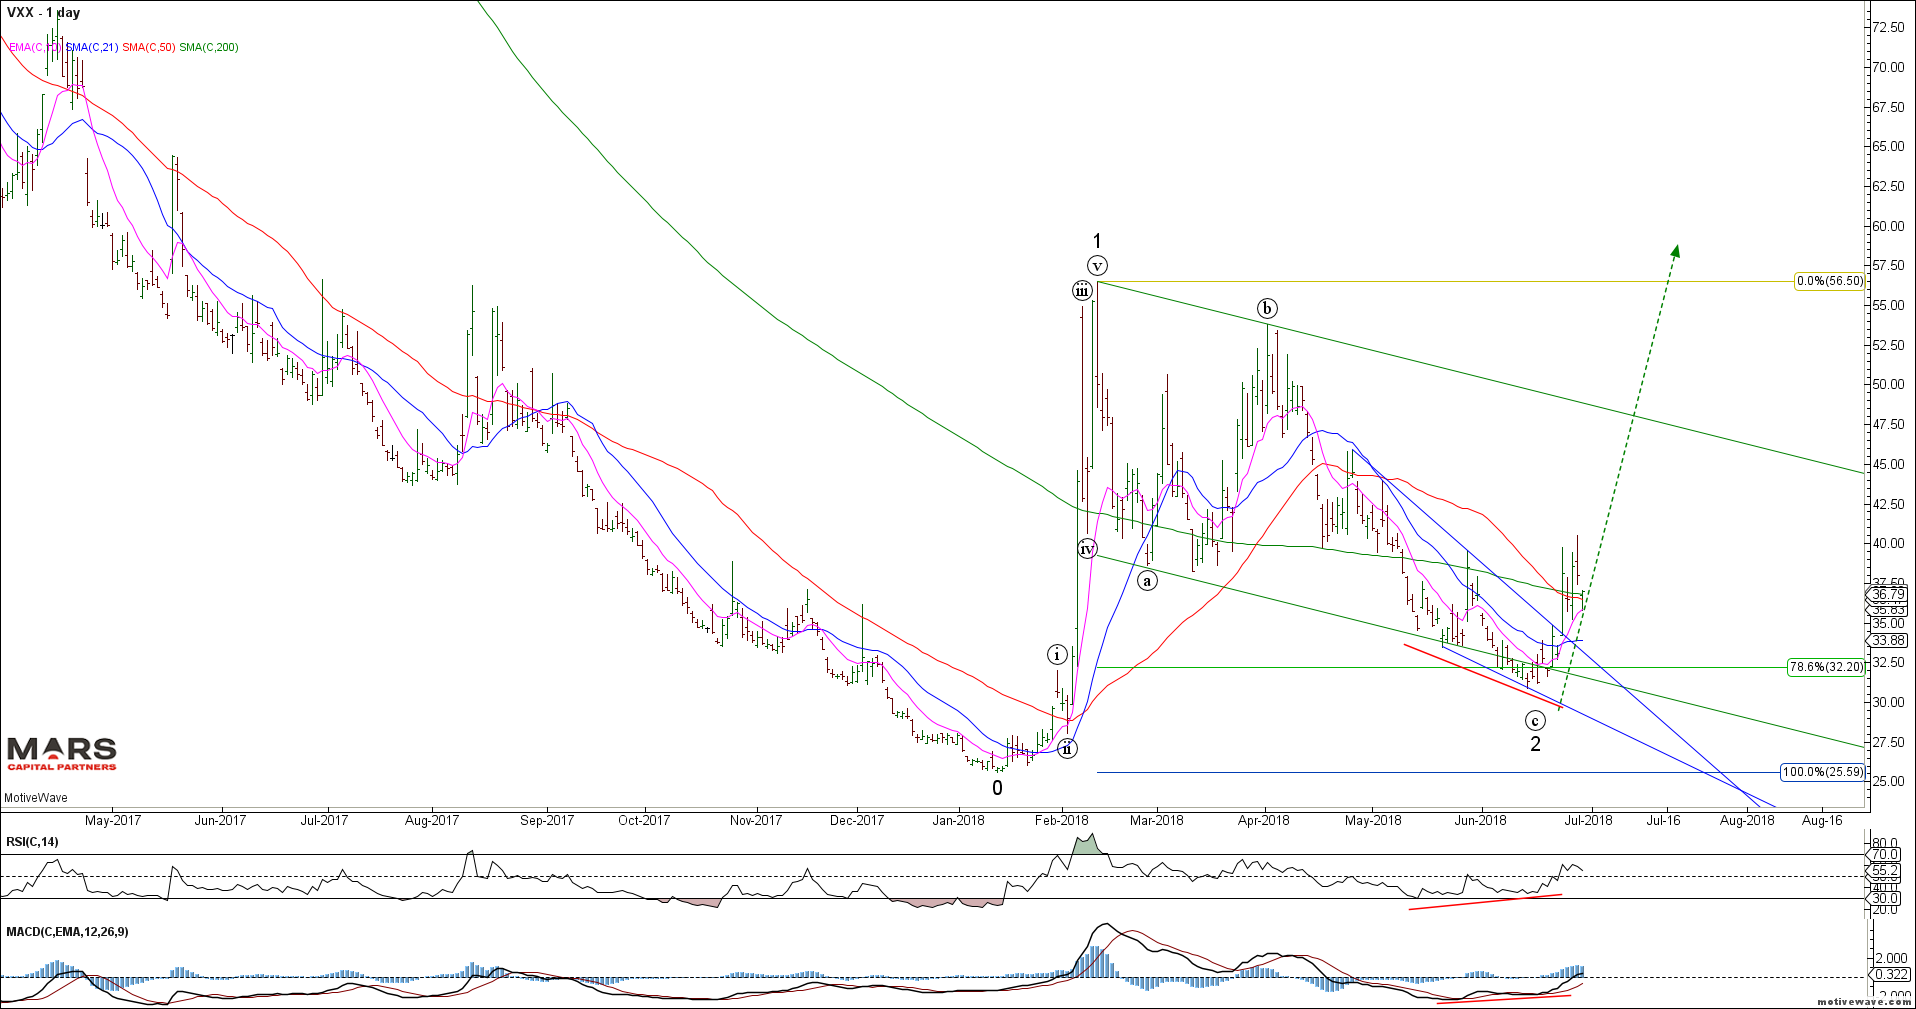
We continue to be bullish the VIX / VXX against the June lows as volatility compression leads to expansion. Note the bullish momentum divergence at recent swing lows which supports our outlook for lower equity prices – is this the calm before the storm?
VXX Daily
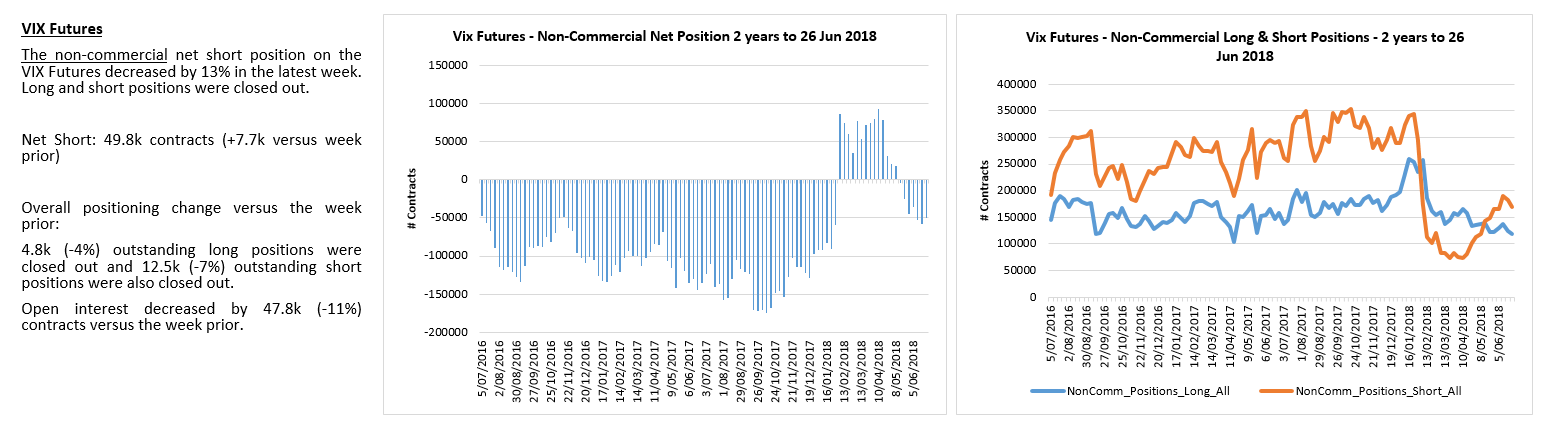
VIX traders are very short again…
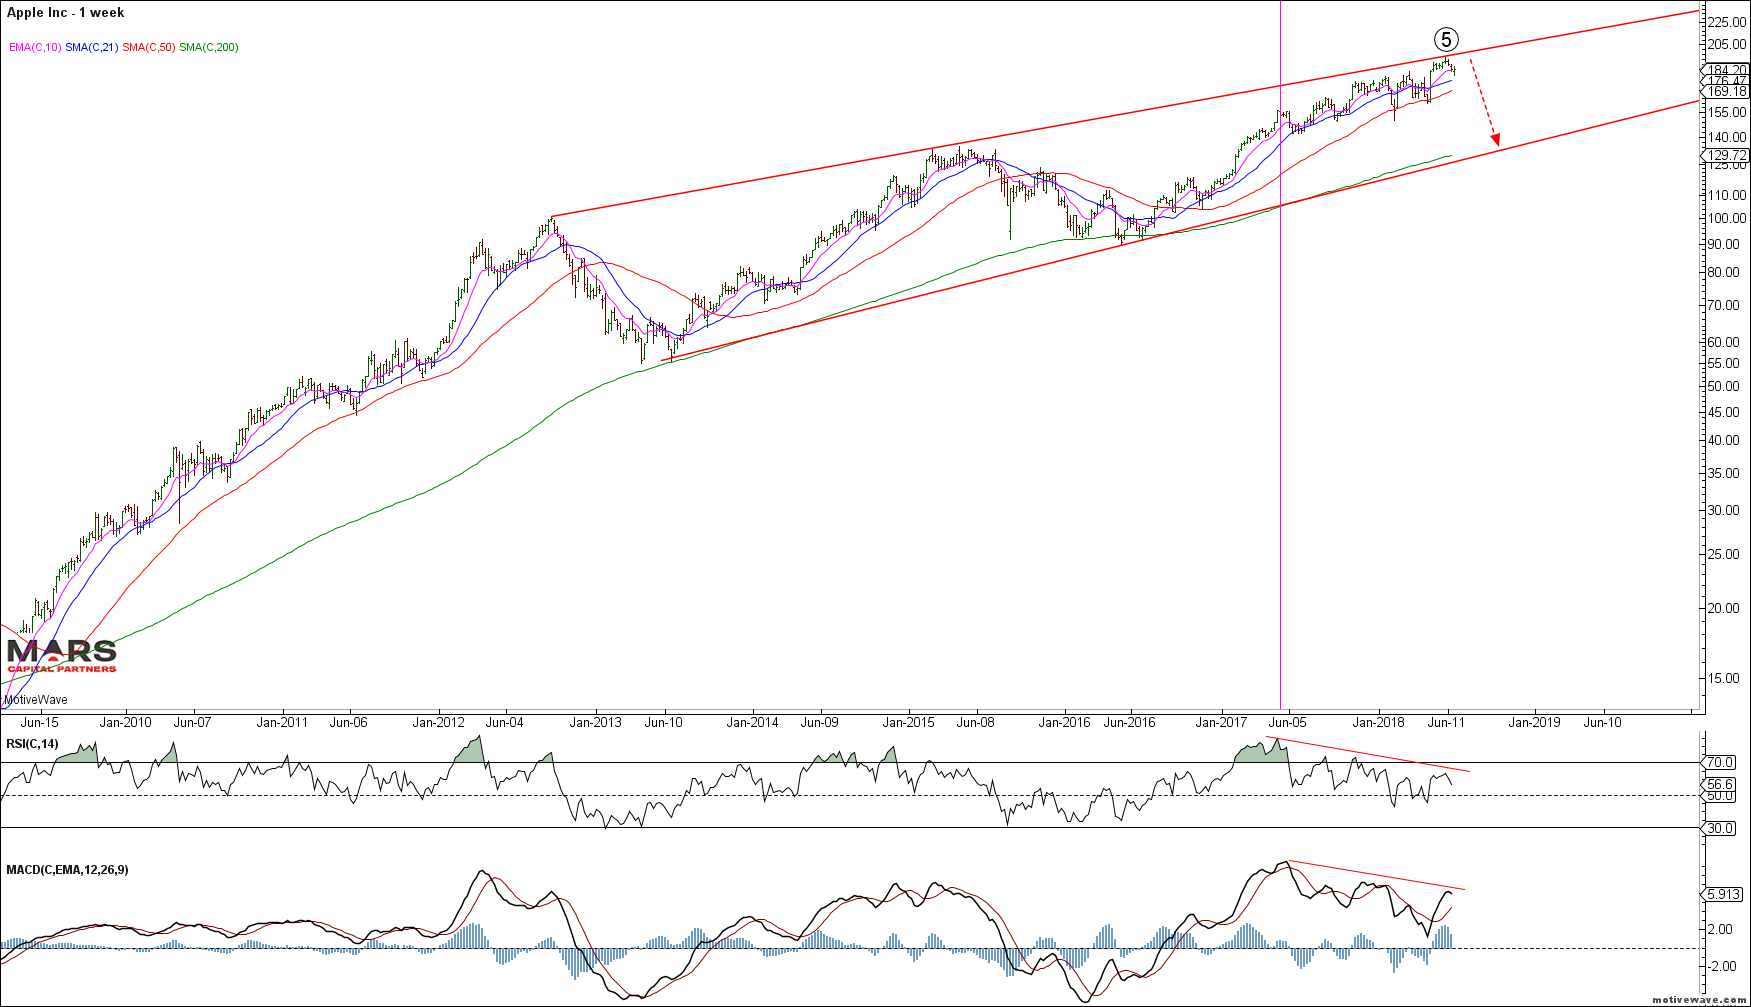
As highlighted in last week’s update, AAPL may be our canary in a coalmine as June’s rally to new ATH’s has not been confirmed by momentum and we are starting to see evidence of a bearish reversal near term. AAPL’s worst fear is China disrupting its supply chain as a result of increased trade wars at a time when phone sales are slowing globally. Unintended consequences…
AAPL Weekly semi-log
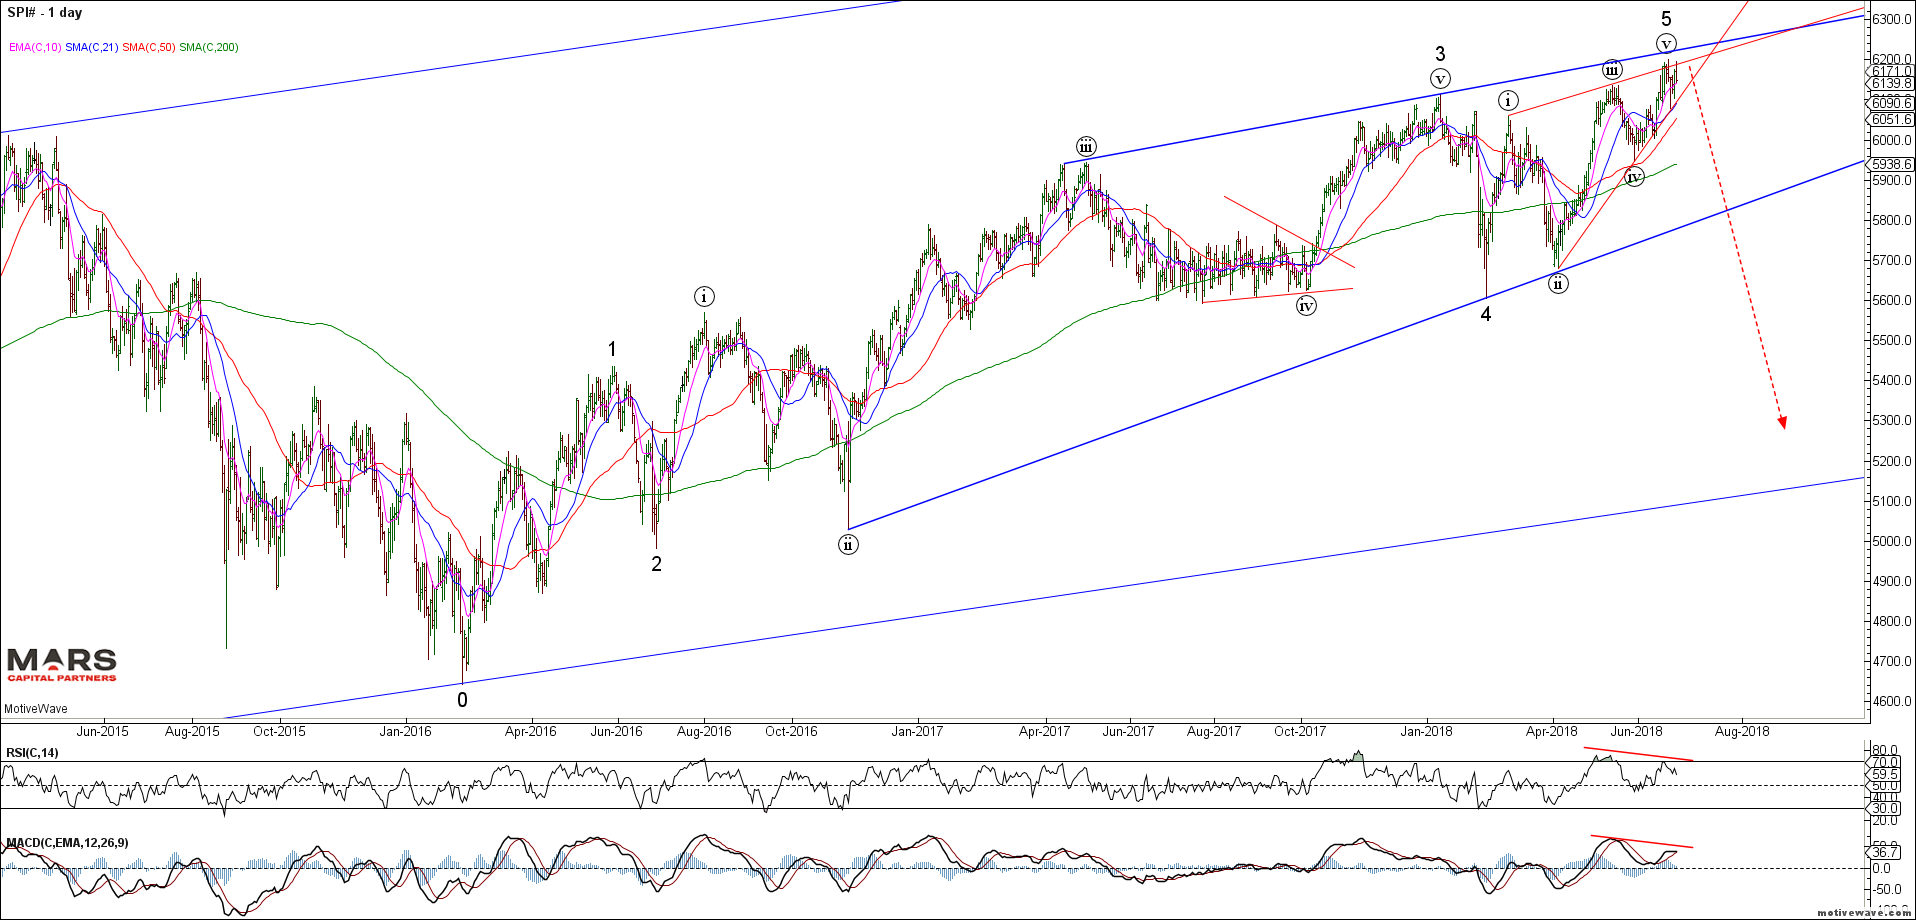
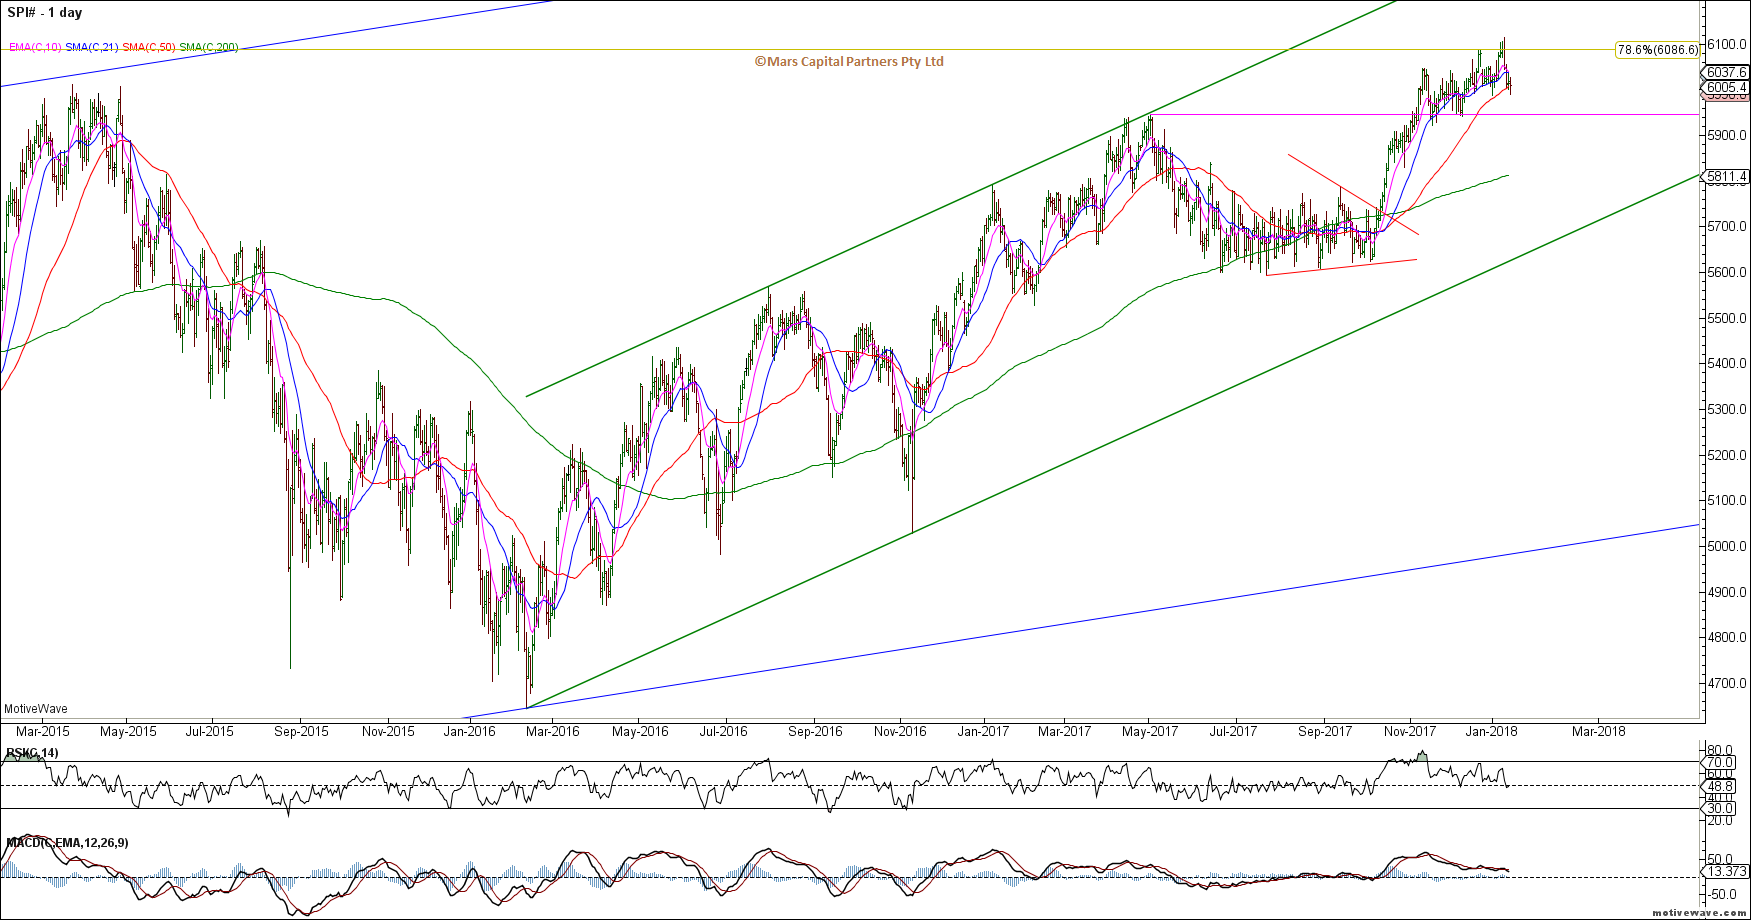
To the global equity markets and we appear to be forming broad based tops throughout as highlighted by the ASX200(SPI futures) which looks particularly vulnerable to a significant turn lower as we wedge into recent highs. Once again, note the recent momentum divergence at the highs. We are now looking for evidence of a bearish reversal in this market.
SPI Daily
We have been correctly bearish the European indices and in particular the CAC40 with the expectation of automotive tariffs and faltering banking system. We appear to be in a broad based topping pattern and while we may see a near term counter-trend rally we remain bearish against the 5555 highs as we look for a retest of the February lows. Trade back above 5555 likely sees marginal new cycle highs but this rally from the 2016 lows can be counted as complete with bigger picture risks to the downside. A push to marginal new cycle highs would likely be a gift for shorts.
CAC40 Daily
The FTSEMIB continues to show clear warning signs for the European markets after completing almost 10 years of range trading. Last month’s bearish reversal from key resistance is emblematic of the downside risks facing Italy right now. Bearish.
FTSEMIB Weekly
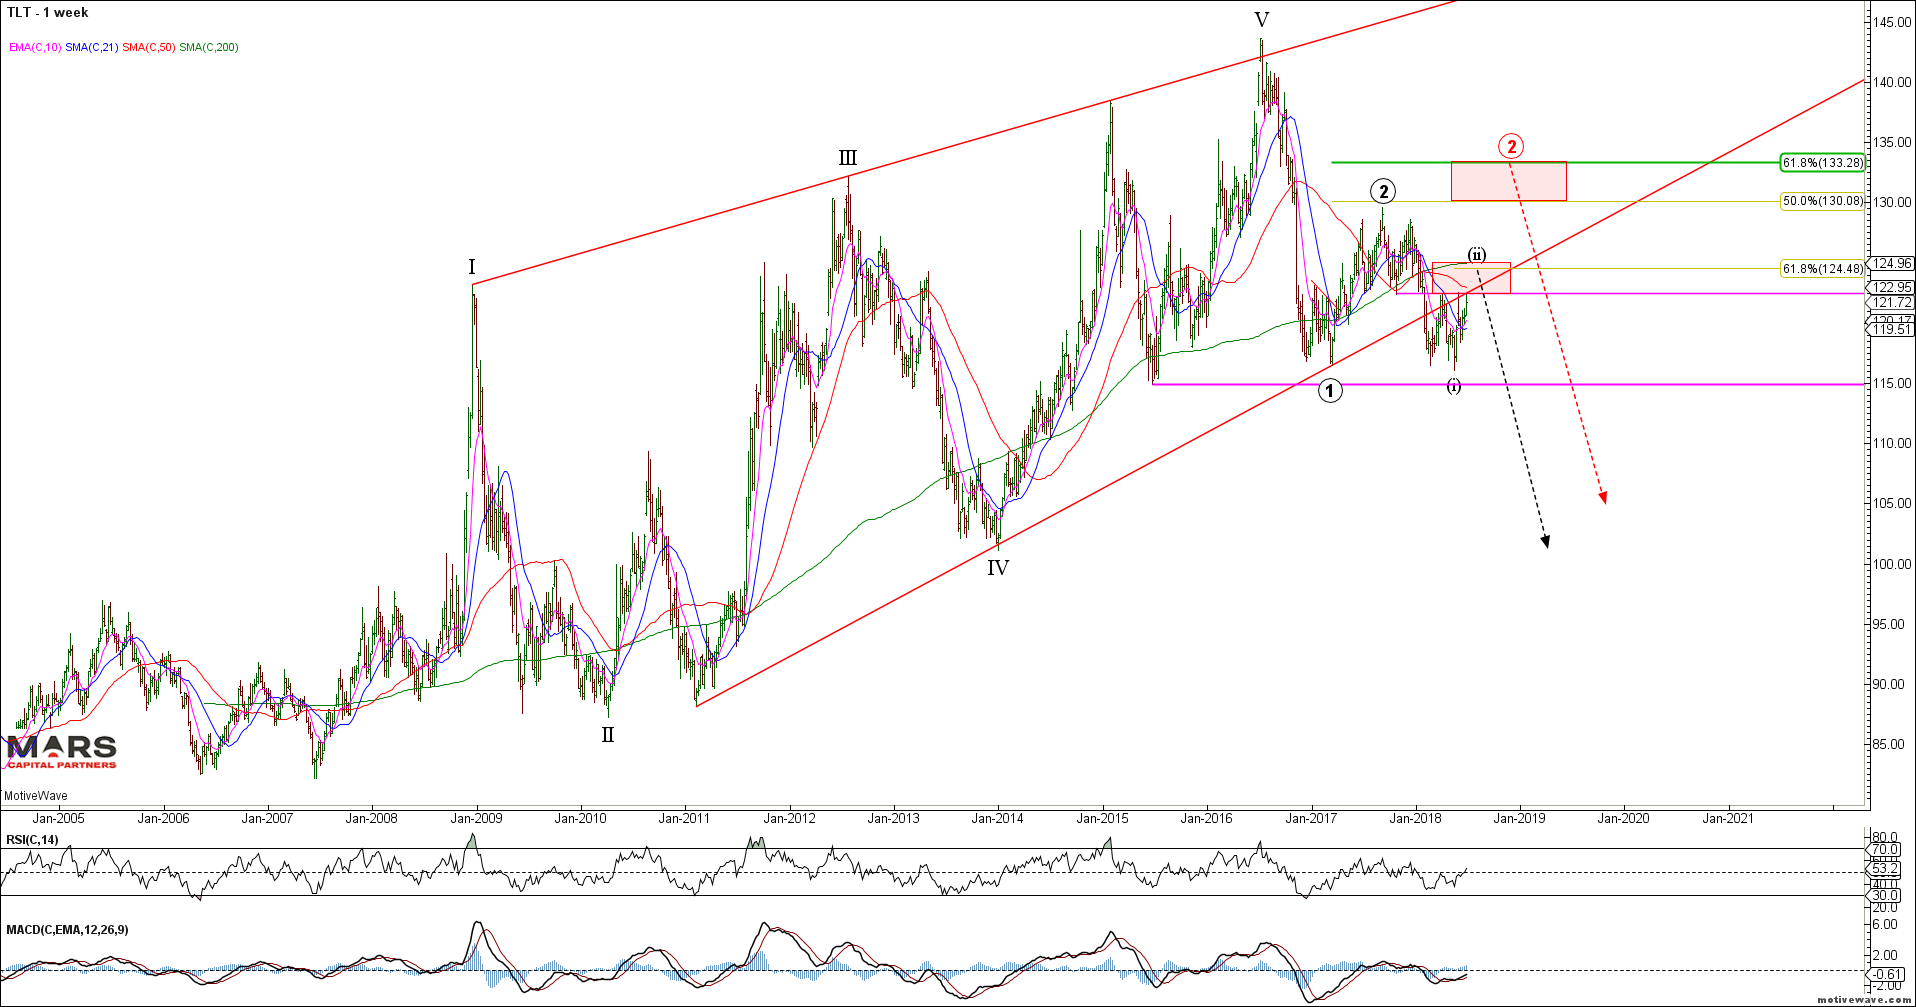
To the Bond markets and the TLT remains bearish from a bigger picture perspectivehaving established a long term top in July 2016. Near term, we remain range bound as the counter-trend rally stalled out at the obvious 122.50 shelf resistance. We are now flat following the rally from the 116 lows. While we may see near term weakness, the intermediate structure continues to look higher towards the 61.8% Fib and 200 day sma (124.50-125) resistance zone. The bigger picture trend is down but ideal sell zones remain higher.
TLT Weekly
The long bond ZB futures show a completed 5 wave decline from the September 2017 highs. We are looking for a counter-trend rally to retest 147’00 resistance and potentially push through to 149 before turning lower again. We are flat bonds looking to short from higher.
ZB Daily
Long bond traders remain flat in this range bound market.
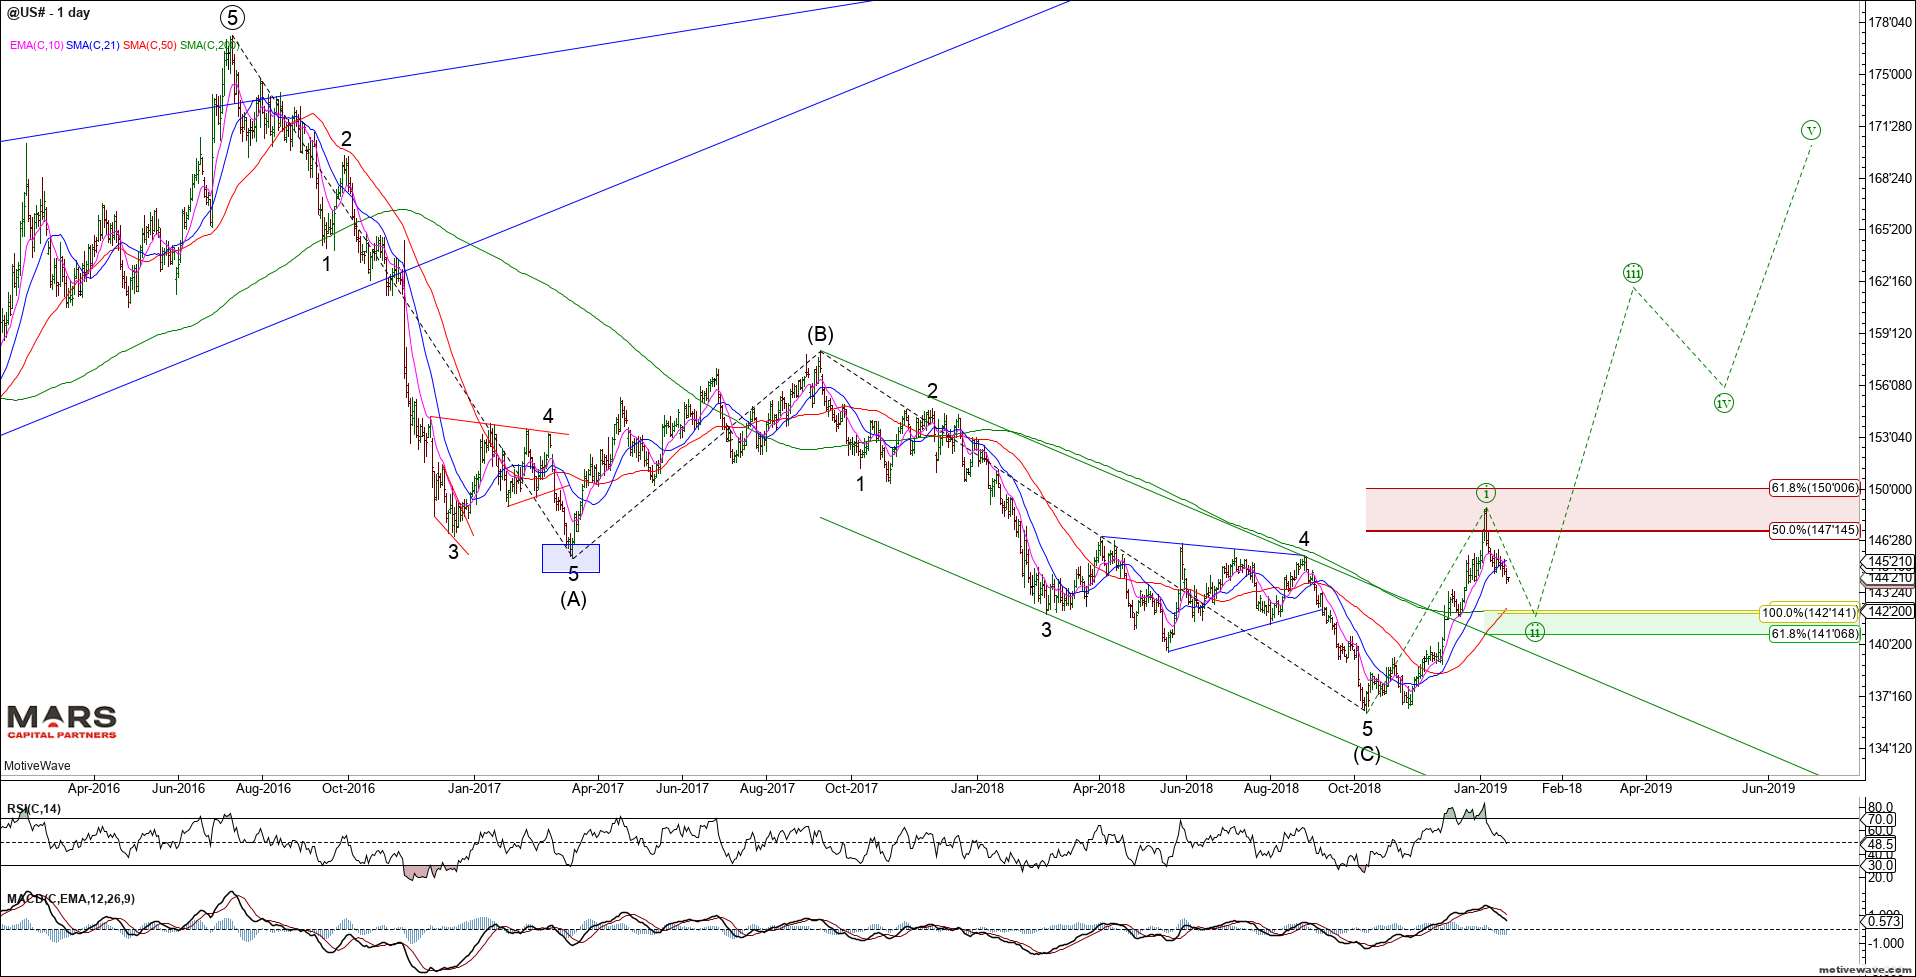
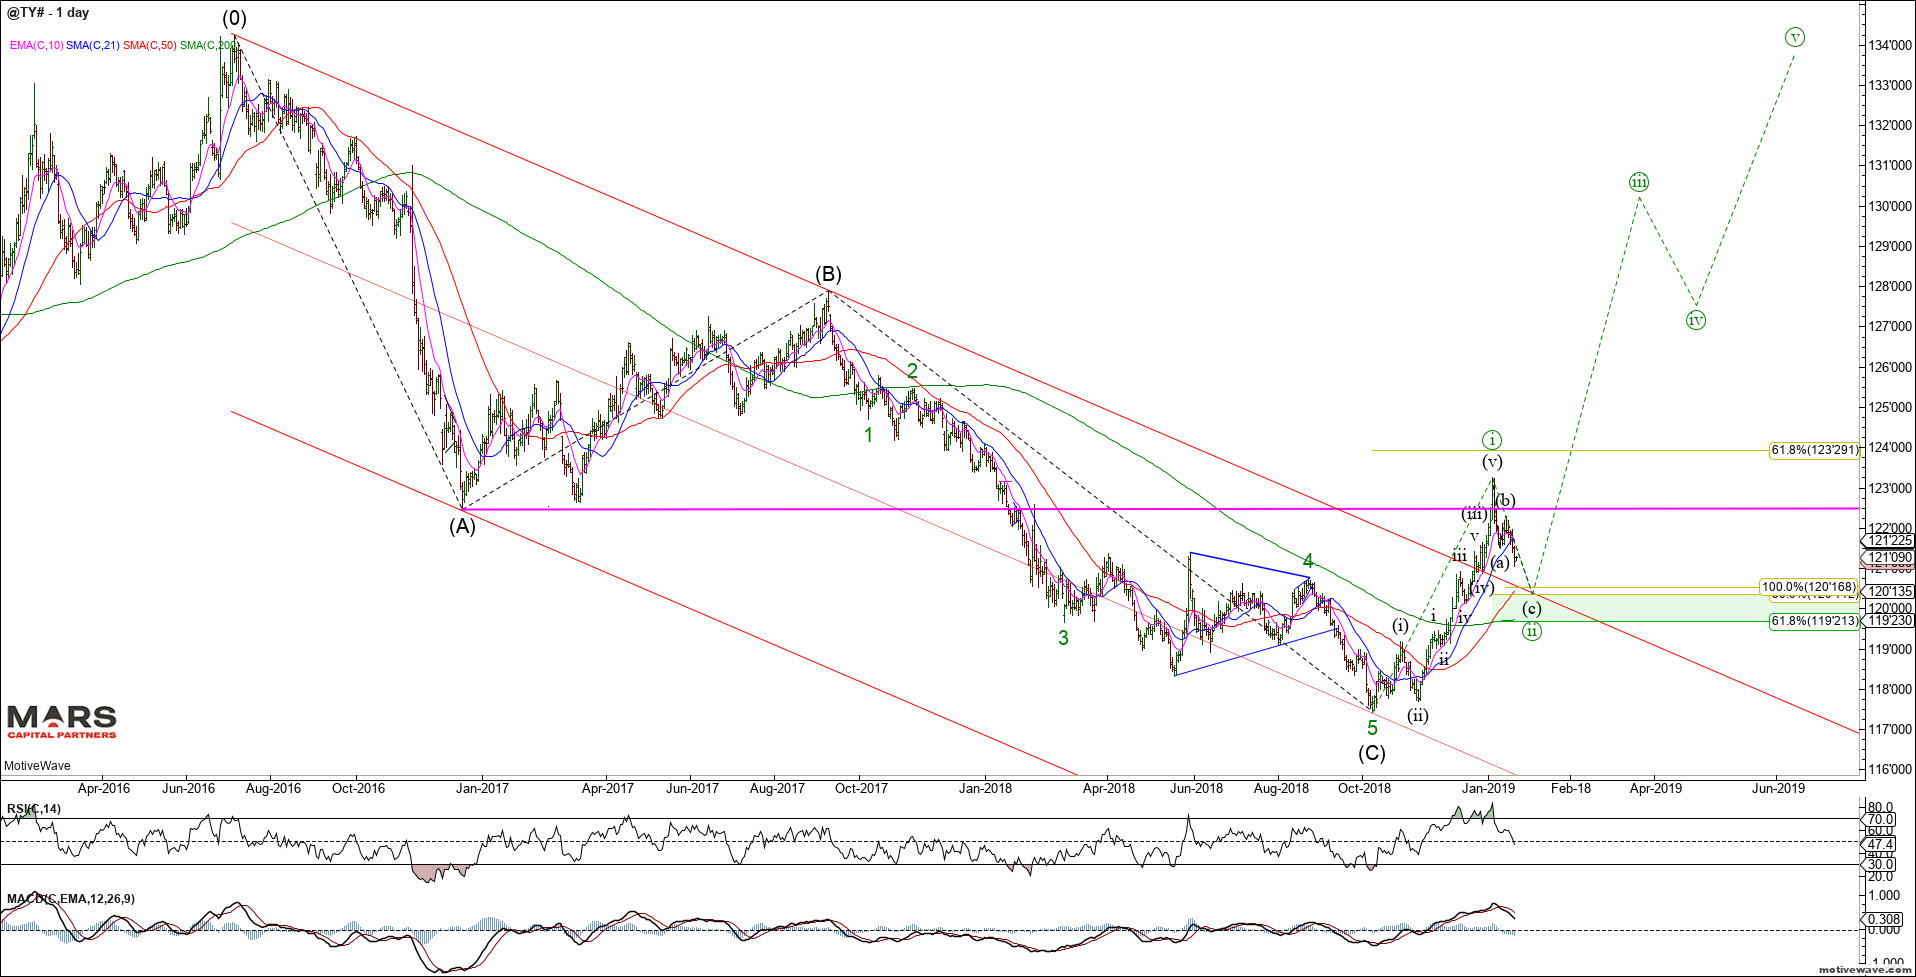
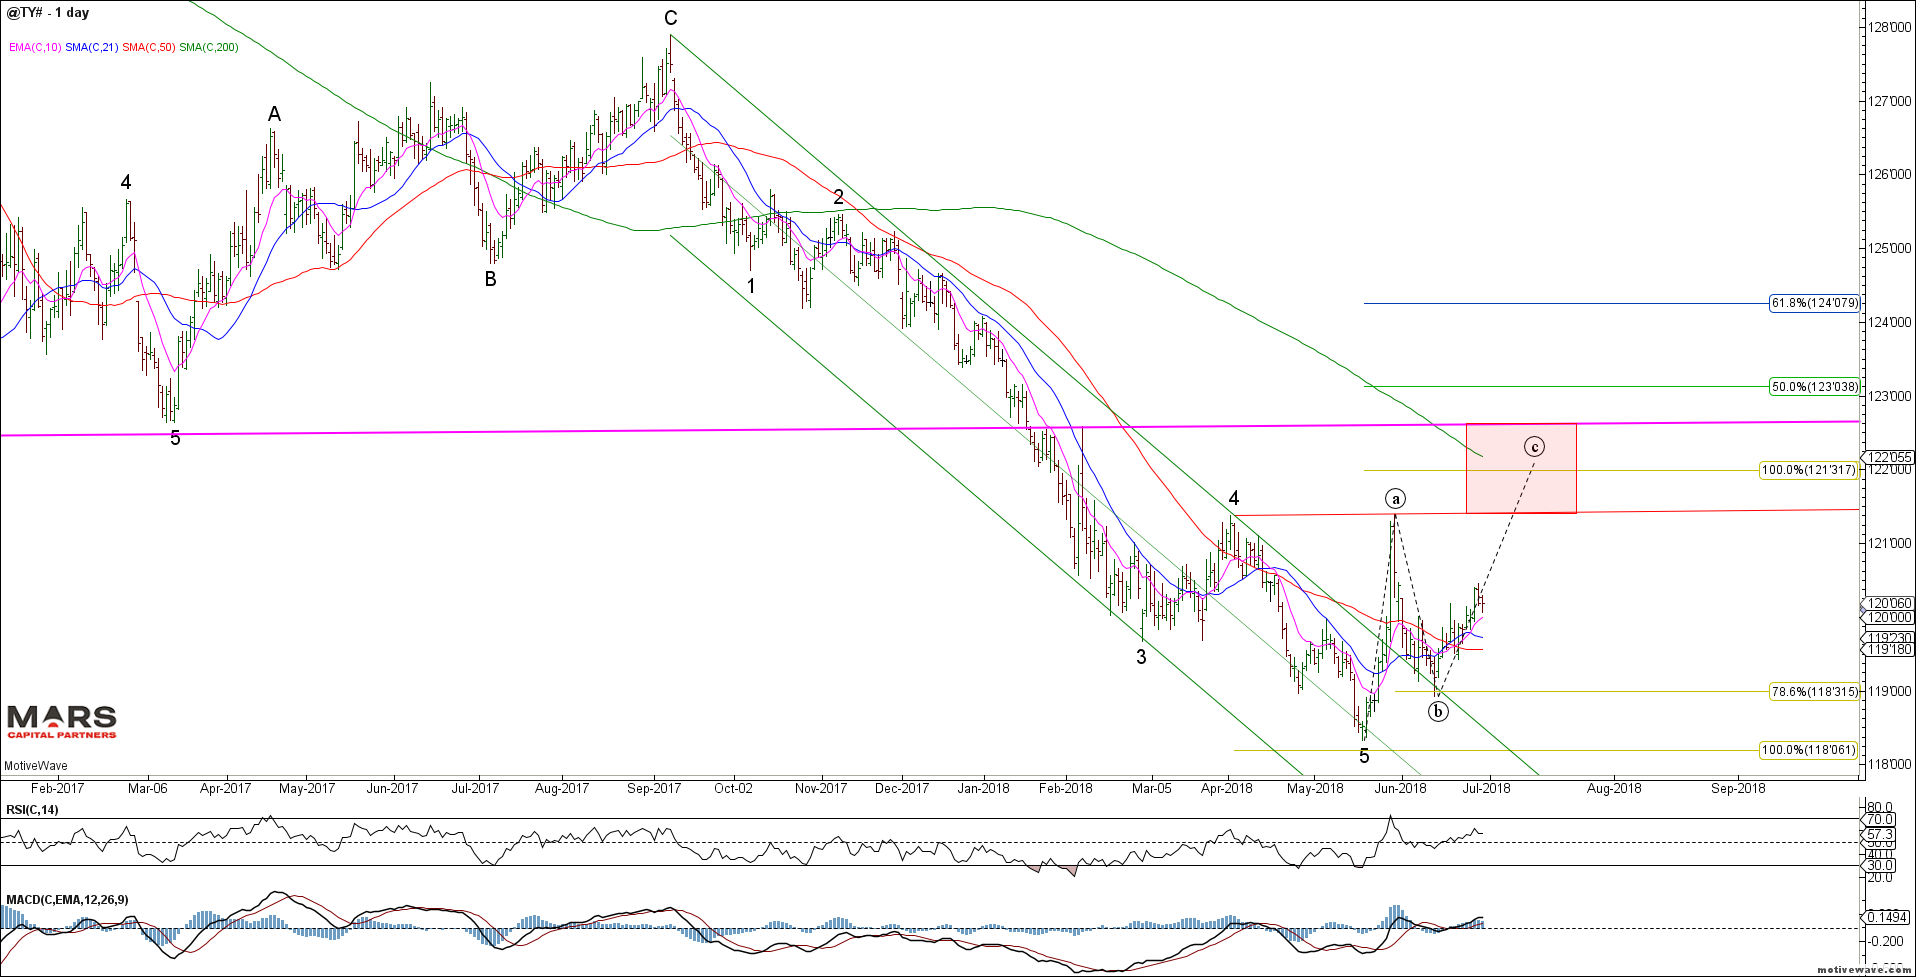
As expected, the TY continues to climb a wall of worry but our sell zone targets remain higher towards 122’00-123’00.
TY Daily
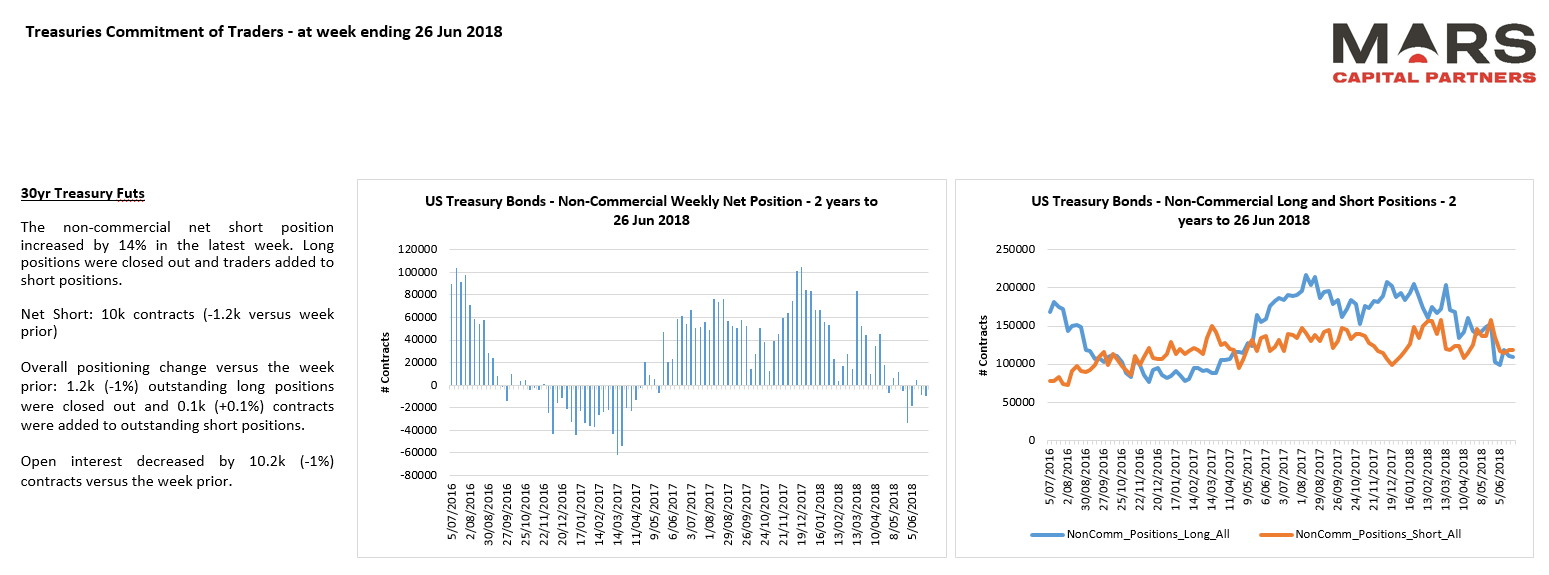
TY traders reducing both long and short exposure while remaining net short.
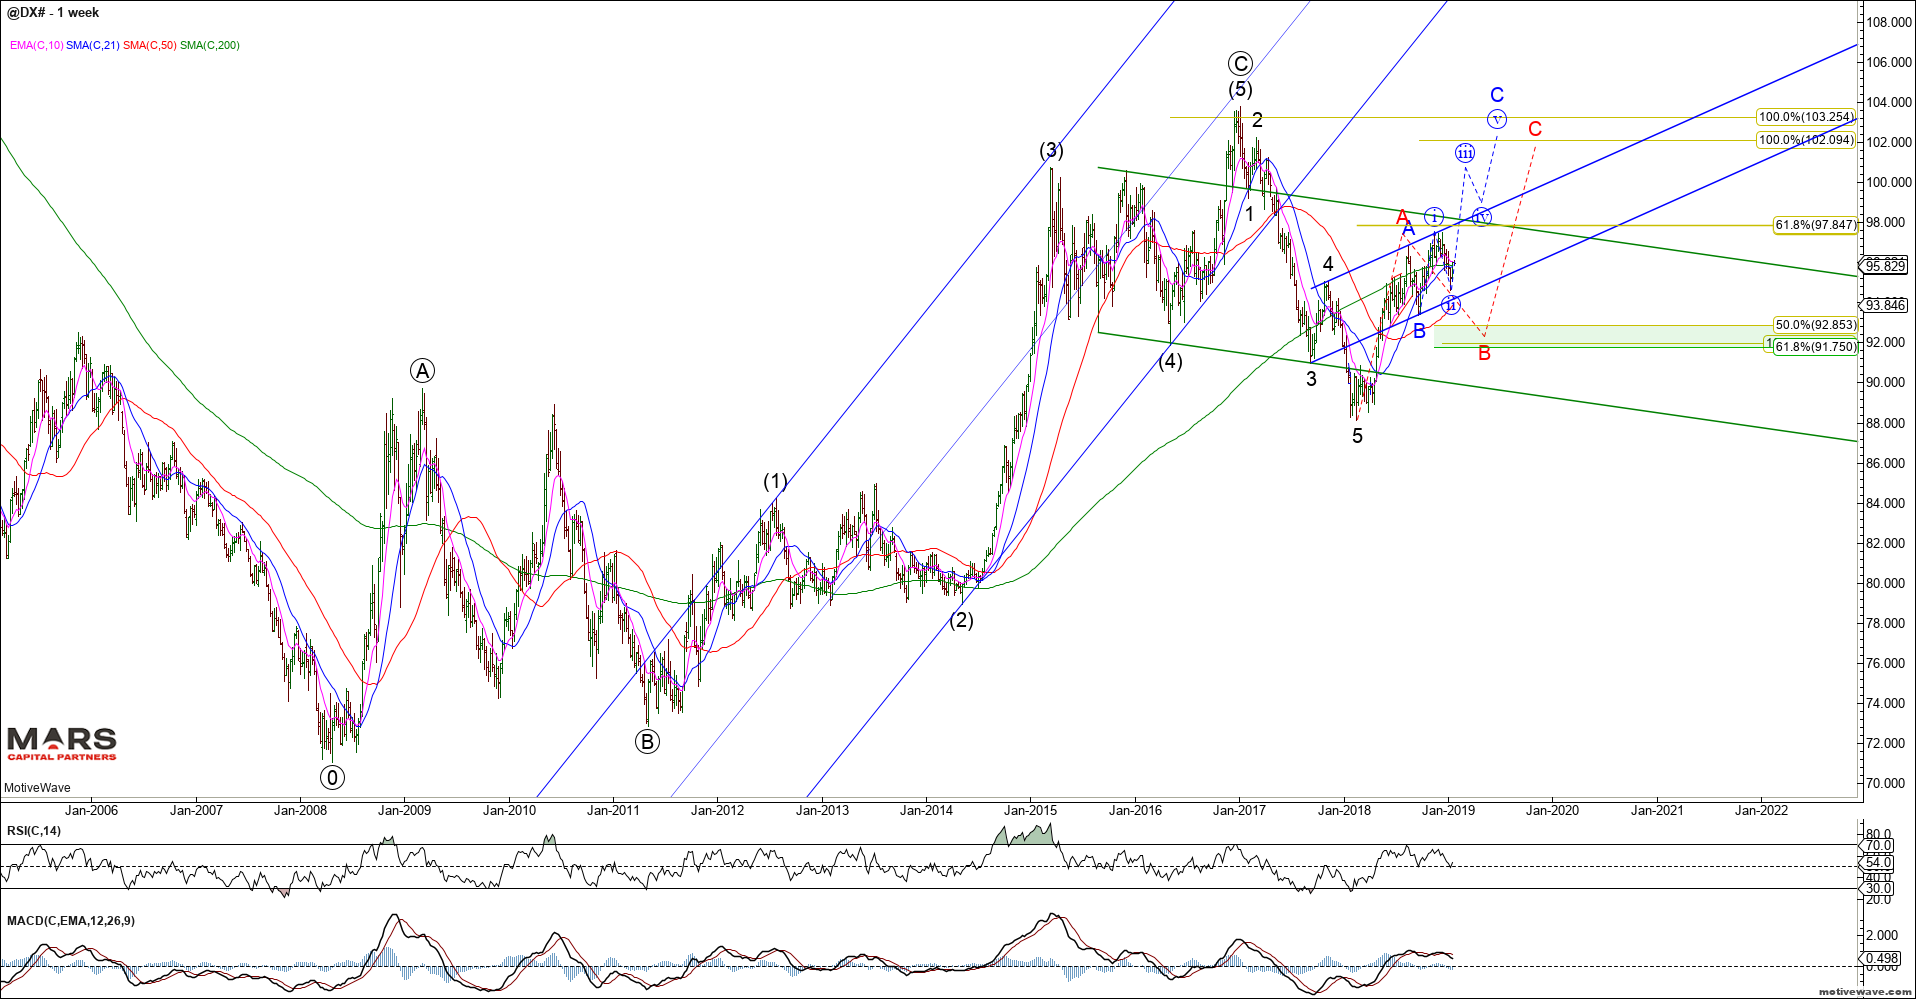
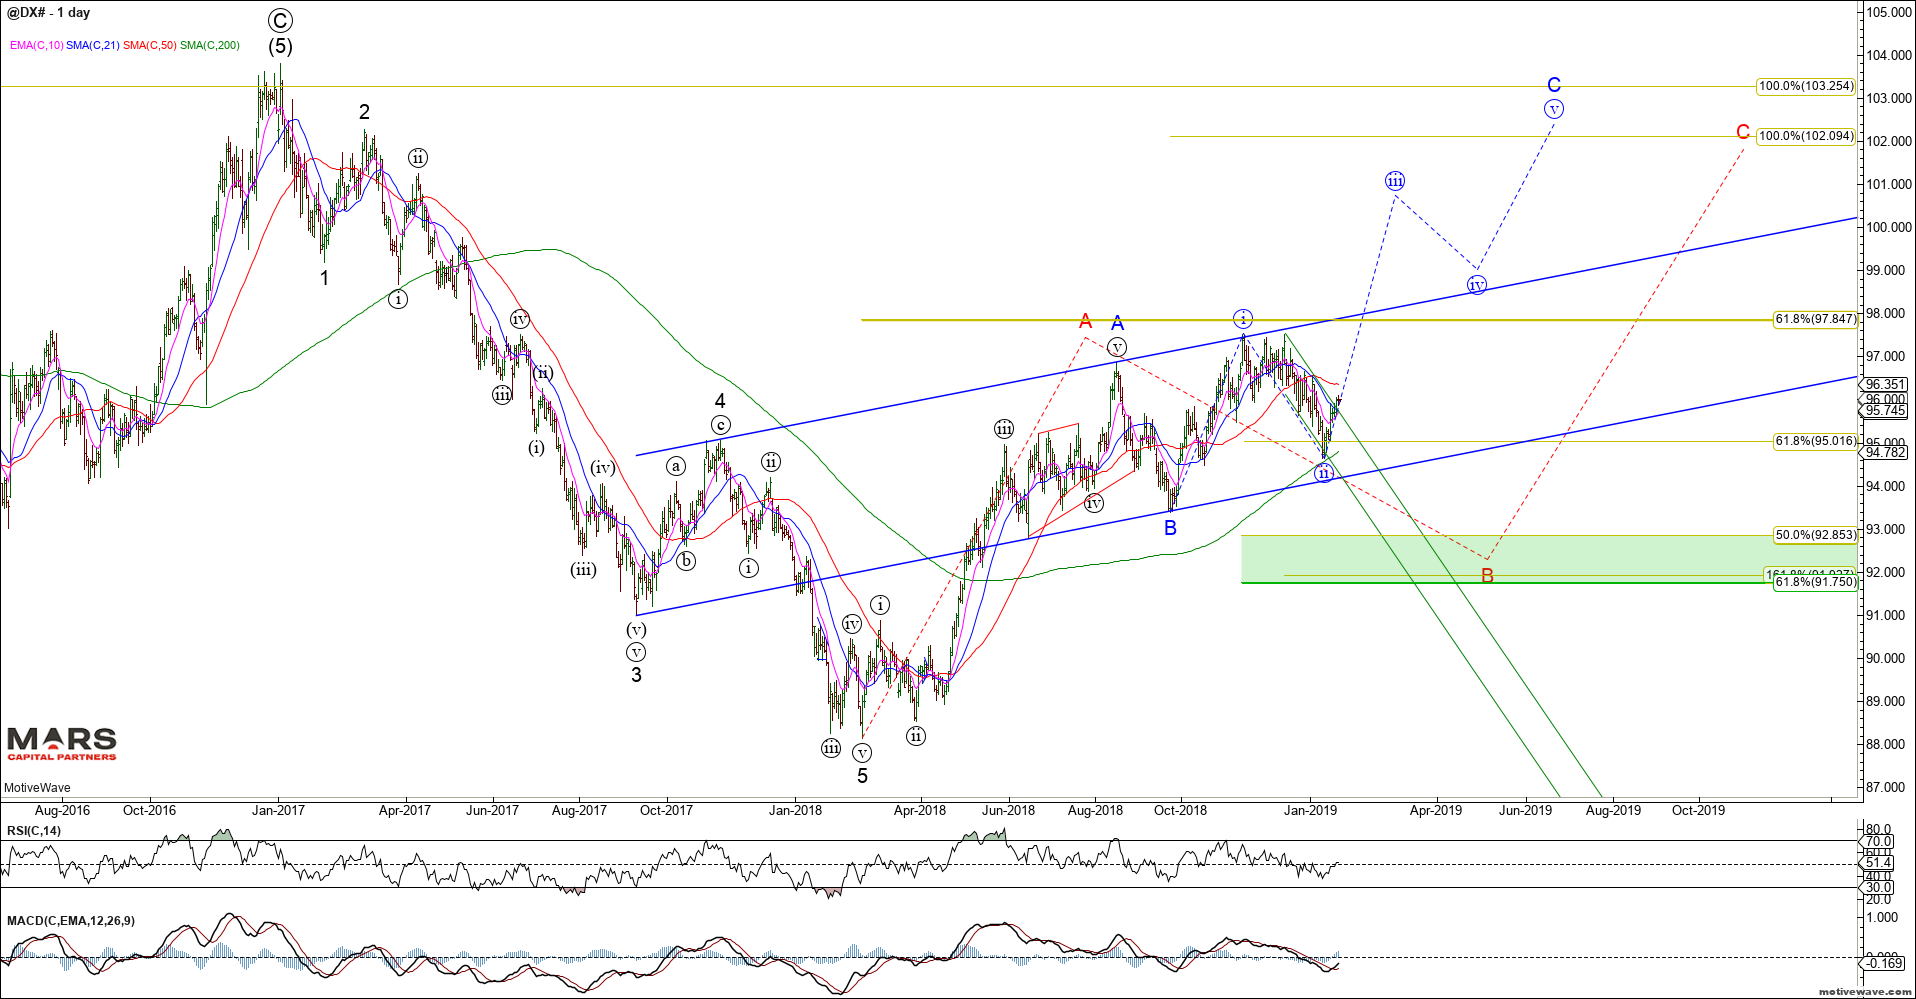
To the FX markets and the US$ appears extended to the upside and may have put in a near term top at 95 resistance to complete wave (v) of A/1.We remain strategically bullish the US$, but are near term defensive as we look for a counter-trend decline towards the 91-92.50 support area before the next strong wave higher can take hold.
DXY Daily
DXY shorts have capitulated while longs embrace the rally.
Similarly, we remain bearish the Euro from a bigger picture perspective. Near term, the Euro appears to be trying to hammer out a low at support after completing 5 waves down from the February highs. Ideally, we are looking for a counter-trend rally higher that terminates in the 1.20-1.21 area before the bigger picture Euro downtrend can reassert itself. Strong trade below 1.15 may trigger an extended decline but I’d be wary of shorting into the hole here.
EURUSD Daily
Euro longs have capitulated while shorts press into the lows.
The USDJPY remains in a large triangle compression. This structure remains bullish US$ while 104.60 holds to the downside.
USDJPY Weekly
Near term, the USDJPY rallied from last week’s support zone keeping the bull trend in tact but I am wary of failure here in the 111.00-50 resistance area for a wave (b) high. The structure would look best with a wave (c) decline back towards our 107-108 buy zone against the 104.60 lows. This would be more consistent with our overall views of near term US$ weakness.
USDJPY H4
The Pound also appears to have hammered out a near term low with corresponding bullish momentum divergence at recent swing lows. Once again, we are looking for a counter-trend rally back towards the 1.3600 area from these oversold conditions.
GBPUSD Daily
GBP longs have declined to cycle lows.
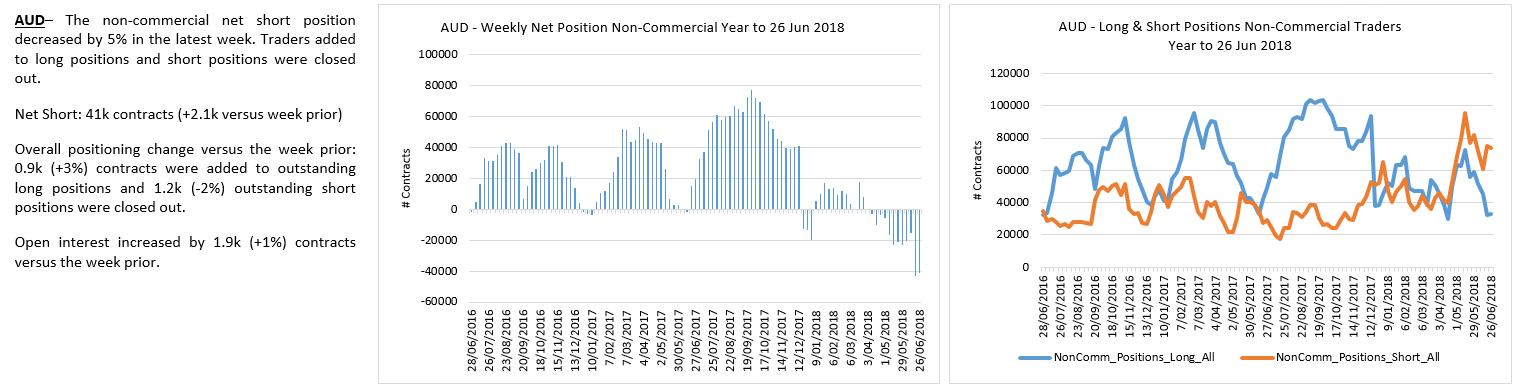
To the commodity currencies and the Aussie and CAD appear to be turning higher from key support.The Aussie$ tagged our 0.7330 Fib support target and has attempted to rally. This is obvious near term structural support for the A$ so we are now looking for a potential bullish reversal for “at least” a counter-trend rally and something much more bullish?
AUDUSD Daily
Aussie$ bulls have now capitulated, opening the door to a rally
The USDCAD looks to have topped near termand now has two diametrically opposed counts from a big picture perspective. (i) We either completed wave (v) of 1 (green count) and last week’s bearish reversal started wave 2 down towards the 1.26-1.28 support zone before wave 3 higher OR (ii) this latest rally from the September lows was a corrective rally within a larger bear trend (red count) – triggered on trade below critical 1.206 support. Either way, we are near term bearish this pair as we look to see how the decline unfolds (wrong on close above 1.34).
USDCAD Daily
CAD shorts pressing into the lows. Likely caught offside with this reversal.
To the commodity markets and our Crude Oil short idea was wrong on last week’s push to new cycle highs. Despite Trump demanding lower Crude prices from the Saudi’s, the bigger picture market structure continues to be defined by higher highs and higher lows in the black gold (reflecting our view on stronger CAD). We must now consider the idea that the 2016 lows marked the end of wave (C) – and not wave 3 of (C) as previously thought. We are standing aside until we gain more clarity on Crude’s market structure.
CL Daily
While traders have reduced longs, shorts have plumbed to new lows.
Natty Gas continues to defy gravity but may be setting up a small degree H&S top on a close below the 50 / 200 day sma shelf support. Watching for a break but no position until we see confirmation of a turn lower.
NG Daily
Traders remain slightly net short with both longs and shorts declining.
Dr Copper declined to the top of our shelf support zone where we would expect the bulls to try and make a stand (key inflection point). Strong support resides in the 2.90-2.95 area – a break of which likely triggers a H&S decline. Careful being short in the hole here near term.
HG Daily
To the PM’s and Gold has now met our weekly 200 sma and trend support in the 1250 area from where we would expect to see a counter-trend rally higher for wave (E). We remain bearish Gold from a bigger picture perspective as long as 1380 holds to the upside (bullish above 1380). Our longer term targets remain lower towards $600-700 as we look for a triangle thrust lower in wave (C).
Gold Weekly
Near term, Gold has a cluster of strong support in the 1210-50 area where the bulls should try make a stand… we have no evidence of a tradable low as yet.
Gold Daily
Gold shorts increasing into the lows.
Silver continues to compress within its contracting symmetrical triangle while running stops either side. We are now flat as we look for a counter-trend bounce near term.
Silver Daily
Summary;
We continue to see an important alignment of fundamental, technical and sentiment indicators warning of a potential market top.
While we are beginning to see increased evidence of a bearish market turn with trend exhaustion for the leaders and fragmented markets, the February lows remain key structural support for the bulls.
We are tactically bearish equities, neutral bonds within a larger bear market, near term bearish US$ (while strategically bullish) and near term bullish PM’s within a larger bear market.
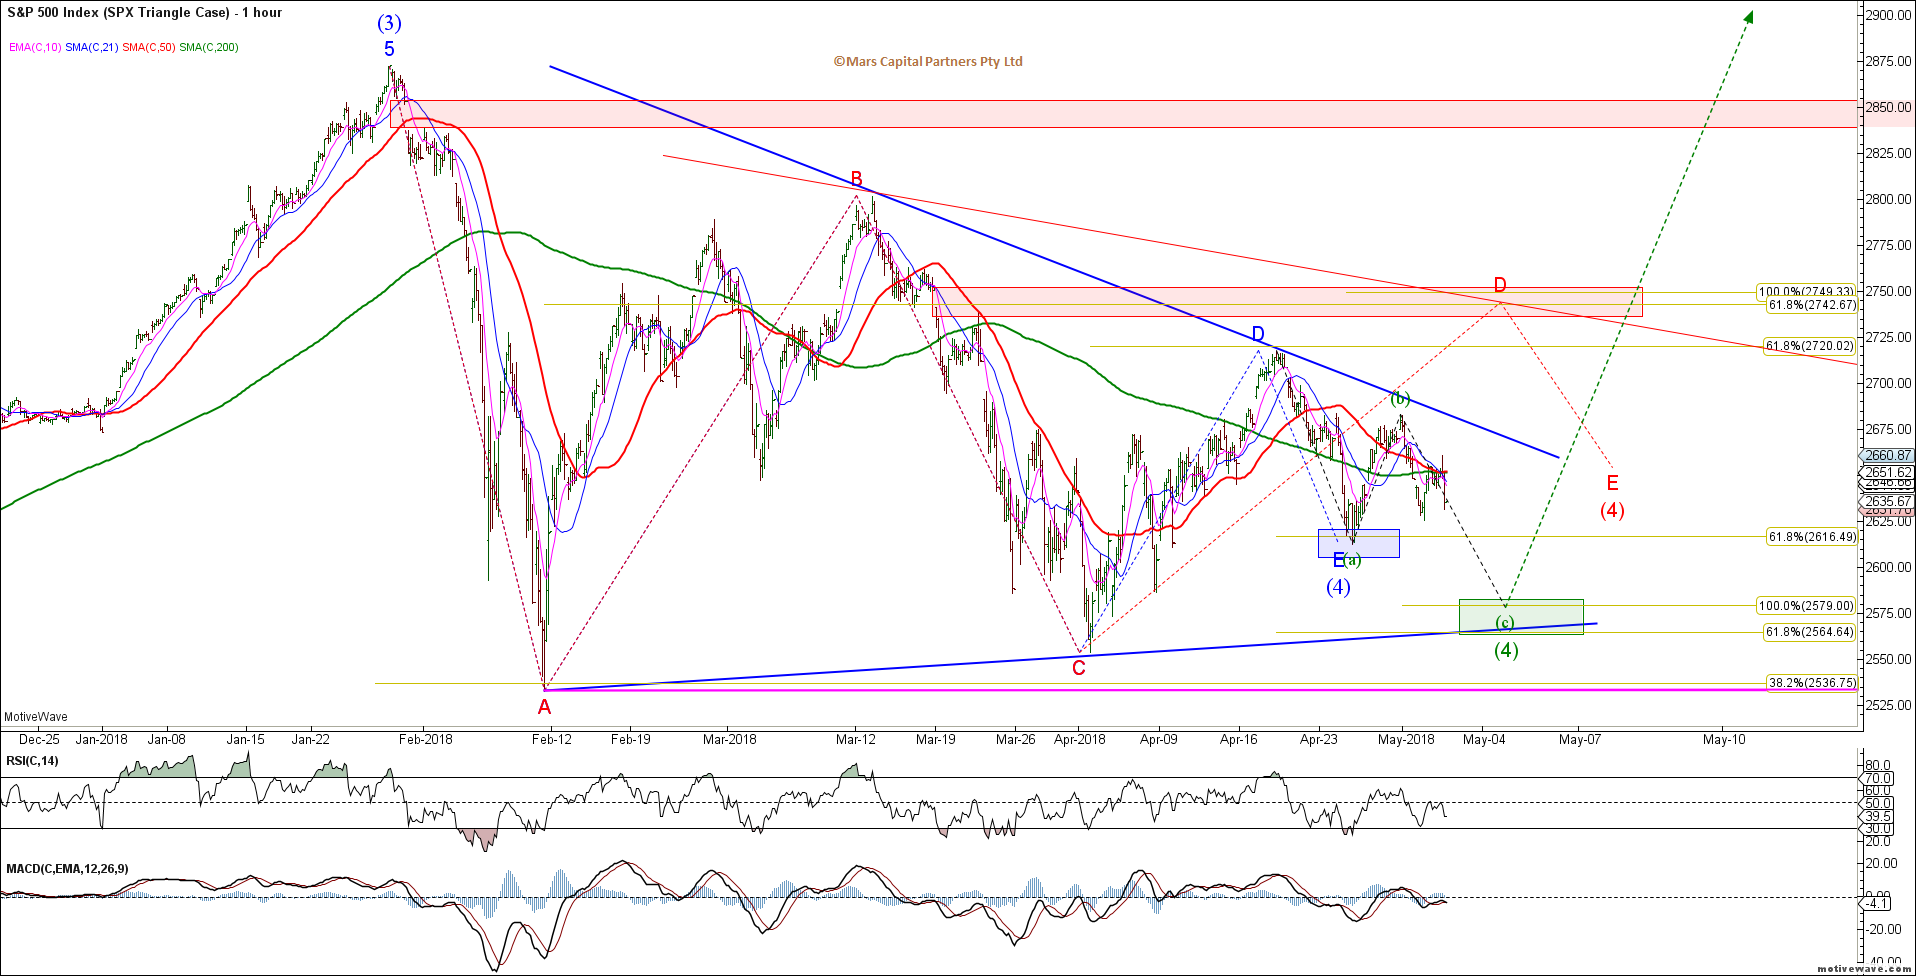
Elliott Wave Triangles usually occur in 4th waves. They occur when a market has rallied too far too fast and the market needs to correct time and price in a primary trend. The exponential SPX rally from August 2017 through to end January highlighted below is a perfect example of this structure. At this point we should explore more bearish potential structures in case we lose the February lows. It is concerning that good earnings are not being rewarded by the market – they are more often than not being sold and the 50 day sma continues to cap attempted rallies. The first step for the bulls is to reclaim the 50 day sma and push through higher levels of resistance highlighted in the charts below.
SPX Daily
While the SPX has met the minimum conditions for a complete Trianglewhere wave E terminated at last week’s lows, the recent price action opens the door for lower targets in the 2565-85 areaand hard test of the April lows. This potential is highlighted by the green count. This will be make or break for the bullish triangle! Trade below the April lows weakens the structure and trade below the February lows opens the door to MUCH lower prices.
SPX H1 Bullish Triangle
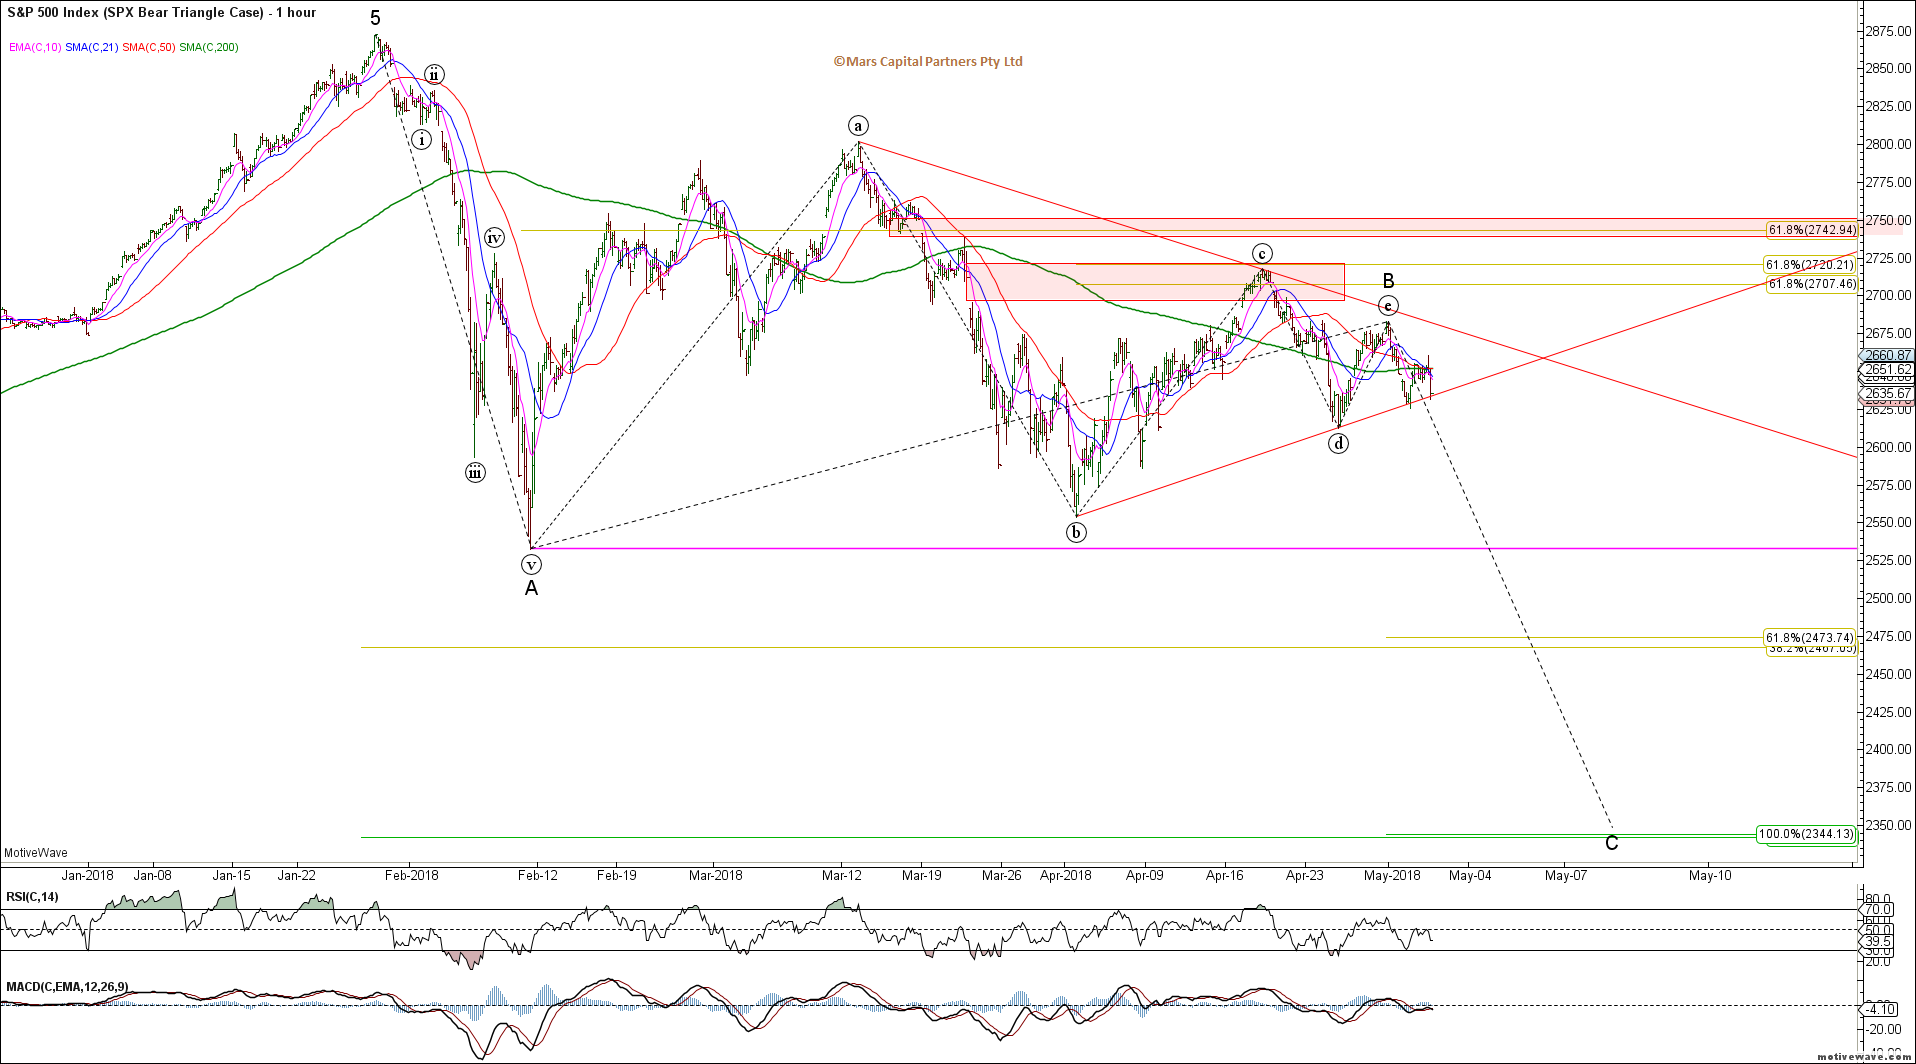
The other place you are likely to see a Triangle is in wave B of a correction (A-B-C). Trade below the February lows will likely trigger this extended decline and intermediate bearish pattern. Given the nature of Triangles, that is, the ability to whipsaw within the larger wave A range, there is NO certainty that wave B has ended. It could always become more complex / expanded if it finds support in the 2565-85 area – Triangles can be difficult to trade outside of bigger picture support / resistance levels.
SPX H1 Bear Triangle
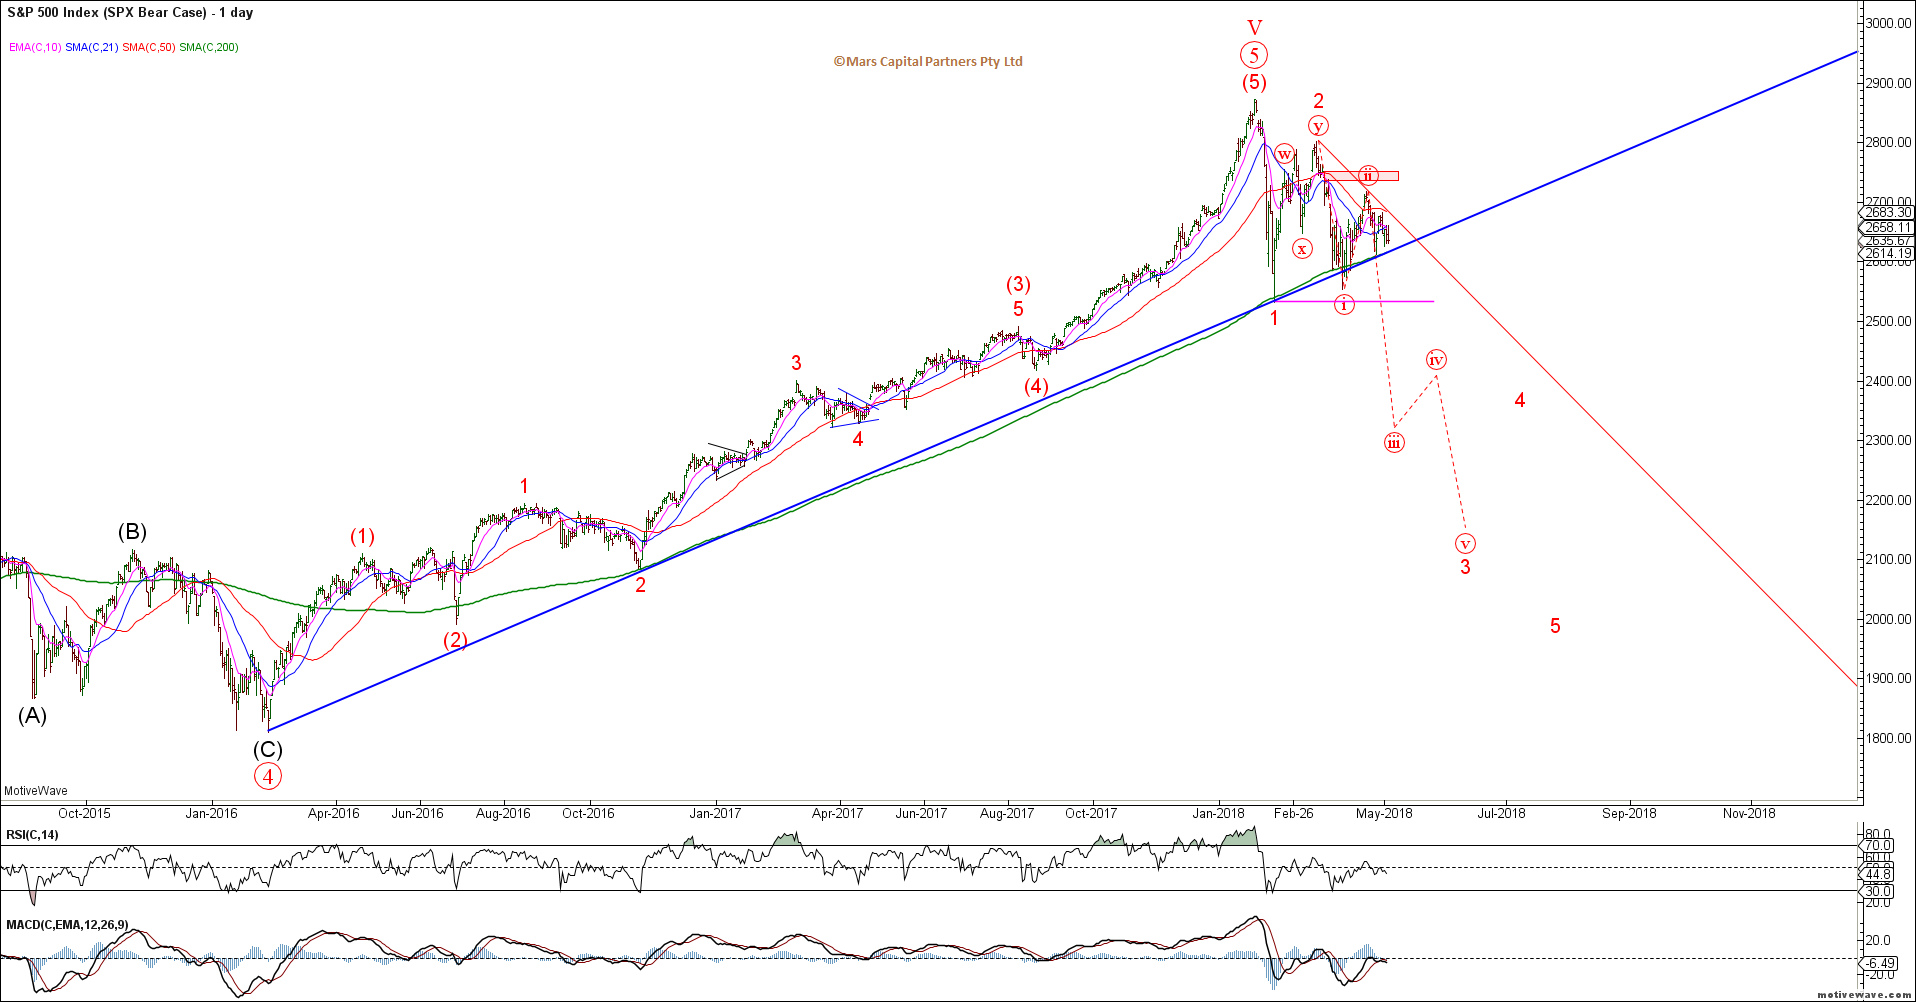
The bigger picture Bear Case remains unchanged. At the moment it looks like a waterfall decline with a series of lower highs and is only triggered on trade below the February lows. Downside targets in this case are much lower as we will assume the rally from the the 2009 lows is over and we are entering a bigger picture bear market.
SPX Daily Bear Case
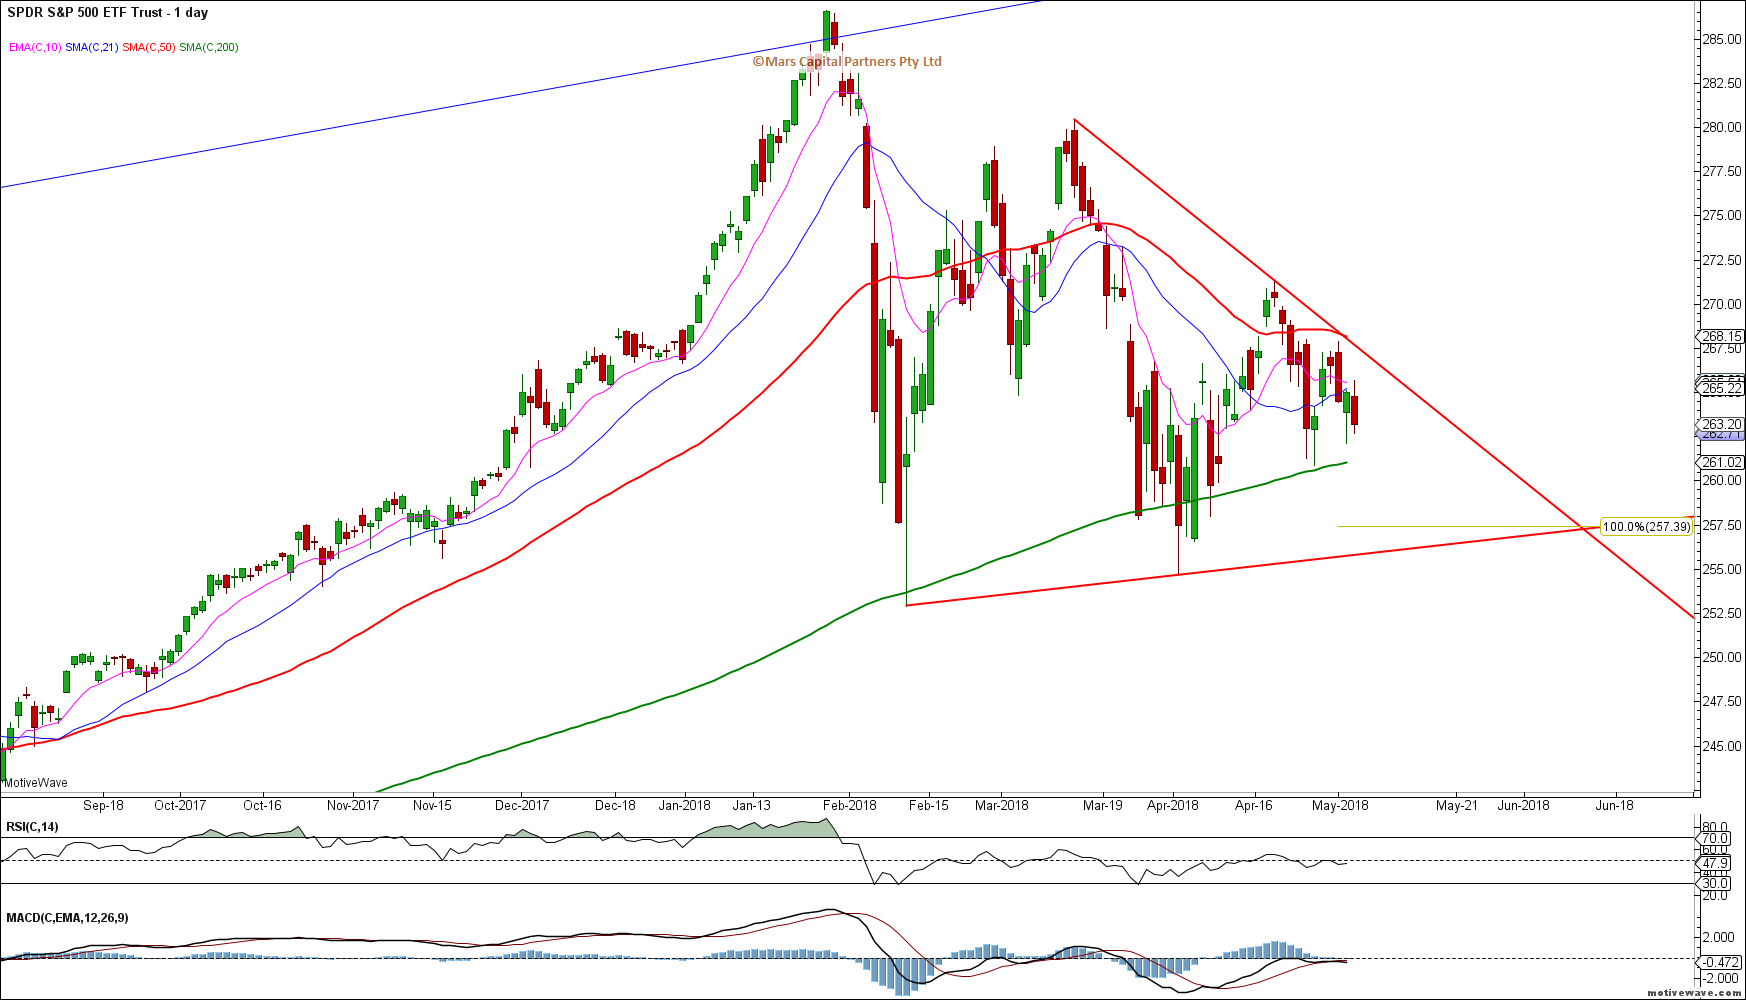
The SPY chart below just highlights key sma and trendline support and resistance areas so we don’t lose sight of the forest from the trees.
SPY Daily
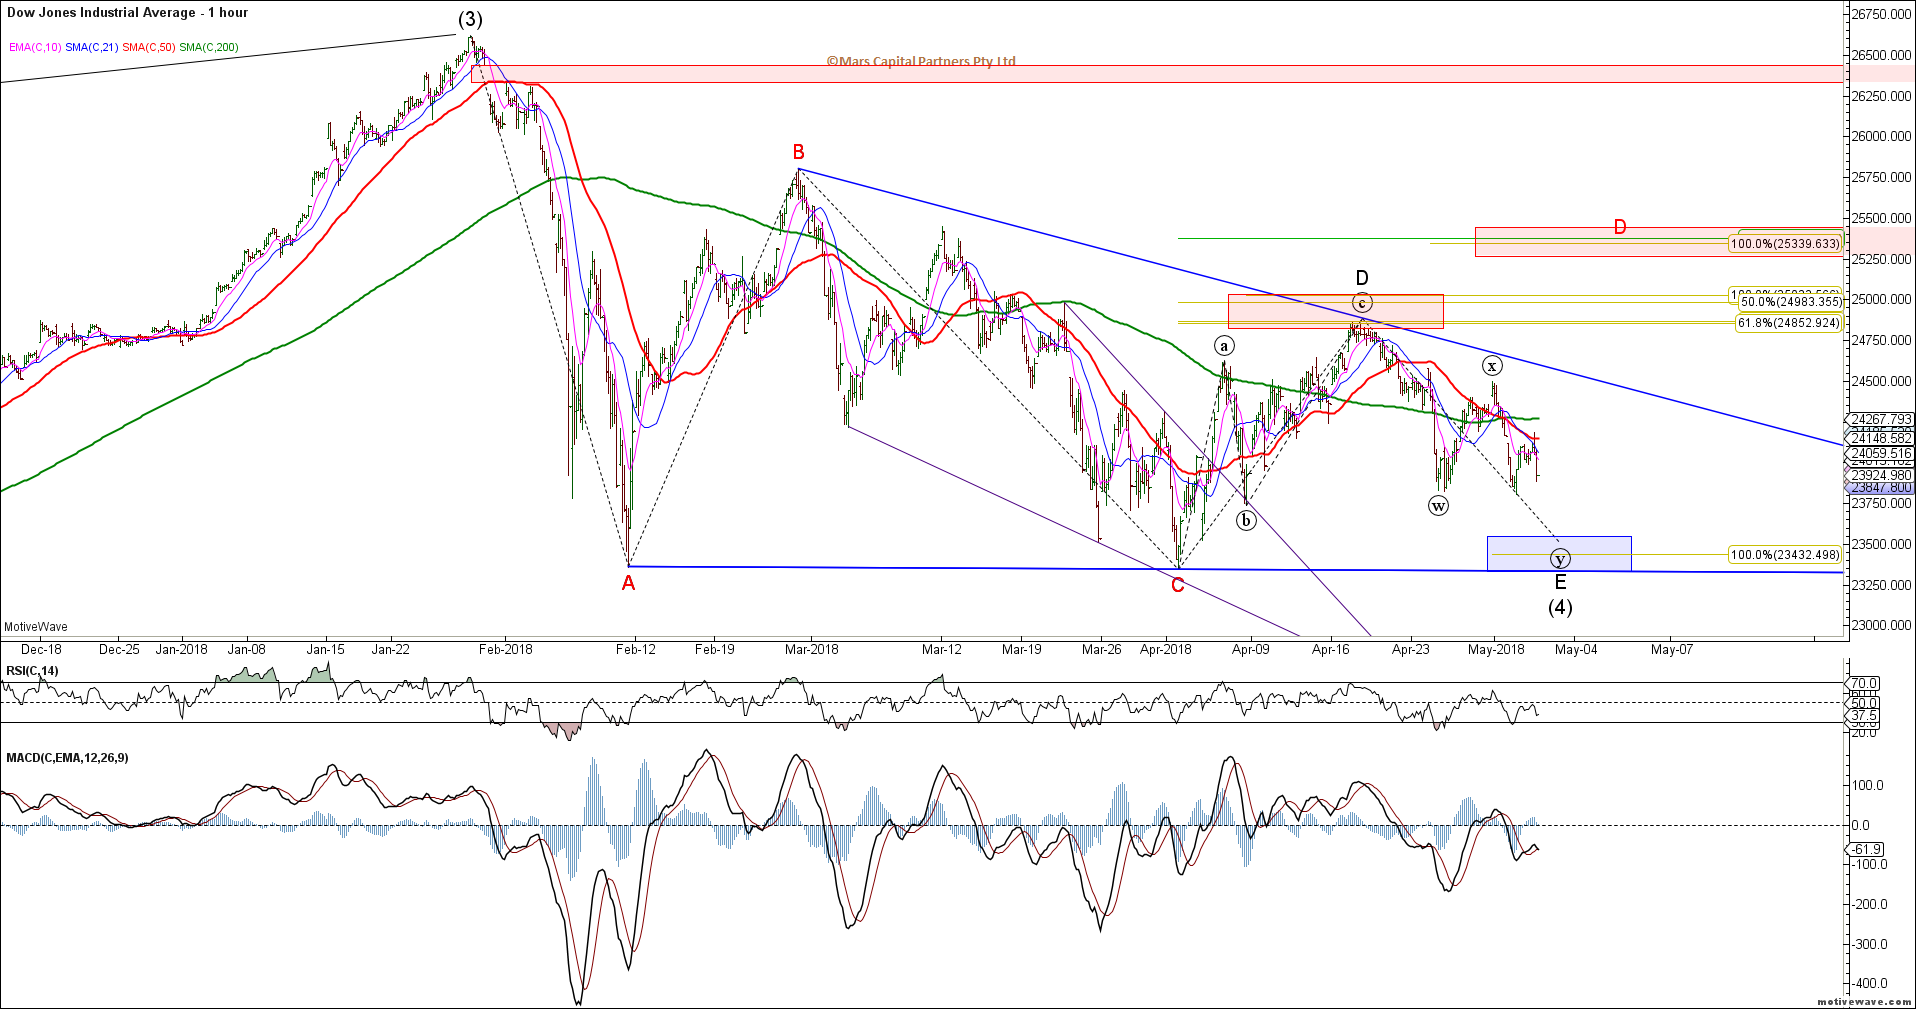
To the other primary indices and the Dow looks like it wants a test of the April lows – as long as these lows hold, the bull case remains in tact. It is important to note that a strong break of the February lows opens the door to more significant waterfall declines highlighted above.
DJIA H1 Triangle Case
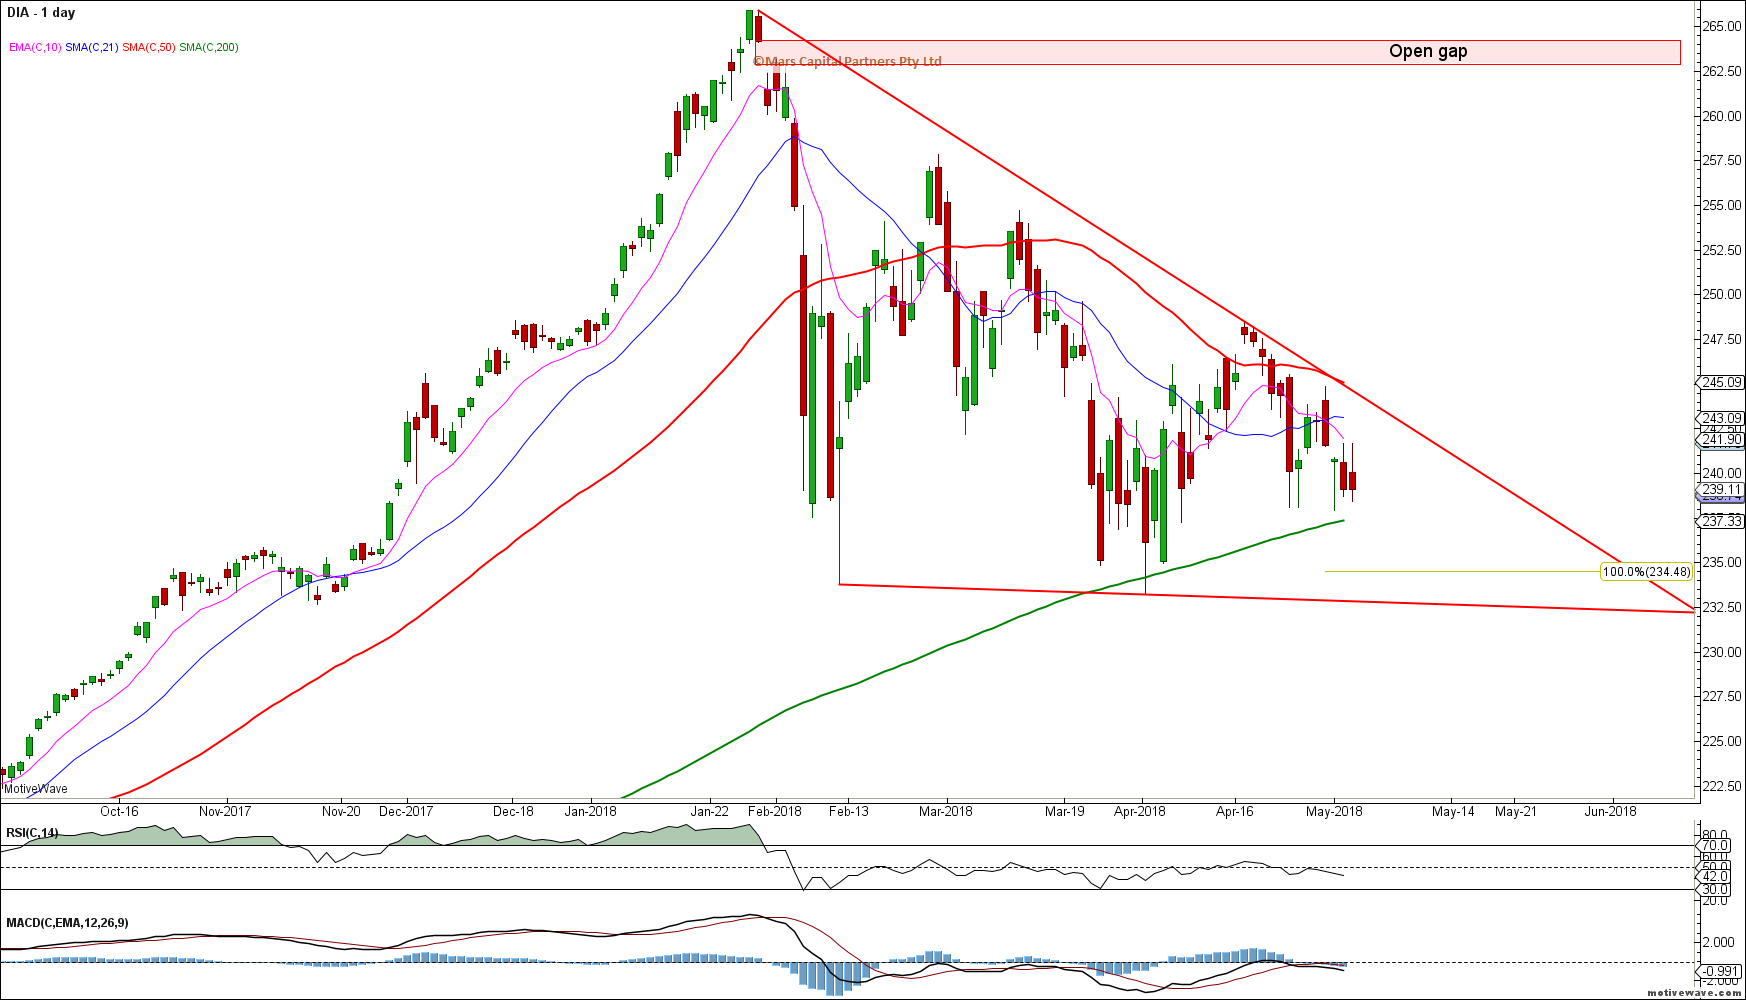
The DIA simplified chart below focuses on the 50 day sma and trend resistance and the 200 day sma and trend support.
DIA Daily
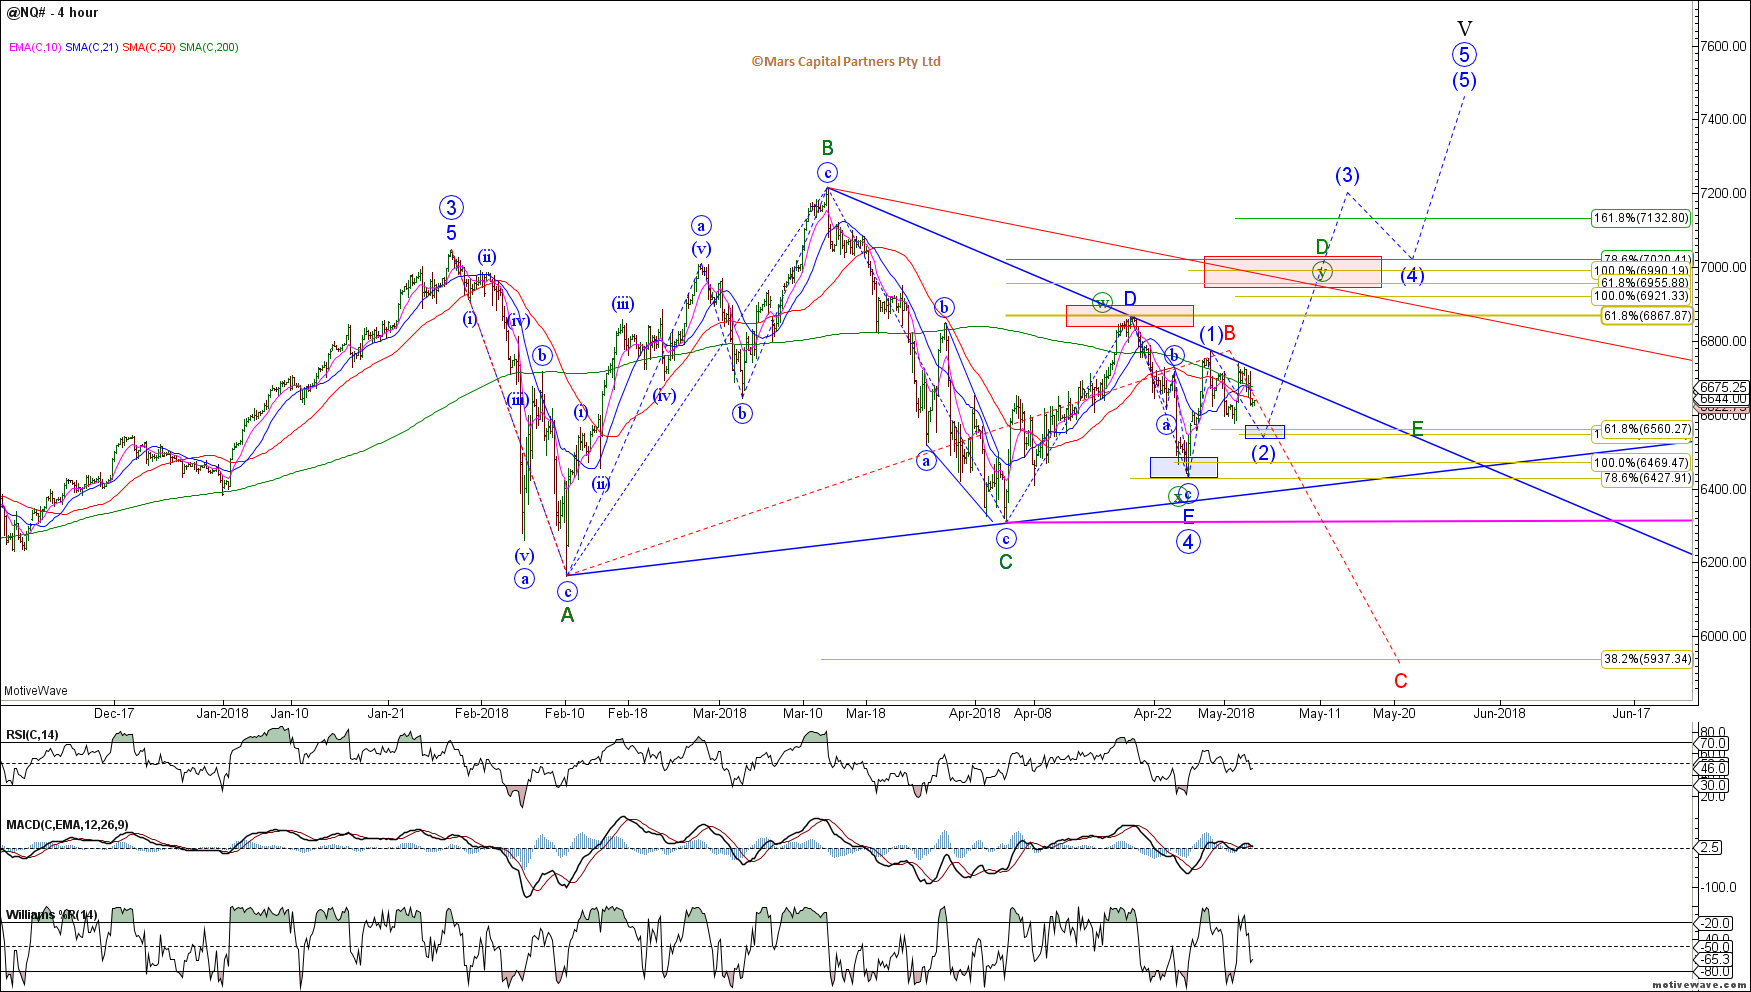
The Nasdaq / NQ continues to be capped by the declining trend line and 50 day sma – while we have covered these structural options previously, I think it is important to revisit them here. The primary blue bull case remains in tact with strong near term support in the 6550-60 area. Clearing the blue upper trendline and 50 day sma will likely see a push through to our next resistance zone at 7000. A decline below the April 6300 lows will likely trigger a larger wave C decline for the Bear Triangle shown in red. The expanded / prolonged Triangle is shown in green.
NQ H4 Triangle
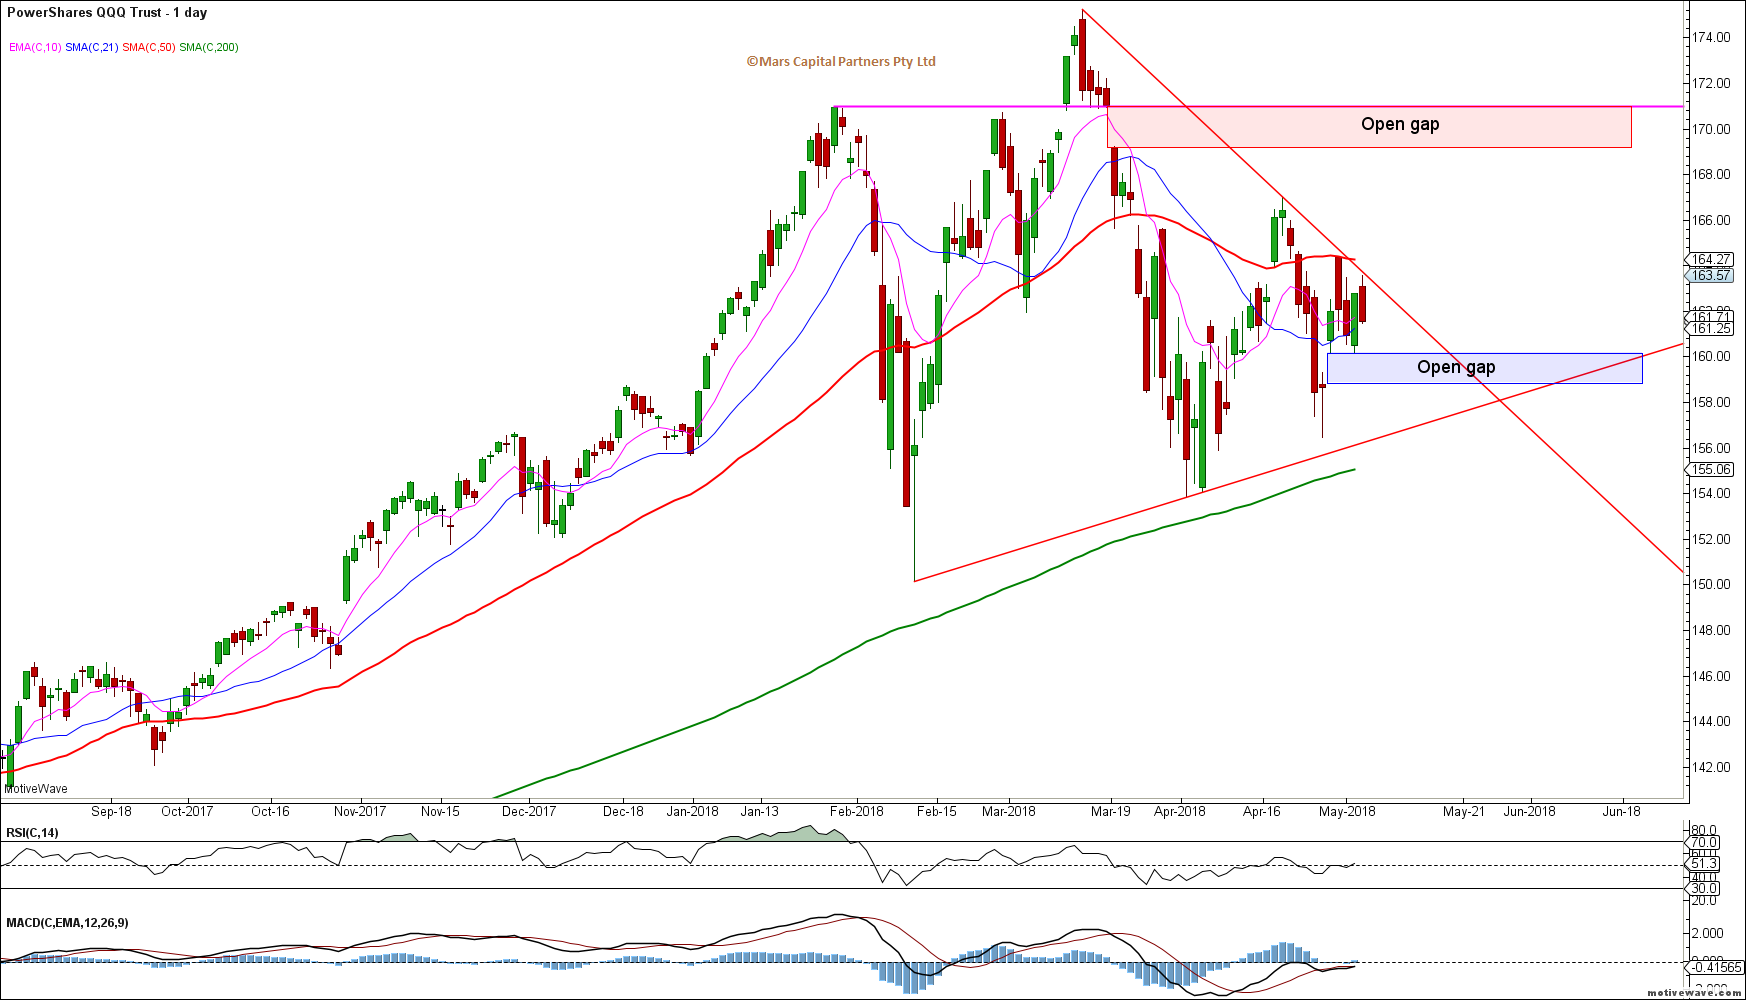
The QQQ clearly shows trend resistance and the important 50 day sma resistance and 200 day sma support – I have also highlighted the open gaps above and below which are natural attraction points and are often filled.
QQQ Daily
The Russell 2000 should have completed wave (c) of E for the bullish Triangle earlier this week and remains bullish while this week’s lows hold. Once again, a wave B bearish Triangle can also be counted as per the other indices. The Russell remains the most bullish with least impact of rising rates, strong $ and impending trade wars. It also hasn’t rallied as far or as fast as the other indices so it is less overbought. However, should the other indices break down, we would expect the Russell to follow suit.
RTY H4 Triangle
The IWM below also highlights key sma and trend support resistance areas we are focused on with particular attention on the 200 day sma in this case.
IWM Daily
That’s all for now folks. I hope that helps in identifying key levels and potential structures when considering Triangles. Cheers 🙂
Reminder: As I will be on vacation from January 29th through to February 16th, we will likely miss updates for the 5th and 12th of February – apologies in advance
US equity markets continued to rally strongly to the point of rising exponentially over the first couple of weeks of 2018 driven by the dovish Fed, Trump tax cuts and investor exuberance. I find it unusual for equity markets to accelerate this late in the cycle as usually only highly leveraged commodities like Silver squeeze exponentially (or the Nasdaq in 1990’s) – the higher we go I suspect the bigger the fall (unless the laws of gravity no longer apply).
Importantly, the US$ FINALLY made the new cycle lowswe had been looking for which added further fuel for the commodity market rally – these markets are fundamentally linked (as commodities are priced in US$) and I do not expect one to turn decisively without the other. We are now looking for a completed wave structure for the decline and subsequent bullish US$ reversal. We have been patient thus far so let’s not jump the shark.
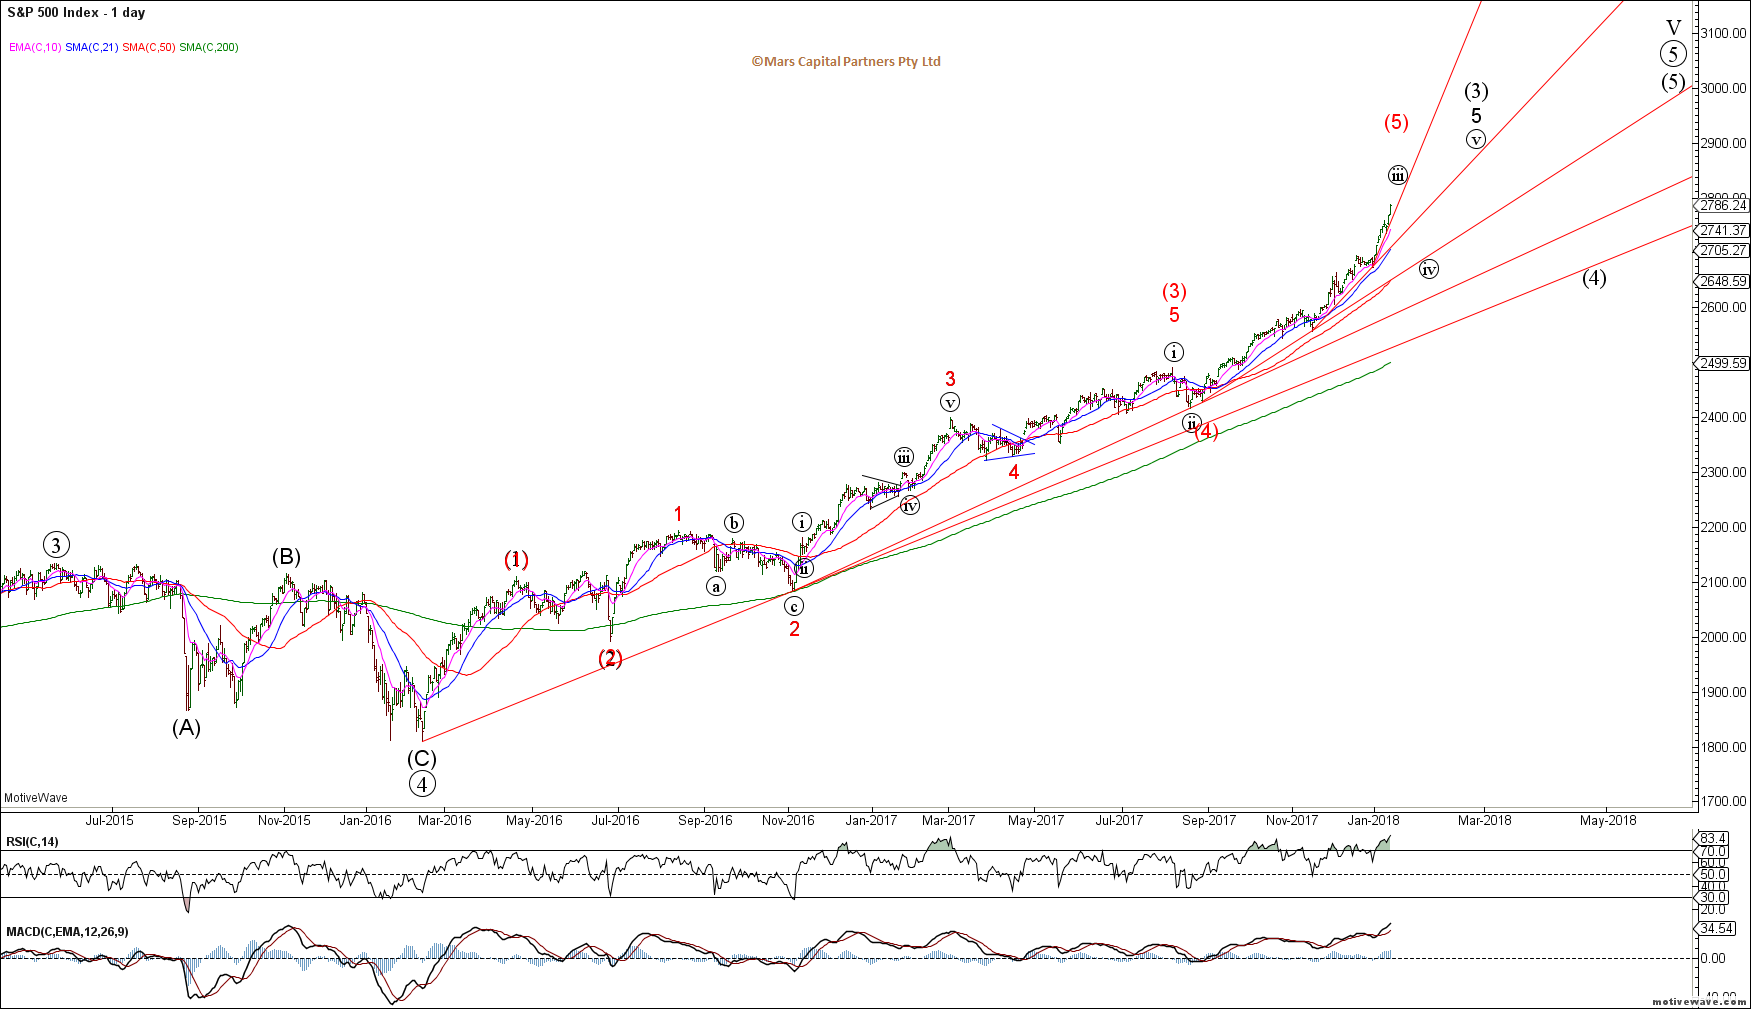
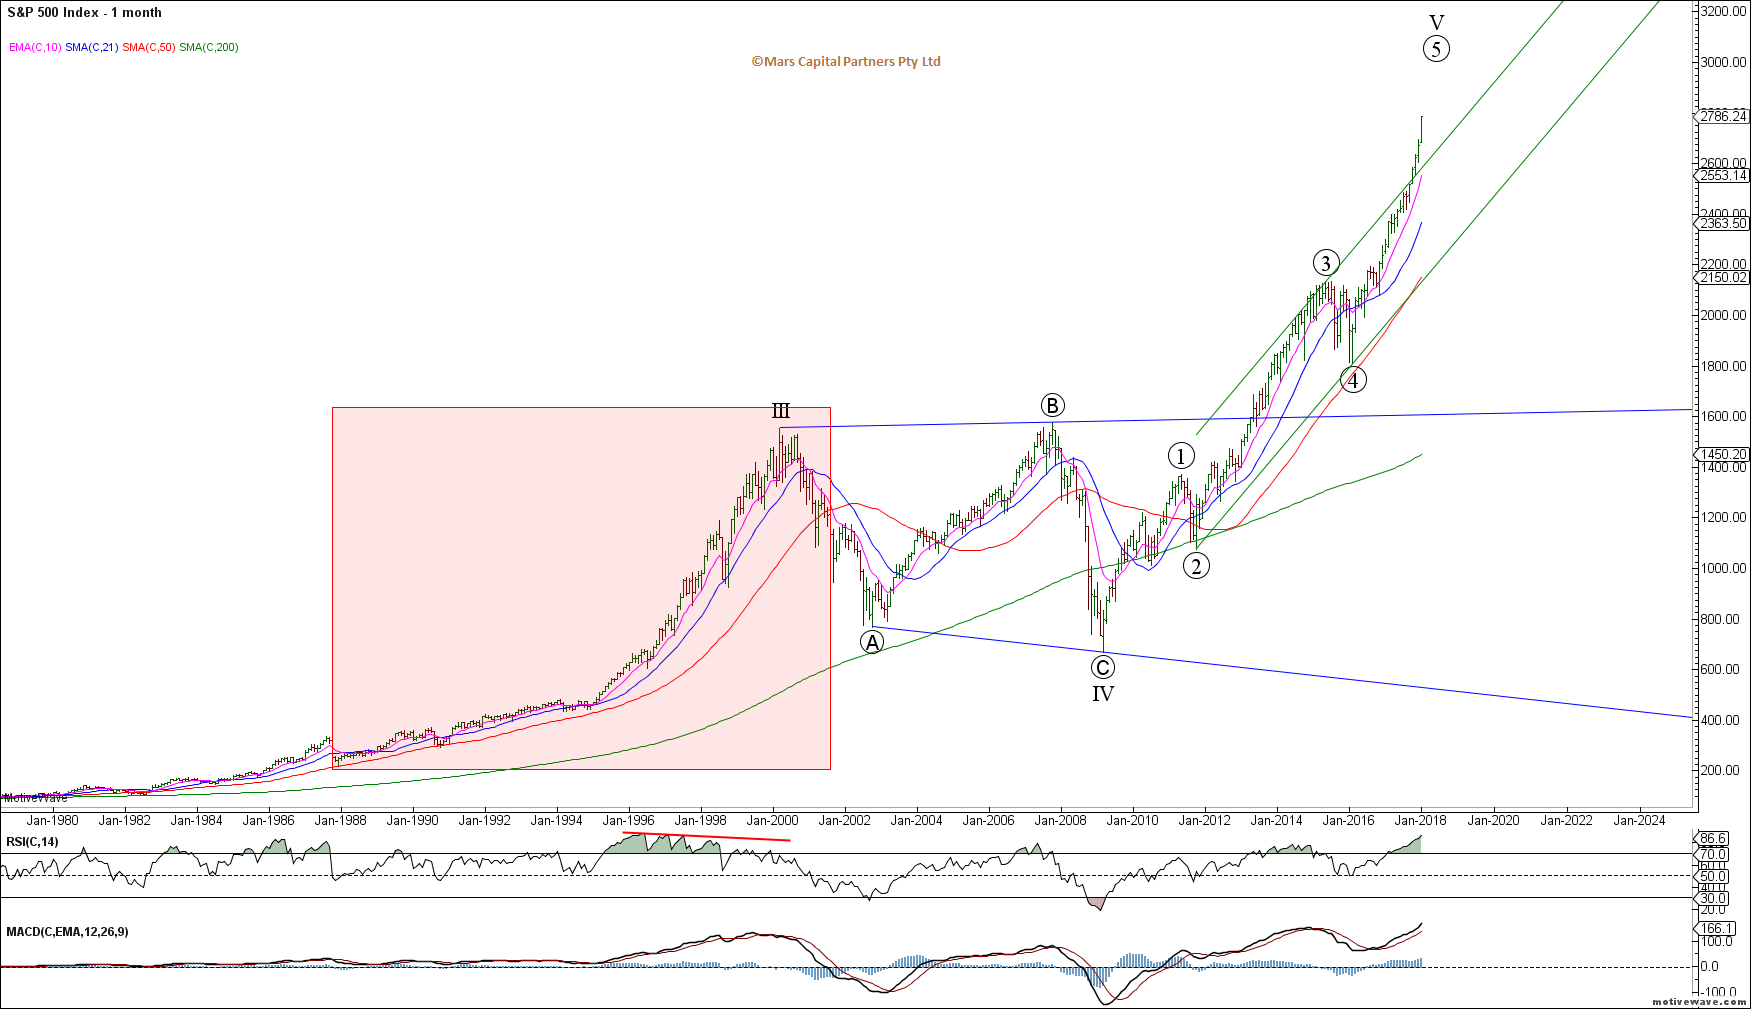
US equities including the SPX have started the year rallying at an increasing rate. This type of price acceleration “usually” occurs in the heart of a 3rd wave OR in the midst of a leveraged 5th wave blow-off. Therefore, if this is a genuine 3rd wave rally this equities rally may have a lot more upside to come. Alternatively, we could be in the final stages of a 5th wave blow-off as shown by the red count. We have blown through relevant upside targets so the key question we have to ask as speculators is whether this rally is the real deal OR are we blowing off into a speculative peak (highly unusual given the breadth of the rally). I don’t know the answer as yet but importantly we have not been fighting this. I have tried to illustrate the exponential nature of this rally by the series of rising red trend lines shown below.
SPX Daily
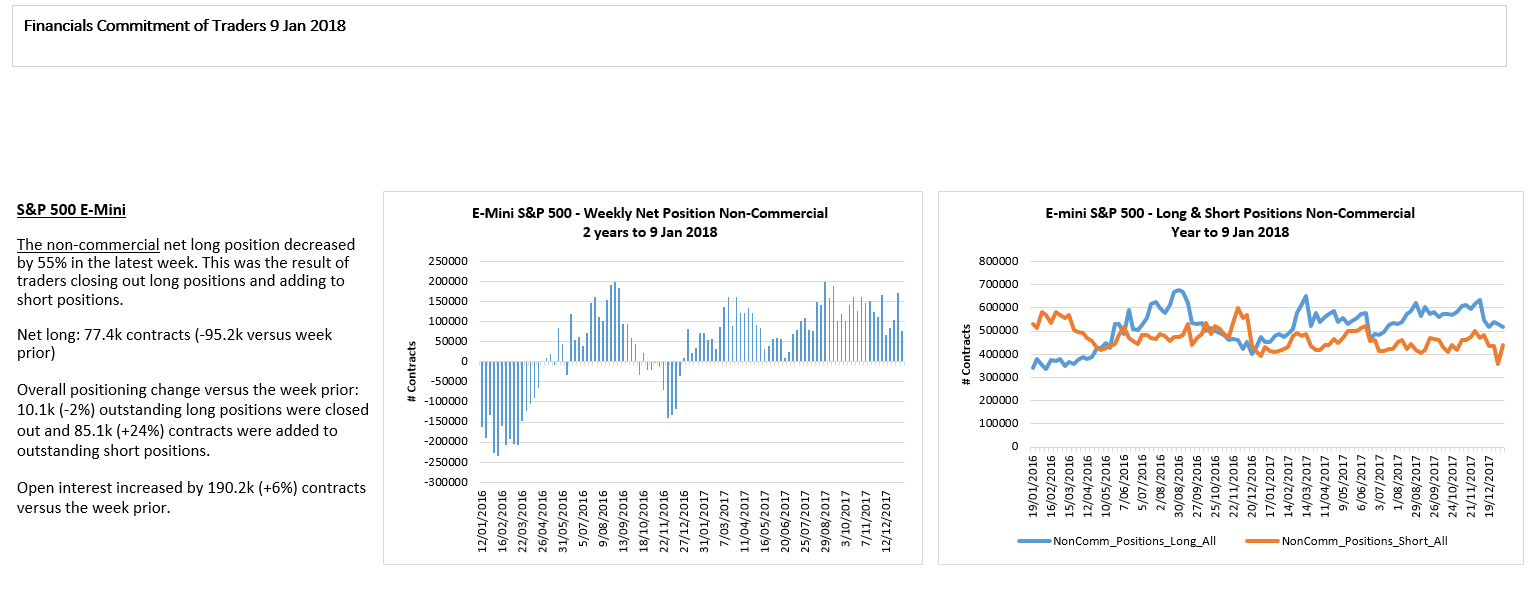
Hedgers have been adding shorts in this melt-up. Meanwhile we have Daily Sentiment at 96 for US equities.
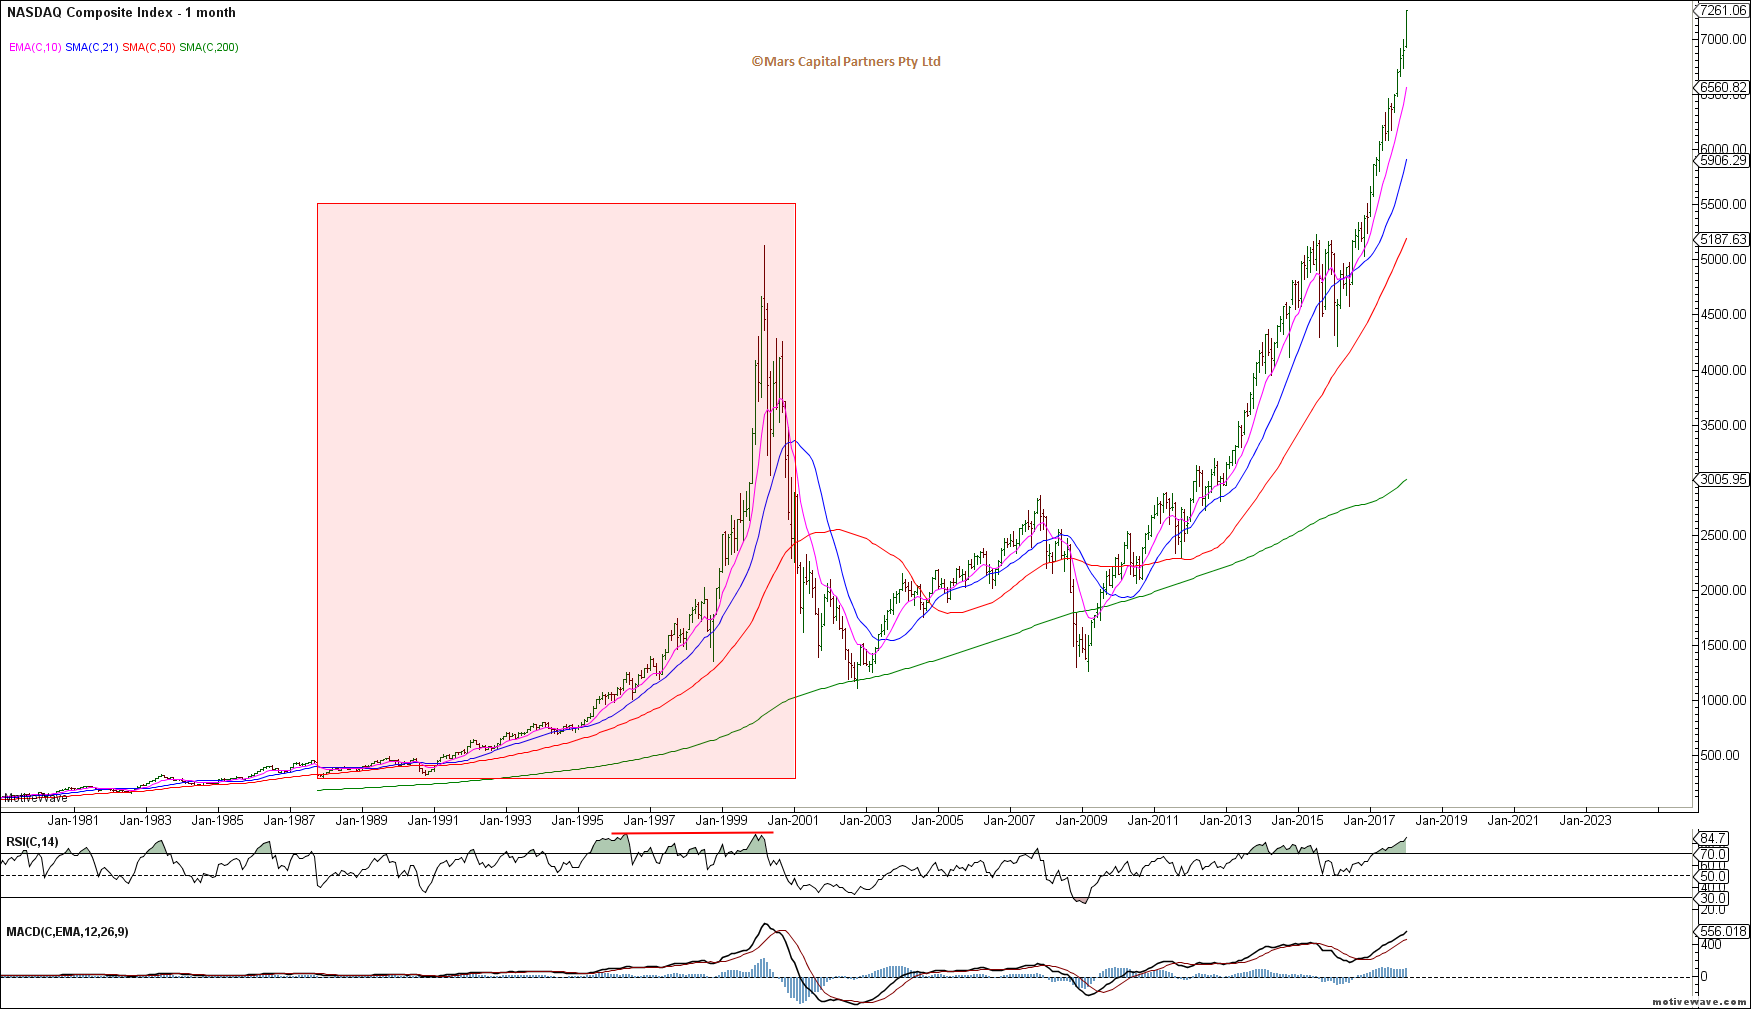
Importantly, momentum measures are now at new high extremes since the start of the post-GFC rally.Either this rally has much further to go to the upside OR we are setting up for an epic fail. Note on the monthly SPX chart below that RSI peaked in June 1996 while the rally continued into March 2000 with a series of lower RSI peaks – the same is NOT true of the Nasdaq rally over the same period where the RSI peaked into the highs (more evidence of a blow-off top). I am pointing this out so readers are aware of the potential outcomes and the dangers of exponential 5th wave blow-offs. I don’t know which of these playbooks plays out BUT we should be mindful of the POTENTIAL of an ending blow-off (shown by the red count above) and what that might mean for markets in this time of speculative euphoria. The key message here is that we can all protect ourselves of either outcome with the use of tail hedging.
SPX Monthly
Nasdaq Monthly
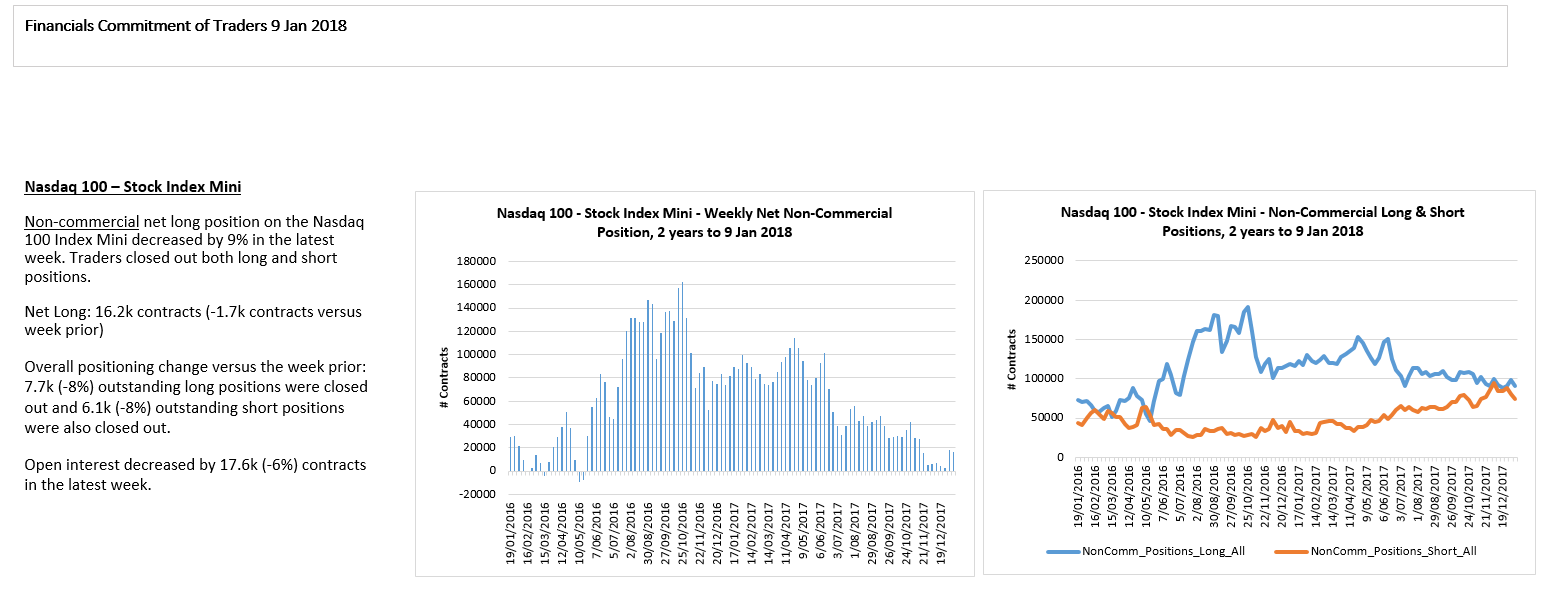
Meanwhile, Nasdaq futures shorts are getting squeezed.
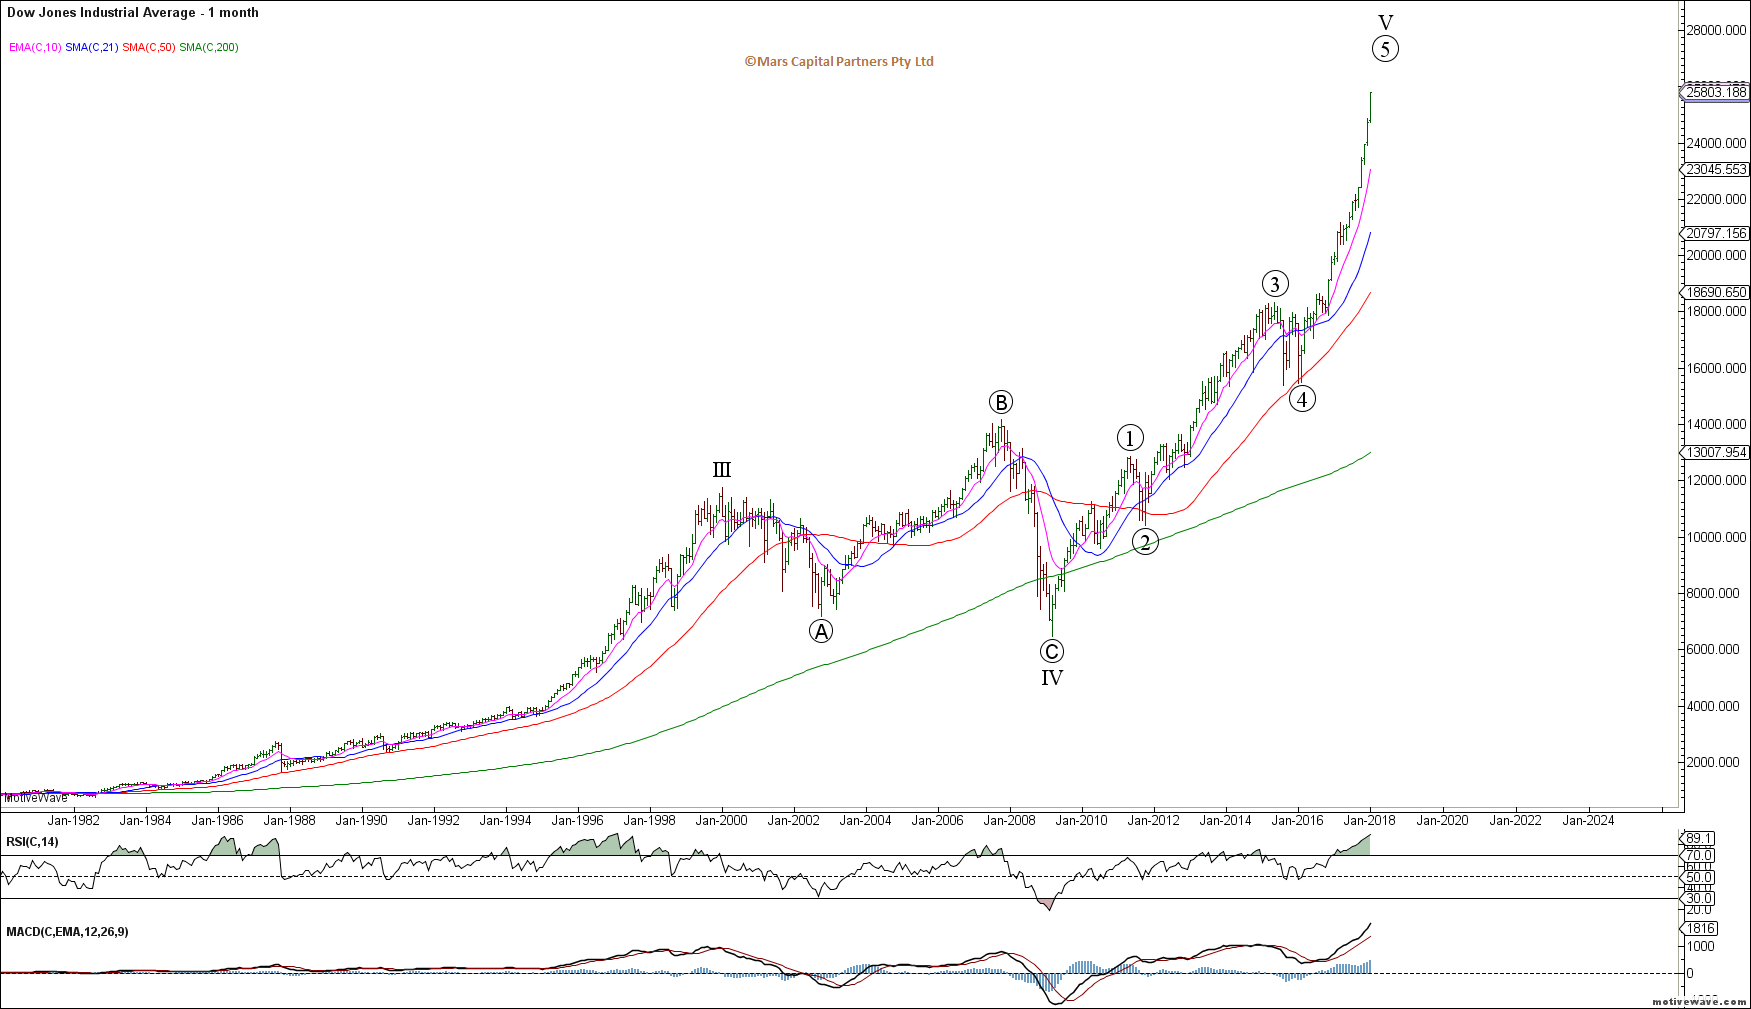
Note the DJIA’s now exponential rise in what is a muddling economy but prices are being driven by increasing leverage (debt) and speculative exuberance.
DJIA Monthly
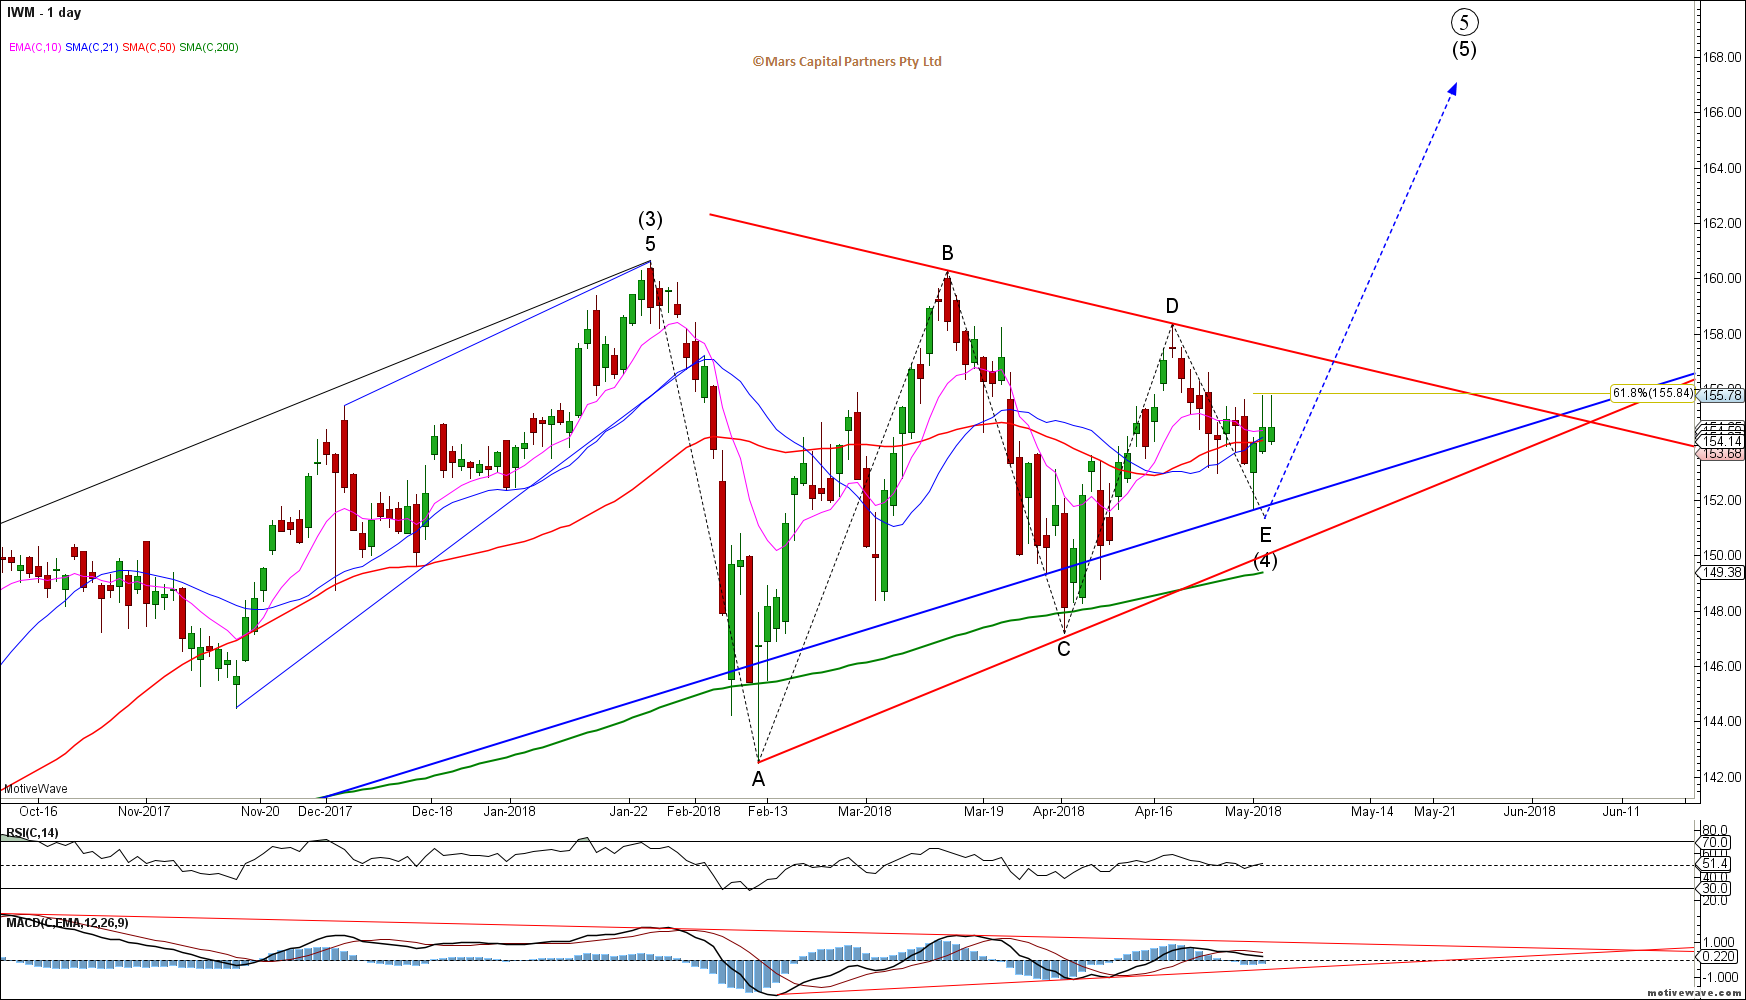
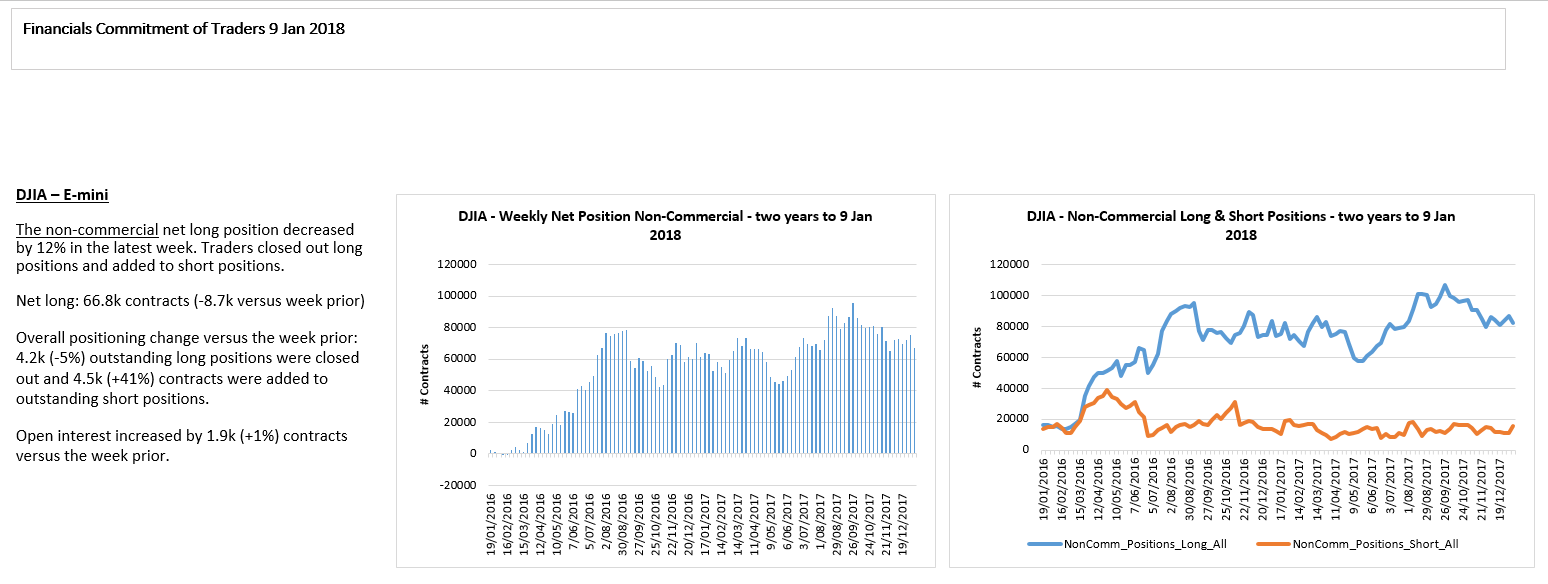
Now that the Russell 2000 has achieved our upside objective we are looking for evidence of a reversal – our “canary in a coalmine”. Trade above 160.55 for IWM invalidates the “ending diagonal” structure and will likely lead to increased strength. Key inflection point here for the small caps.
IWM Daily
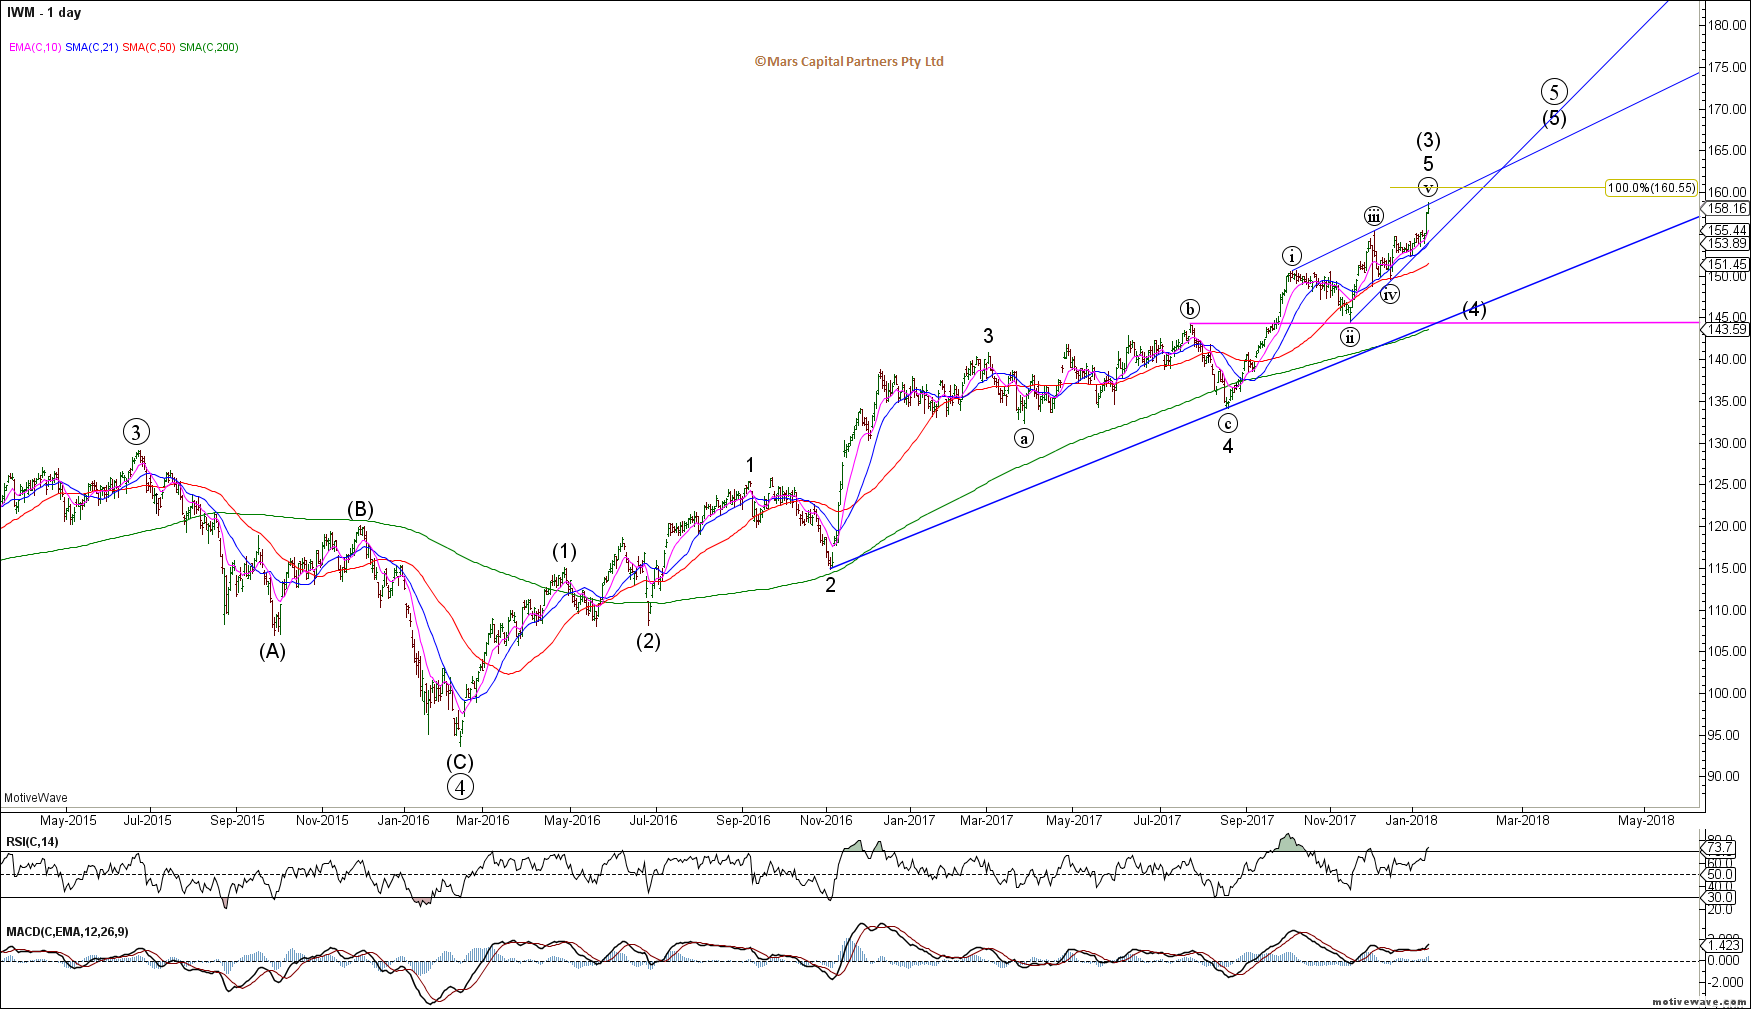
RTY is approaching invalidation of its ending diagonal above 1615 – remember, if we don’t fail asap then we could extend much higher.
RTY H4
Interestingly, the VIX has NOT made new lows despite the strong new year run-up in US equities as this pincer move continues. Take note.
VIX Weekly
VIX traders are adding longs at a faster rate than shorts likely for tail hedging which likely explains the VIX not making new lows while equities are at ATH’s.
To the global equity markets and the DAX reversed from megaphone resistance we highlighted in prior updates. The November highs remain key resistance as trade above that will likely lead to another strong wave higher. Until then, our bias remains lower back towards 12700 and potentially much lower. Ideally, we don’t want to see the DAX trade back above 13400 to maintain bearish momentum.
DAX H4
The European Banks have broken out to the upsidegiven rising rates in the Euro area. Bulls don’t want to see this back inside the triangle as this is likely a 5th wave rally.
Euro Banks Daily
The NKD has stalled since our triangle thrust higher but has held up despite a strengthening Yen. No interest for me here as there are no clear signs of a bearish reversal so the wave may extend higher.
NKD Daily
It is concerning that NKD traders have gotten so bearish which may imply that wave (v) of 3 is incomplete.
The ASX200 (SPI) reversed lower last week from recent highs but continues to hold breakout support. Still no interest for me here until we get a clearer structure to trade against. Trade back below 5950 prior swing highs may get me interested on the short side.
SPI Daily
To the bond markets and while the world is getting bearish bonds, the TLT chart just shows continuous range trading– strong trade below 122 would likely signify a break down in bonds and rally in rates.
TLT Daily
The TYX shows a similar choppy structure with no clear impulse since the 2016 rally. Tough to trade until we get a clear direction but I’d prefer to buy from lower.
TYX Daily
The TY bond declined into long term support but there is no evidence of a bullish reversal as yet.The mood remains bearish bonds and traders are now very short into structural support. For this decline to look impulsive it would need to accelerate lower from here. I think the better bet is to buy some cheap calls against the herd as I am wary of shorting into the hole here.
TY Daily
While I still prefer this ending wave C structure, we have no real evidence of a turn except for a small potential hammer on the Daily. Tough to call a low just yet until we get confirmation of a turn.
TY H4
TY longs capitulating here into long term support.
The US30yr bond broke shelf support but has failed to follow through to the downside so far. Despite the bond market pessimism, prices really aren’t breaking down as yet so I am wary of the potential for a false break. The decline from the September 2017 highs continues to look corrective unless it starts to accelerate lower from here which is not my base case. I don’t like the R/R of being short bonds here near term.
ZB Daily
ZB bulls may also be giving up here but less one-sided than TY and FV.
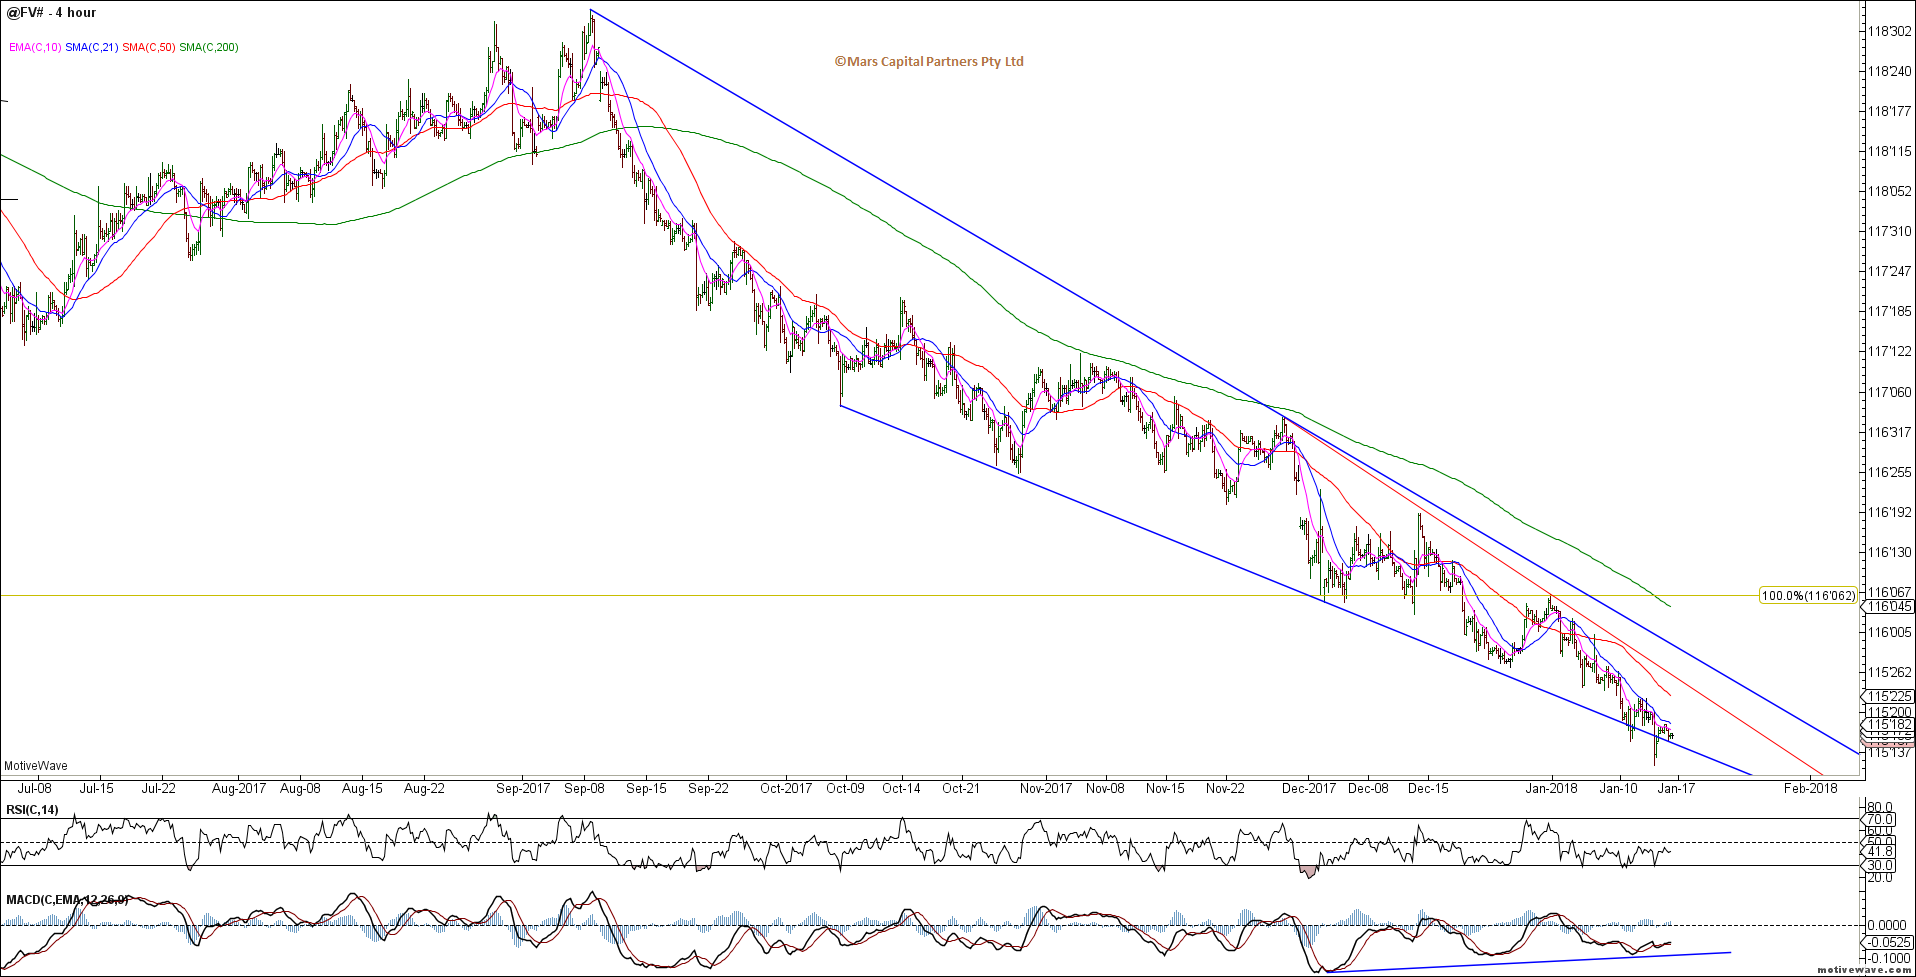
The 5yr continued trending lower with no clear signs of a bullish reversal while the declining wedge remains in play. Traders are extremely short so be careful of the asymmetric positioning!
FV H4
To the FX markets and the DXY finally made new cycle lows that we had been waiting for.We need to see this wave subdivide into 5 waves to complete the bigger picture decline and look for a bullish reversal. So far so good.
DXY Daily
DXY H4
DXY traders remain flat as we make new cycle lows.
The Euro shows the same picture as we approach our upside targets for this rally. We continue to look at this as an ending wave prior to a bigger picture Euro decline.
EURUSD Daily
EURUSD H4
Euro traders have continued to pile in to longs while bears have capitulated – a very one-sided bet being placed here so beware.
The USDJPY declined towards our 110 support after breaking 112 as we discussed previously. We are approaching an important inflectionpoint where USDJPY is approaching support and Gold is approaching resistance. Trade below 109 likely sees 104 under the alternate red count (if Gold breaks out to the upside). Watch correlated markets here.
USDJPY Daily
USDJPY H4
YEN traders remain strongly net short so there is a risk the USDJPY continues to decline as traders are caught short?
The Aussie$ tried to reverse lower from our 0.7900 resistance area but reversed higher on Friday. As mentioned last week, the short positioning of traders made me wary of joining them – the bear count is invalidated above the September cycle highs where we will have to reassess the bigger picture. The impulsive look of this rally has me on the sidelines until we get evidence of a reversal.Next resistance is in the 0.80 area but we’ll sit tight given the US$ downside risk.
AUDUSD Daily
Aussie shorts may finally be capitulating…
The USDCAD is approaching Fib 61.8% support once again but we don’t yet have buy signal so we will see how this retest of the lows evolves.Tough to get long the US$ until downside momentum moderates.
USDCAD Daily
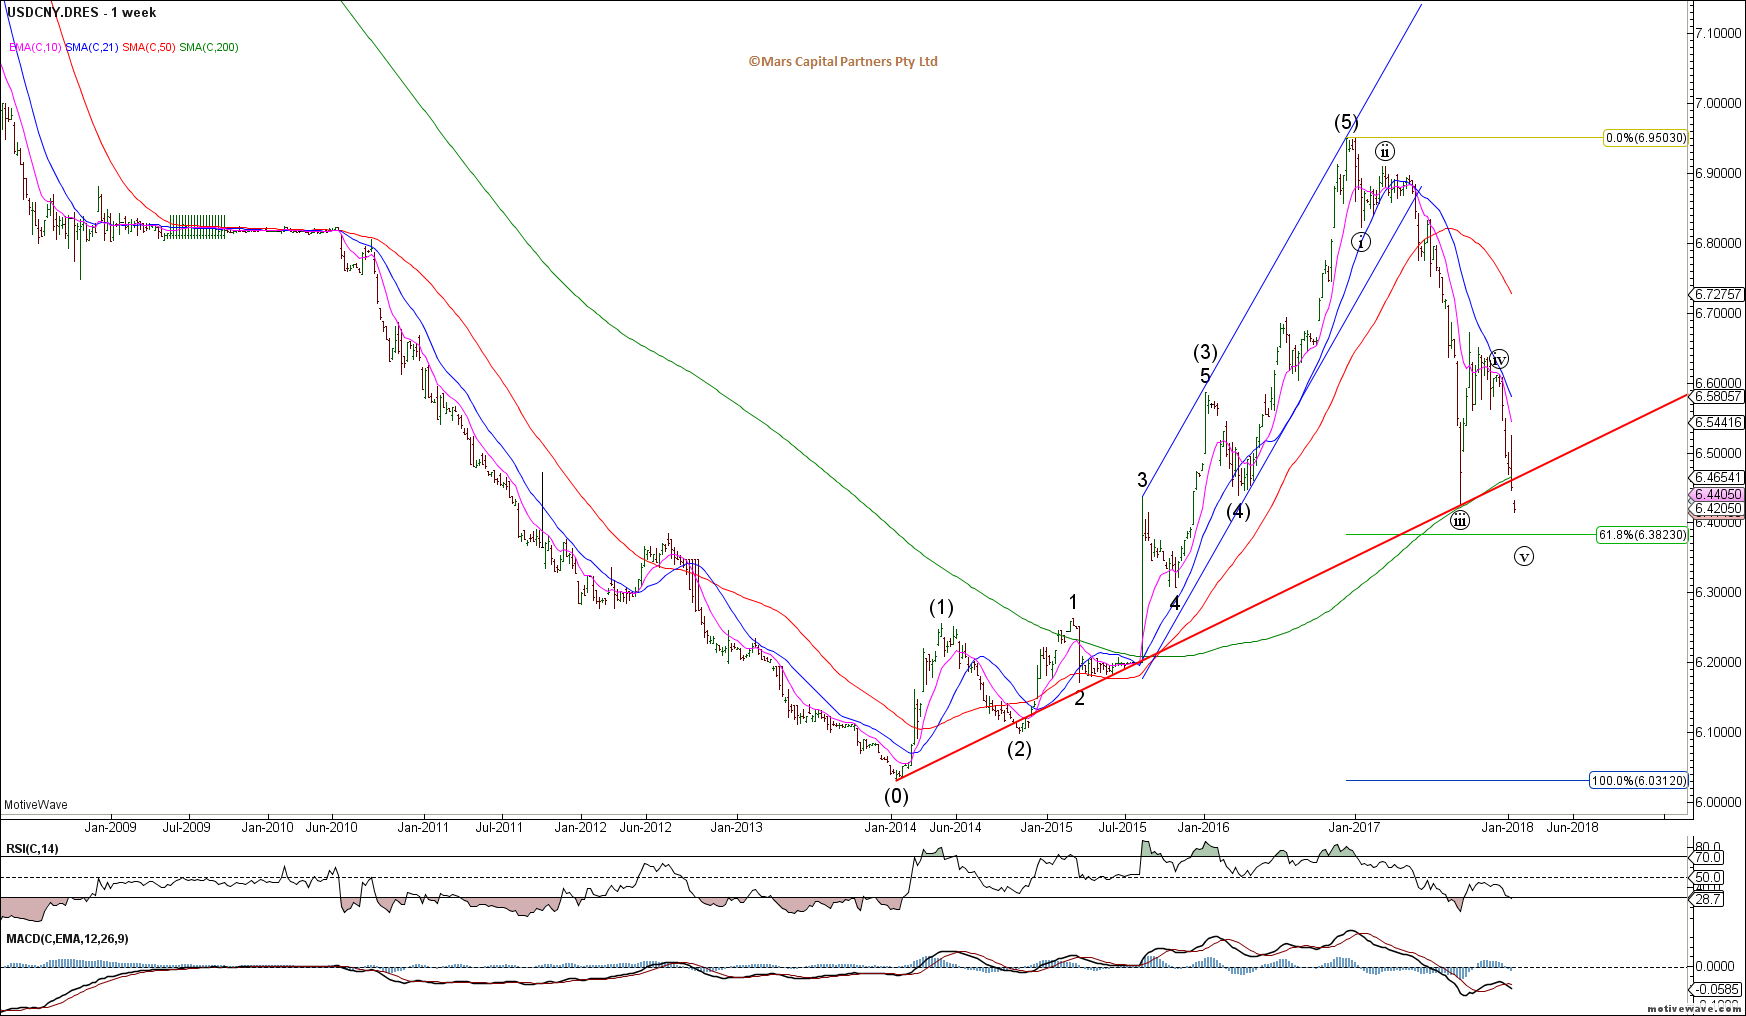
The USDCNY failed to hold trend support but the Fib 61.8% resides in the 6.38 area – this decline looks impulsive but once again, I am interpreting this latest decline as a 5th and final wave where upon completion we should be looking for a bullish reversal. Until then I’m standing aside.
USDCNY Weekly
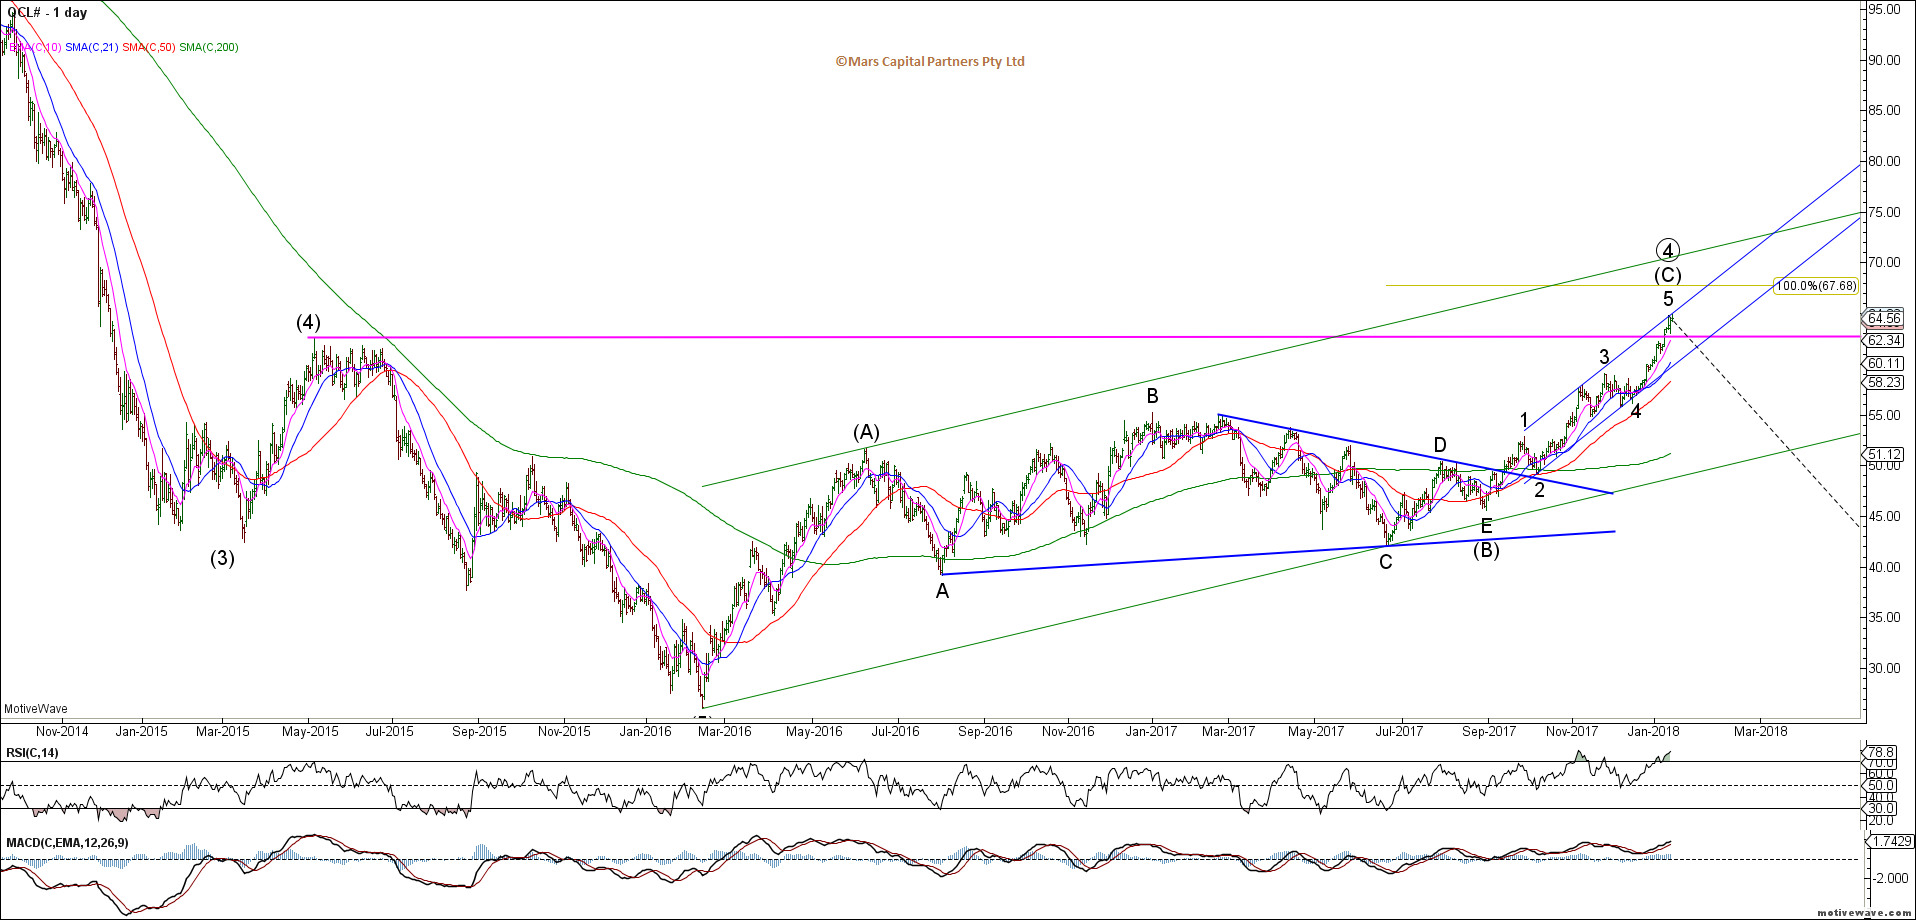
To the commodity markets and Crude Oil failed to break our $63 support (tweeted last week) and continued to extend its advance with new highs. As we’ve said previously, Crude is unlikely to turn until the US$ does so patience is required as we might take a few shots at a turn. I just like the R/R here for shorts as we look for this wave 5 of (C) to end.
CL Daily
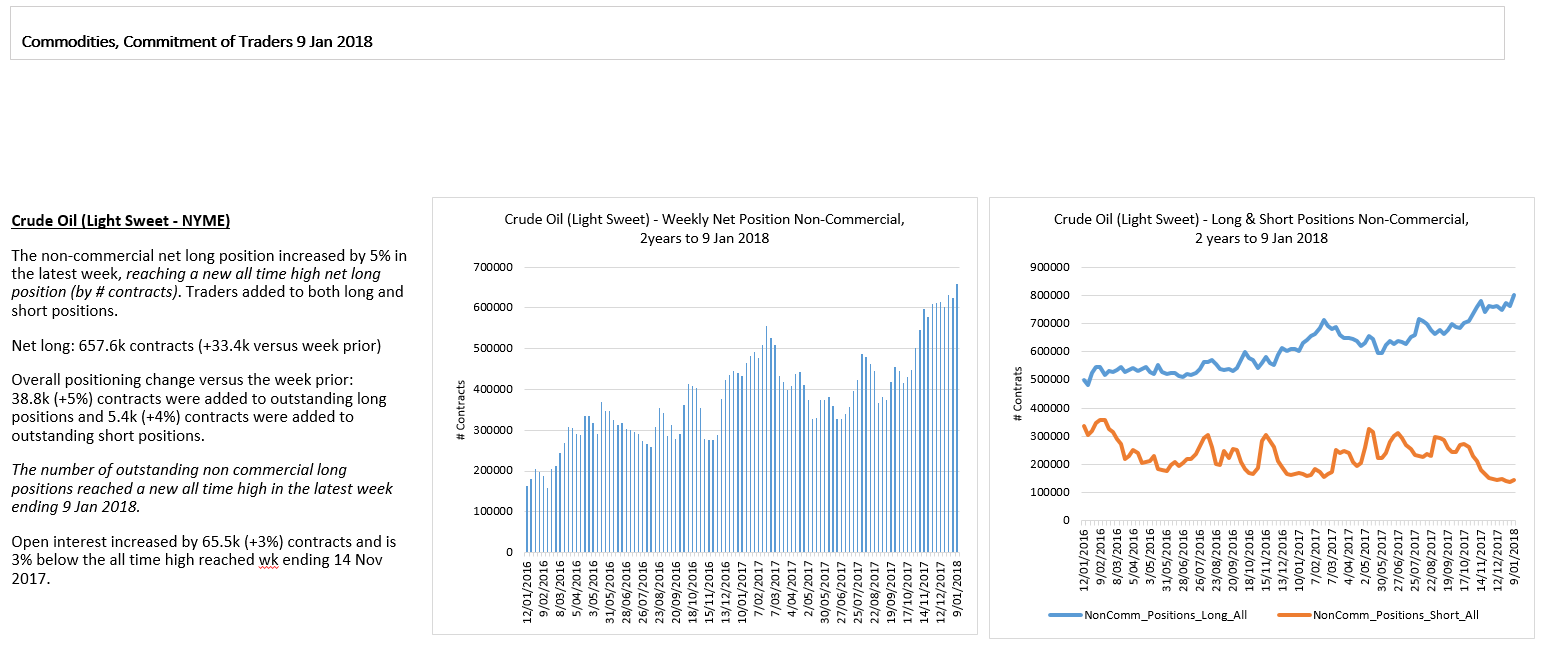
Crude traders extending historic long positions… when this market reverses, the door to get out will be very small.
Brent is in the same structural position as Crude. Looking for a turn lower now that $70 upside targets have been met.
Brent Crude Daily
Natty Gas ripped higher as expected but the bigger picture structure remains unclear. Ideally we see a 5 wave rally towards 3.44 while 2.70 holds the downside. We are approaching the top of the range so buyer beware.
NG Daily
Natty traders remain short in the hole.
To the PM’s and Gold has continued to rally back towards the top of the range as we had been anticipating. The triangle structure is invalidated above 1380 where we will have to consider the potential for a break higher towards 1450. Approaching an important inflection point for the PM’s as bulls pile in.
Gold Daily
Gold traders piling into longs once again…
Silver is also now at trend resistance in the 17.50 area so it is also at a near term inflection point. No signs of a reversal yet but we are watching the US$ carefully.