by Mars Capital Partners | Jan 3, 2018
As we look forward towards 2018, let’s focus on some bigger picture themes:
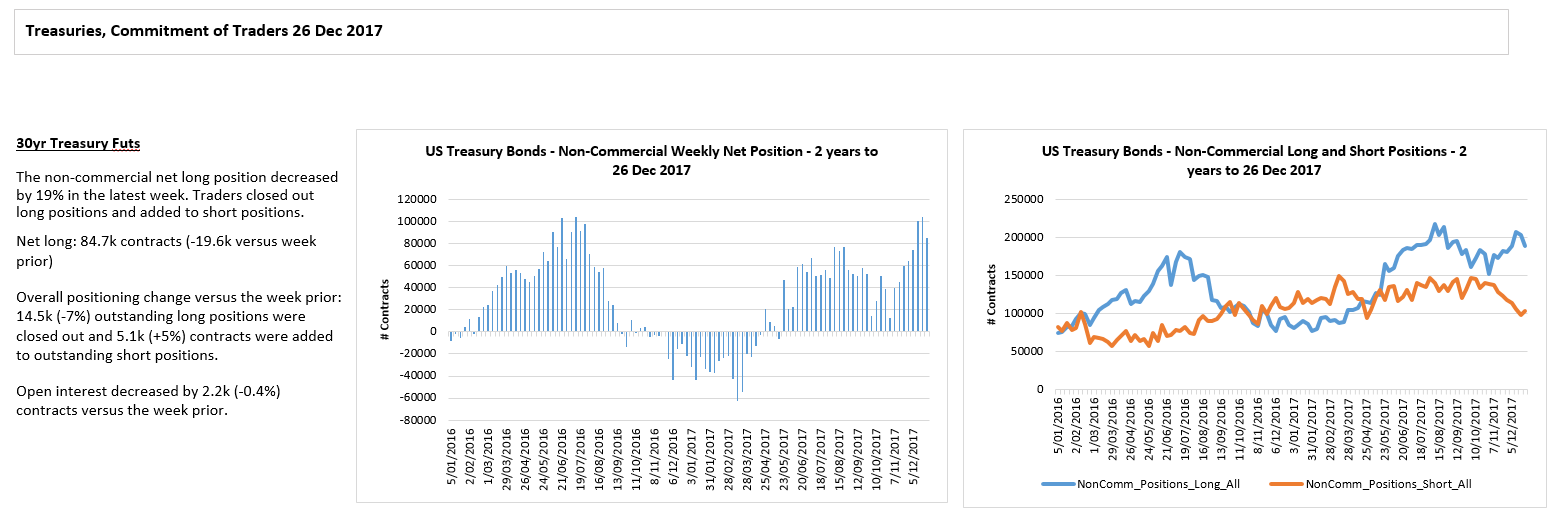
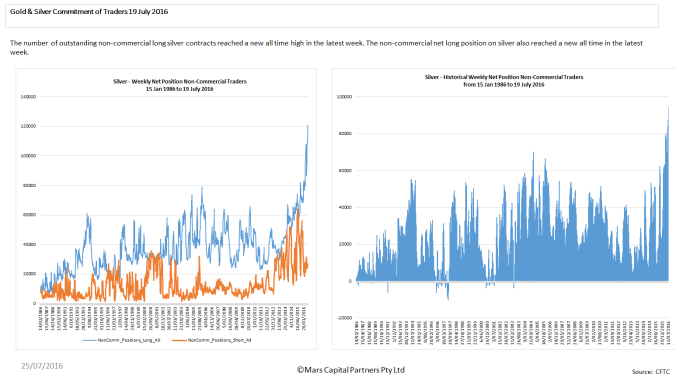
- Global Central Bank money printing and interest rate suppression has distorted financial markets pushing investors further out on the risk spectrum. This is at a time when global debt and deficits are all time highs while global demand continues to stagnate – what happens when global rates start to rise as we are forecasting…
- The rise in Passive Investing in ETF’s (aka: anyone can do it), demise of Macro Hedge Funds and rampant speculation in Crypto-currencies (which aren’t currencies at all) suggests we are nearing a top of this speculative mania
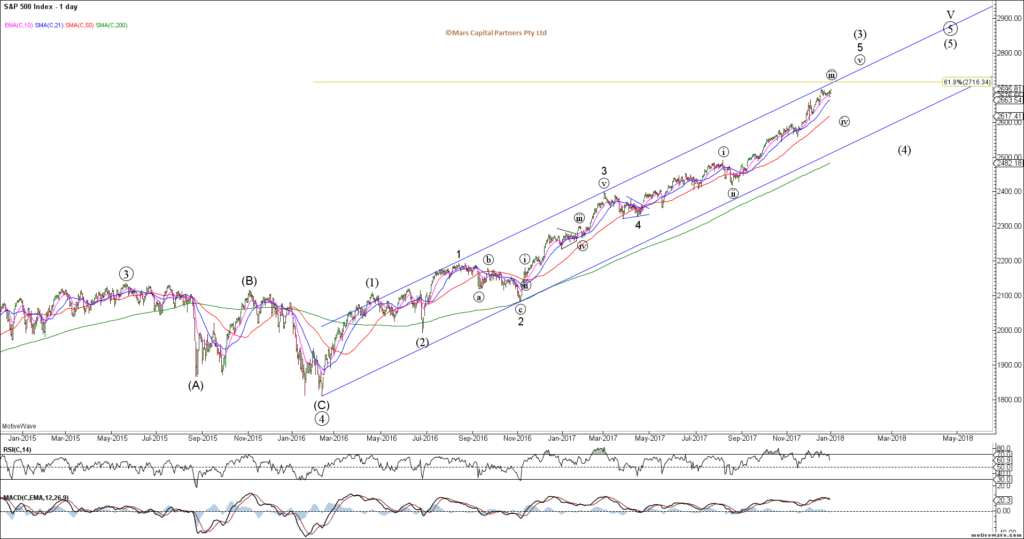
- Global equities remain within bigger picture wave (5) rallies that commenced in 2009
– we expect global equities to top in 2018
– wave 5 of (5) started in February 2016
– while upside targets have been met, we have very little evidence to suggest an end to the rally
– VIX continues its wedge compression as we look for an expansion in volatility in 2018
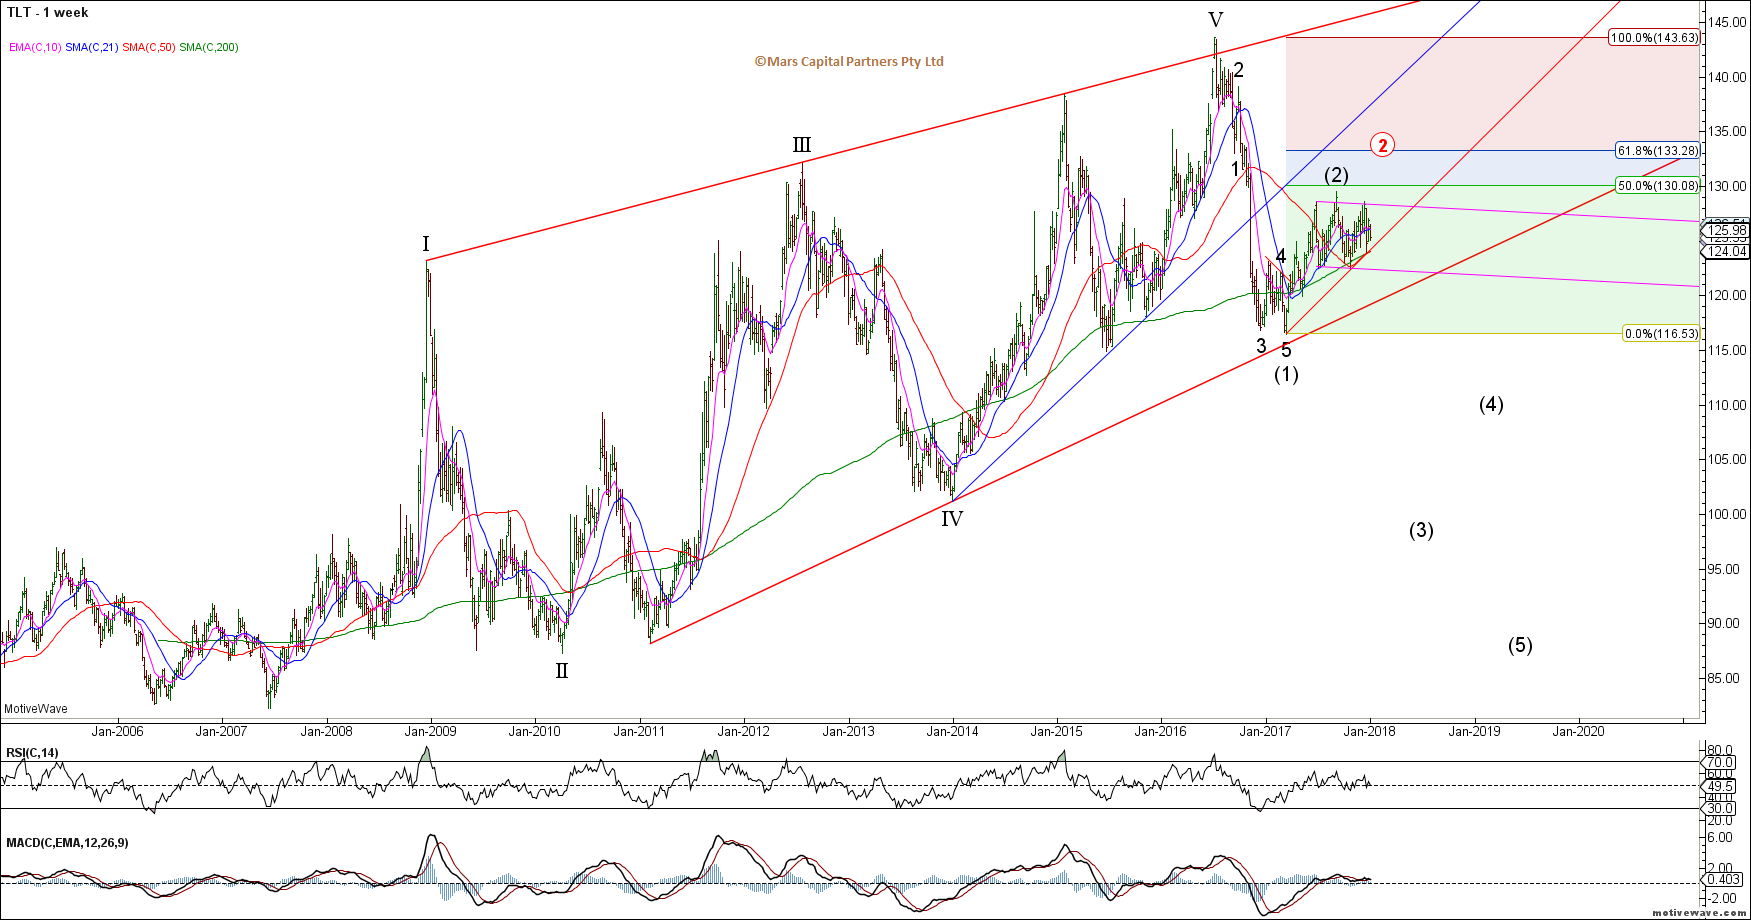
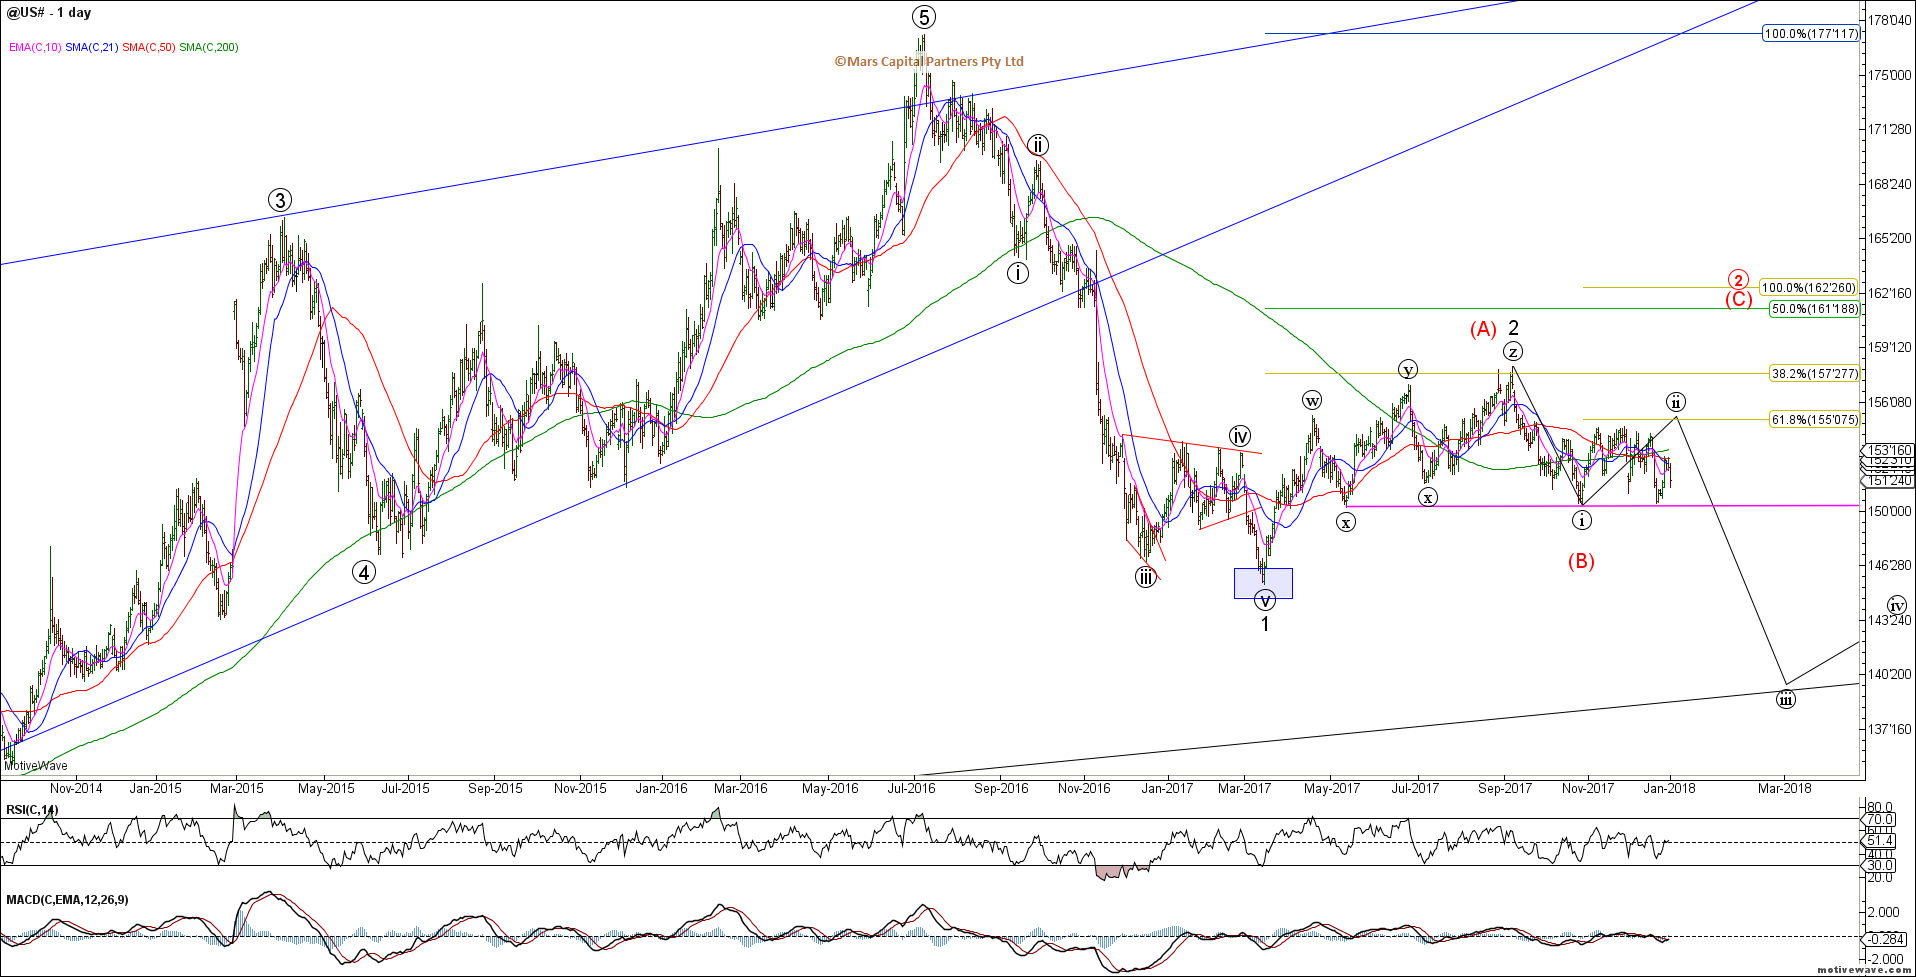
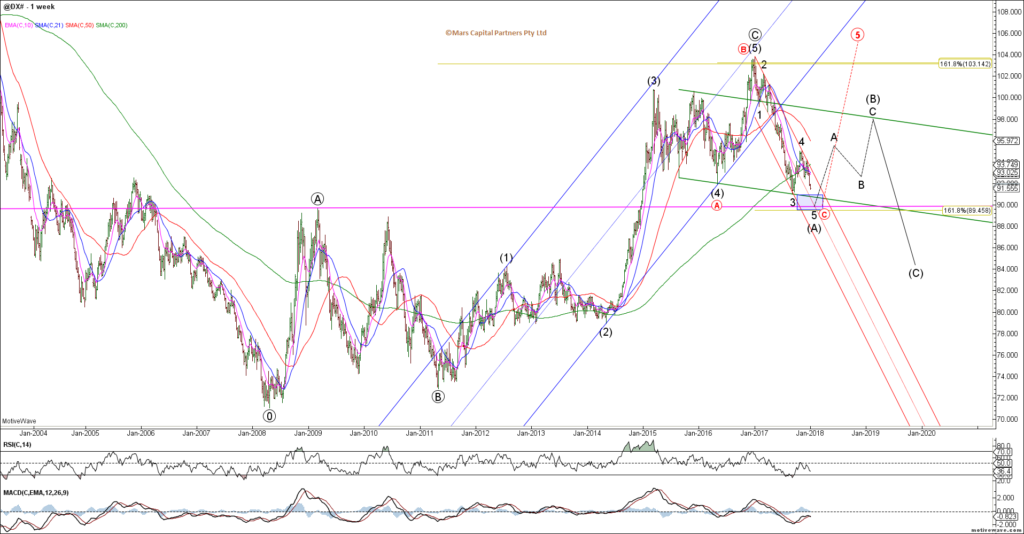
- Global bond prices topped in July 2016 from where rates rose until March 2017
– 2017 started a wave 2 correction but it is unclear whether this correction is complete
– bearish Bonds
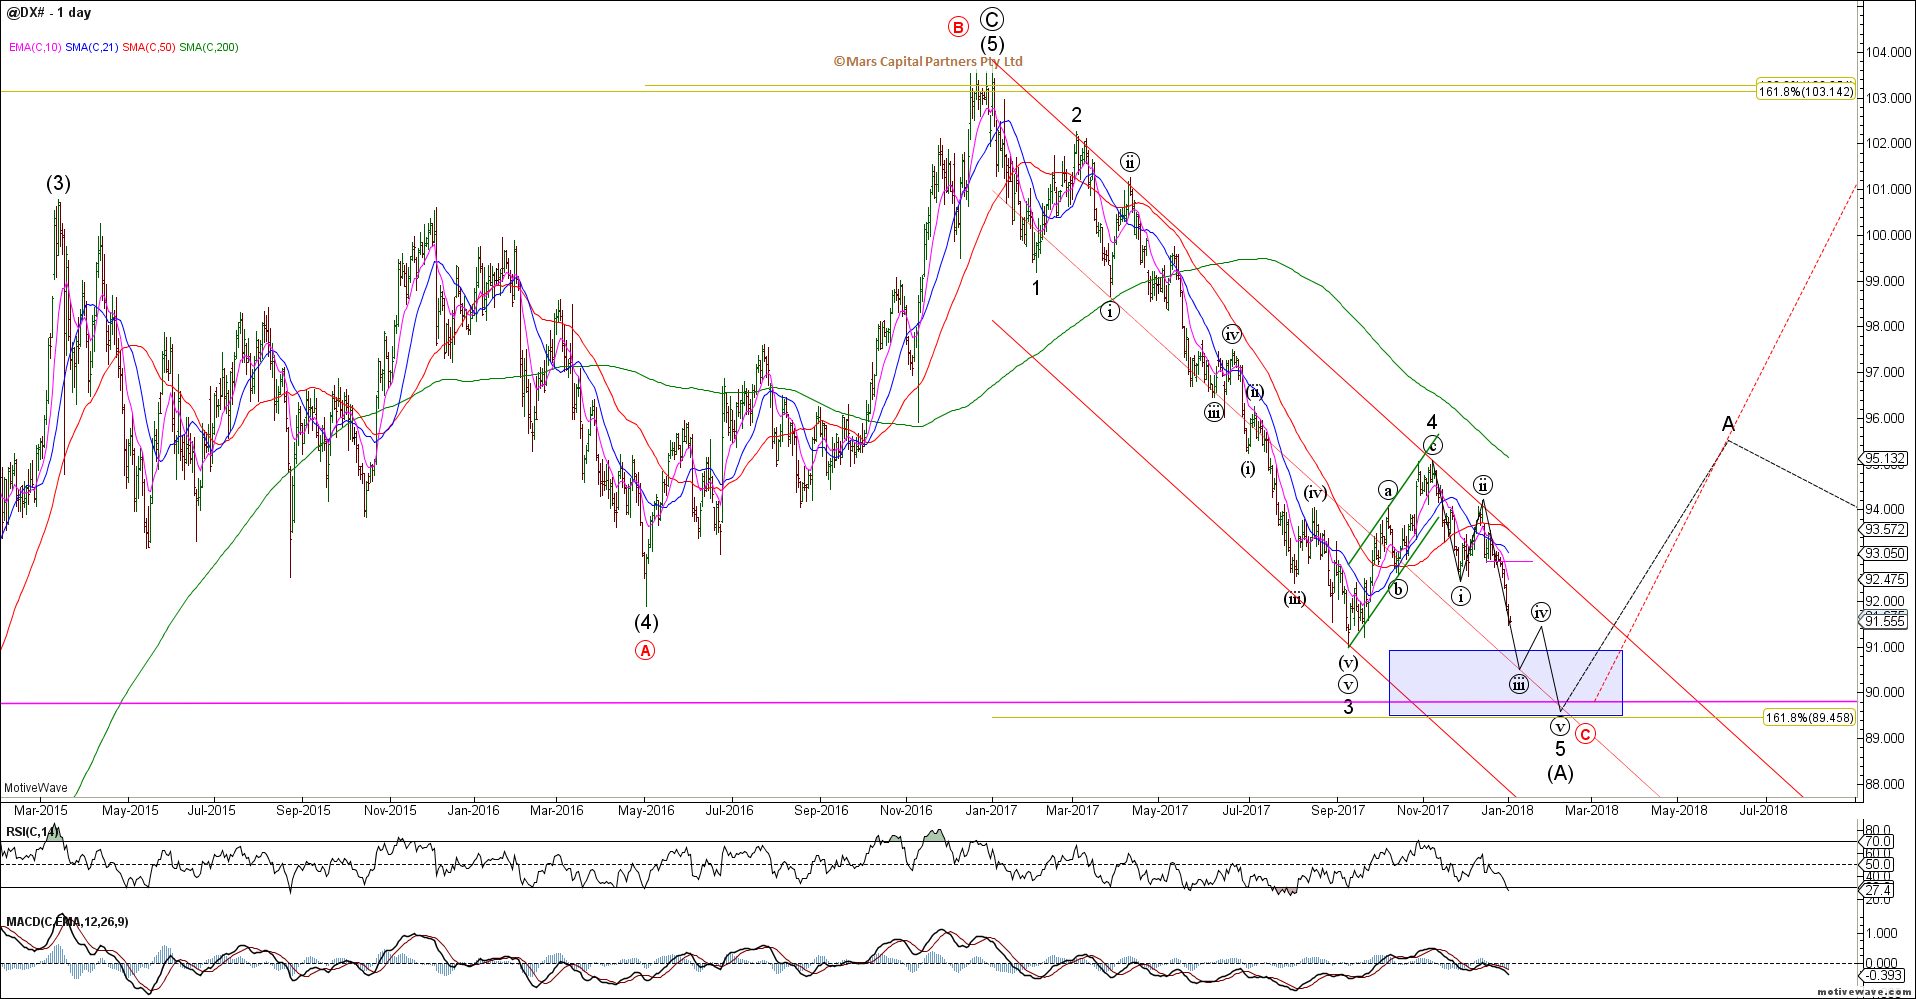
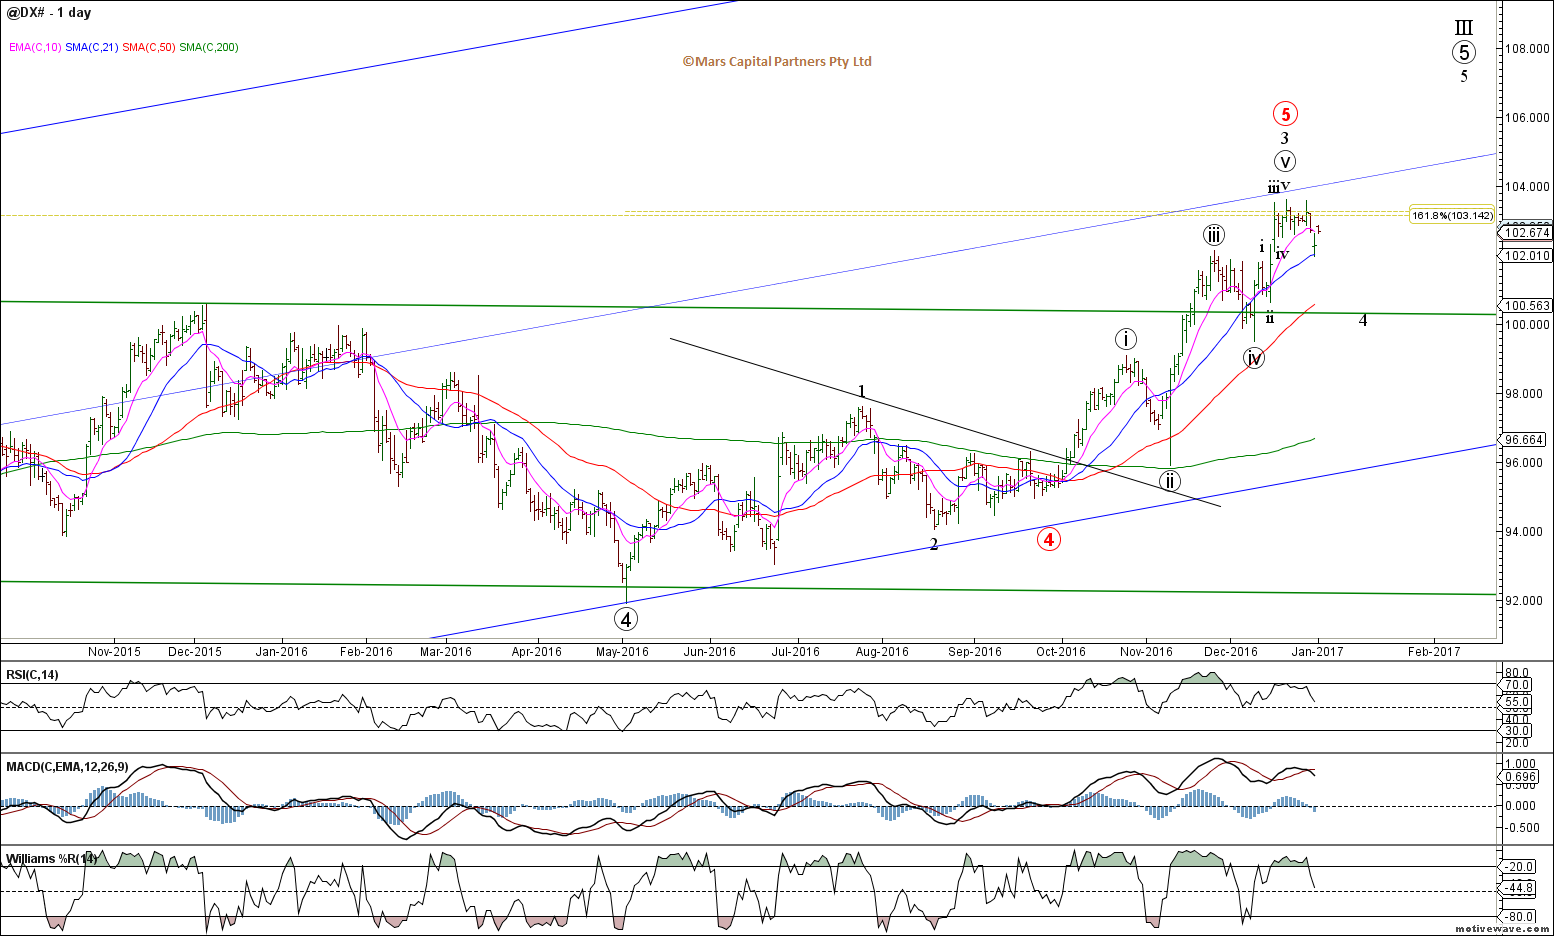
- 2017 saw an impulsive decline in the DXY and rally in the Euro that is nearly complete
– we should now be in the 5th and final wave of this decline
– therefore we should expect a bullish turn in the US$ in early 2018
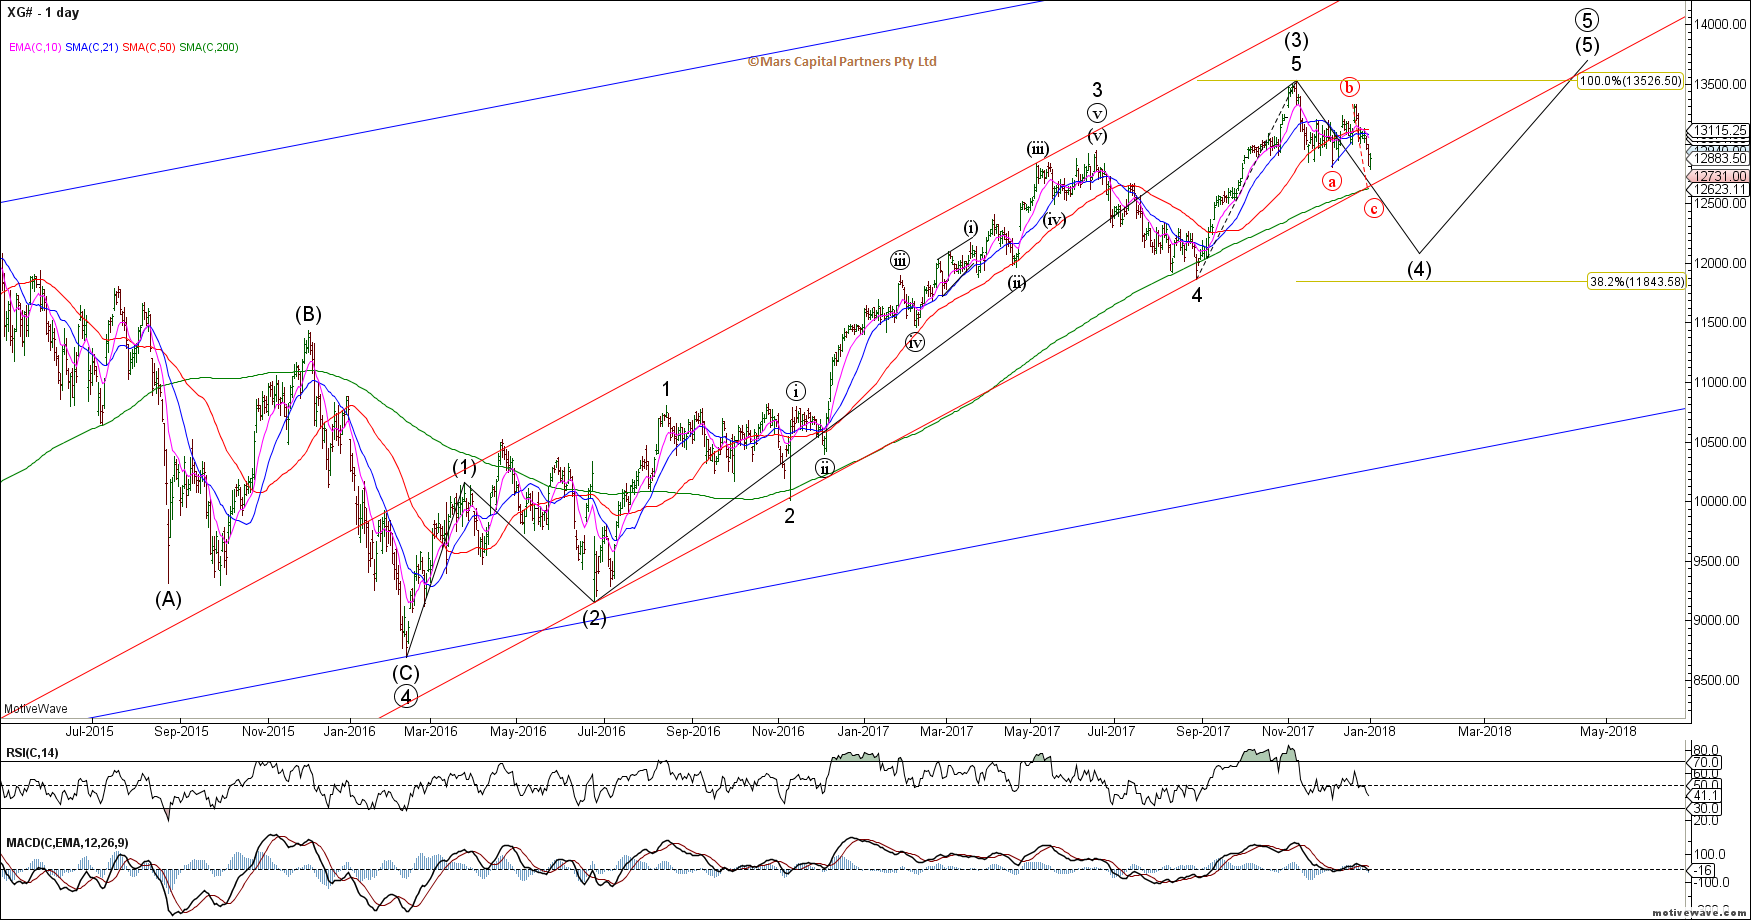
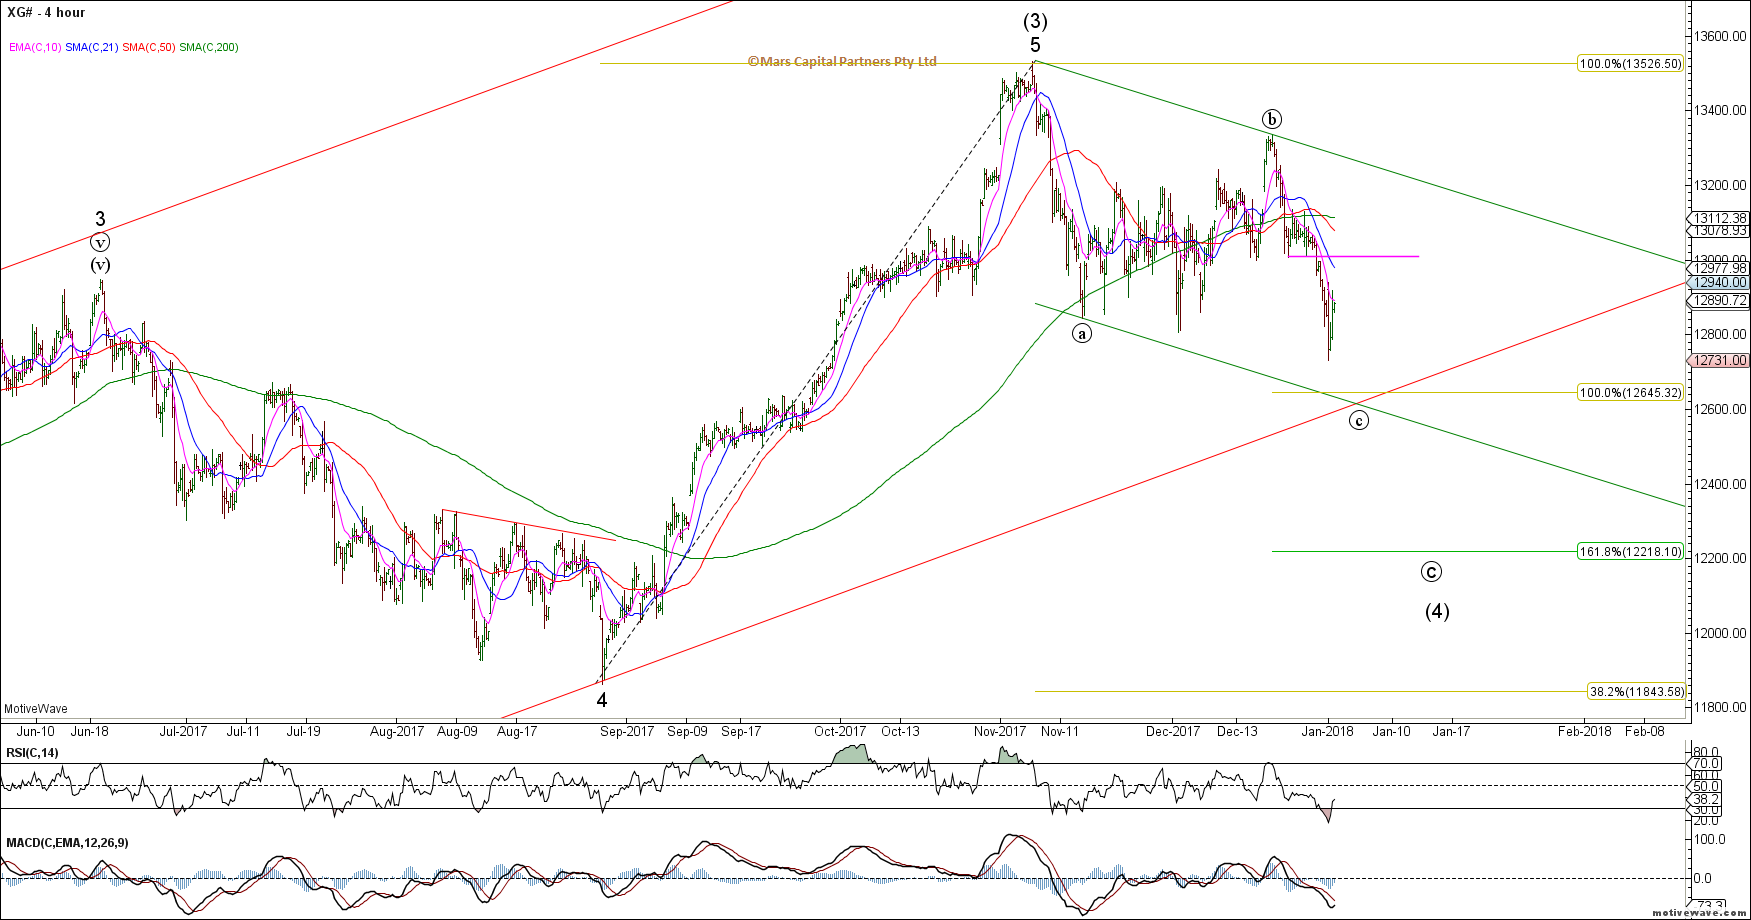
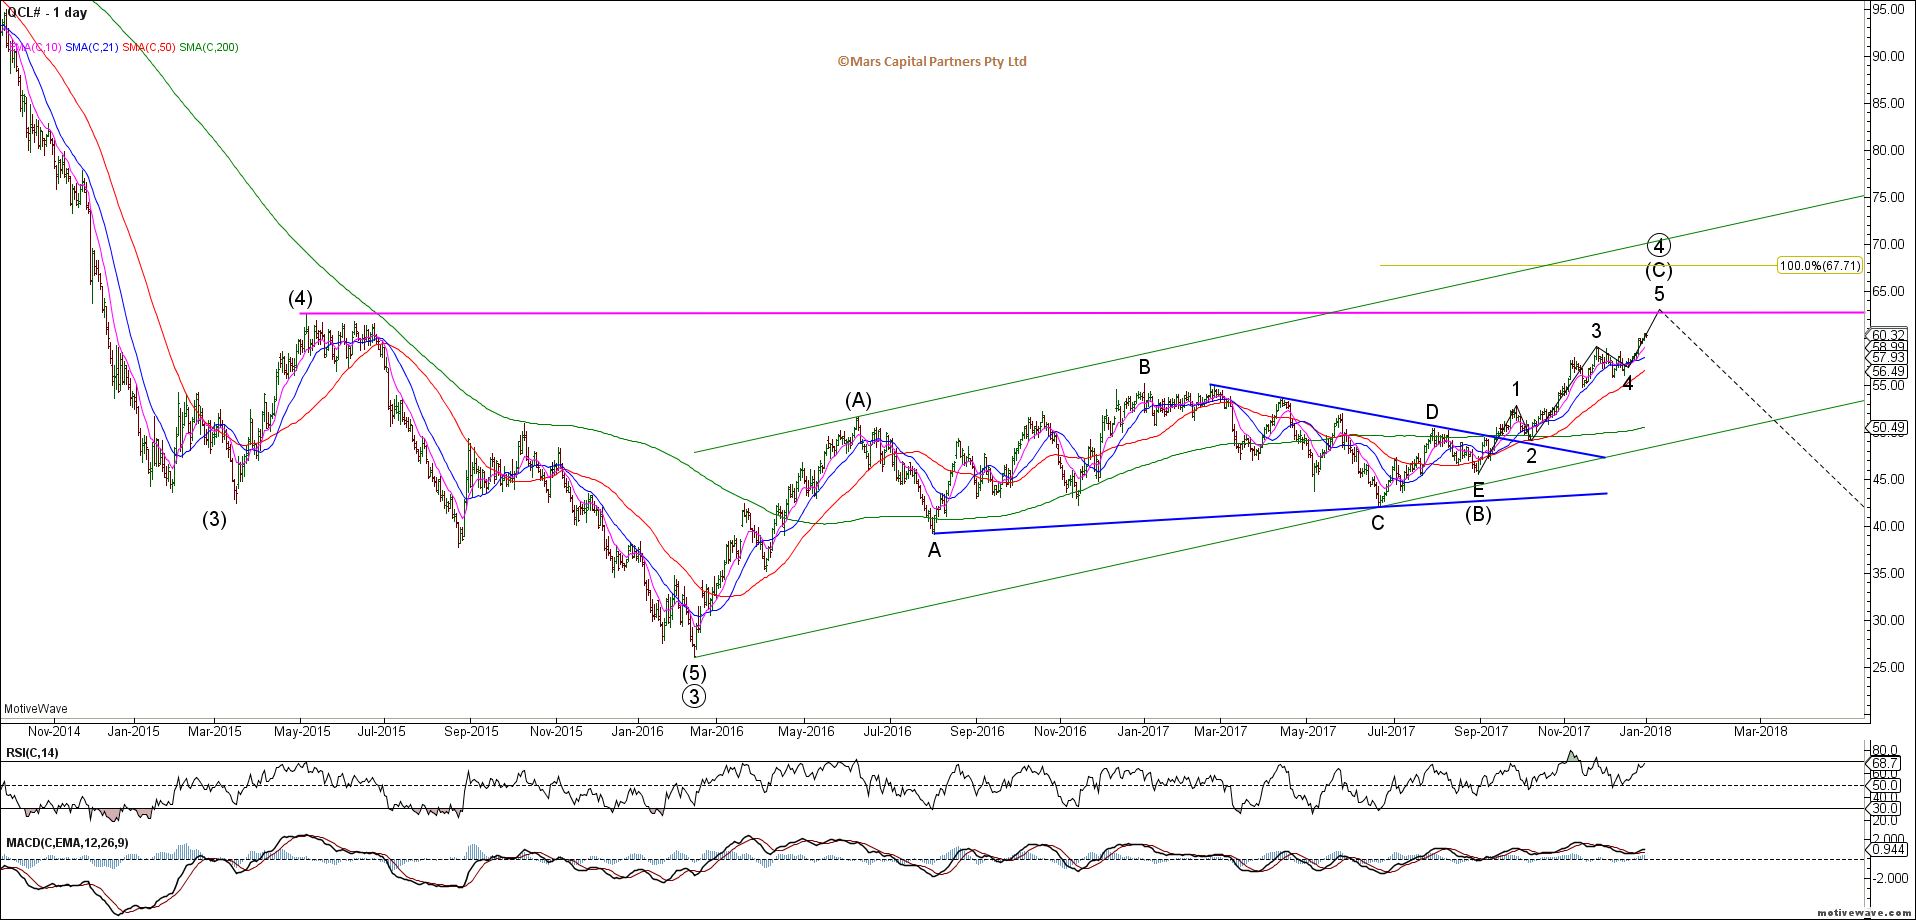
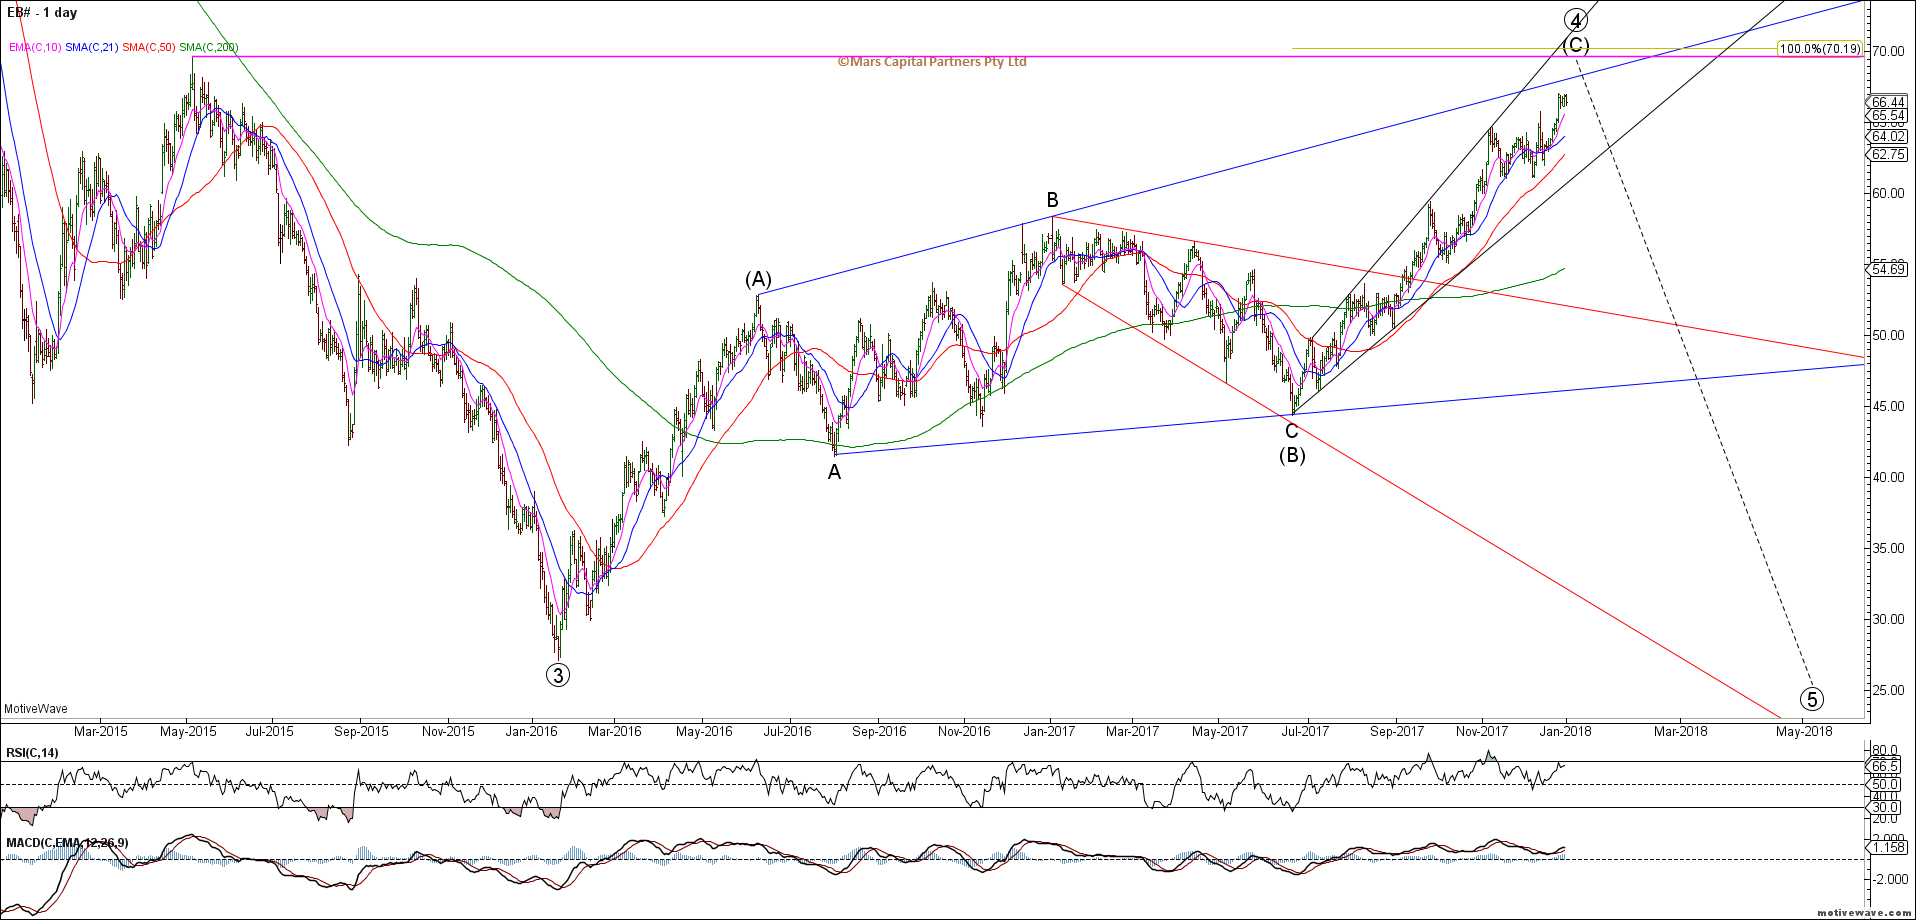
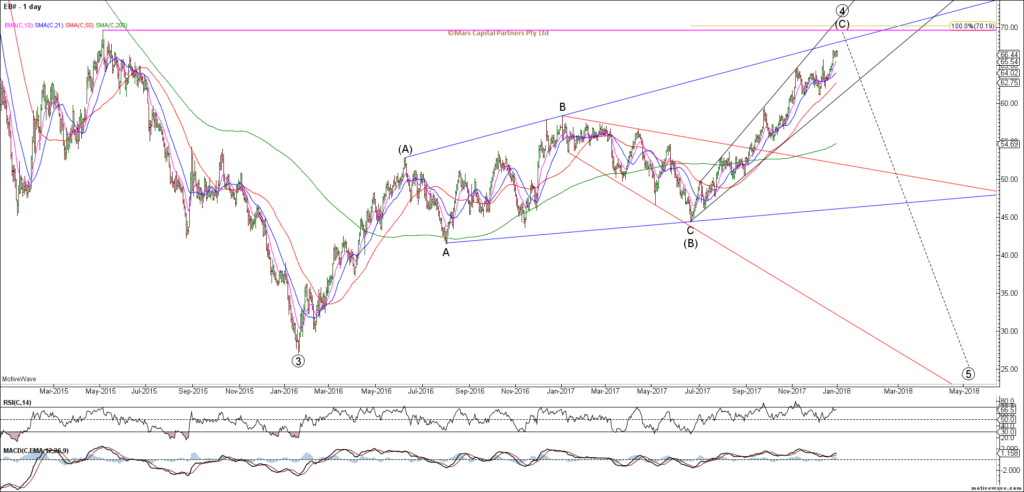
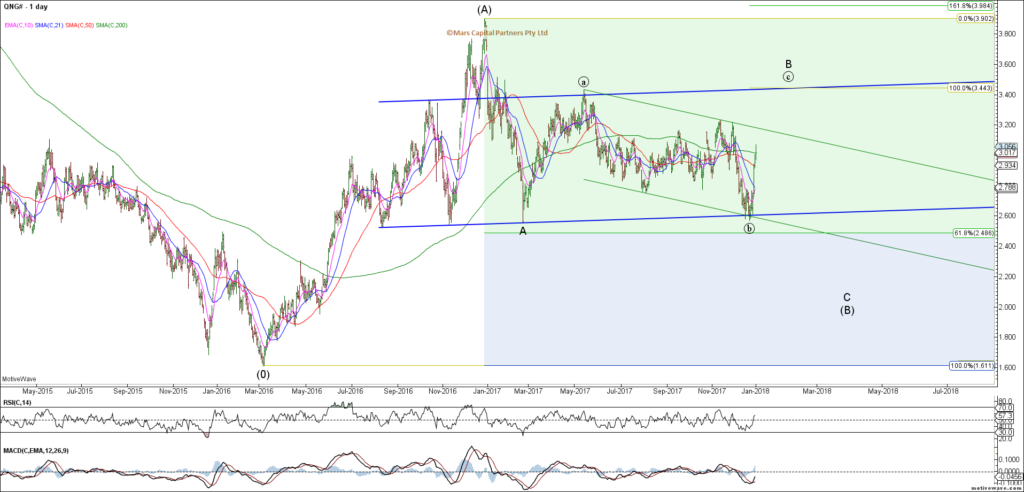
- Crude Oil should be completing its wave 4 corrective rally that began in February 2016
– looking for a bearish turn in CL to ultimately take out the 2016 cycle lows
– this will likely catch the most crowded trade wrong footed and coincide with a stronger US$
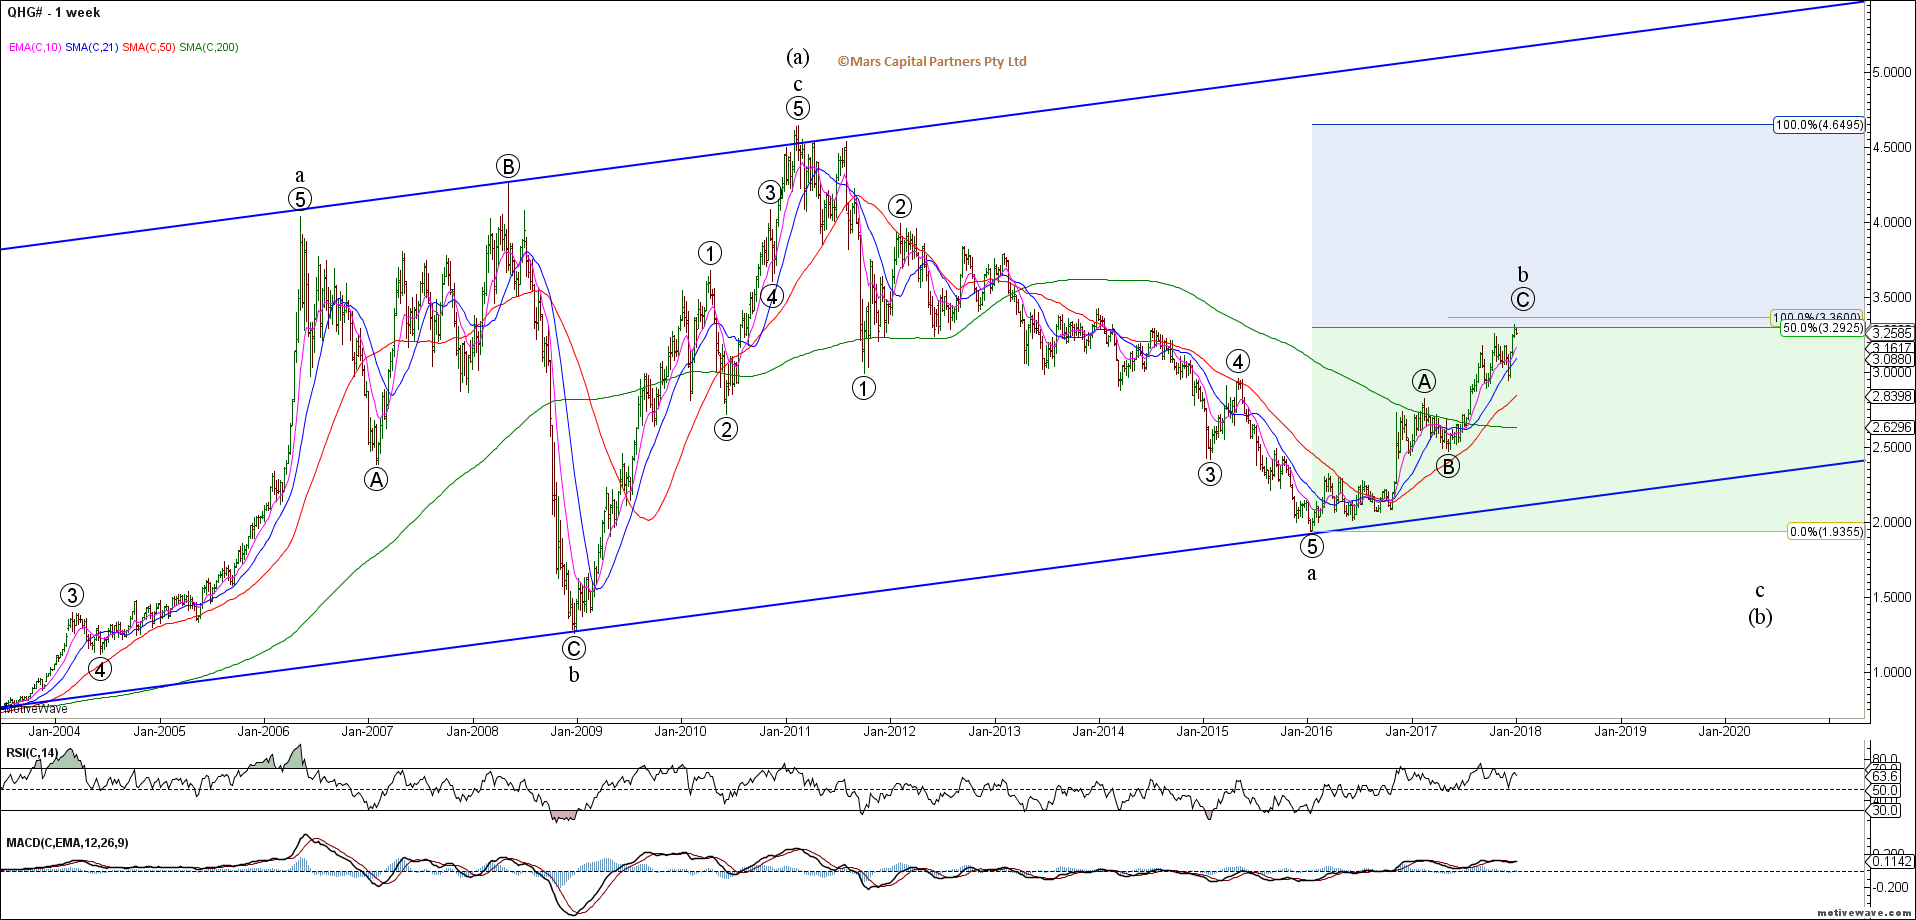
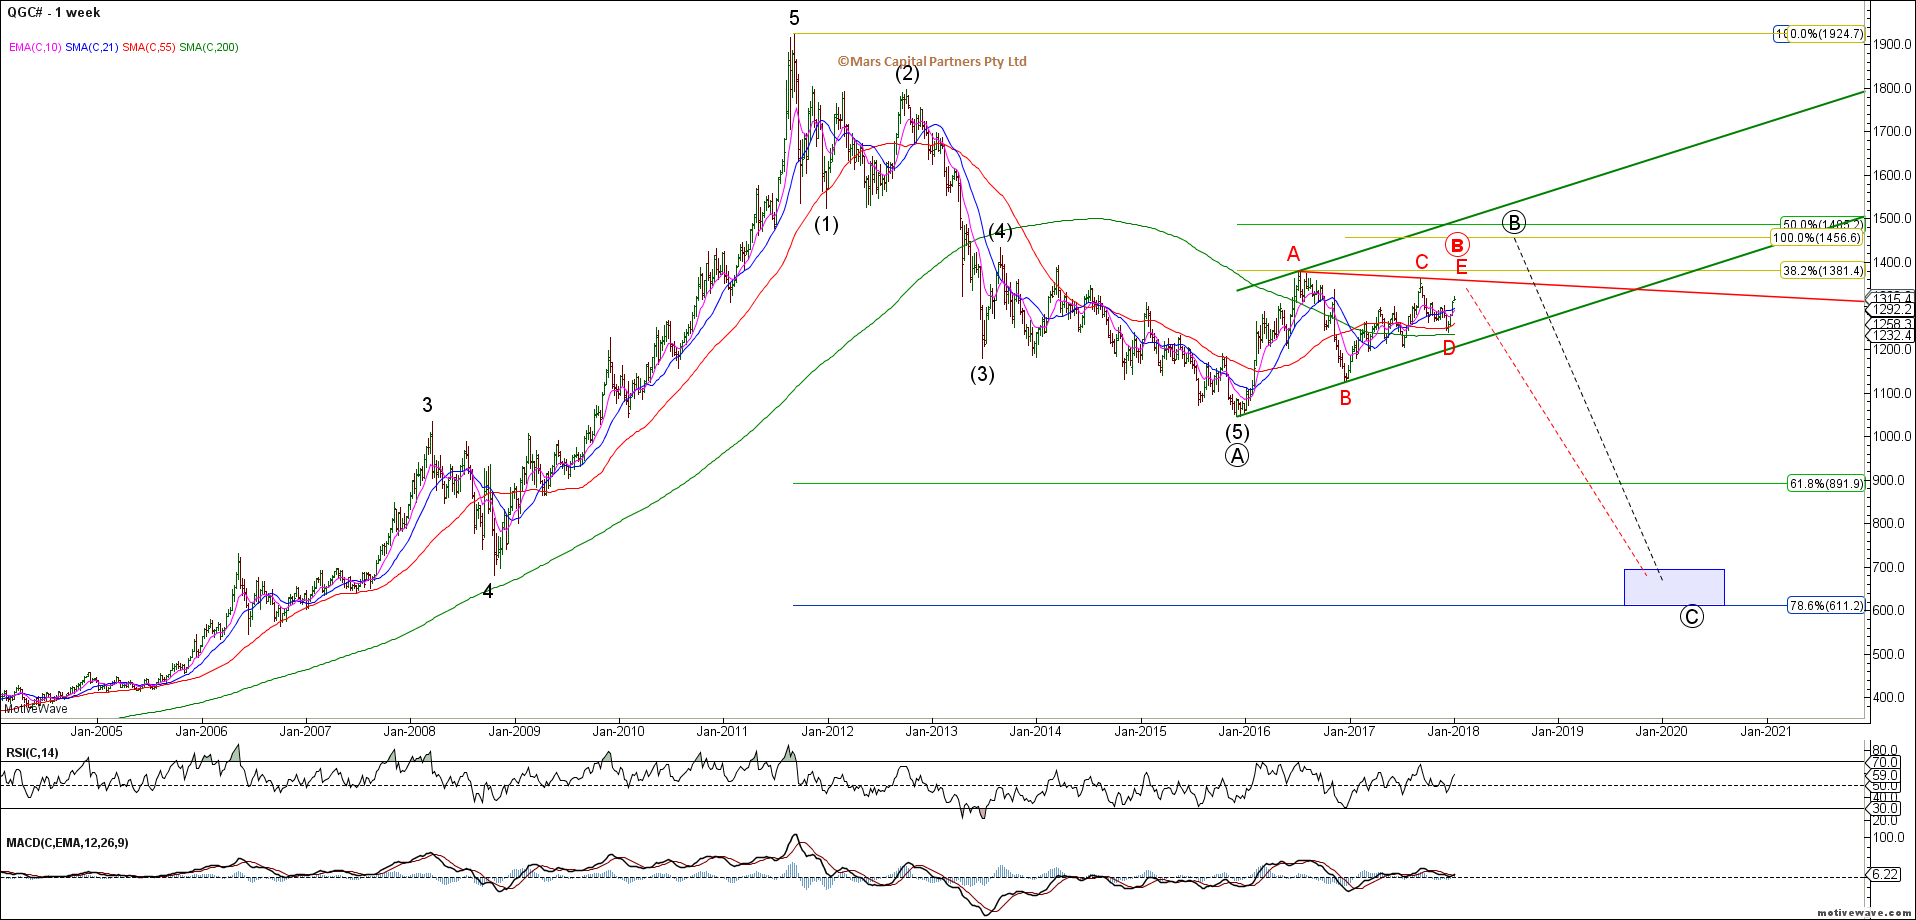
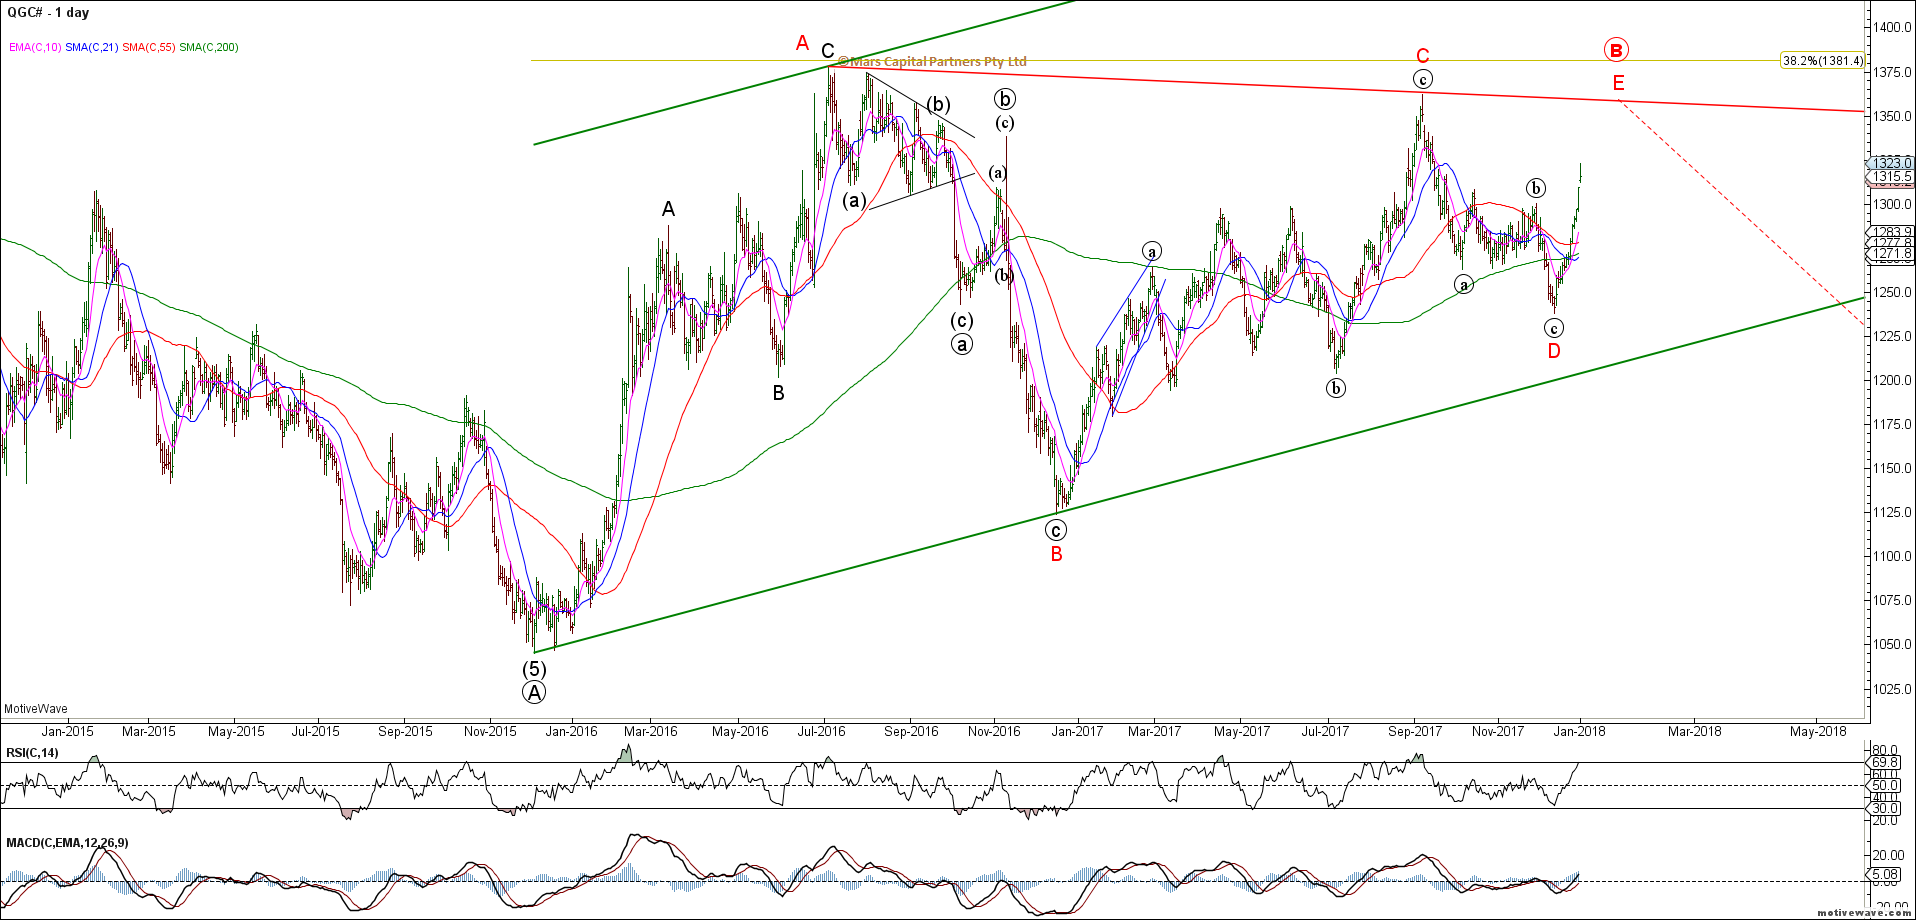
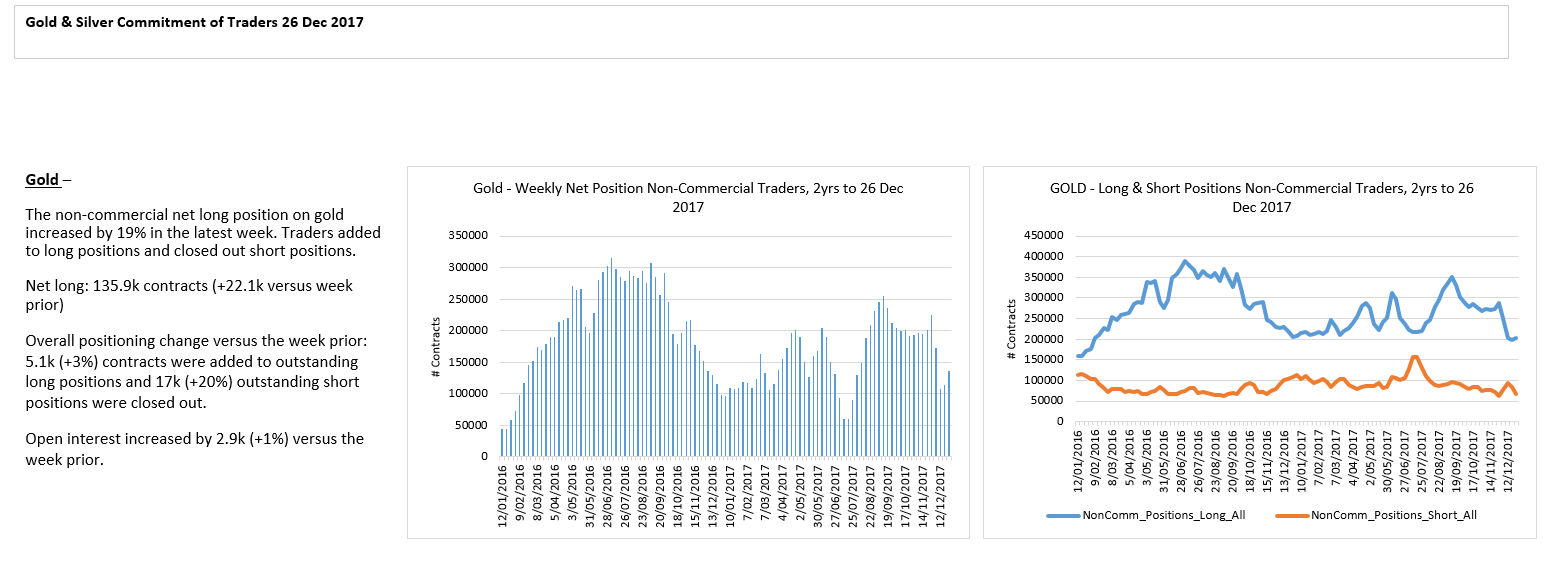
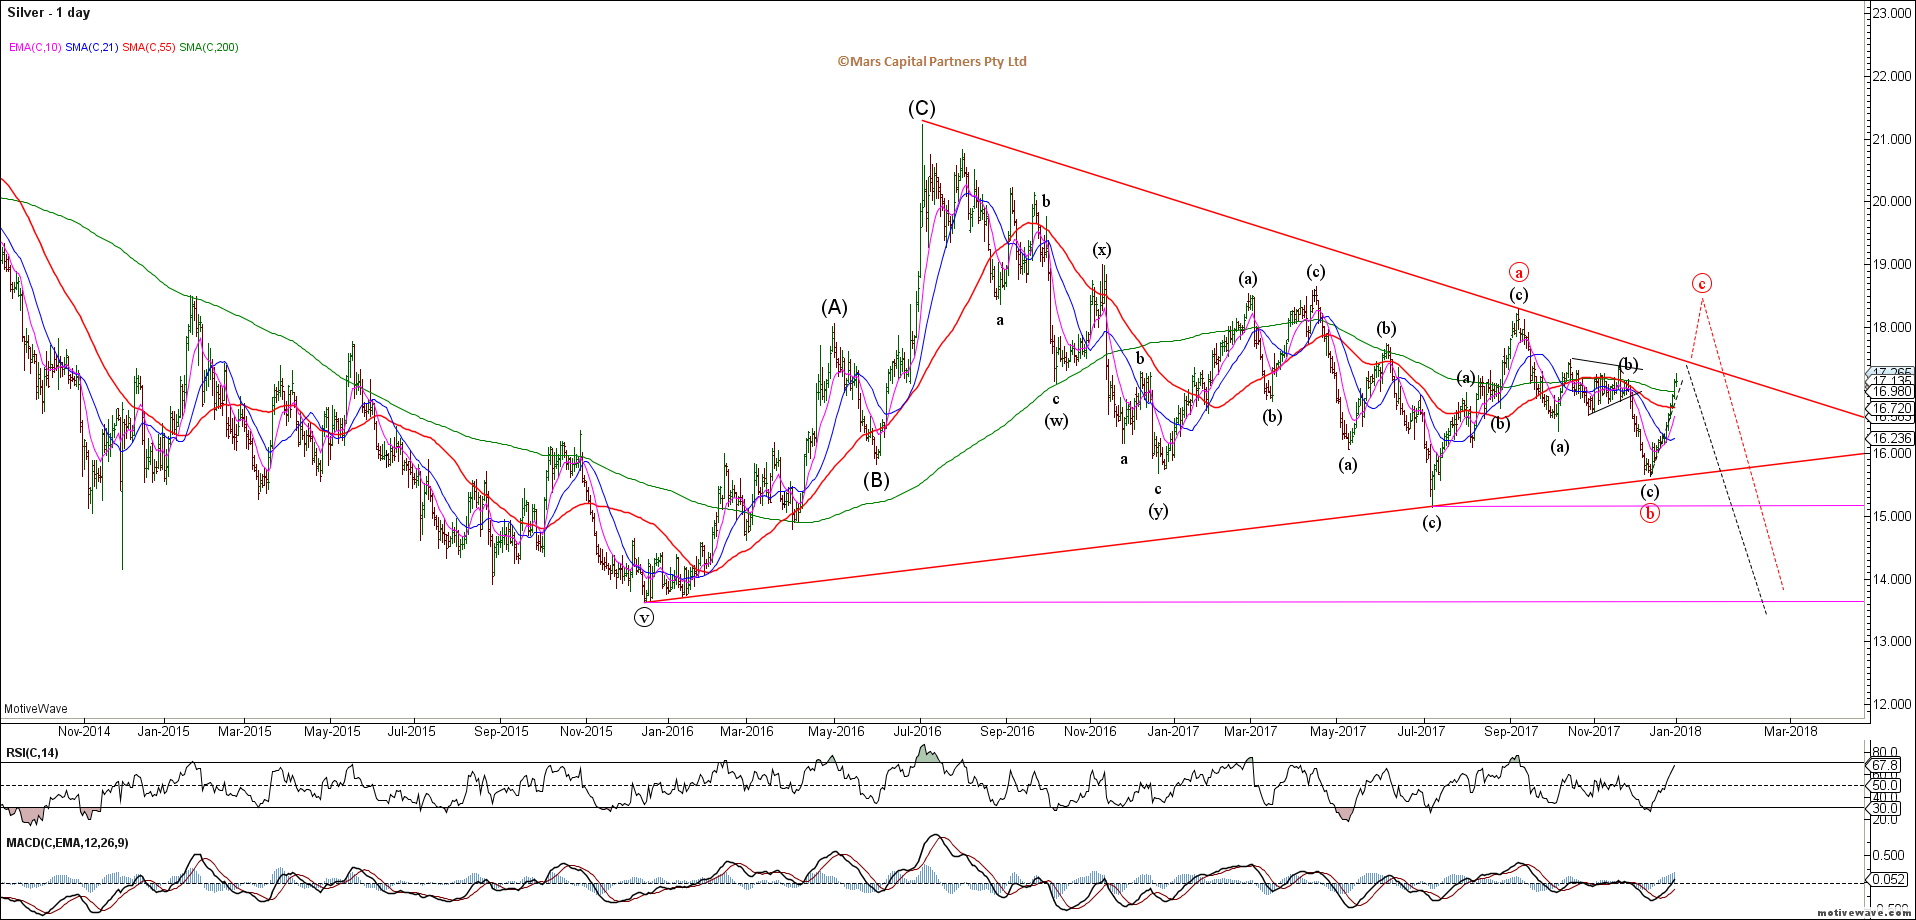
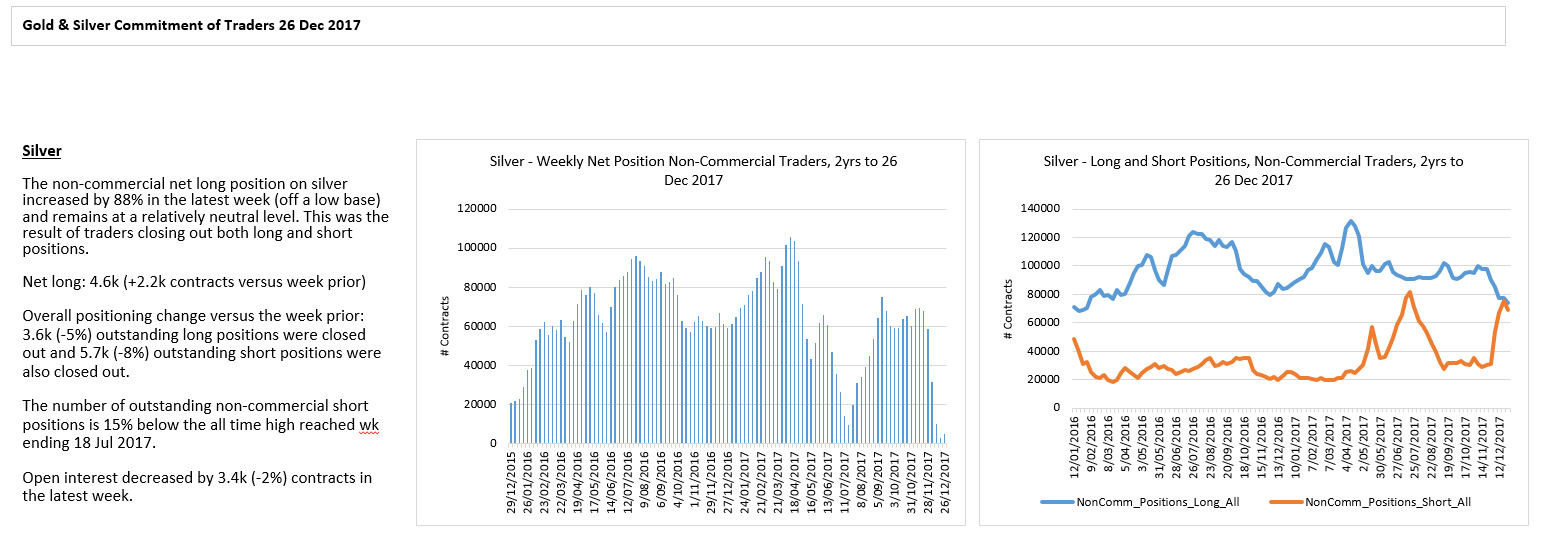
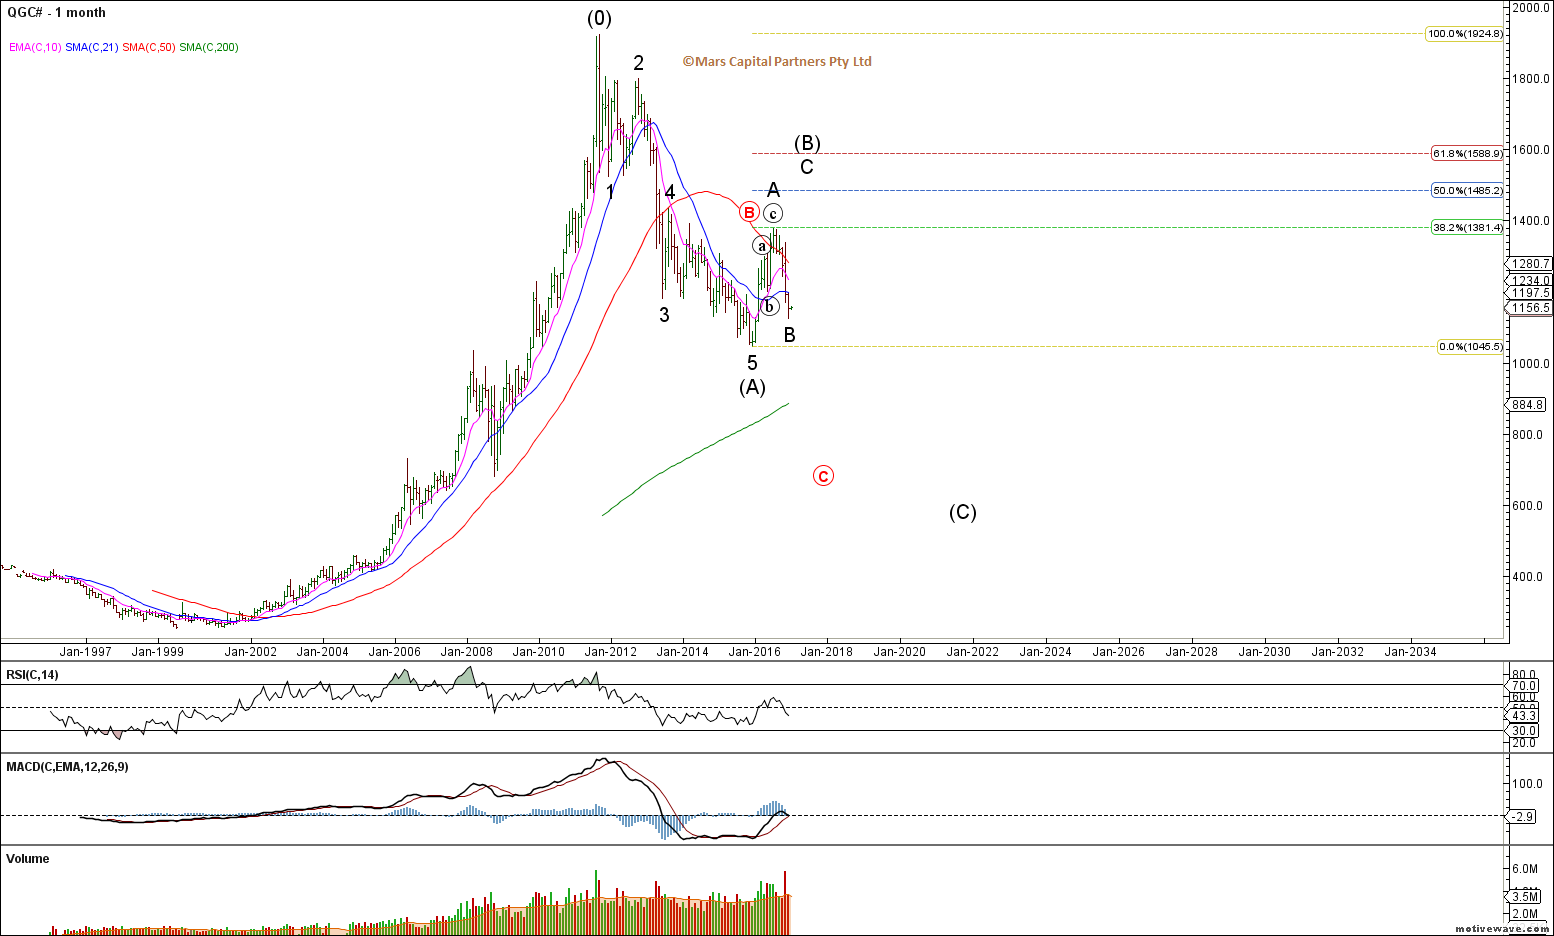
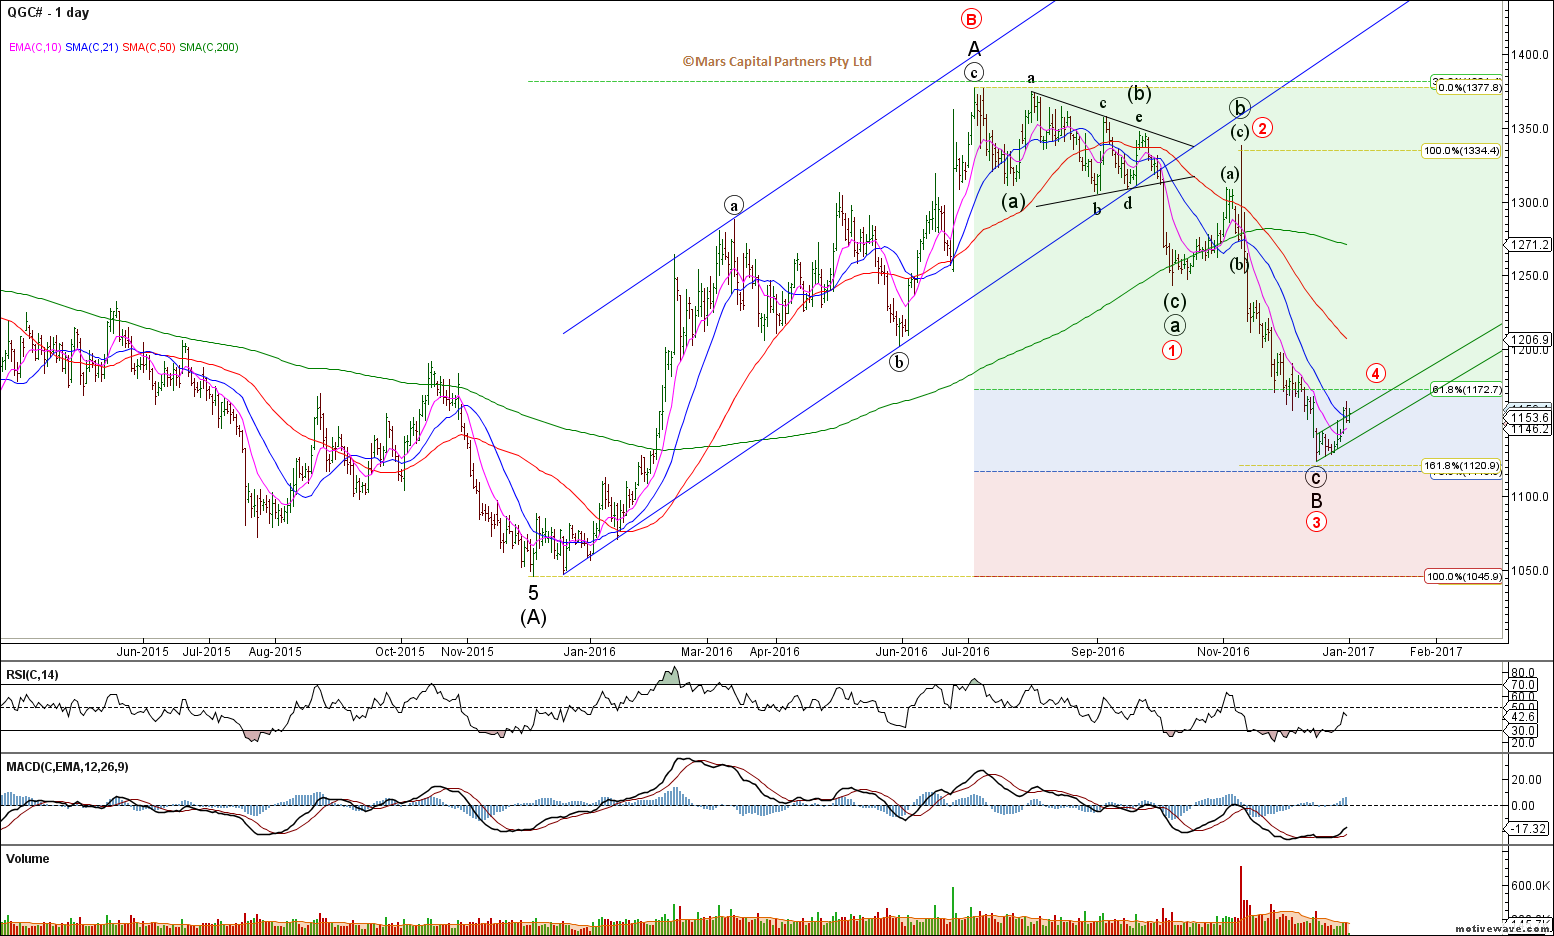
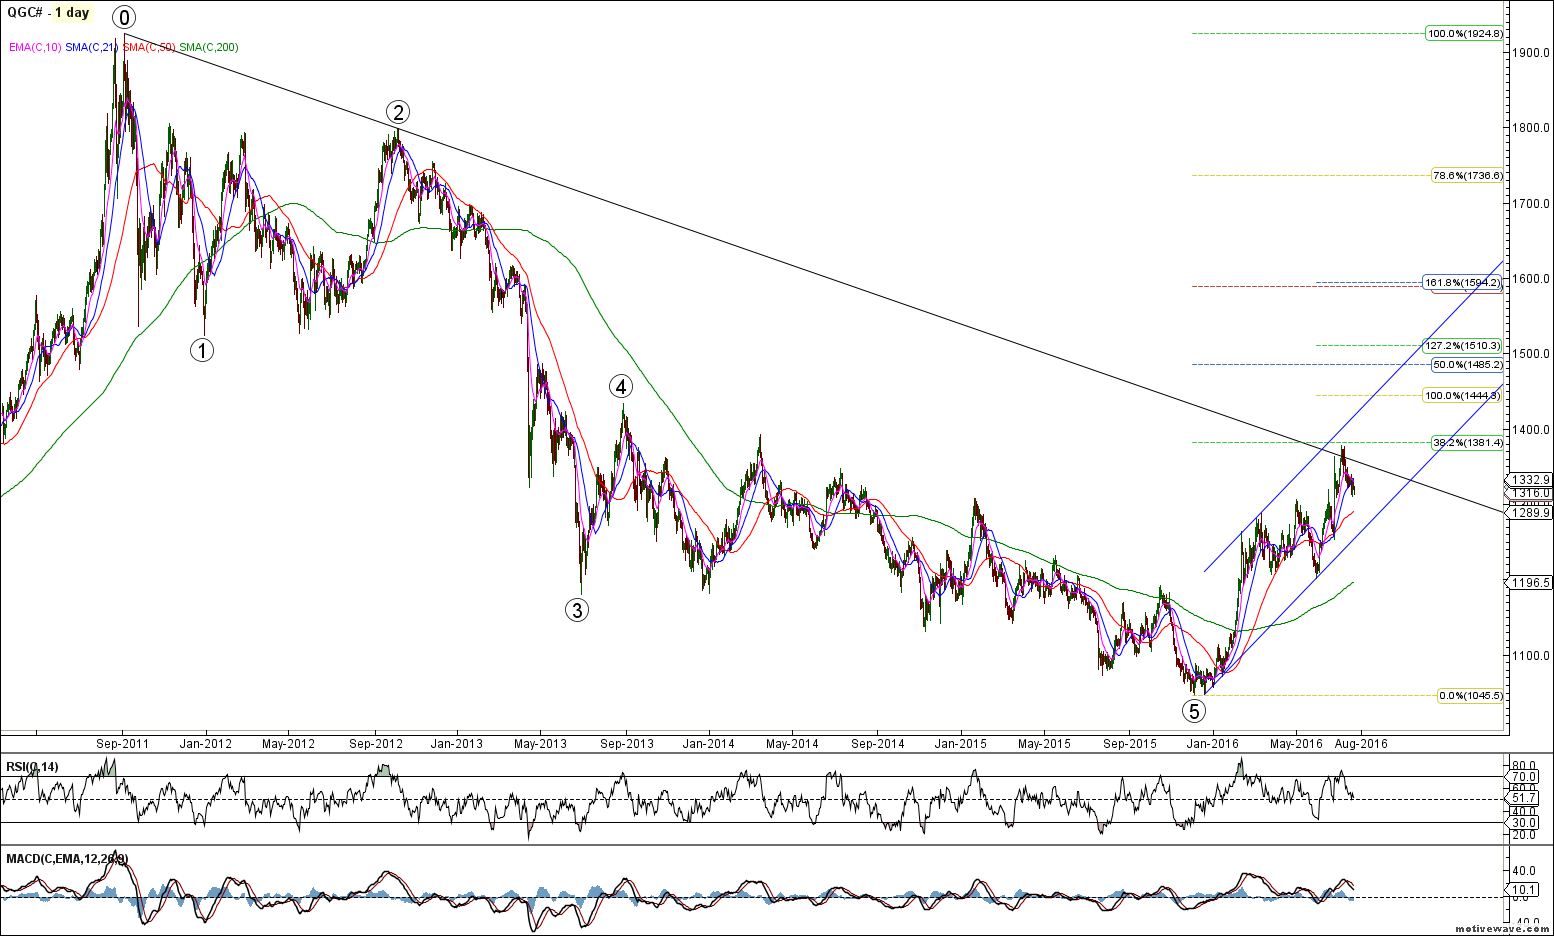
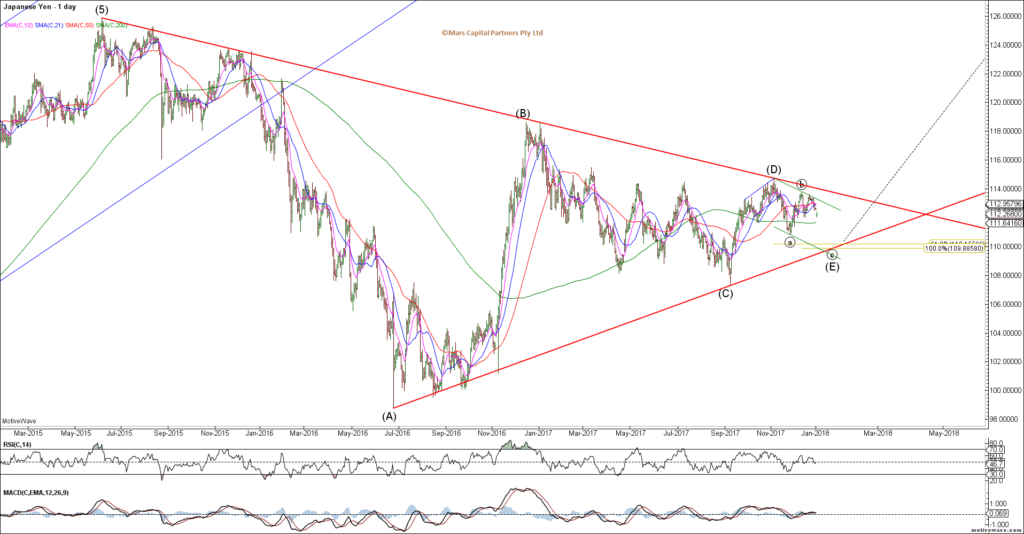
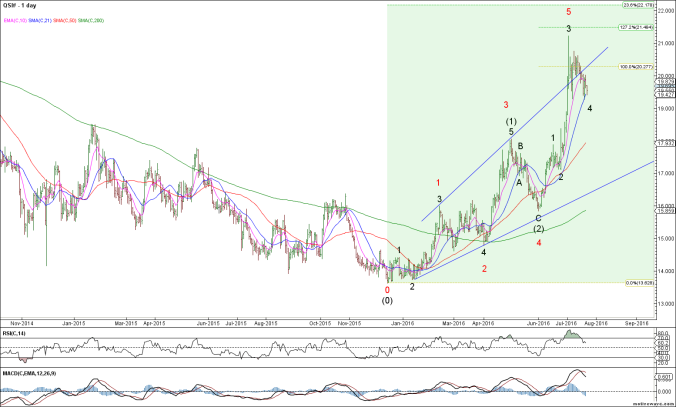
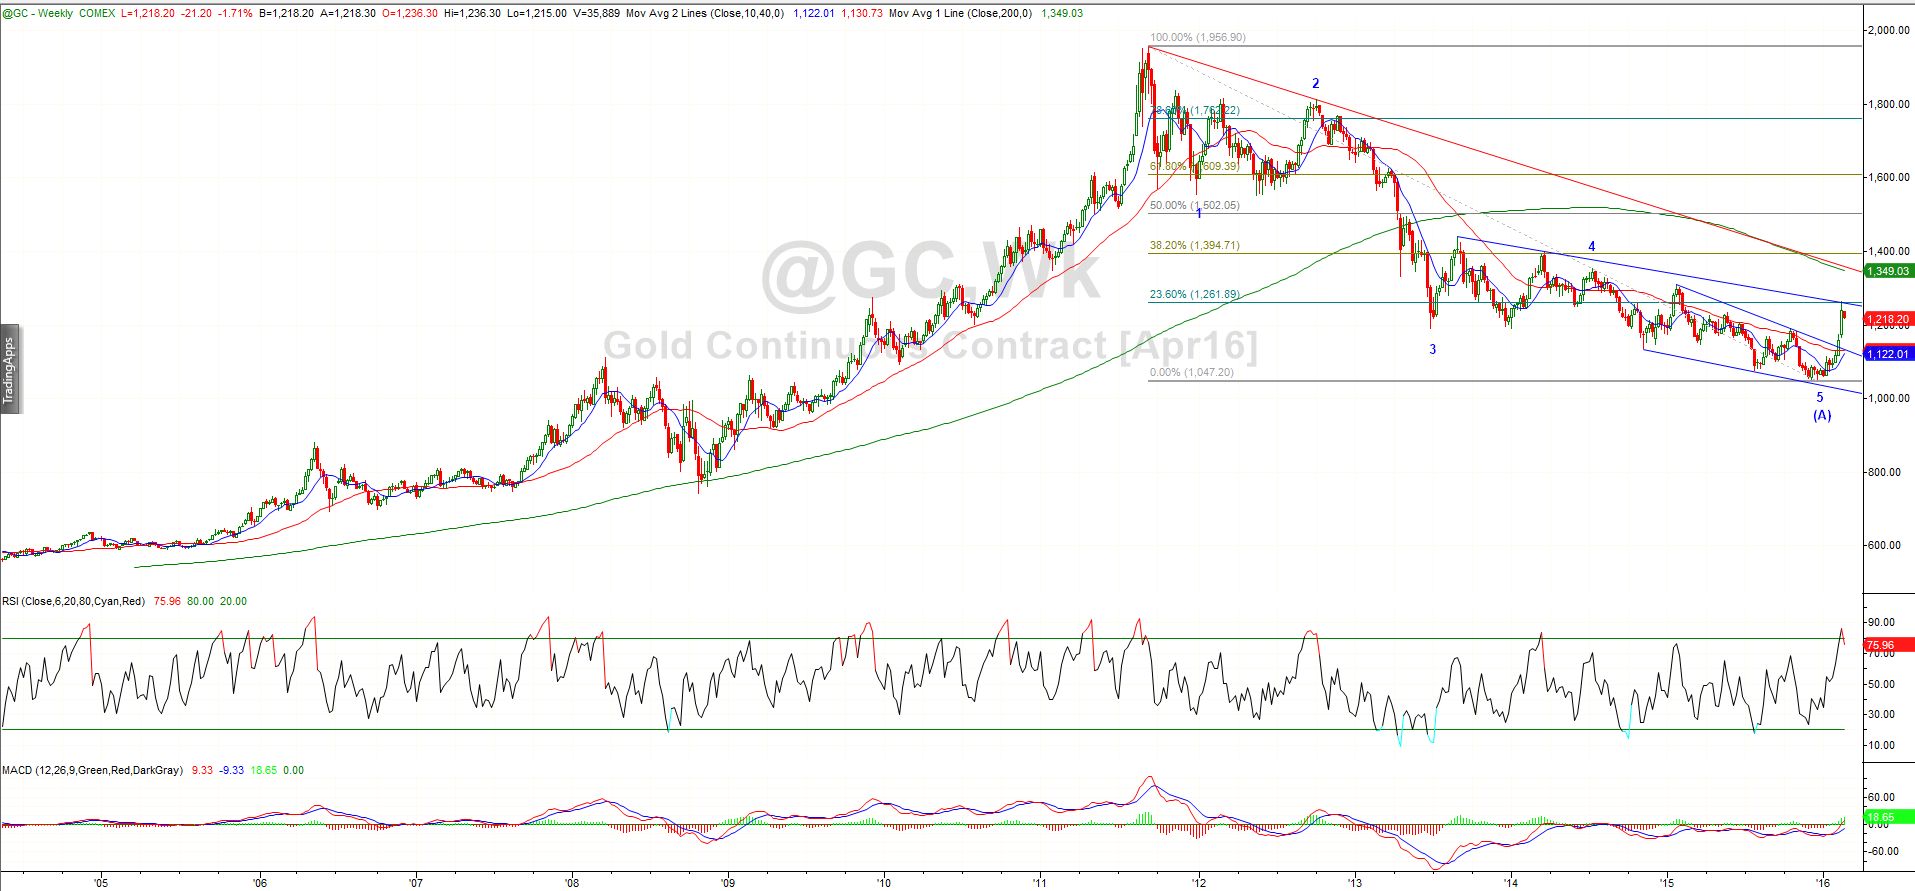
- Gold and Silver are ending multi-year wave (B) triangles that should terminate very early 2018
– bearish PM’s thereafter as we target Gold at $700
- Expect Commodities and US$ to turn together
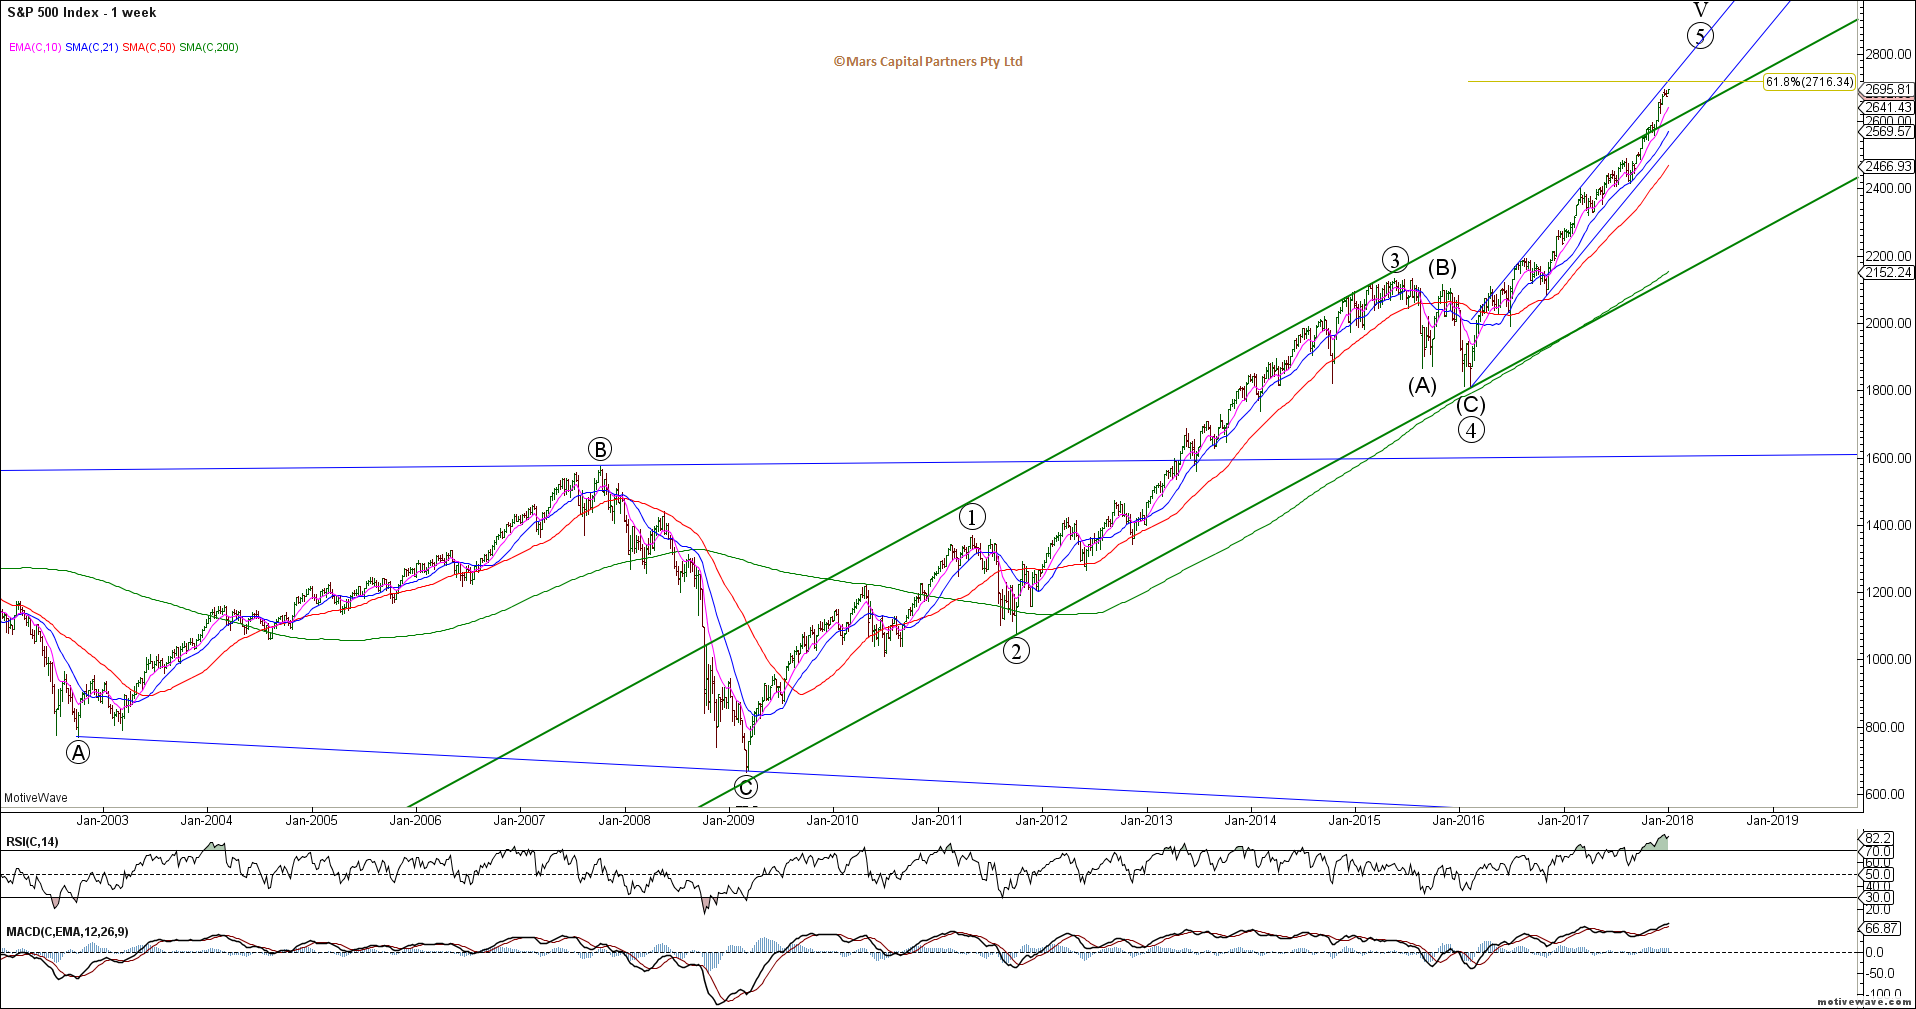
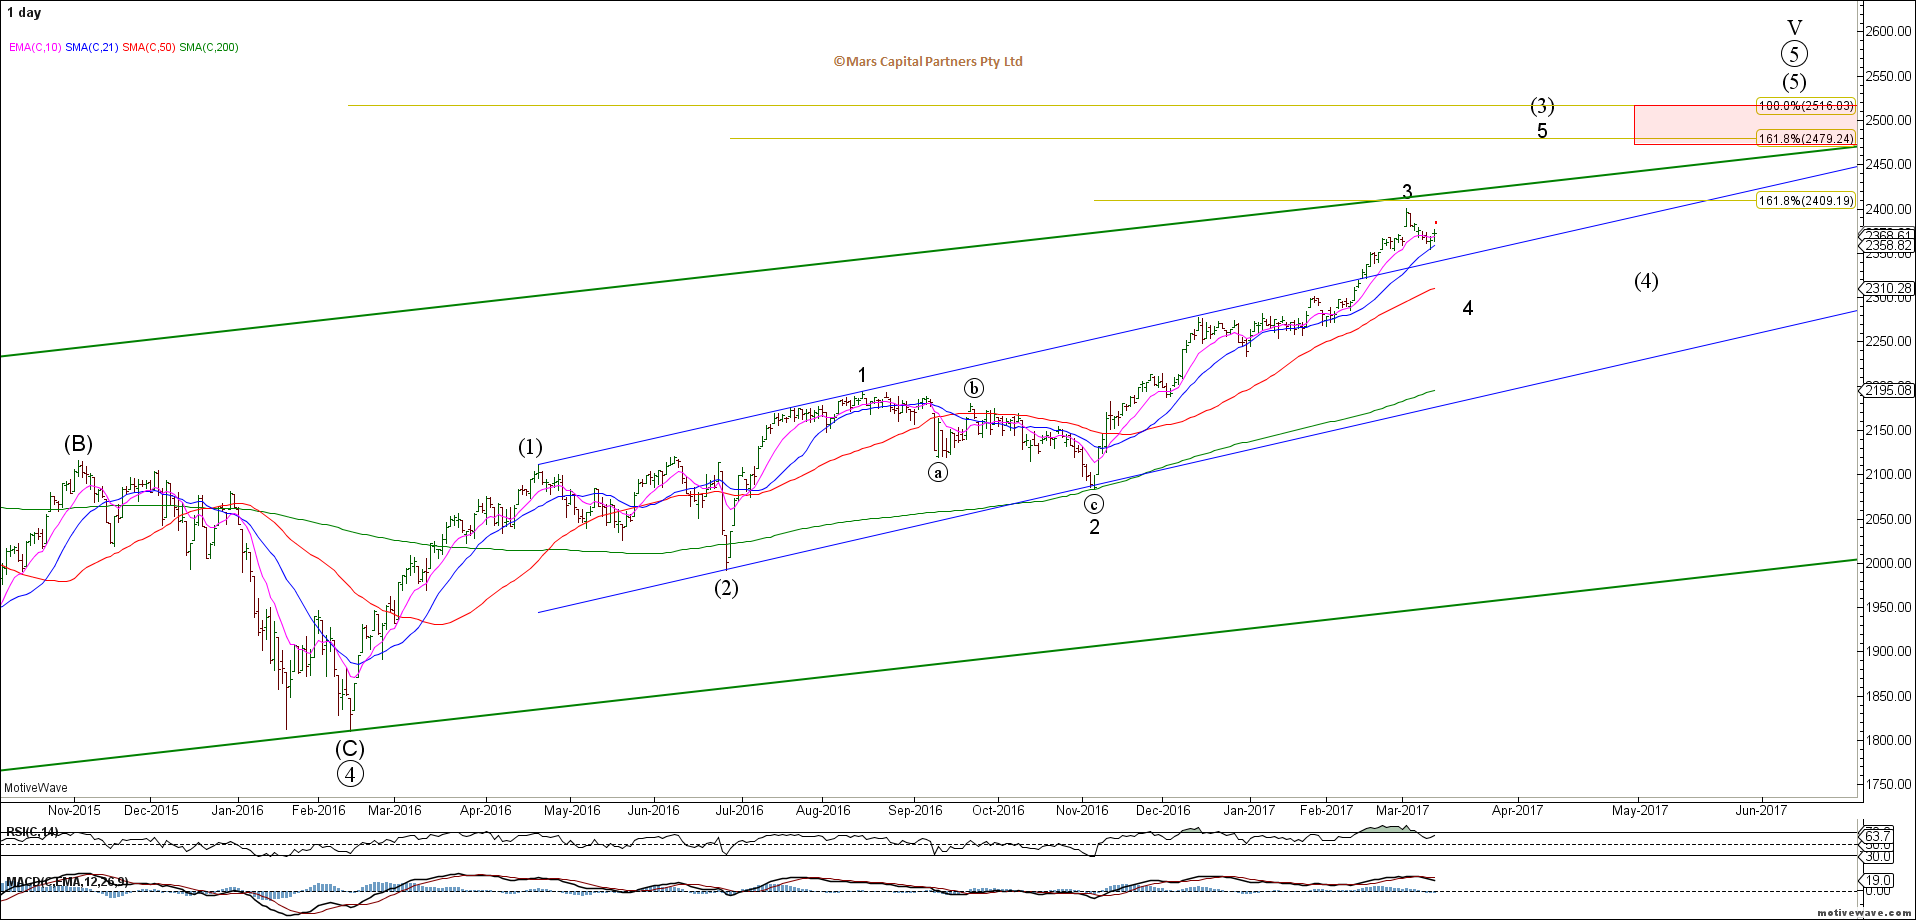
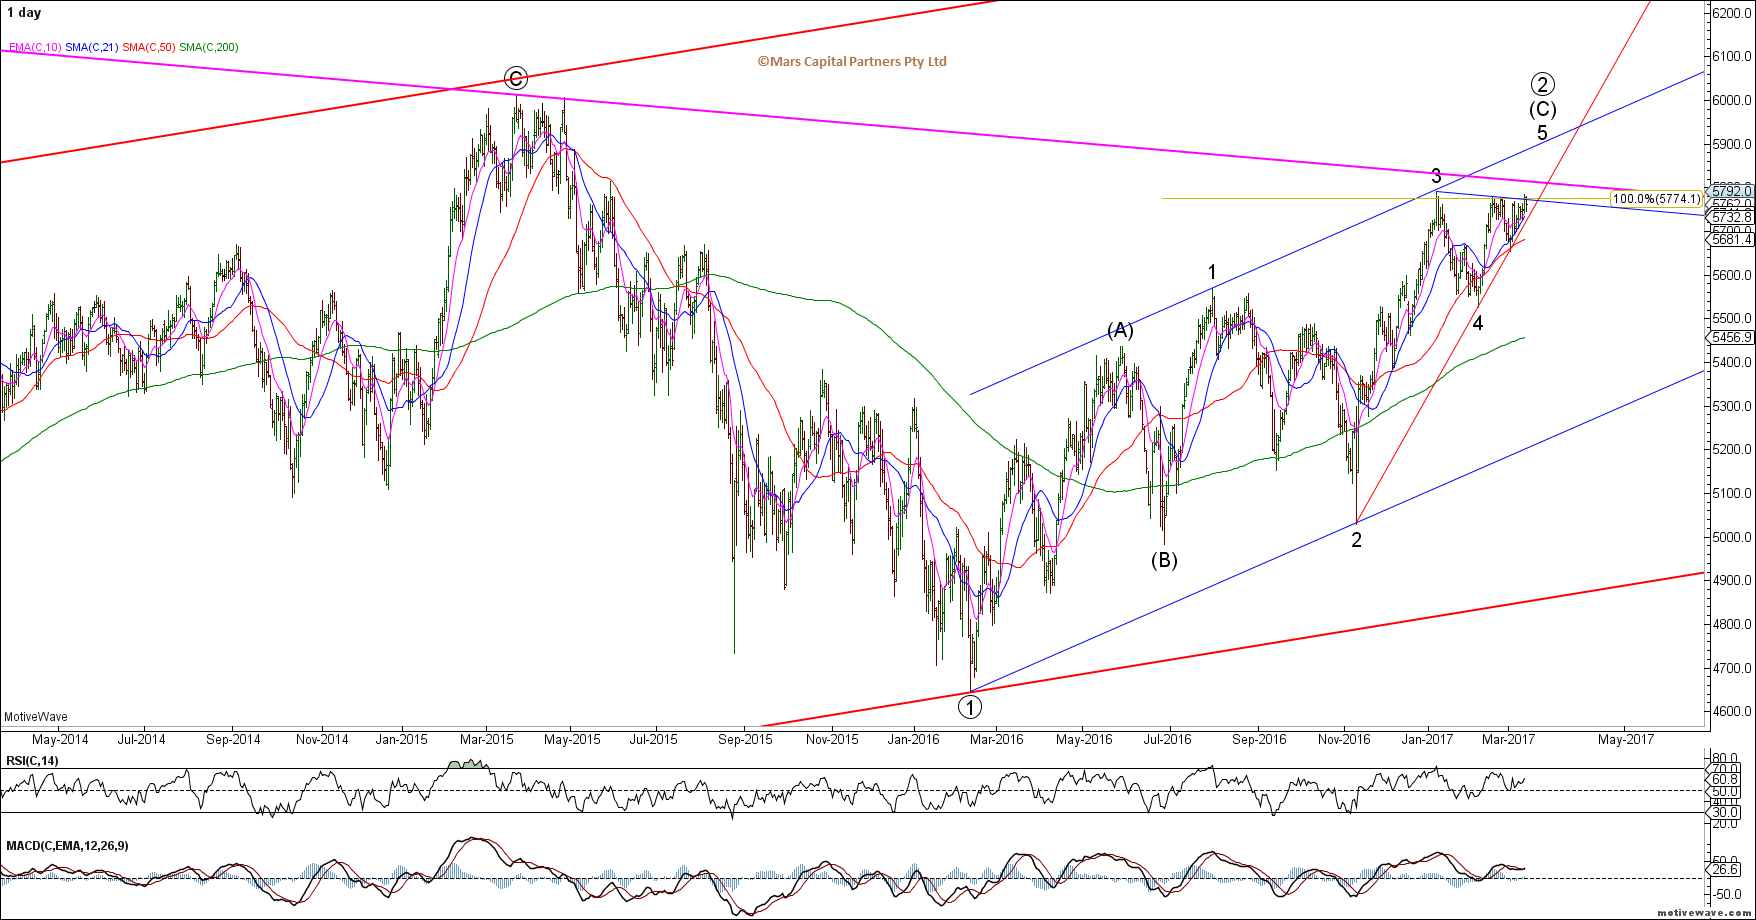
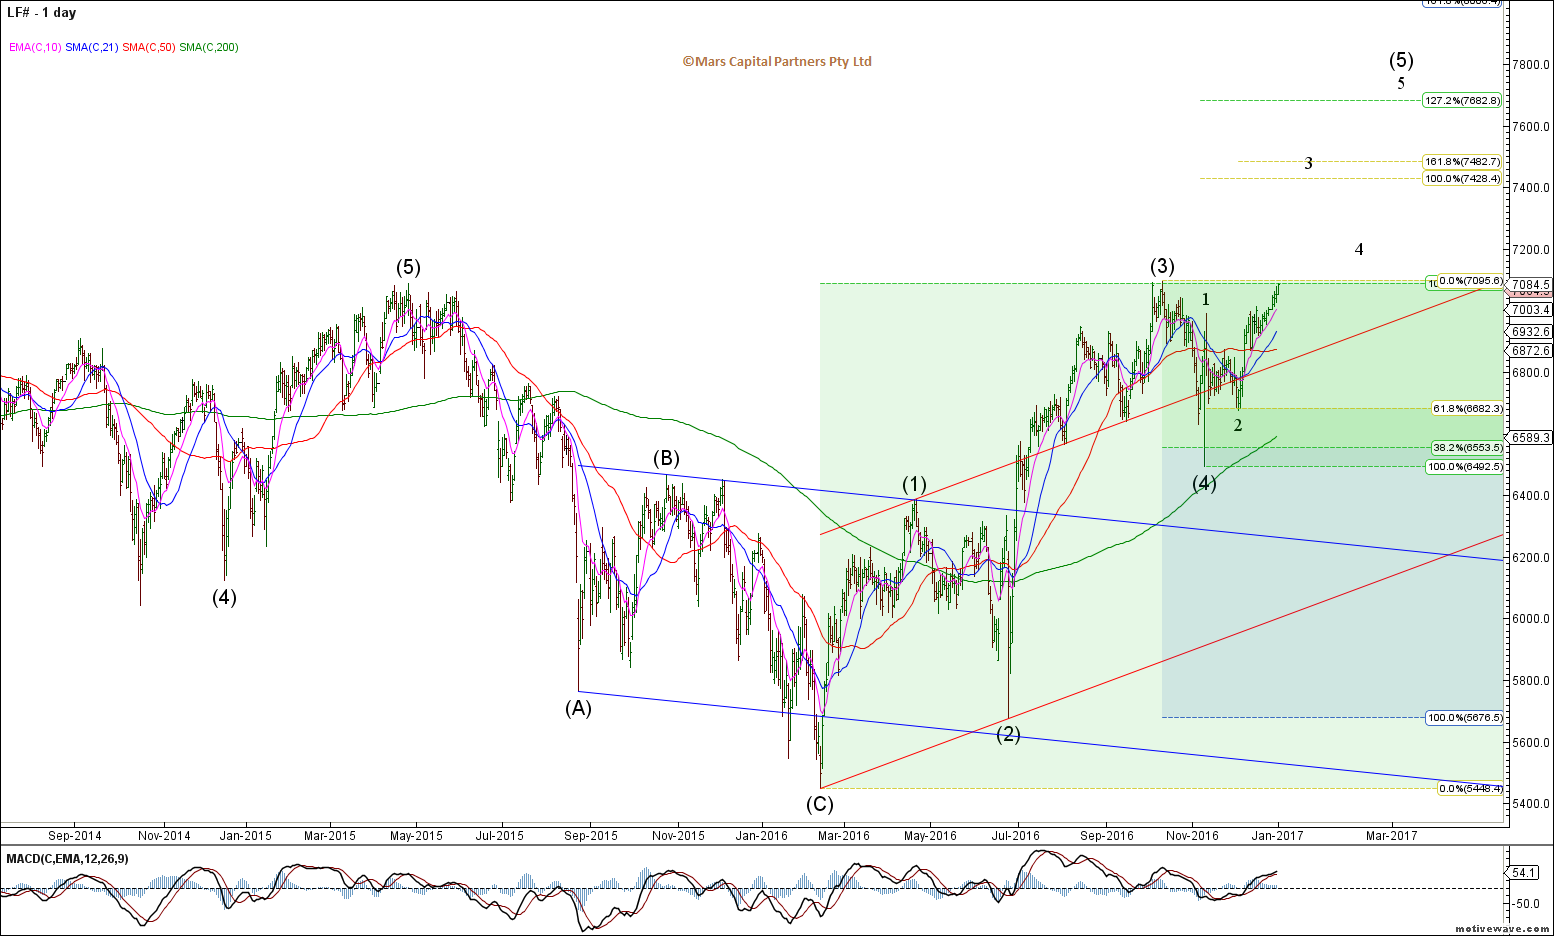
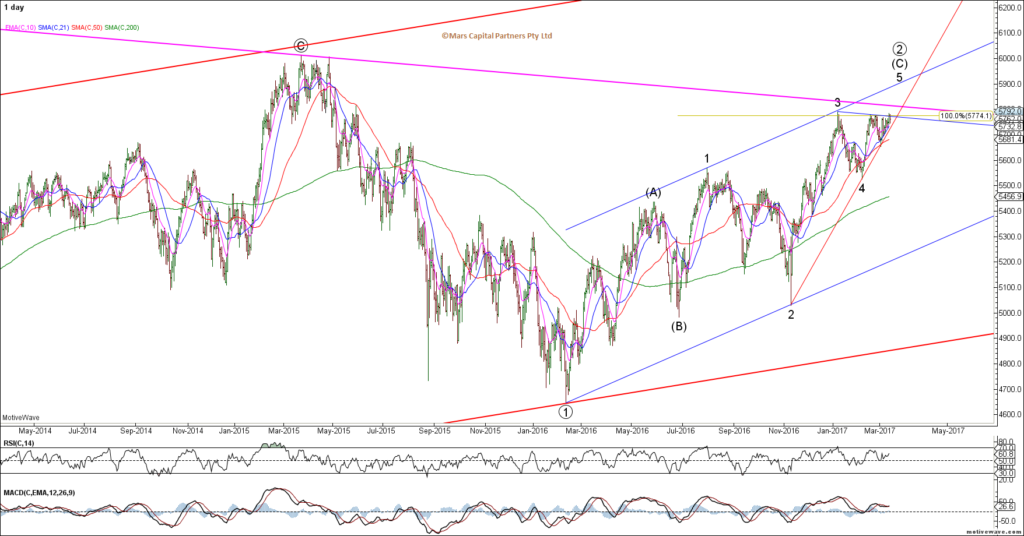
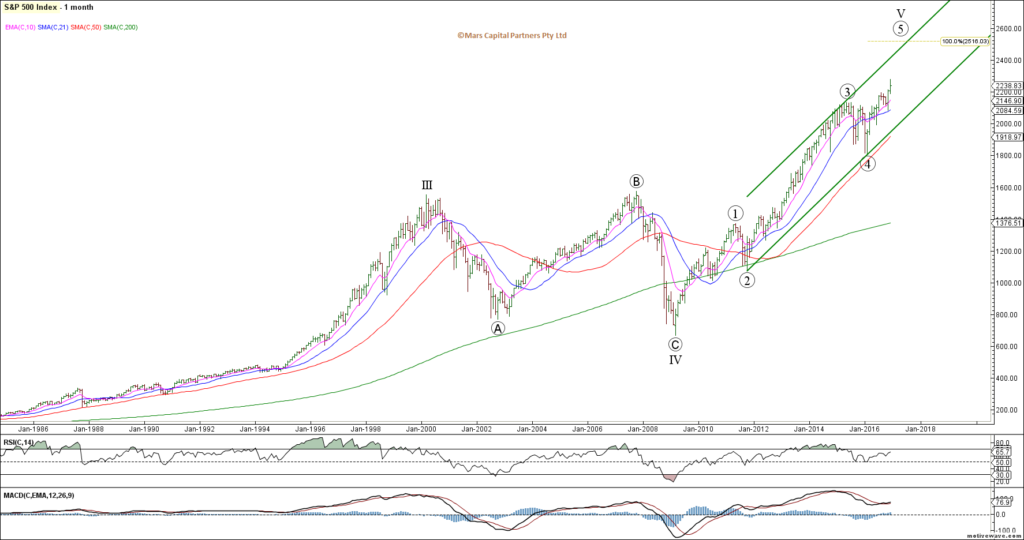
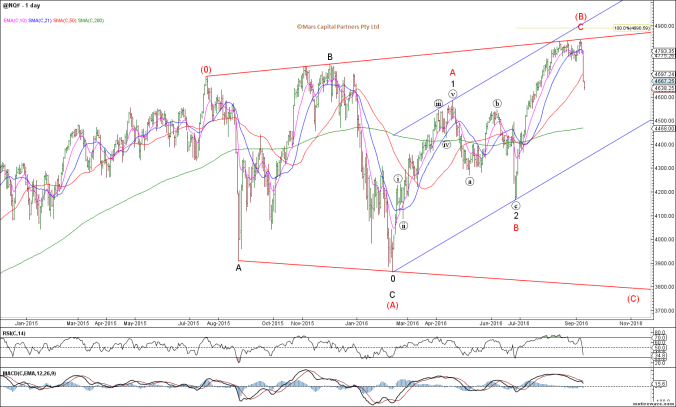
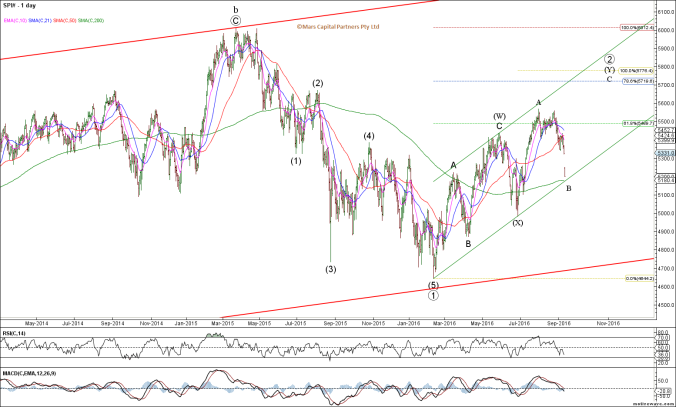
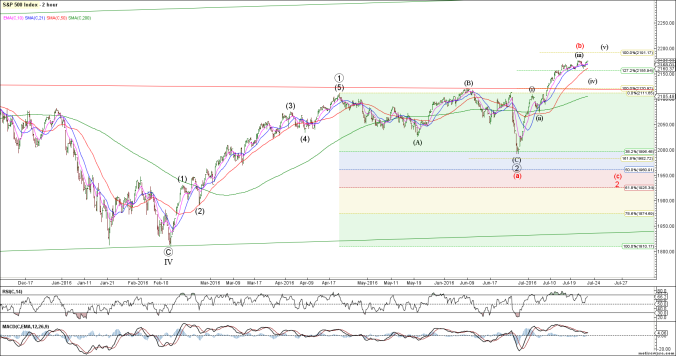
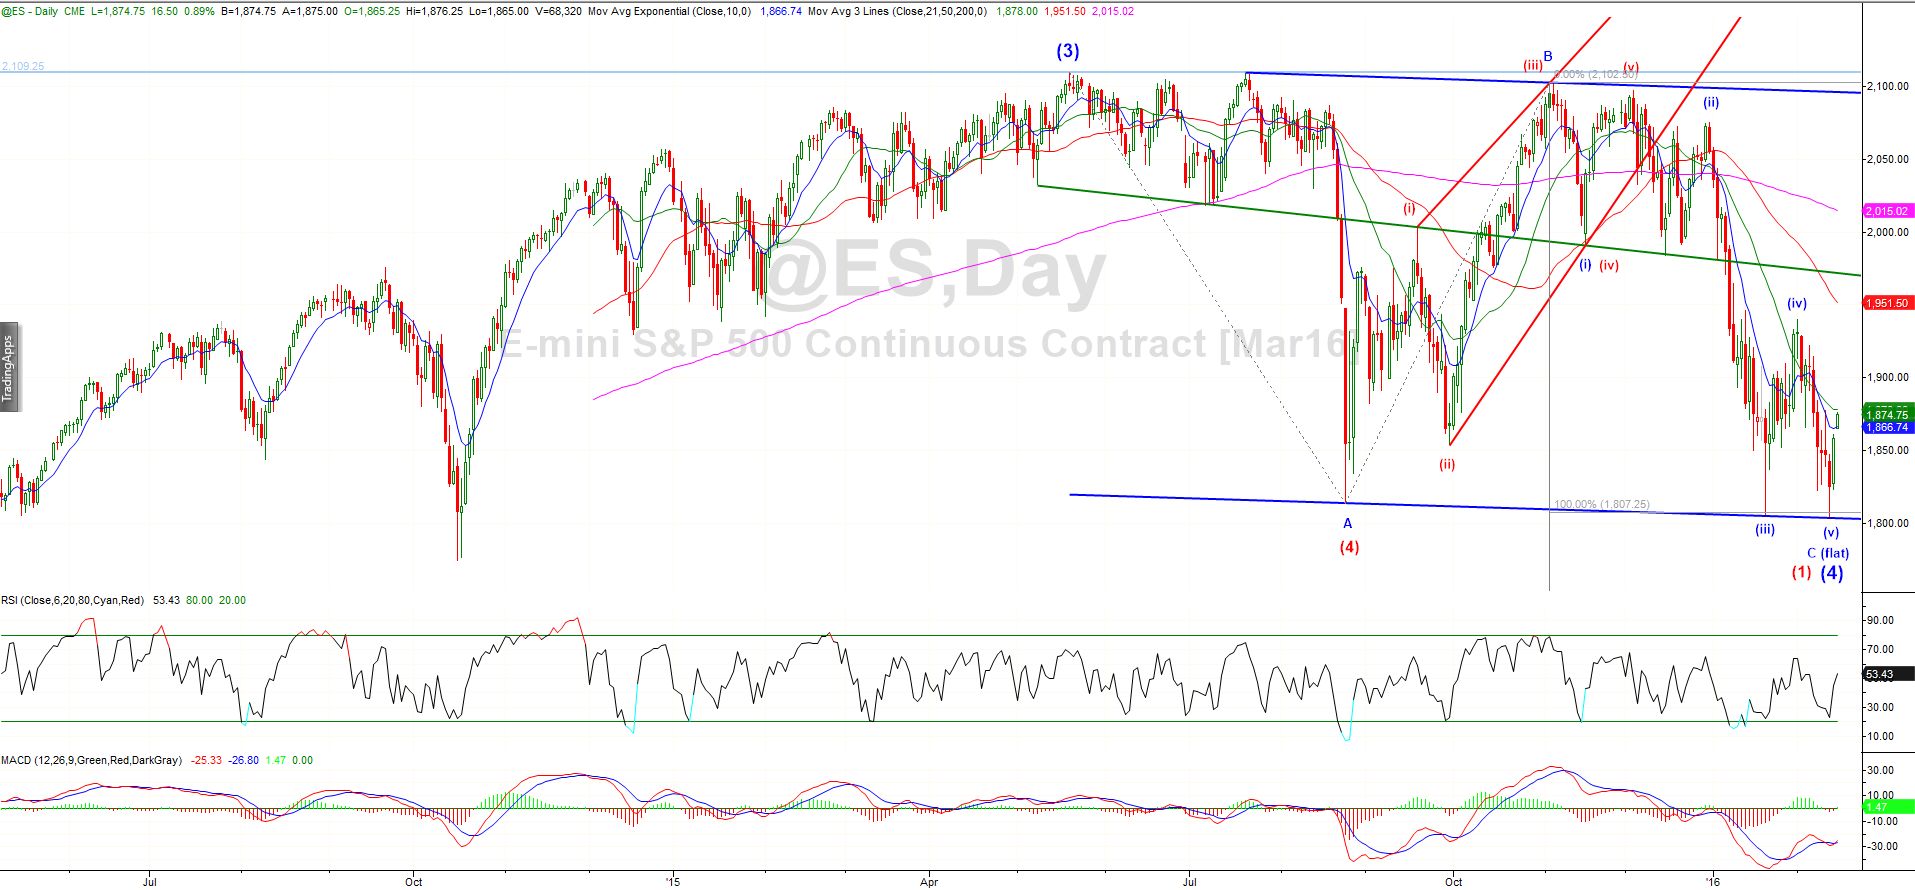
Last year we forecast a strong equities rally targeting the 2500 area for SPX – the rally has been stronger and longer than expected as Central Banks pulled back from the idea of reducing QE. Momentum remains strong and the absence of a clear 4th wave of intermediate degree suggests this bigger picture rally isn’t done. We are counting this rally from February 2016 as wave 5 of V – an ending wave to this entire rally from the 2009 lows. Once this trend exhausts, we will be looking at trading from the short side because “IF” we are correct, this entire 8 year rally should be retraced. Our next measured upside target is where wave (5) equals 0.618x waves (1)-(3) which resides at 2716. We have no reason to fight this until we see evidence of a bearish reversal. 2018 is likely to feature increased volatility as we unwind 4th and 5th waves into the end of this rally but we’re not there yet.

SPX Weekly
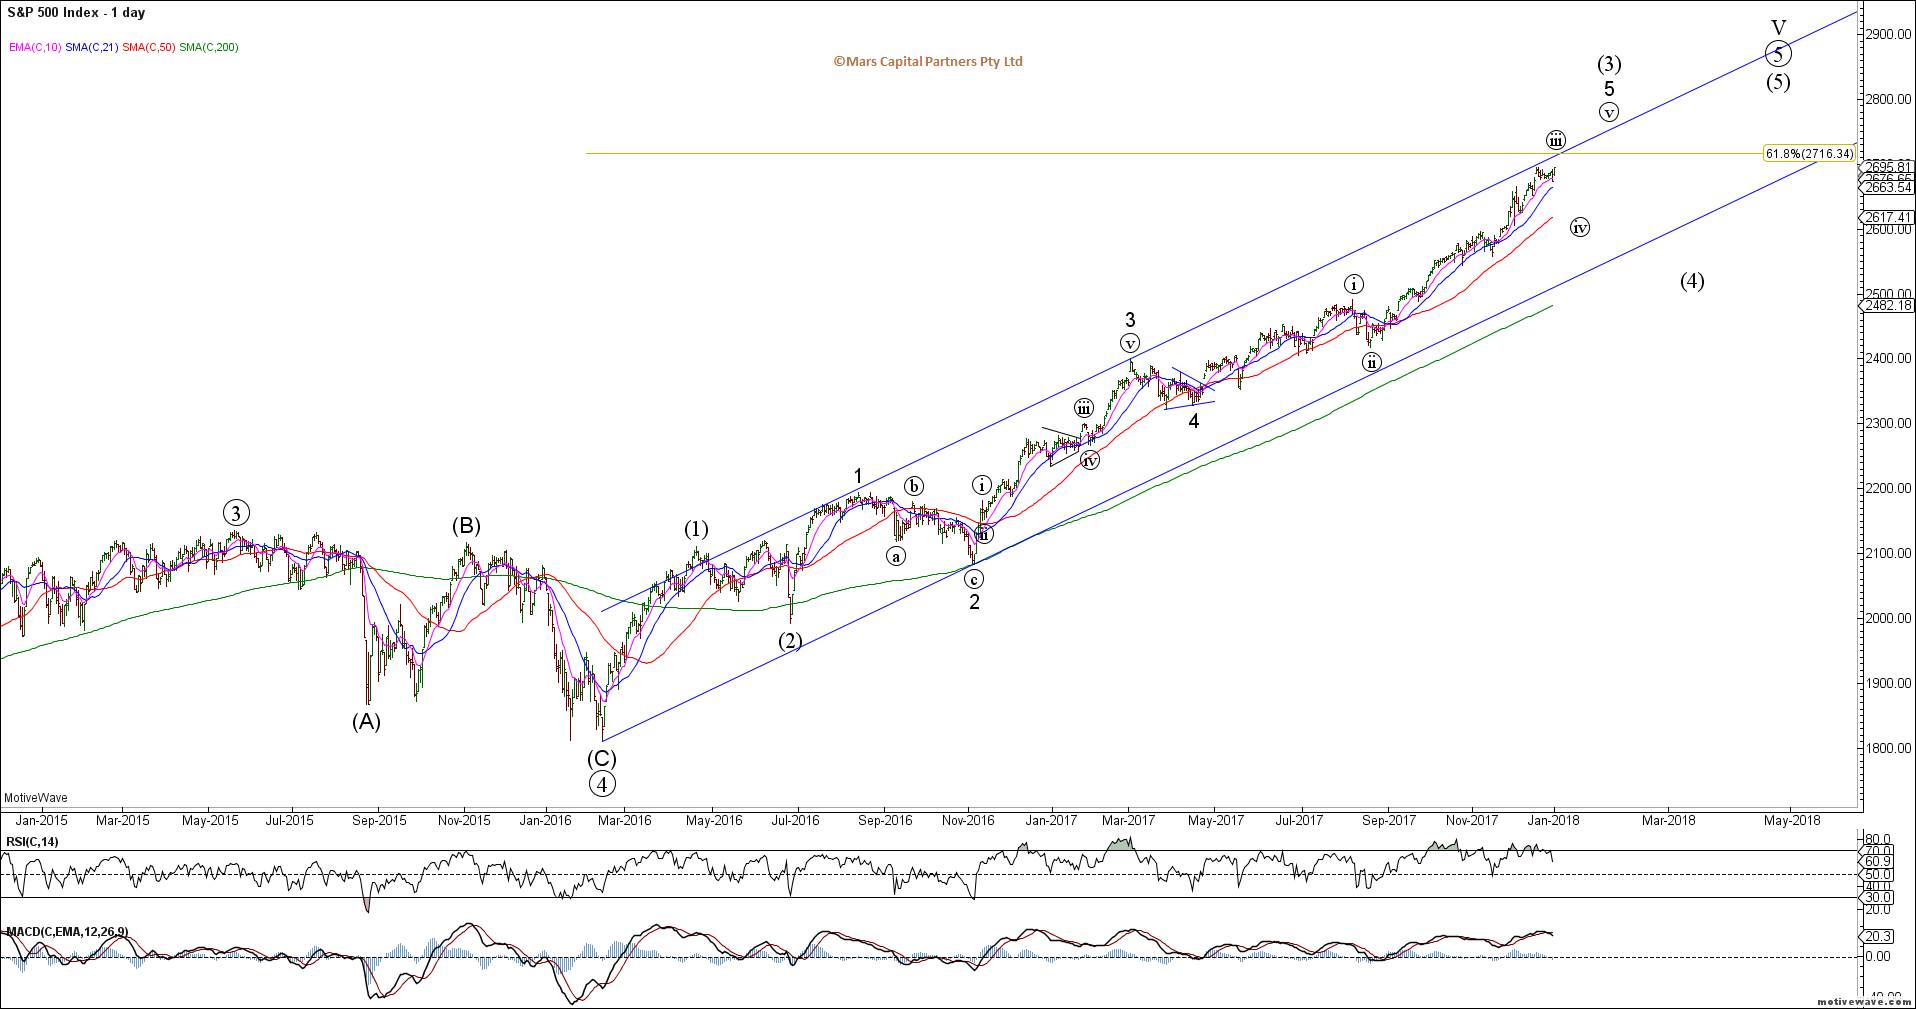
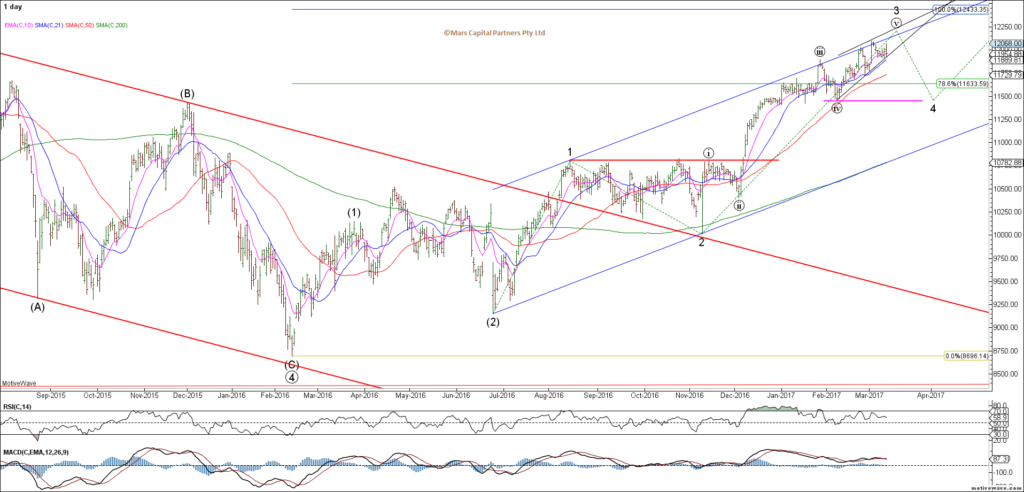
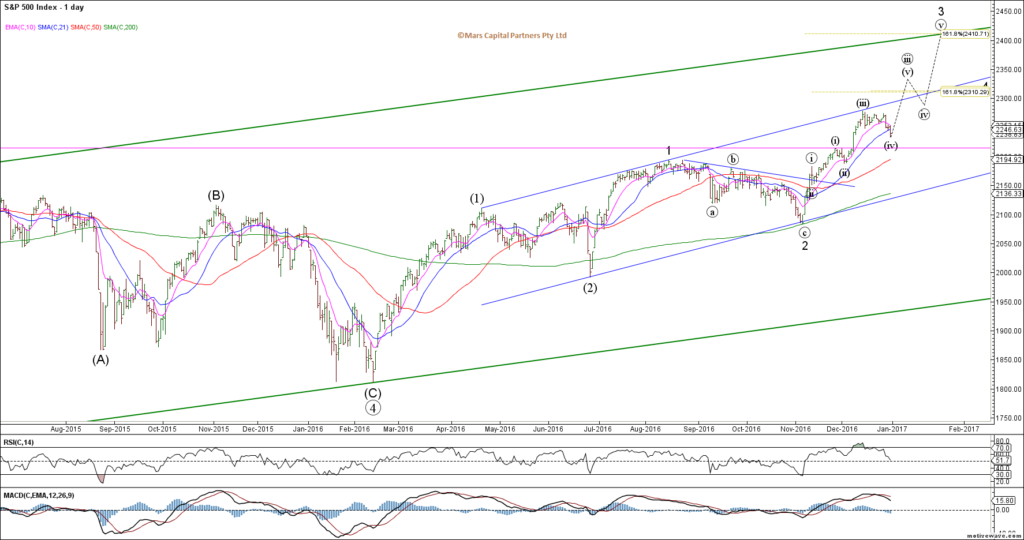
The Daily SPX chart suggests we remain in the wave (3) rally with waves (4) and (5) to come. There are no signs of a tradable top but we are alert to a change in sentiment given the extreme bullishness. This year, we will be on the lookout for an impending market top and potential triggers for this to occur – first and foremost the wave count must be complete (no signs of this as yet) and the bullish paradigm needs to shift – likely triggered by rising yields and US$
SPX Daily
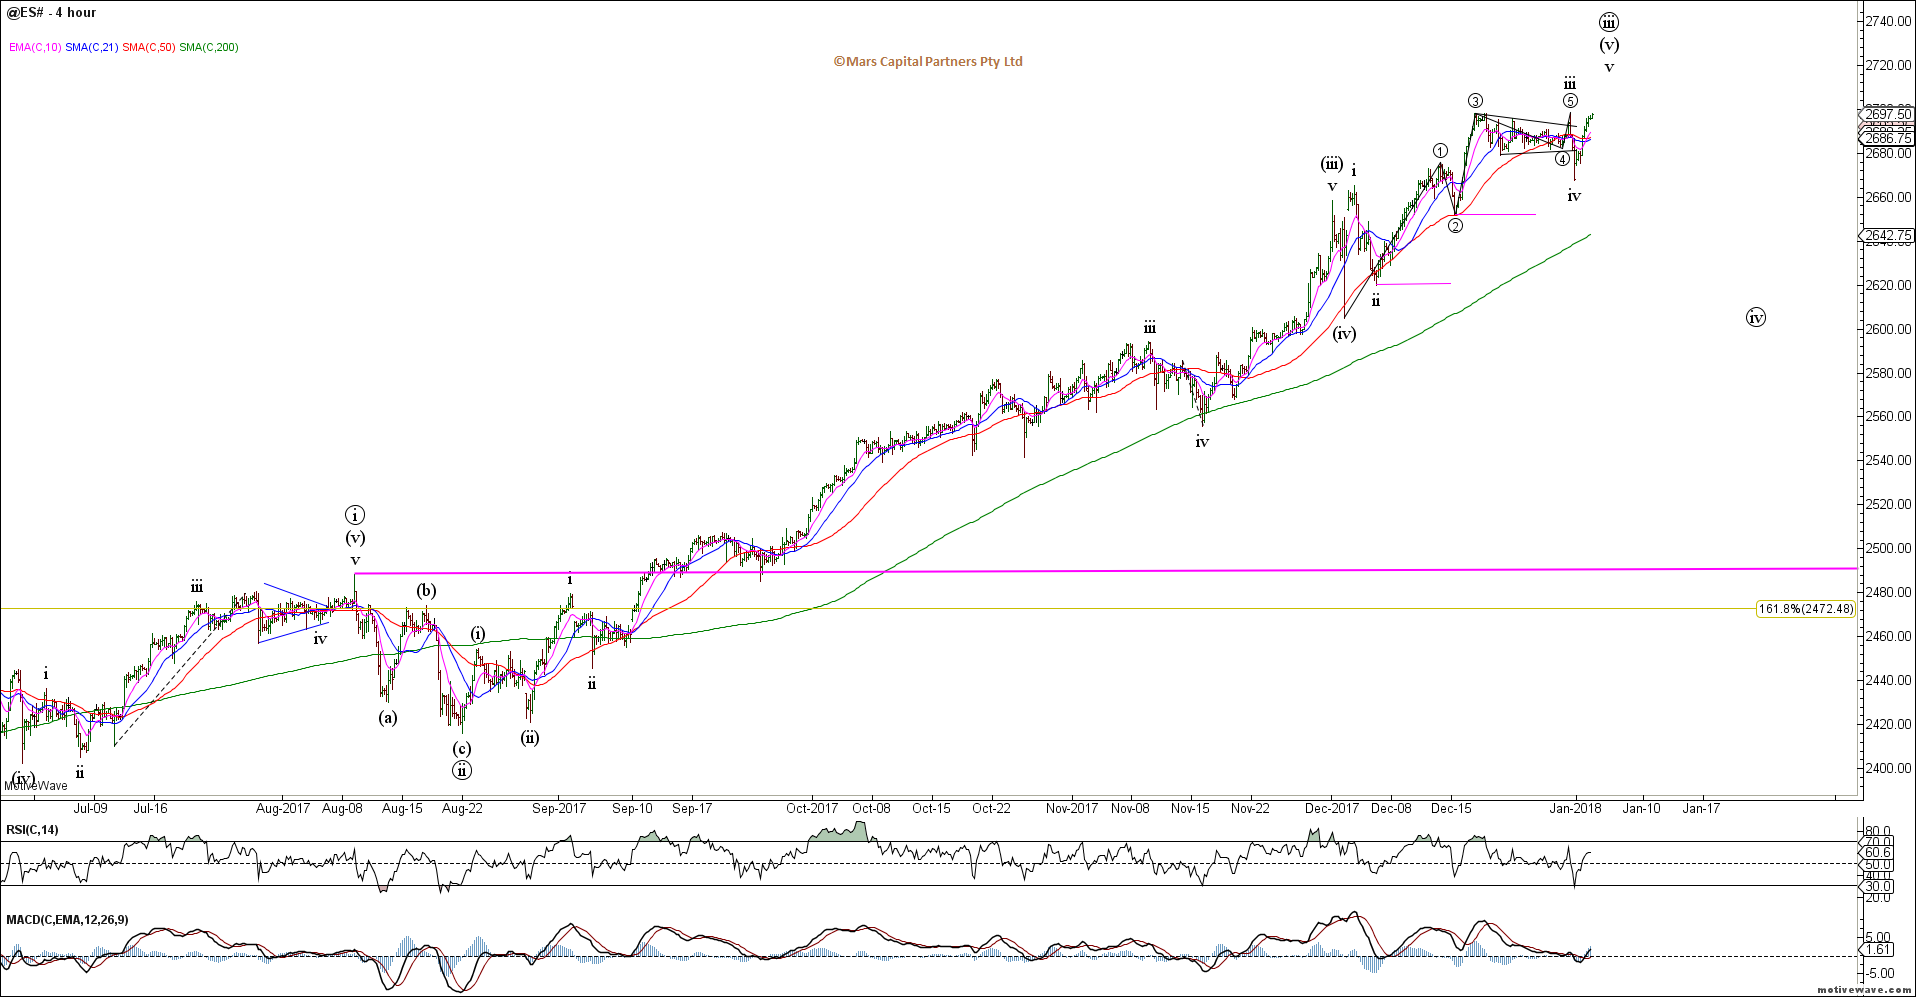
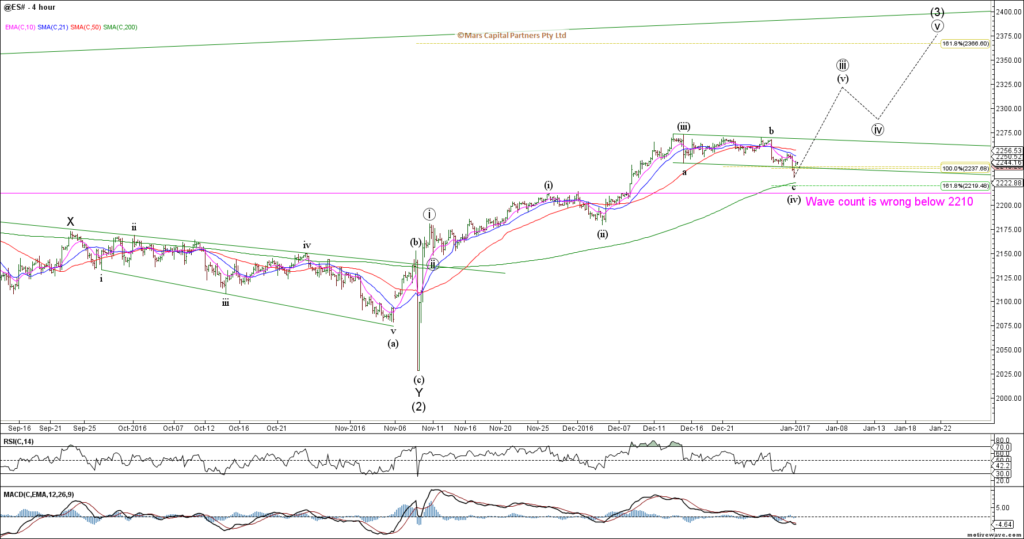
ES continues to rally impulsively and decline correctively. Until that changes the bulls remain in control but momentum is deteriorating.
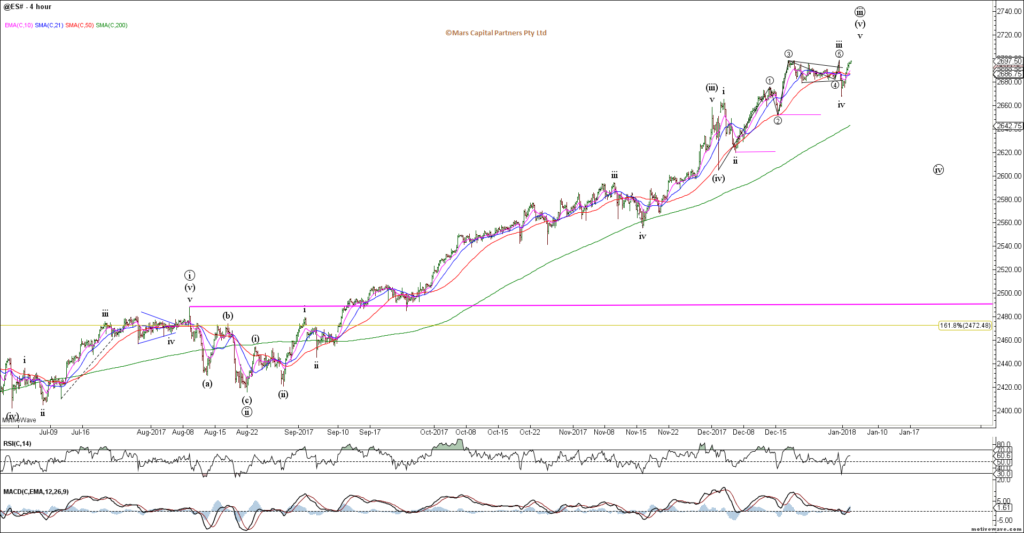
ES H4
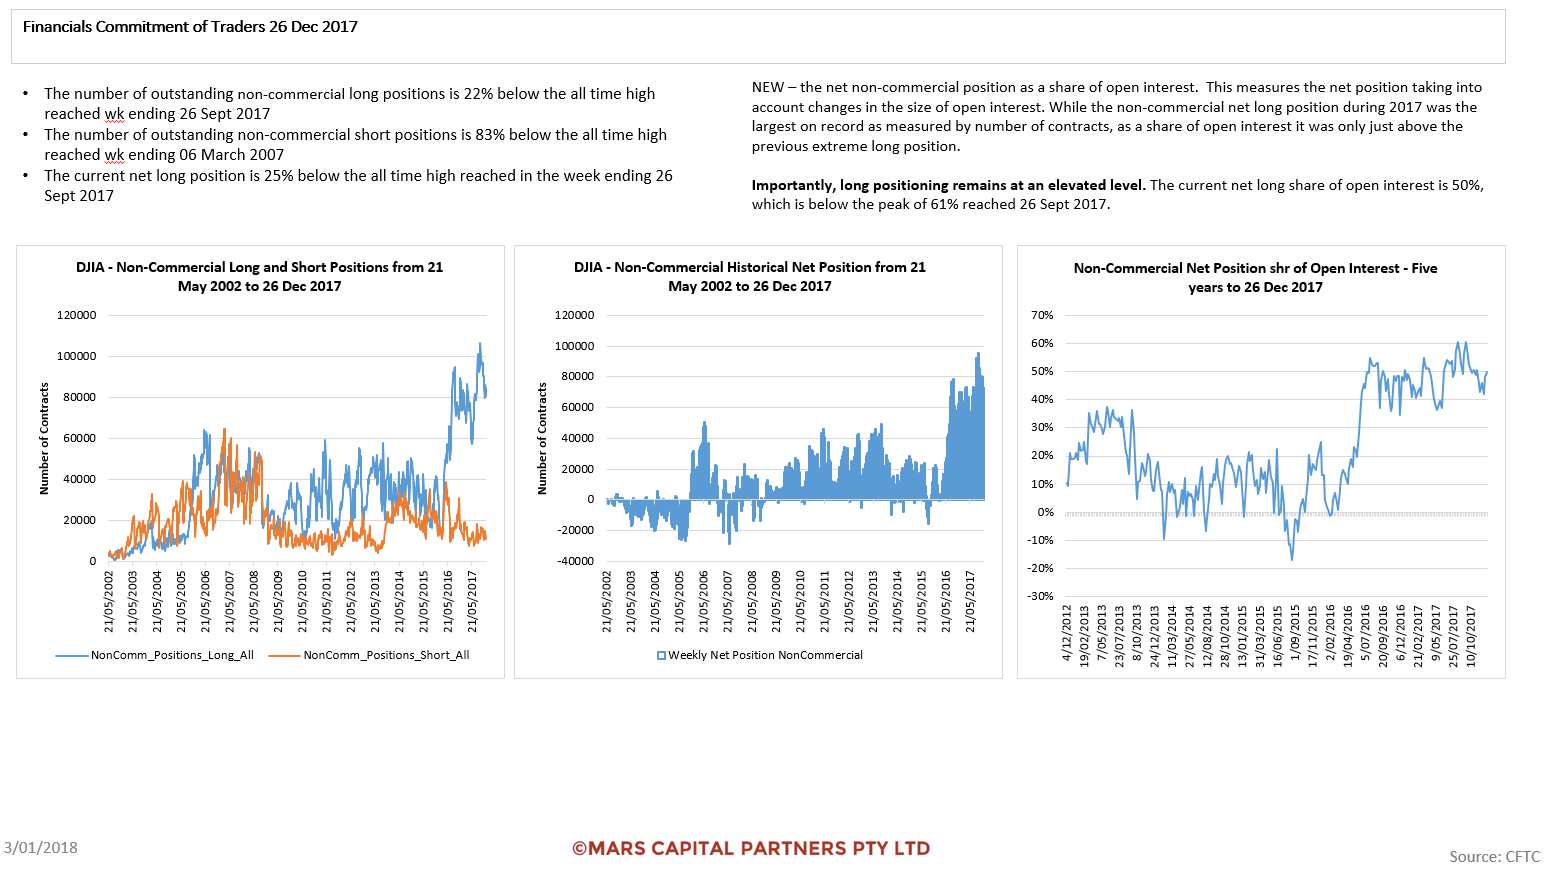
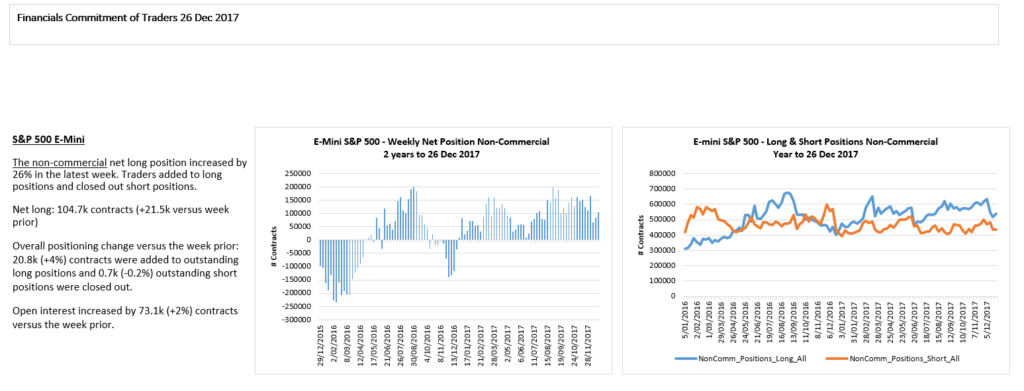
Interestingly, while equity traders are all-in, this is not the case with futures traders who remain partially hedged.
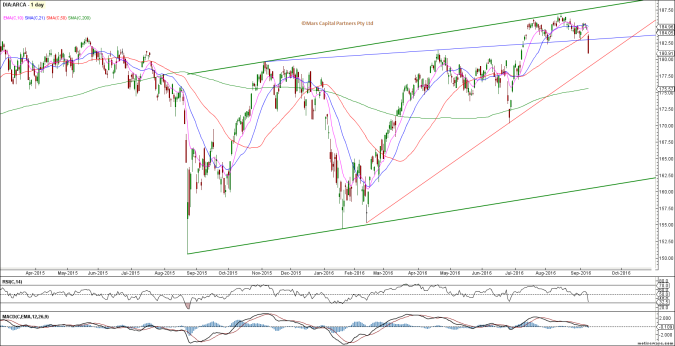
The DJIA has been the strongest index supported by the weakening US$ throughout 2017 – our expected bullish turn in the US$ will likely cause the DJIA to underperform in 2018.
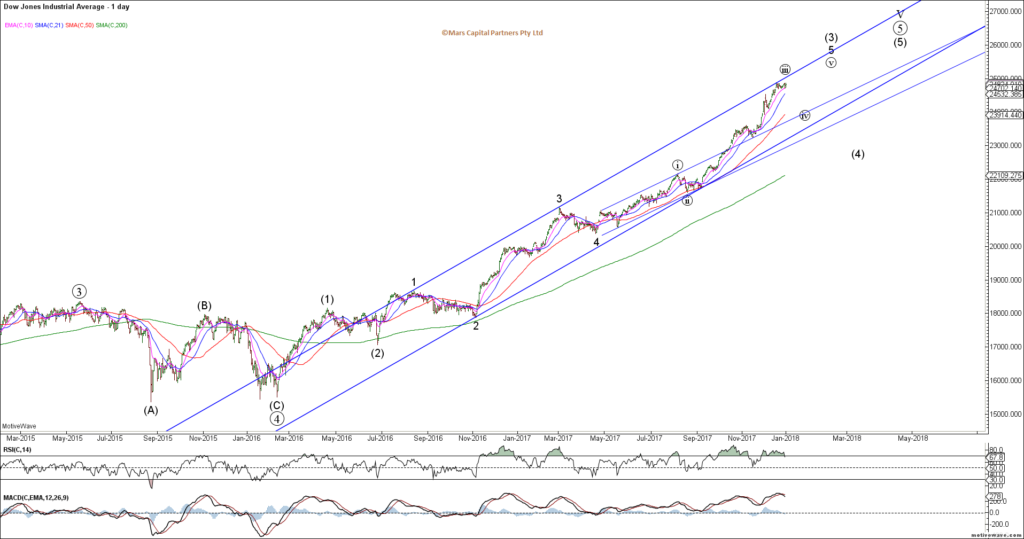
DJIA Daily
The YM COT data shows the strength of this rally despite the pull back in futures longs. Physical equities leading the way.

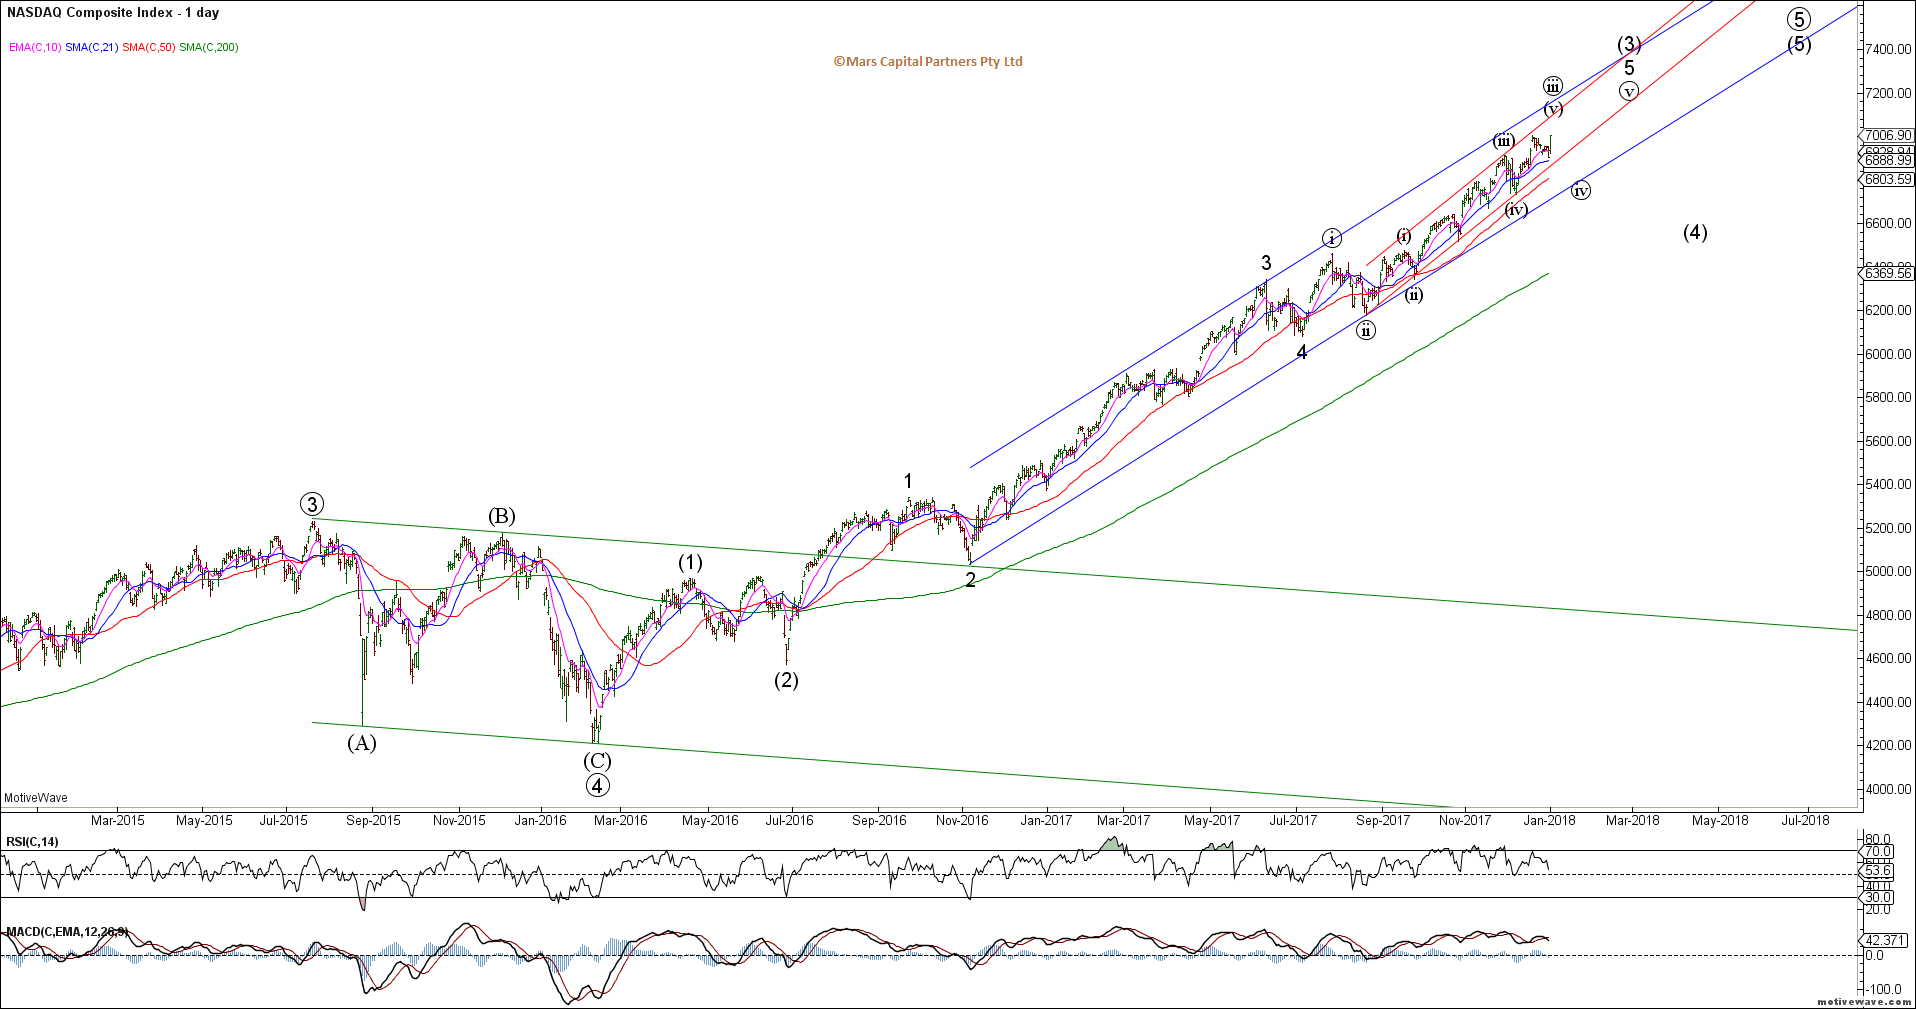
The Nasdaq continues to subdivide higher in wave (3) supported by the 50 day sma and trend channels. This chart is more illustrative of declining momentum but as long as we continue to make higher highs and higher lows coupled with impulsive rallies and corrective declines, the trend is your friend until it bends. While we expect this rally to terminate at some point during 2018, I would prefer to see a clearer wave (4) and (5) play out first. In the meantime there has been no reason to alter our bullish stance.

Nasdaq Composite Daily
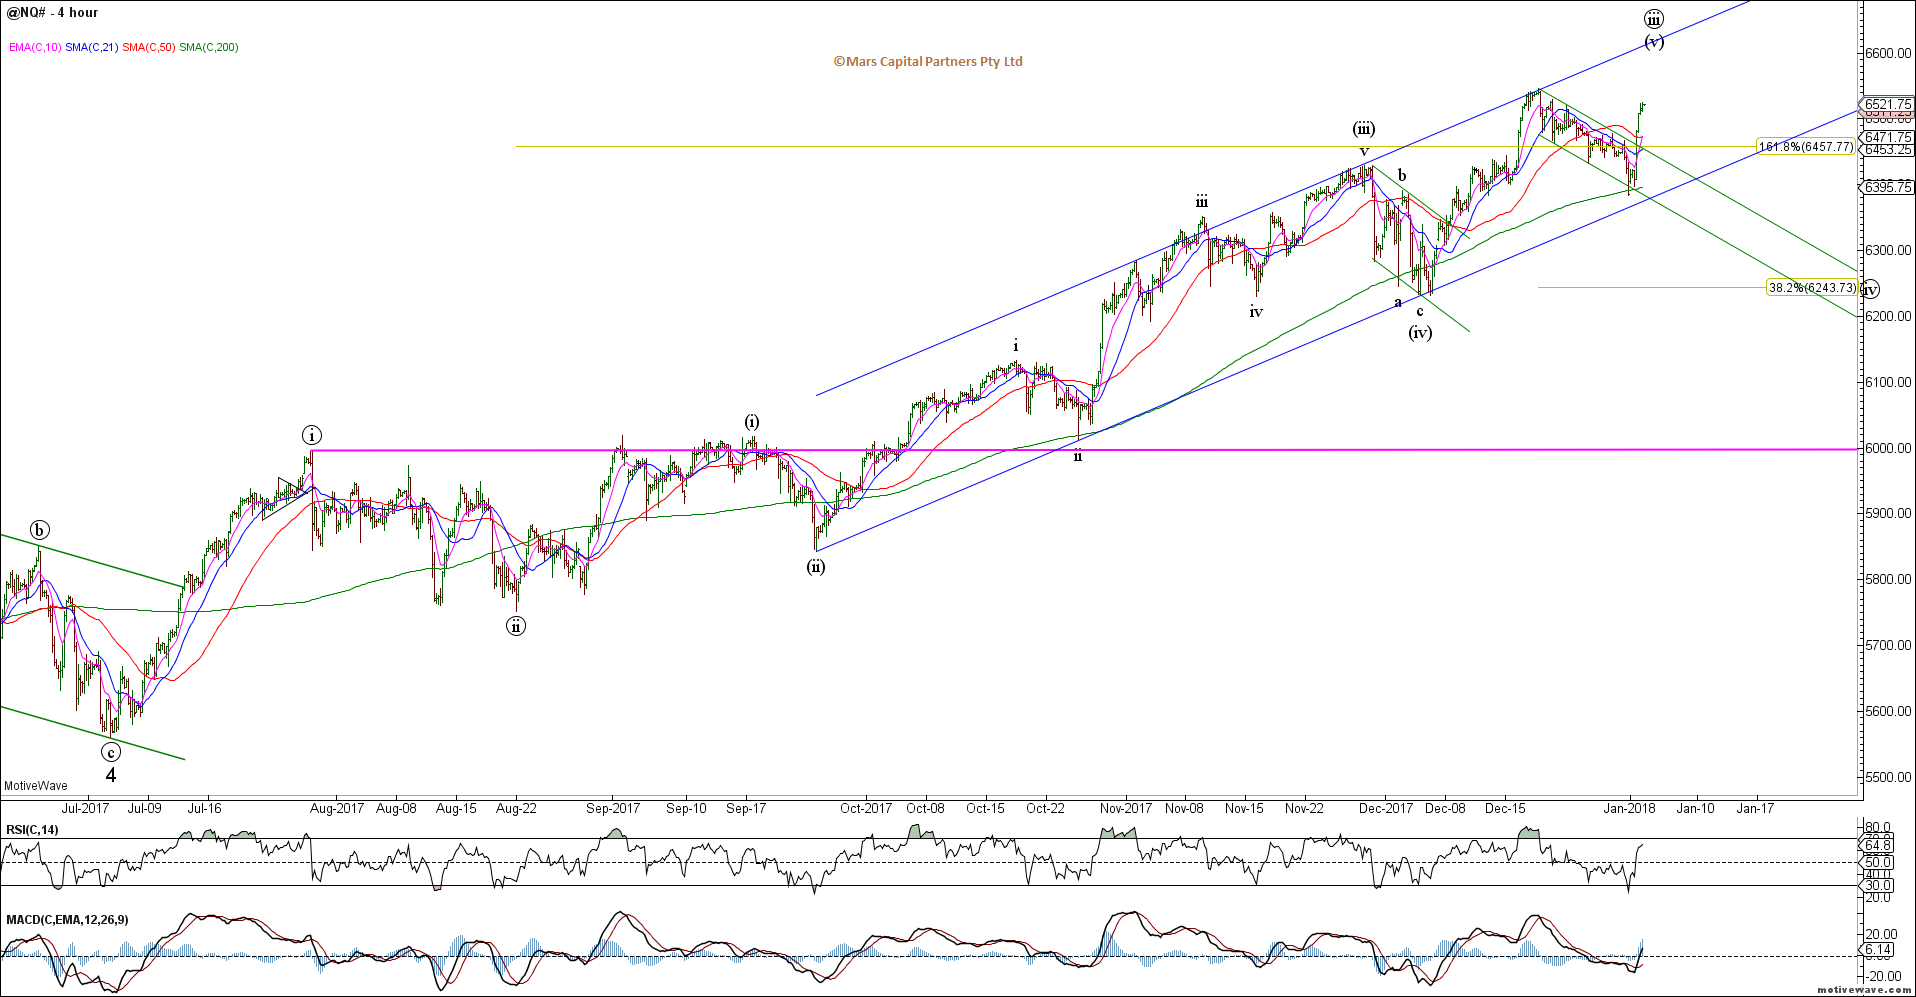
The near term NQ chart clearly shows the recent trend channel and likely push to new ATH’s.
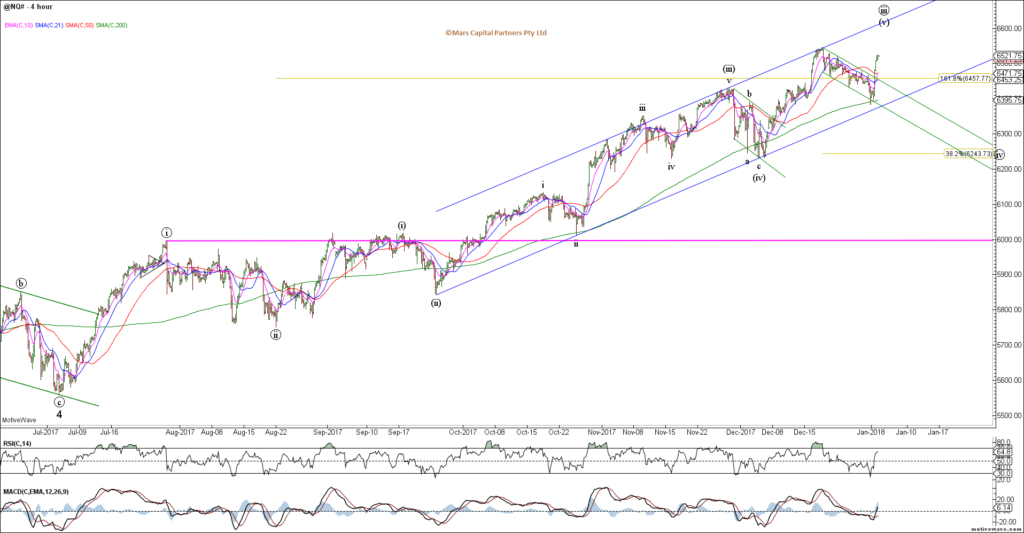
NQ H4
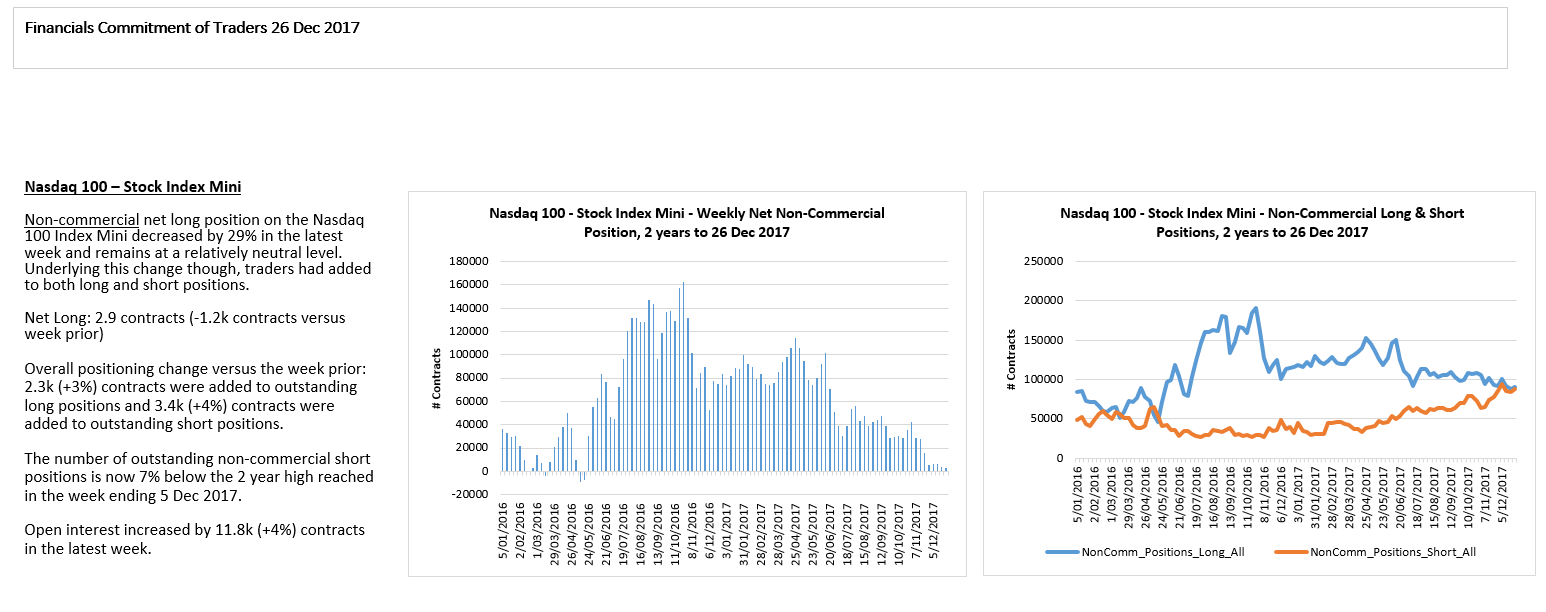
NQ traders have been actively hedging as prices advance. Note the high level of shorts causing this squeeze.

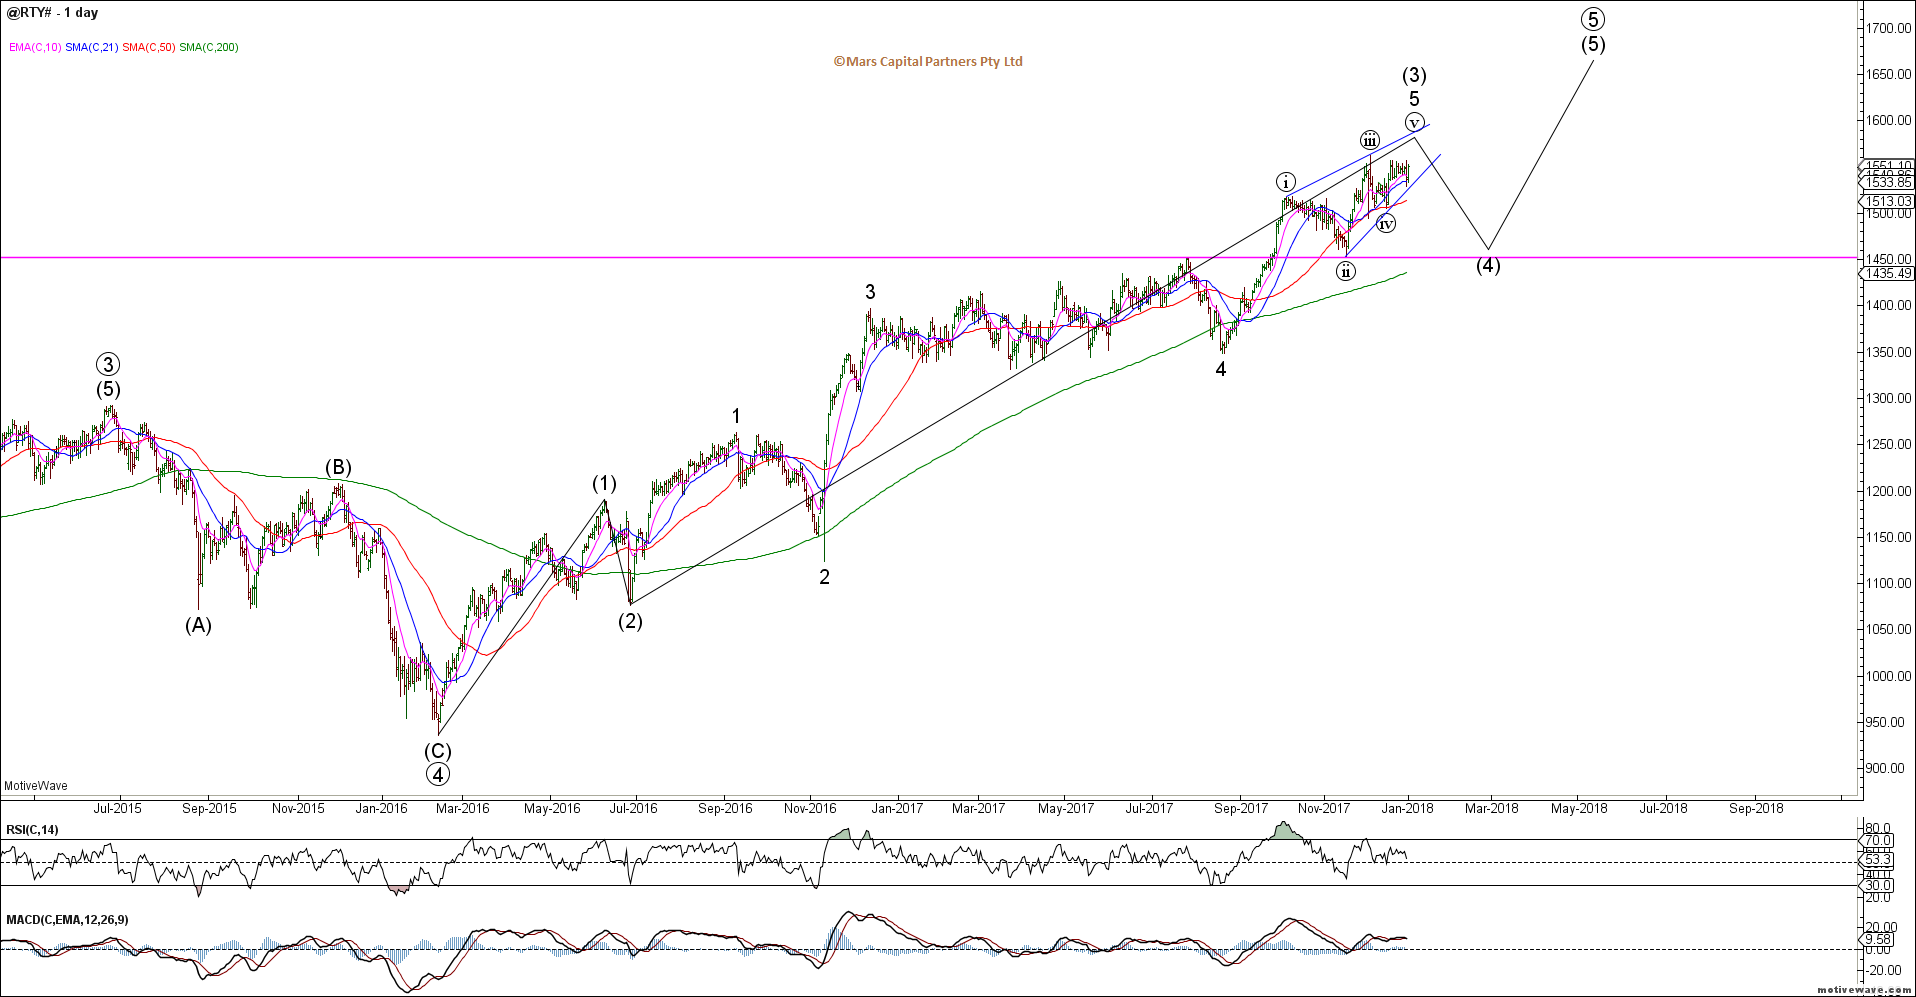
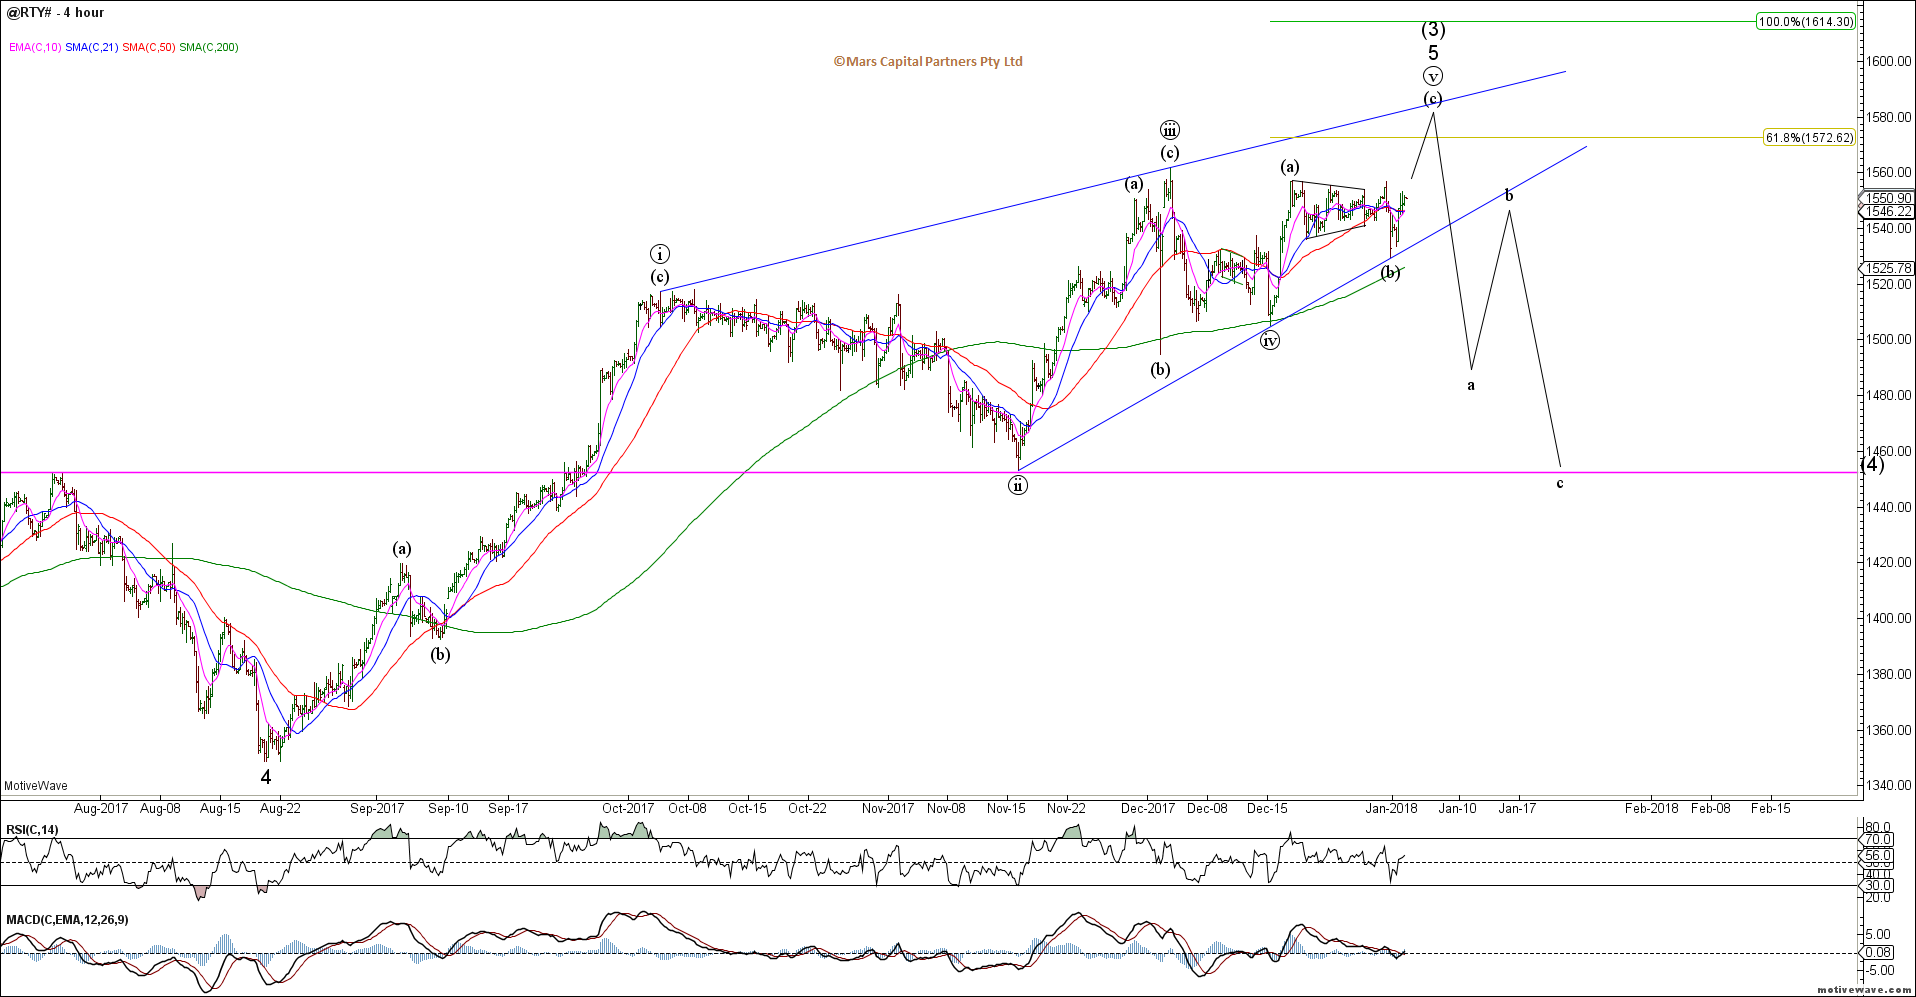
The Russell 2000 looks the most vulnerable of US equity indices as we wedge into yet another high. The overlapping nature of the advance suggests an ending wave to complete wave (3) prior to a wave (4) decline towards the 200 day sma. Remember, this rally from the 2016 lows is an ENDING wave 5 which should be fully retraced on completing to this rally.
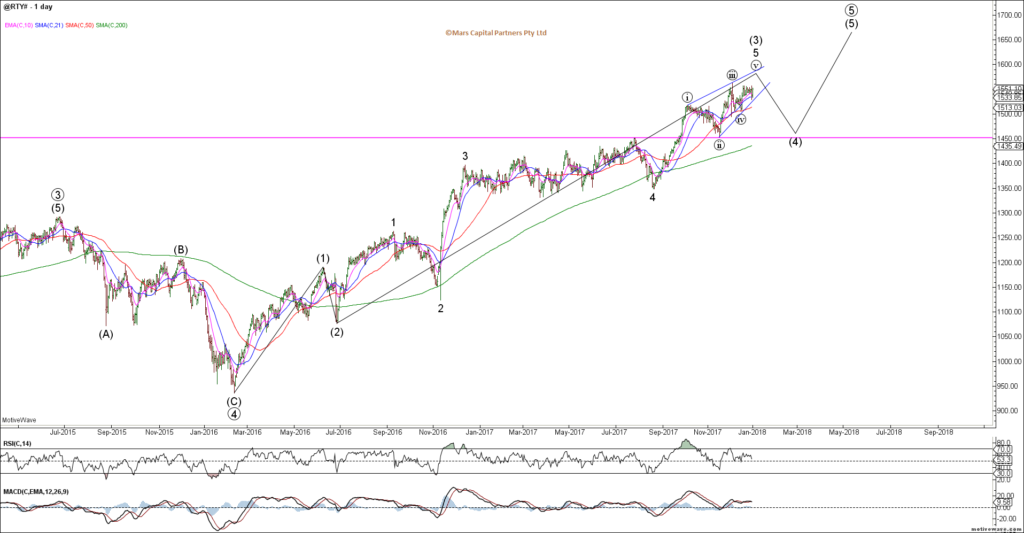
RTY Daily
The near term count (ending diagonal) suggests one final push higher for wave (c) of (v) of 5 before a bearish reversal. Trade above 1615 would invalidate this count as wave (iii) would be the shortest. Stylized pattern is shown below. Topping.
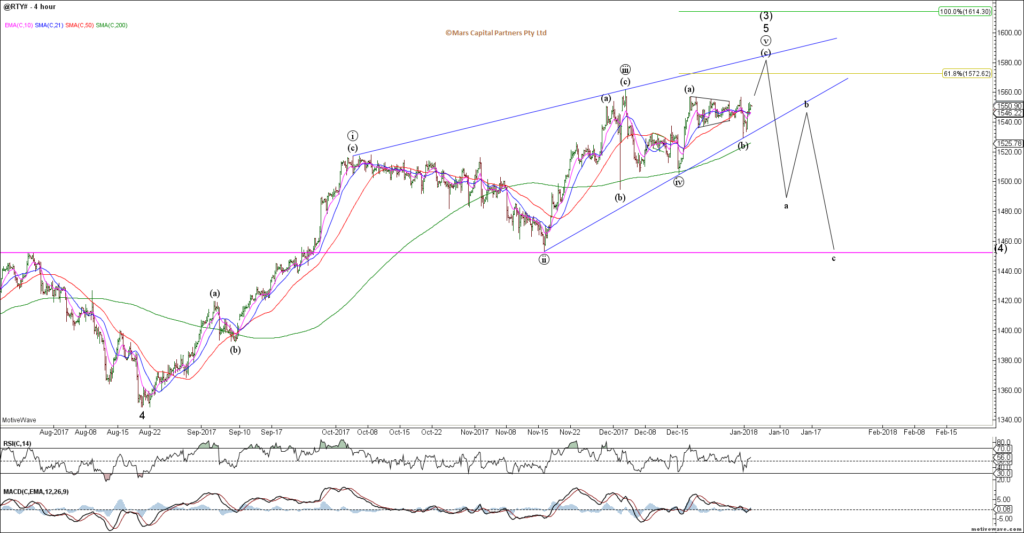
RTY H4
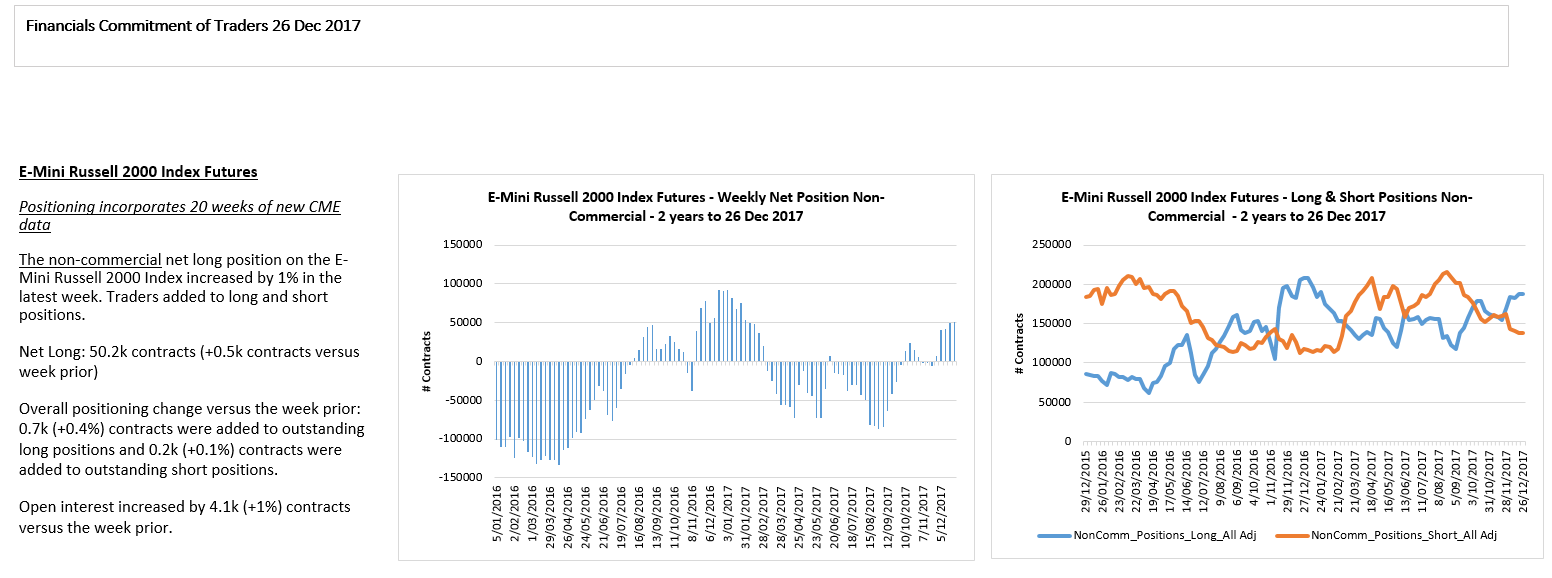
The RTY COT data shows shorts squeezed out again which makes this index more susceptible to a decline near term.

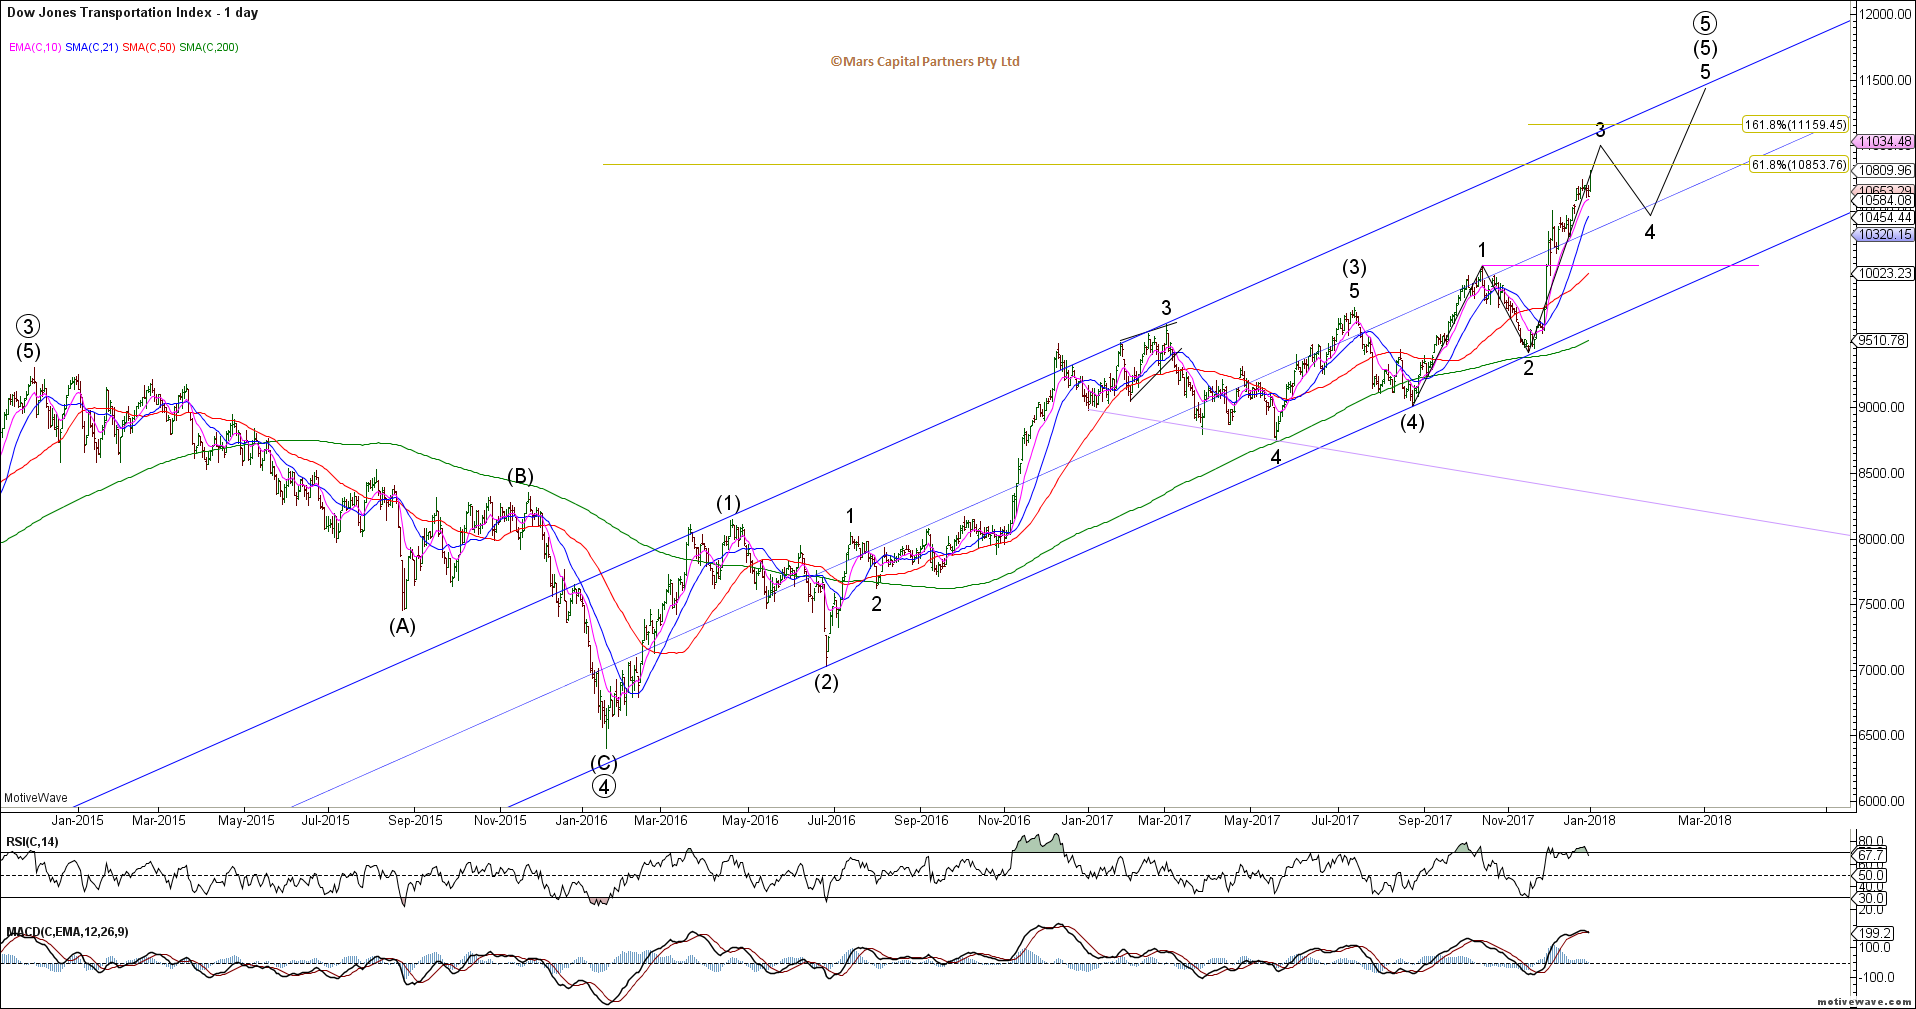
The DJ Transports are currently in wave 3 of (5) after bouncing off the 200 day sma we highlighted some weeks back. We require another wave 4 and 5 to potentially complete this multi-year rally.

DJT Daily
The VIX compression continues to wedge lower – ever tightening. Do you really want to be a seller of volatility here? Take note that momentum continues to make higher lows as per the MACD. This was the most crowded trade for 2017 – I am looking for a bullish reversal early in the new year as volatility expands. The market is gifting cheap protection so I suggest you take some…
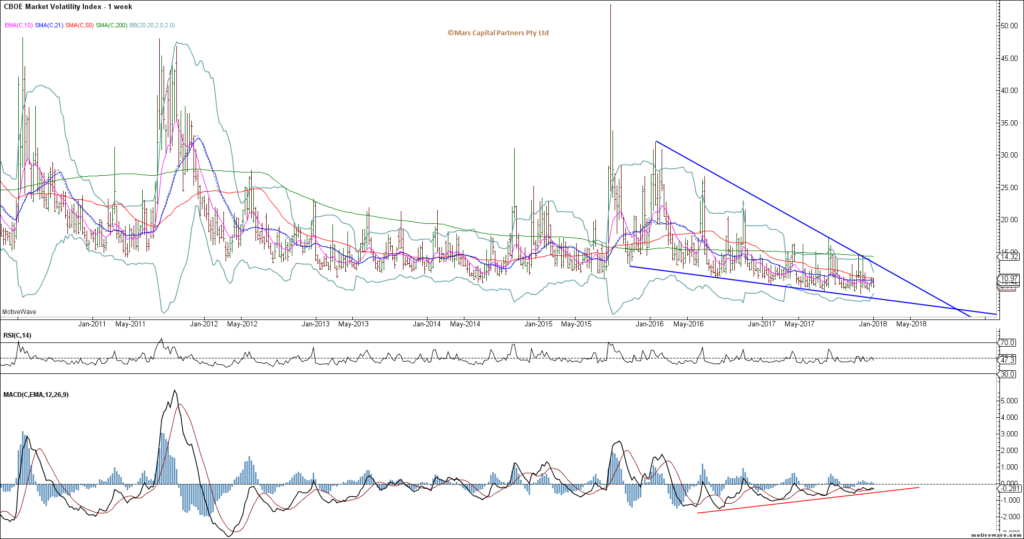
VIX Weekly
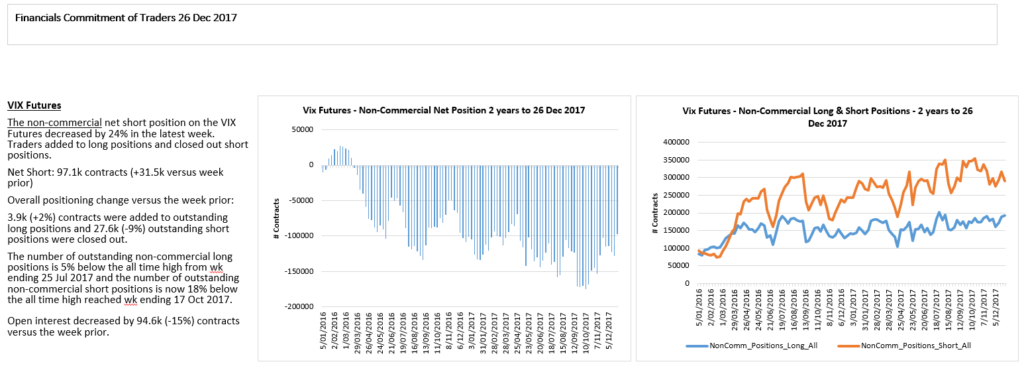
VIX shorts remain elevated but not at recent extremes.
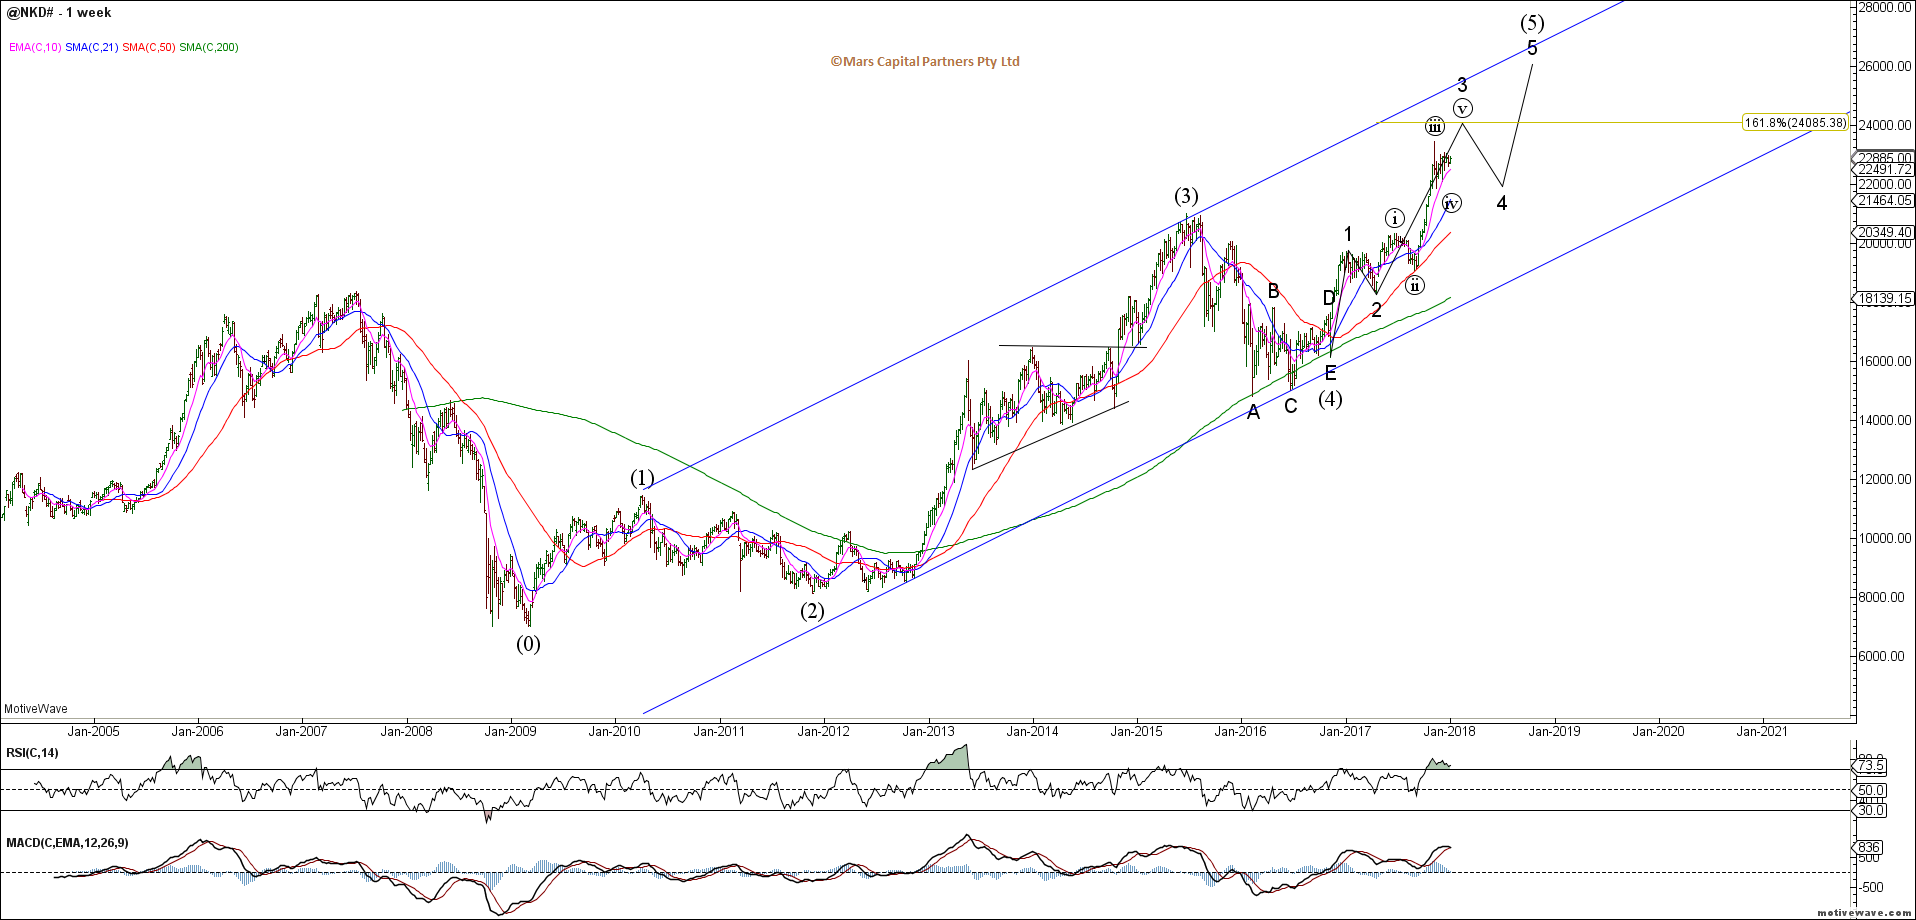
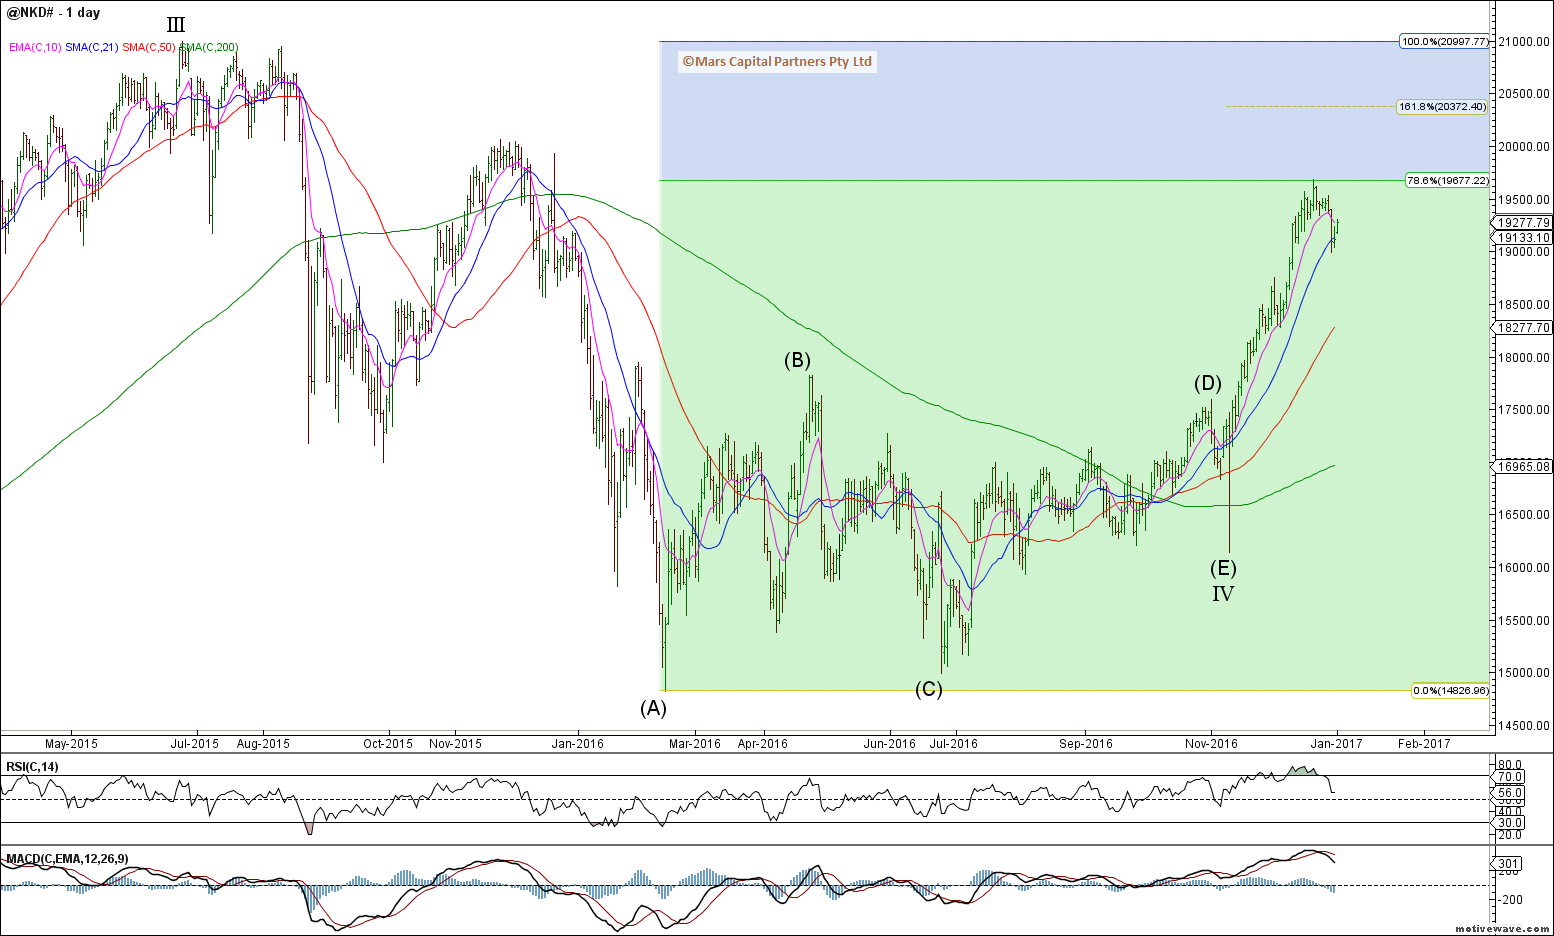
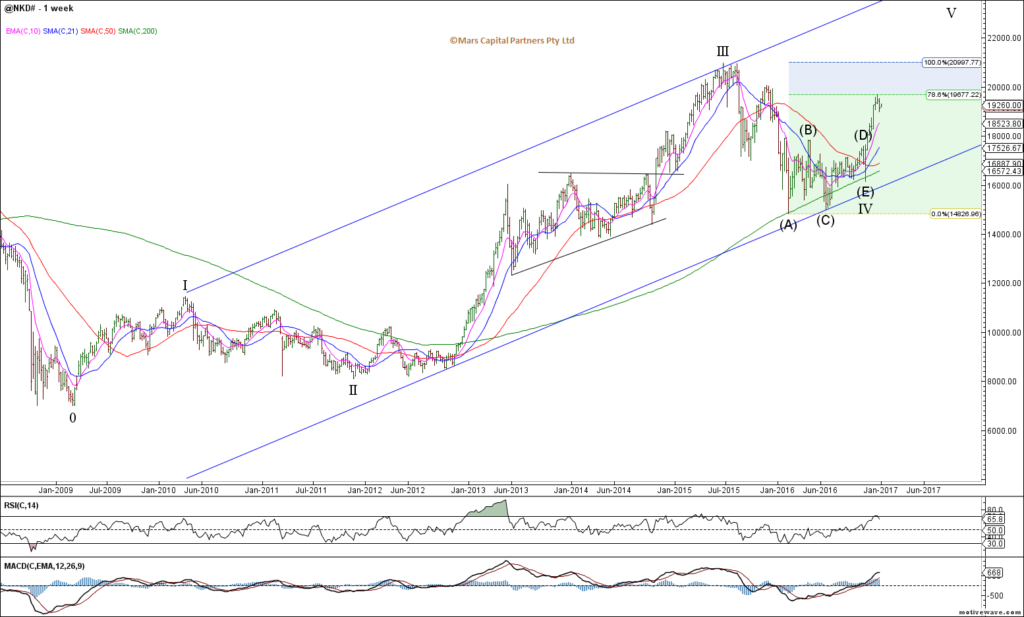
To the global equity markets and our 2017 Year Ahead Review highlighted the need for new highs in the NKD and DAX which have both performed as expected. NKD pushed strongly to new highs but the rally is incomplete. We are currently in a small degree wave (iv) of 3 with the expectation of (v) up towards 24000 to complete wave 3 from where we should see a larger degree wave 4 and 5 to complete the post-2009 rally.
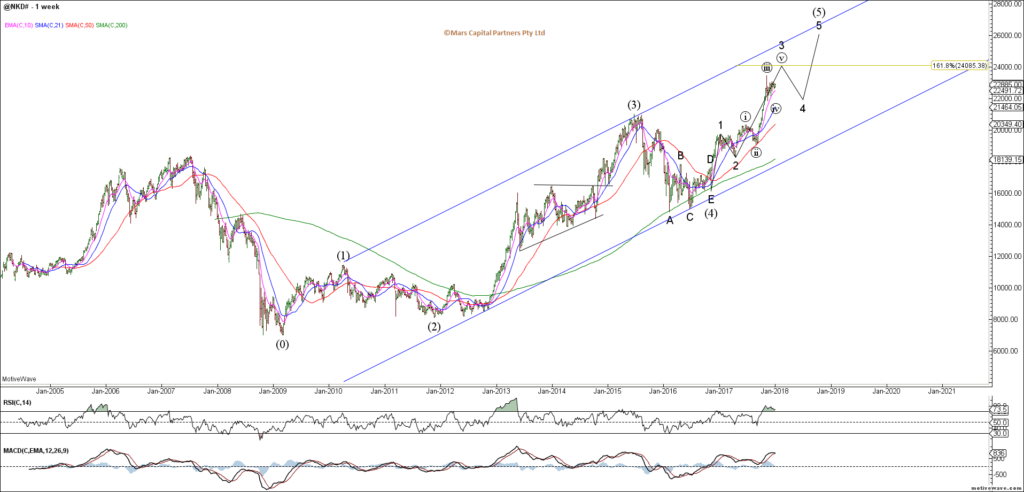
NKD Weekly
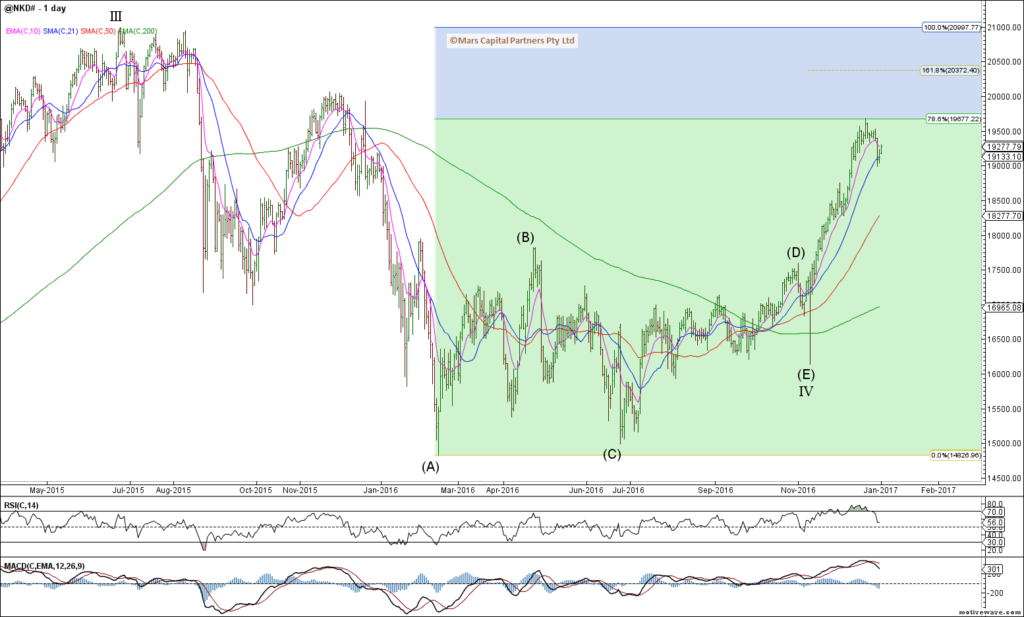
Near term the count is unclear but we appear to be forming a contracting triangle. The question is whether we retest the 21800 area (black count) prior to wave (v) up or just push directly higher from here (red count) – the near term count is unclear. Either way, we should expect new cycle highs for the NKD.
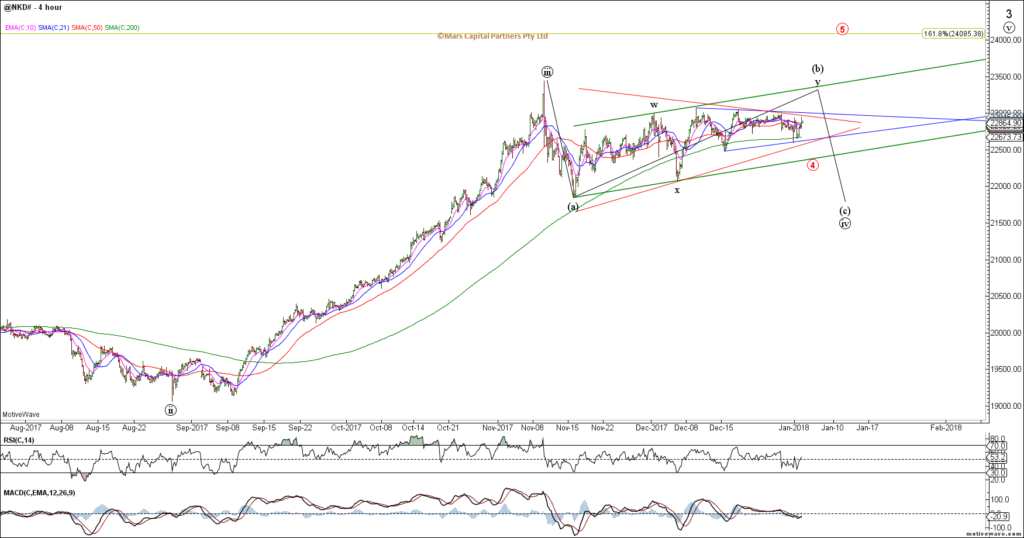
NKD H4
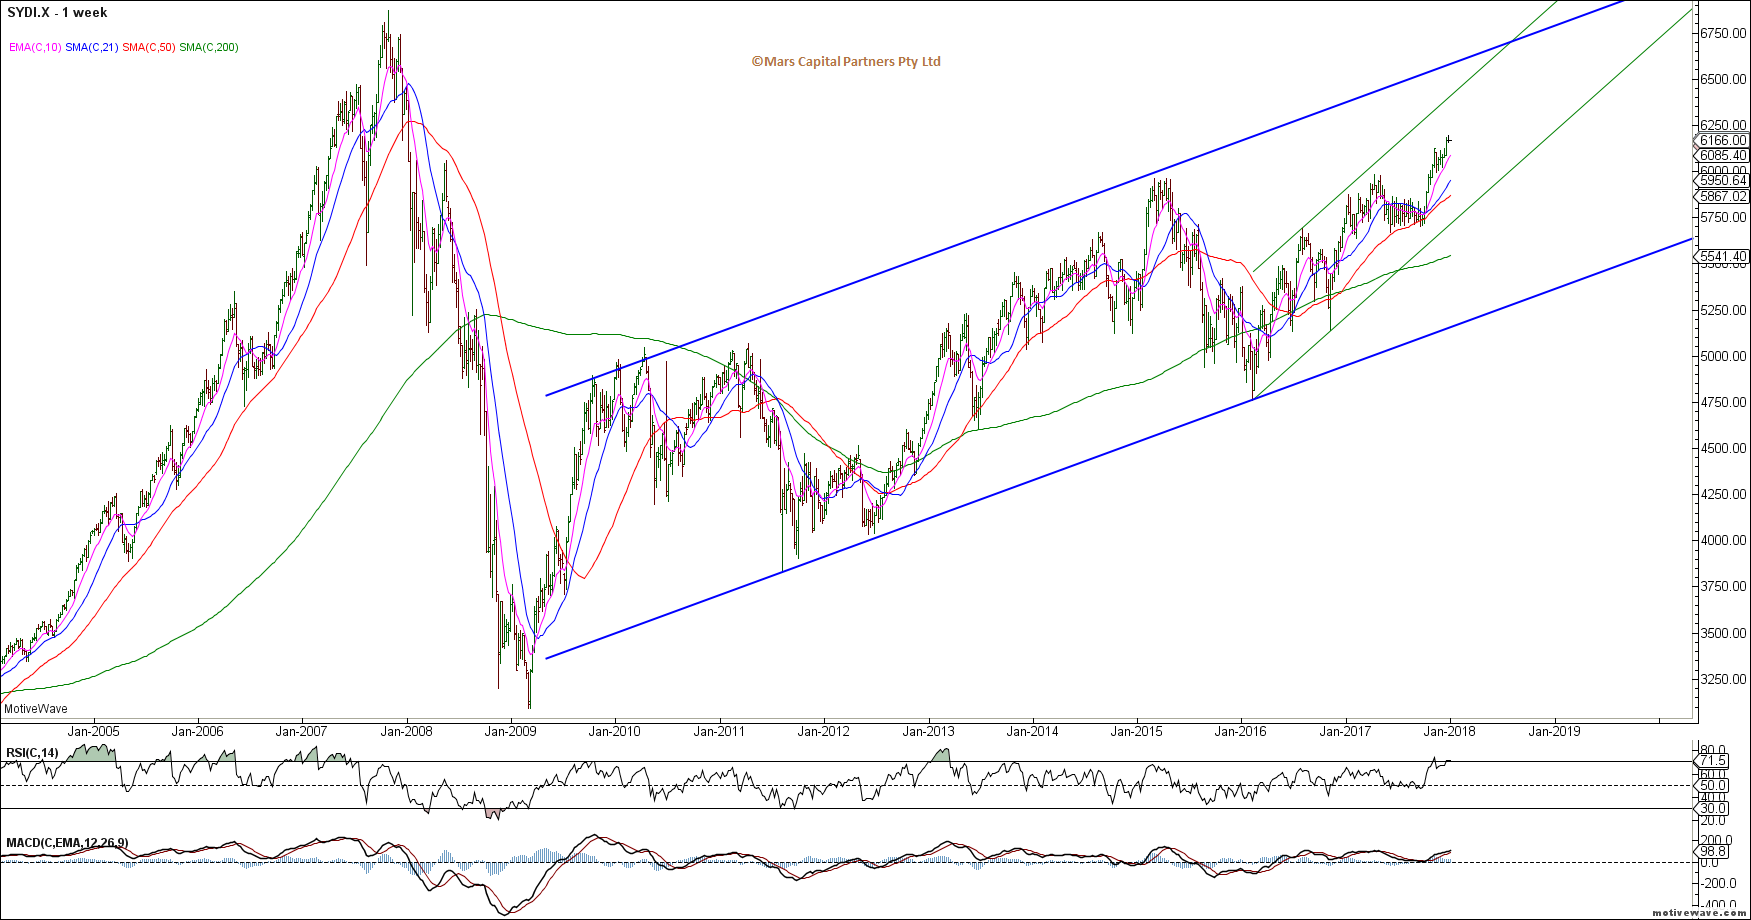
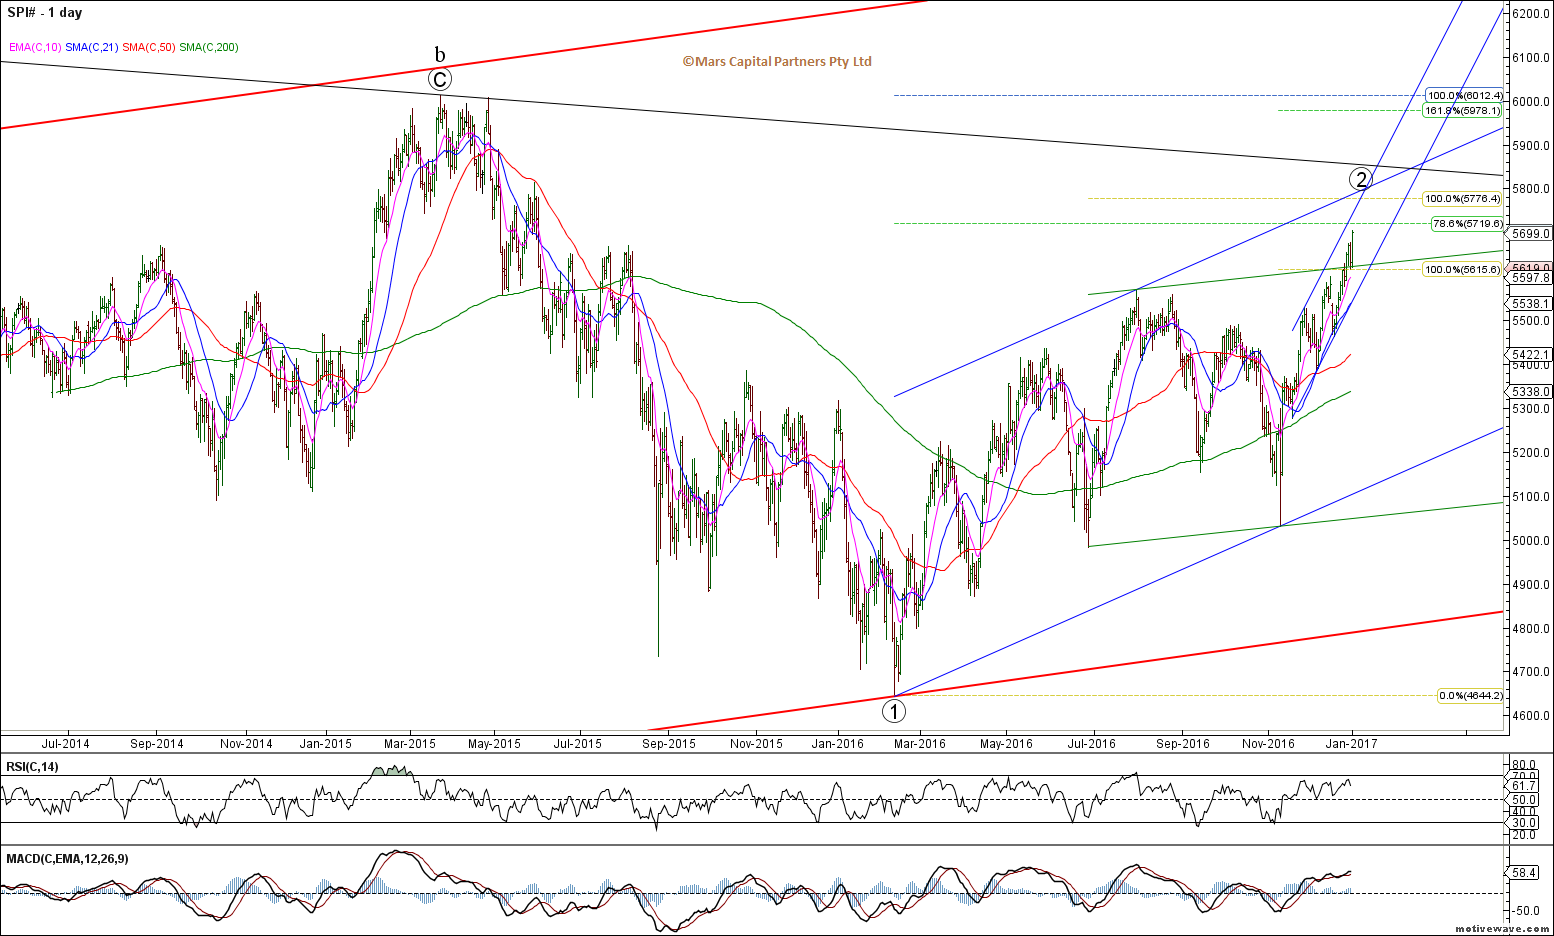
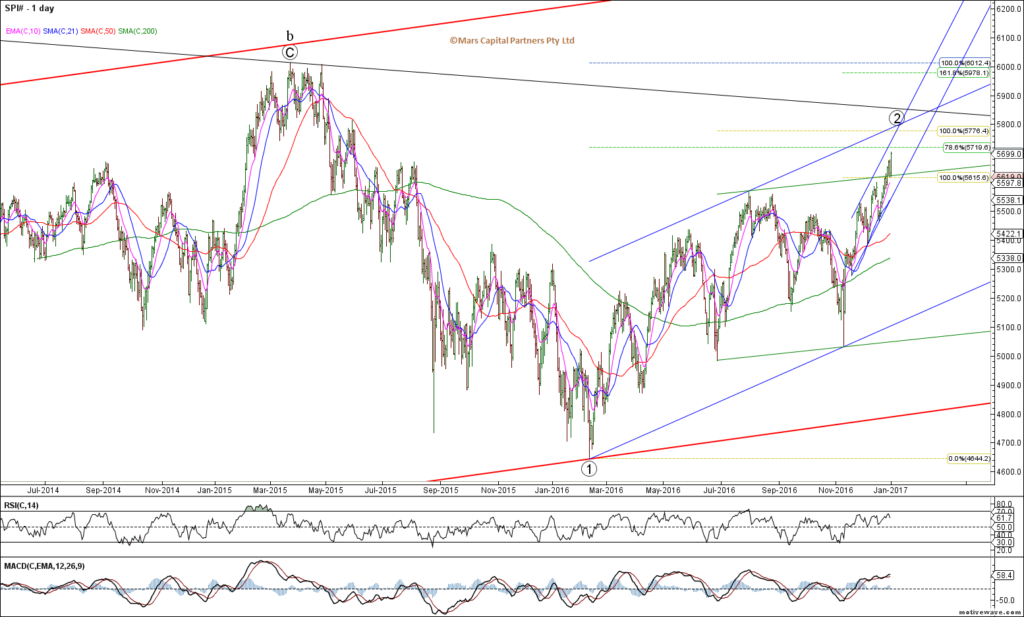
The ASX200 (SPI) pushed to new cycle highs which was not expected earlier in the year. It has reluctantly followed the global equity market theme higher. This overlapping rally is likely doomed to fail but the wave count is unclear. I am looking for opportunities to short this index when we get confirmation of a turn – in the meantime I am not fighting this.

ASX200 Weekly
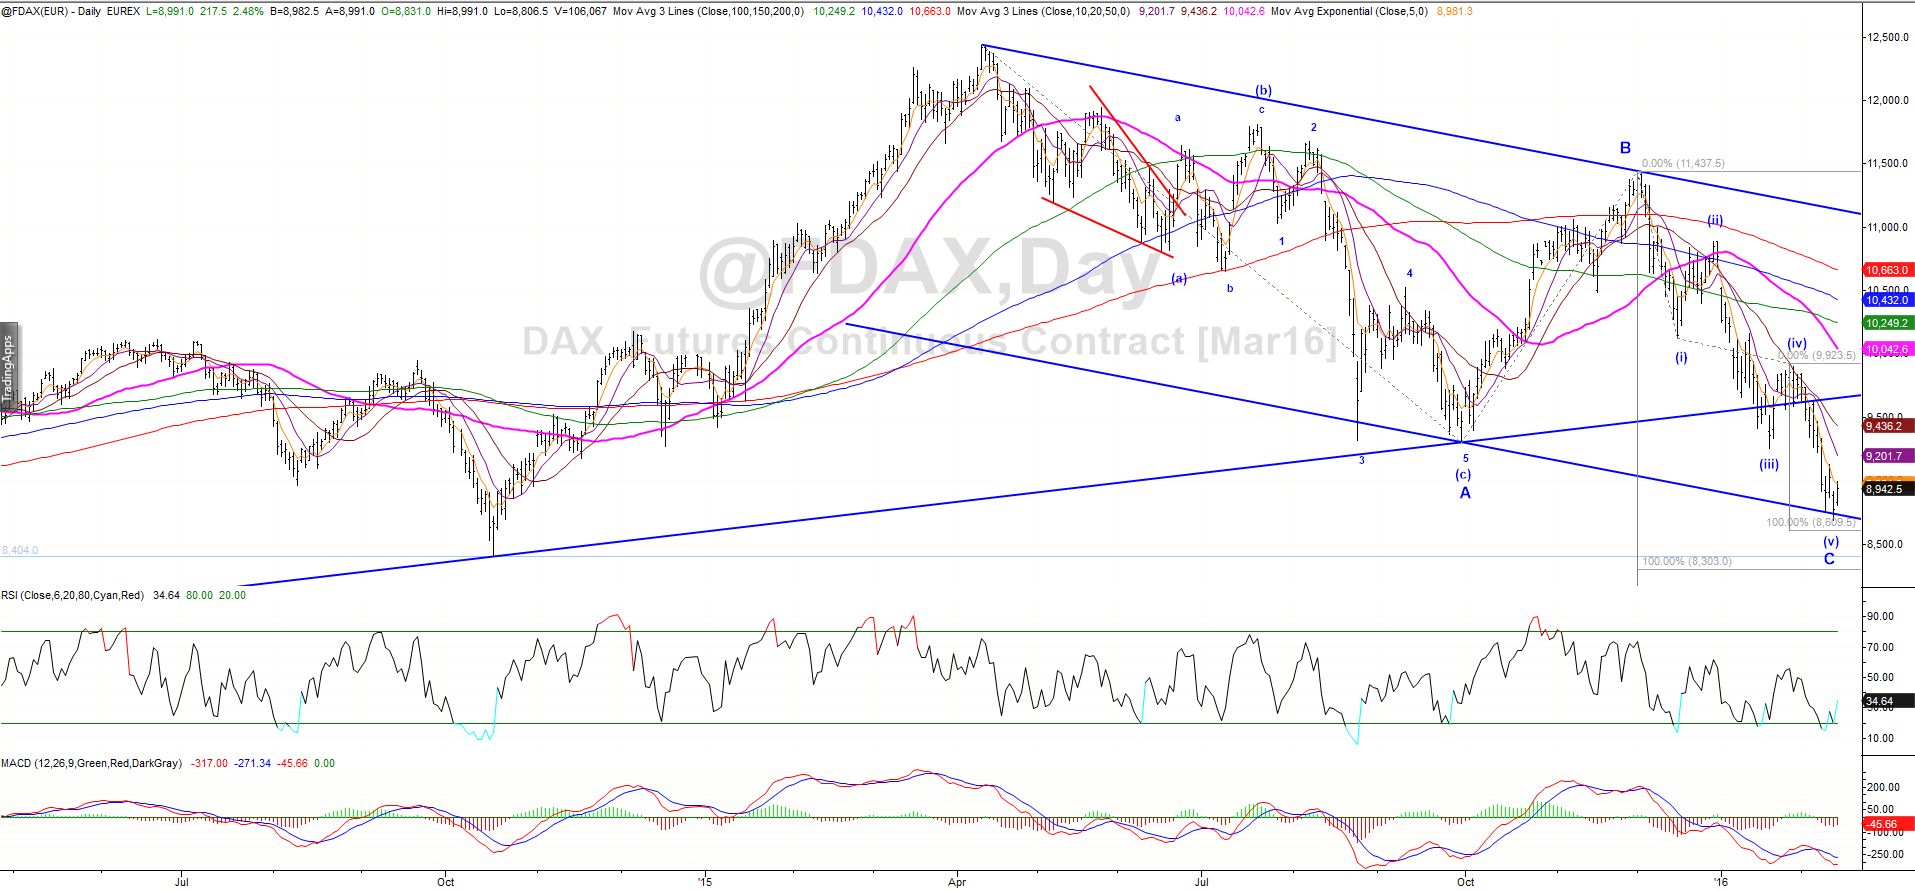
We are looking for the DAX to complete its multi-year rally in 2018. The DAX appears to have completed wave (3) of (5) and we should now be in wave (4) of larger degree. I would like to see a deeper correction in price and time before the next wave higher for (5). There is a confluence of strong support in the 12650 area with Fib, trend and 200 day sma intersecting. A break of this likely sees 12000.

DAX Daily
Last week we got the near term decline we were looking for but short of downside targets. Bears need downside follow through and keep the DAX below 13000 to maintain bearish momentum or risk another rip higher to retest the cycle highs forming a more complex correction.
DAX H4
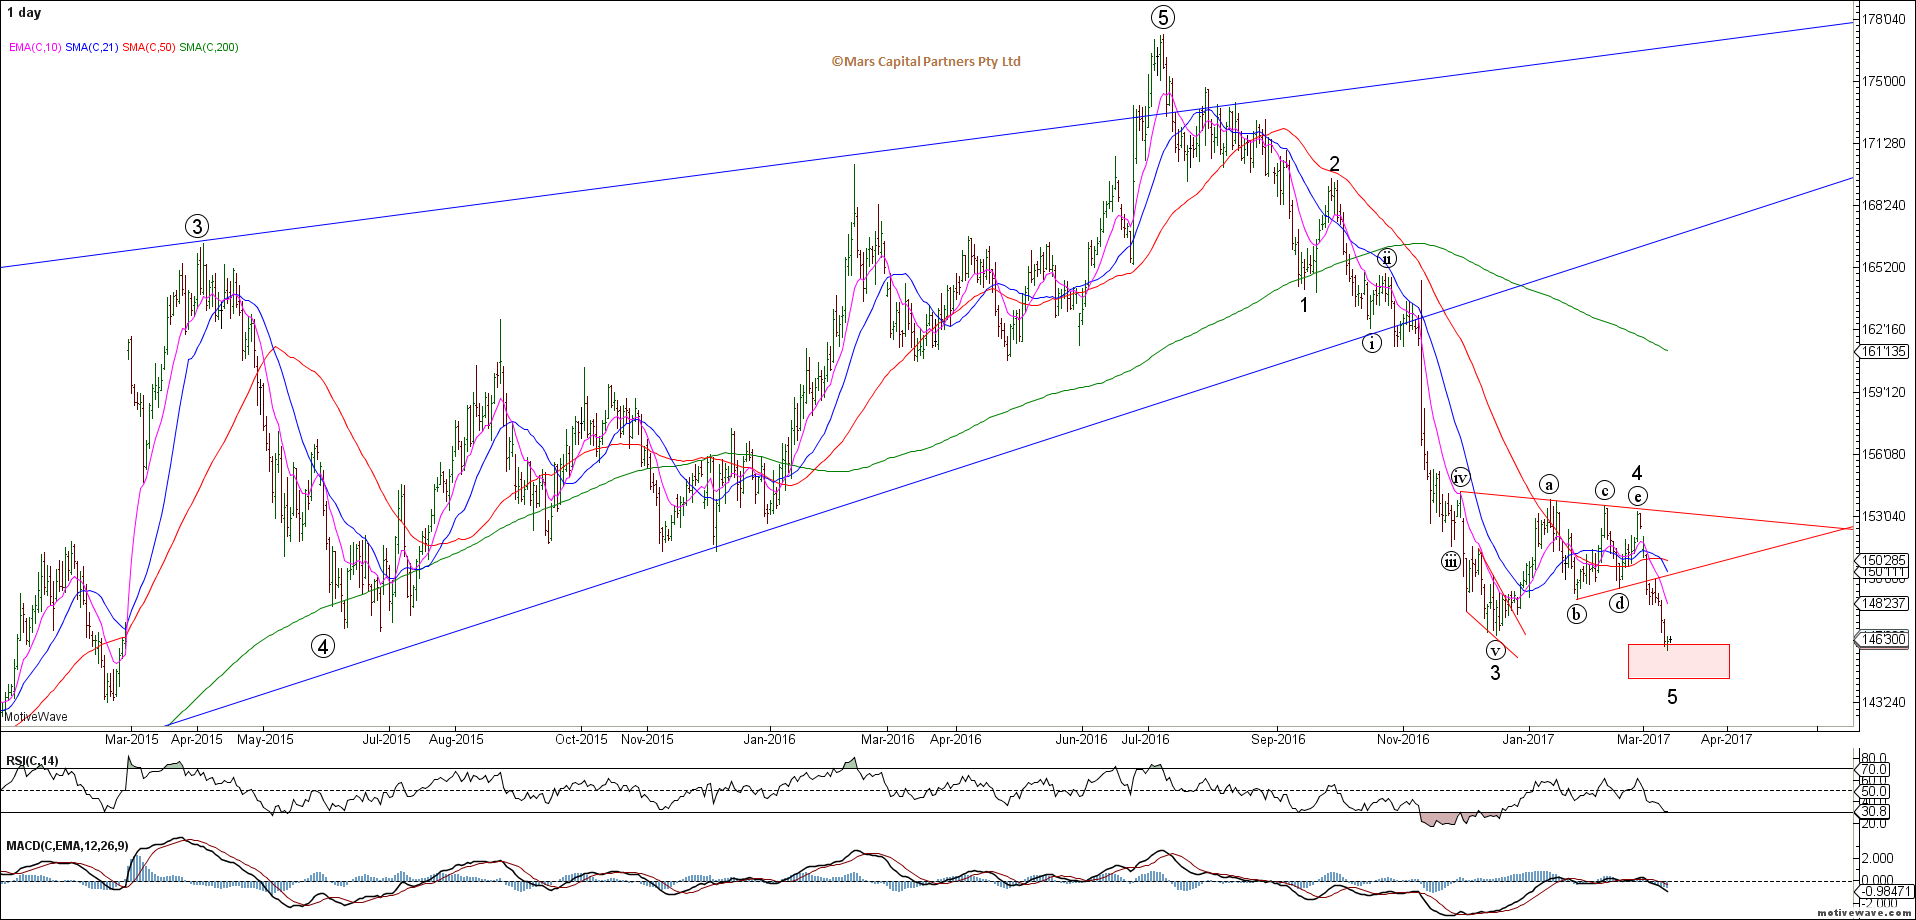
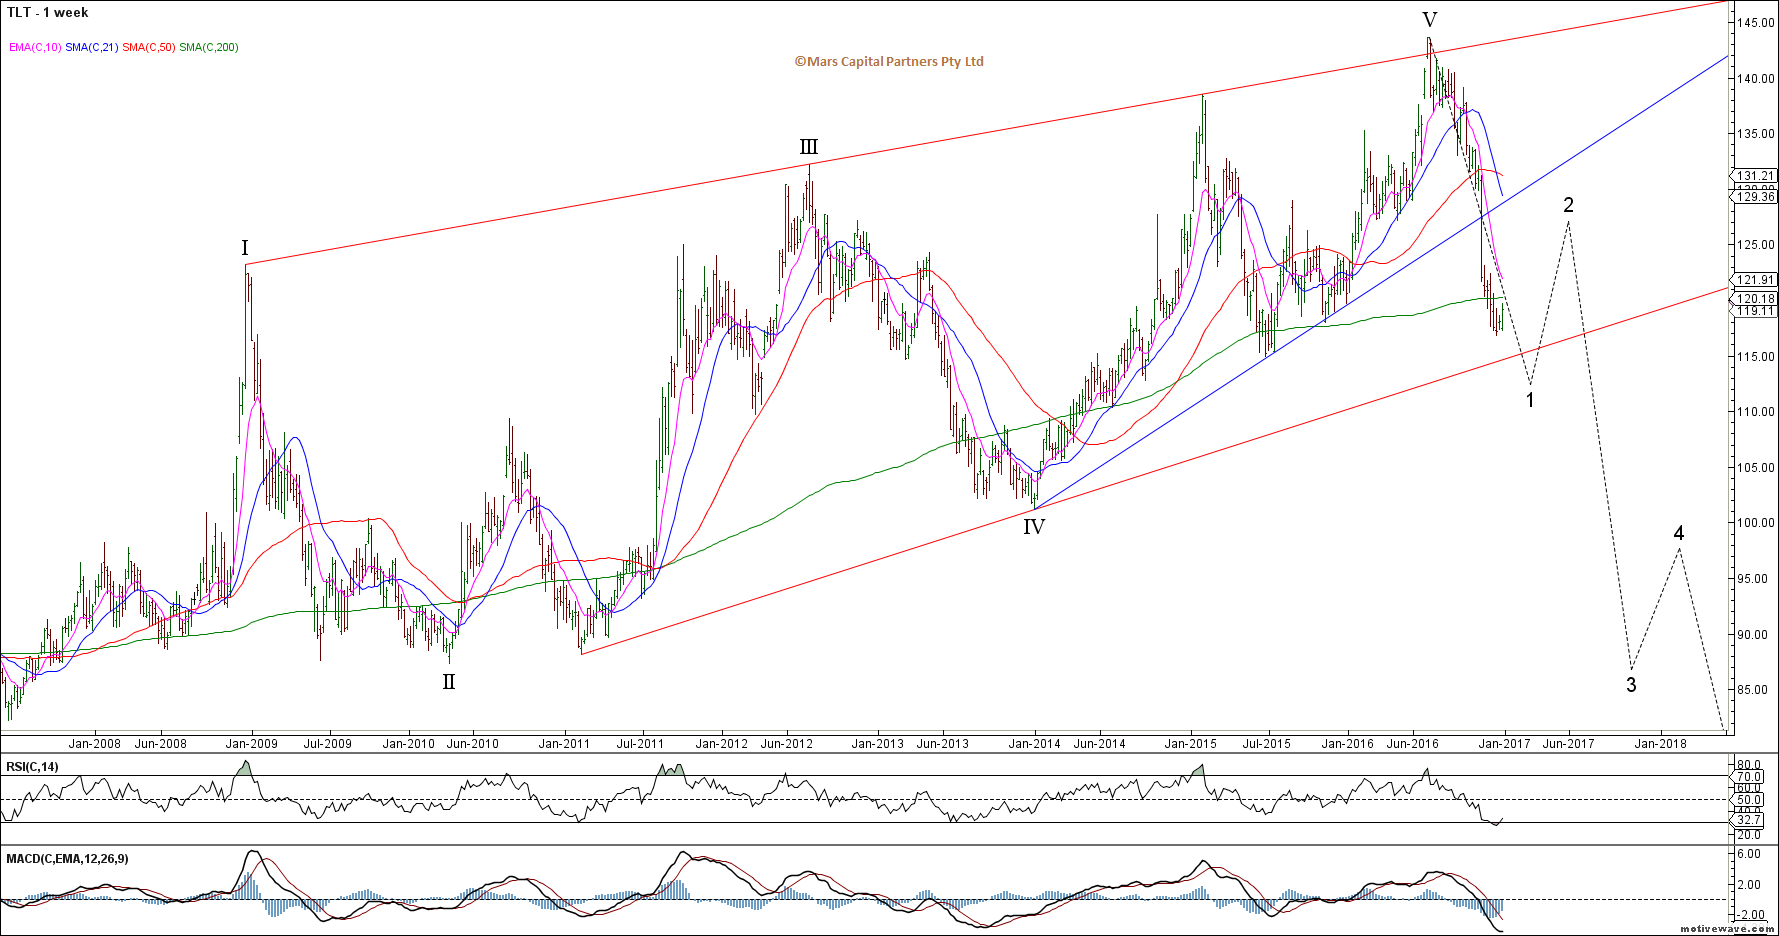
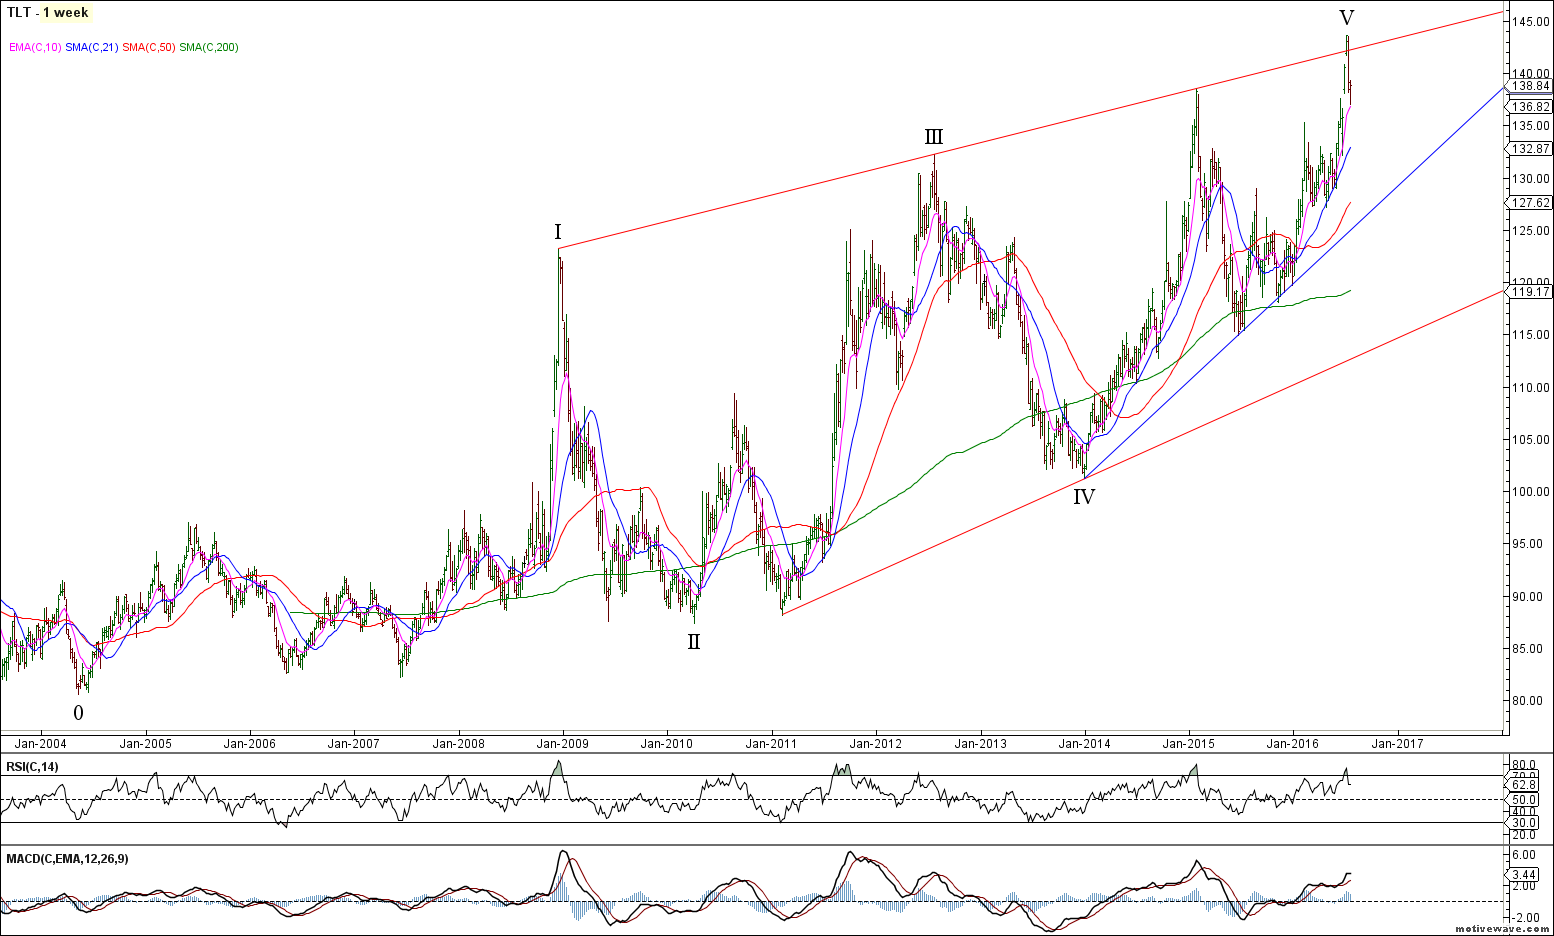
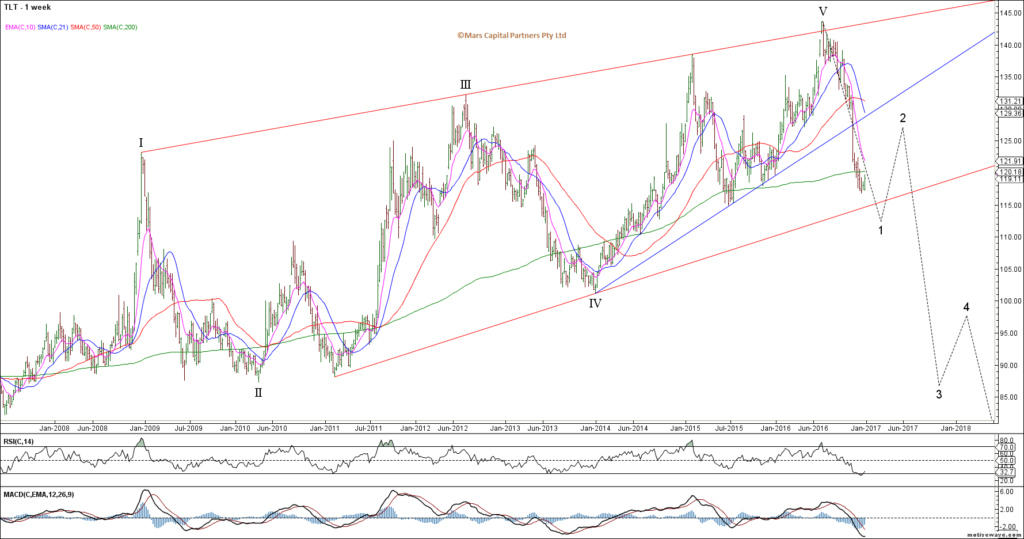
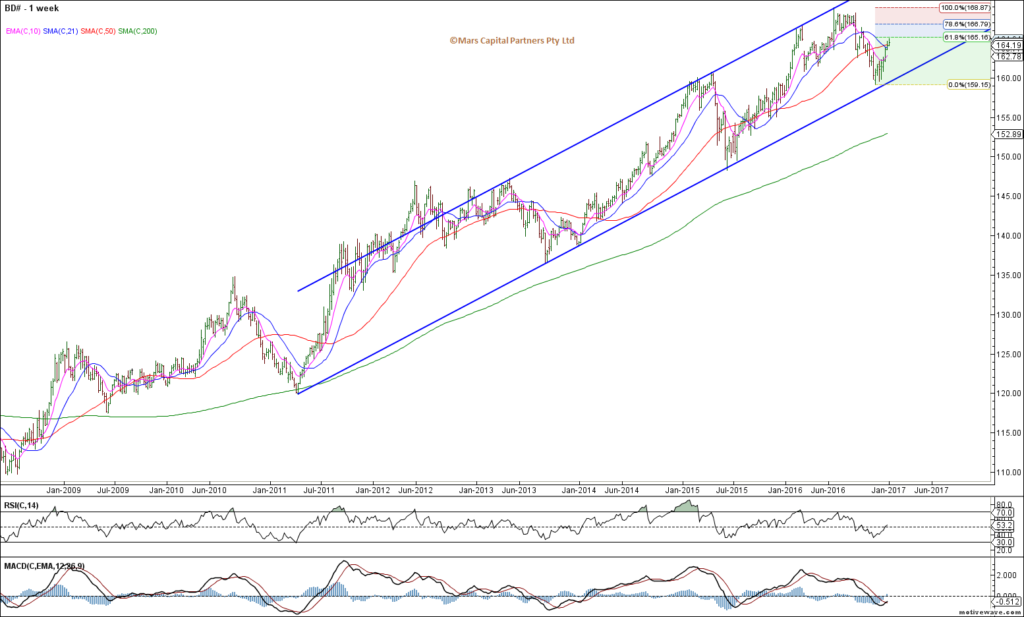
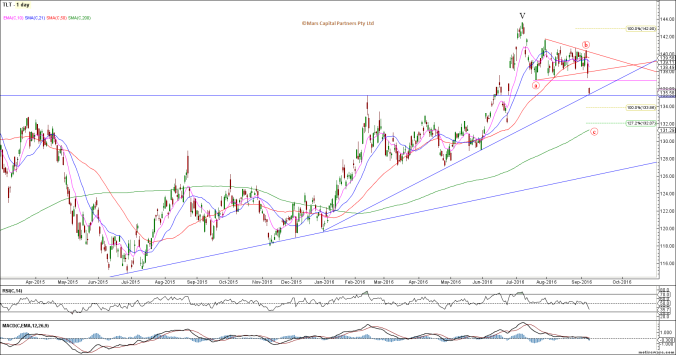
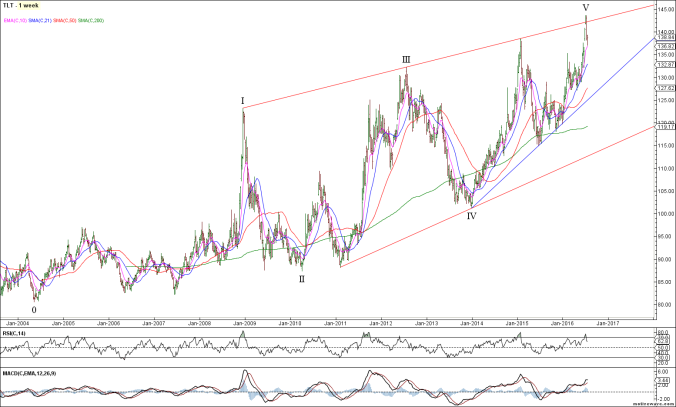
To the Bond markets and as predicted in our 2017 year ahead review, we saw a wave 2 corrective rally develop throughout the year. We remain bearish from a bigger picture perspective as our base case is that rates bottomed in July 2016. We are looking for much higher rates later in 2018 (bearish bonds). The TLT chart shows the clear impulsive decline from the July 2016 highs – next we can see an overlapping corrective wave structure that either ended at the September highs or another push higher towards 133 as per the red count. We also have a potential H&S top formation with a neckline break below 122.00 likely to lead to an accelerated decline towards 117 and potentially much lower. In the meantime we are just range racing between 122 and 130.
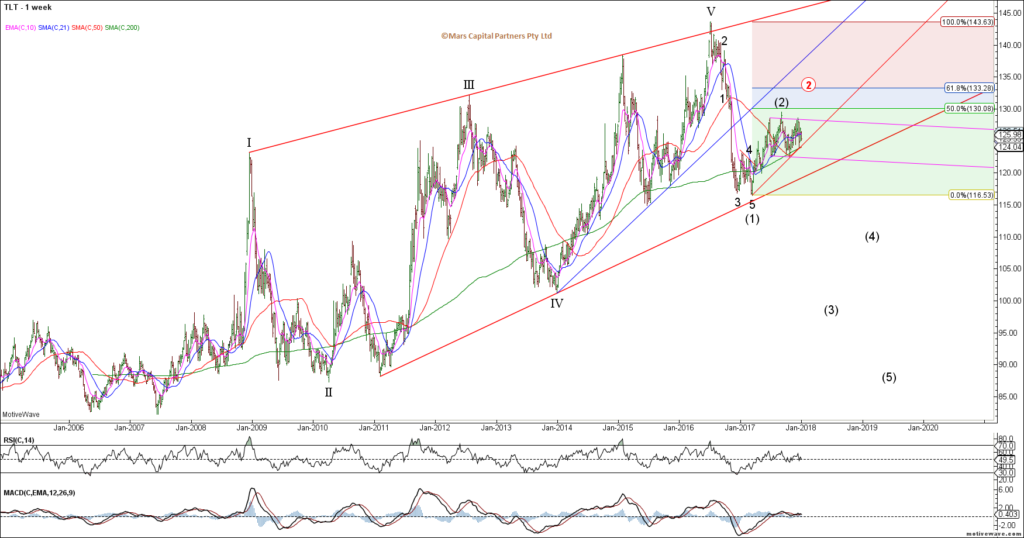
TLT Weekly
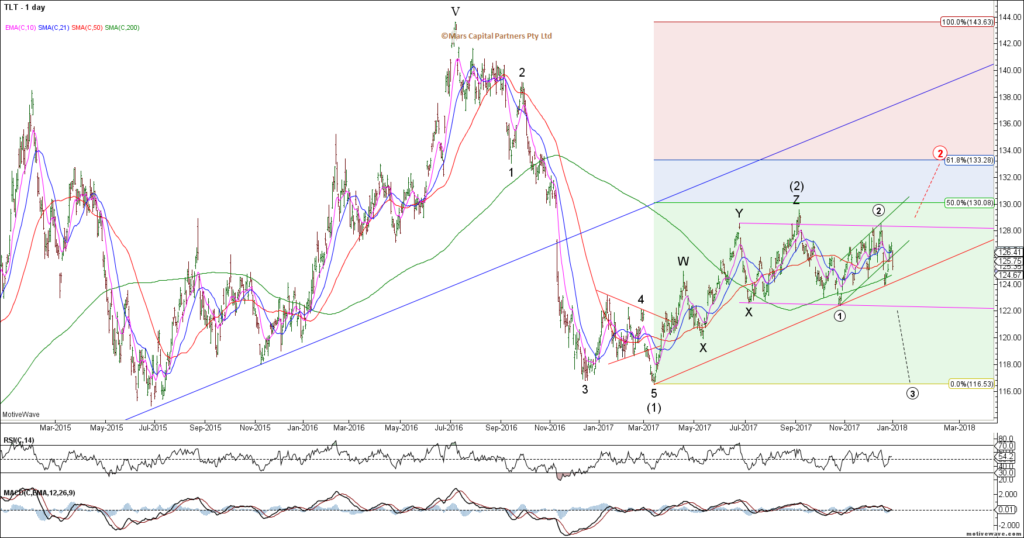
TLT Daily
The US 30yr chart looks less clear from a near term perspective although the bigger picture theme remains (bearish). I was looking for a push higher towards the 155’00 area to establish new shorts which would help clear up the structure and give us a cleaner count.

ZB Daily

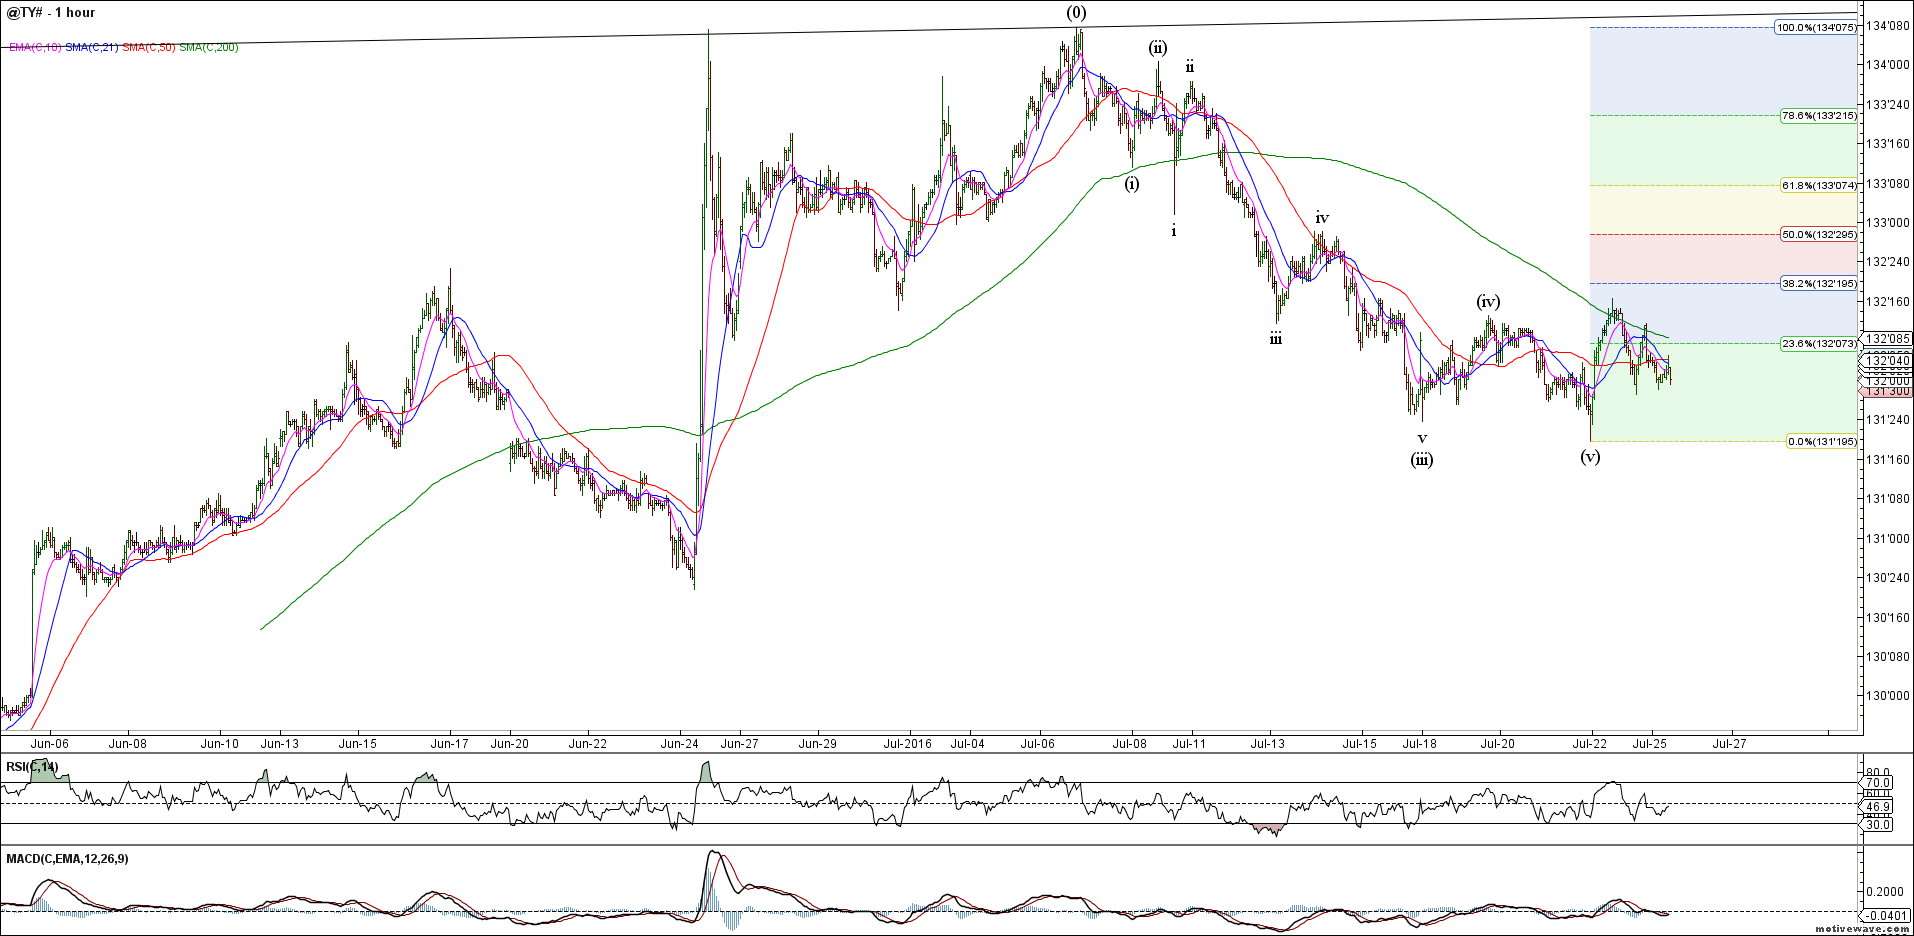
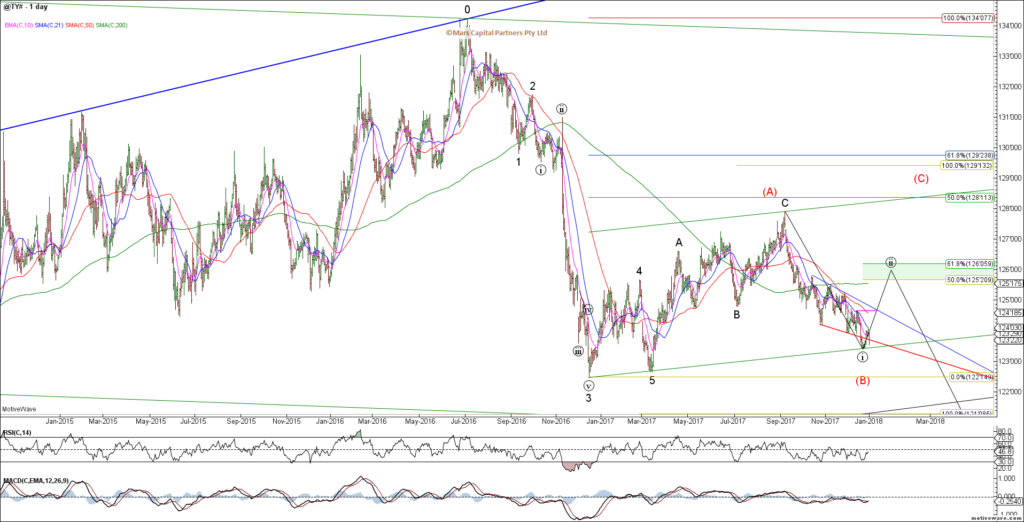
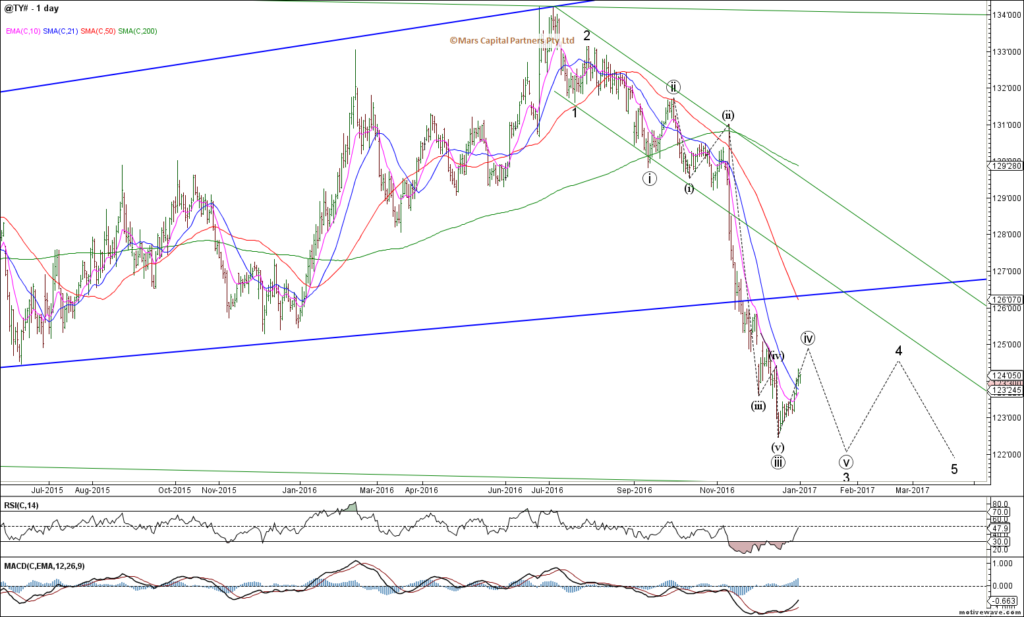
The TY looks less clear as the decline from the September highs does not look particularly impulsive. Expect strong support in the 122-123 area. Bigger picture we remain bearish but I am reluctant to short into strong support here. I’d rather be short from higher levels.
TY Daily
From a near term perspective, the decline is NOT a clear impulse although it can always extend lower. Looks to me that it is wedging into a low and I’d watch the near term red trendlines for guides. Maybe this red count below? Wary of a near term bounce from this support area previously highlighted.
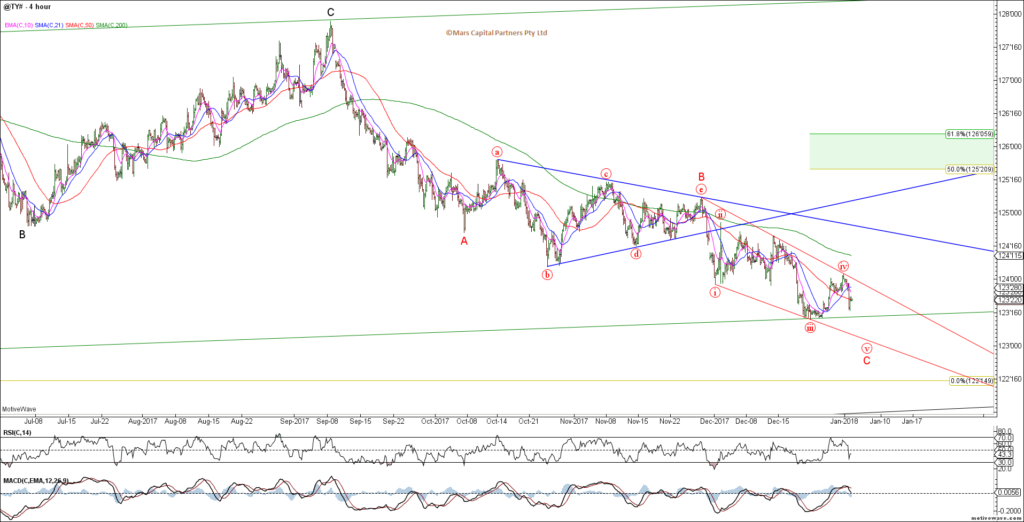
TY H4
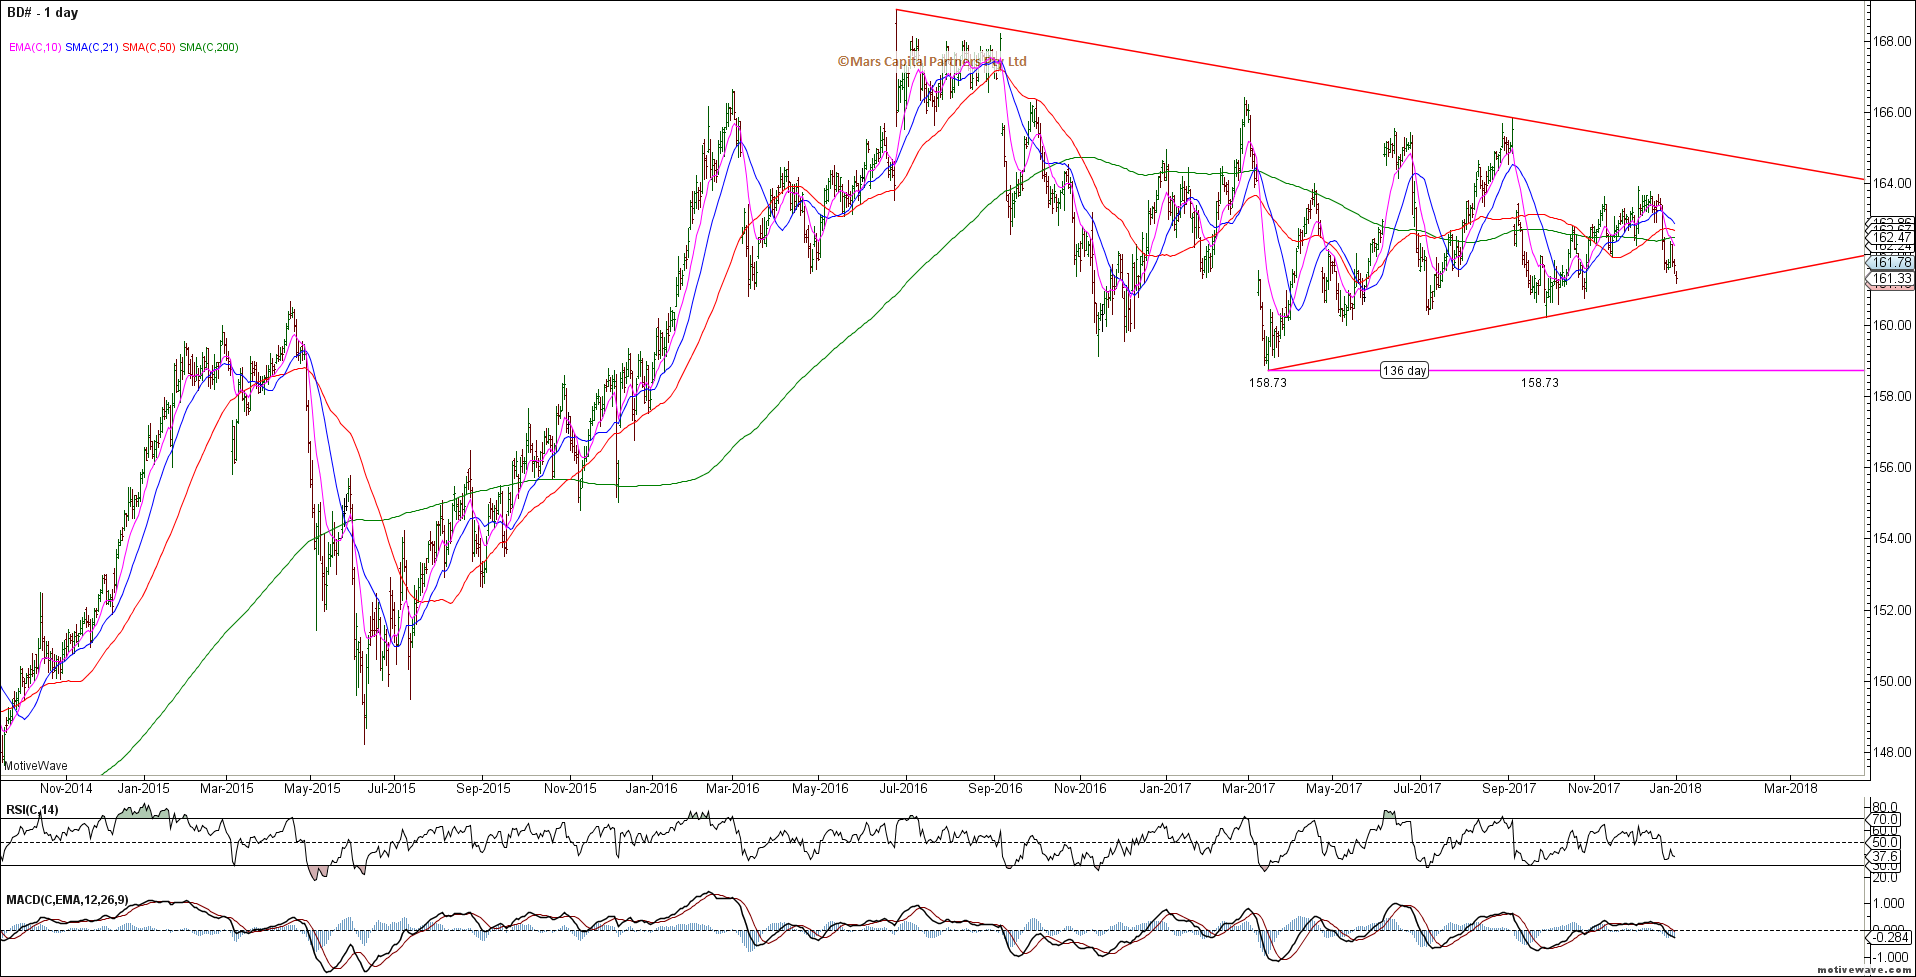
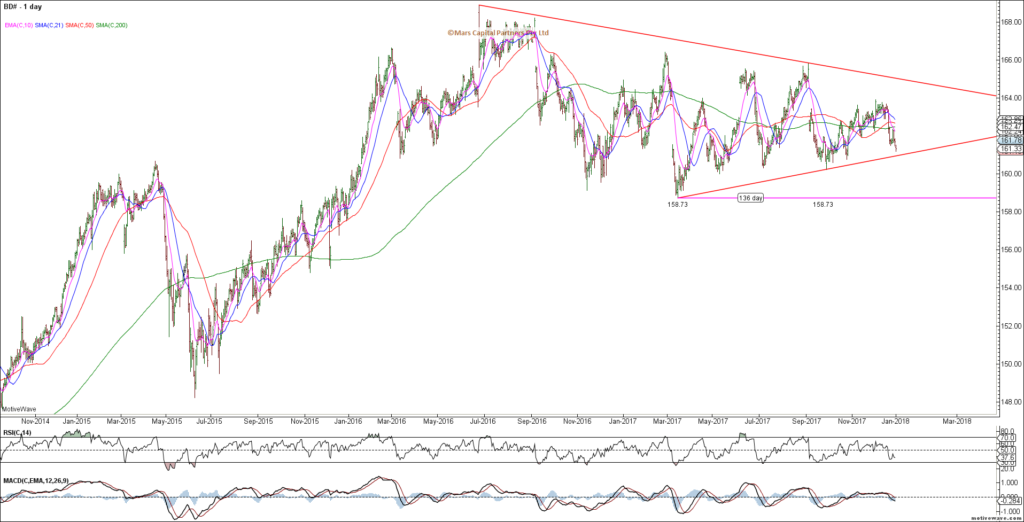
The German Bund is less clear and appears to be trapped within a larger triangle – merely range racing for the last 18 months. I have no strong view on the Bund as triangles can break either way. 158.73 is critical support.
Bund Daily
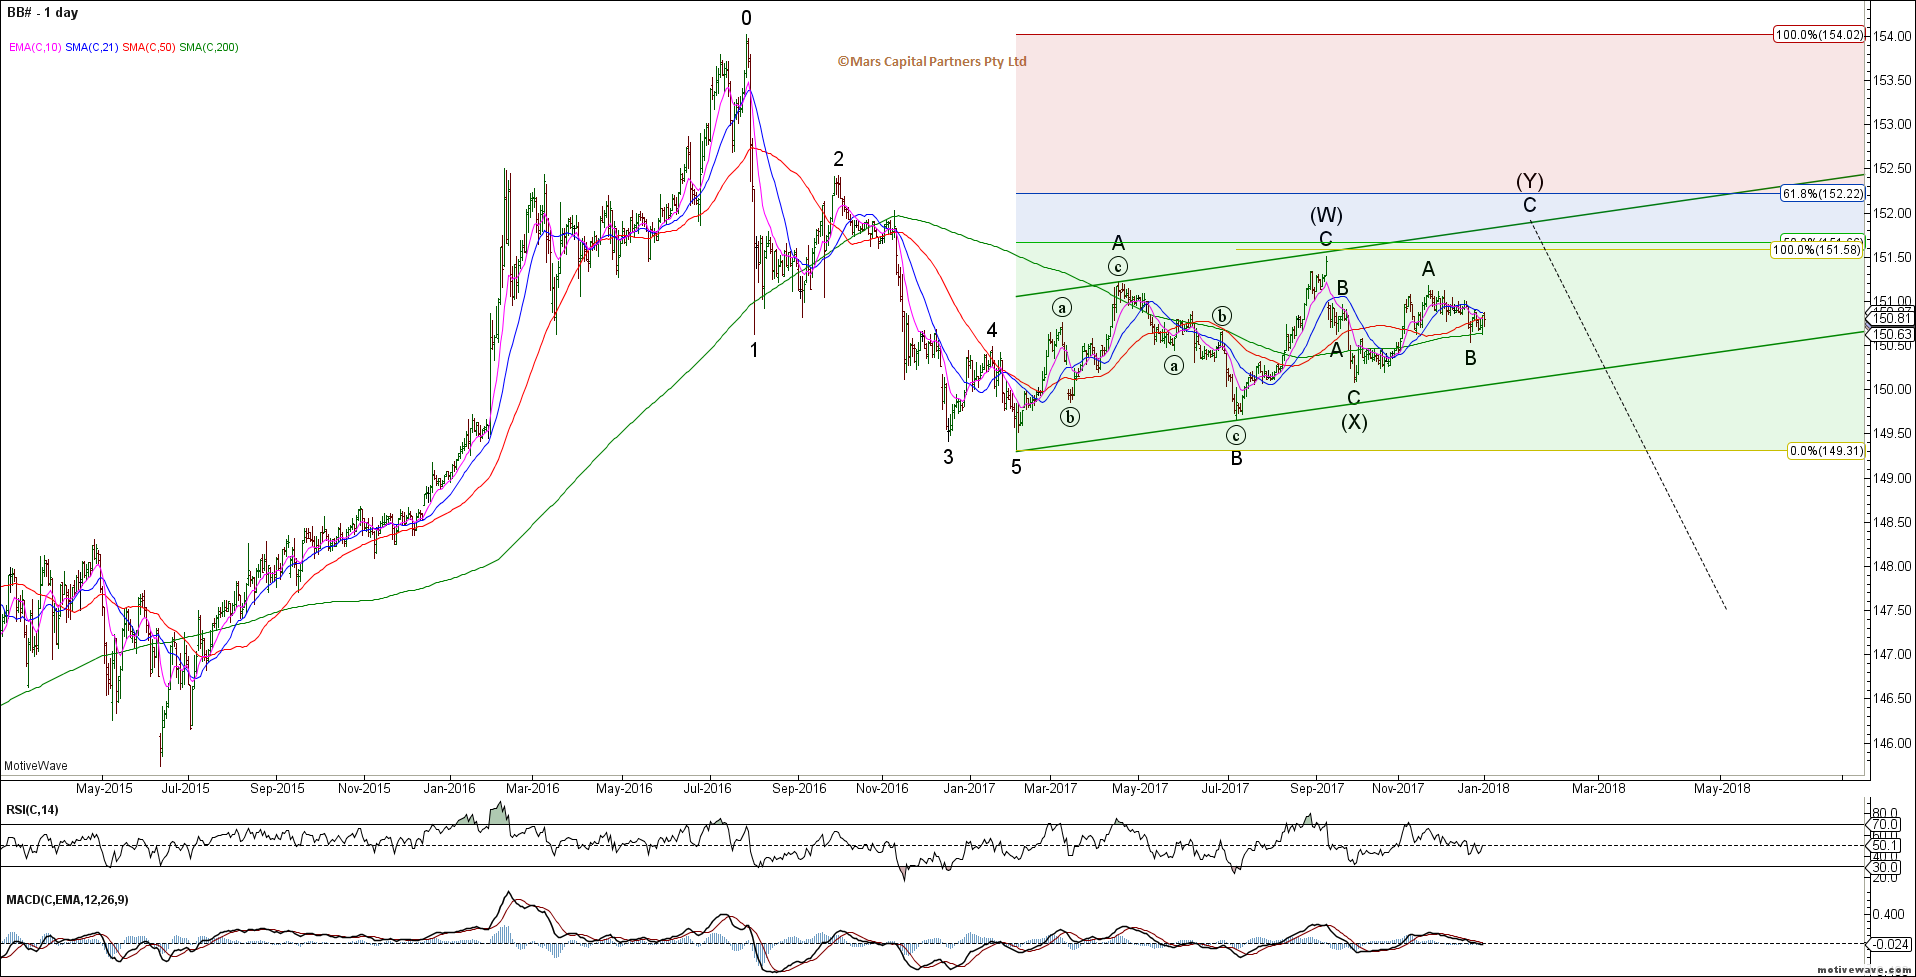
The Japanese JGB also appears range bound within a corrective channel consistent with the BOJ’s bond buying program – the structure looks like it needs higher towards 152 before the bears have a chance to potentially reverse this trend.

JGB Daily
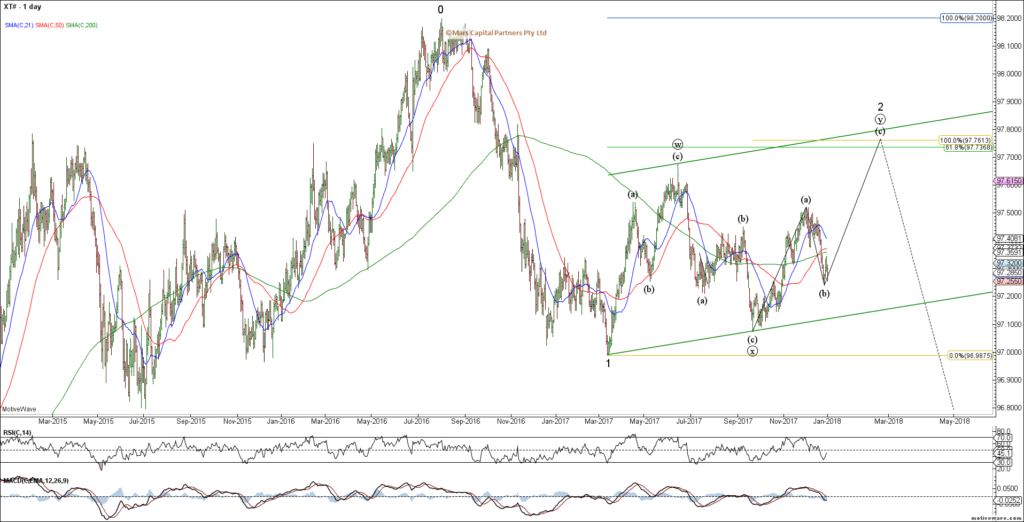
The Aussie 10yr Bonds also looks like they need higher towards 97.75 setting up a bigger picture H&S (double right shoulder) before the bear trend can resume.
AUS10yr Daily
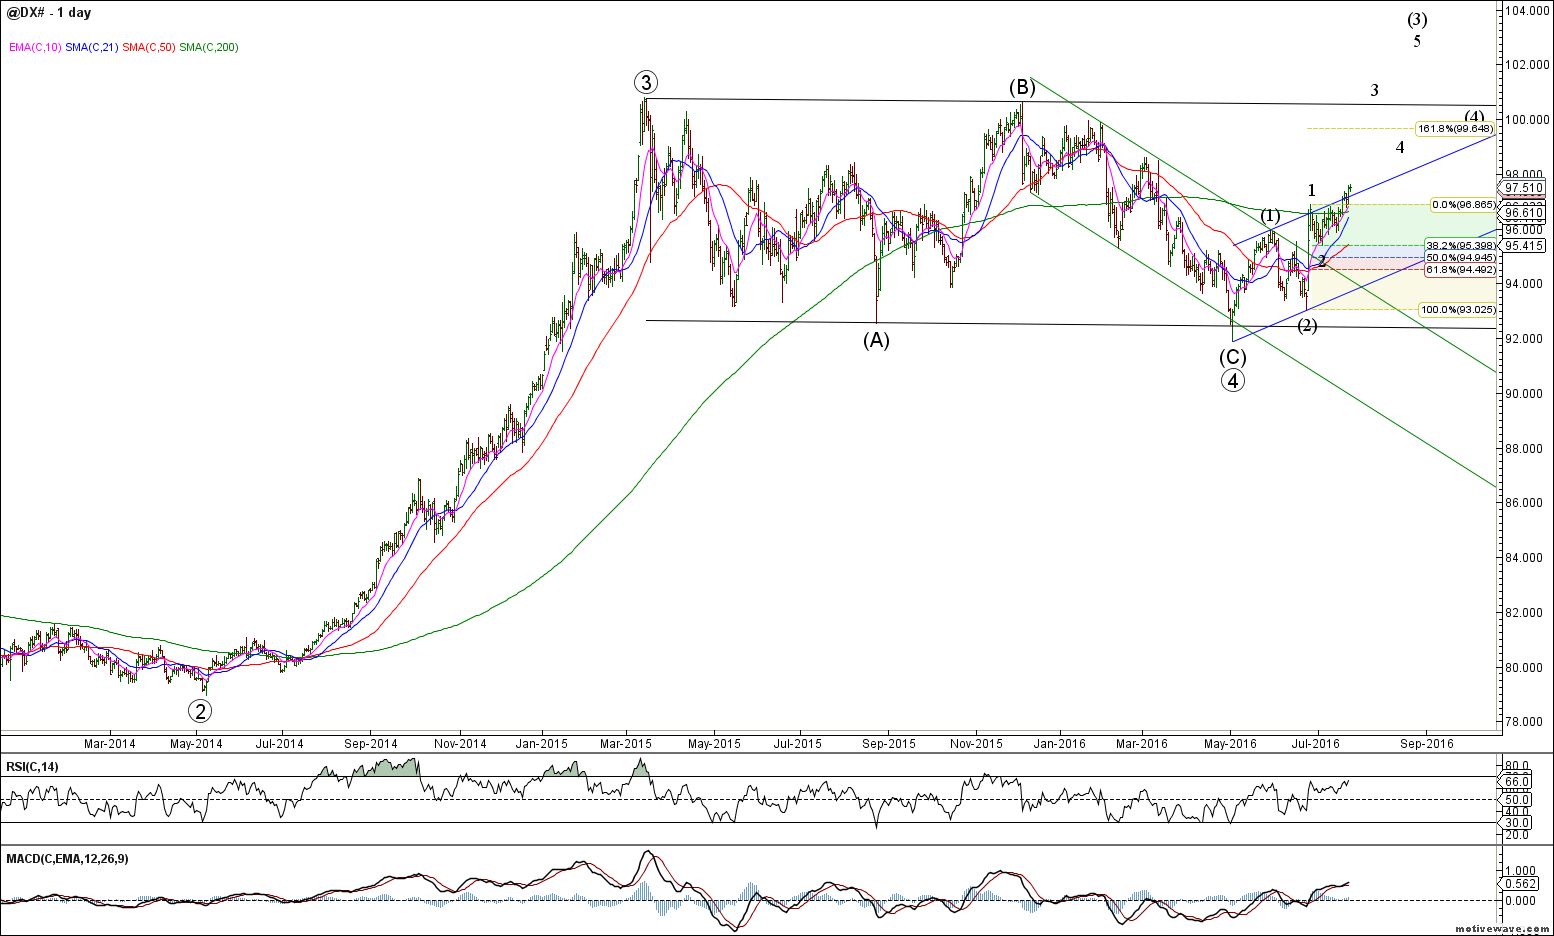
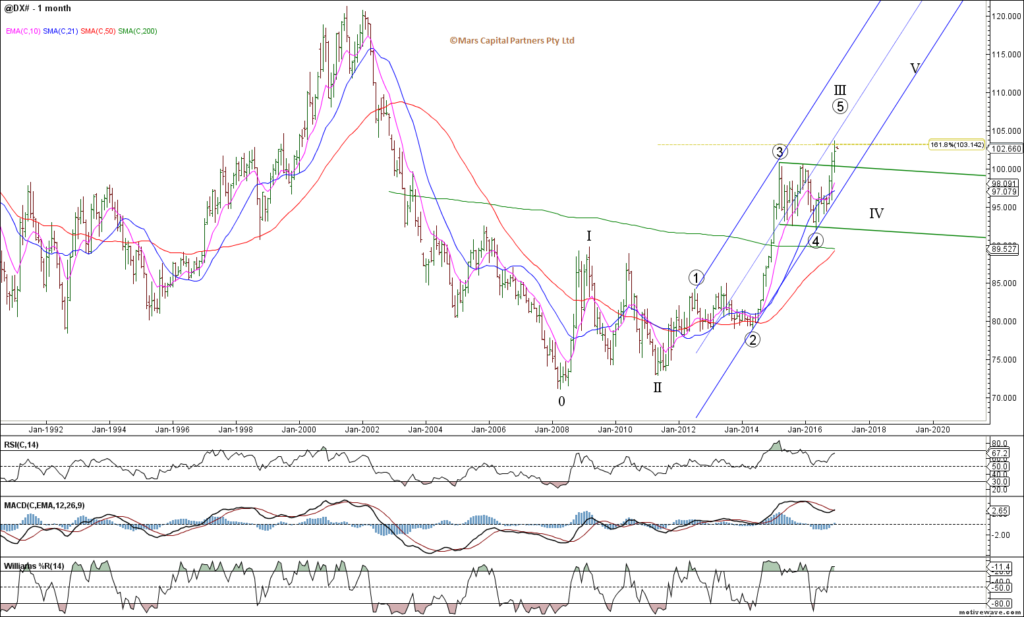
To the FX markets and after declining throughout 2017, the US$ is due for a strong bullish turn in early 2018 once 5 waves down is complete from the January 2017 highs. The world is universally bearish the US$ now which is the ideal time to look for a turn. We should expect this decline to terminate in the 90.00 area for the DXY. Our anticipated bullish US$ turn will have important implications for the commodity complex which we expect to turn bearish in 2018.
DX Weekly
We need to see a complete 5 waves down to new marginal cycle lows in the 89.50-90.50 area before we can turn bullish the US$ as shown below.

DX Daily
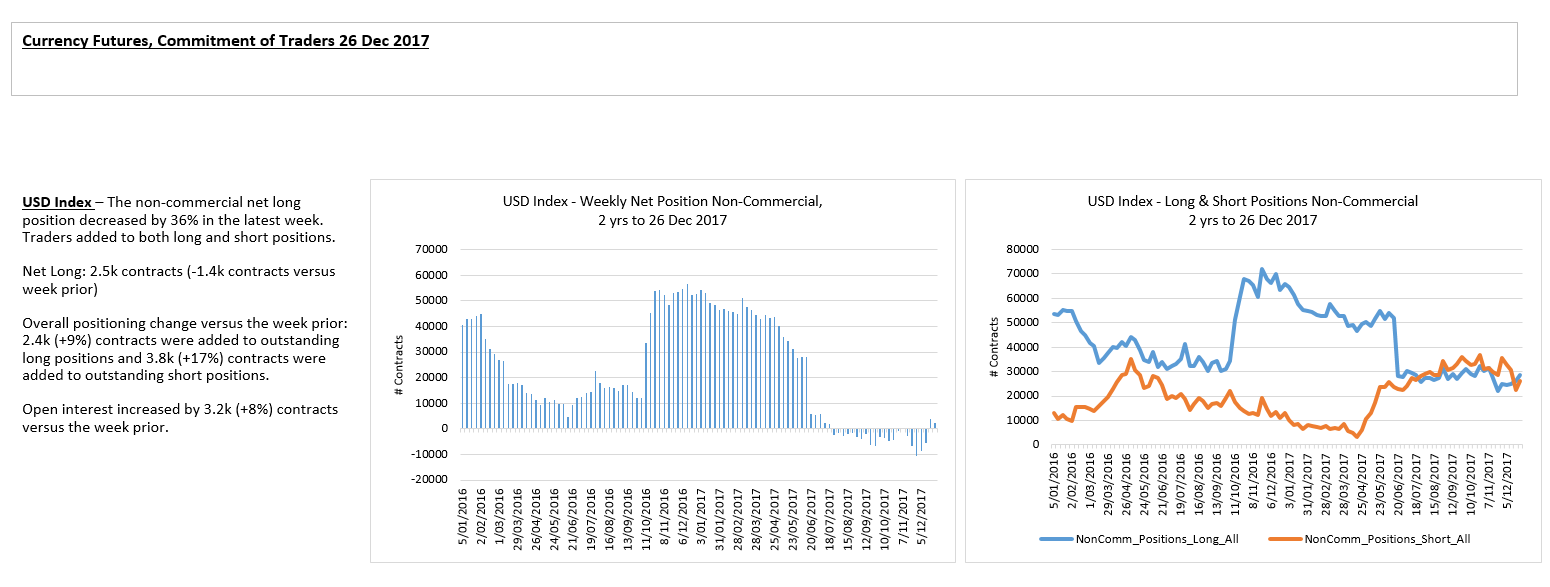
DXY traders remain flat for the last 6 months.

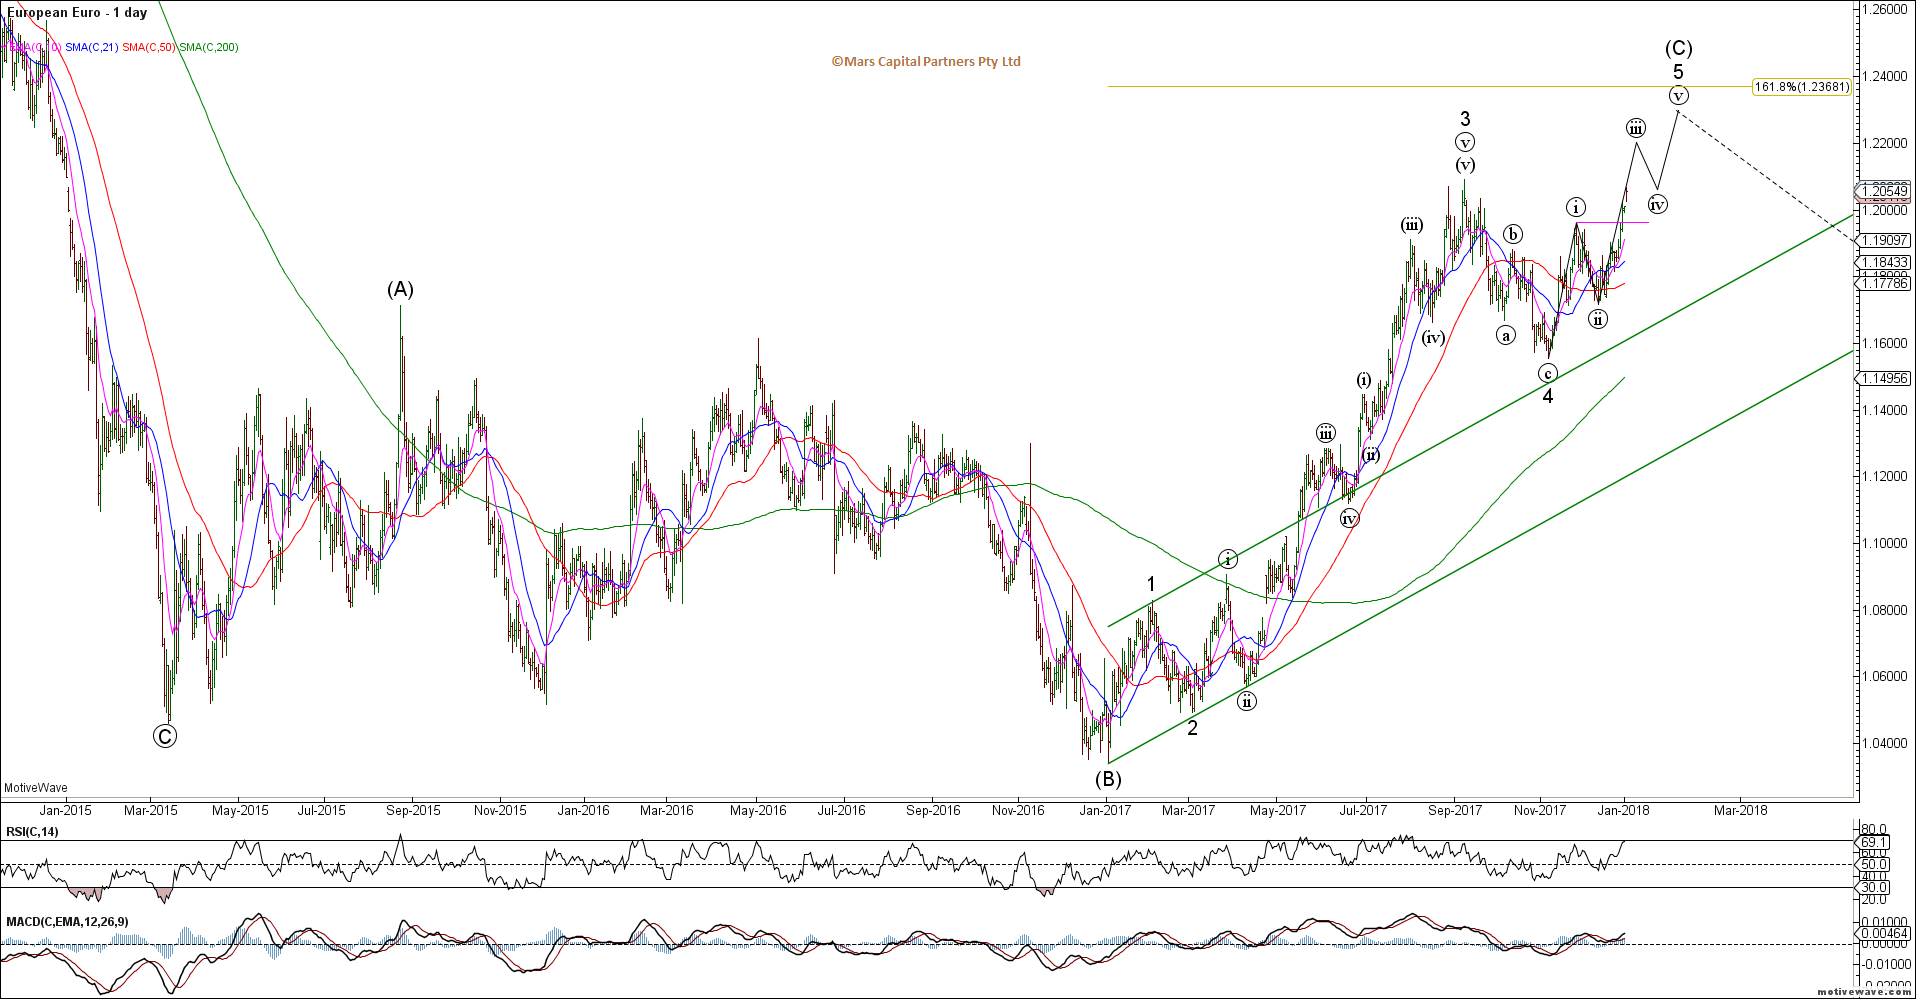
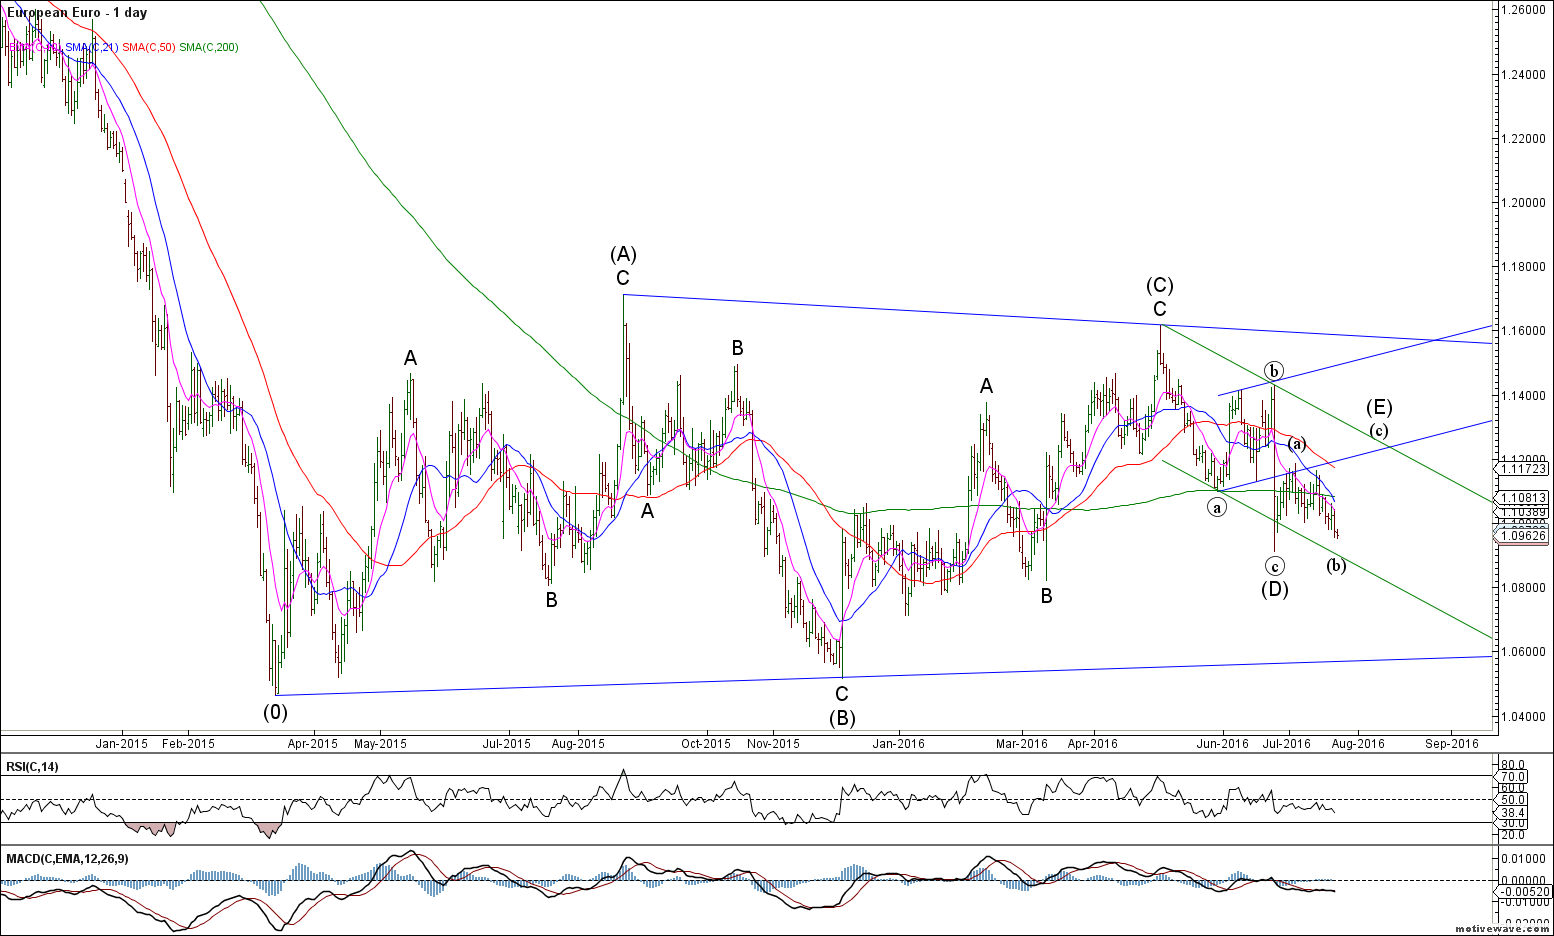
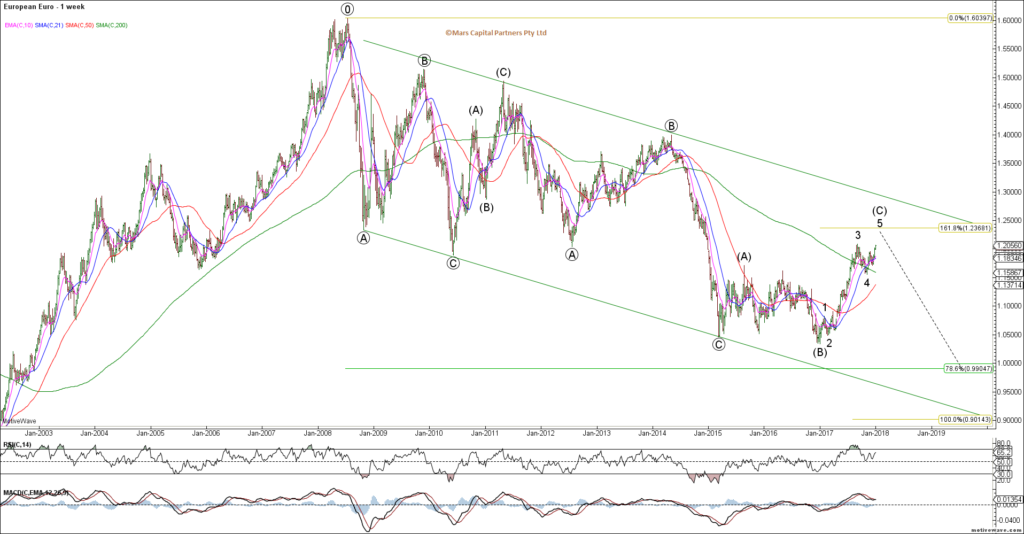
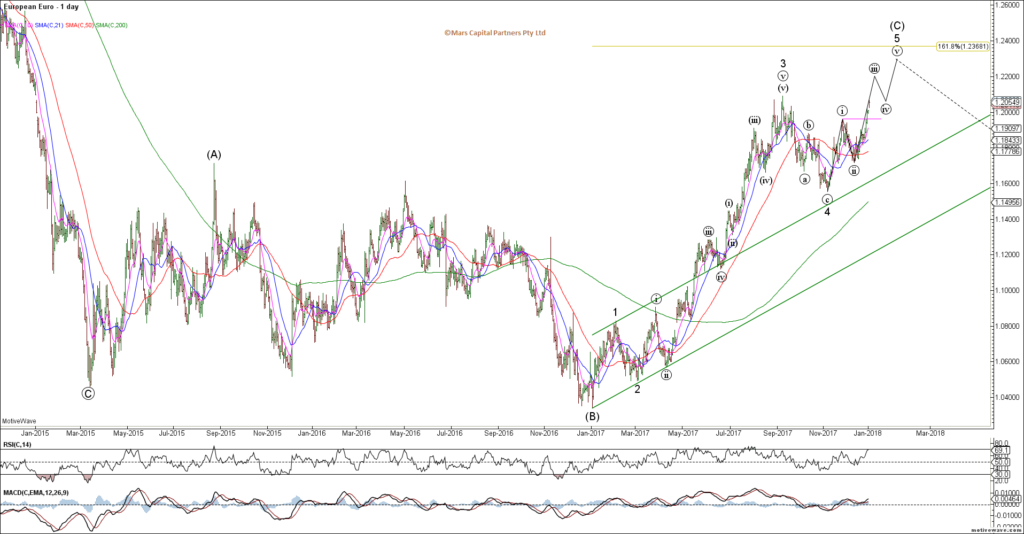
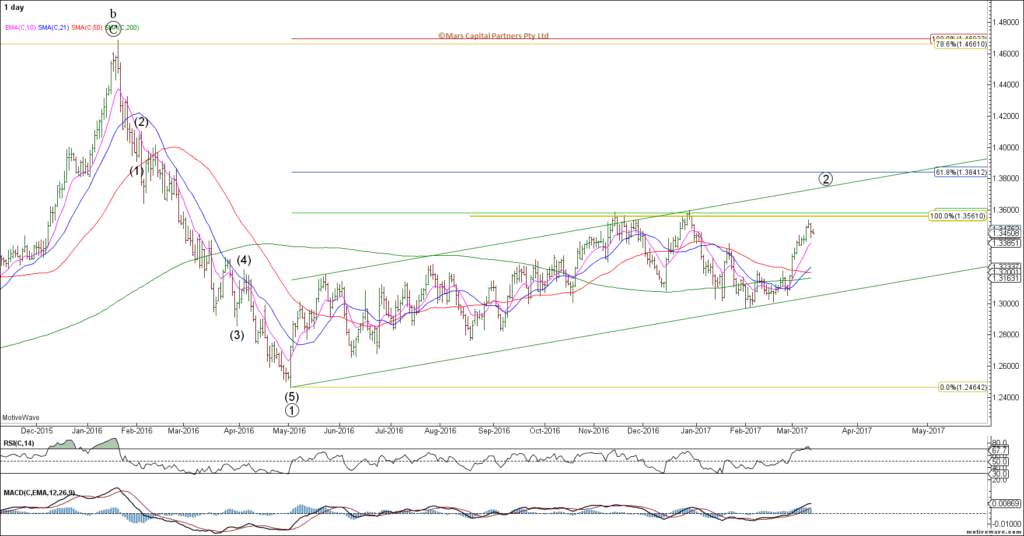
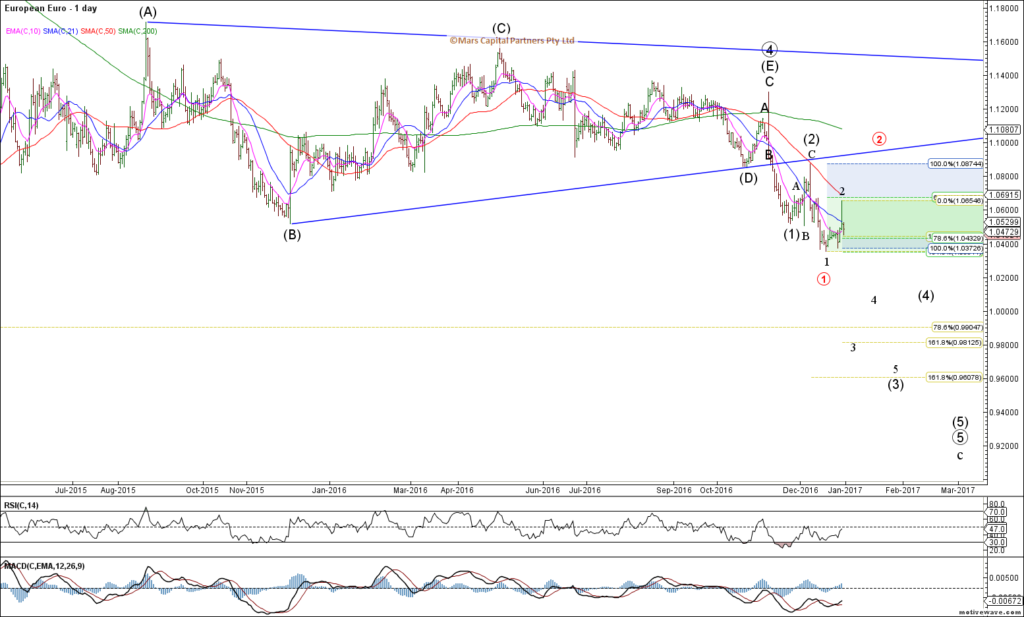
Like the DXY, we are looking for this year long Euro rally to end in early 2018 and completely reverse as we head to new cycle lows and parity.
EURUSD Weekly
This correction in the Euro from the 2015 lows is counted as an expanded Flat (3-3-5) with wave (C) targets at 1.618x wave (A) in the 1.23-1.24 area as shown below. Upon completion of wave 5 we will be very bearish the Euro as we look towards parity for this pair.
EURUSD Daily
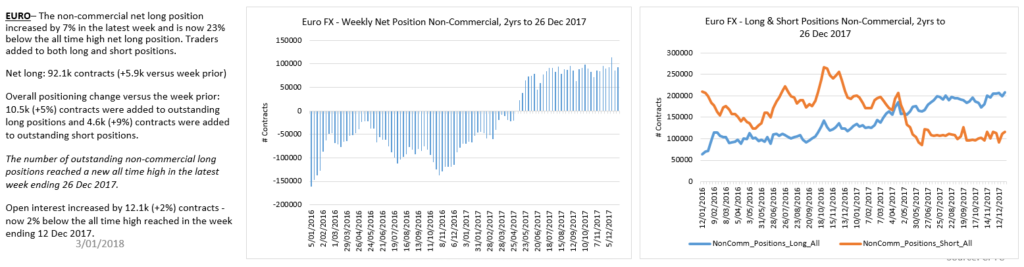
Euro traders remain long and soon to be wrong.
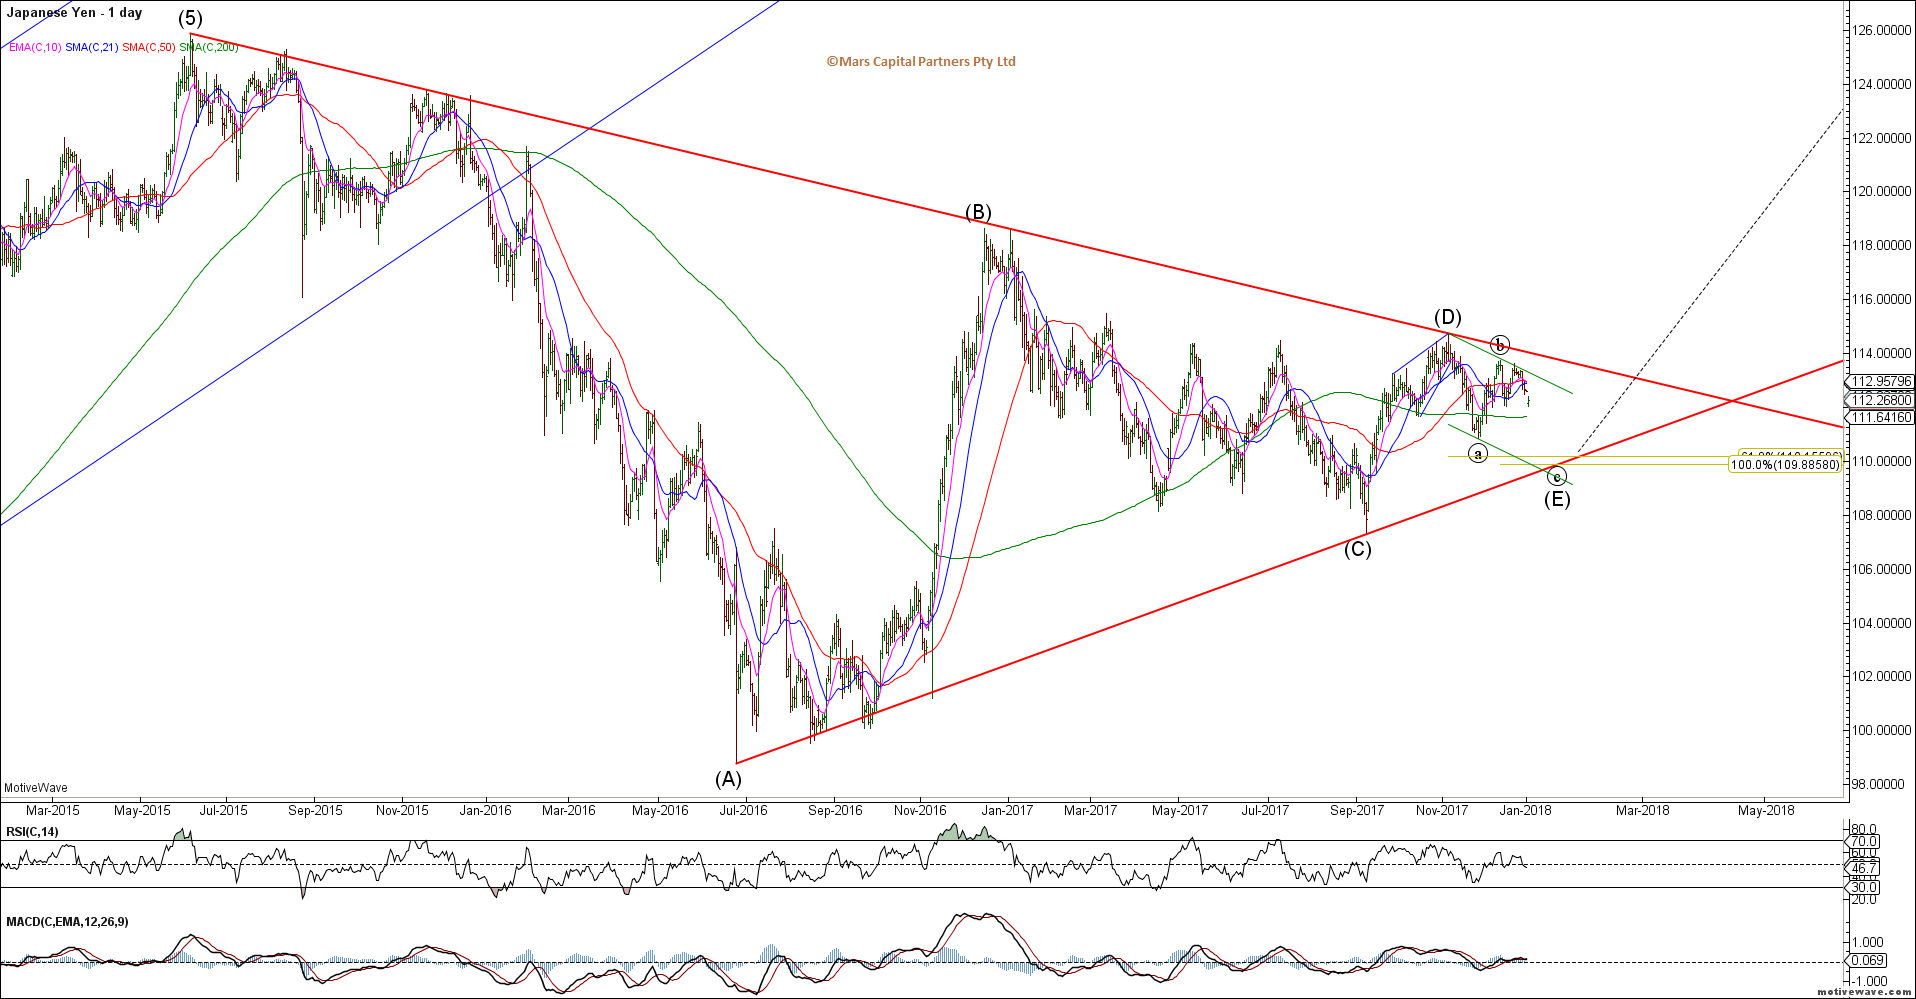
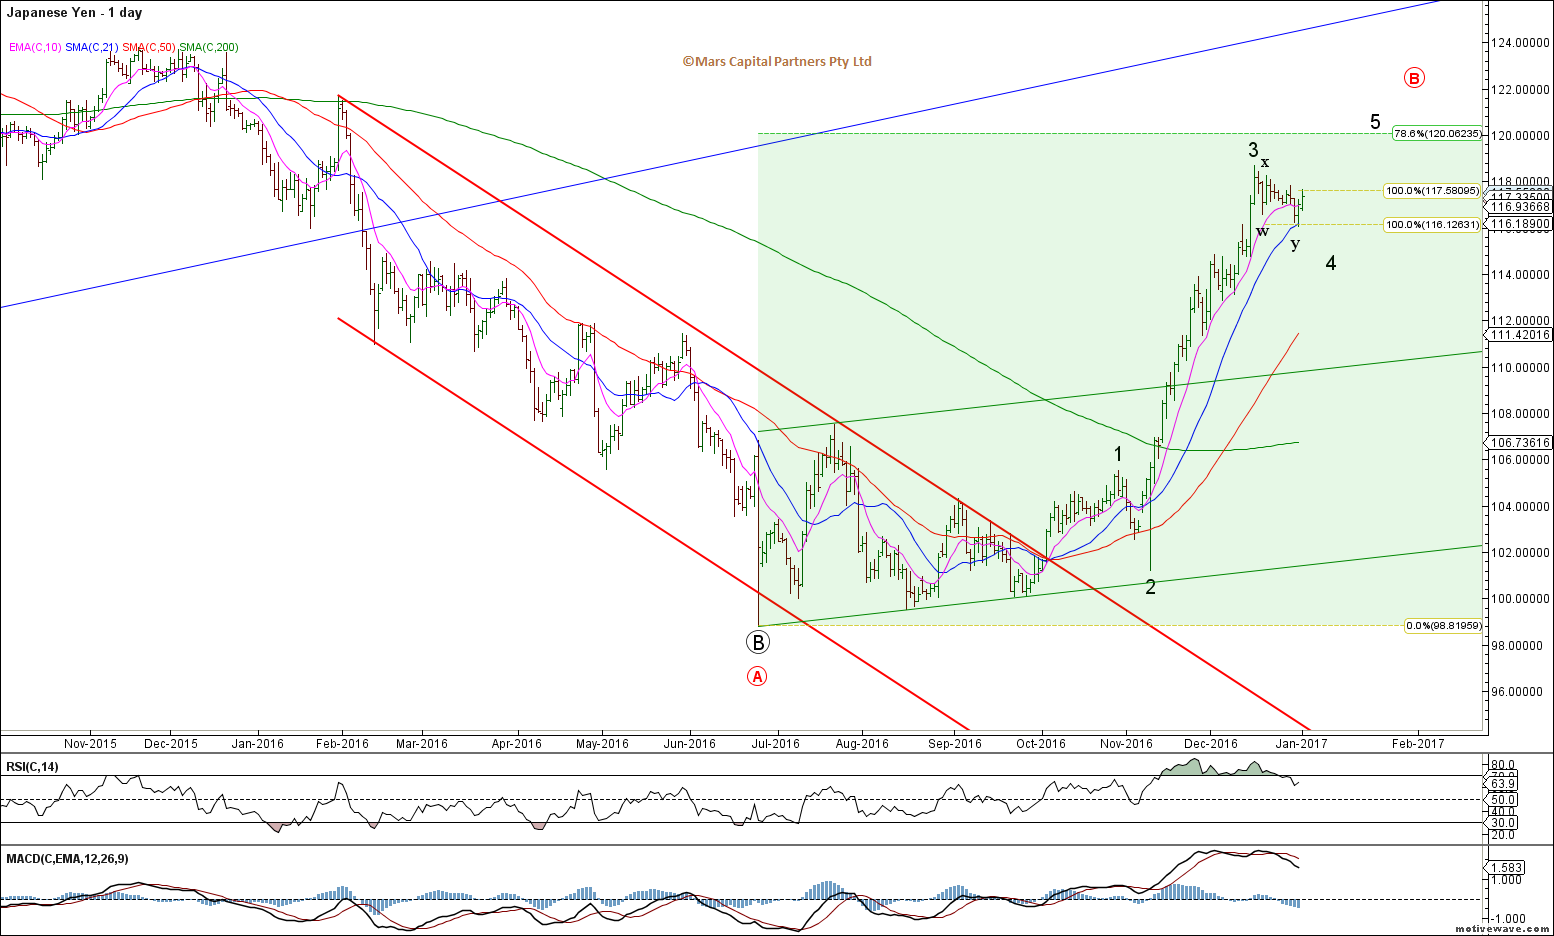
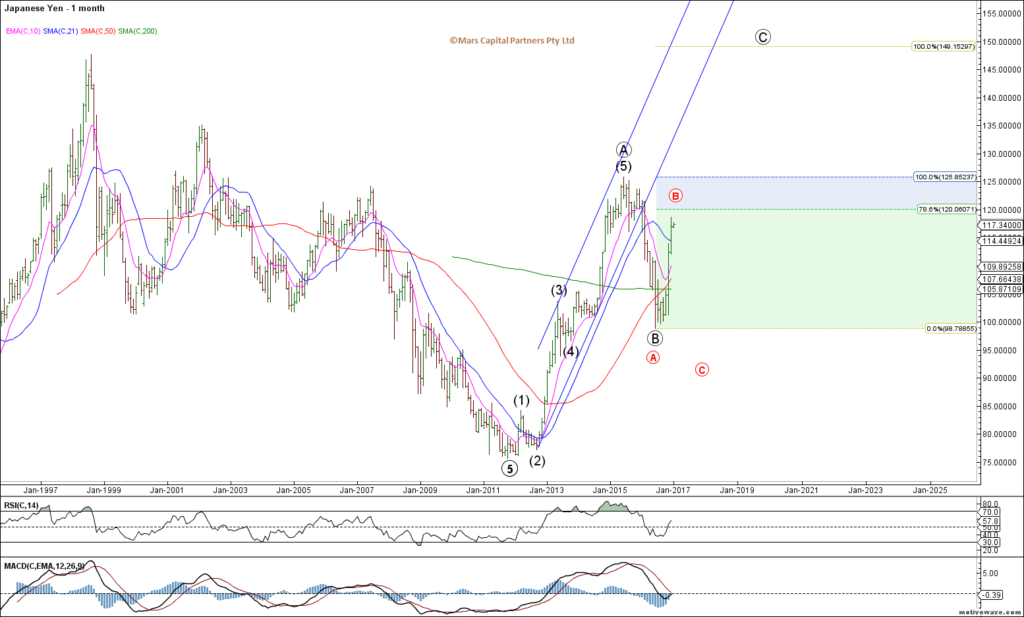
The USDJPY spend 2017 going nowhere and range racing and it is starting to look suspiciously like a bullish triangle / pennant which fits our bullish US$ theme for 2018.
USDJPY Weekly
From a near term perspective, a decline towards 110.00 Fib support would present the best buying opportunity while a decline below 107.30 opens the door towards 104.
USDJPY Daily
A decline towards 110 would help flush out some of these short Yen traders.

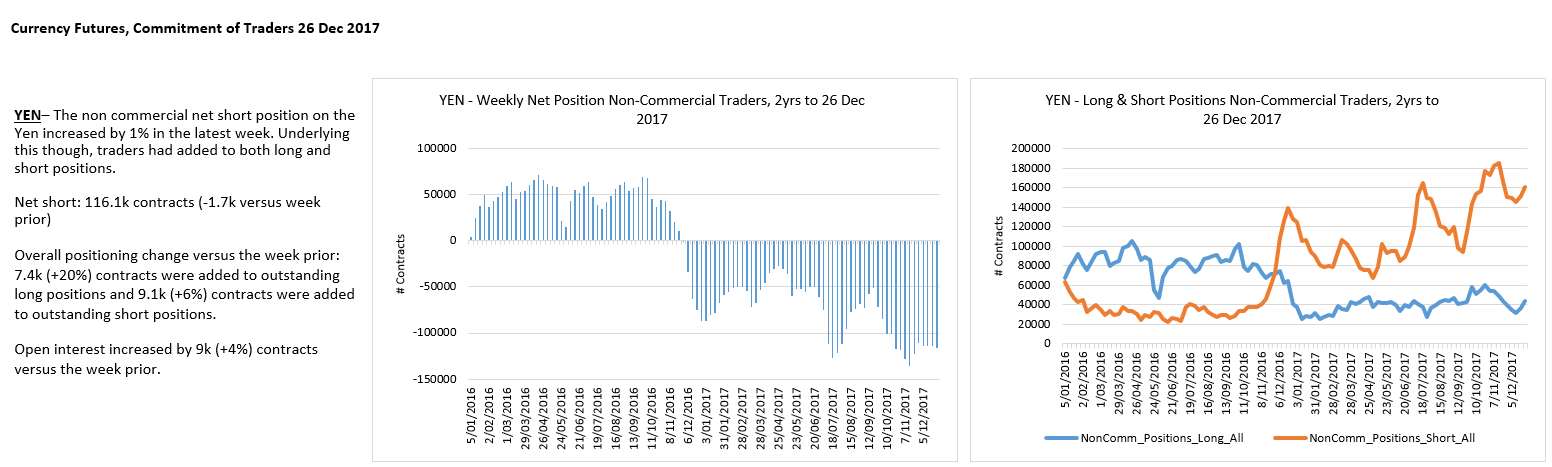
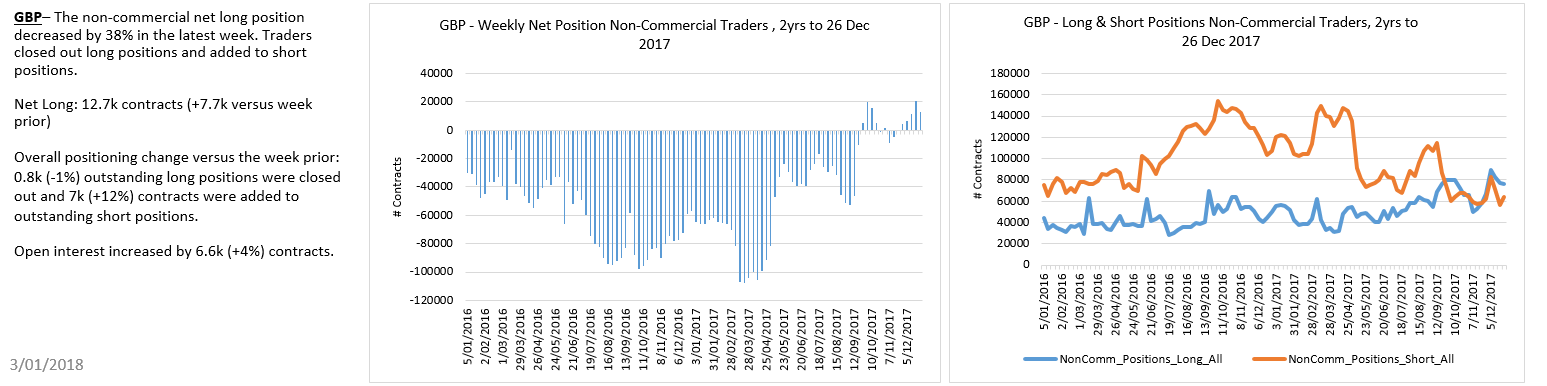
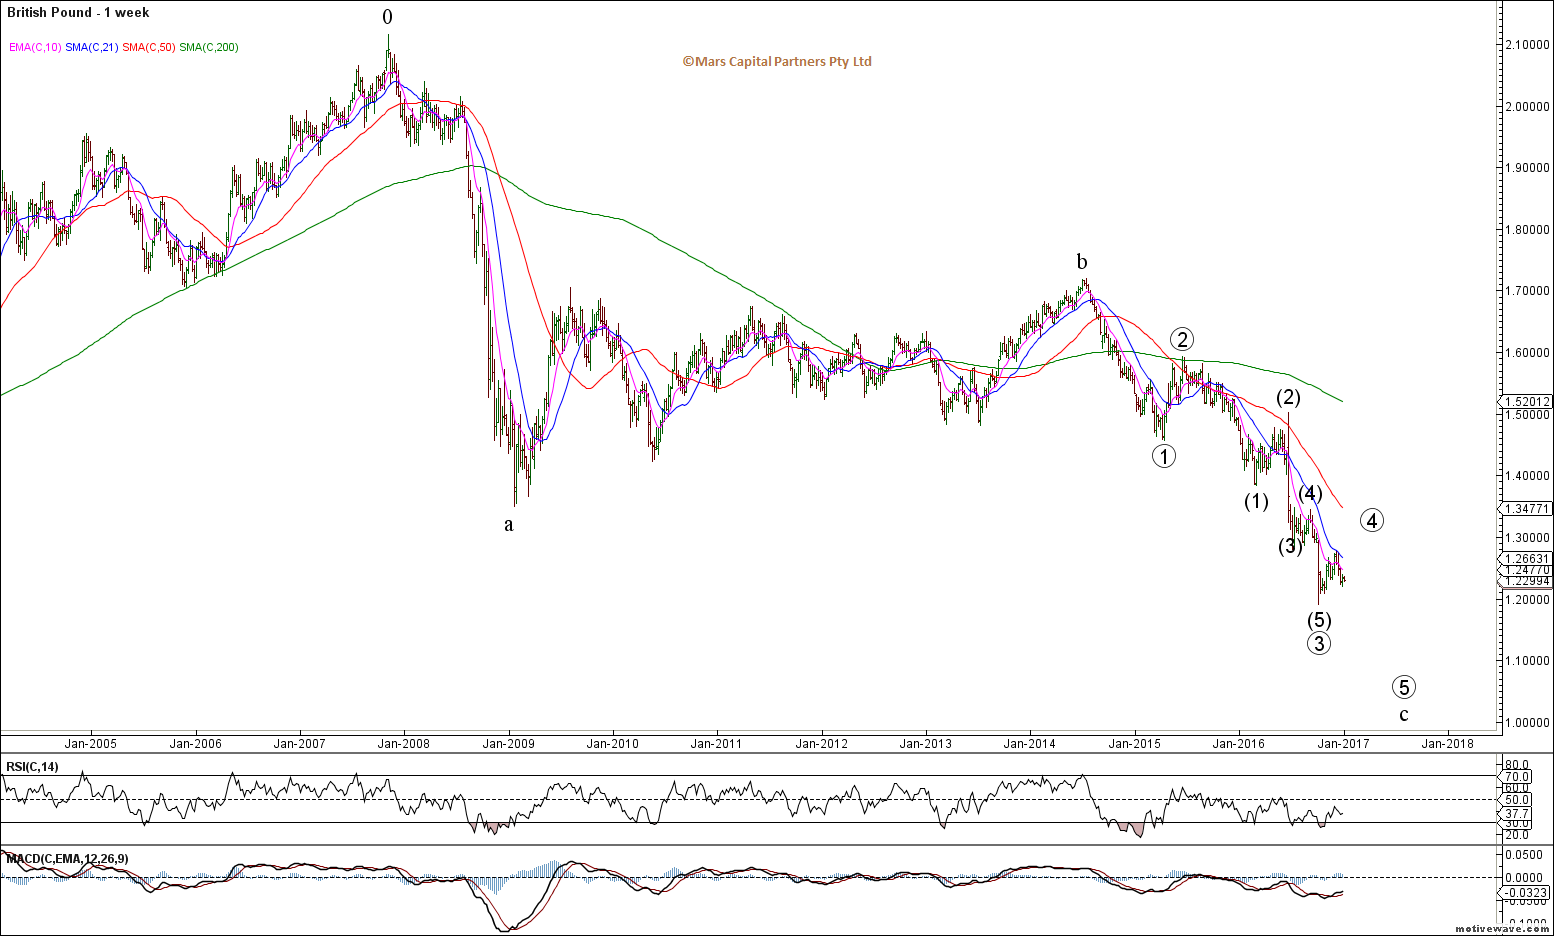
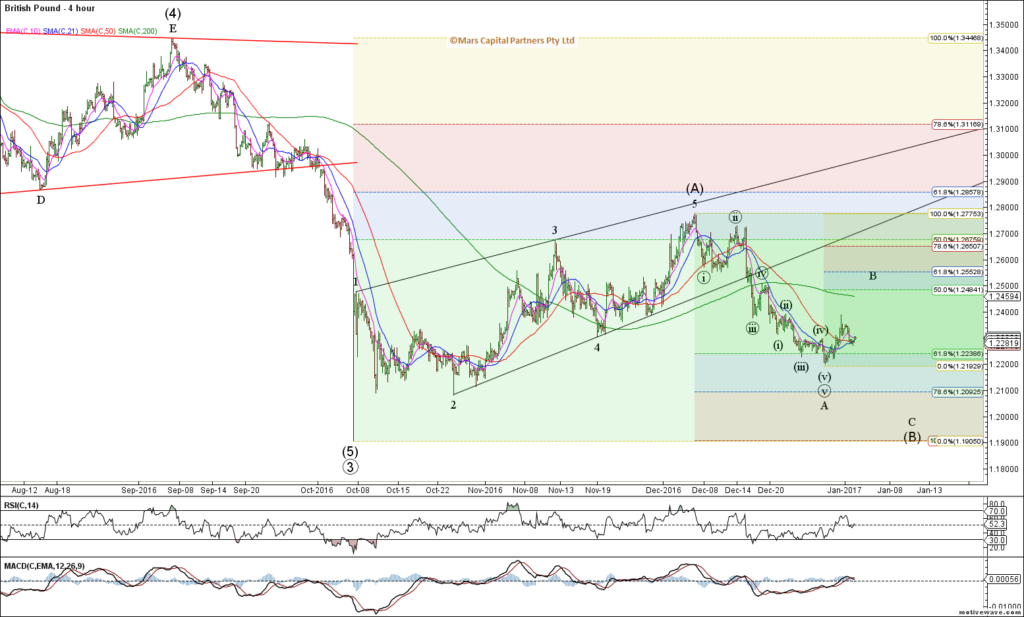
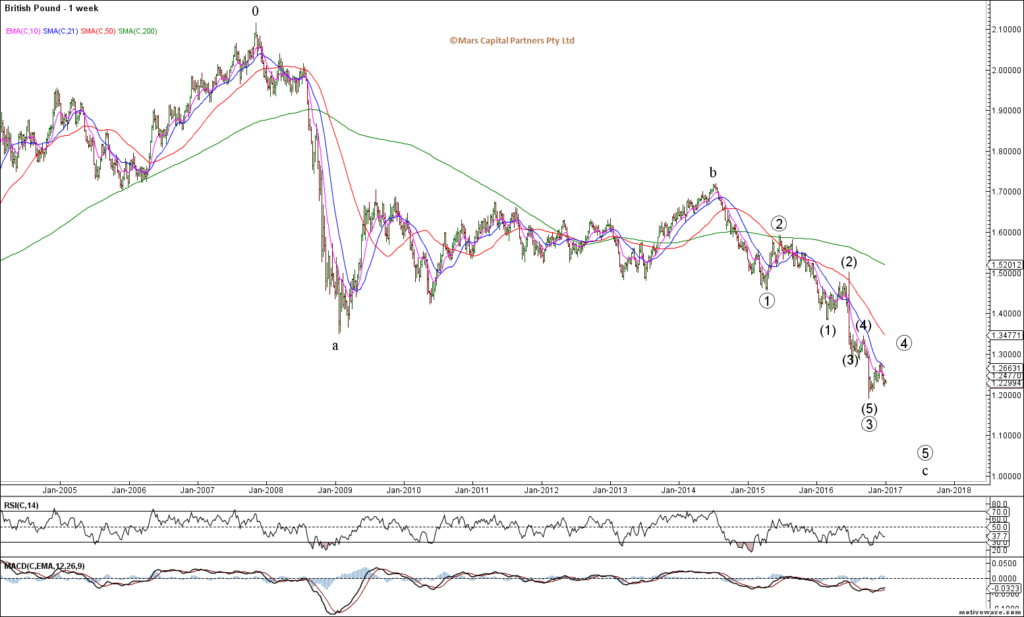
The Pound continues to frustrate and hold trend support. We are still looking for wave 5 of (C) down but we don’t have a clear setup. Trade above 1.46 eliminates this count but I am probably not trading it until I see a clear structure to trade against. My least favourite dollar pair but I think there is significant downside risk with Brexit.
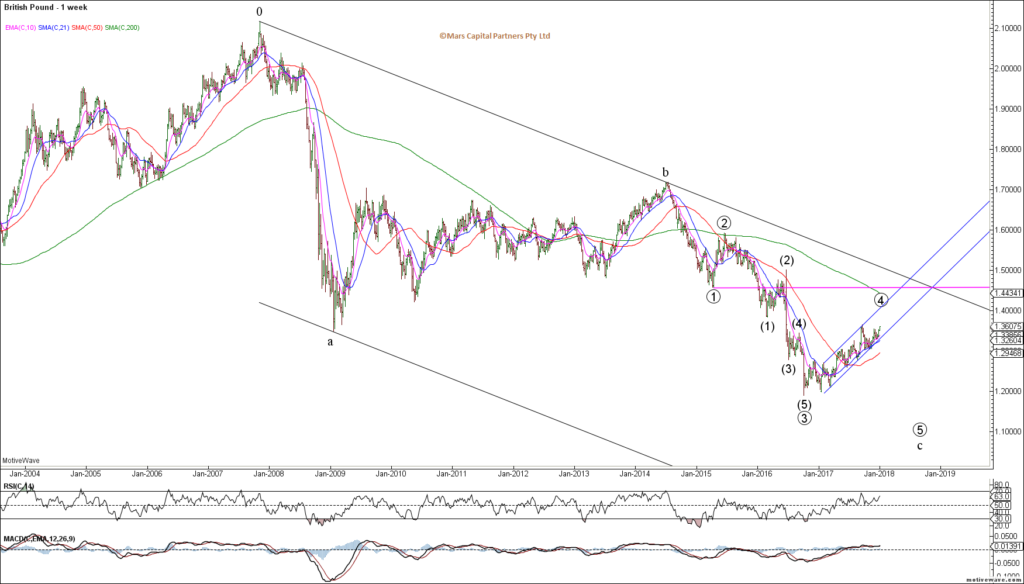
GBPUSD Weekly
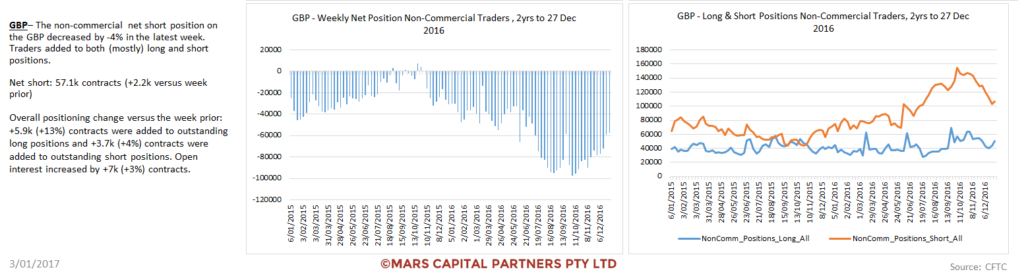
It appears that most GBP traders have given up and are now flat.

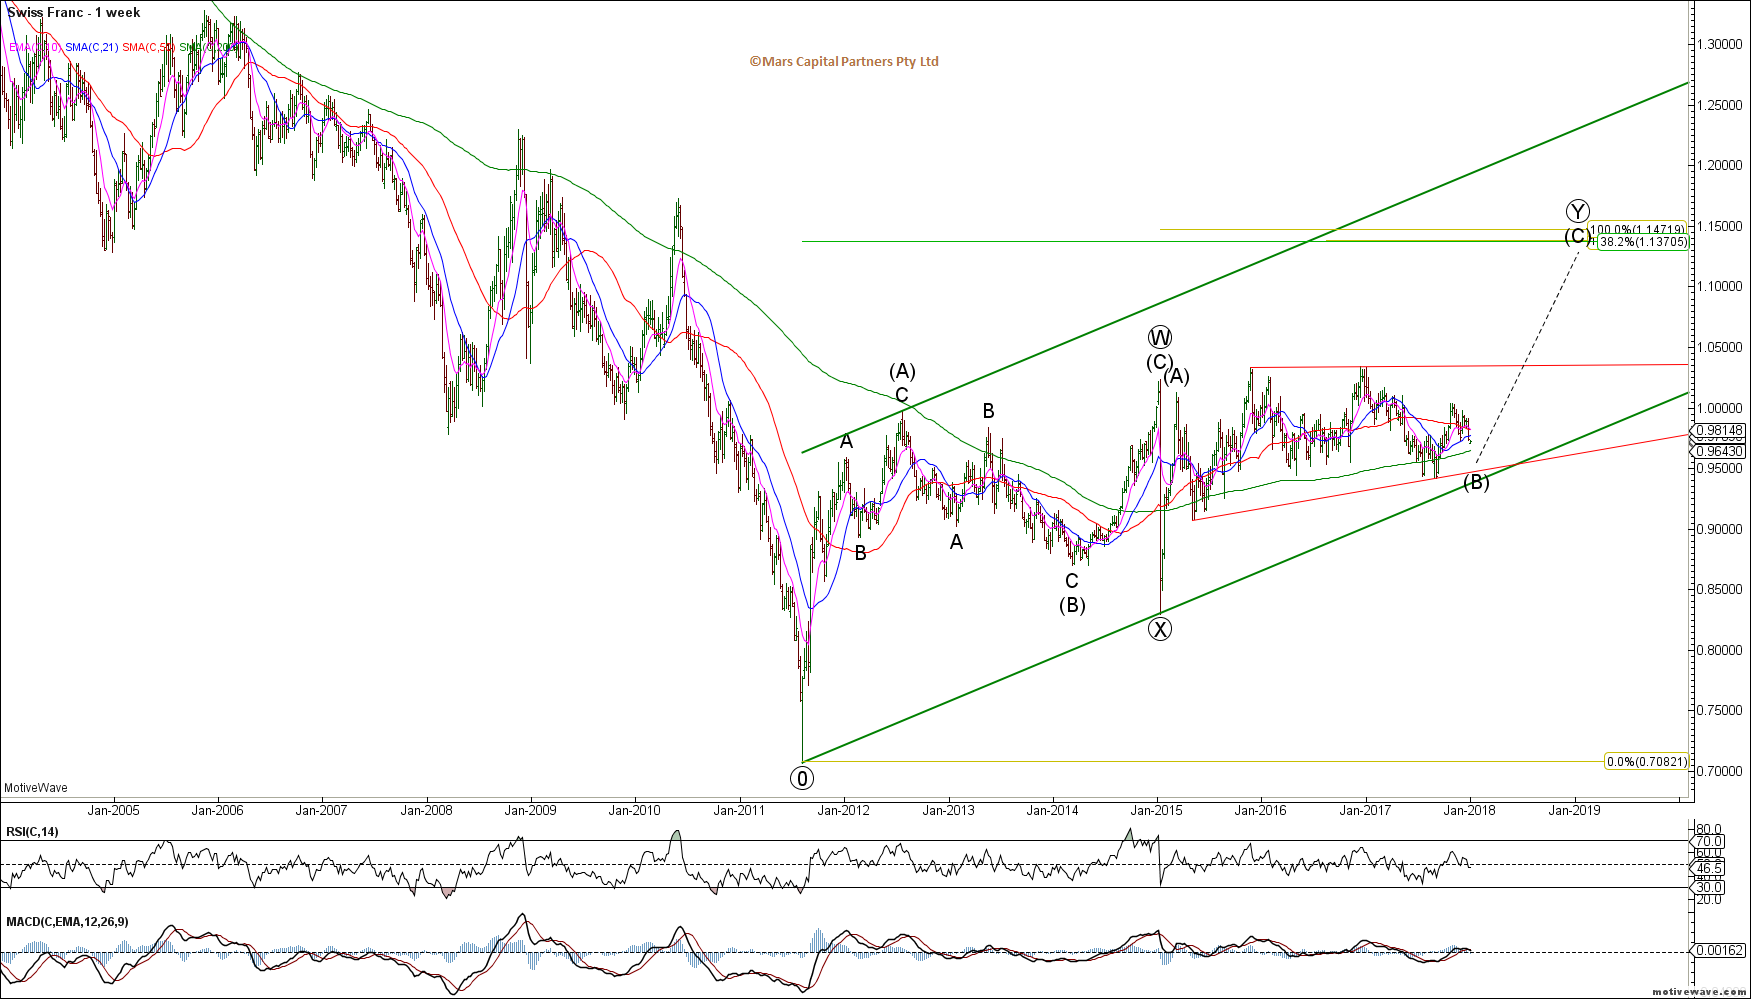
The USDCHF remains range bound but I’d rather be a buyer in the 0.95 area for the next potential leg higher – no clear structure here but underlying sentiment favours the bulls down at trend support.
USDCHF Weekly

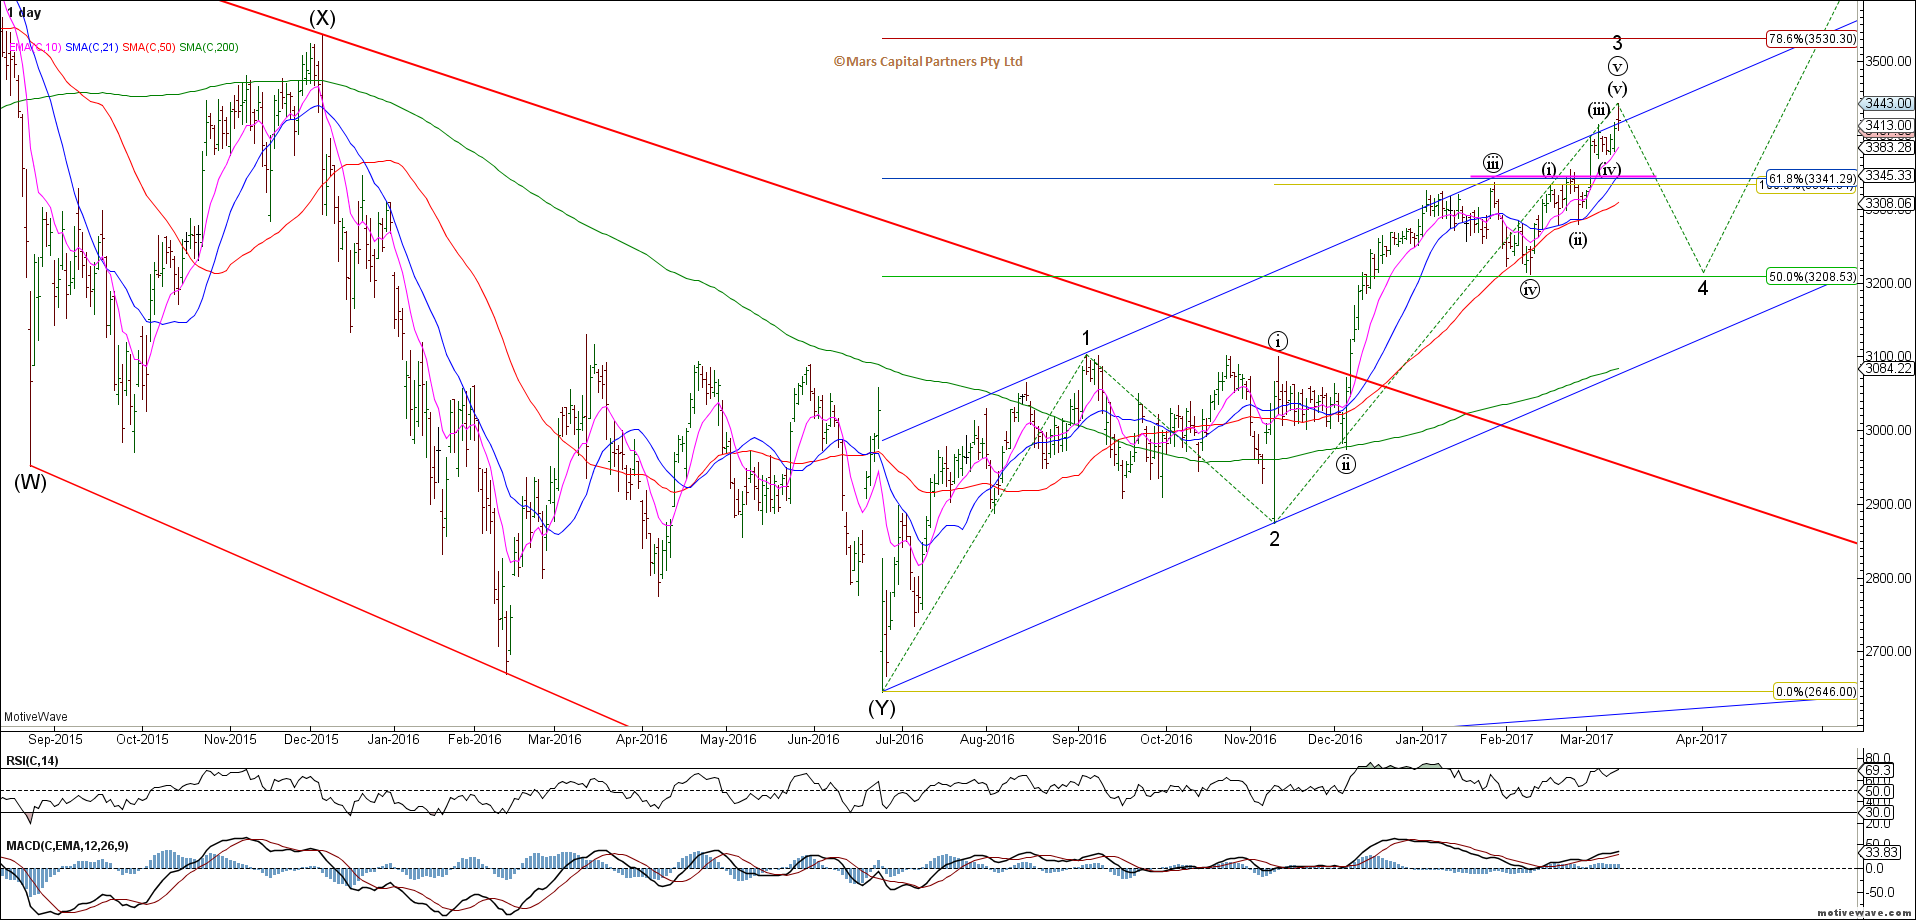
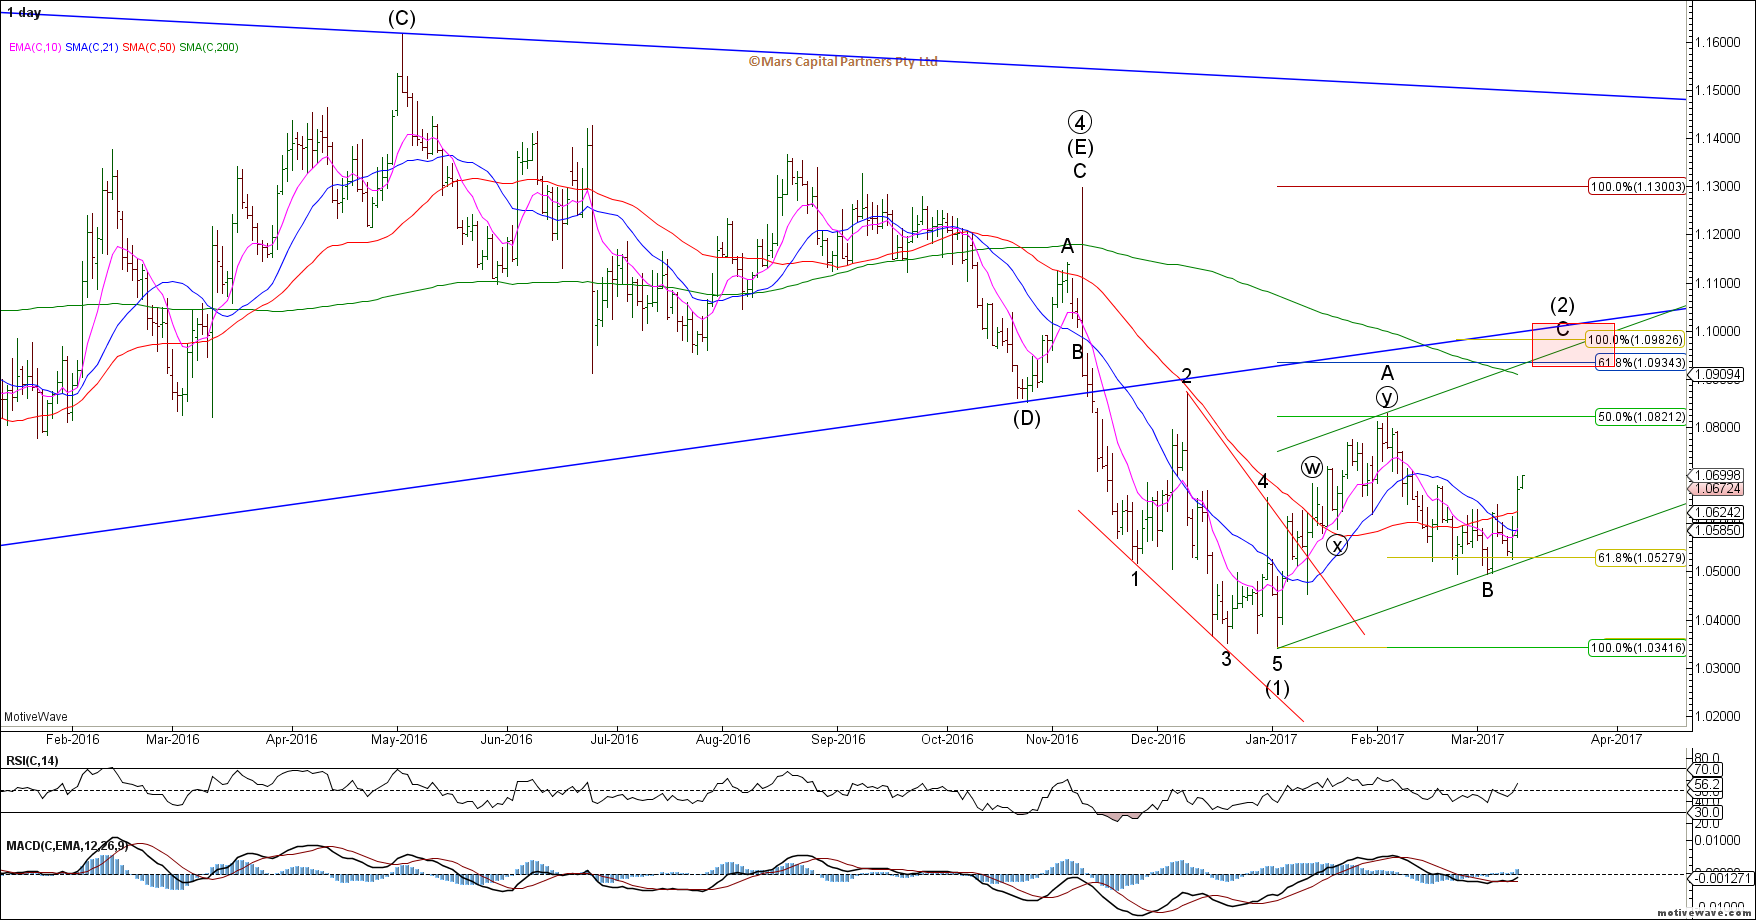
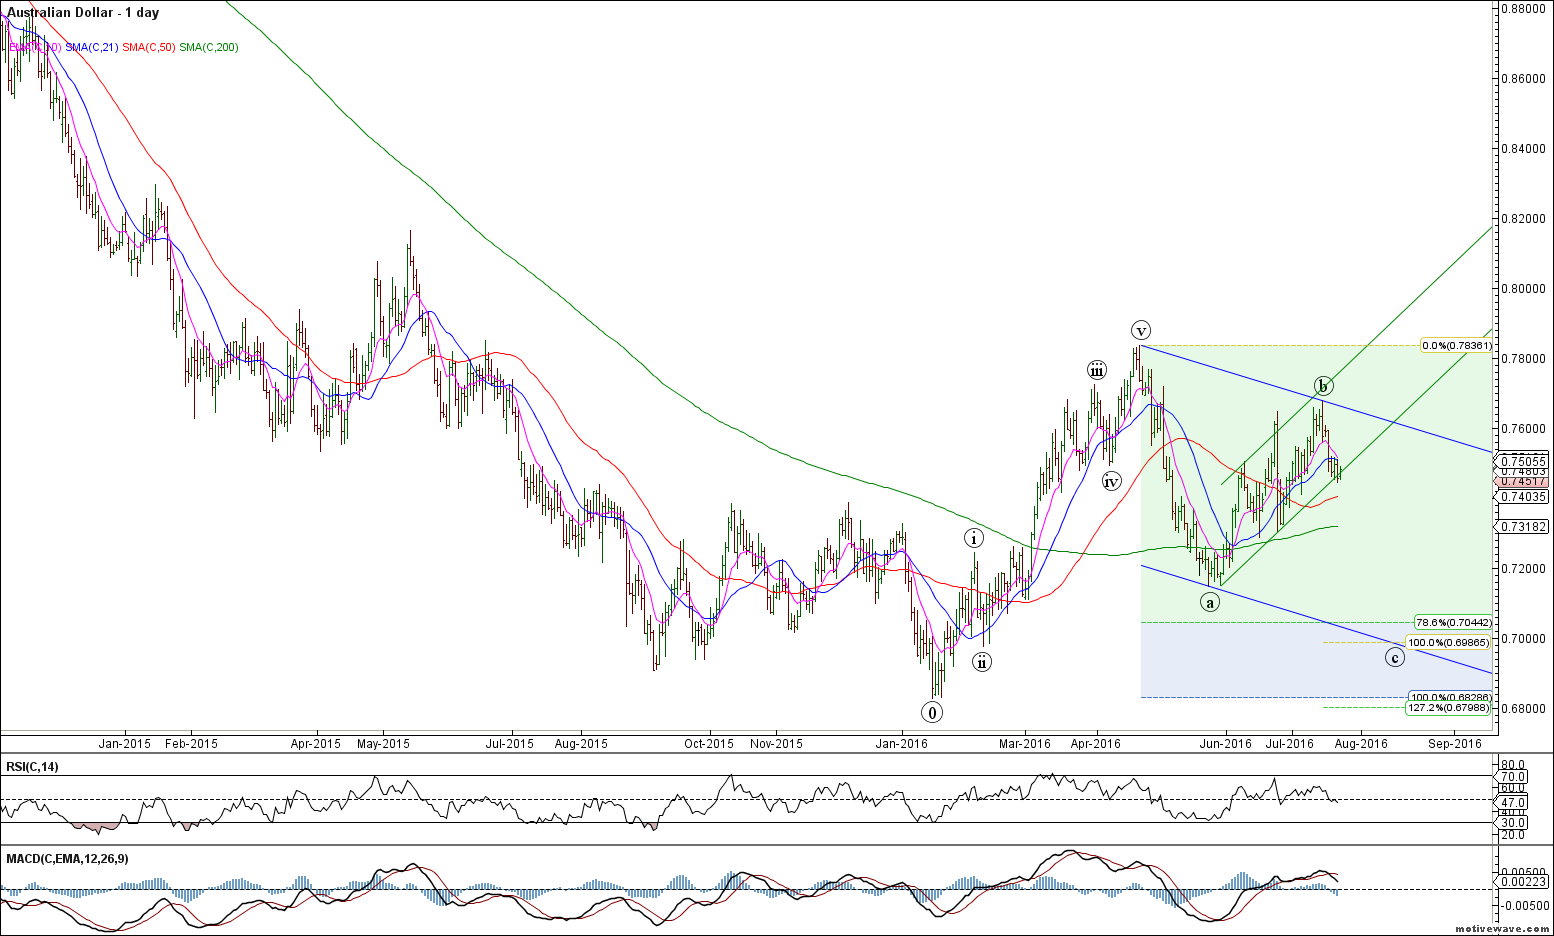
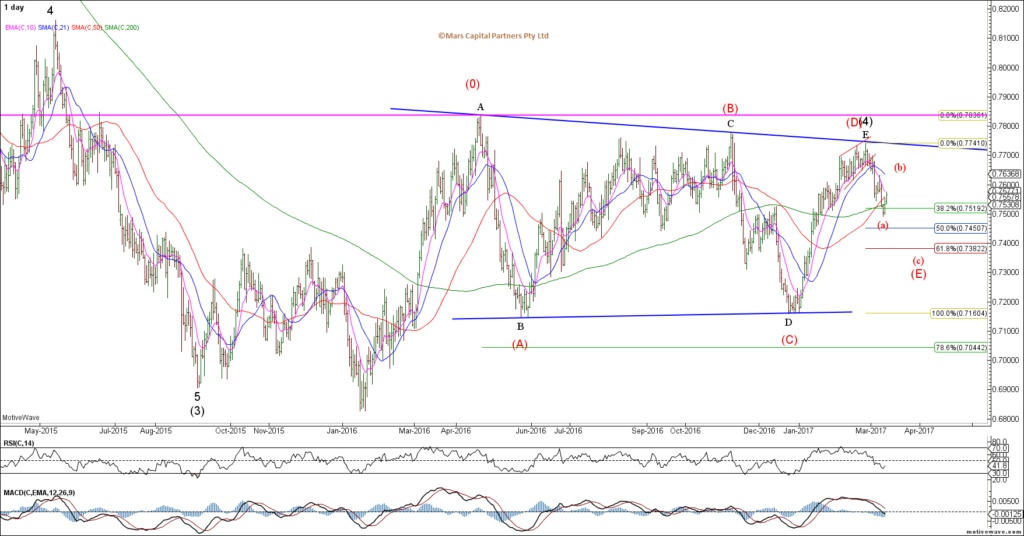
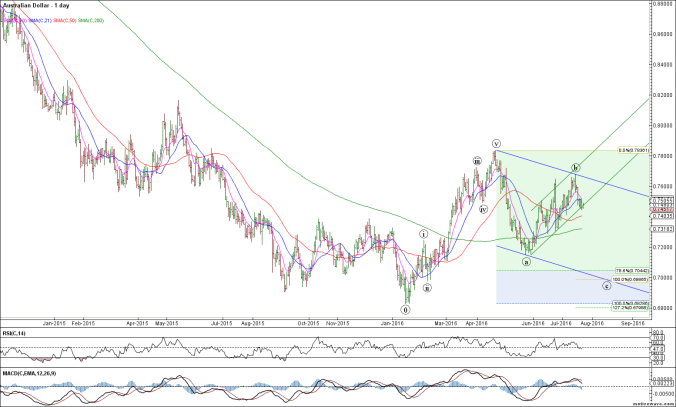
The bigger picture structure shows an A – triangle B – C wave corrective rally from the 2016 lows which likely completed wave (4). Near term, the Aussie$ is approaching our previously defined resistance in the 0.7900 area from where we would look for the downtrend to take hold for wave 3 of (5). Bearish the Aussie$.
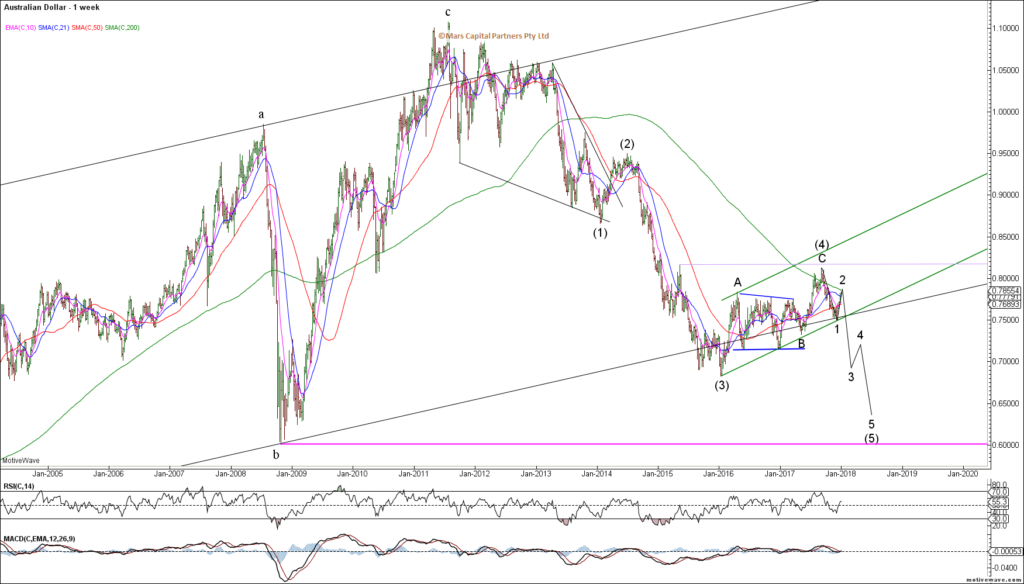
AUDUSD Weekly
Once again, we are looking for the strong US$ to take hold.
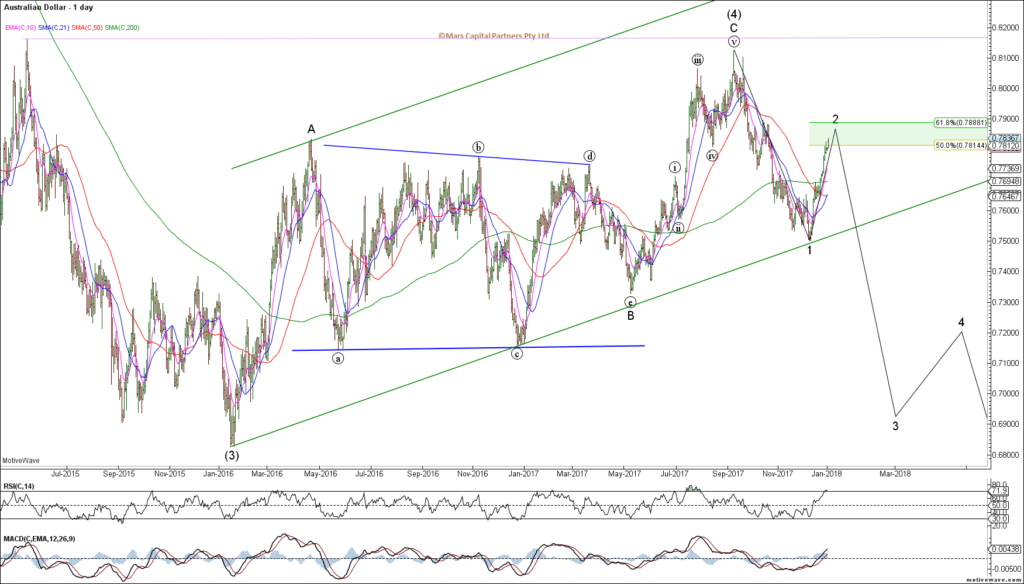
AUDUSD Daily
Aussie$ longs capitulated at exactly the wrong time…

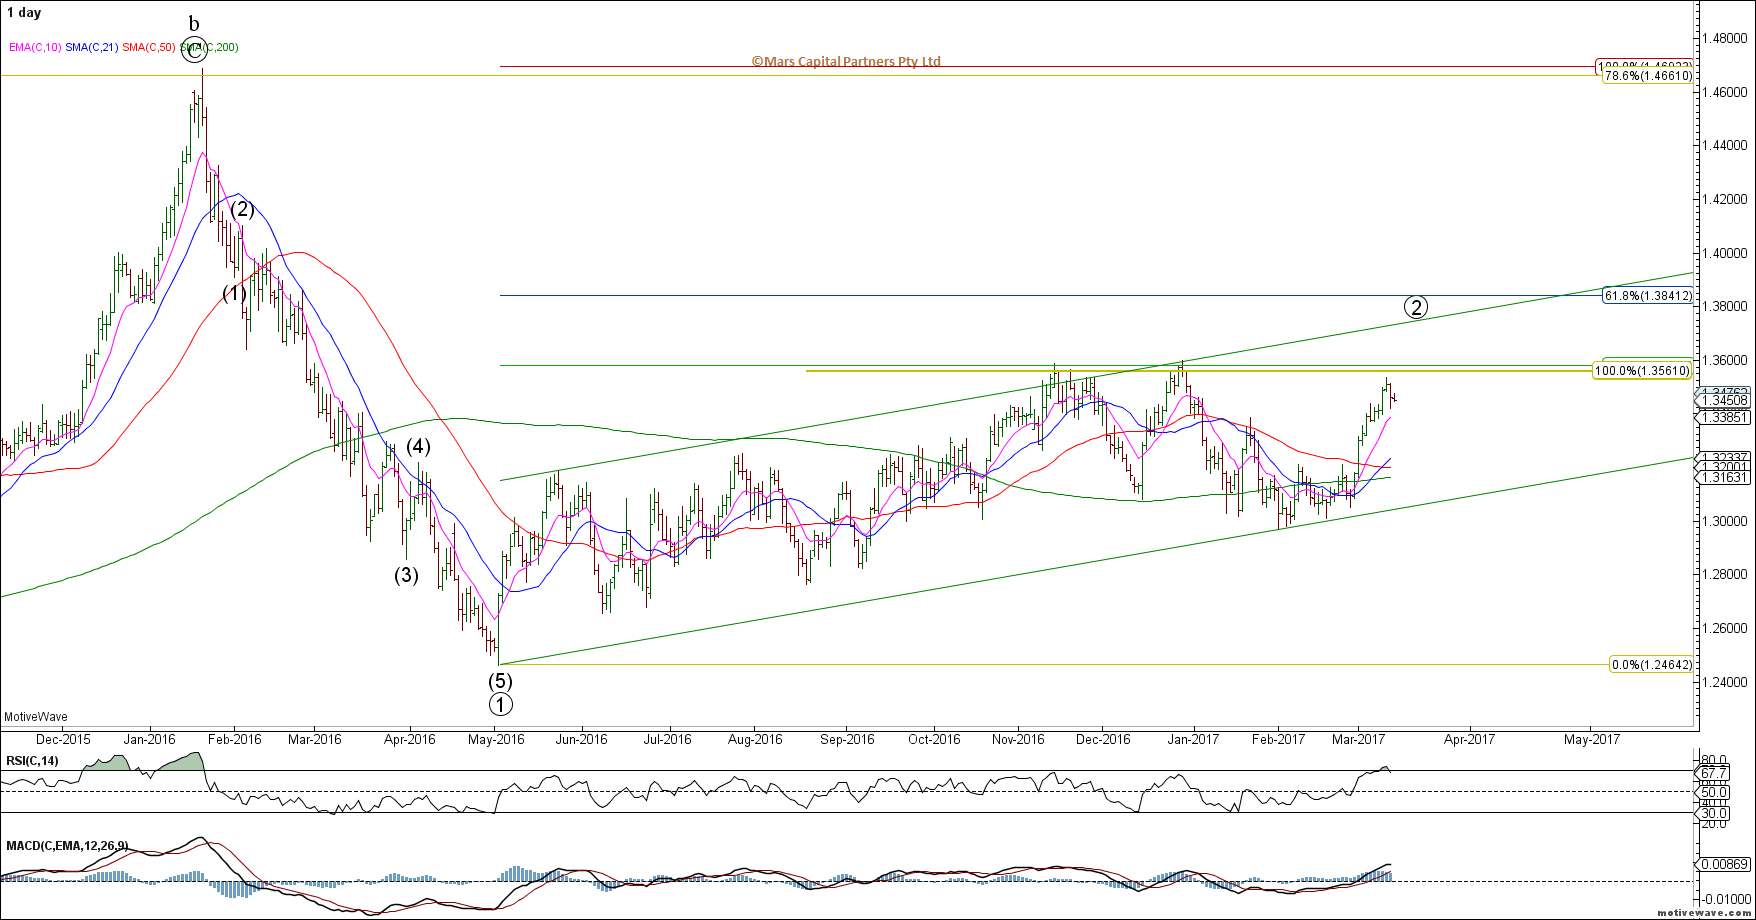
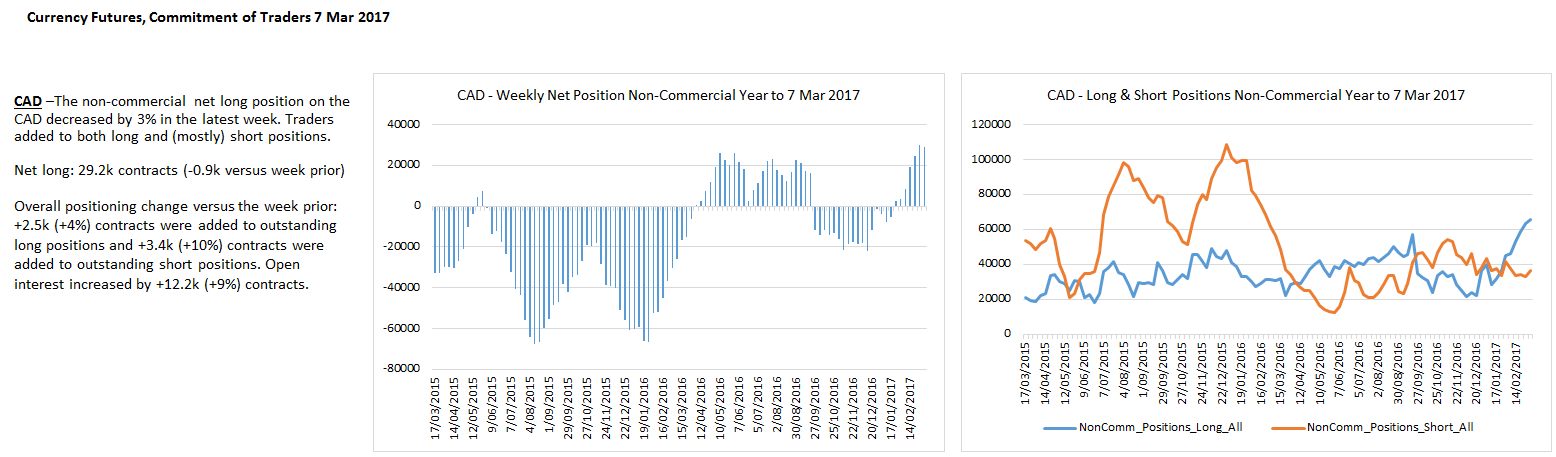
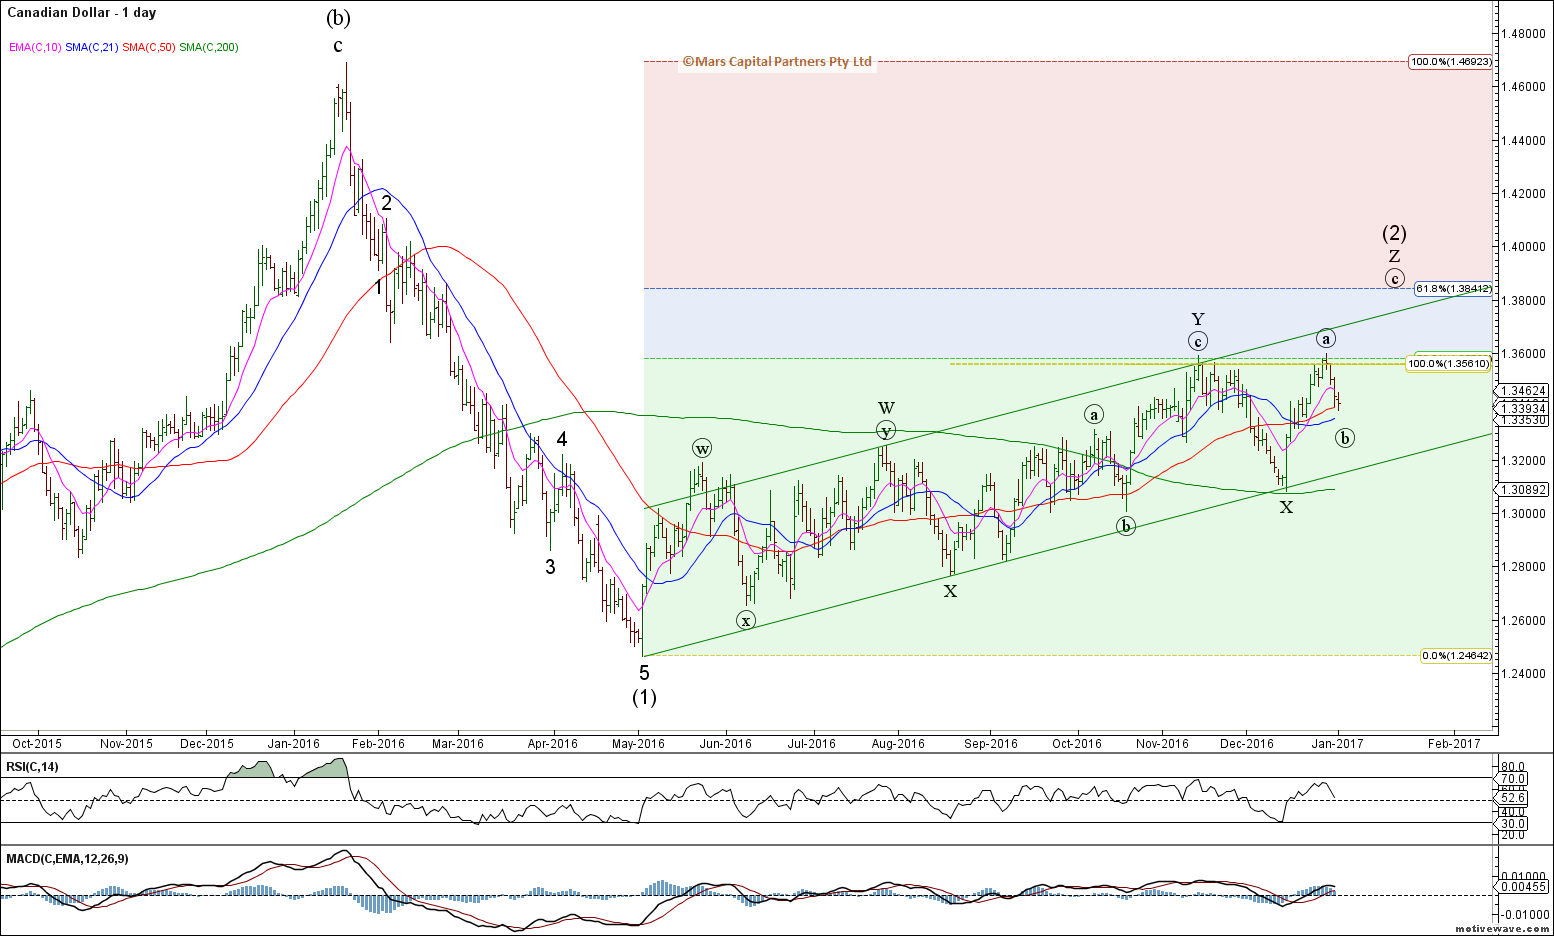
The USDCAD has declined to strong support in the 1.24-1.25 area from where we would look for a bullish turn. US$ bulls need to step up. Bullish USDCAD.
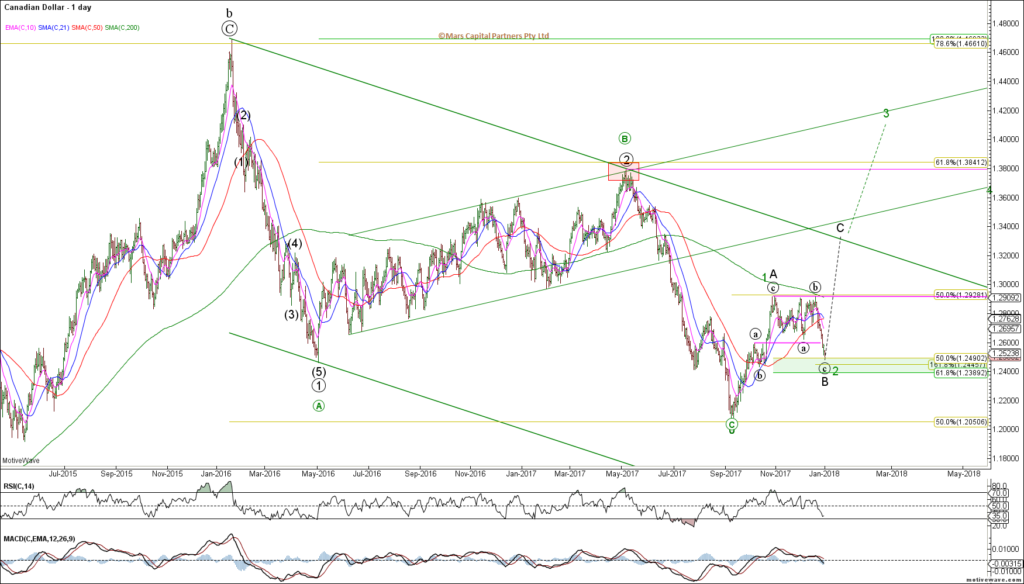
USDCAD Daily
CAD traders now flat after being whipsawed.

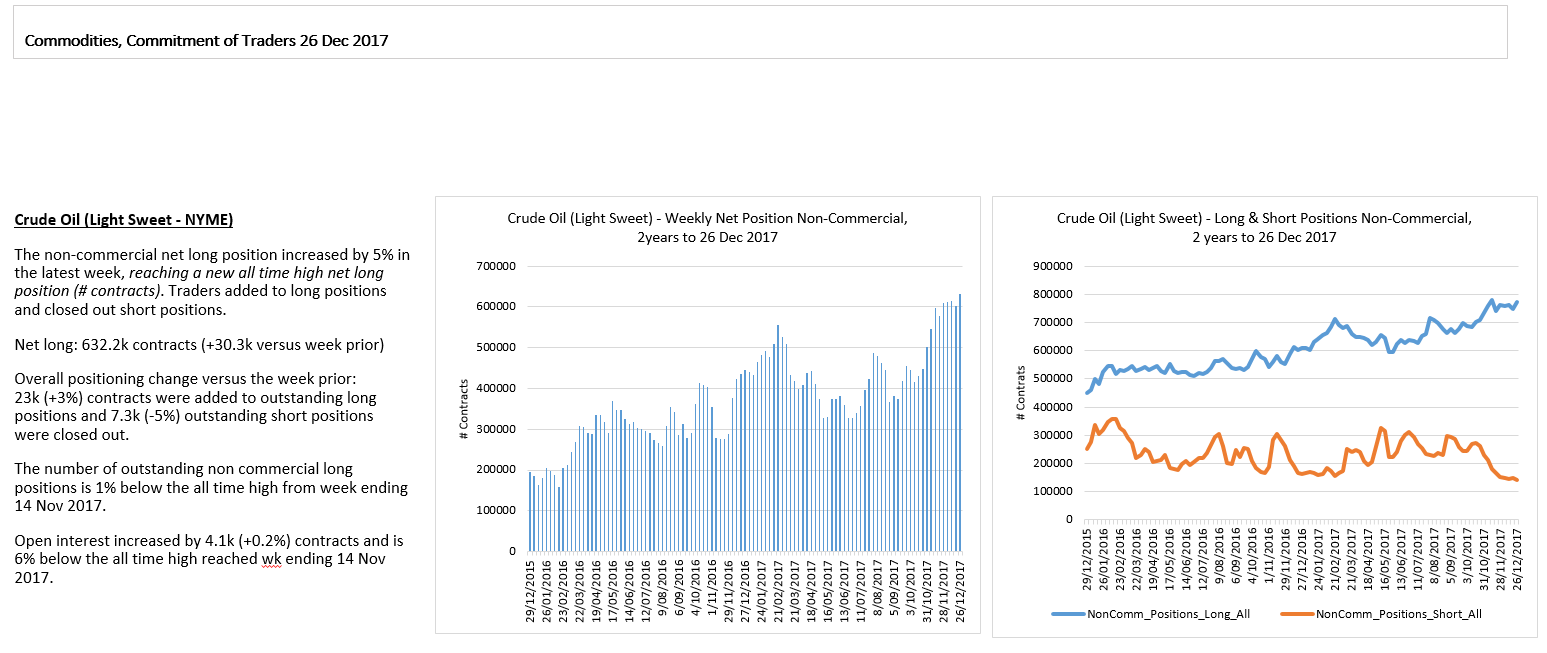
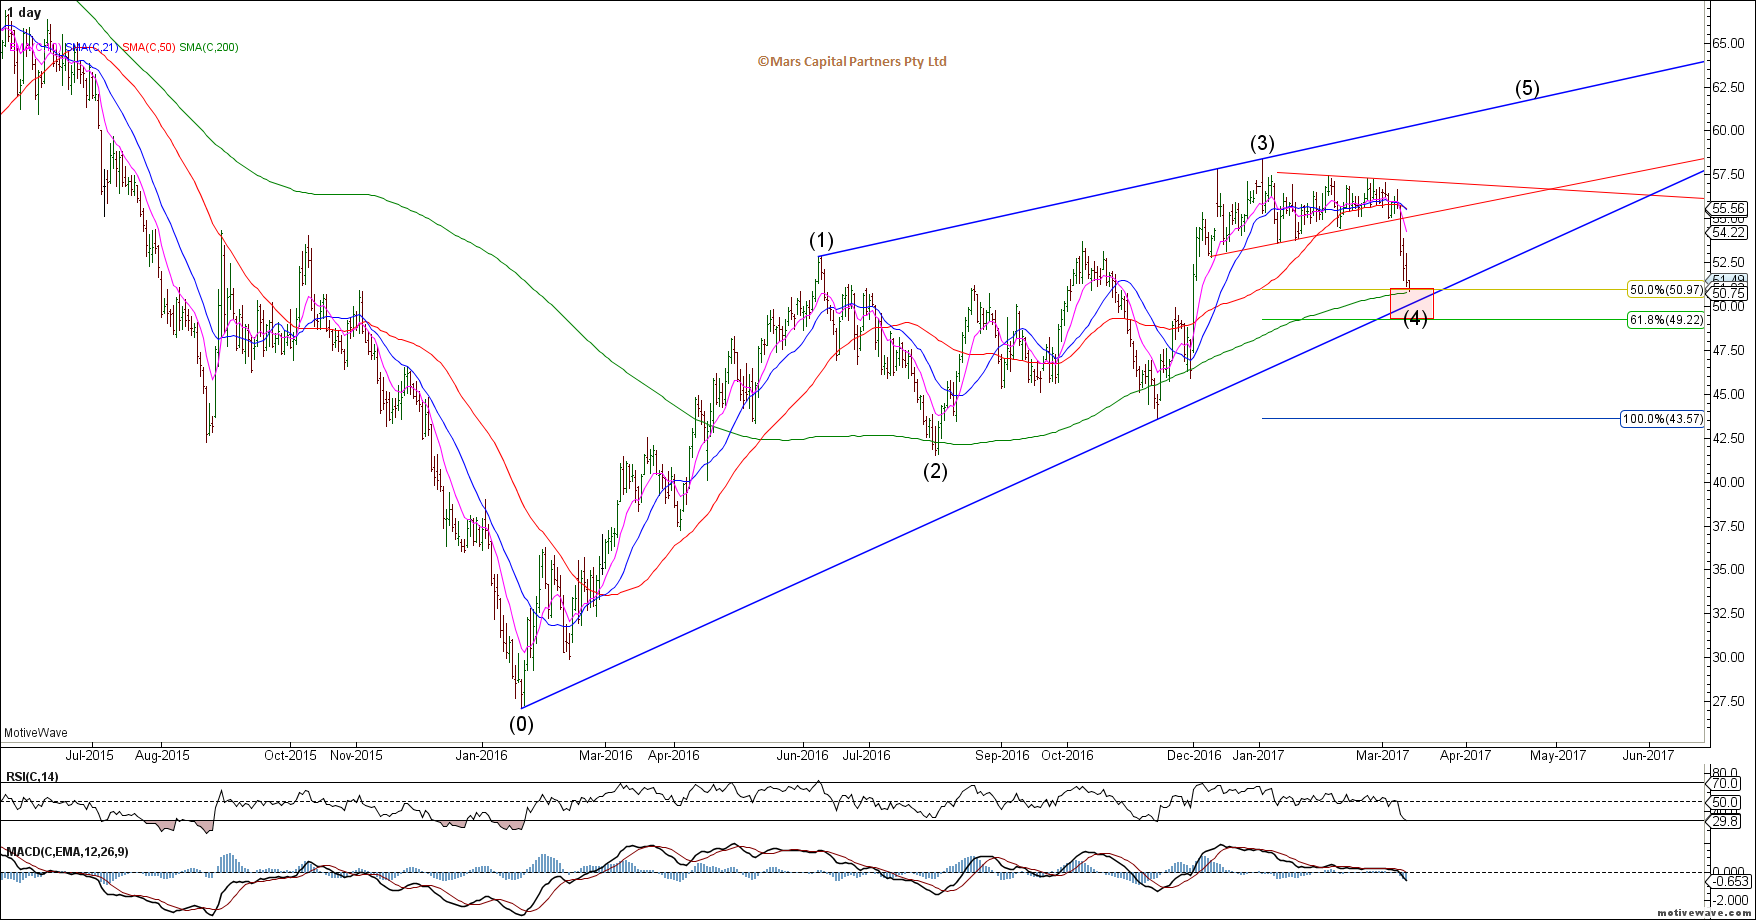
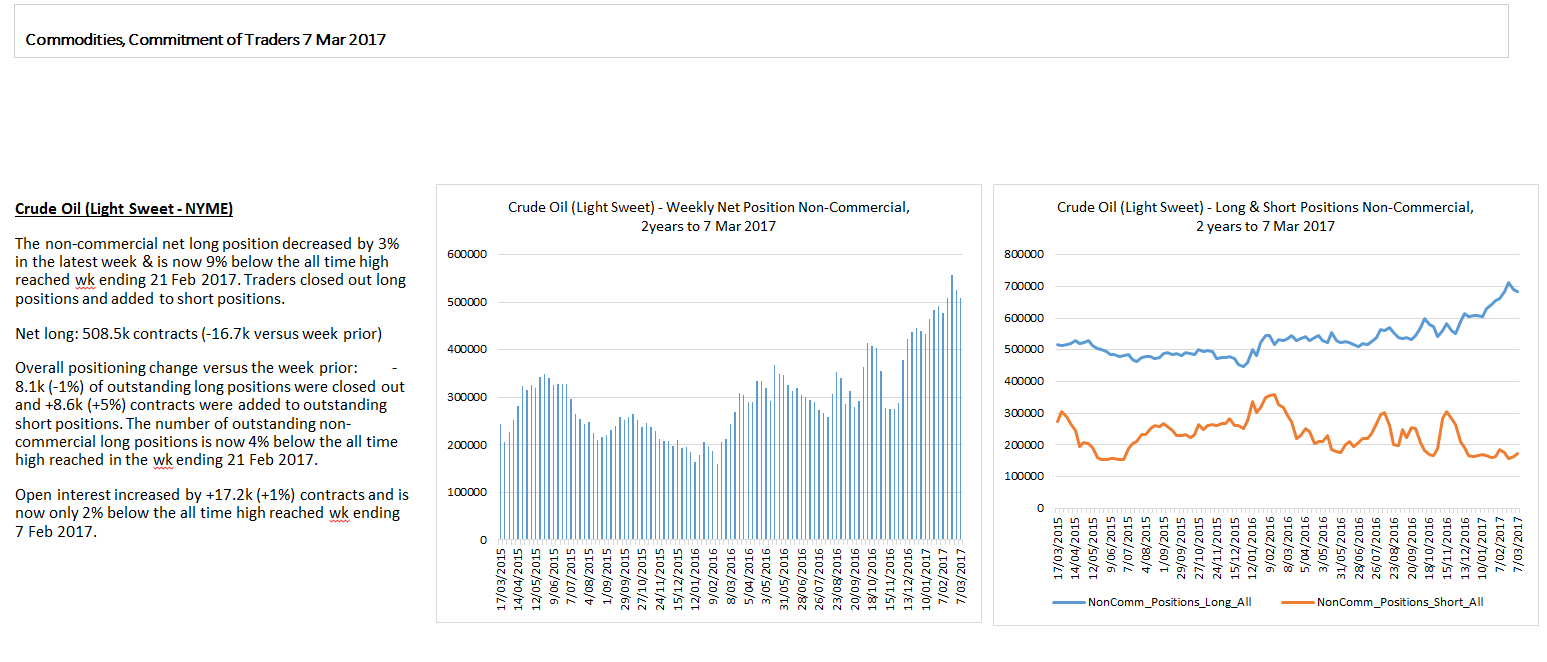
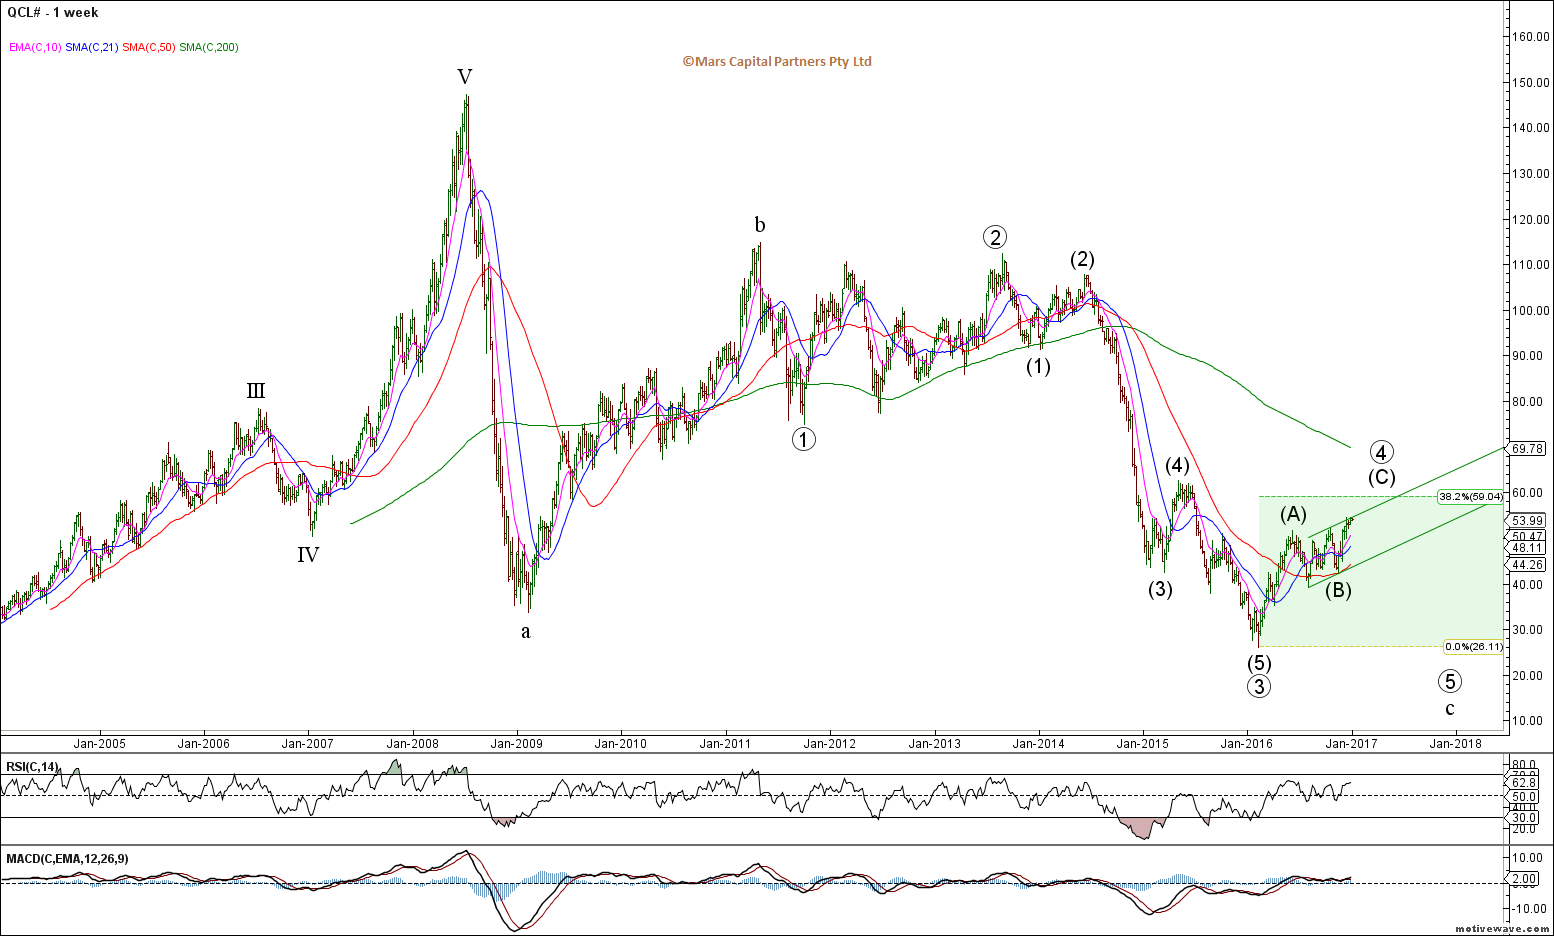
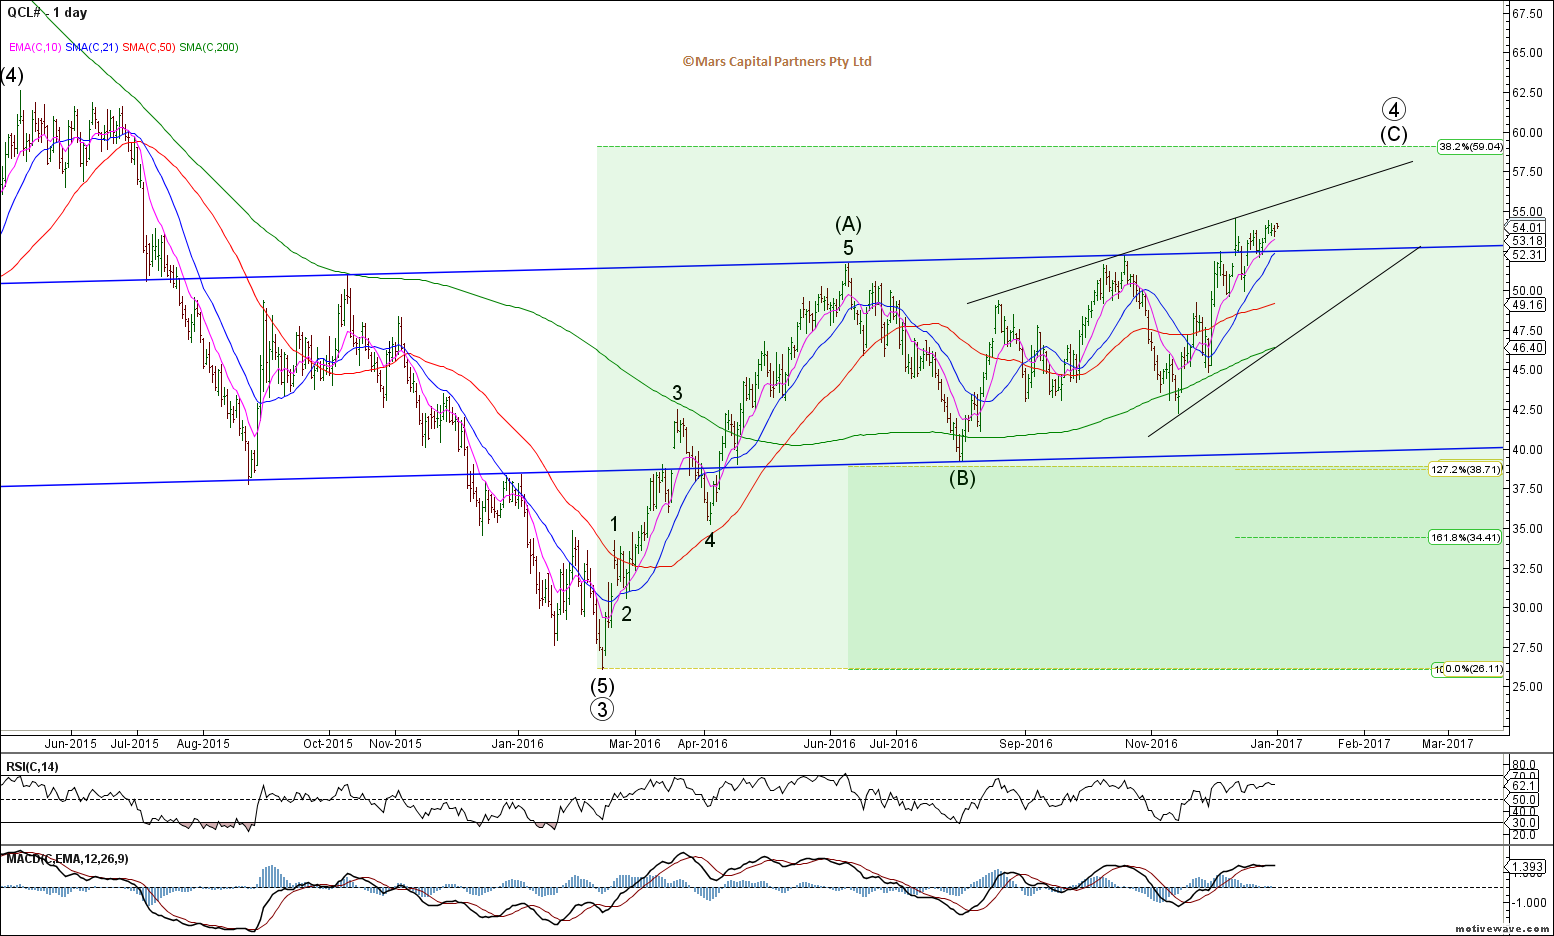
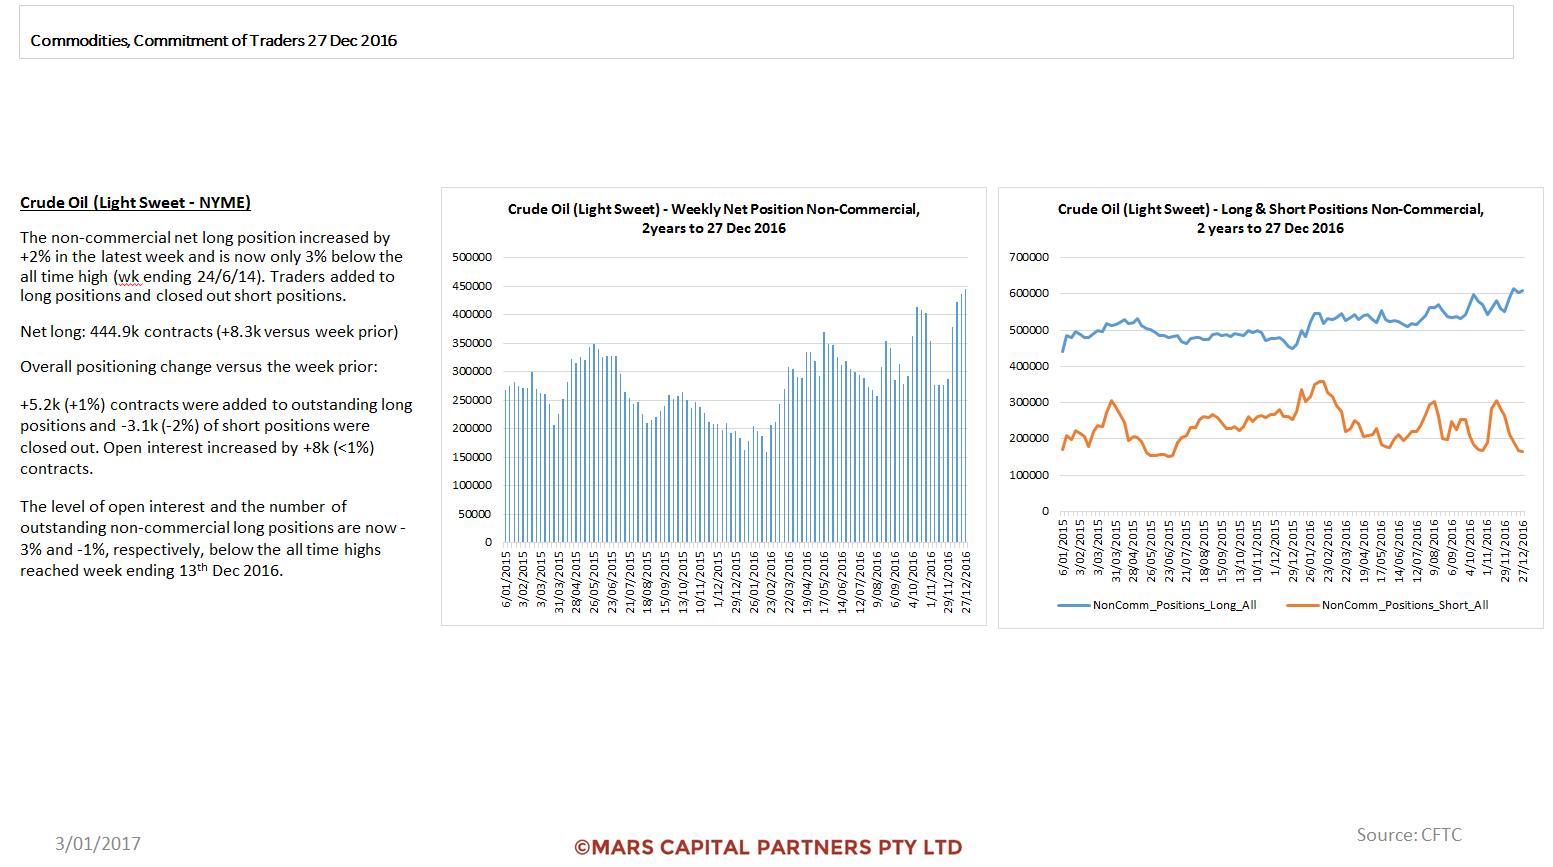
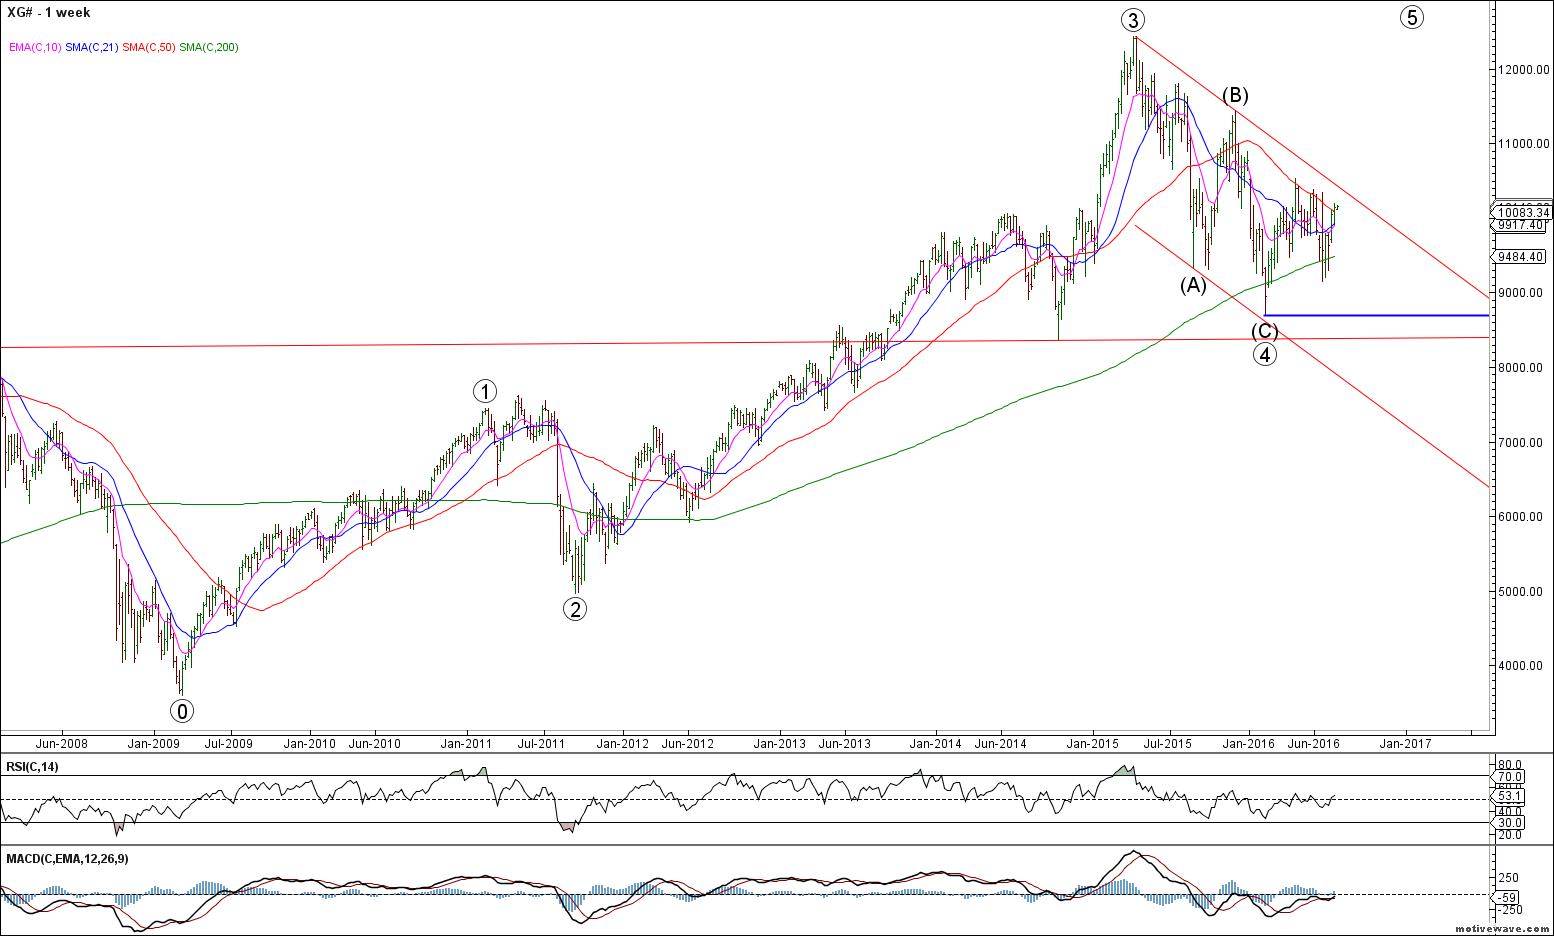
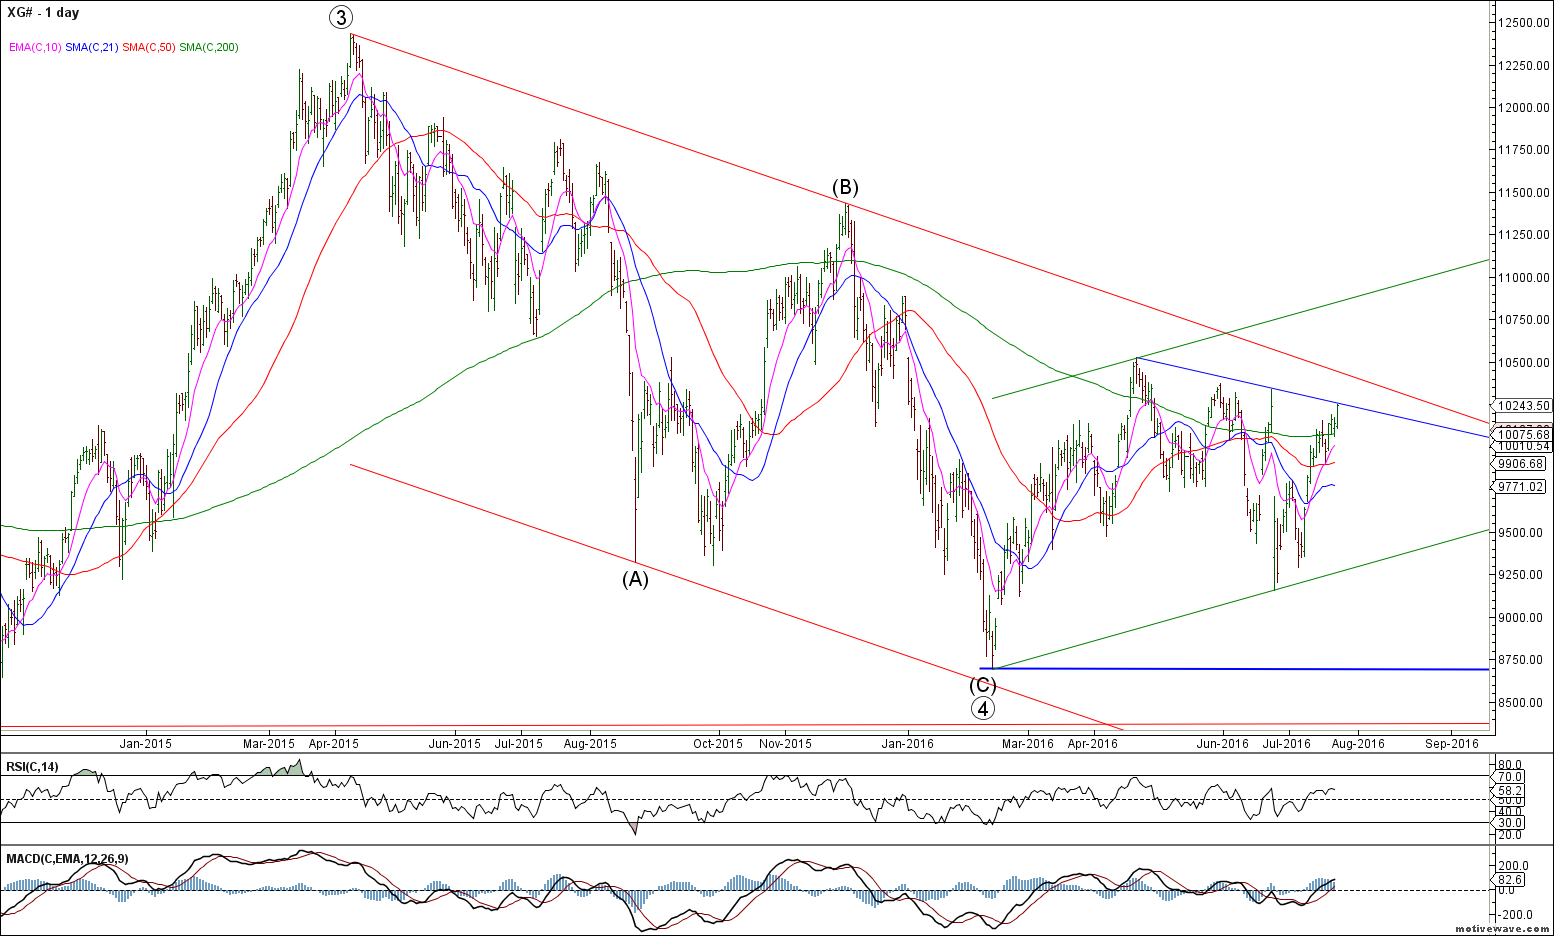
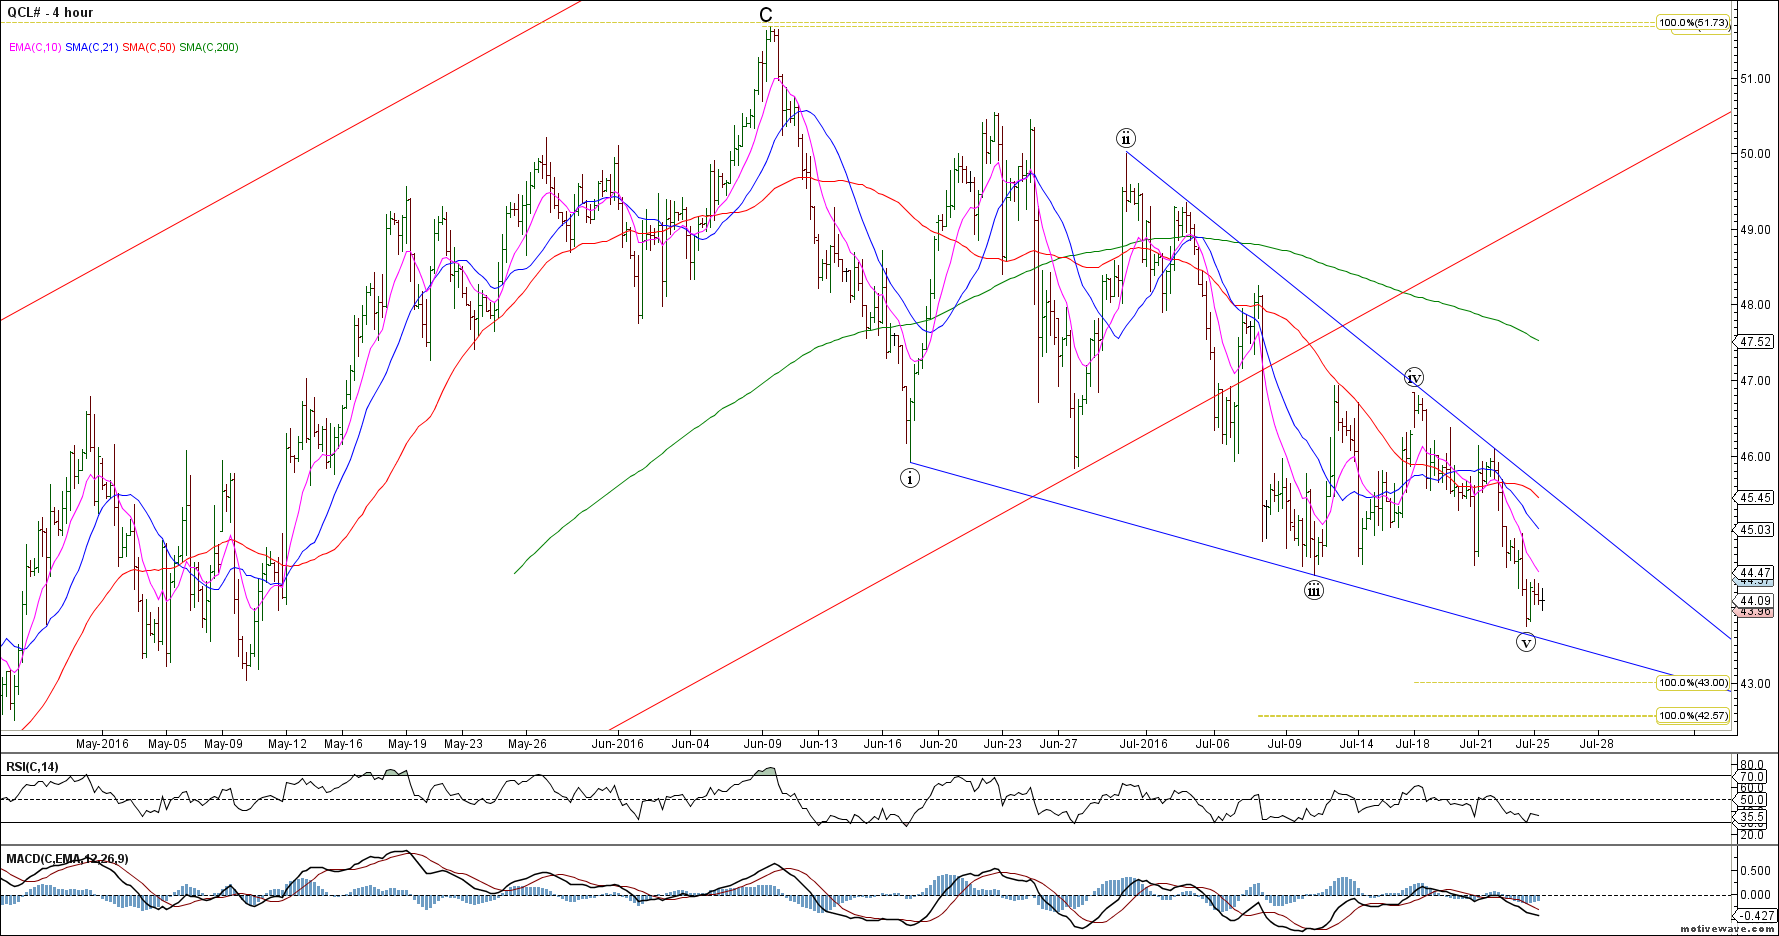
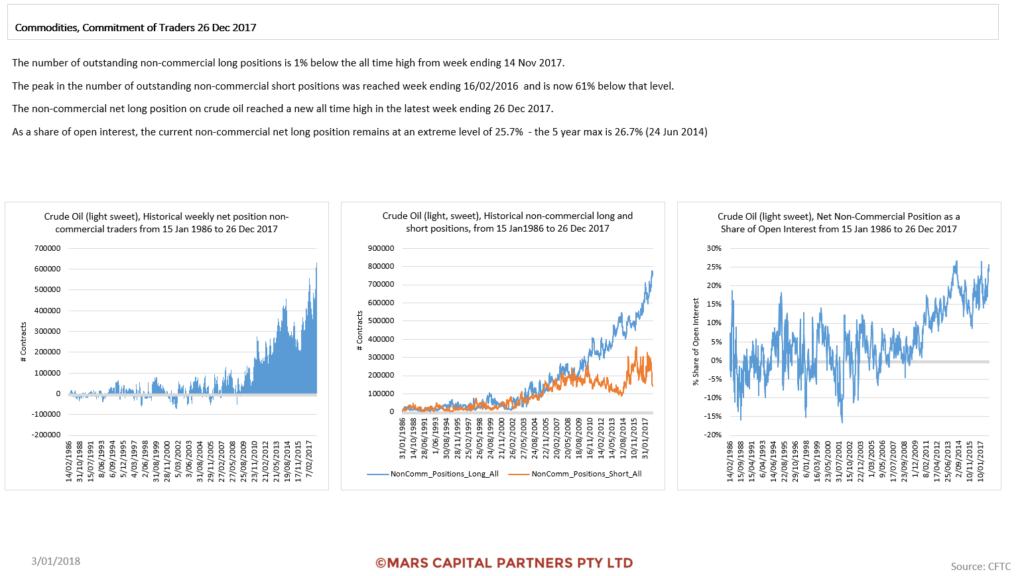
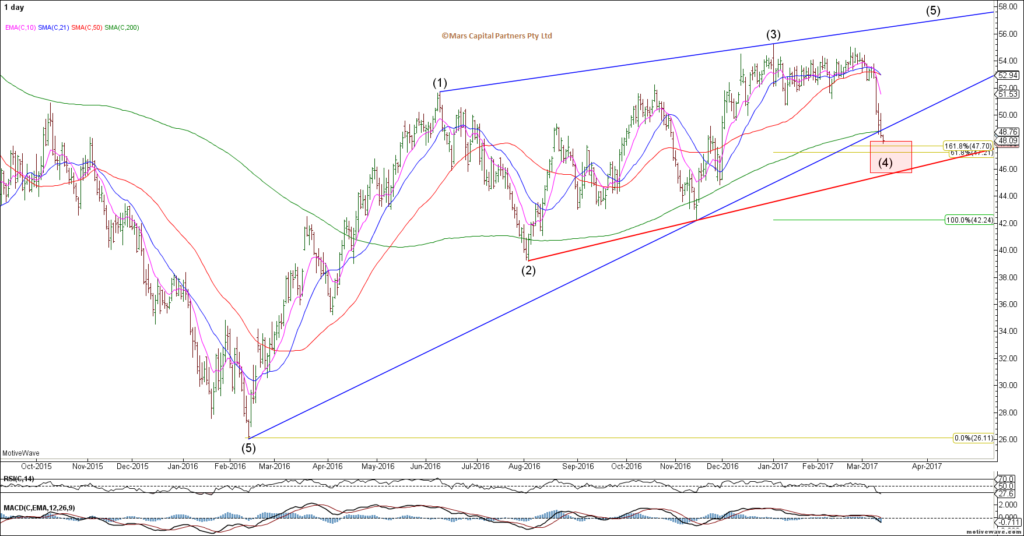
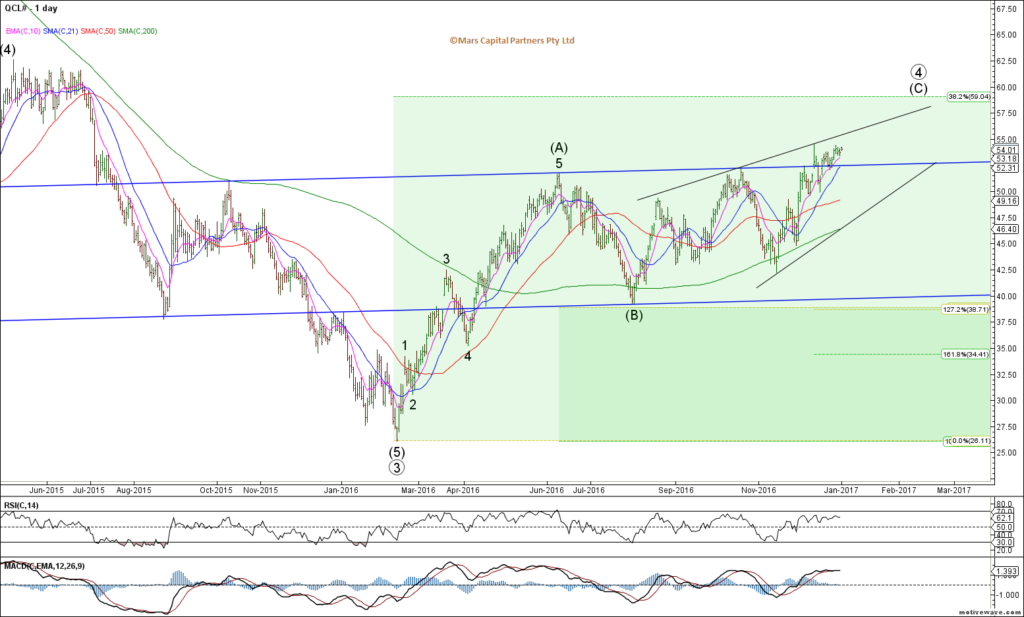
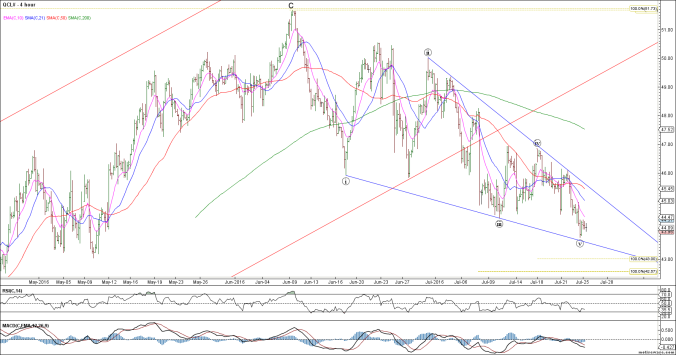
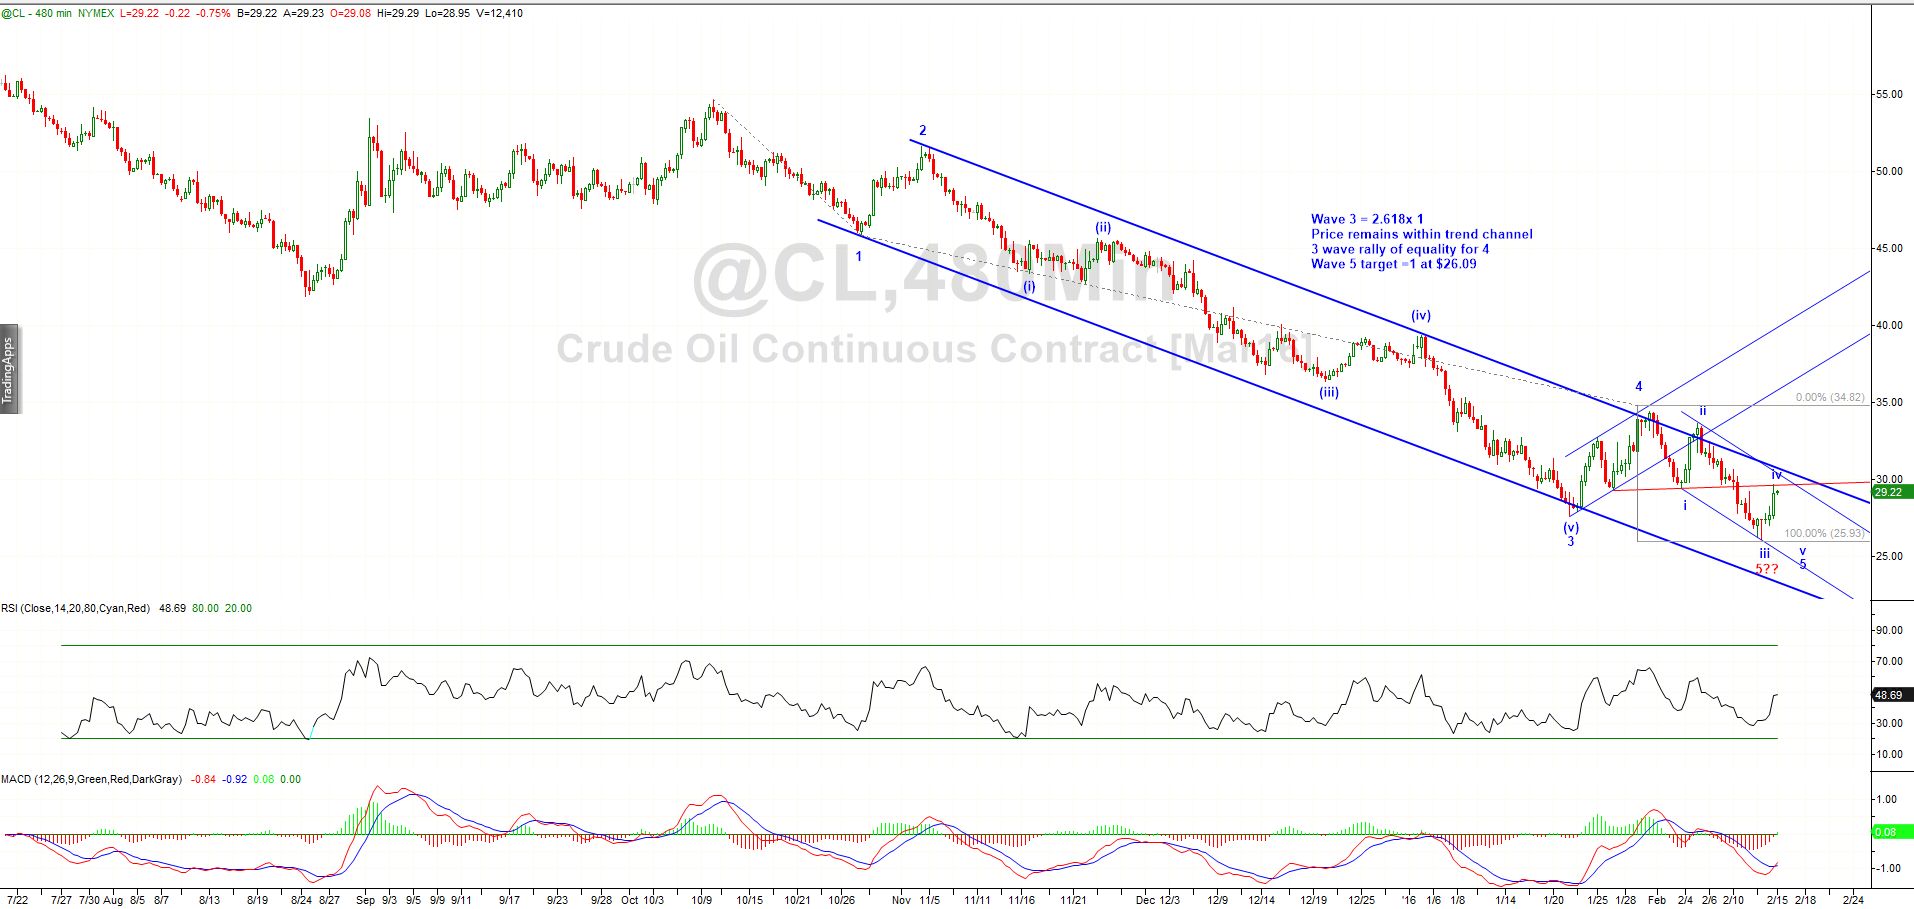
To the commodity markets and “IF” we are right about the impending bullish US$ reversal, the commodities will likely decline as a result. The bearish setups are definitely there. Crude Oil is a particularly interesting short prospect given the extreme long positioning of traders and 3 wave corrective rally into prior wave 4 resistance at 62.50 – our bigger picture structure is looking for a final wave 5 down for new lows below $26. We are alert for signs of a bearish reversal which should coincide with a bullish reversal in the US$. Bearish Oil.
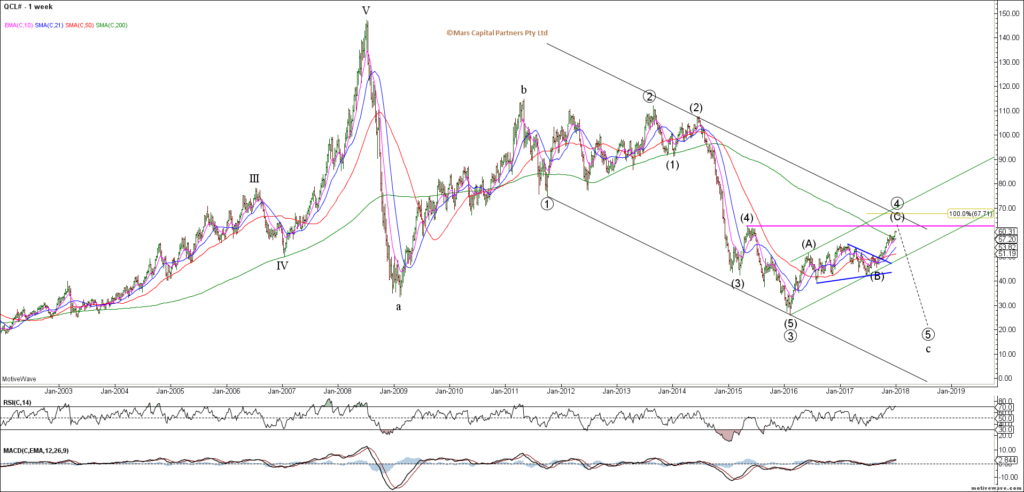
CL Weekly
CL should now be in the final wave 5 of (C) where it is vulnerable to a bearish reversal although we have no evidence of this just yet. Awaiting signs of a bearish reversal to get very short against the herd.

CL Daily
Bulls pushing the envelope to new extremes! The longer they get, the more exciting this opportunity.

Perspective…
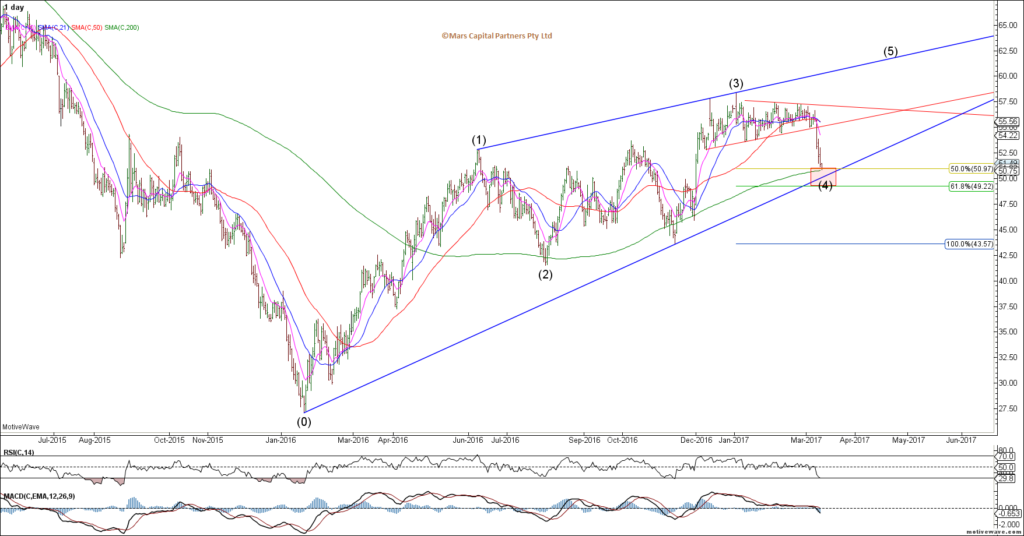
Brent Crude shows the same structure as we approach $70 resistance.
Brent Crude Daily
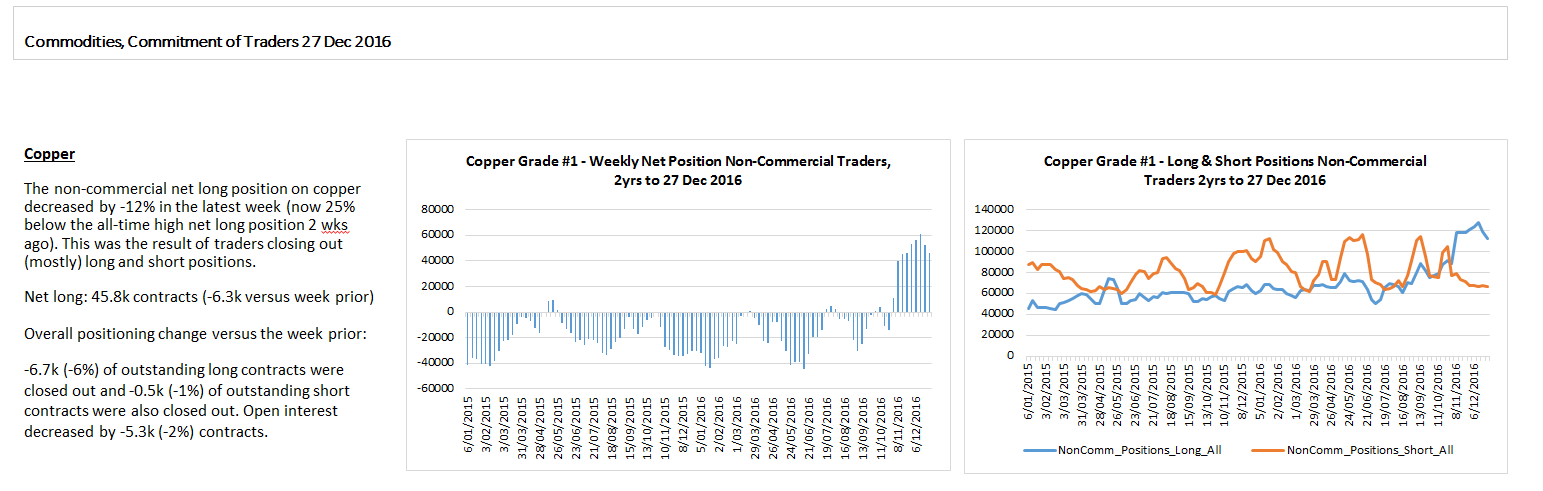
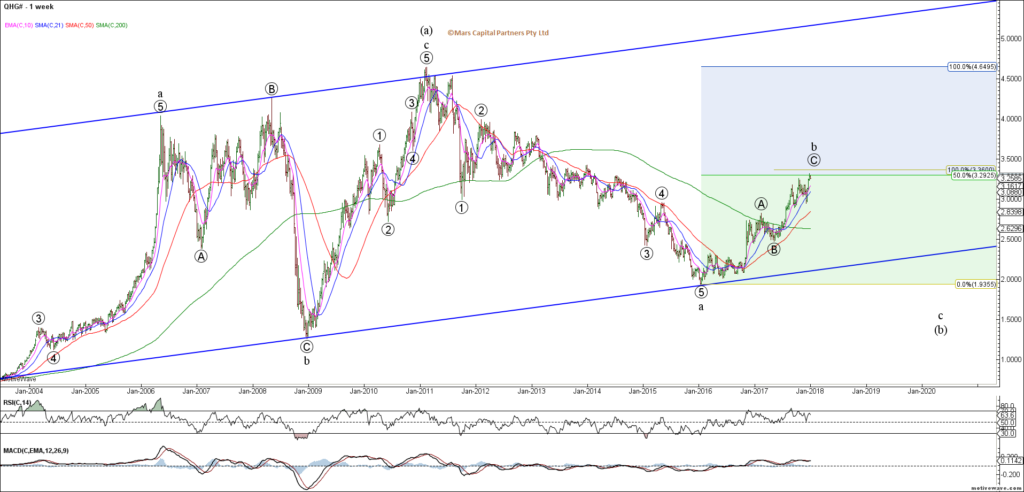
Dr Copper has pushed higher into a cluster of Fib resistance but the structure remains bullish until we see evidence of an impulsive decline – I have no strong view on the good doctor but the rally is extended and I would be looking for at least a correction towards 2.60 on a break of 2.90. I have no strong long term view for HG.
HG Weekly
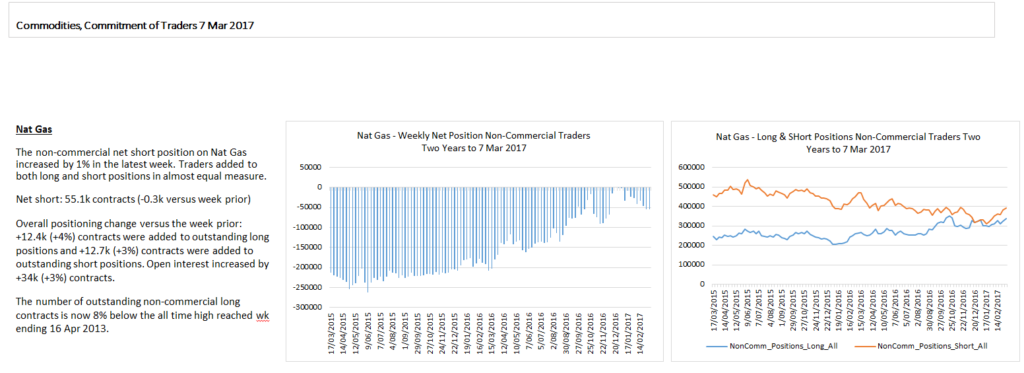
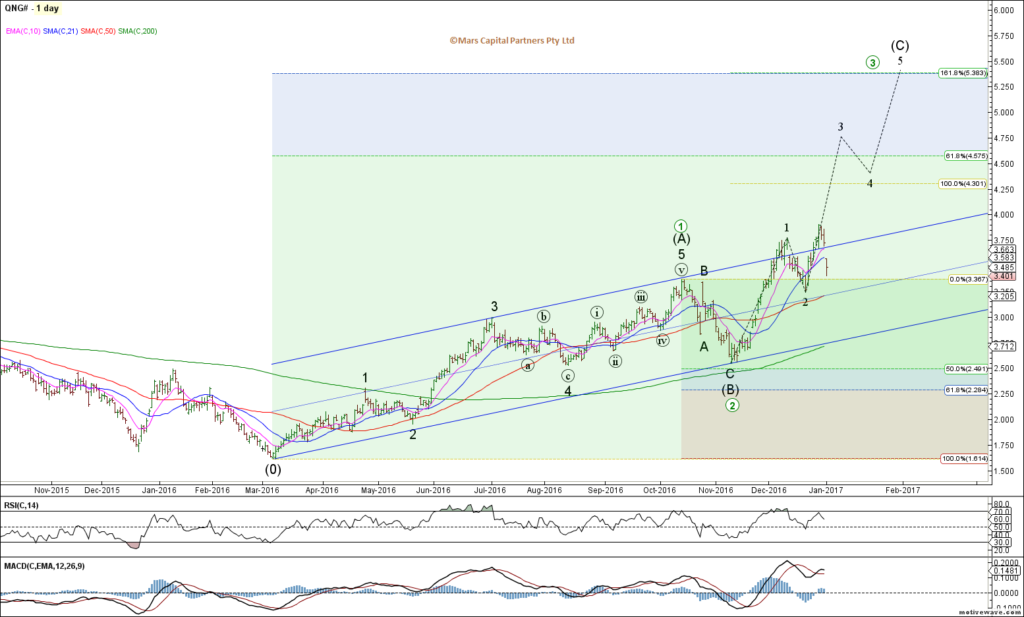
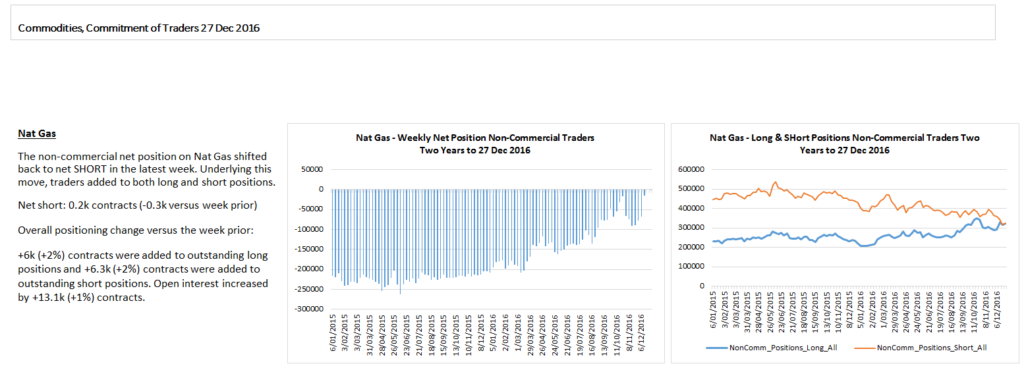
Natty Gas continues to break hearts as it ripped higher from our support area – the count is unclear but we should expect an initial upside target in the 3.40-45 area. I would not chase this but look for a 3 wave correction of this current advance to add longs – the reality is we continue to range trade and we are now back to the middle of the range. I have no strong long term view for NG.
NG Daily
Overloaded Natty shorts have been torched as expected.
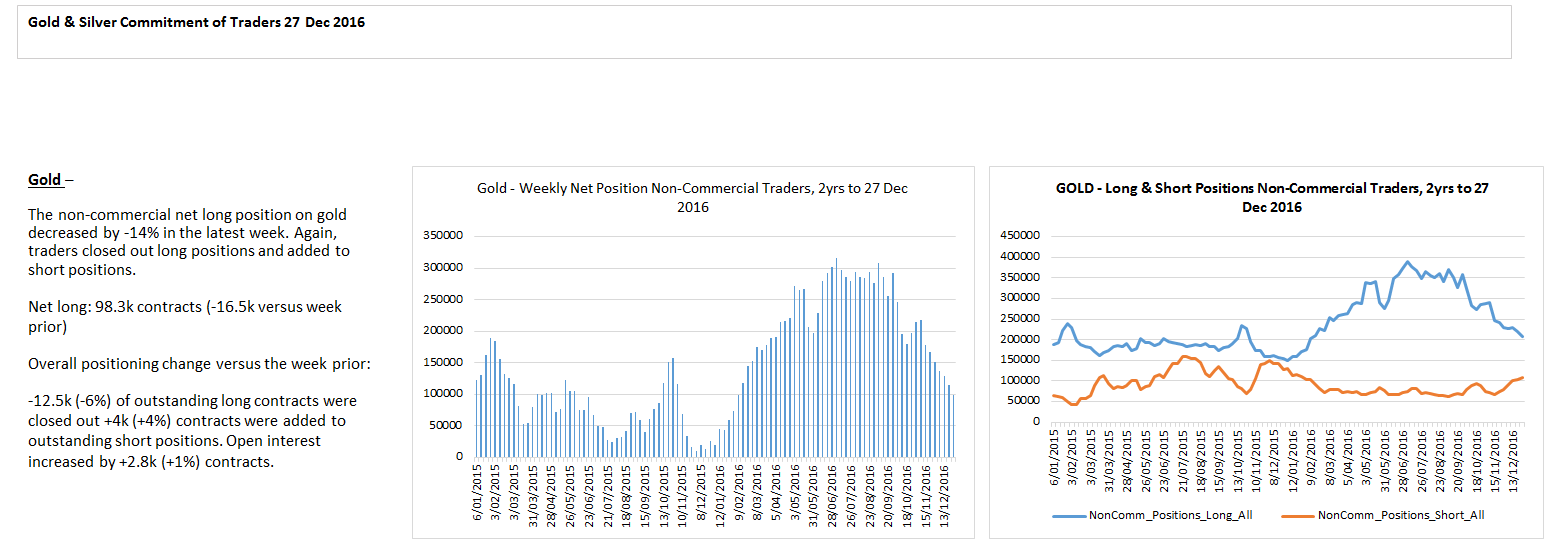
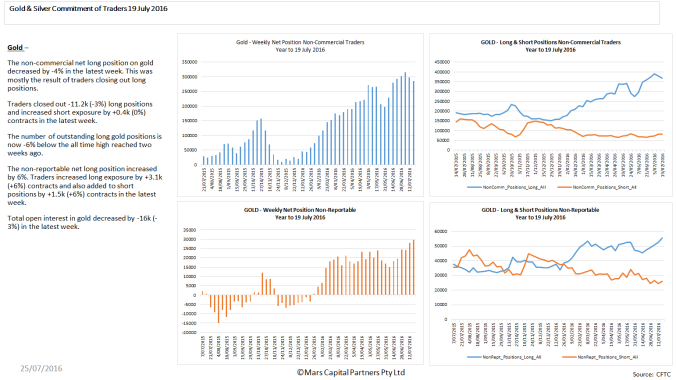
To the PM’s and we remain bearish from a bigger picture perspective. 2018 will likely be the year that Gold declines towards our $700 target which will be where we will be getting very long physical Gold. The immediate question is whether prices turn down from the red triangle resistance or pushes through higher towards 1450 targets. This will largely depend on the US$ in the near term as we look for a bullish reversal.
Gold Weekly
Gold Daily
Interesting that the bulls have been reluctant to jump on this latest rally but still very few shorts.

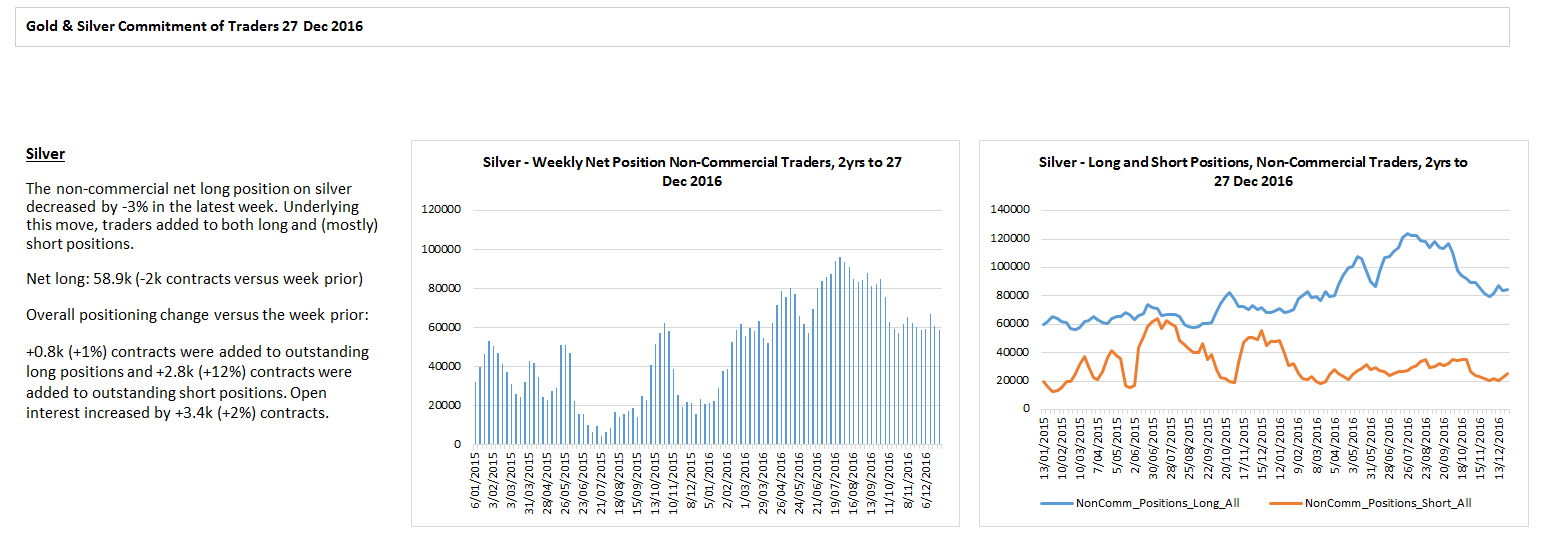
Silver also continues to look bearish from a bigger picture perspective with a continuation of 3 wave corrective structures within a triangle.

Silver Daily
Silver shorts smoked again as it rips higher from our support.

That’s all for now folks. Looking forward to a great 2018 🙂
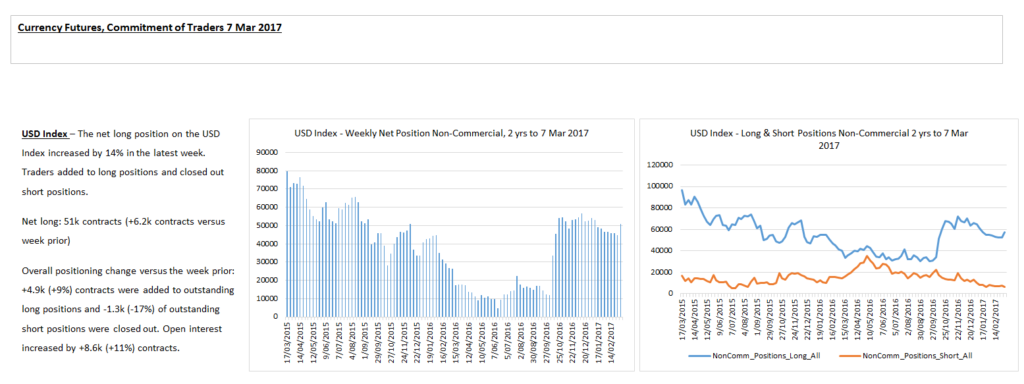
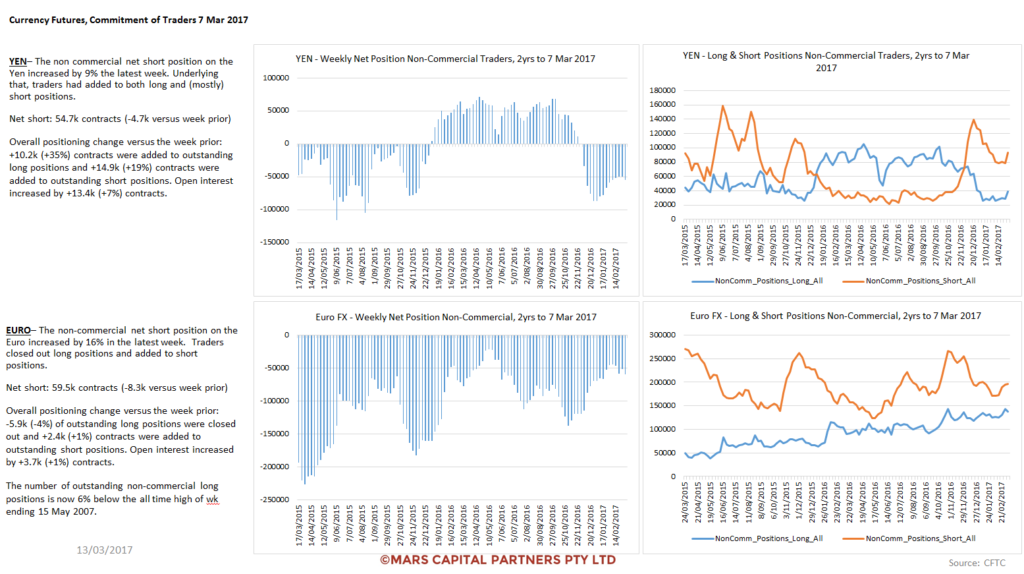
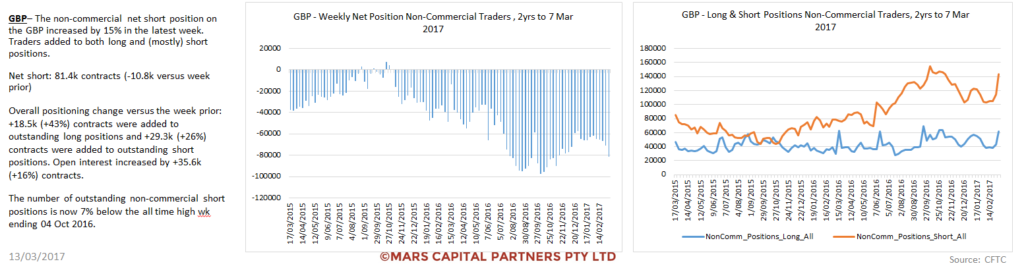
by Mars Capital Partners | Mar 13, 2017
Fractures in the global equity markets continued last week. I continue to believe we are in an intermediate degree 4th wave (which are almost impossible to trade effectively). A number of global equity markets appear to be topping while commodity bulls have been killed. Crude Oil, Dr Copper and Silver are all good examples of what happens when all traders are on the same side of the boat – it eventually tips. This is why we follow the COT and sentiment data closely – it tells us when to bet against the herd. The consistent theme here is that we are looking for near term market tops across a broad spectrum of global equity indices.
My themes for this week are for continued US$ weakness while looking for a bullish reversal in US bonds and Precious Metals. Equities will remain tricky to trade as we whipsaw through this 4th wave correction.
The next key opportunity I am focused on is the long US bond trade to bet against the herd:
(i) The EW structure tells us the 9 month decline is ending
(ii) Bearish sentiment is at an extreme
(iii) Bears are “all-in” short
(iv) FOMC / PPI / CPI this week likely will trigger a bullish reversal
(v) Bank stocks are likely topping
The other trade setup I like is long GBPUSD:
(i) The EW structure is bullish
(ii) Bearish sentiment is at all time extremes
(iii) BOE later this week
(iv) FTSE looking very toppy here
To the equity markets and US equities continued to chop lower, led by the Russell and small caps while the Nasdaq remained the strongest. The declines are not clearly impulsive as bulls and bears fight it out at the end of wave 3. I continue to believe that risk remains to the downside near term as this 4th wave of intermediate degree unfolds. The SPX completely closed its Trump rally gap as expected and found support at the 21 day sma. While we cannot discount the potential for a marginal new high towards 2410, I think this is akin to picking up pennies in front of a steamroller. 4th waves are tough to trade. The bigger picture structure remains in a bull market long term.

SPX Daily
The ES structure continues to be choppy (but descending) and we didn’t get a good r/r short signal last week. I still think the safest bet is to trade the extremes and bigger picture levels and not chase this whipsawing market. I still prefer shorts around the 2380-2390 area as I think they are better r/r than being long at this time. I will tweet a trade setup if I see something I like.
ES_F H4
Bulls are still believers and have added to longs up here.
The Nasdaq, Banks and DJIA all had inside weeks and are at risk of failure here to coincide with this week’s FOMC meeting. I expect volatility to increase in line with my strong bond outlook. I am alert to a break of weekly exponential trend support in the Nasdaq likely triggered below last week’s lows. The uptrend has NOT been broken yet so it’s best to wait for confirmation IMO as it still looks strong.
NDX Weekly
If I am right about an impending bullish turn in bonds, I suspect the banks will take the biggest hit so I am watching for an inside week and down. Also note that the XLF is at an interesting juncture in its Elliott Wave structure and long term FIB resistance. I don’t really trade equities and ETF’s but I am tempted to buy some puts here.
XLF Weekly
The NKD bounced strongly from the support area we identified for the 4th wave triangle and is now challenging strong overhead resistance. I see two main potential counts here: (i) 5th wave triangle thrust up towards 20500 to complete 5 of (C) or 3 (black count) and (ii) an ending diagonal 5th wave (red count) which should remain below 20012 to remain valid – Importantly, both of these structures are ending waves so longs should be cautious here.

NKD H4
Nikkei traders are all anticipating a break-out and continue to add longs.

The ASX200 also appears to be putting in the final waves to end this rally. I am not convinced of the bigger picture count but I am alert to failures of rising wedges (ending diagonals). Risk remains to the downside here for the Aussie market. Ideally, I would like to see a spike to new cycle highs followed by a bearish reversal. That would be a short setup I would be interested in taking.
ASX200 (SPI) Daily
The European indices also appear to be completing wave 3 rallies and risk remains to the downside. Ideally the Dax makes one more marginal new high to complete its ending diagonal wave (v) of 3 before declining in wave 4 shown below.
DAX Daily
The Eurostoxx50 pushed higher last week and now has enough waves in place to complete wave (v) of 3. While this small degree 5th wave may extend for one more marginal new high to align with the DAX, I am alert to a bearish reversal here this week and will be looking for short setups.
ESTX50 Daily
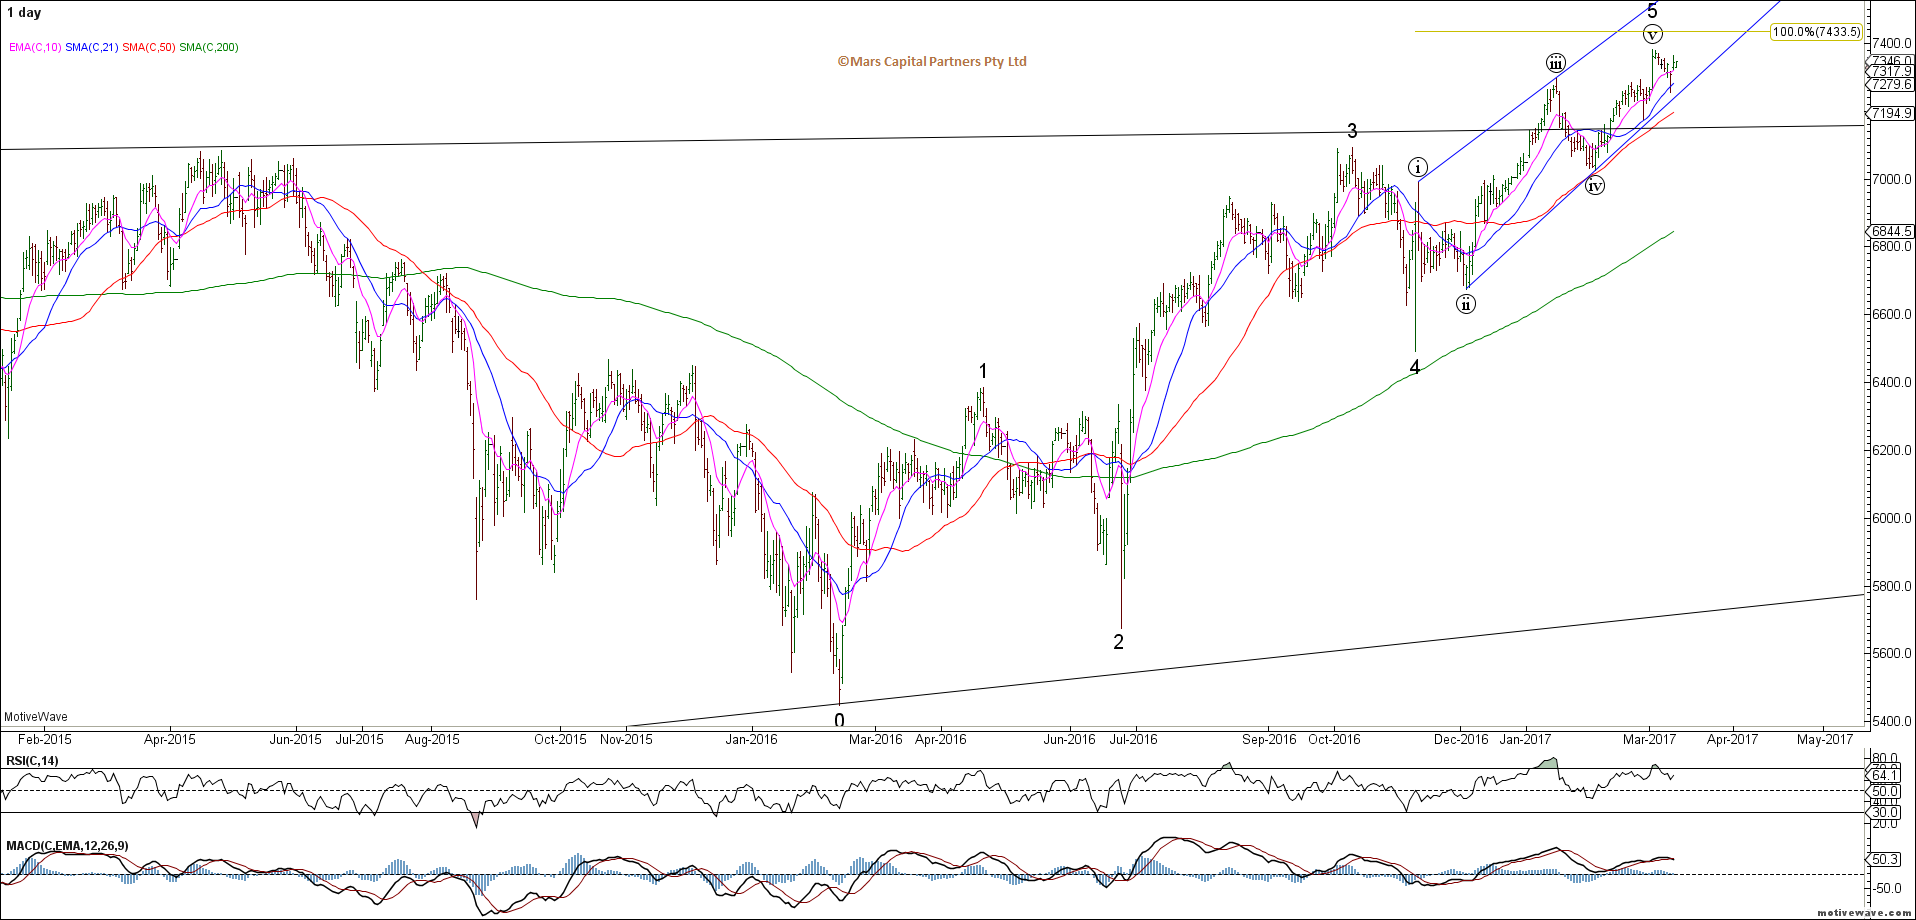
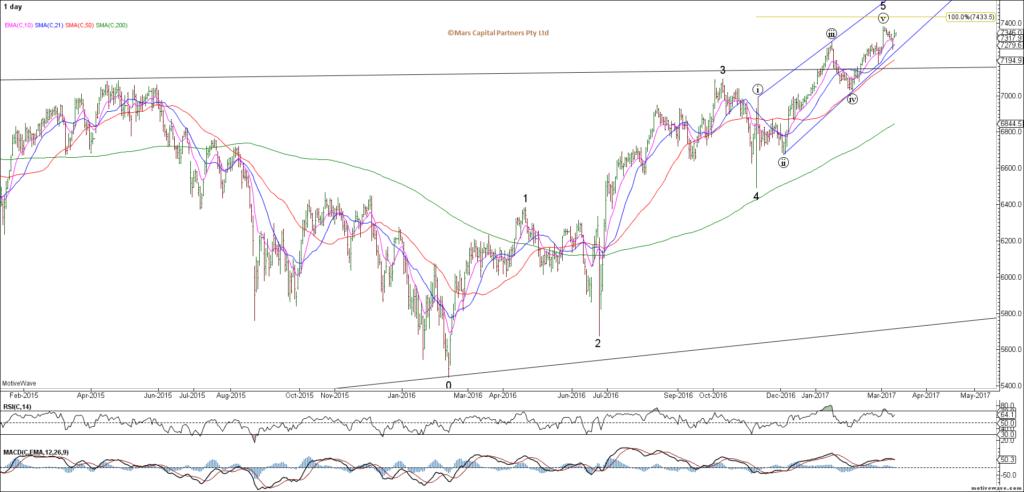
The FTSE which has been a market leader (assisted by the weaker GBP) also appears to be completing wave (v) of 5 with natural targets in the 7433 area. This index is particularly vulnerable given my outlook for a strengthening GBP this week. We have momentum divergences appearing across multiple time-frames but it refuses to die just yet.
FTSE Daily
To the bond markets and yields have made new cycle highs as expected (new price lows). Remember, this is a terminal (ending) move in the US bond markets and I expect a bullish reversal this week.
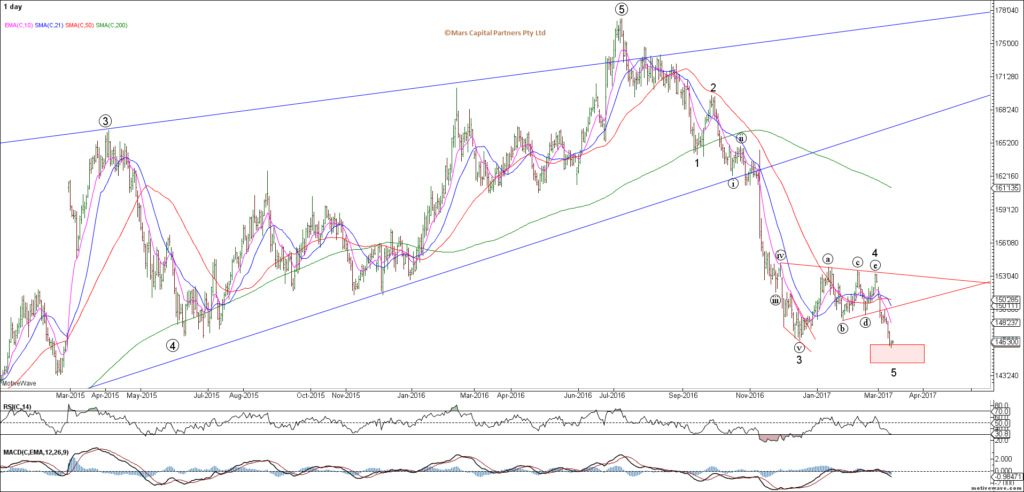
US 30yr Daily
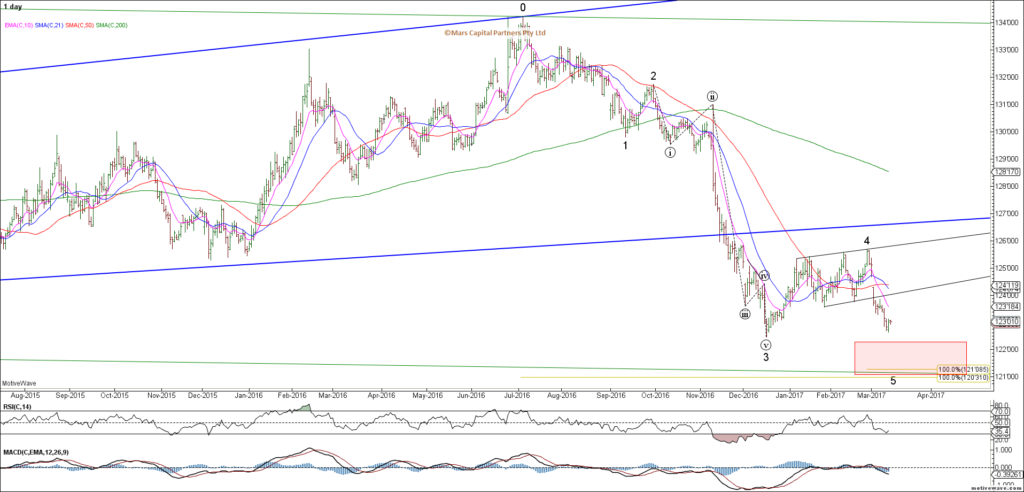
US 10yr Daily
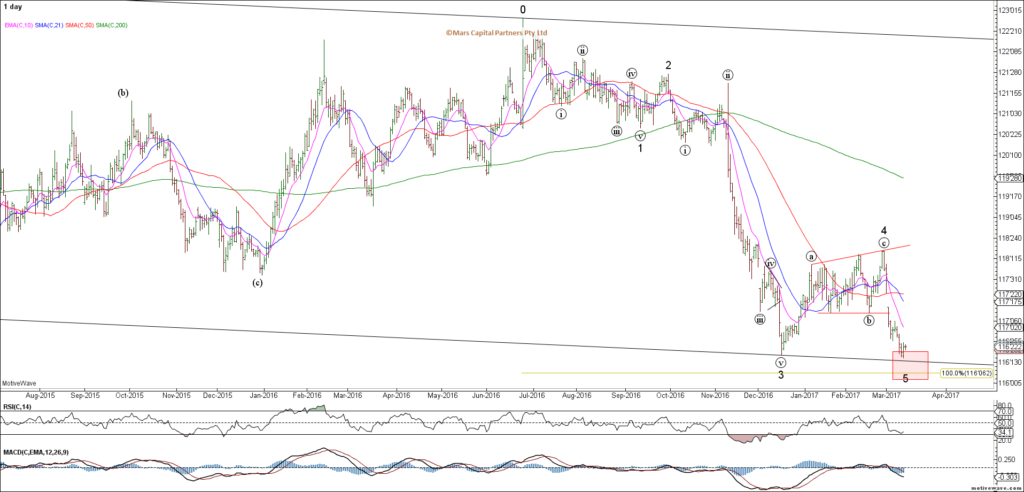
US 5yr Daily
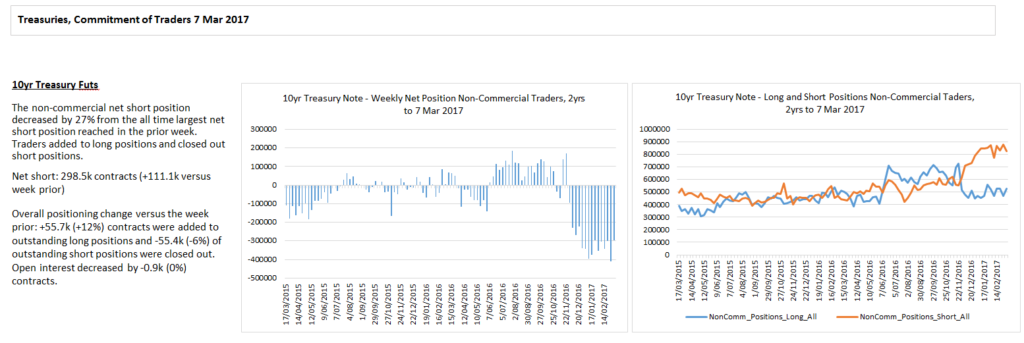
Treasury shorts remain at extreme historical levels…

To the FX markets and my call for a weaker US$ against consensus appears to be playing out. The rally from the wave A lows is clearly corrective and should be fully retraced with wave C targets below 99.00. So far the decline is only in 3 waves of equality so we must be mindful of the potential for a more complex correction but the DX turned down from 0.618 Fib resistance so remains bearish until proven otherwise.

DXY Daily
The Euro remains the cleanest pattern as described last week and has the potential to rally back towards the 1.0930-1.0980 area to complete wave C of (2). Our initial target of 1.07 has already been met but the wave structure does not look complete. I remain bullish the Euro until proven otherwise.

EURUSD Daily
The USDJPY pushed to a marginal new high above wave (a) which is a minimum expectation for wave (c) of B. I suspect the USDJPY will push to new cycle lows in line with the broader US$ complex. This is still not the cleanest structure but I find it hard to be bullish this pair given it reversed lower from a cluster of Fib resistance.

USDJPY H4
The GBPUSD is setting up as my favourite long trade setup right now. With extreme bearishness and a corrective decline that is currently holding key support, I like the long side of this trade against the January lows. The BOE later this week should help this trade with minimum upside targets in the 1.26 area and potentially much higher.
GBPUSD H4
Extreme bearishness in the Pound continues… into support
The Aussie$ achieved our minimum downside objective at 0.7520 so I am neutral here. The decline can be interpreted as impulsive so I need to see the structure of the rally here to determine where we are in the bigger structure. We have no edge here in the middle of the range. I would expect strong resistance in the 0.7630 area which may set up our next trade.
AUDUSD Daily

The USDCAD continues to frustrate as I await the 1.38 area for better shorting levels out of this multi month congestion. I would prefer a few more shorts to get squeezed first before committing to the short side. Patience.
USDCAD Daily
Long CAD traders are still wrong.

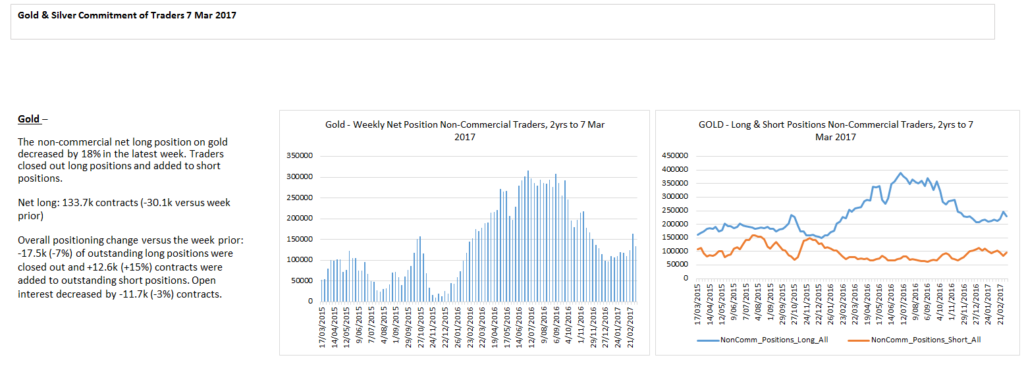
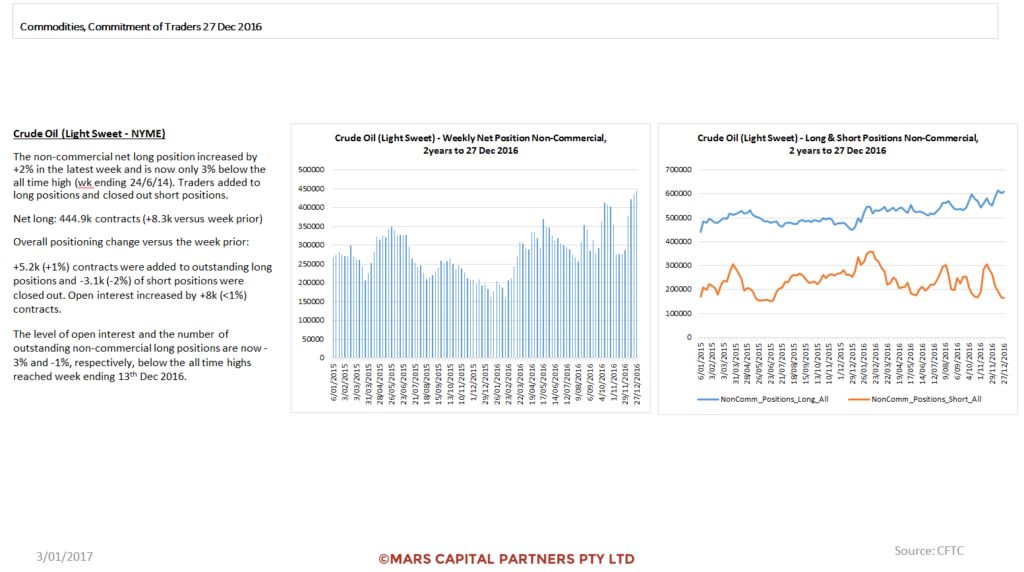
To the commodity markets and the over-committed longs got killed last week in CL, Brent and Silver (commodities showing the most extreme bullish readings). However, I believe this decline is the corrective 4th wave we were looking for. This week is a big test for Crude Oil and Brent. We are now testing the weekly 50 sma along with our 0.50-0.618 Fib support targets. I would like to see an early flush lower to support and evidence of a bullish reversal to get long.
CL Daily
Brent Crude Daily
Historically extreme long positions would have hurt…

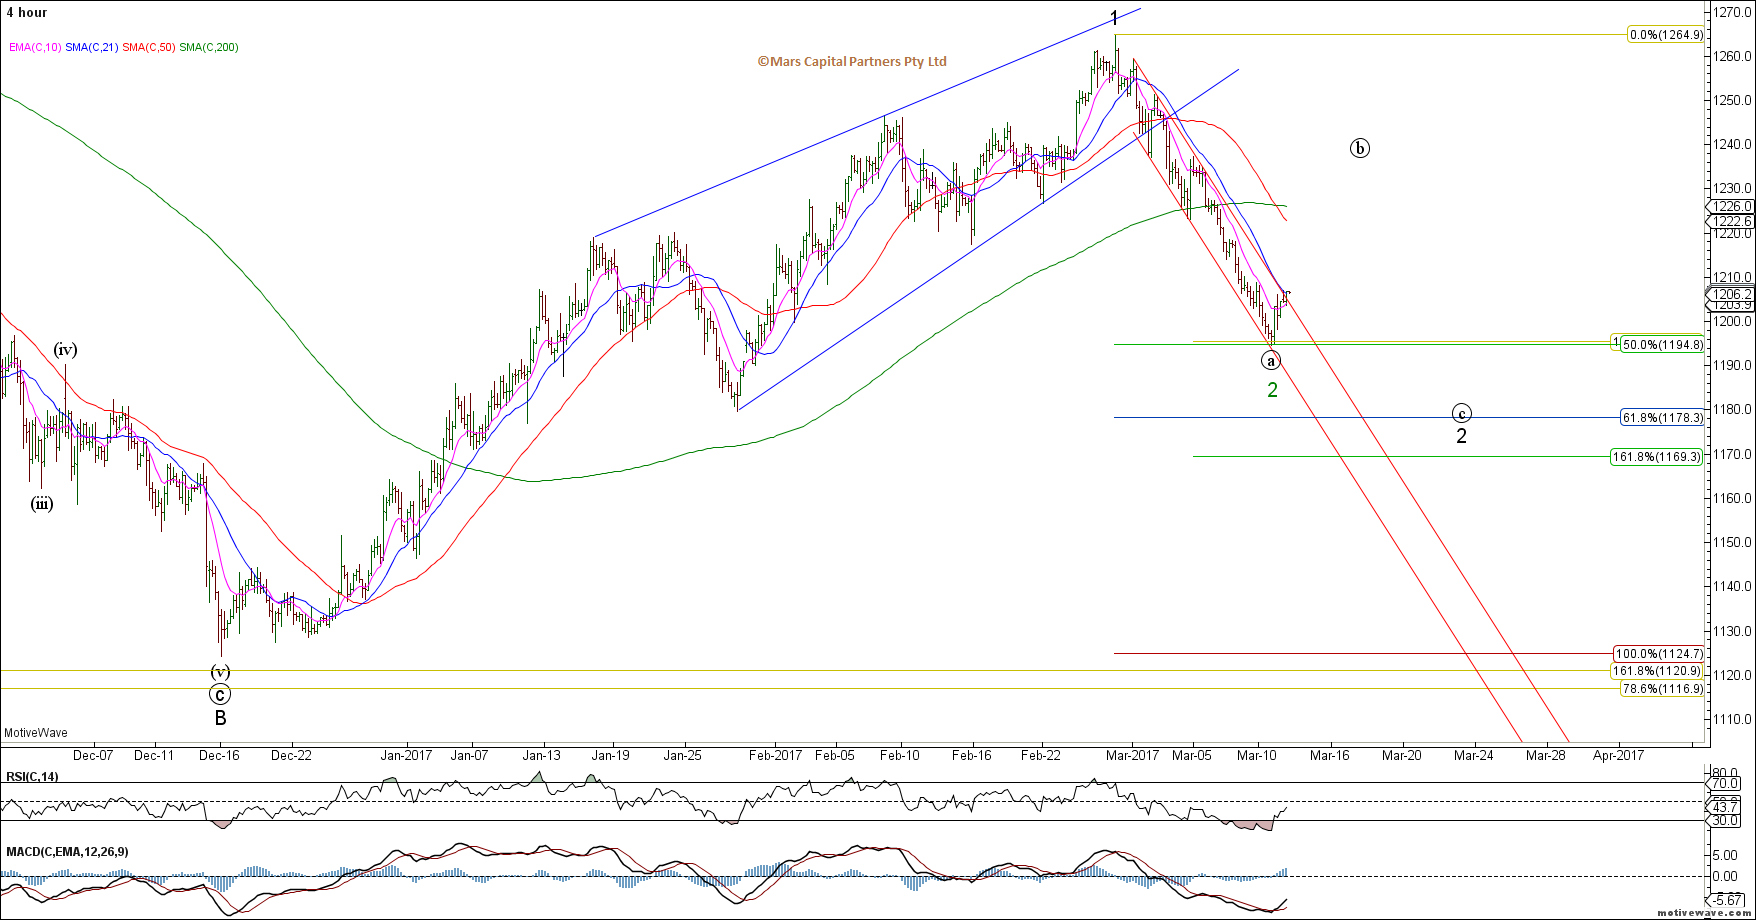
Gold is attempting to break out of its declining trend channel after it found support at the 50% retracement. If we hold last week’s lows, I will be looking for a wave (b) rally towards 1235 or something much more bullish (green 2 low) which assumes that ALL of wave 2 down is complete and we make new cycle highs towards 1300 (aligned with our weaker US$ outlook).
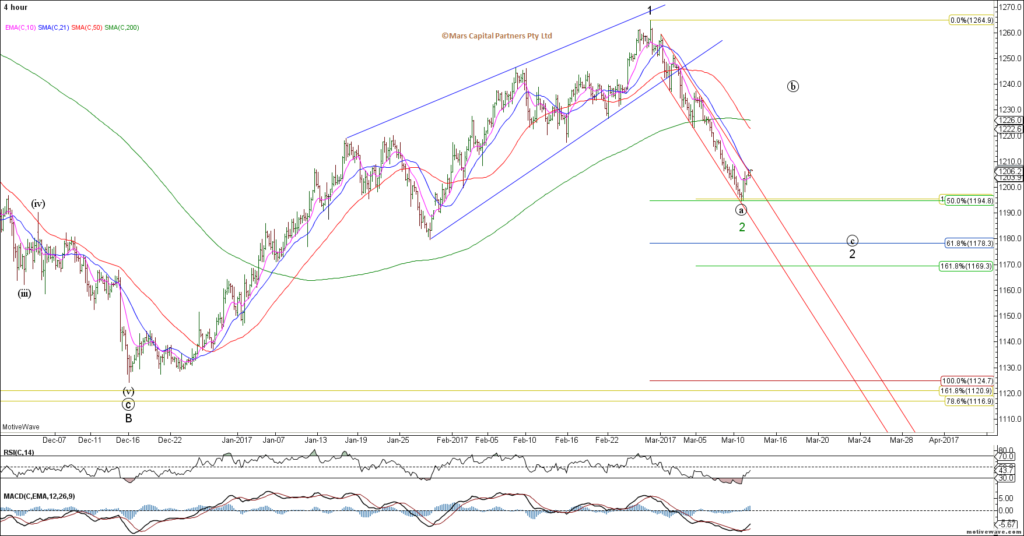
Gold H4
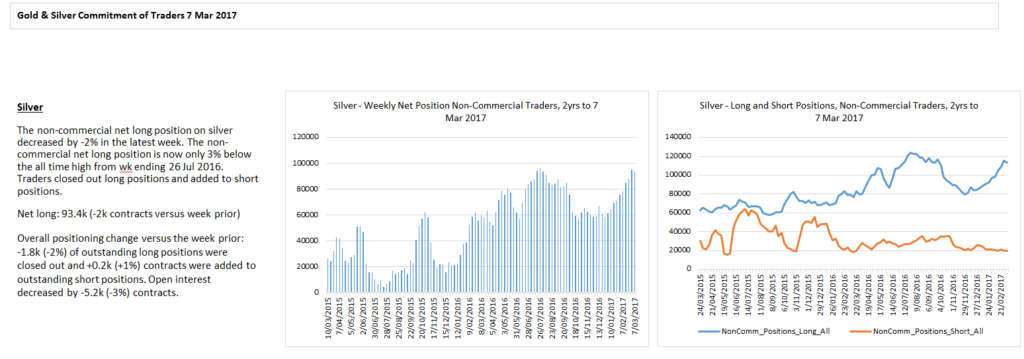
Silver got crushed again last week so I would be more reluctant to go long especially considering the rally off the December lows is corrective. I have no interest in trading Silver here even though it is currently testing 0.618 Fib support.

Silver Daily
Natty Gas made a liar of me and we didn’t get to buy it at 2.50. The rally from the recent lows looks impulsive and has now run into strong overhead supply (wave (A) lows). Importantly, the decline from the 3.90 highs is only in 3 waves (corrective) so I will be looking for a 3 wave pullback that holds above 2.50 to get strategically long Natty Gas. I’m not chasing it here into 50 day sma resistance.
Natty Gas Daily
Natty Gas traders are effectively neutral here.
That’s all for now folks. Have a great week 🙂
by Mars Capital Partners | Jan 3, 2017
As promised I’ve undertaken a strategic review of my outlook for 2017. I hope you get some value out of my planning for the year ahead – it took a week to write so I hope you enjoy it!
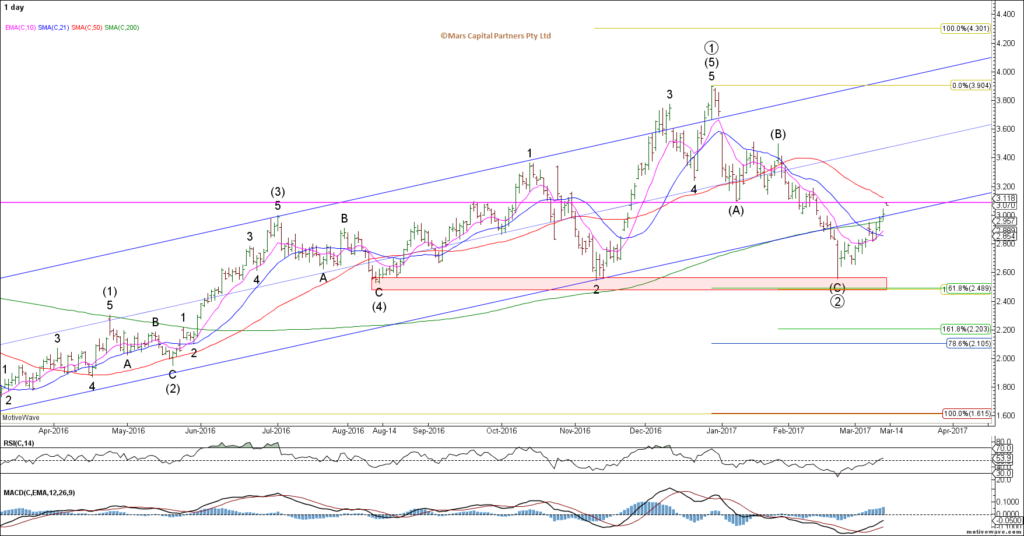
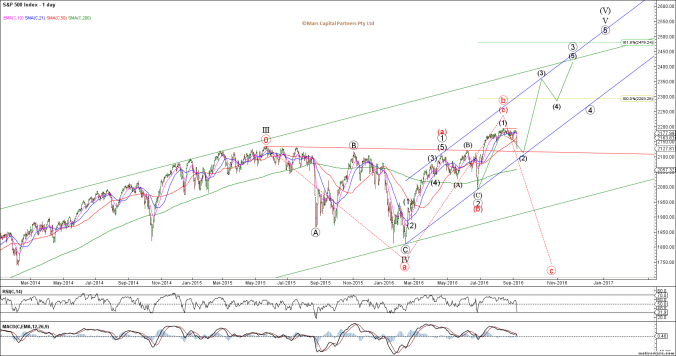
2017 is now upon us and we expect our themes of strong equities to continue. We are yet to see the market fully commit to this bull market as we continue to climb a wall of worry. Our forecast for 2016 was that we would see new ATH’s for global equities as the US took the lead on the global recovery. Our forecast 2017 is for higher equity prices as we continue this big picture wave V rally from the 2009 post-GFC lows – remember, this is an ENDING wave and we are currently in wave 5 of V as we expect this rally to end in 2017.
Our macro backdrop for 2017 includes rising global interest rates which will ultimately result in a tightening of financial conditions around the globe bringing about the end of the equity market rally. The world now has more net debt than prior to the GFC which has been sustained by low yields – the end result will be debt-deflation-destruction of capital so enjoy these healthy happy markets while you can as the party will likely end in 2017.
Our expectation is that global bond yields bottomed in 2016 and we should now see a multi-year rise in yields – not necessarily because the world is a better place and economic growth is expanding but rather credit risk and tightening financial conditions will lead to a failure of trust in the global monetary system.
Geopolitically, we will likely see the break-up of the European monetary experiment which will result in member nations like Greece and Italy depart the Euro as they reach to print their own money to help with balance sheet repair (like the US did) – this will be very bullish for the German led Euro currency – EW analysis confirms that this near term decline in the Euro and GBP should be a 5th and final wave down of major degree leading to big picture trend reversals in 2017. We are likely to see a rise in global isolationism led by Trump’s US-centric policies which will ultimately resolve in greater protectionism and decline in global trade – this will be a significant headwind for global equities in the latter half of the year.
Our strong US$ theme will be a major headwind for Precious Metals throughout 2017 as we look for much lower prices as gold ultimately targets $700-800 to the downside.
While the US equity markets have already achieved minimum conditions of wave 5 of V with new ATH’s, we expect this rally to continue to measured targets in the 2500 area for the SPX. At some point in 2017, we expect to be reversing our bullish bias and shift to strategic short positions when this rally ends. Trading a fast moving bear market is notoriously difficult as volatility expands but we will do our best to keep on the right side of the market. “IF” we are correct, the bear market should retrace the entire rally since 2009 but let’s not put the cart before the horse.
SPX Monthly
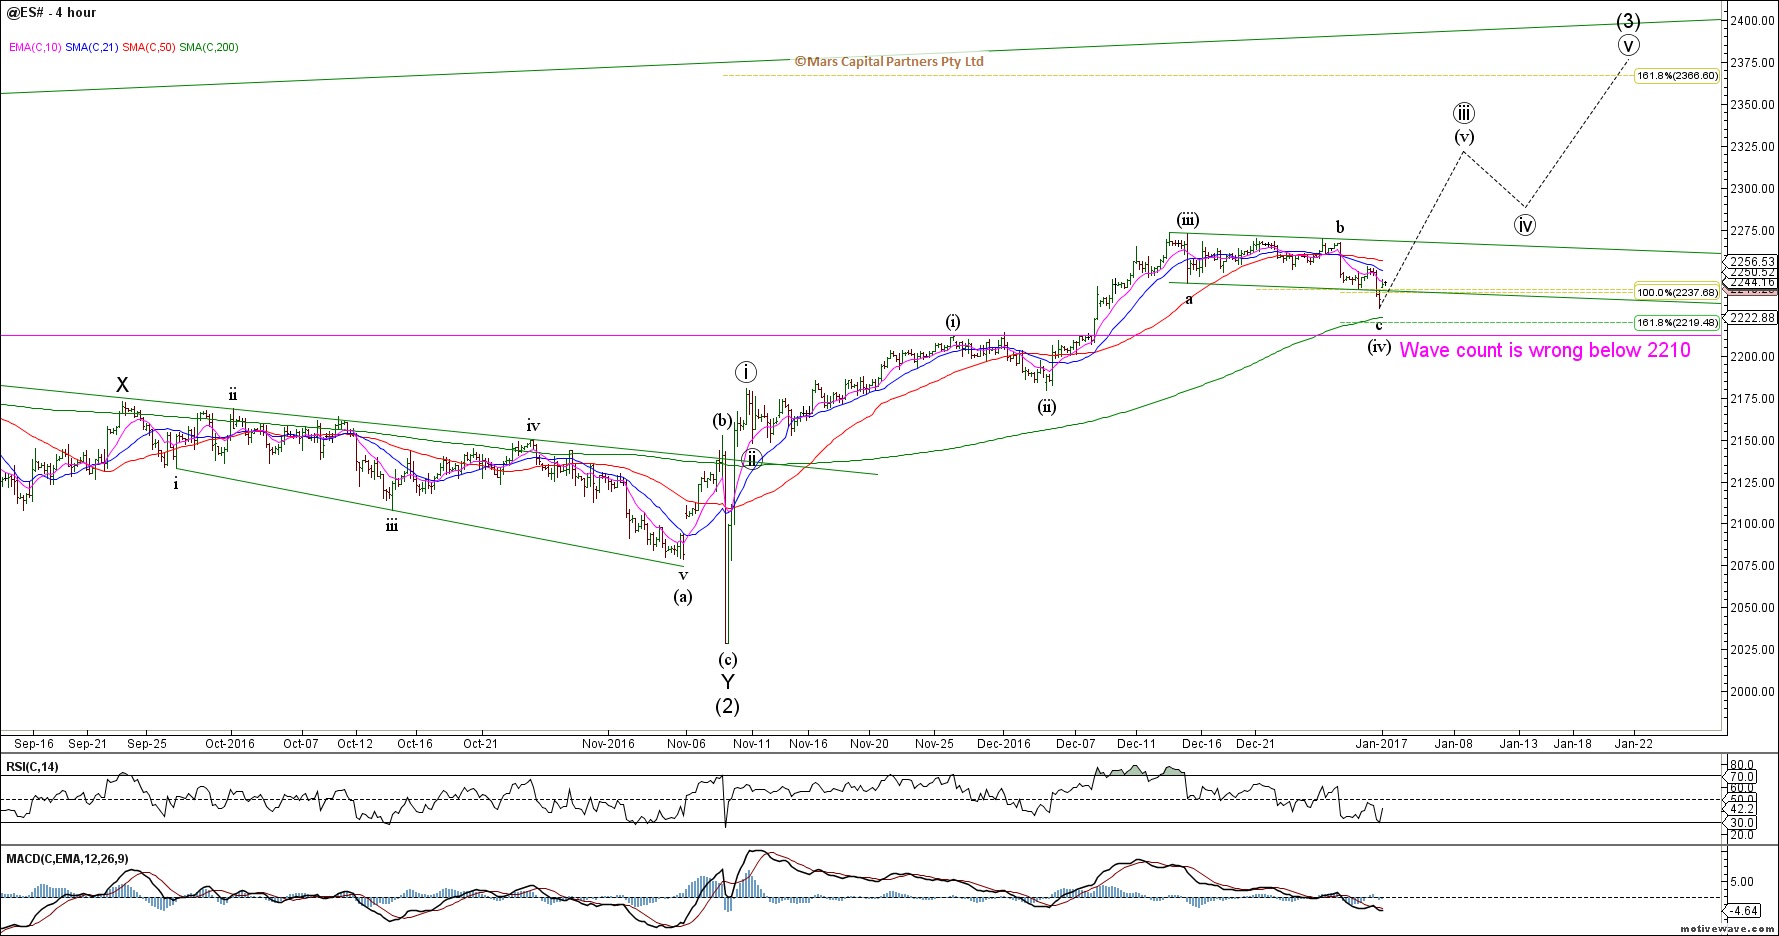
Our near term count suggests we are in wave (iv) of iii of 3 and the new year should kick off wave (v). This impulsive wave count may need to be revised on trade below 2214 – we remain resolutely bullish until proven otherwise.
SPX Daily
The ES_F shows the same impulsive rally pattern and remains in force as long as there is no overlap between wave (i) and (iv) below 2210.
ES_F H4
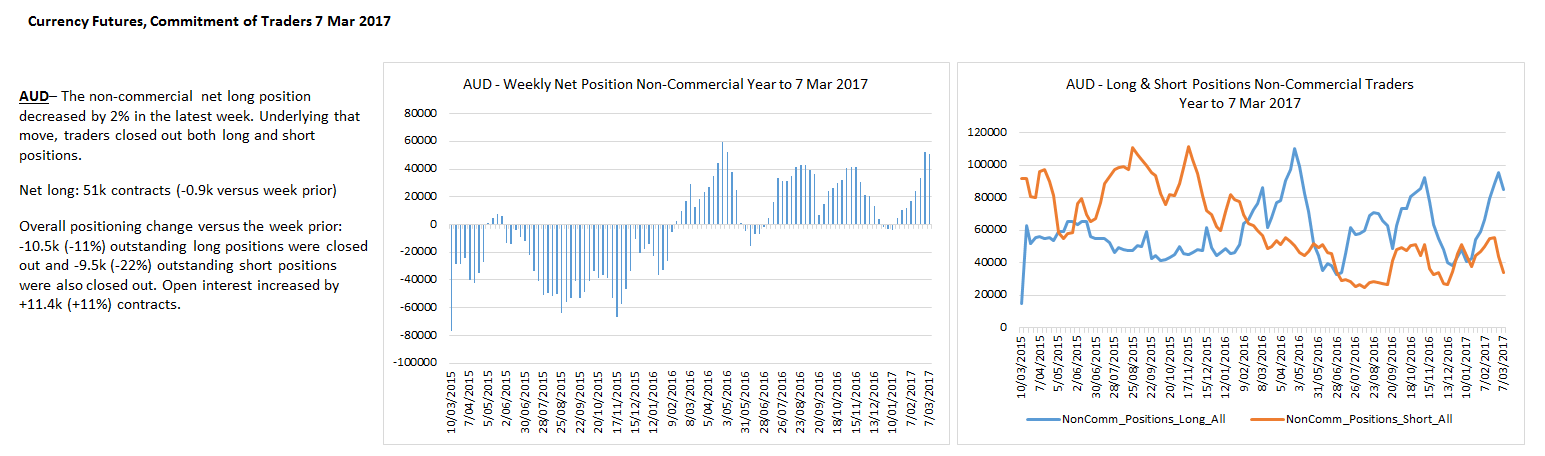
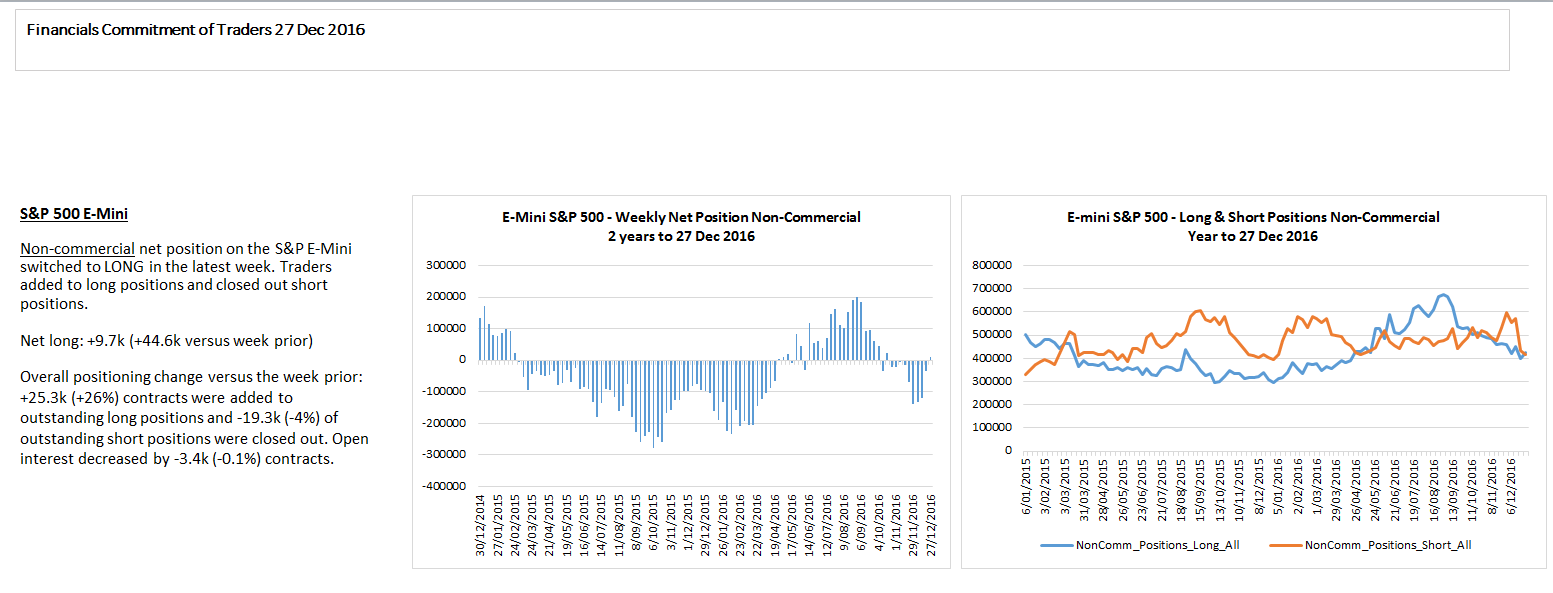
As we can see from the latest COT data, Traders have not yet bought into the nature of this rally and remain sceptical of the upside potential.
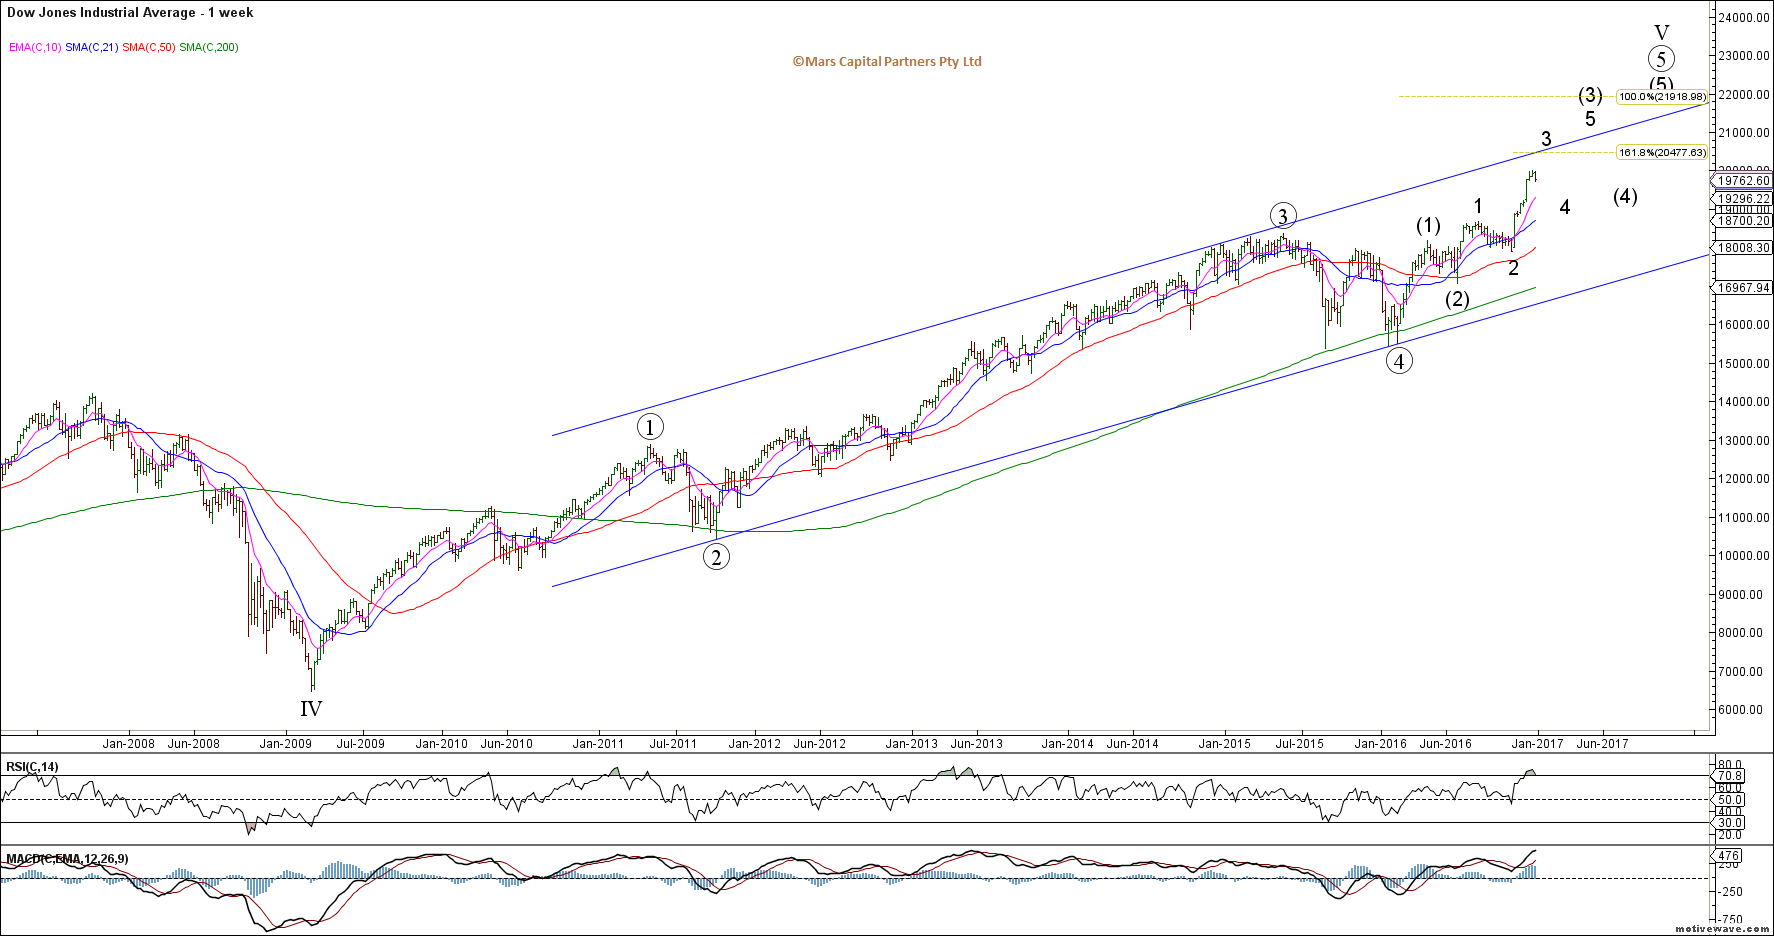
Our bigger picture upside targets for DJIA remains towards 22000 to complete wave 5 of V.

DJIA Weekly
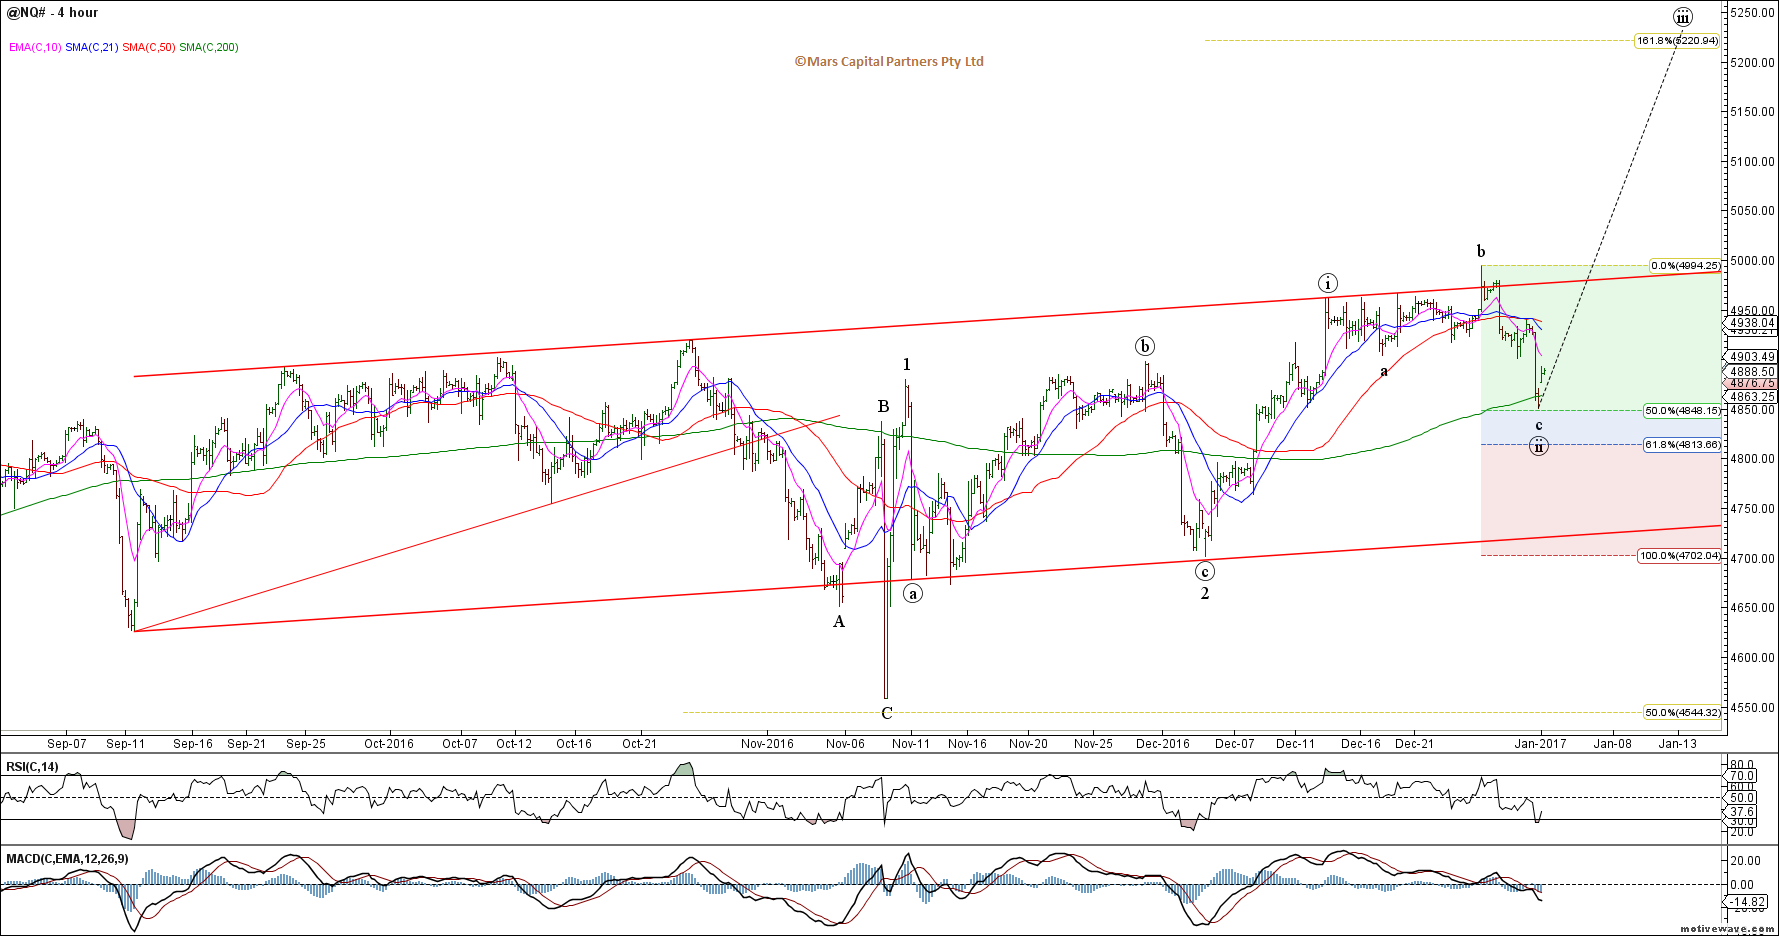
The Nasdaq continues to look bullish to me despite last week’s low volume decline as long as it holds support in the 4810-50 area. I expect this decline was wave c of an expanded flat (as Tweeted last week). What we want to see is an impulsive rally higher from here.

NQ_F H4
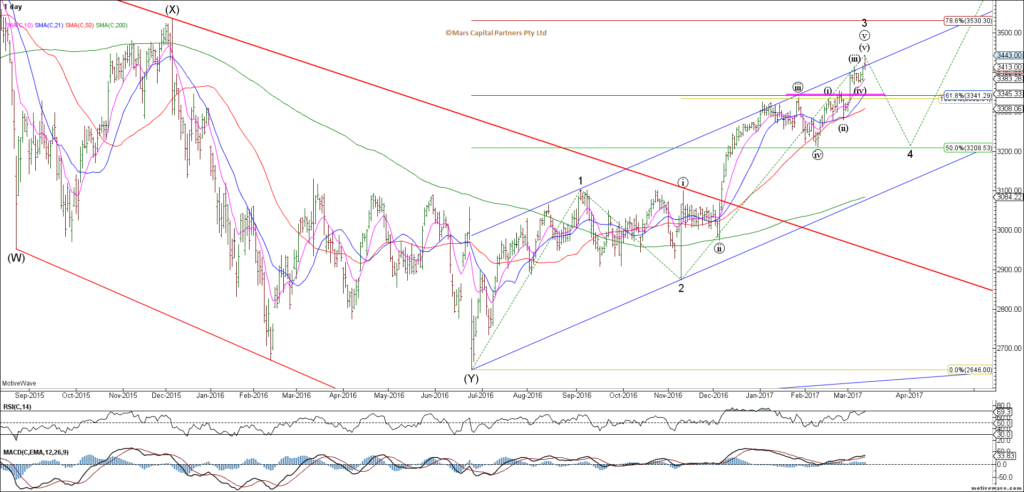
Our bullish bias in the European indices as our favourite pick has been well rewarded. The most important feature on the Dax chart is the fact that we now have a confirmed corrective 3 waves down from the 2015 highs – we must then expect new ATH’s for the European indices. In the near term, we have a cluster of Fib resistance in the 11650 area but I expect we will eventually push higher as shown below.
DAX Daily
As highlighted a few weeks ago, the FTSE was poised to reverse higher and we are now challenging ATH’s once again. I see nothing bearish in this chart to alter our bullish bias.
FTSE Daily
The Nikkei 225 has stalled at the 0.786 Fib retracement as has the USDJPY. So far the decline is only in 3 waves so we need to give the bulls the benefit of the doubt as we look towards new cycle highs.
NKD Weekly
NKD Daily
As posted last week, the ASX200 continues to extend higher towards the 0.786 retracement. This wave count is particularly unclear but you can’t fight a market with higher highs and higher lows. With the global bullish bias, I will only get short the ASX200 when the market tells me to. In the meantime I have no interest trading this as it is the most unclear pattern.
ASX200 (SPI) Daily
To the US bond market and the counter-trend rally continues as expected in this 4th wave. We remain very bearish bonds in the bigger picture and will continue to look for levels to get short again.
TLT Weekly
ZN Daily
The near term count in the 30yr met our initial upside objective of 150’15 highlighted last week. There are no signs of a reversal as yet. I do expect the downtrend to continue but 4th waves are difficult to trade so we will keep an eye out for short trade setups. No good R/R opportunities here at the moment.

ZB Daily
Traders are shorting into the hole here… which is why I am not in a hurry to join them.

Bunds continue to climb as we approach the 0.618 retracement of last year’s decline. As the decline was not clearly impulsive we must allow for the possibility of new cycle highs for the bund. A clear break of the 6 year trend channel would be the best indication of a change in trend. I am watching this closely for a good short setup as we remain bearish on the bigger picture.
Bund Weekly
To the FX markets and my main focus is on the US$ – Our DXI measured targets were met in December. The easy money has been made and now things get far more tricky and we will need to rely on the near term counts to determine where to from here. We are at an important juncture – There are enough waves in place to complete wave 5 of III for the DXI – however, our expectations are for a much stronger US$ with US centric policies being undertaken by the Trump administration. How we get there has important implications for precious metals and US Treasuries.
DXI Monthly
The Daily chart shows the potential for a completed 5th wave count and a deeper potential correction. We have had no clear signs of a reversal so we have no position here until we get a clearer picture of the near term structure.

DXI Daily

The Euro is in a similar position having met our minimum downside objective of new cycle lows. While our expectations are for prices below parity, it is more a question of “how” we get there.

EURUSD Monthly
The near term count highlights the potentials I am watching. Either wave 2 of (3) completed last week and we accelerate lower (black count) OR we see a more complex correction for red wave 2. Either way, we remain bearish from a big picture perspective until our downside targets are met with a completed structure.
EURUSD Daily
Traders pared back shorts into year end as expected but we may see a resumption of the short trade early in the new year.

The Pound looks to have found near term support at the 0.618 retracement after completing 5 waves down from December’s highs. We would expect the Pound to outperform the Euro near term. Ultimately we are looking for new cycle lows once wave 4 is complete from a bigger picture perspective.
GBPUSD H4
2017 should see an end to the decline in GBP as we complete wave 5 of C towards 1.10 – while the big picture decline is not yet over, we expect to get very bullish the Pound later in the year.
GBPUSD Weekly
The USDJPY holds the key for Precious Metals given its high historical correlation. We remain bullish this pair from a bigger picture perspective with upside targets closer to 150. The question is whether we continue to climb impulsively and directly to new cycle highs OR we get a more complex wave B?
USDJPY Monthly
Importantly, the near term wave structure is corrective so we are likely to push higher towards 120 at a minimum.

USDJPY Daily
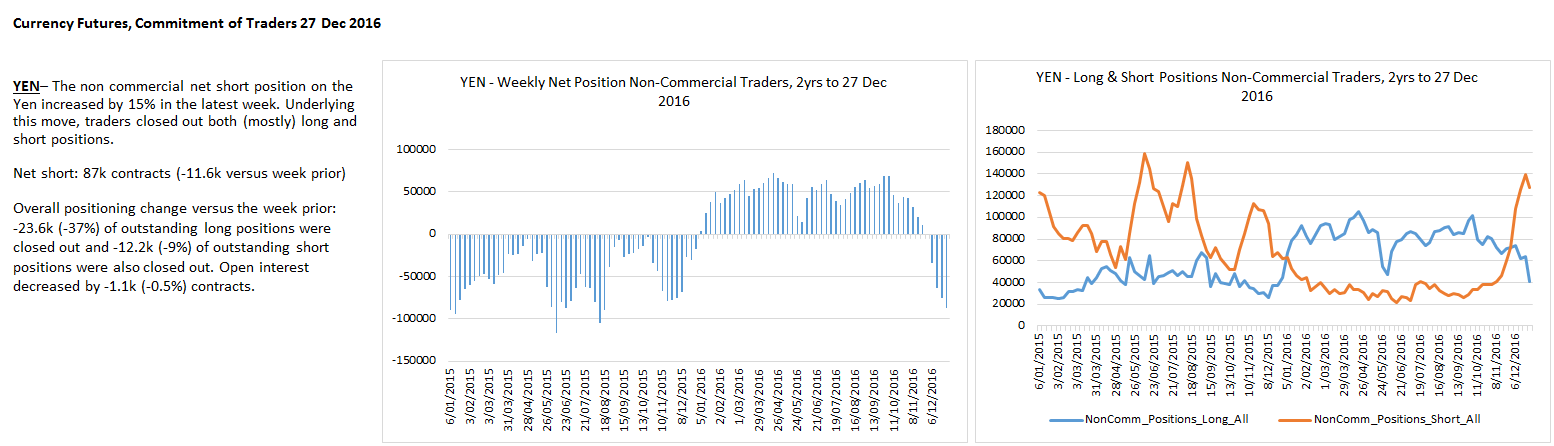
Traders are getting aggressively short the Yen here as we expect when the near term trend is ending.
The Aussie$ continues to hold near term support but we remain bearish as we look for prices back below the 2015 lows towards 0.65
AUDUSD Weekly
AUDUSD Daily
USDCAD continues to frustrate and I am now looking towards 1.38 to initiate long term shorts – alternatively, a break of the lower trend line will probably get me short. I am very bearish this pair from a bigger picture perspective.
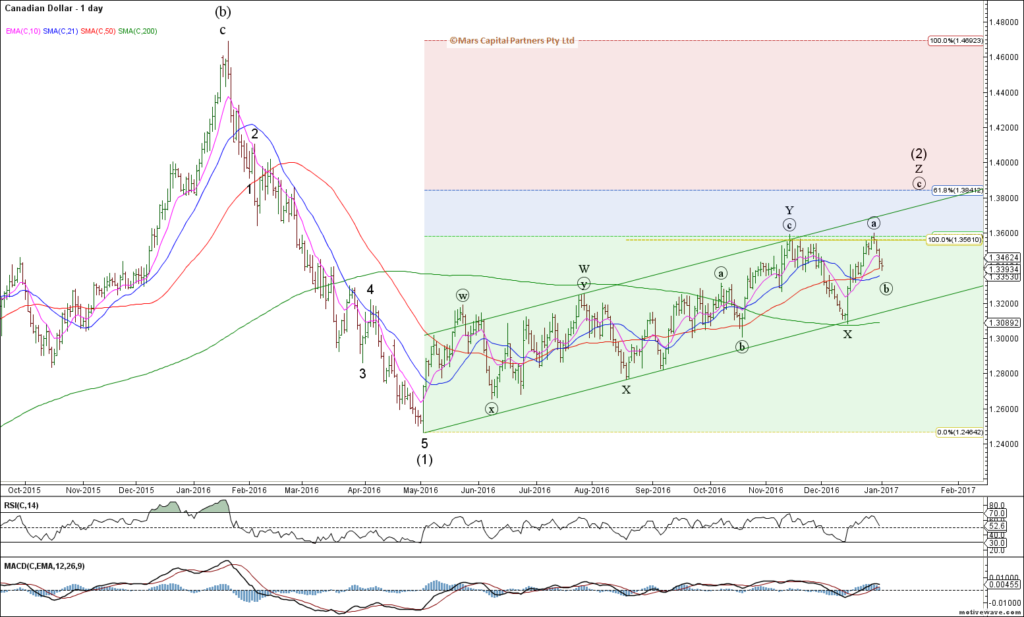
USDCAD Daily
To the commodity markets and the path of precious metals will likely be determined by the Yen. Our bigger picture outlook for gold is bearish but the question is whether we need another C wave higher towards 1485 first? The rally from 1045 to 1380 could be ALL of wave red B or just A of B – this will depend greatly on whether the US$ corrects first.

Gold Monthly
From a near term perspective, the rally in gold is not clearly impulsive from recent lows so we must respect the potentially more immediately bearish count here given our bigger picture outlook.

Gold Daily
Gold bulls are slowly capitulating…

The near term rally in Silver remains corrective so we expect new lows near term as it stair steps lower towards our initial targets.
Silver Daily
Silver Traders remain overly bullish given the decline in PM’s. I think they are wrong.

Crude Oil remains bearish from a bigger picture perspective as we are counting the 2016 rally as wave 4 with wave 5 down to come to retest the cycle lows. Expect strong resistance in the $59-62 area.
CL Weekly
The near term structure is unclear and may be forming an Ending Diagonal wave C towards our target area.
CL Daily
Traders appear to be max bullish which always has me looking the other way.
Dr Copper is trying to form a near term low before it pushes higher in wave 5 of C. The rally off the wave 4 low is not clearly impulsive so we should allow for a brief retest and undercut before it pushes higher near term.
HG Daily
Traders appear too bullish Dr Copper for my liking so I am not buying this yet.
Nat Gas had a nasty gap down today but I remain bullish while we hold the wave 2 low.
Nat Gas Daily
That’s all for now folks. Have a great week 🙂
by Mofar2016 | Sep 12, 2016
Dear Traders,
After 3 years of publishing my research in the public domain for free, I have decided to move my work behind a paywall. I would like to thank everyone that has followed and supported me over the years. My new website should be up and running within the next 2 weeks…
- The MCP Market Update will now only be available via subscription
- A Private Twitter feed has been established for subscribers
- The format and timing of my updates will remain the same
- My website domain will remain marscapitalpartners.com
- I will not be spamming or spruiking to my followers on @Trader_Mars
I hope you will join my subscriber community as we navigate these markets in the future. If not, then thank you for all your support as it has been greatly appreciated. This will be my final public MCP Market Update.
Yours sincerely,
Dario Mofardin
To the Market Update…
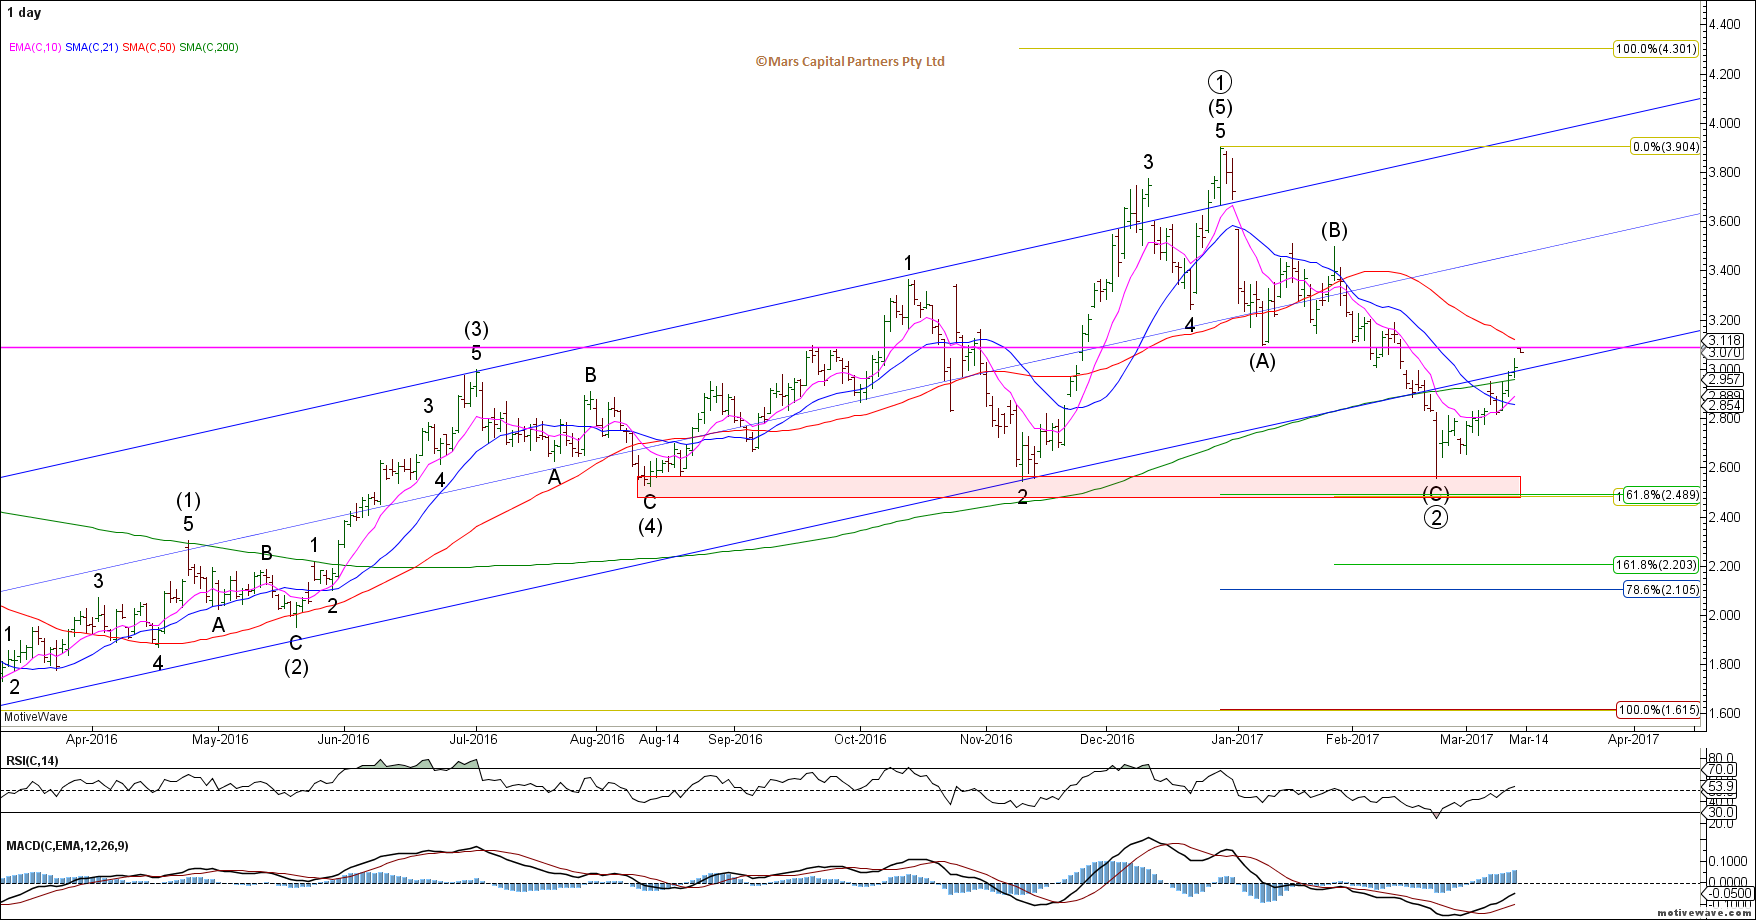
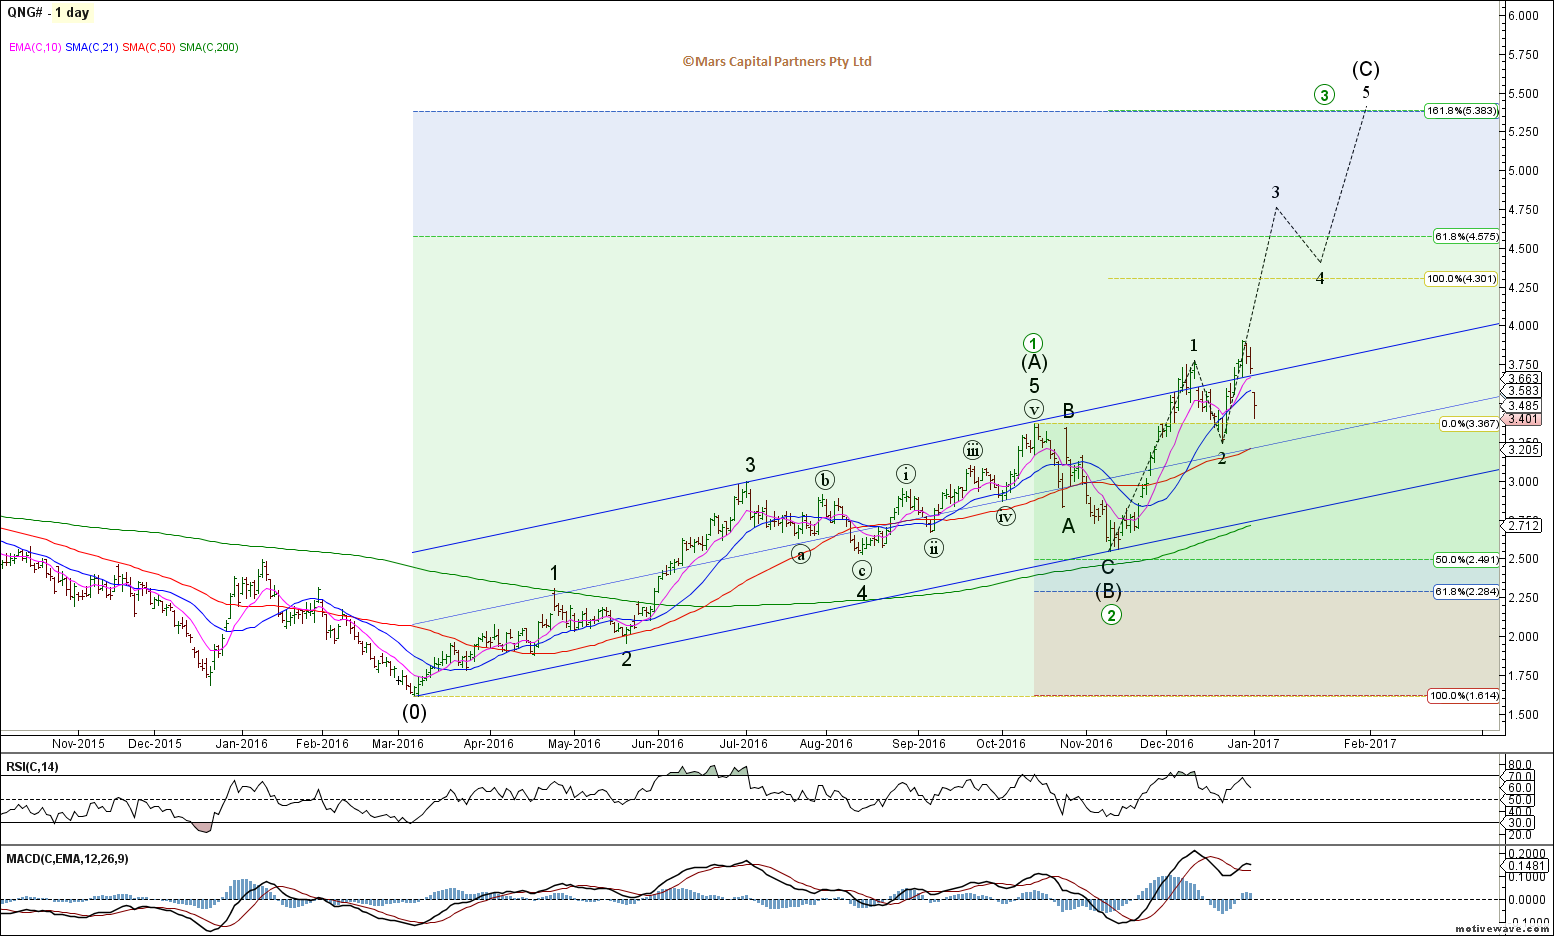
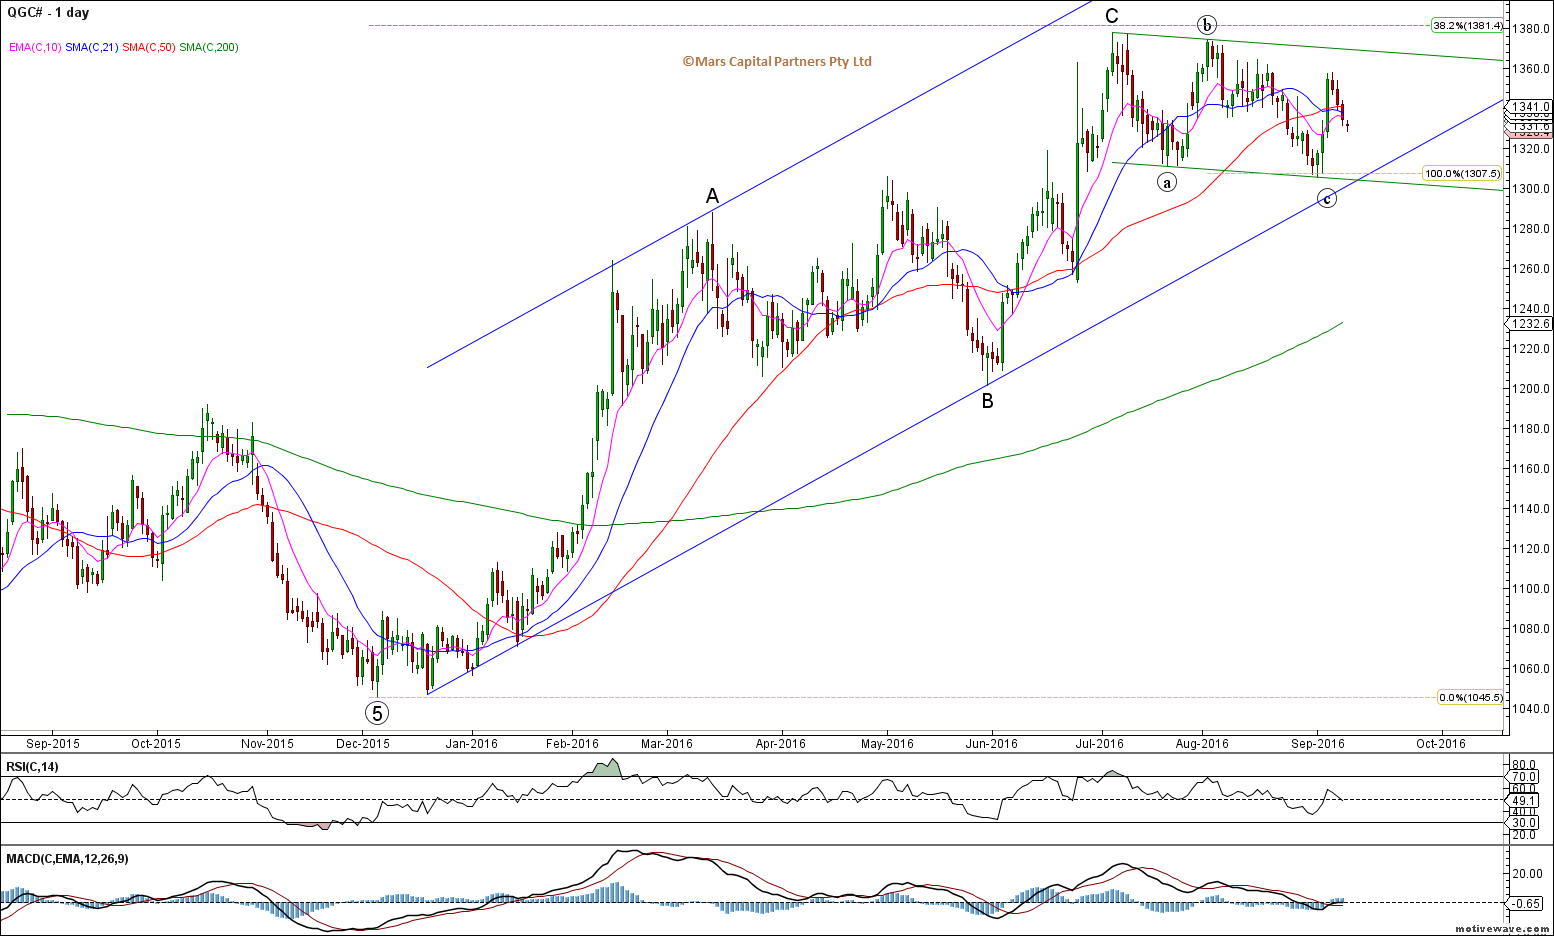
A number of commodity and FX markets are coiled within triangles (like TLT was) and set for fast moves.
Suppressed volatility inevitably leads to expanded volatility and that’s what we saw last Friday. Importantly, we were on the right side of the trade as clearly outlined last week. Forewarned is forearmed 😉
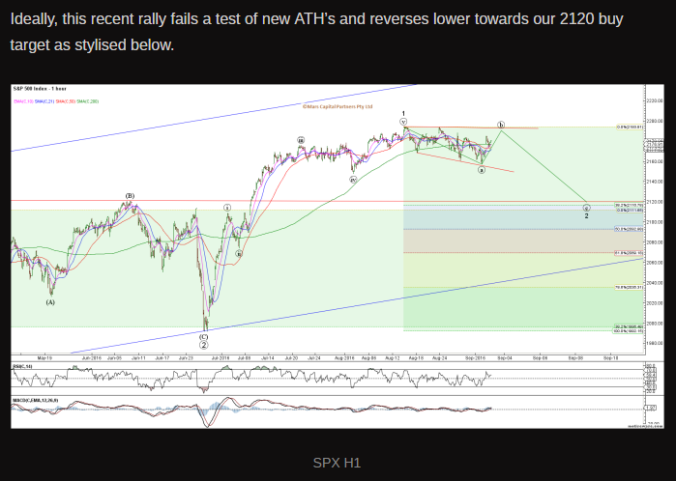
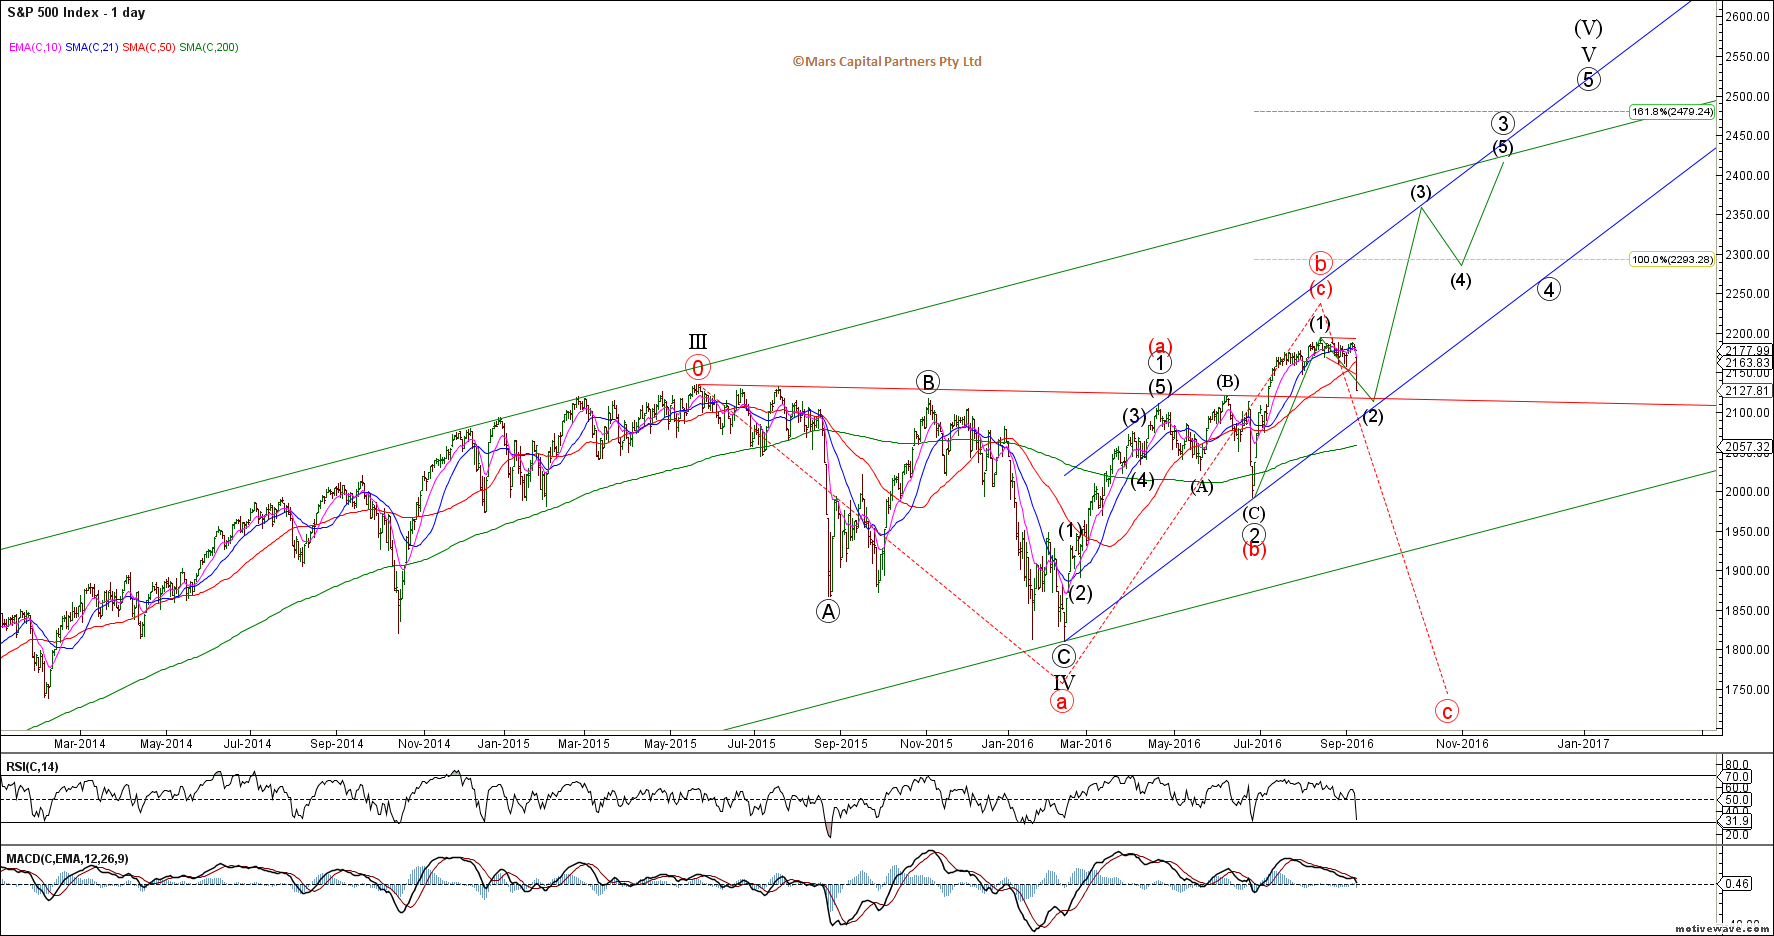
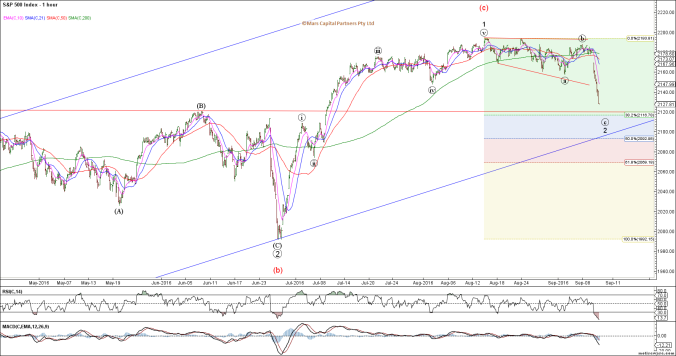
The ES is now 80 pts lower than where it was a couple of days ago. Now that our initial downside target of 2120 has been met, the question now is whether this decline was all of wave (c) down of 2 and a strong rally is about to kick-off or is the red bearish alternate count raising its head? The bulls need to stand up now! The bear case that I highlighted in my August 15th update could lead to a strong decline back below 1800. We are at a critical juncture here…
SPX Daily
From a near term perspective, support for the SPX comes in at 2116-20 and then 2092-2100. Below that and the wheels may fall off. Ideally, the market gaps down on Monday and reverses higher impulsively to hammer out a low.
SPX H1
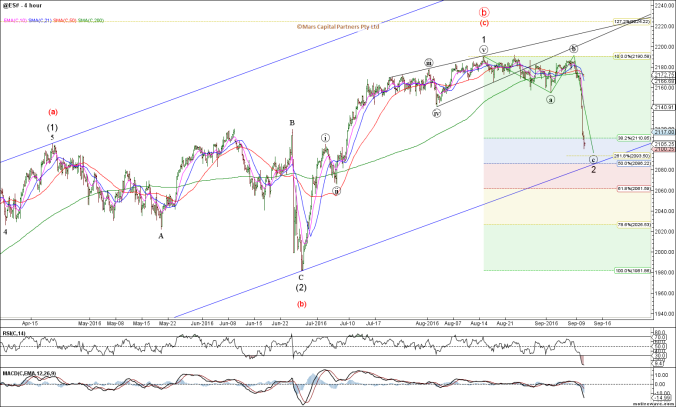
The ES has already seen some Sunday night follow-through selling below the 0.382 retracement and likely now targets 2086-93
ES H4
What concerns me about the bull case are the number of broadening formation top failures in other indices like the NDX / NQ – Last week’s high is now critical resistance for the bears.
NQ Daily
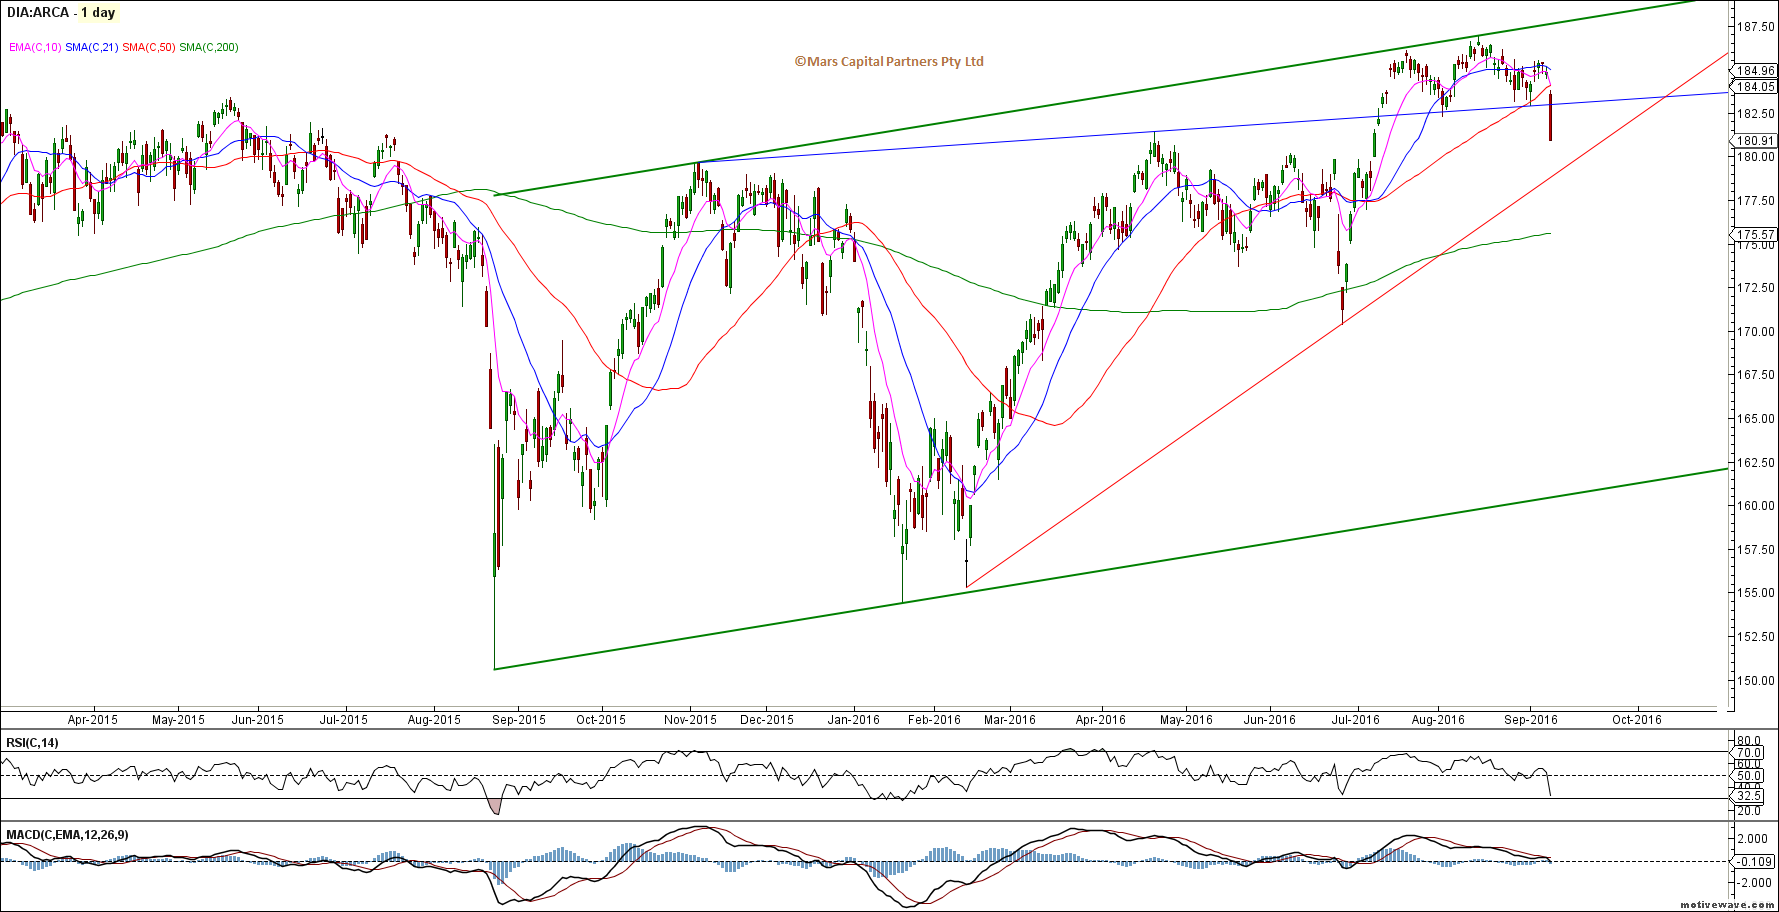
This DIA chart I posted some time back was illustrative of my “topping” concerns for the near term bull case and highlighted the green trend channel rejection and gap below the 50 day sma and small blue H&S break on Friday.
DIA Daily
The SPI (ASX200) is fast approaching its 200 day sma and green channel support – Bulls need to stand up here.
SPI Daily
We have been bearish the bond markets since the end of July and yields “finally” spiked higher across the board late last week. Unfortunately, the structure of the market made it difficult for me to really participate (but at least we weren’t long bonds). The TLT broke out and down from its triangle and closed at near term trend support. Remain bearish until proven otherwise.
TLT Daily
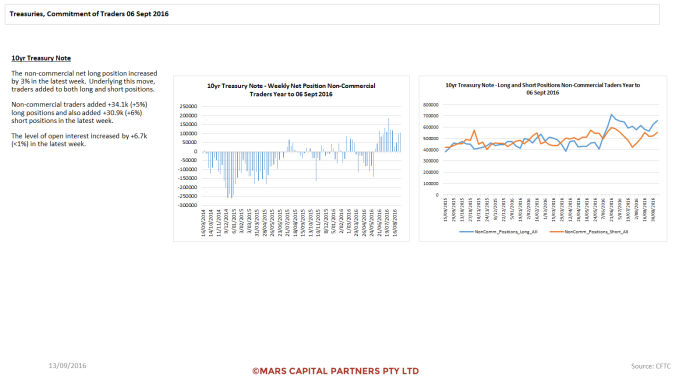
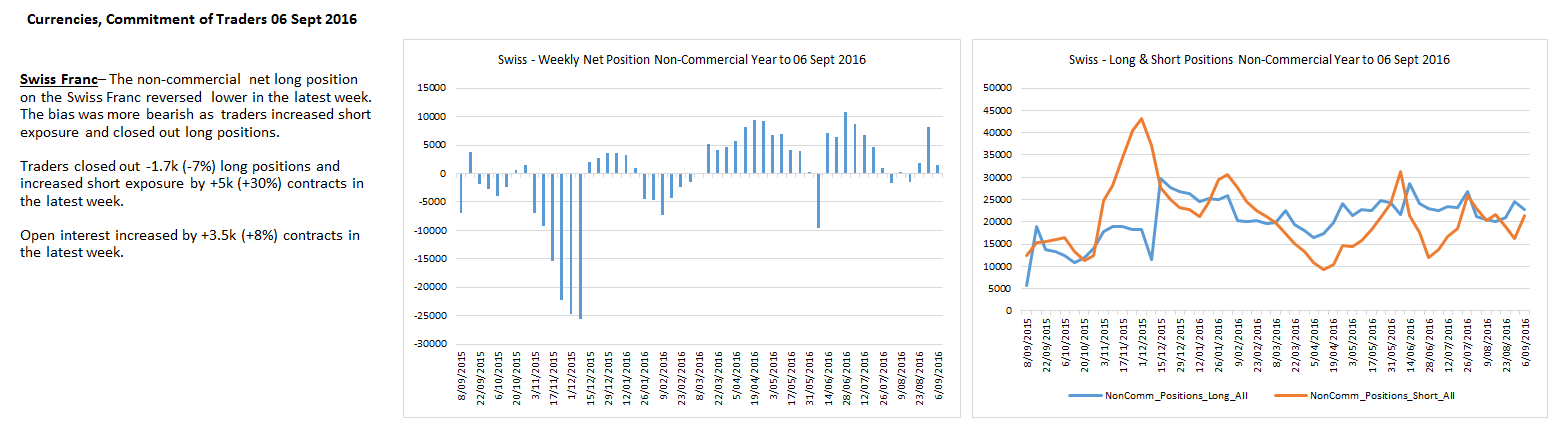
To the FX markets and the US$ has only rallied in 3 waves of equality from the lows, calling into question our near term bullish thesis. There is now risk of a breakdown back towards 94.00 on trade below 94.80 – Trade back above 95.60 would be bullish. I am neutral here. I have drawn the red and blue lines in the sand on the chart below.
DXI H1
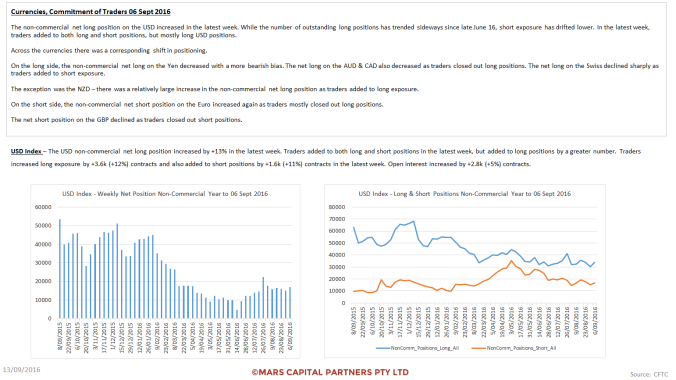
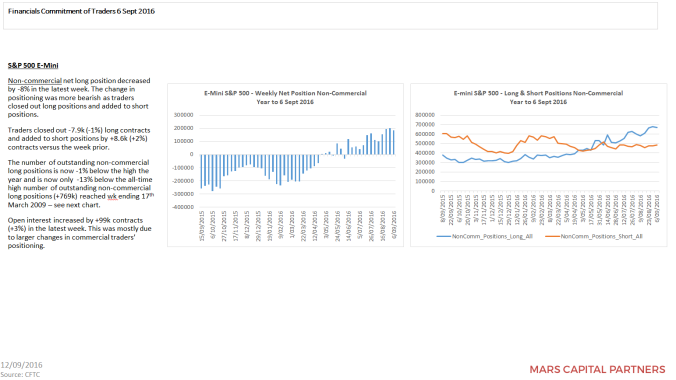
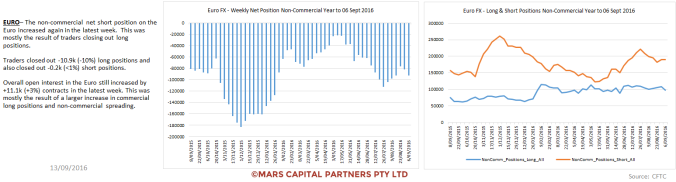
The calm before the storm as open interest plunges…
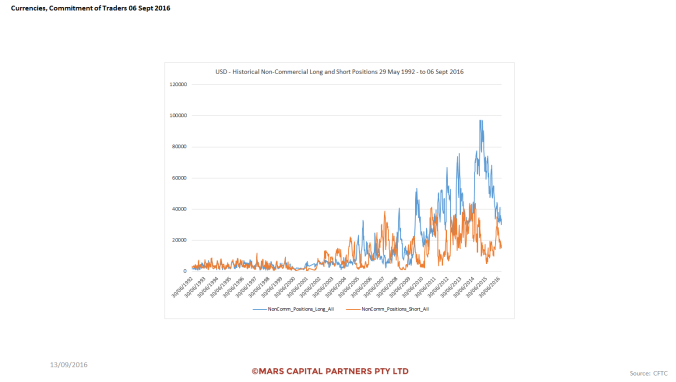
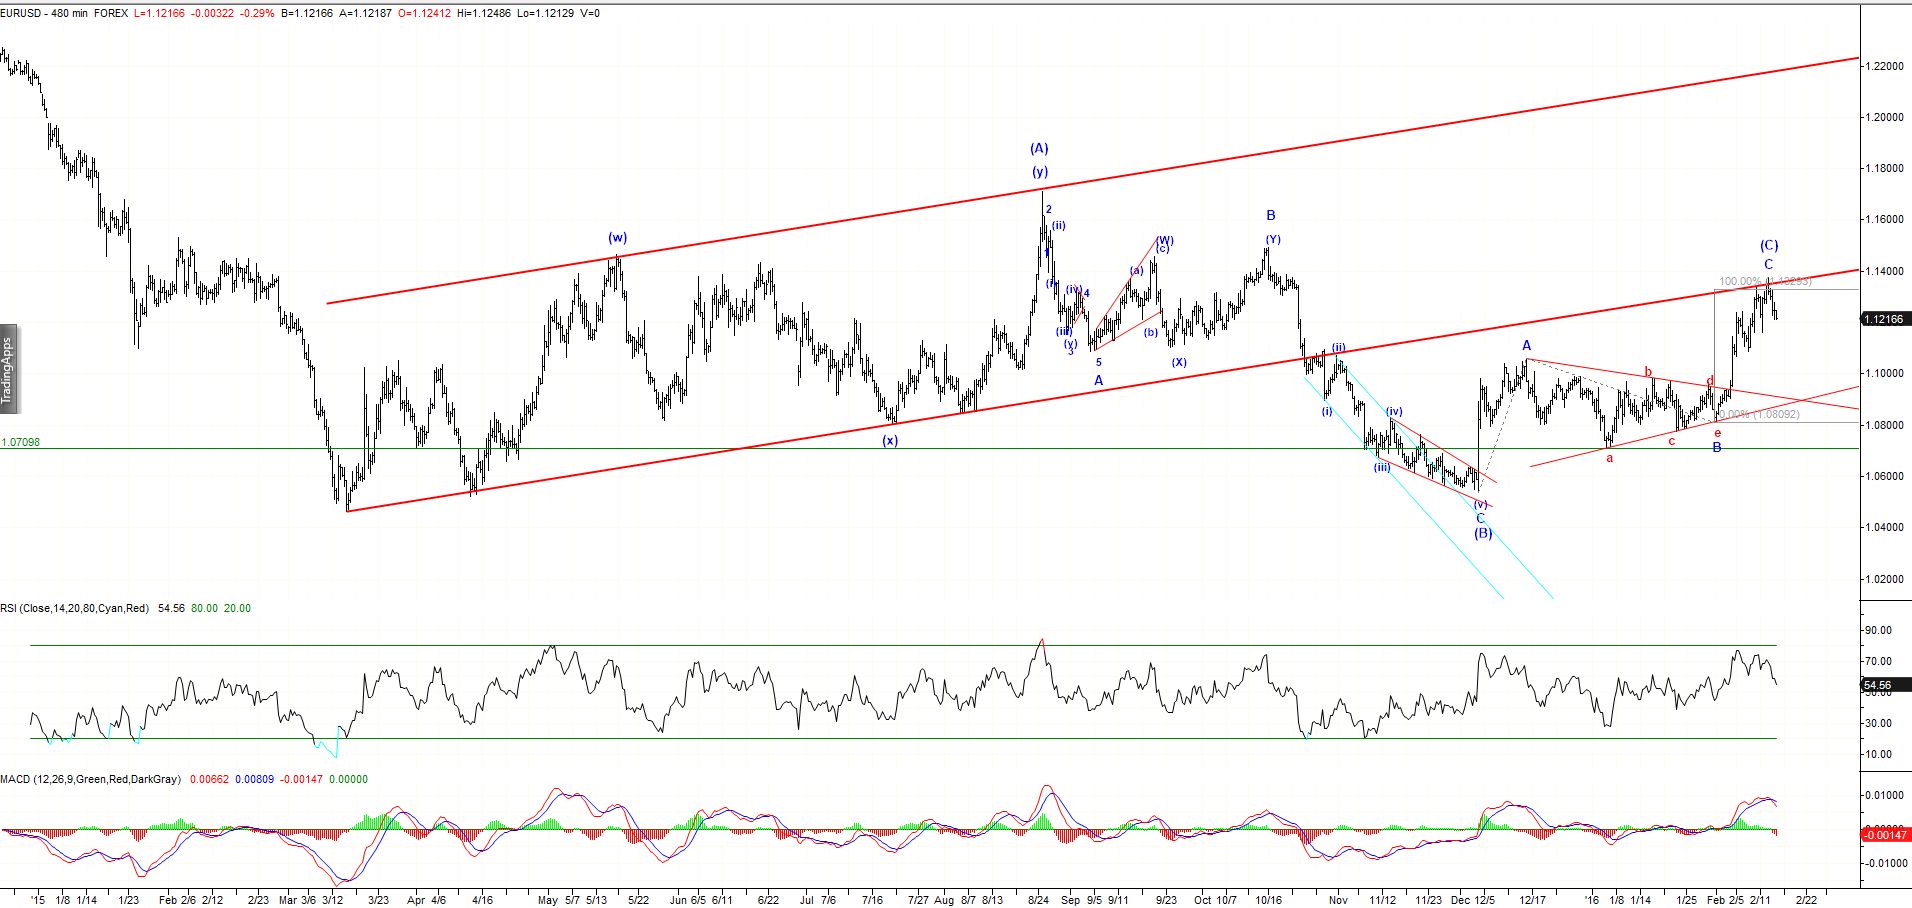
The equivalent 3 wave (corrective) structures can be seen on the Euro chart below.
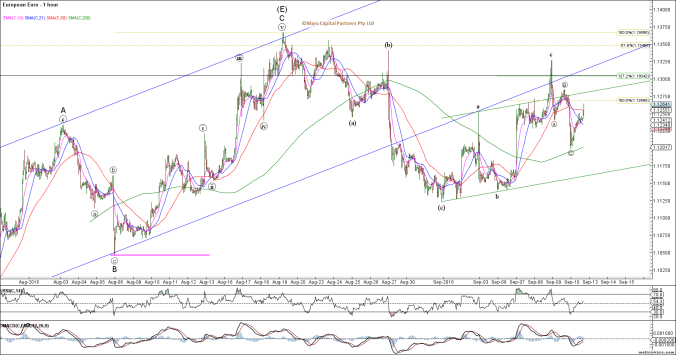
EURUSD H1
Trade immediately back above 1.1285 opens the door towards 1.150 as the triangle expands. Critical juncture here…
EURUSD Daily
The USDCHF continues to compress within its triangle – Compressed volatility leads to expanded volatility. I am now less confidant on which way it will break so I will likely go with the break and not pre-empt.
USDCHF Daily

To the commodity markets and they have been sold off despite a neutral US$. The constant 3 wave structures in Crude Oil suggest we are in the middle of a corrective movement which is likely another triangle (more compression). I still think it breaks down but I will not pre-empt here .
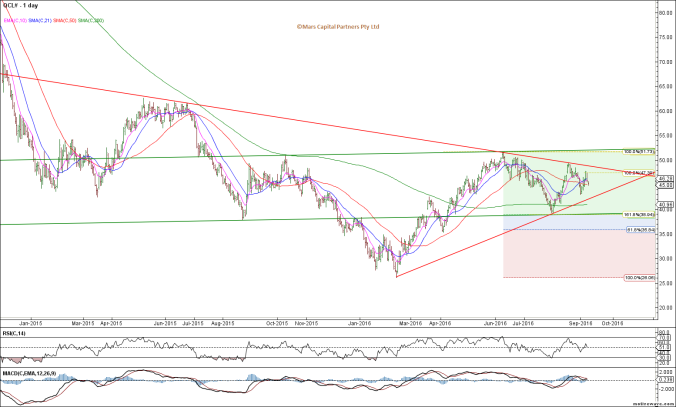
CL Daily
The internal corrective structure can best be seen on the H4 chart below – 3 waves up and down repeatedly (all corrective).
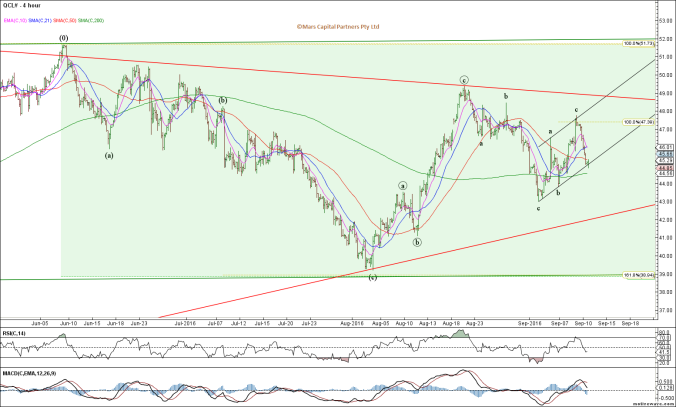
CL H4
The decline in Gold was in 3 corrective waves and will continue to look more bullish while 1305 holds to the downside (low conviction given how over-owned it is).

Gold Daily
Excessive optimism continues in the precious metals complex. Everyone is on the same side of the boat…
That’s all for now folks. Have a great week 🙂
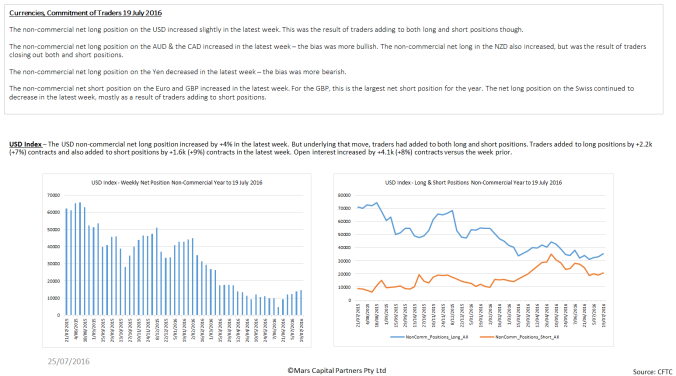
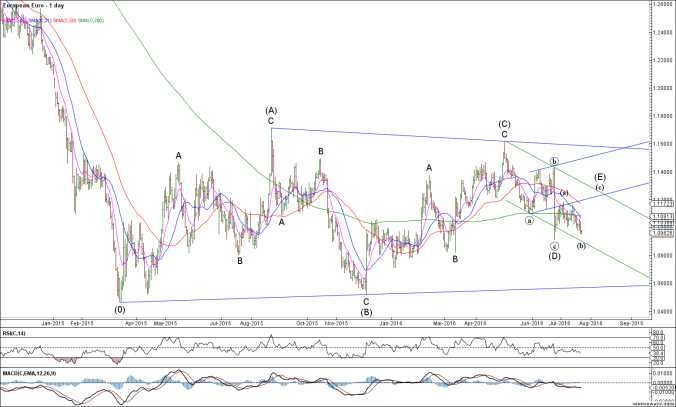
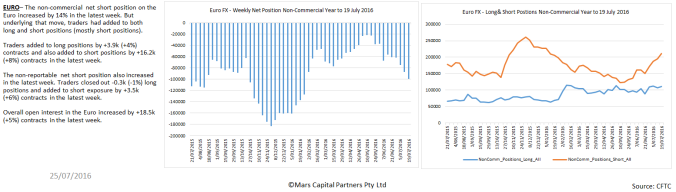
by Mars Capital Partners | Jul 25, 2016
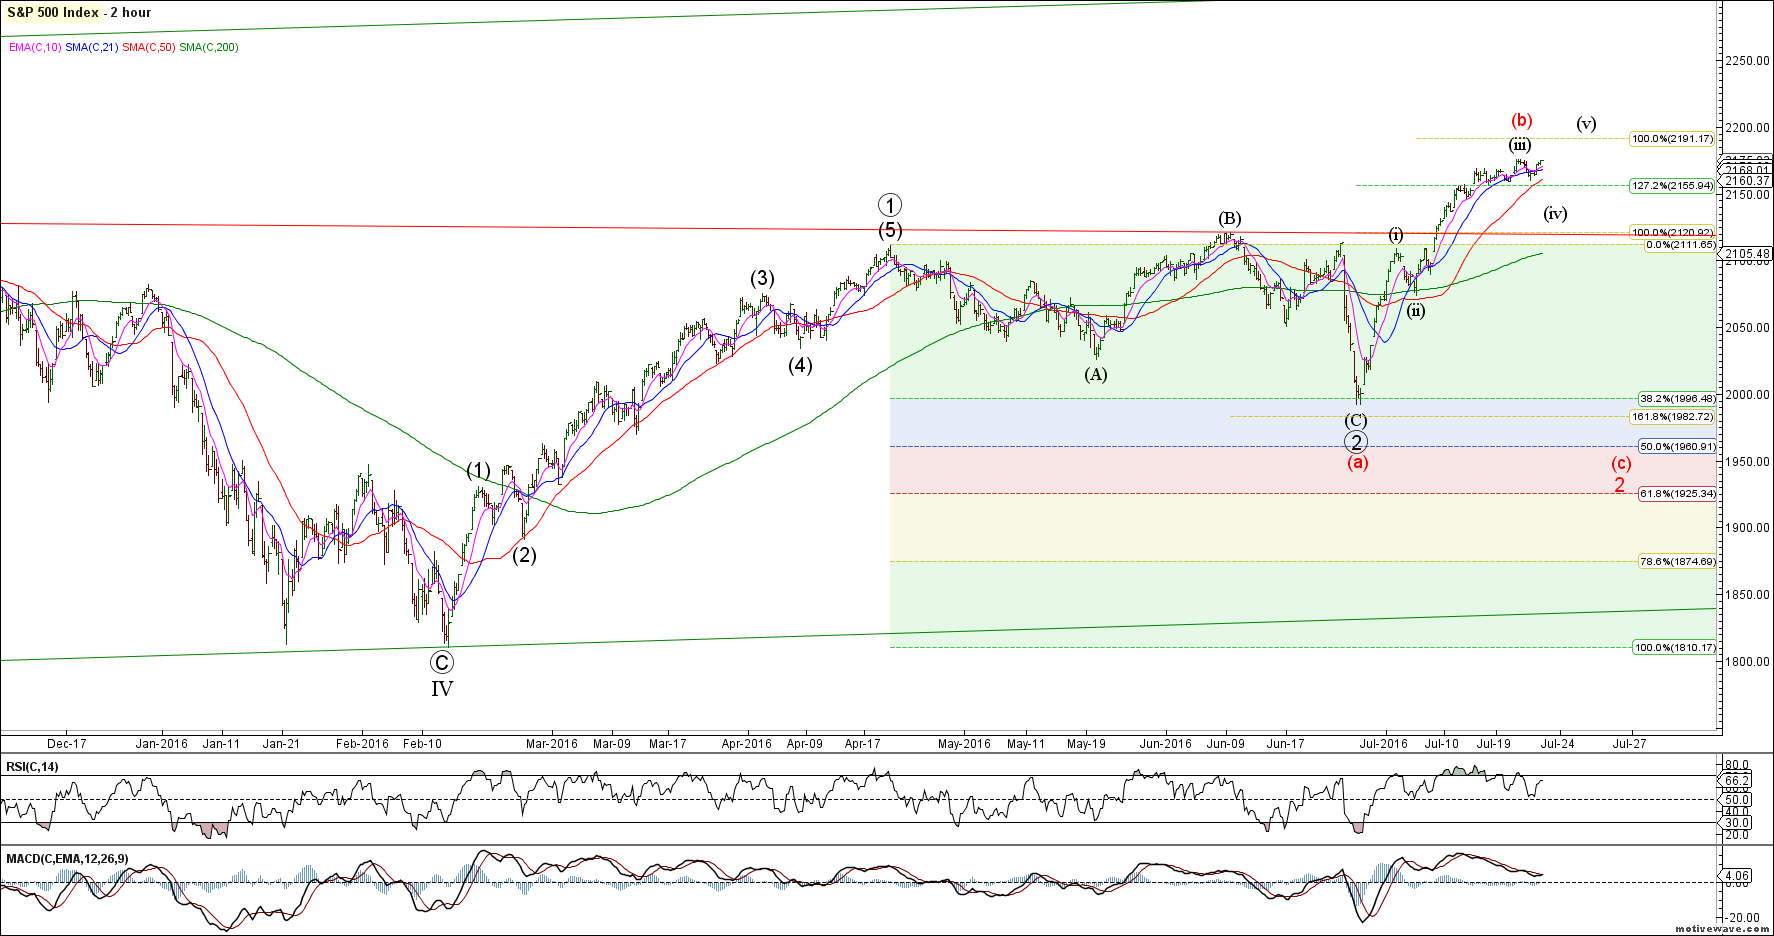
There’s not much to add since my last update as equity markets have continued to rally to new ATH’s as expected while the US$ remains strong and commodities take a much deserved breather. The most important chart to me at the moment is the US bond market. The reversal lower from ATH’s in price appears impulsive, setting the stage for a potential major BEARISH reversal in bond markets.
To the SPX and so far, the rally from the late June lows is in 3 waves and needs a small degree 4th and 5th wave higher to complete an initial impulsive rally. Therefore prices must maintain this breakout above 2120 to keep bullish momentum. The theme from my last update was higher now or higher later and this has not changed. The red expanded flat count is only relevant if we were to reverse down hard from these levels which is not my base case. Higher highs and higher lows is the very definition of a bull market trend.
SPX H2

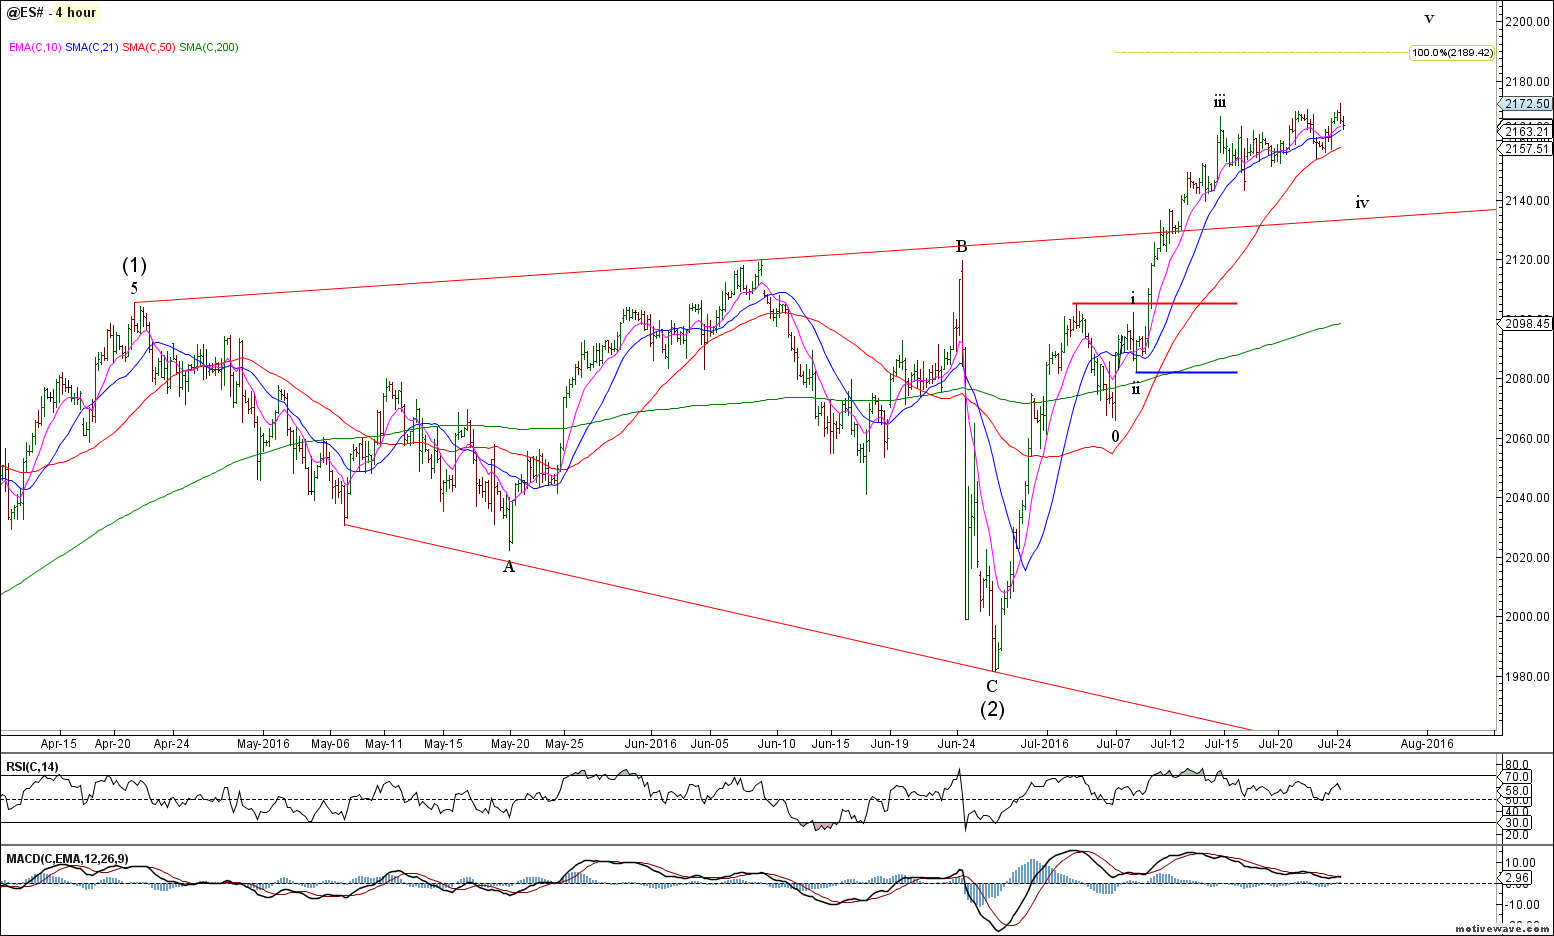
ES H4
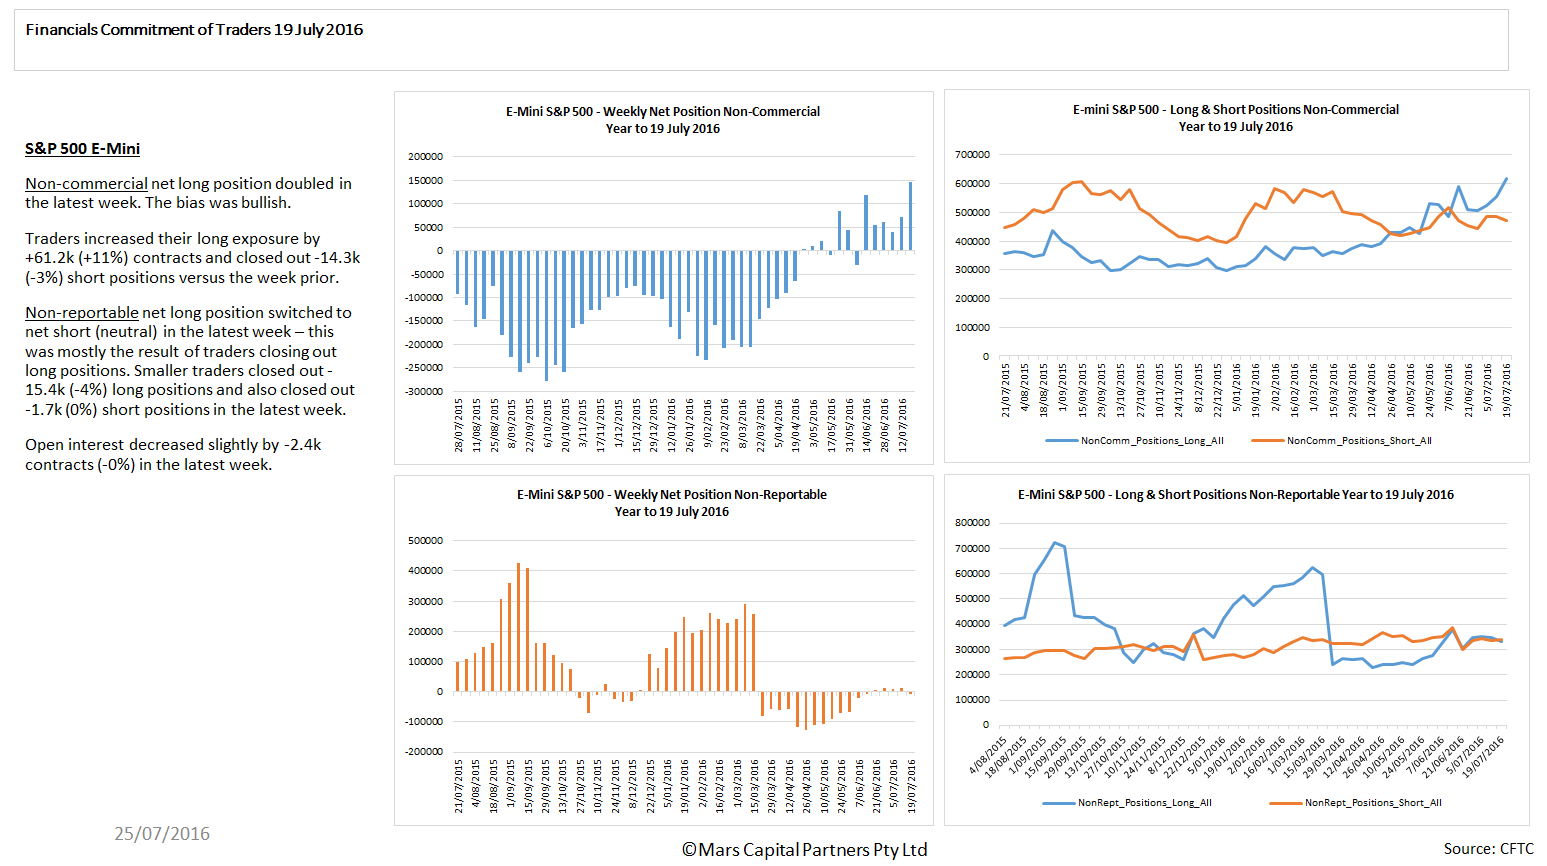
It appears that investors / hedge funds are finally getting bullish on this rally for the first time in a long time…

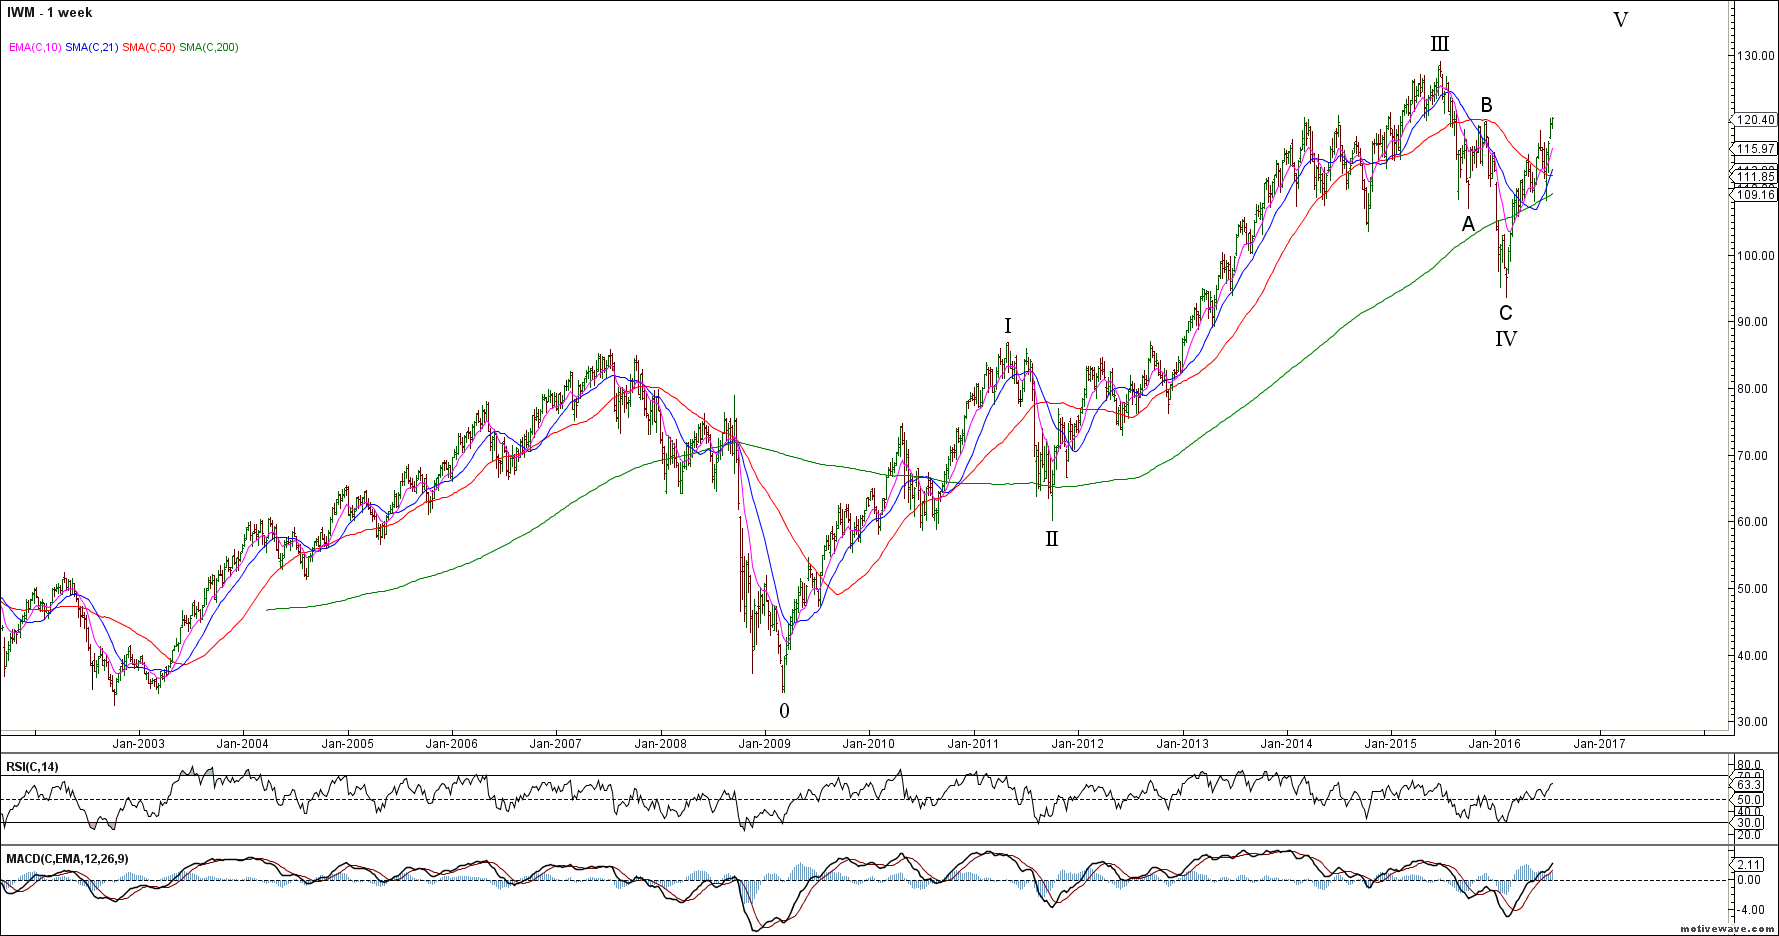
Bigger picture, we remain in a bull market until proven otherwise – the rally in IWM above the wave B high “locks-in” 3 waves down (corrective) and confirms the bullish case looking for new ATH’s.
IWM Weekly
The European equity markets continue to hold key support and have begun to rally impulsively. I see no reason to be bearish any equity markets while the February lows continue to hold. There is significant upside potential for the European equity indices as the entire decline from the 2015 highs is in 3 waves (corrective).
Dax Weekly
While the Dax is approaching near term trend resistance, I expect it to break to the upside in line with global equity markets
Dax Daily
The most important charts right now may be the US bond markets. The TLT broke above the long term Ending Diagonal trendline and reversed lower (throwover). This is a classic EW topping pattern.
TLT Weekly
Importantly, the decline from the recent ATH’s in bond prices appears impulsive and could signify a major trend change in the US bond market. I will be looking for a 3 wave counter-trend rally towards the 0.382-0.618 retracement area to aggressively short US bonds. I am looking for a MAJOR trend change. The impulsive decline can be clearly seen on the TY and US bond futures…
US 10yr Bond Futures H1
US 30yr Bond Futures H1
It also appears that investors remain long Treasuries in their search for yield
To the FX markets and I remain bullish the US$. Near term, the 200 sma is likely key support for an acceleration higher in a 3rd wave. Close below the 200 sma will likely mean we back and fill before the bull trend can reassert itself. That is my near term line in the sand. Either way, I am still looking for 102+
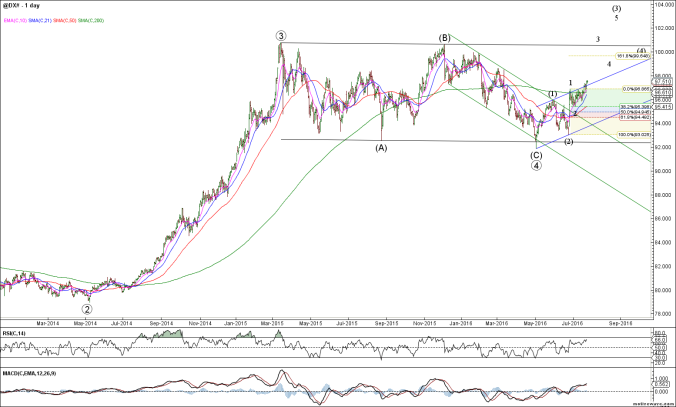
DXI Daily
The structure of the Euro allows for 1 more push higher towards 1.12 before the bottom falls out. The alternative is that we just accelerate lower from here on a break below 1.09 – My bigger picture targets for the Euro are way lower… my concern is that investors are starting to pile into the short Euro trade
EURUSD Daily
The Aussie$ has remained difficult to trade but remains destined for lower prices towards 0.70 – the recent decline from last week’s 0.7676 highs appears impulsive so I will be happy shorting against this level on any near term counter-trend rally. I remain bearish the Aussie$.
AUDUSD Daily
AUDUSD H1

The near term chart of the GBP is interesting as we look for lower prices to get long. The rally off the 1.2790 Brexit lows appears impulsive and the decline corrective. I will be looking to go long the GBP around the 1.2950 target area and measured support against the Brexit lows targeting back above 1.35.

GBPUSD H1
Max GBP bearishness also appeals to me…
Interestingly, like the ES and SPX, the USDJPY has only rallied in 3 waves so far from the post panic Brexit lows. We require a new high above 107.50 to “lock-in” 5 waves up and a potentially significant change in trend. So far, wave (iii) is 1.618x wave (i) as I look for wave (iv) support in the 105 area. This is a very important juncture for this pair and the Nikkei 225.
USDJPY H4

The AUDJPY shows the same structure…
AUDJPY H4
While the 5 wave rally in GBPJPY appears complete and I’m looking at 136 as a good area to get long for wave (iii)…

GBPJPY H4
The long AUDNZD trade I highlighted previously also looks interesting given the strong impulsive rally from the 0.786 measured support.
AUDNZD Daily
To the commodity markets and it appears that Crude Oil is/has formed a Leading Diagonal from recent highs. Near term, I am looking to get long a bullish intraday reversal targeting $48-50 which may also set up a nice longer term short IF I’m right. I’ll just trade it 1 wave at a time…
Crude Oil H4
The precious metals have pulled back from recent highs but I don’t have a good tradable setup right now. They appear to be in no-man’s-land. I have no strong views on Gold or Silver here??? Given the continued extreme bullish sentiment, I would be cautious initiating longs until we see a decent pullback despite the fact I remain very bullish long term.
All I know is that PM’s are extended and Gold has been rejected at the 0.382 retracement of the entire decline (natural resistance) – Gold will be very bullish back above 1380

Gold Daily
Silver appears more constructive for the bulls but it is unclear whether the rally was a completed Expanding Leading Diagonal (Very Rare – red count) OR if we need another push higher towards 22 to complete wave 5 of (3)? No new trades for me here as the COT data shows extreme bullishness and there are too many folks on this trade for my liking.
Silver Daily

The Silver bullishness is EXTREME by historical standards…
That’s all for now folks. Have a great week 🙂
by Mofar2016 | Feb 15, 2016
Last week’s market update highlighted the need for a final 5th wave to marginal new lows across the broad equity market indices. With downside targets met and enough waves in place for a completed structure we are now long against last week’s lows. What we need to see now is an impulsive rally from the lows. So far so good.
Now that we appear to have a completed pattern to the downside, the next big question is whether or not the correction is complete and we head to new ATH’s for a large degree 5th and FINAL wave “or” the cyclical equity market rally is already complete and this decline was the first wave of a larger bear market correction.
My job isn’t to make predictions, it IS to make money. My live tweets of an #ES_F wave (iii) low of 1807, then wave (iv) high of 1940 and wave (v) retest of 1800 all nailed key turns. There’s not much more I can do.
Last week’s lows are critical for the near term bull case. I will remain long while those lows hold and let this rally structure play out. If we see an impulsive rally and subsequent corrective decline, Mr Market will tell us whether we are still in a bull market or not.
Below I have highlighted the bull and bear cases for the #ES_F. My primary count across all markets presume the “lows are in” and we head to new ATH’s (blue count) in a risk-on environment. The key feature of the following charts is that we have 3 waves down from the highs contained within CORRECTIVE channels.
ES_F Daily
The following equity index charts all show the same structure of 3 intermediate waves down from the highs and are supportive of my bullish outlook…

DJIA Daily

TF_F Daily (Russell 2000)
While the DAX fell just short of my measured downside targets (8300-8600), the structure now has enough waves in place to be complete to the downside. So far the decline from ATH’s is in 3 clear waves contained within a corrective channel. Risk is not dead yet.
FDAX Daily
The following chart is more illustrative of the potential that the “top is in” bearish case with 5 waves complete into the highs and an impulsive decline. Specifically the #NDX / #NQ_F shows a clear 5 waves down from the cycle highs. This is the chart that concerns me most about the potential for a significant decline after a wave (2) bounce higher towards 4300-4400 (previous 4th wave and Fib retracement). Either way, we should continue to expect higher prices in the near term.
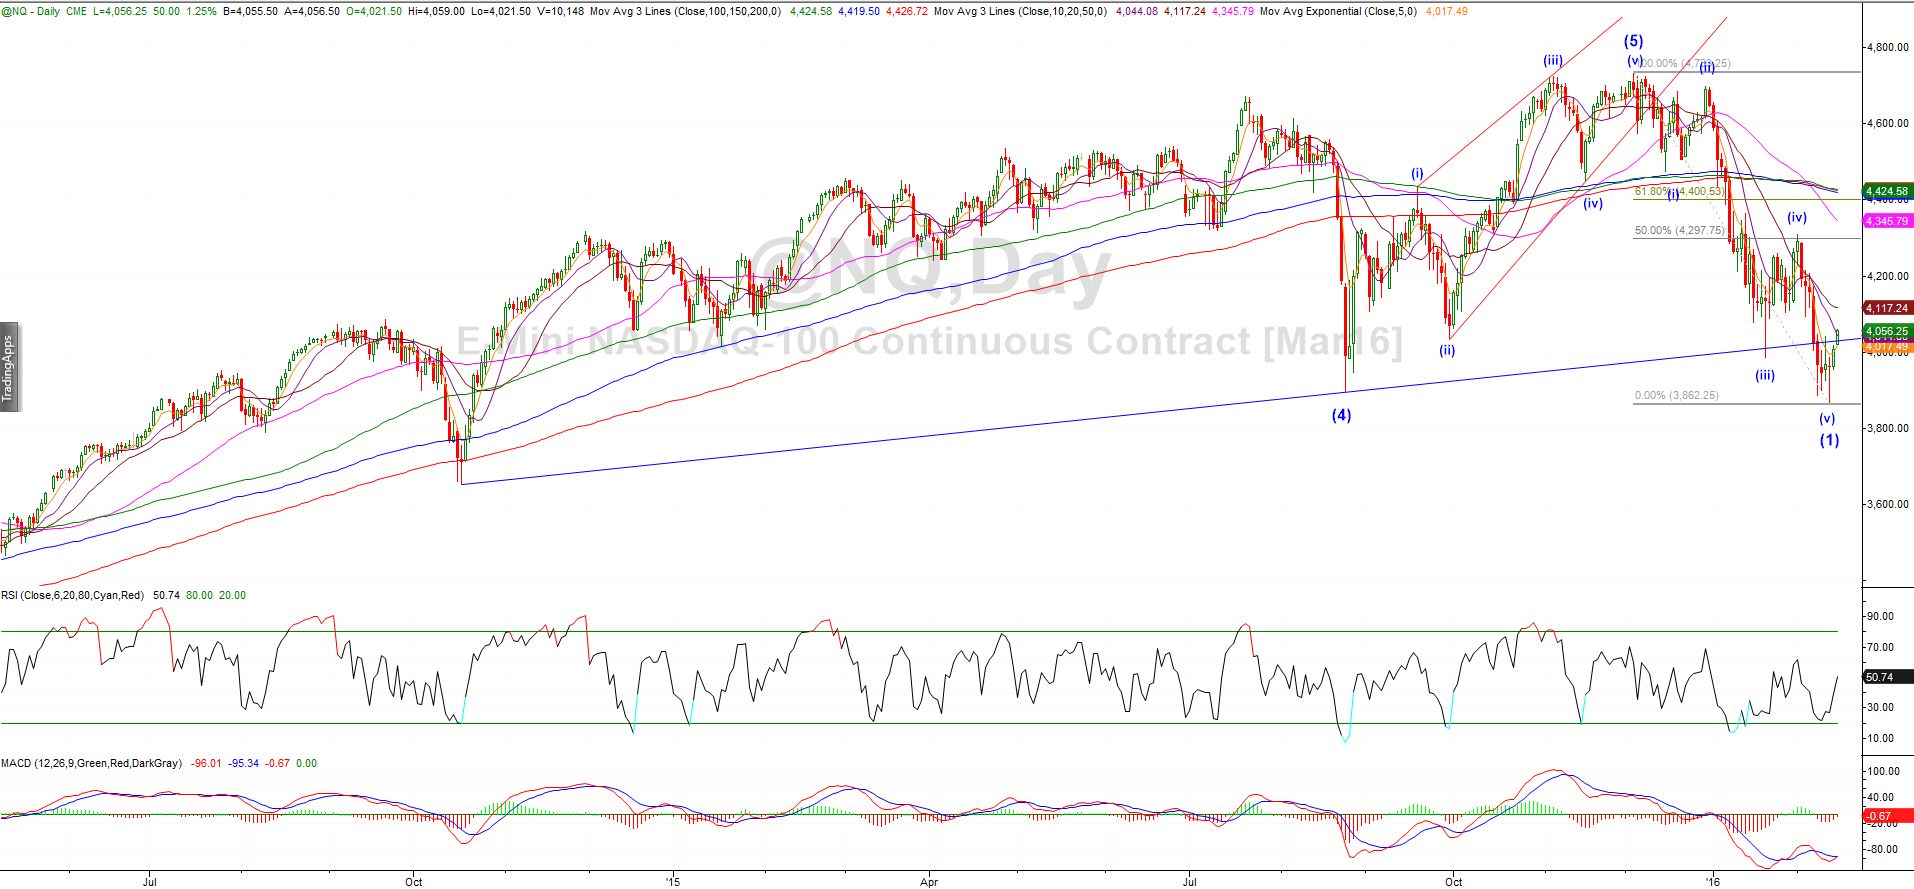
NQ_F Daily
The heavy net-short positioning of #ES_F traders in the COT report also provides further fuel for a strong short covering squeeze at a minimum…

The US30 yr Treasury spiked higher above 170 before reversing hard with a daily shooting star. Remember this is an Ending wave! Shorts are strongly now favored here in line with my risk-on thesis.

#ZB_F Daily
To the FX markets and the biggest mover was the Yen with some wild post-BOJ swings which triggered the H&S I spoke of last week. The bullish equities case requires the USDJPY to rally from here. I have updated my count with an expanded diagonal (very rare) wave C of (4) for the bullish case which falls short of the H&S downside targets. This count requires the USDJPY to recapture and close above the H&S neckline at 116. Should the 116 resistance hold the market to the upside and new lows are subsequently made, I would have to concede that the H&S is indeed in force putting more pressure on risk assets.
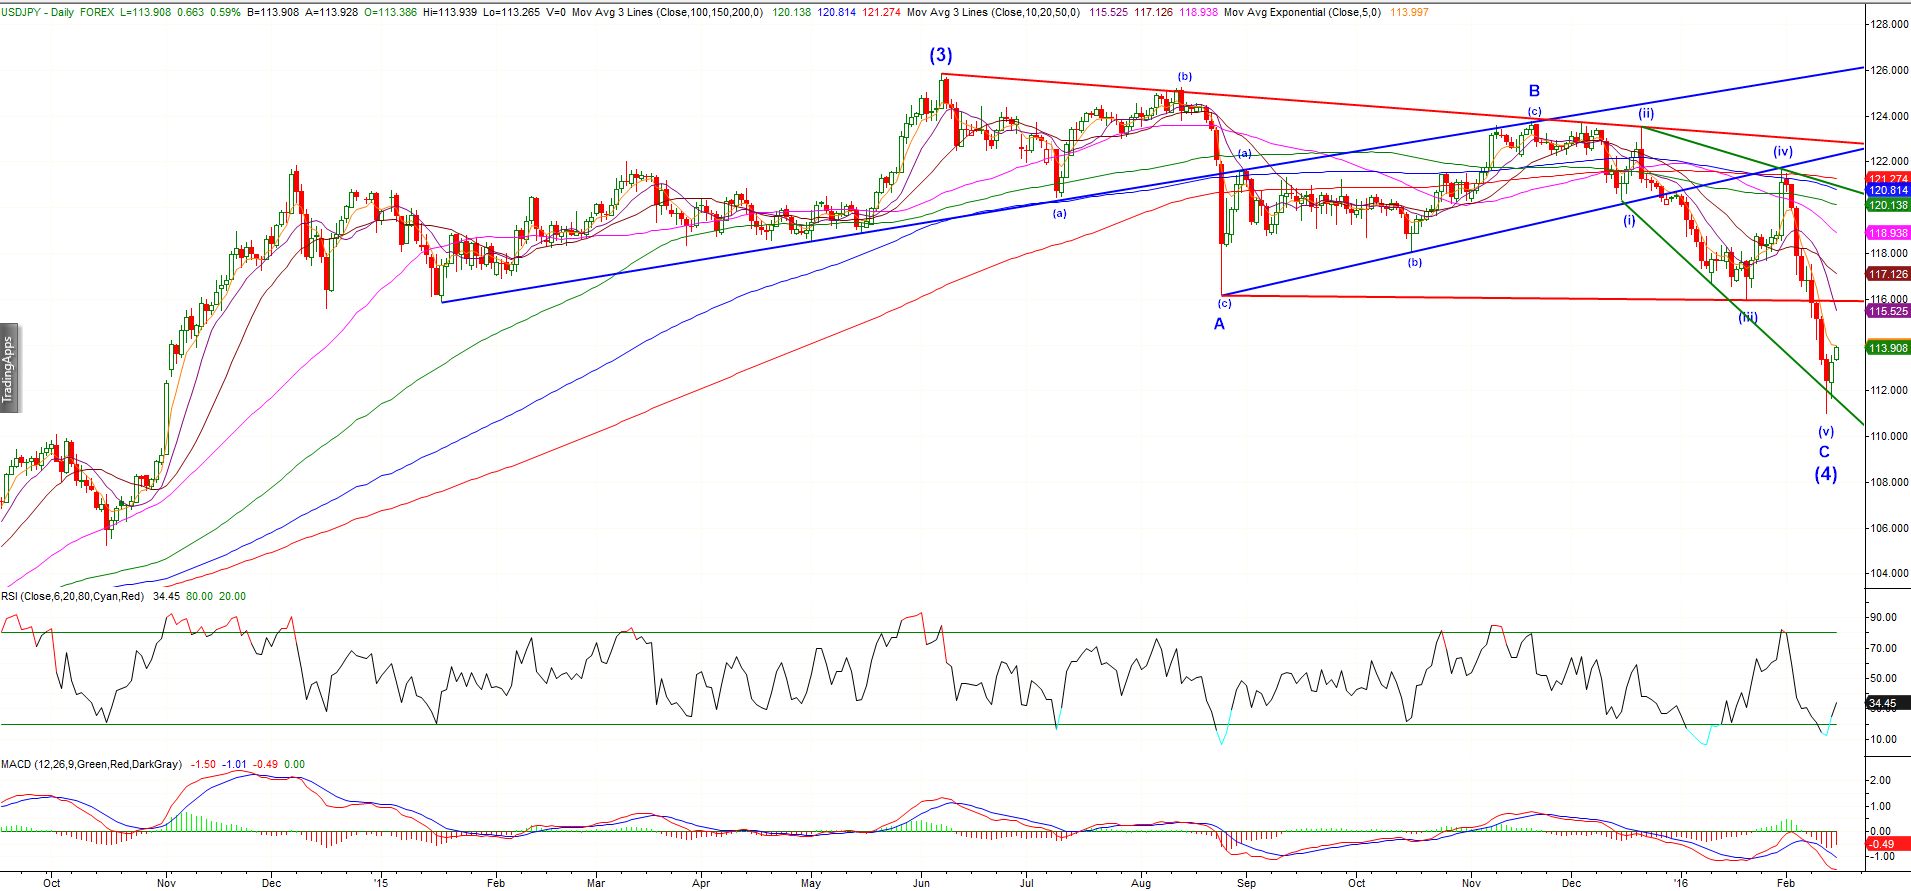
USDJPY Daily
The Euro found strong resistance on the backtest of the red trendline as suggested last week. I remain bearish the Euro but the pattern is tricky so my conviction is low at this point.
EURUSD 8hr
The commodity chart of note is #CL_F. My downside target of $26.00 was achieved last week (LOD $26.05). While I’m not a big fan of the 3 wave structure into the lows, we must respect the fact that downside targets have been reached and Crude has been declining for a LONG time. A close back above $30 would certainly help the bullish case and align with equities. I am bullish #CL_F especially if we can make a marginal new low not confirmed by equities.
CL_F 8hr
Gold has rallied straight to Fib 23.6% resistance in a large short covering rally. We should expect some pullback here while traders digest the near term risk-on environment.
Gold Weekly
The recent Gold COT report highlights the short squeeze in real time.

That’s all for now folks 🙂