Last week, equities extended higher as expected in a counter-trend rally into overhead resistance before reversing sharply lower. The question is whether the rally was “all” or “part” of a wave B counter-trend rally. The impulsive nature of Friday’s decline warns of an immediate red wave C decline towards big picture targets. The alternate is a more complex green wave B if bulls can hold recent swing low support. The equity markets remain bearish from a big picture perspective until proven otherwise.
Rates and the US$ are attempting to reverse lower to help confirm our bearish outlook as this risk off environment takes hold. The shorter end of the bond market in particular appears bullish as we look for a 5th wave extension higher. The Euro held key support and is attempting to reverse higher to help maintain our bullish outlook. Gold pushed to new ATH’s as expected but the rally is very extended as we look for evidence of a tradable top. Trump’s tariffs continue to weigh on markets as the economic outlook remains uncertain.
Equity Markets – Bear reversal
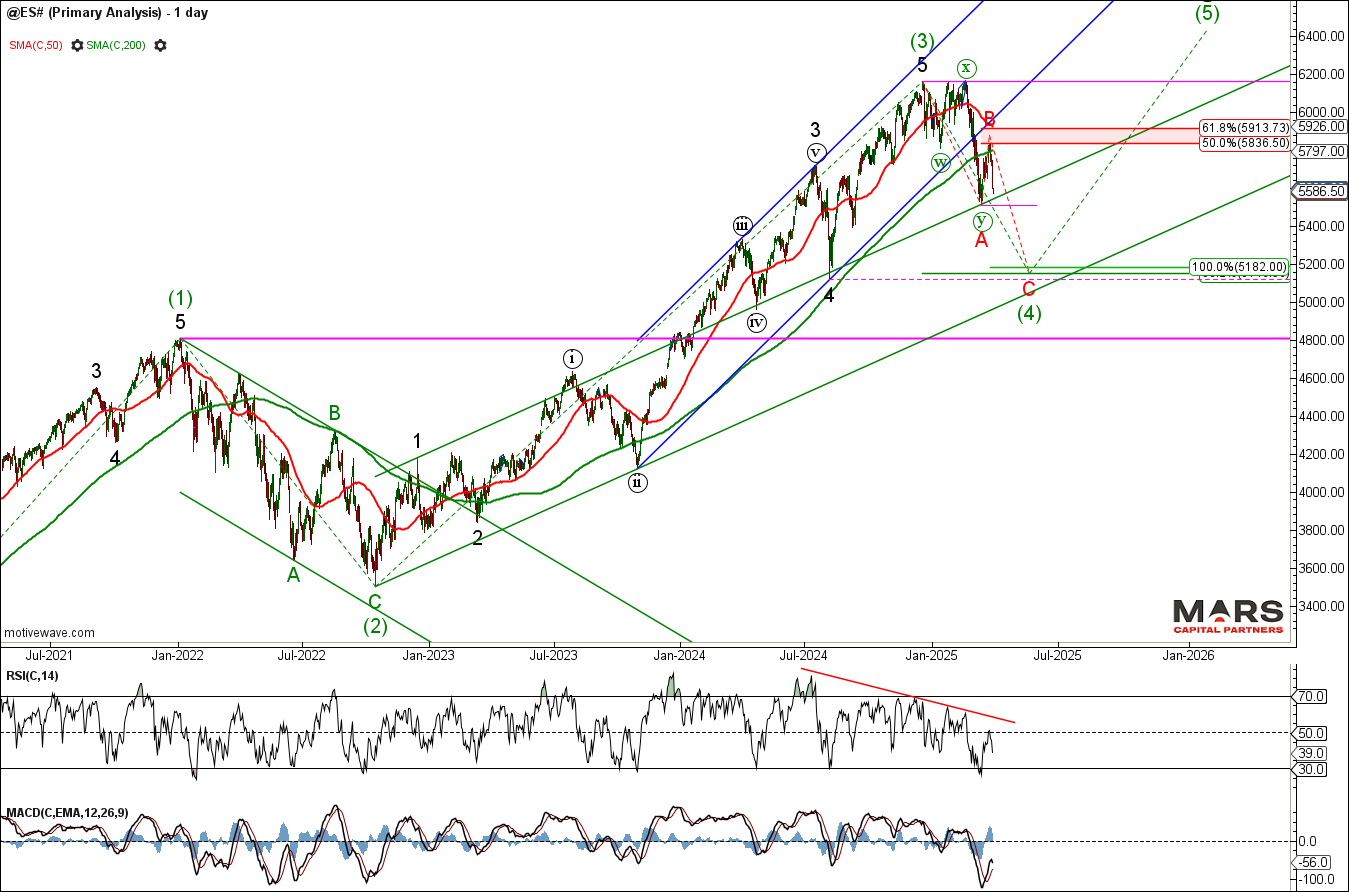
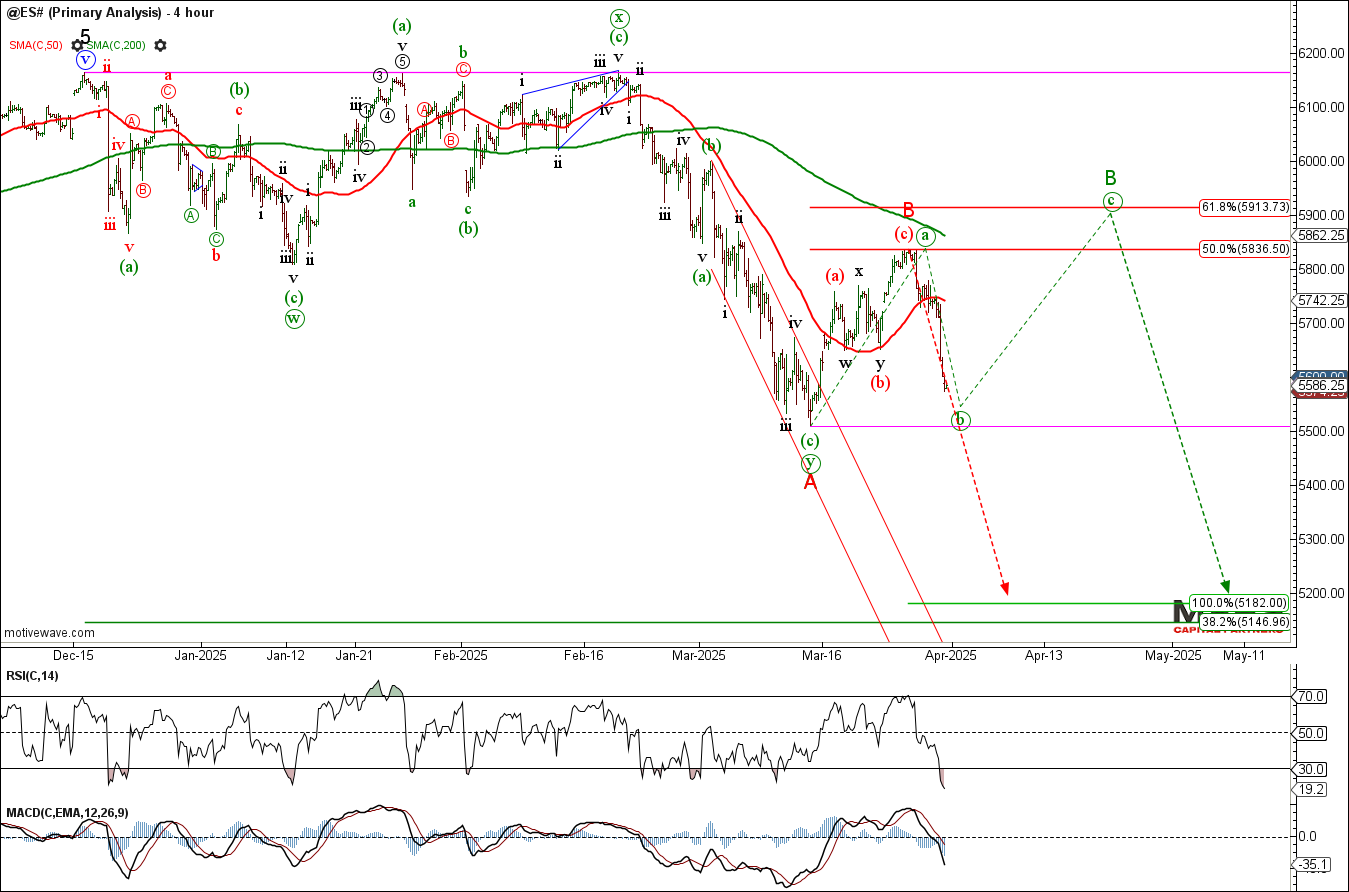
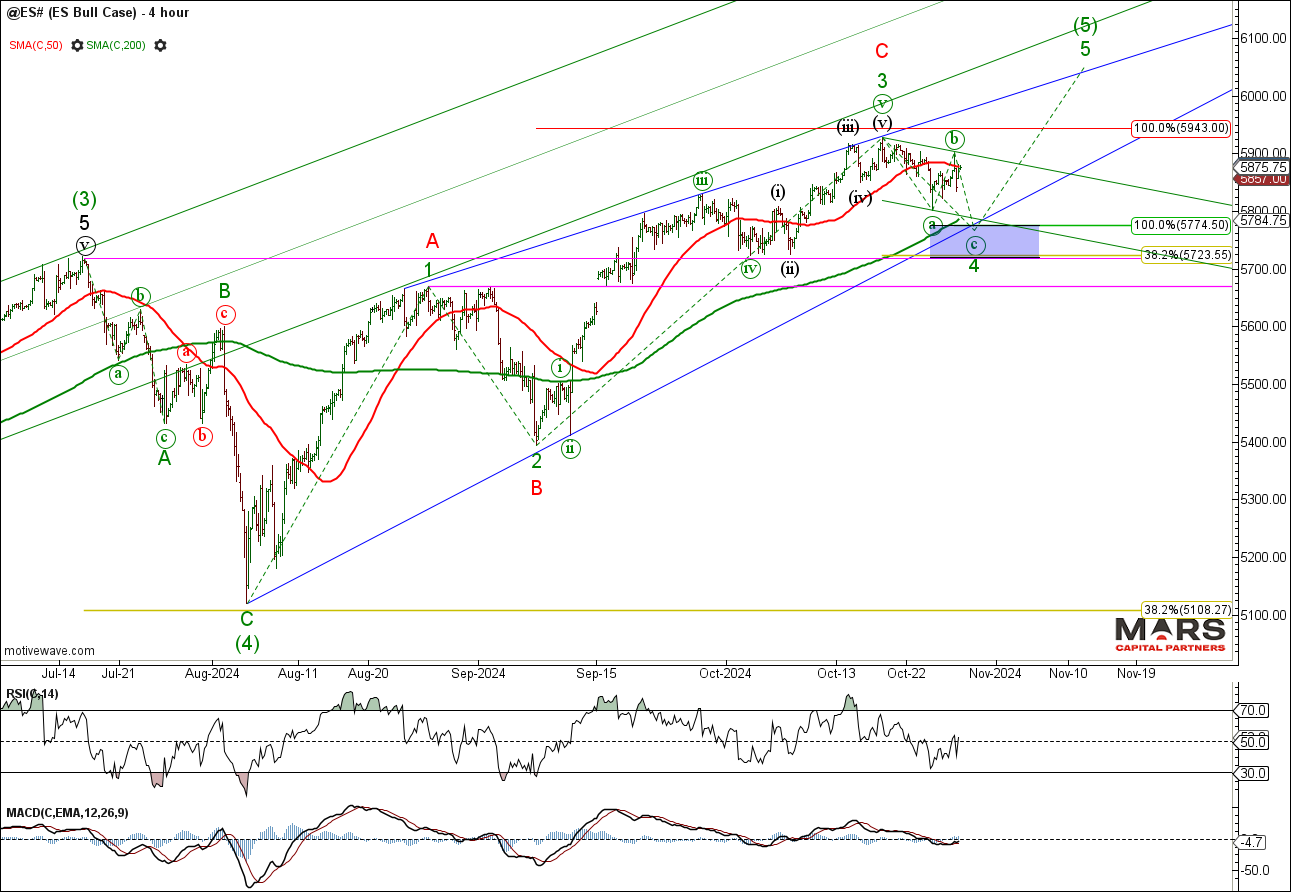
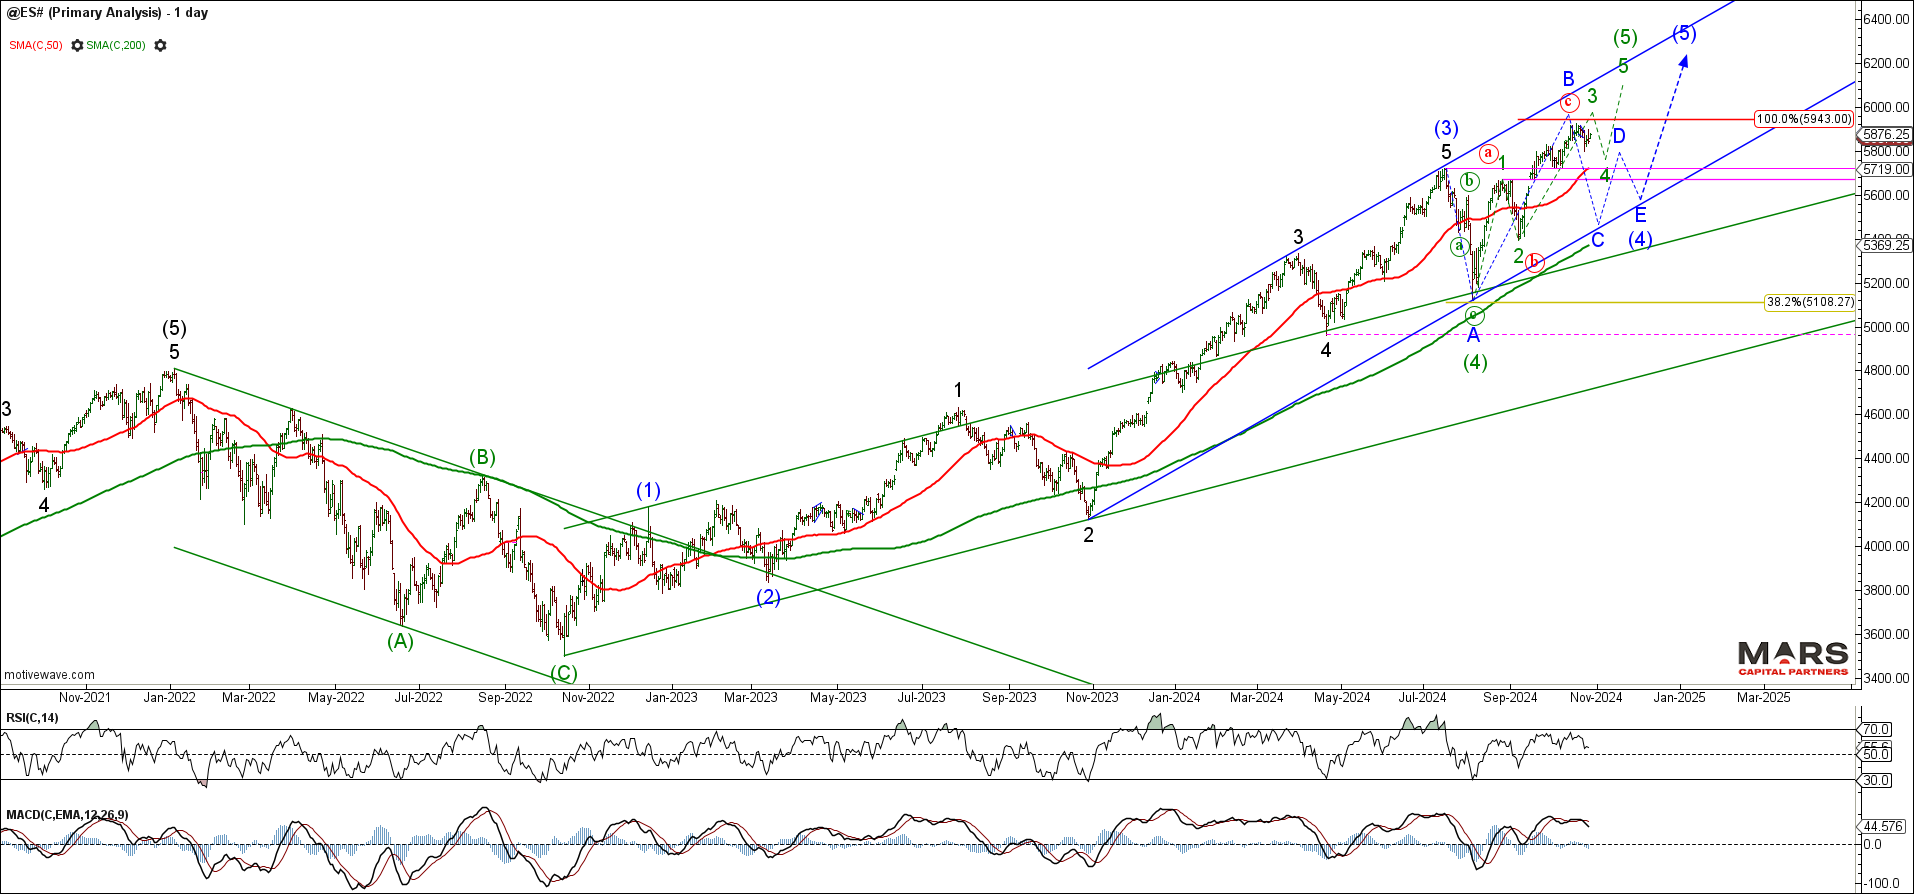
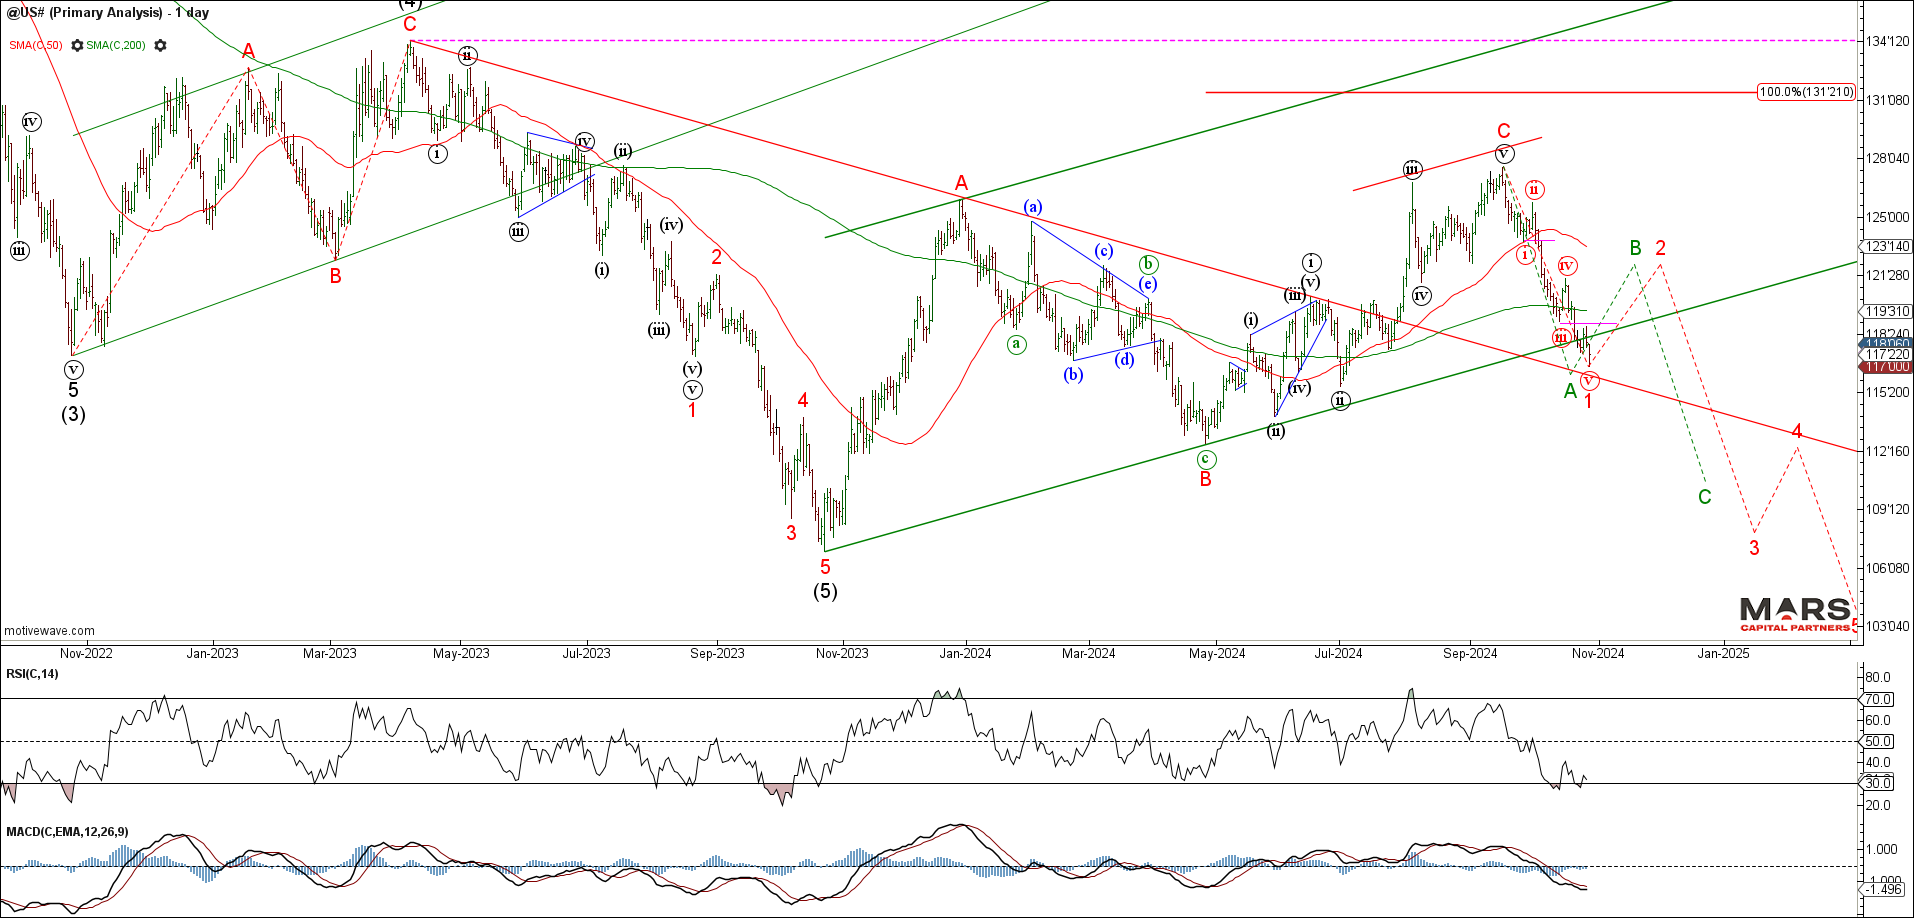
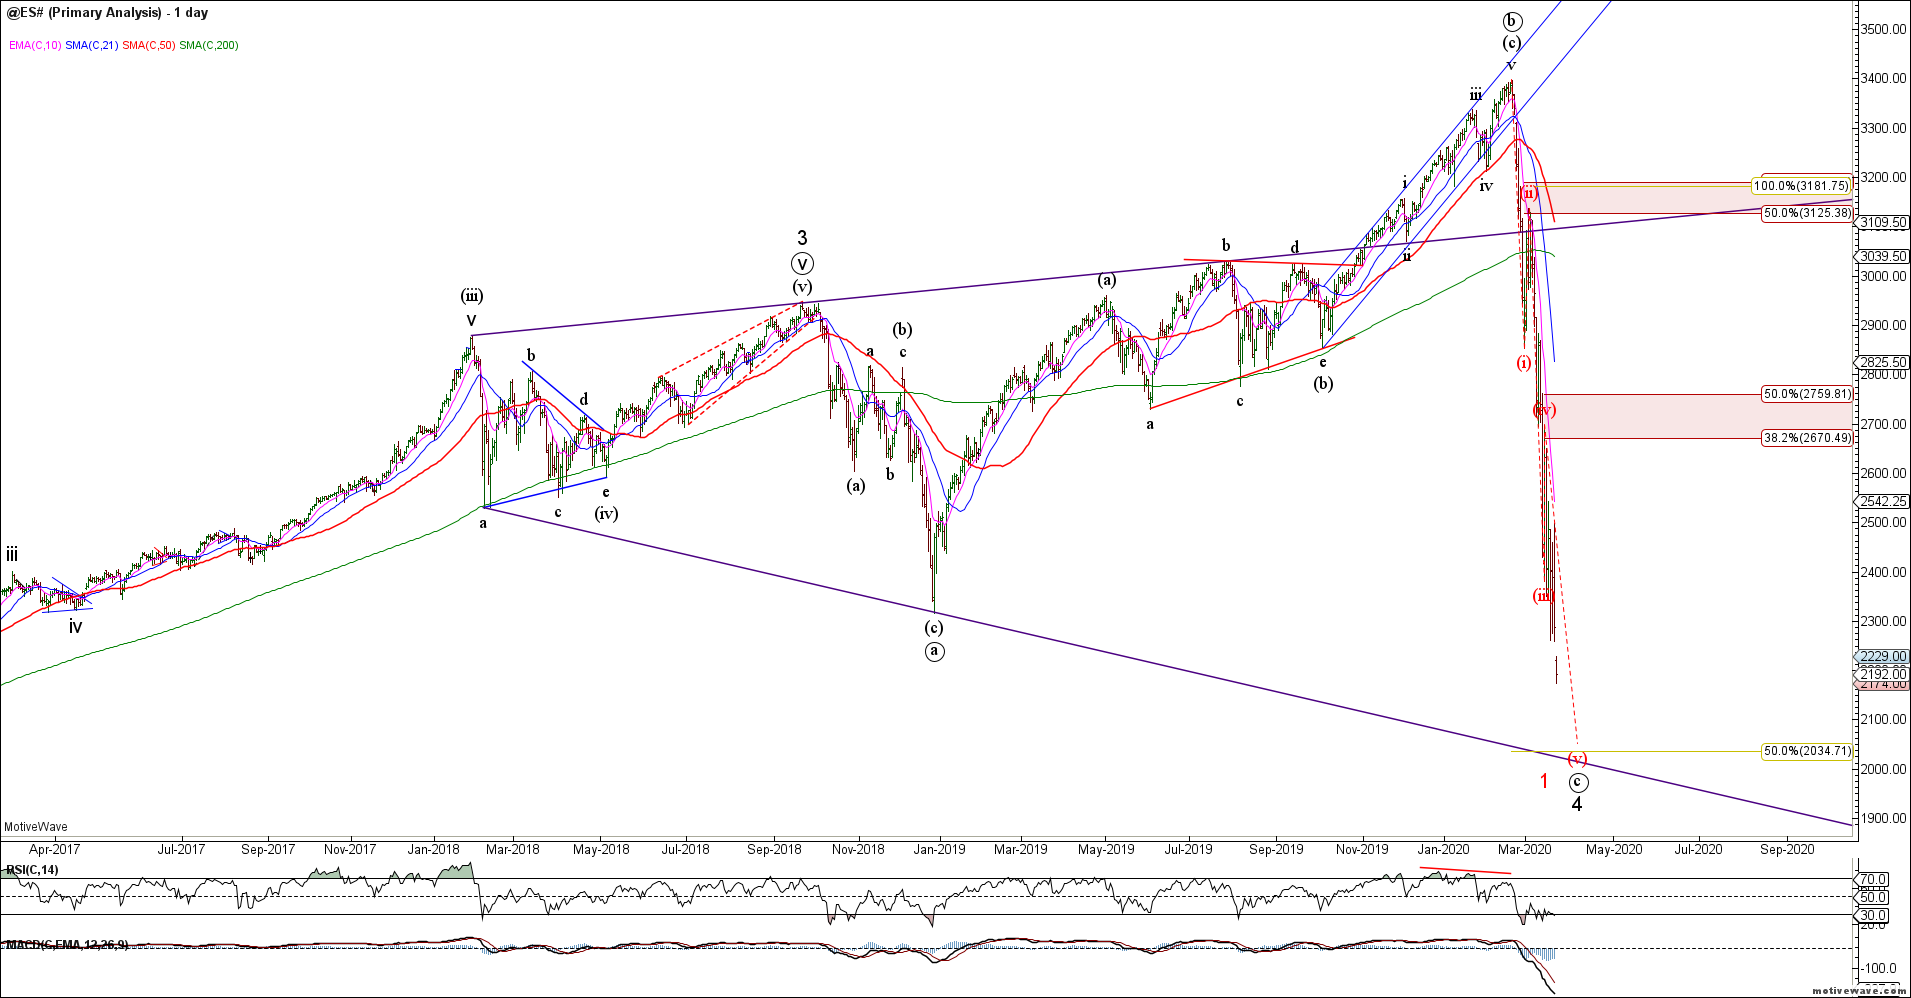
To the equity markets and the benchmark SPX / ES extended higher for a counter-trend wave (c) rally before reversing sharply lower as expected. The impulsive nature of last week’s decline warns that red wave B is complete and a strong wave C decline is underway. The alternate is a more complex green wave B counter-trend rally if bulls can hold recent swing low support. Either way, the recent counter-trend rally helped confirm our bigger picture bearish outlook with wave (4) targets lower towards the 5150 area. Bearish now or bearish later…
ES DailyES H4
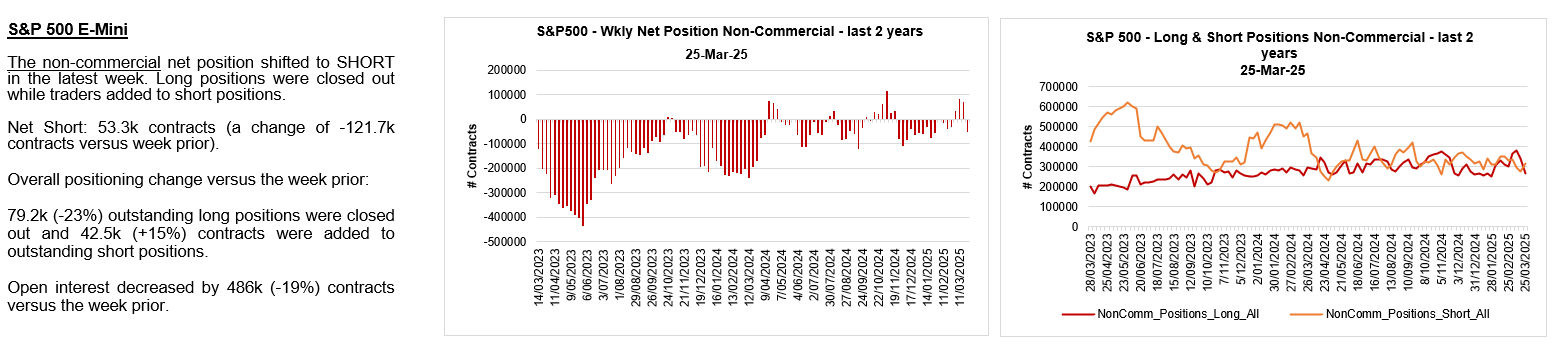
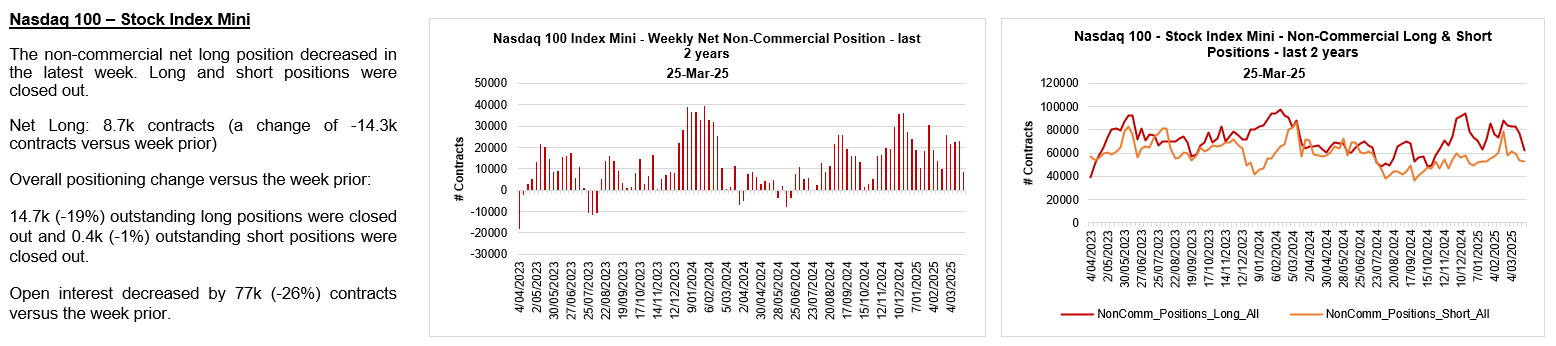
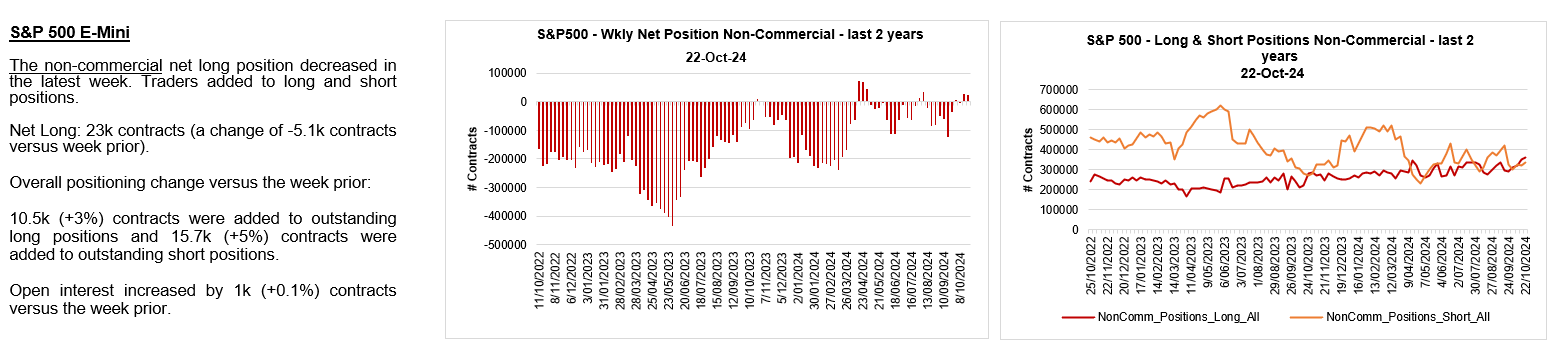
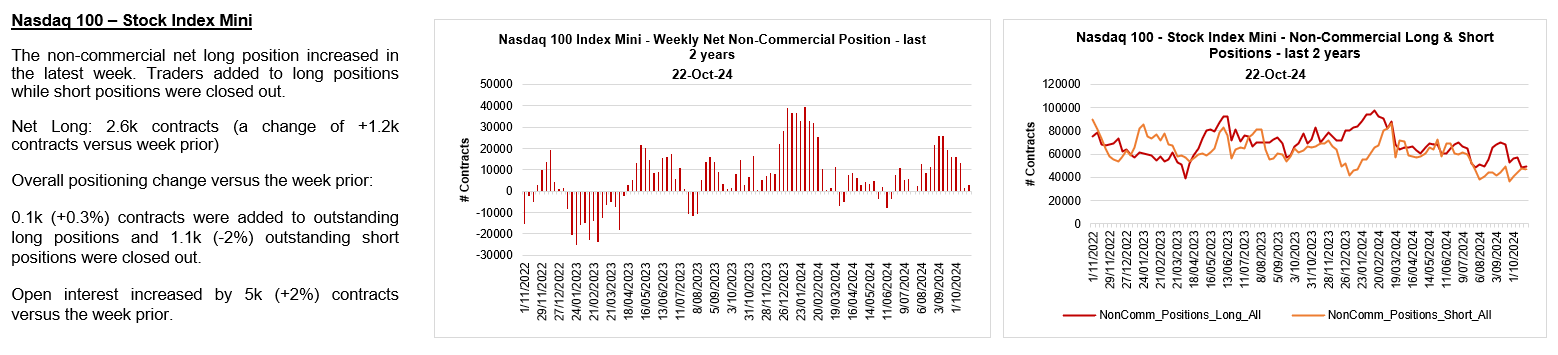
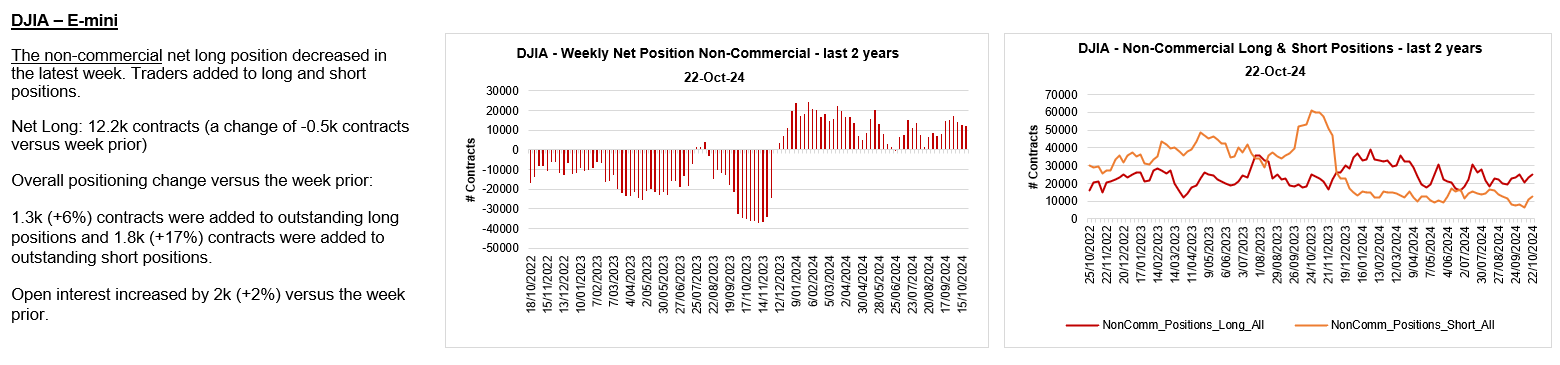
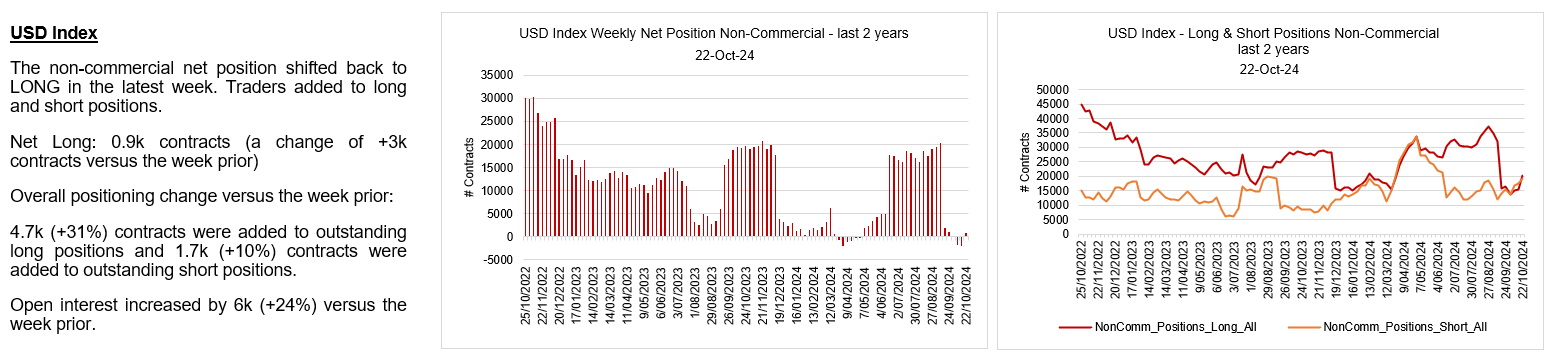
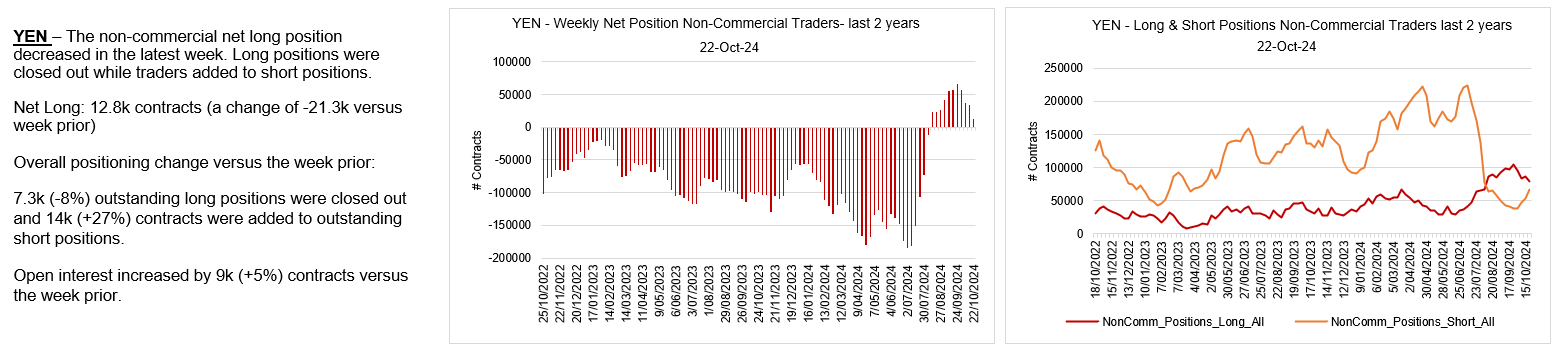
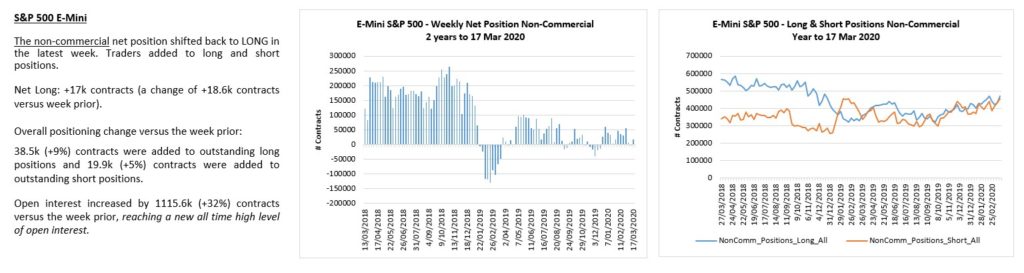
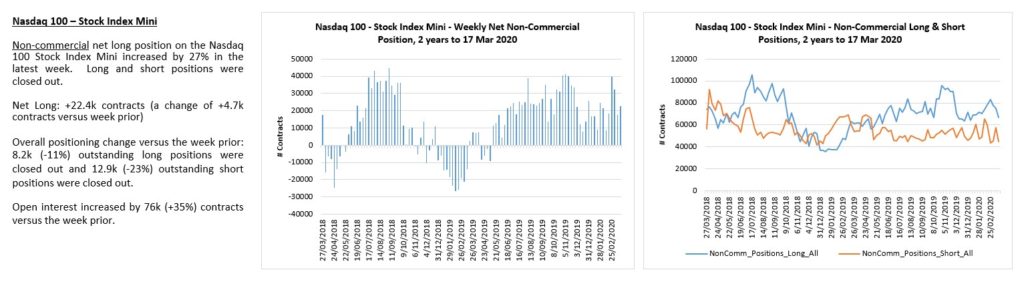
ES traders flipped net short.
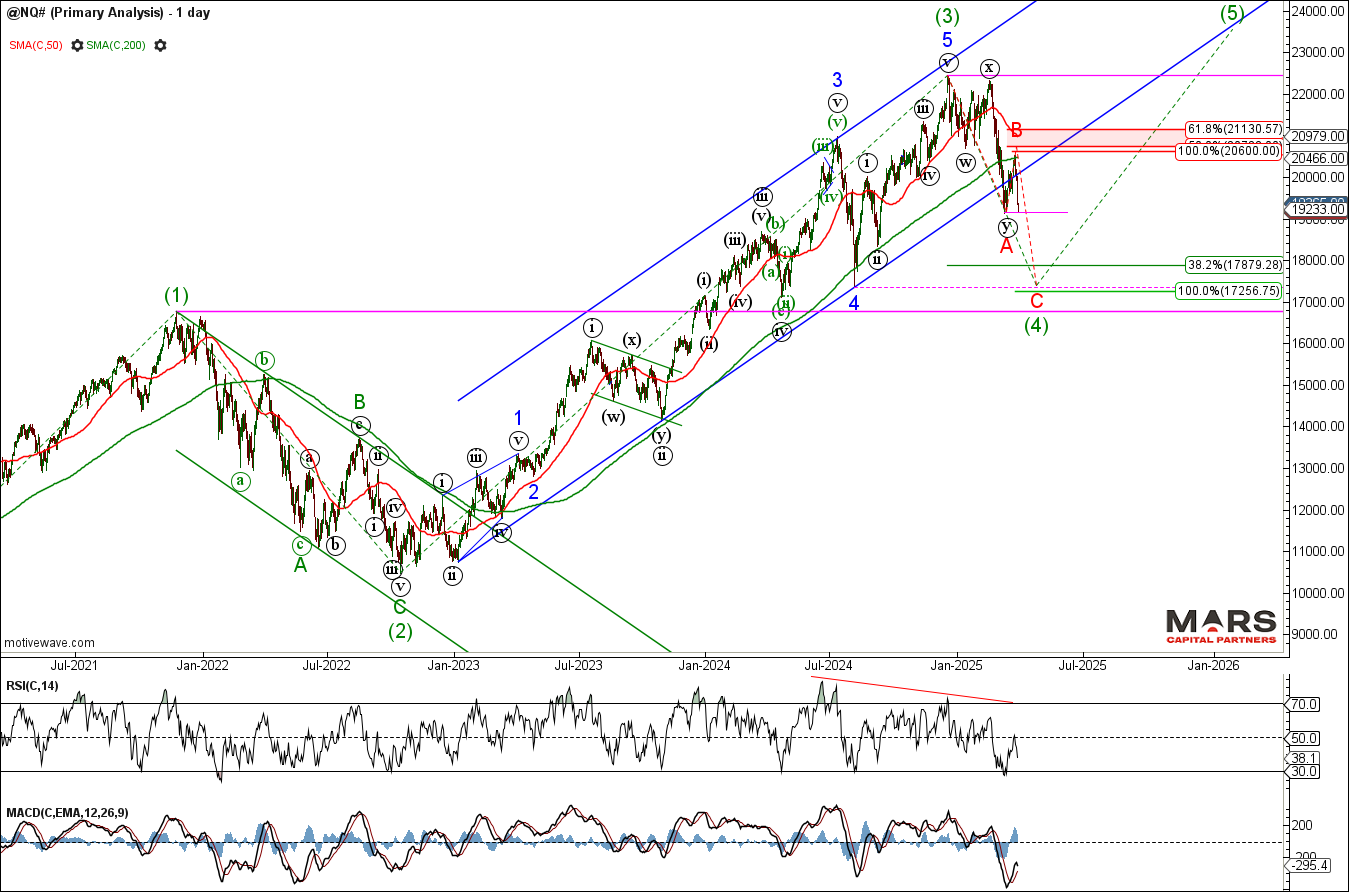
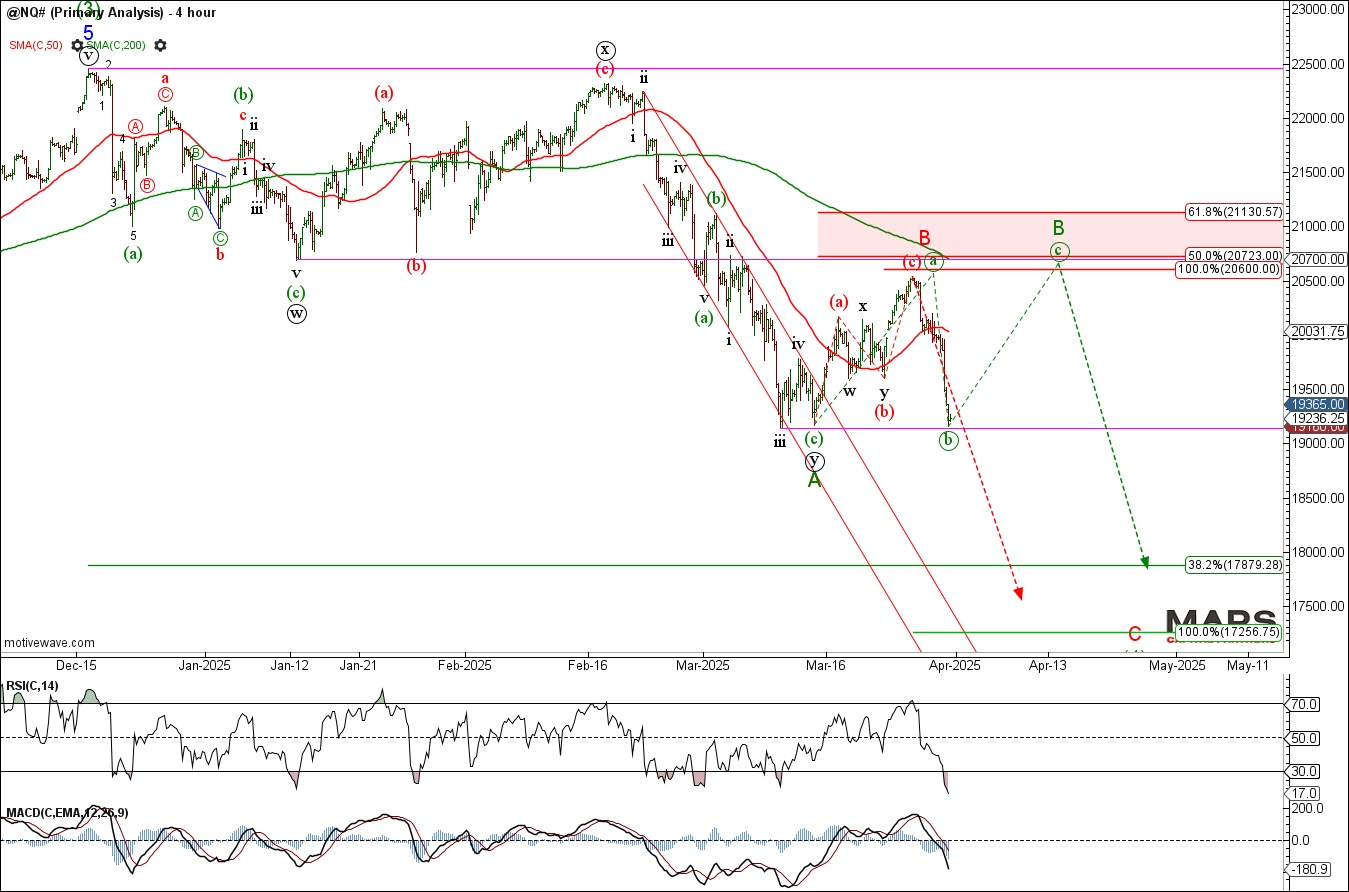
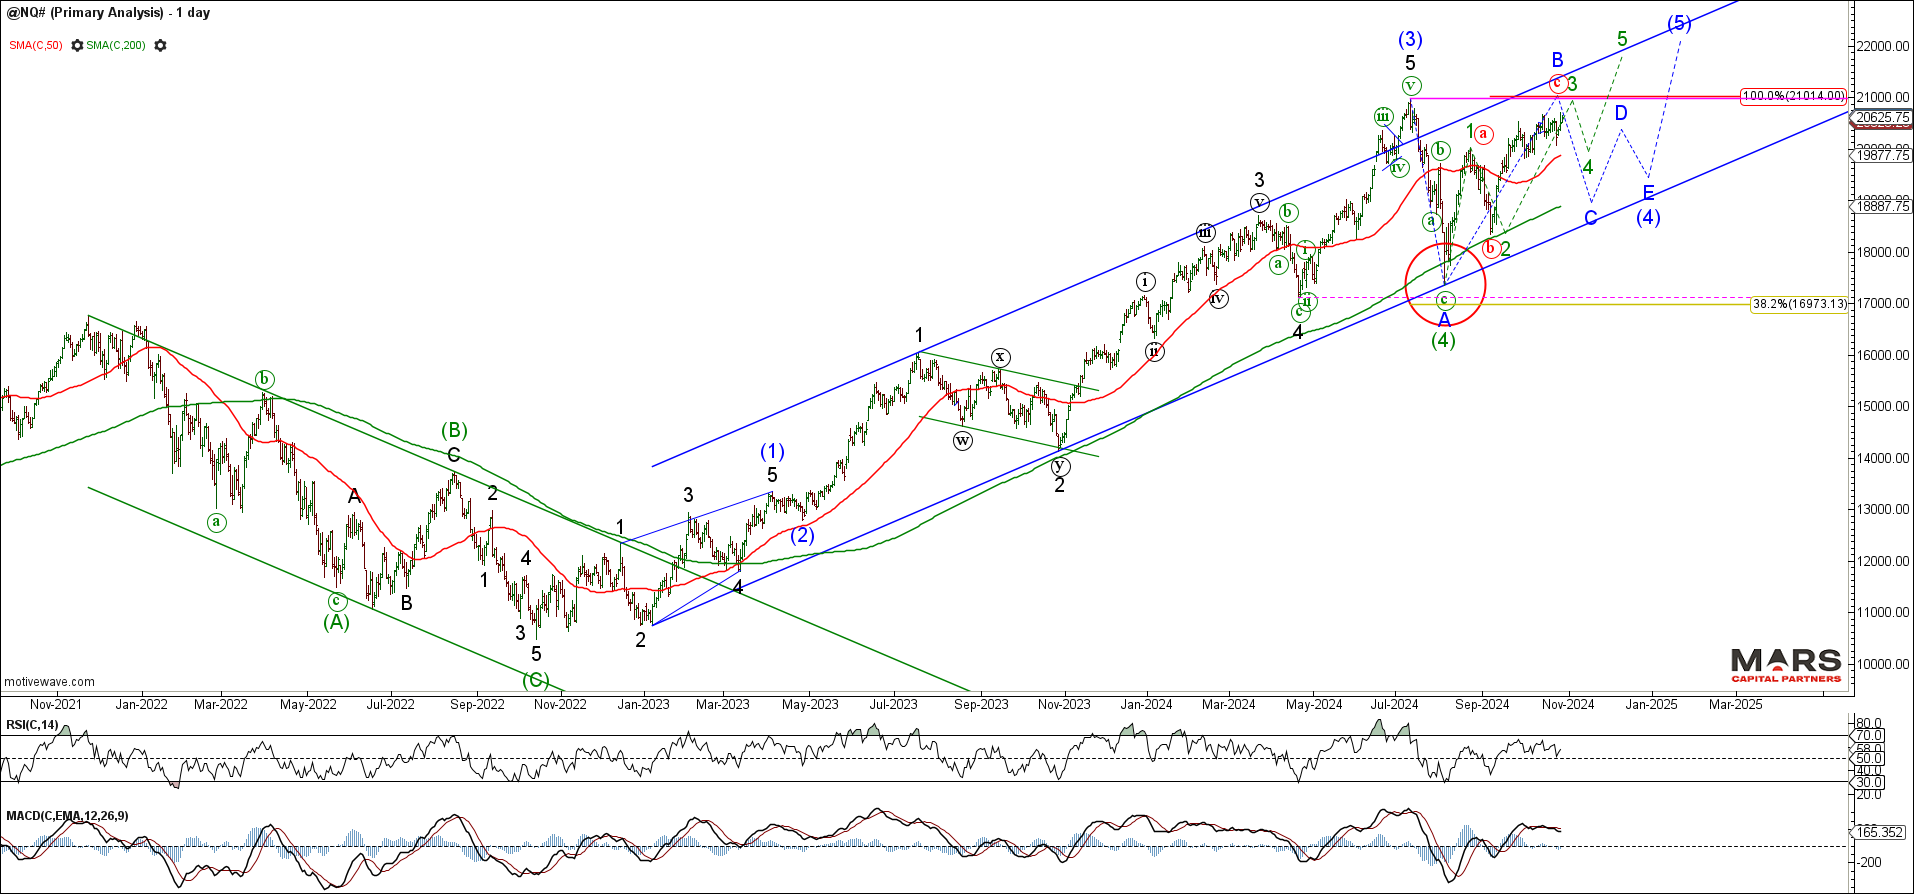
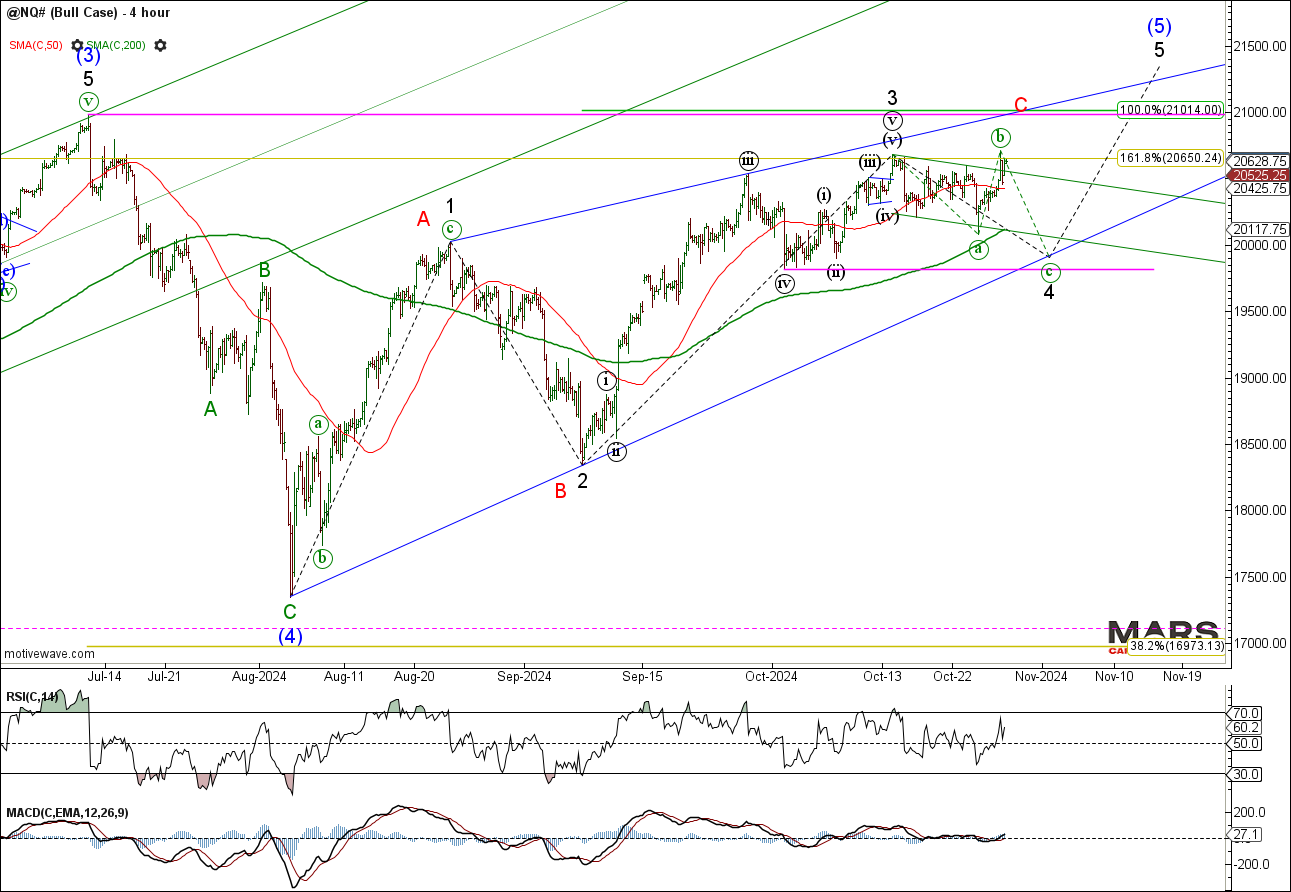
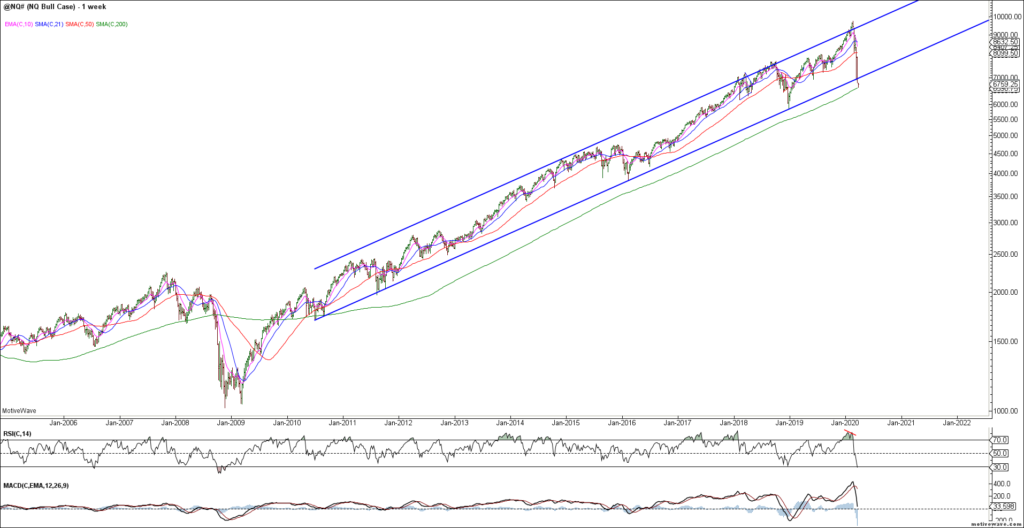
The Nasdaq / NQ also extended higher in a counter-trend rally before reversing sharply lower. While there are enough waves in place to complete red B, bears need to break recent swing lows and continue its impulsive decline to help confirm wave C down. The alternate is a more complex green wave B counter-trend rally if bulls can hold near term support. Either way, the bigger picture trend remains bearish until proven otherwise as we look for wave (4) down towards targets in the 17250 area.
NQ DailyNQ H4
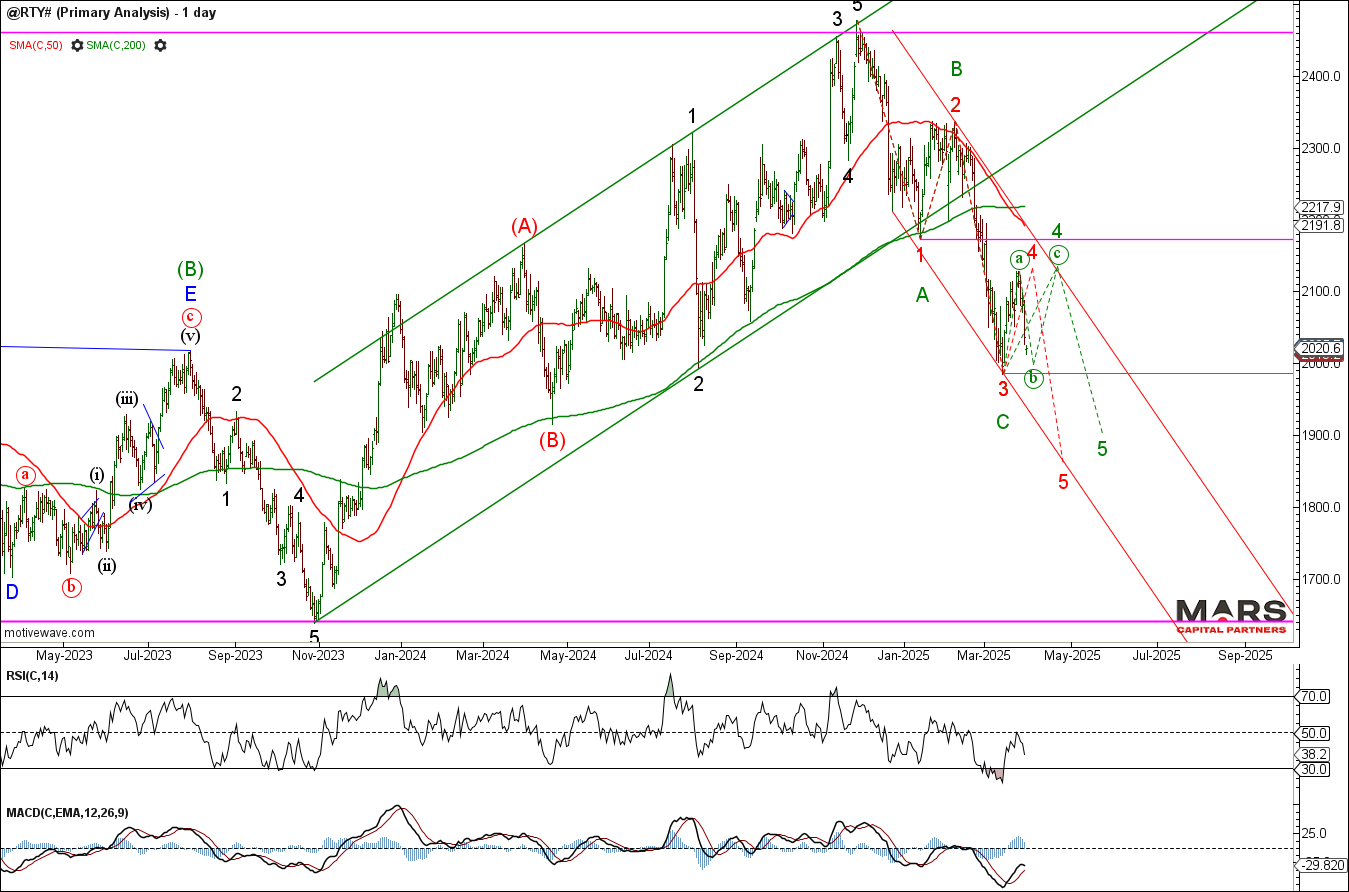
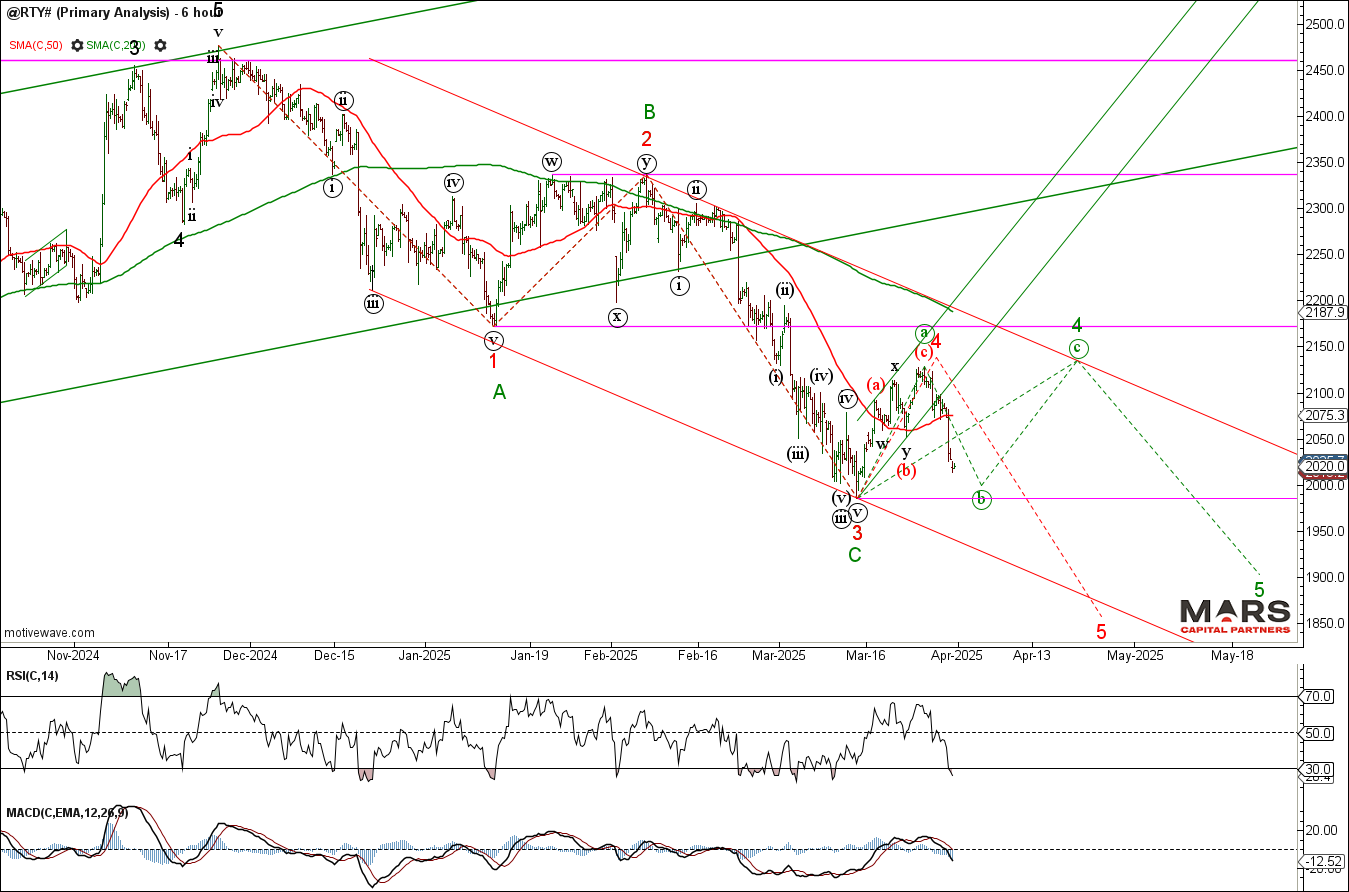
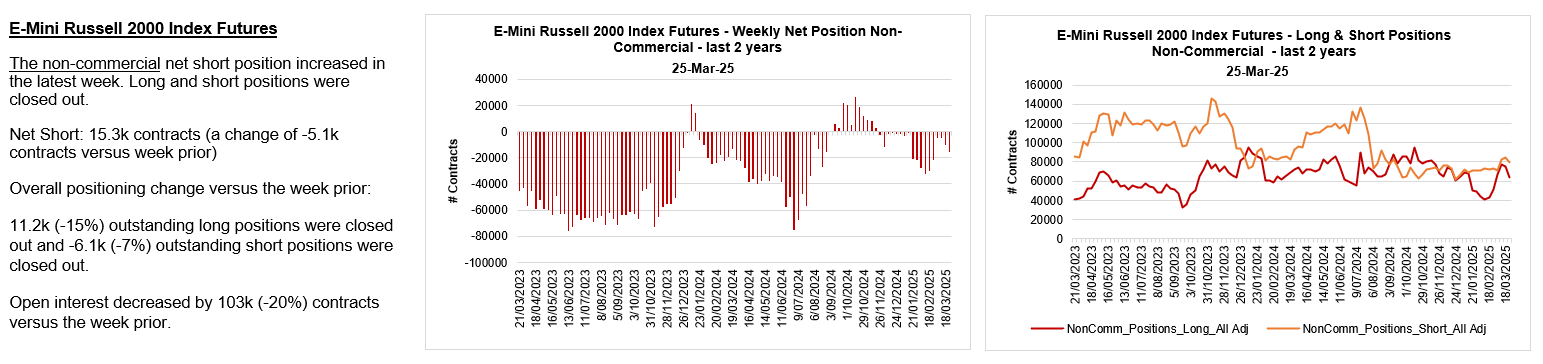
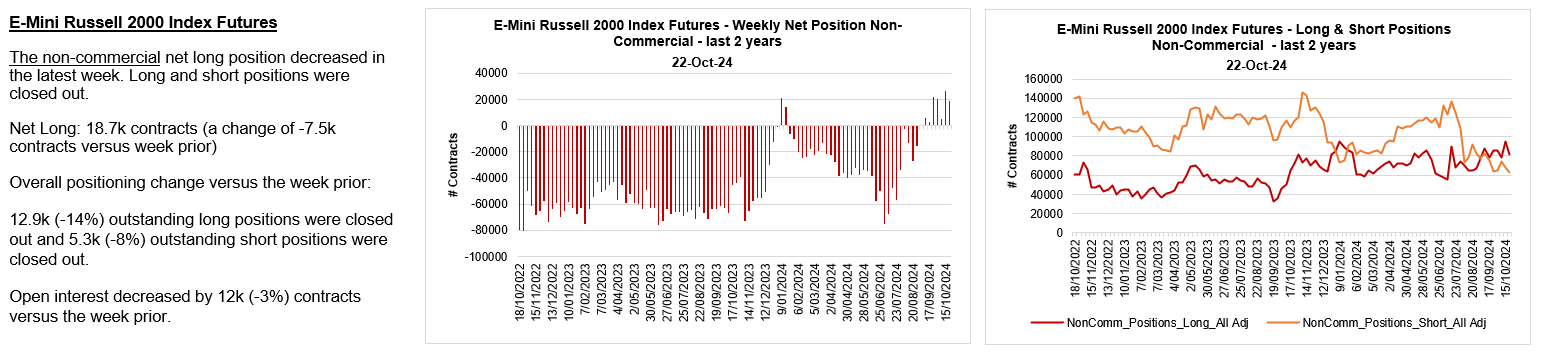
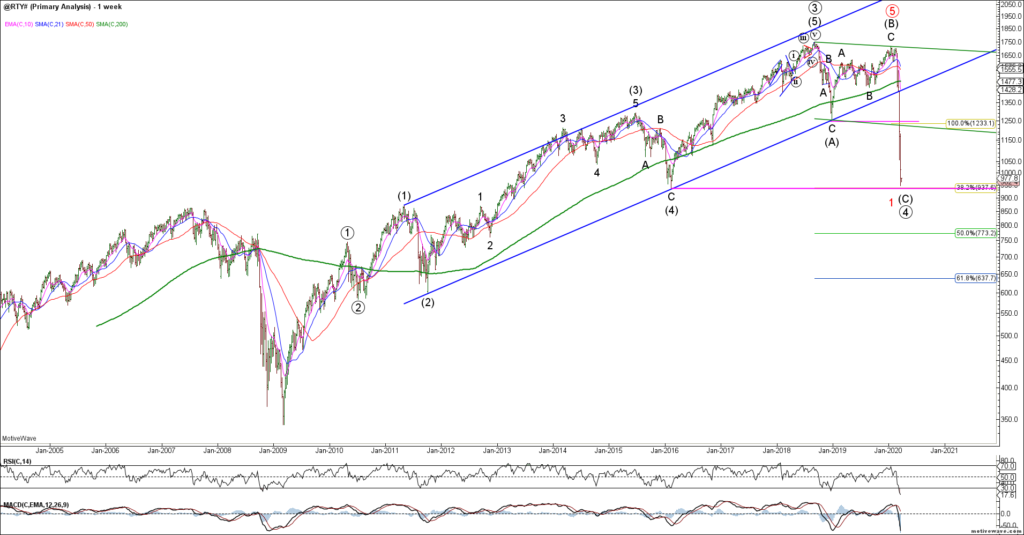
The Russell 2000 / RTY reversed sharply lower while below key overhead resistance as expected. The question is whether the rally completed green wave (a) or “all” of red 4 with wave 5 down on deck. The structure remains bearish while below the wave 1 overlap in the 2172 area as we look for confirmation of a bigger picture bearish decline.
RTY DailyRTY H6
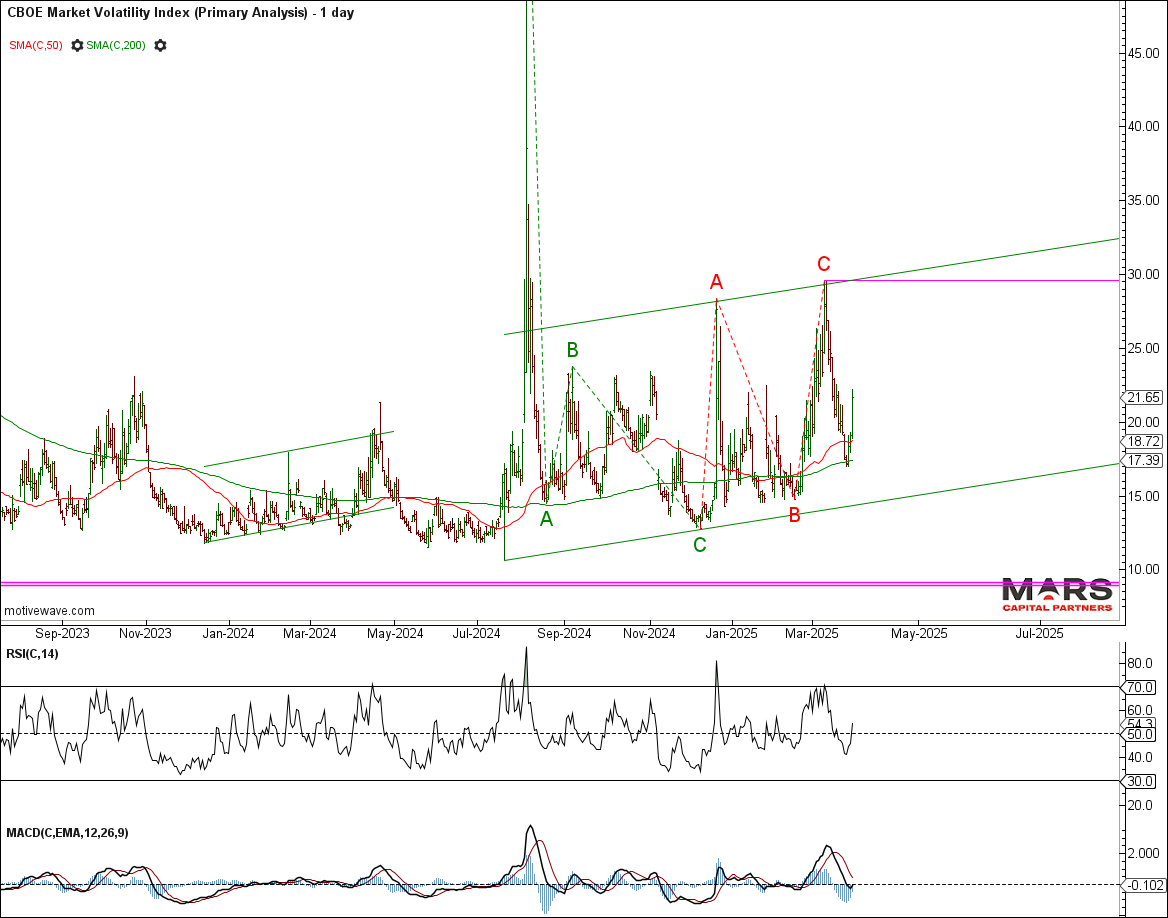
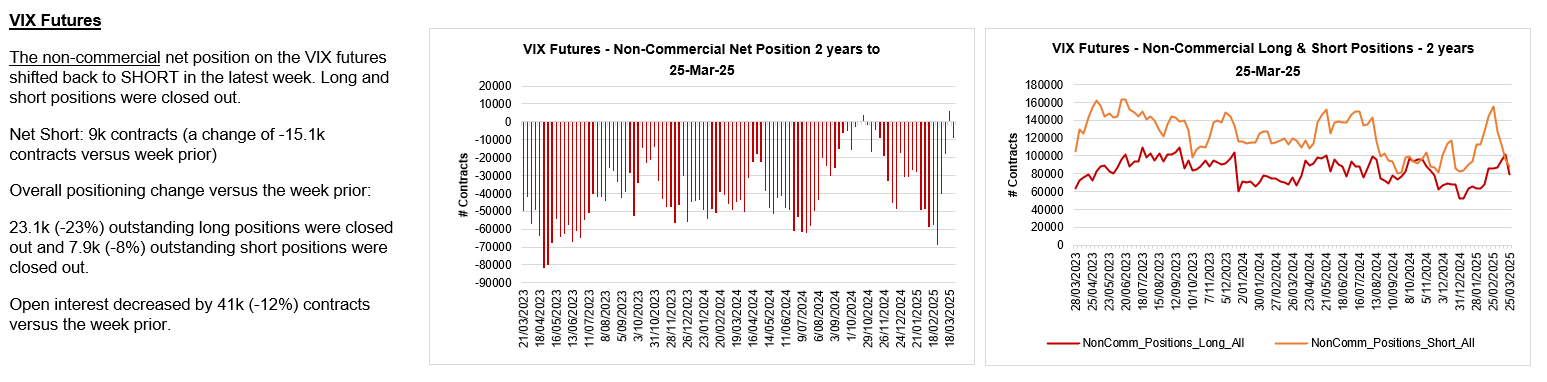
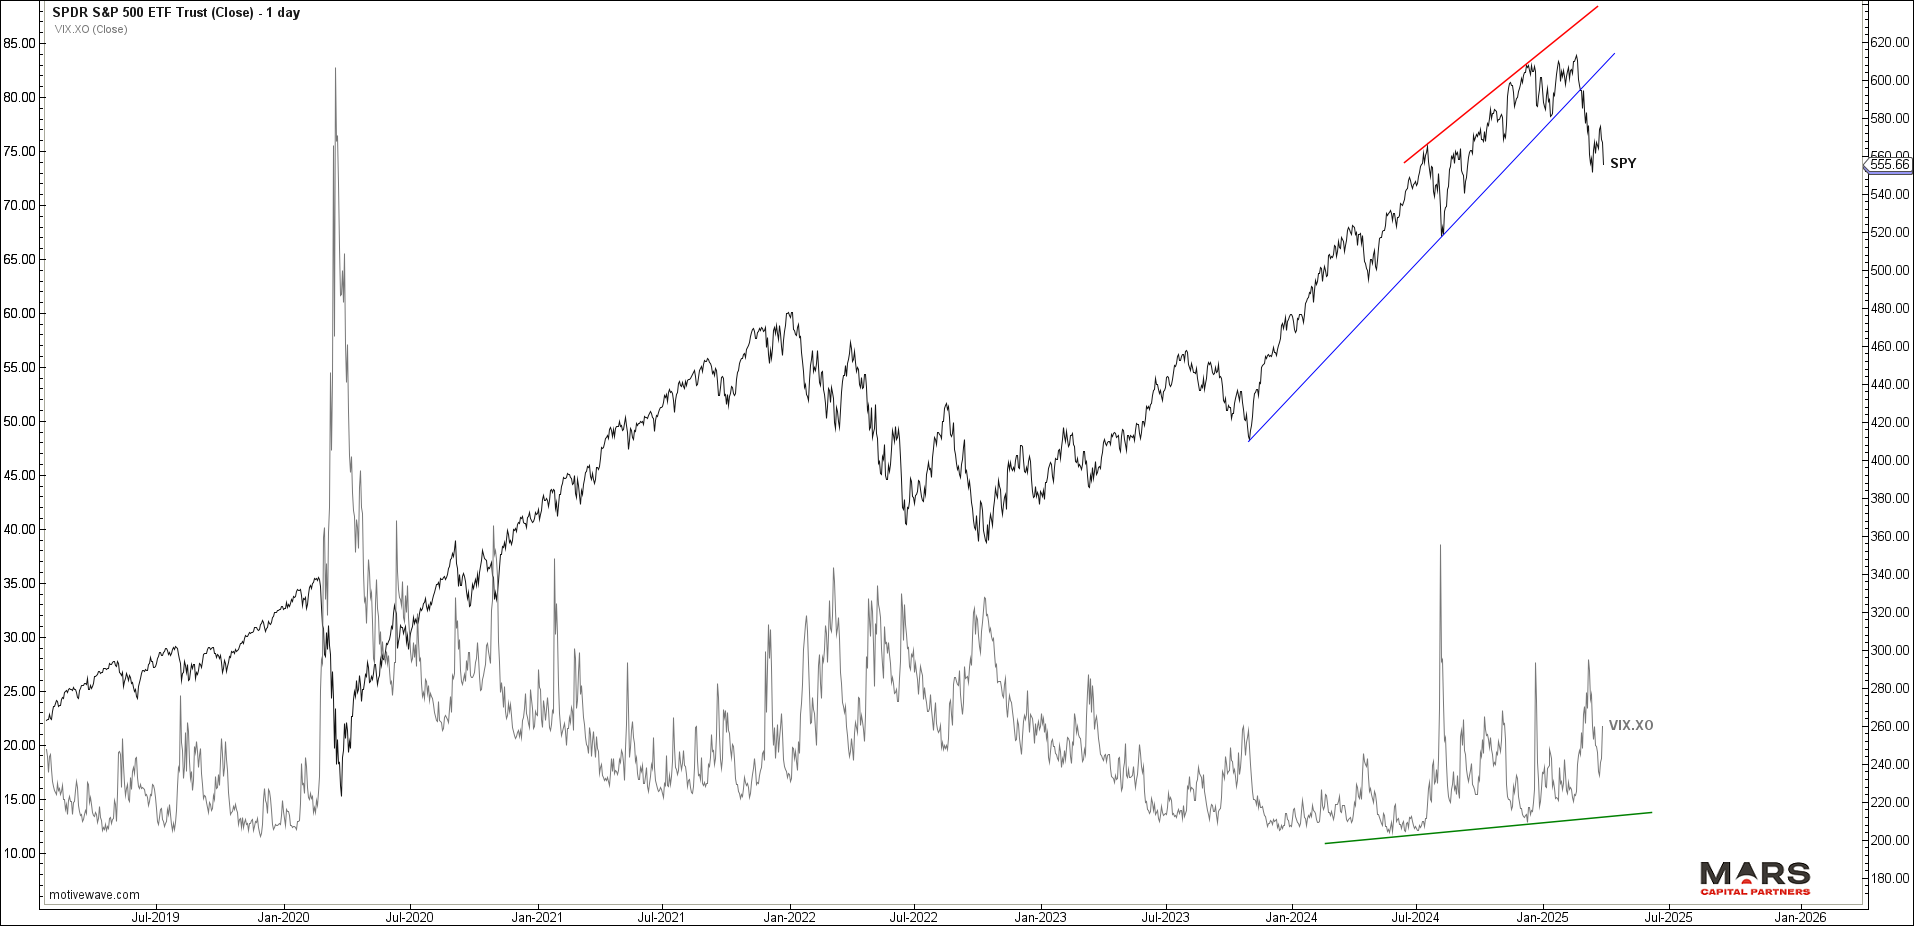
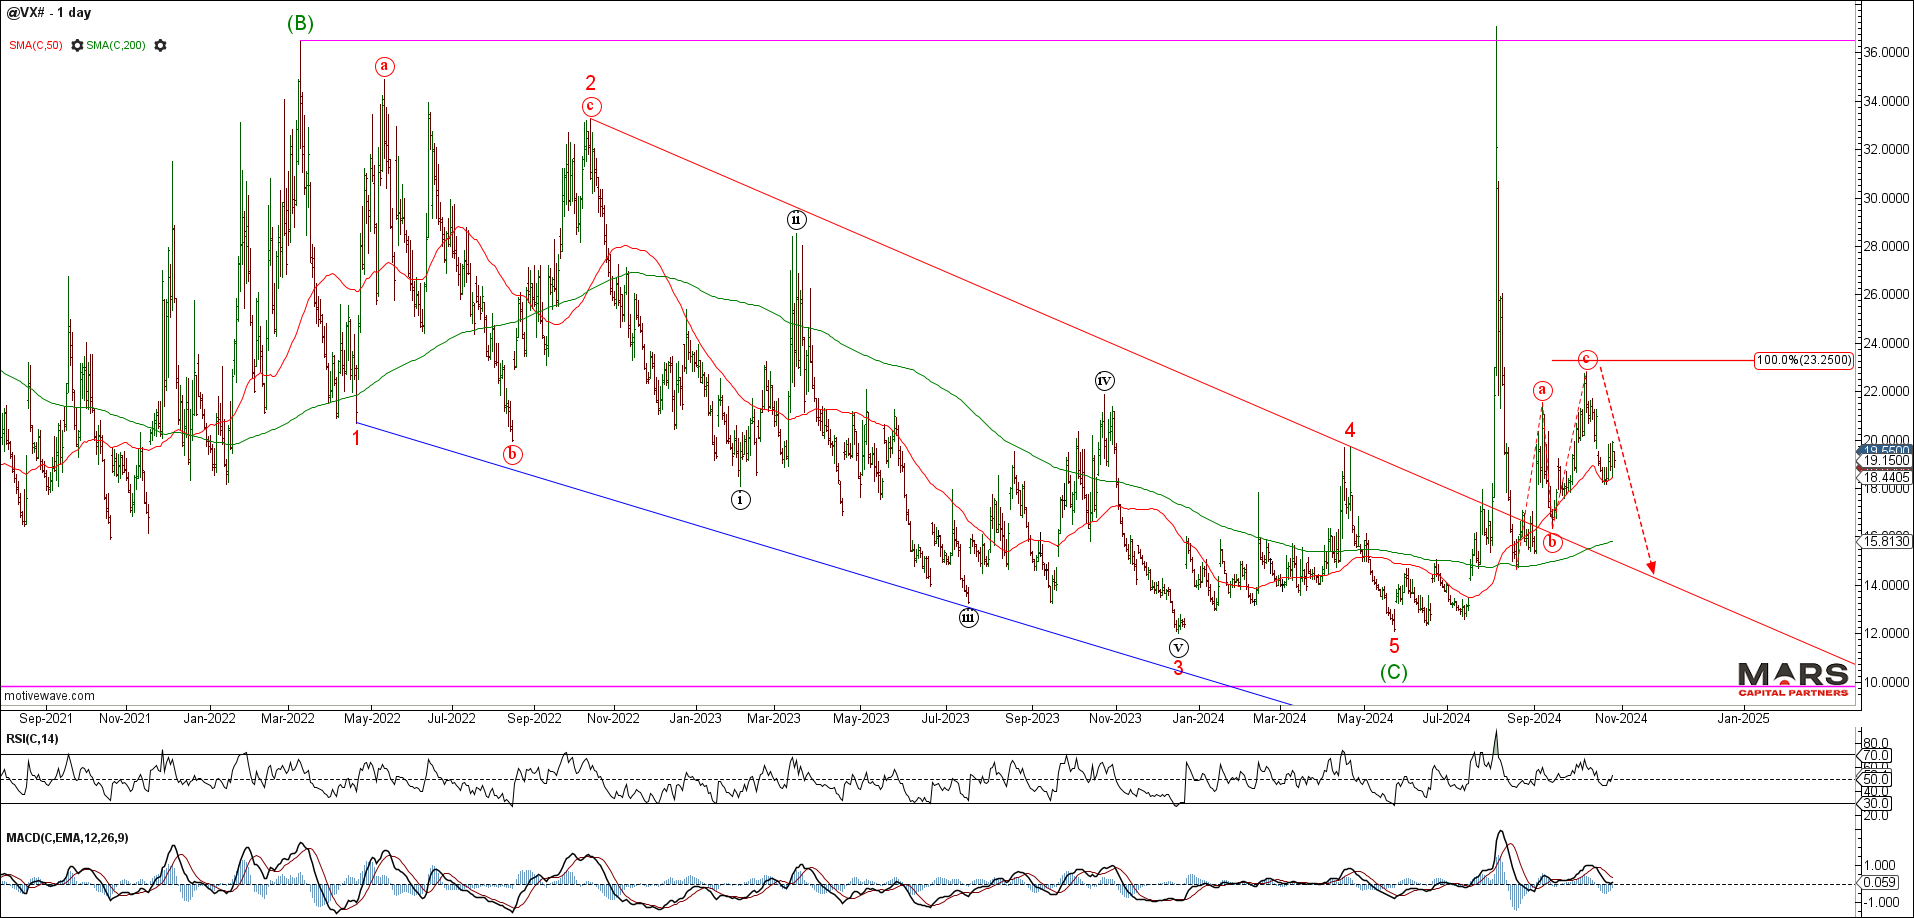
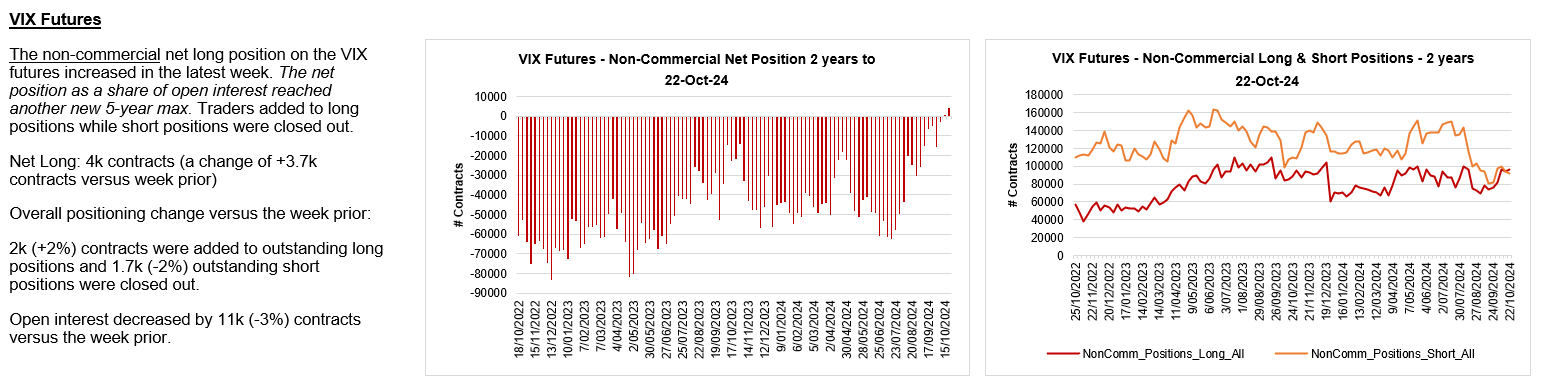
The VIX reversed sharply higher from 200 day sma support but it remains range bound from a big picture perspective. This consolidation is consistent with a bigger picture wave (4) correction in the equity markets. No edge here as the range racing continues and Trump threatens a trade war. The response in the VIX has been muted so far.
VIX DailySPY / VIX Daily
Bond Markets – Breaking higher?
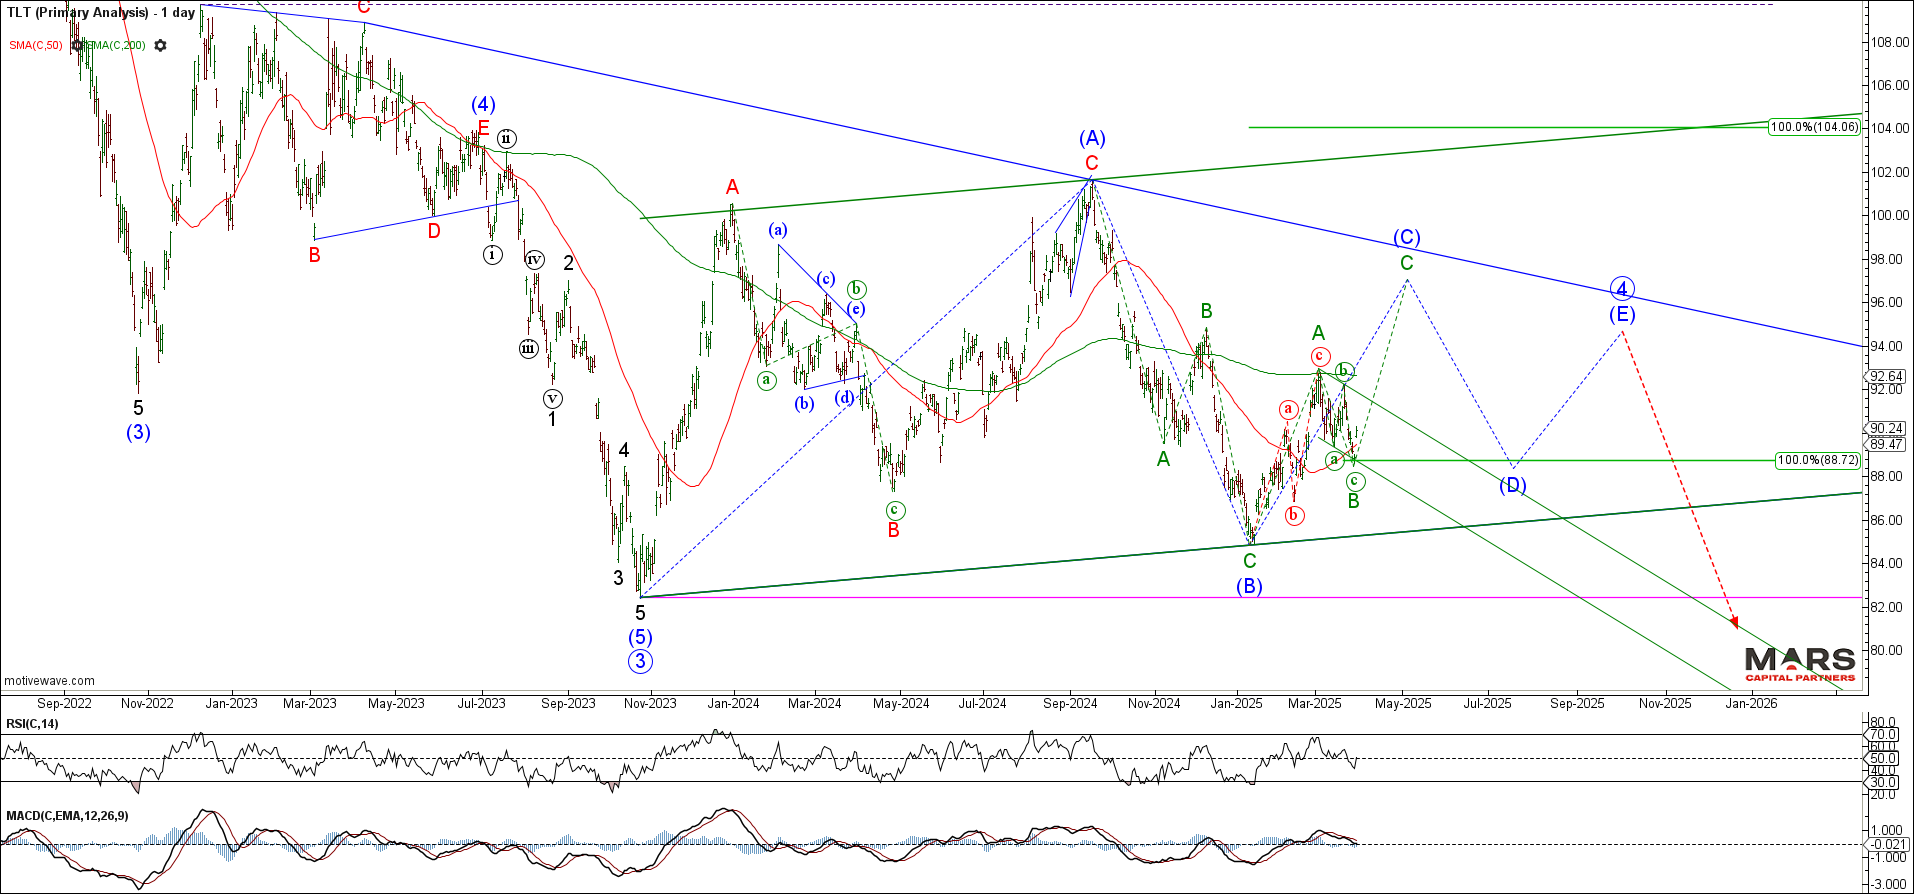
To the bond markets and the TLT declined in 3 waves of equality before reversing higher late last week. The TLT is likely trapped within a big picture triangle but bulls need to clear overhead resistance at the 200 day sma to help confirm more bullish potential. It remains range bound within a big picture consolidation until proven otherwise.
TLT Daily
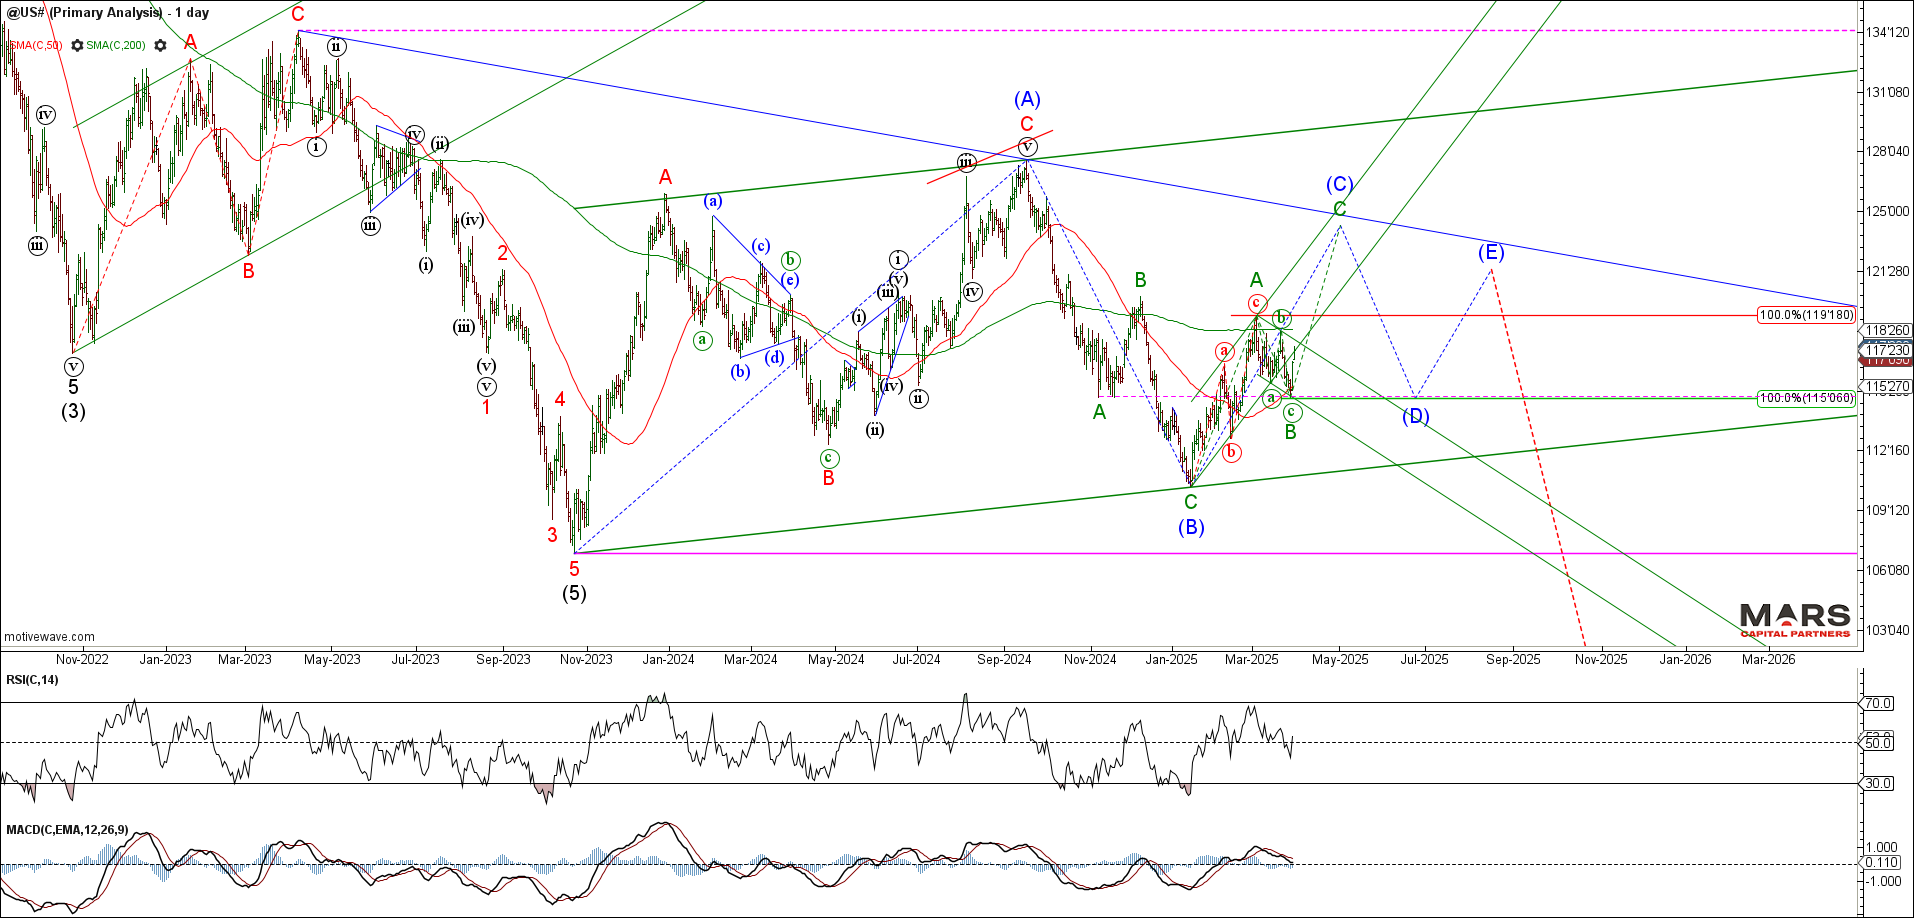
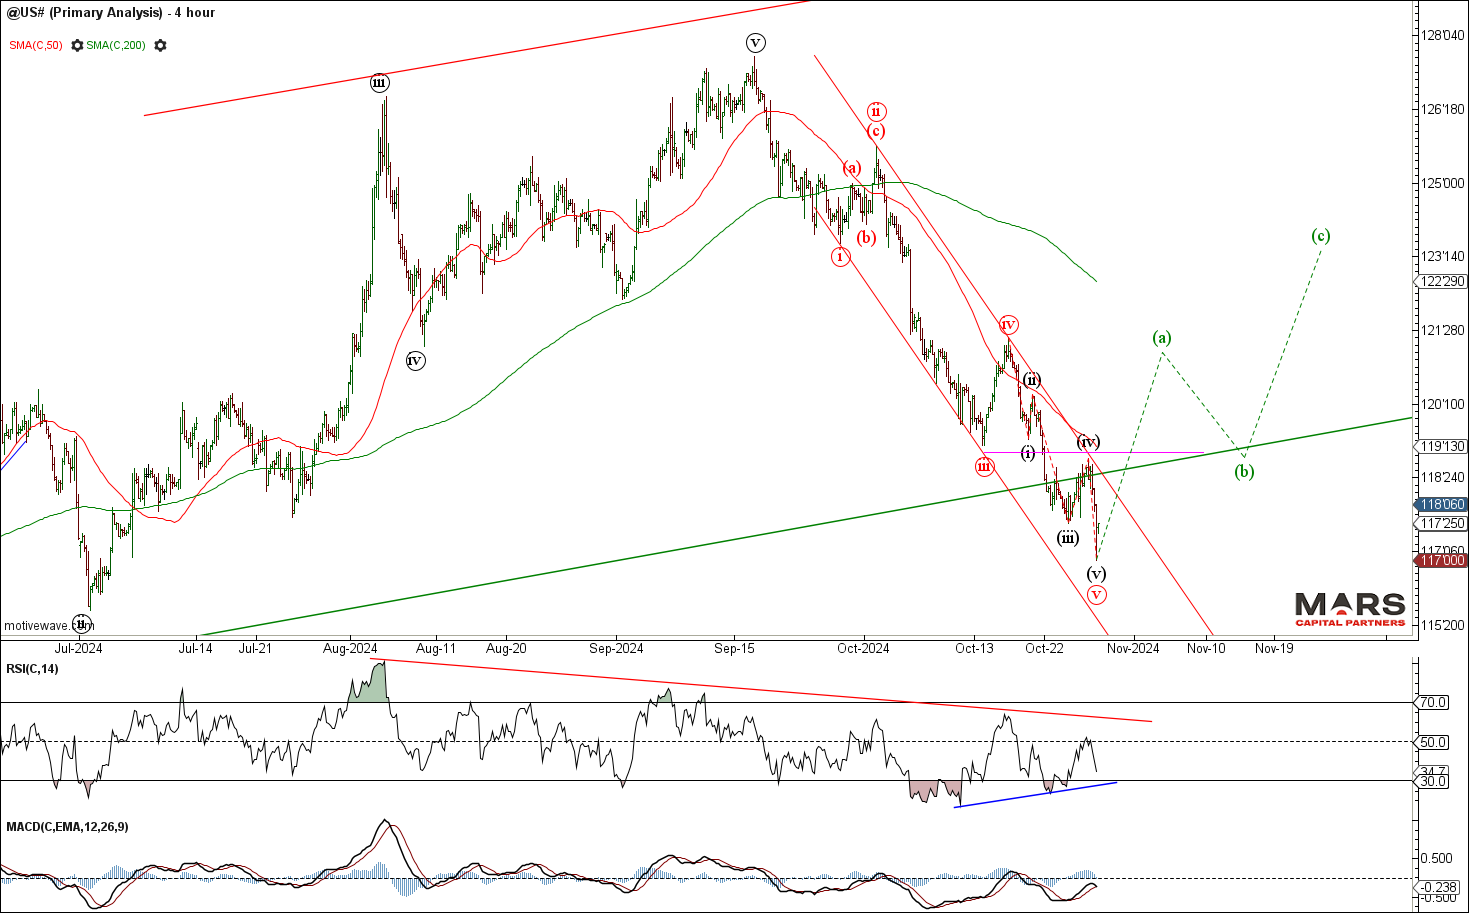
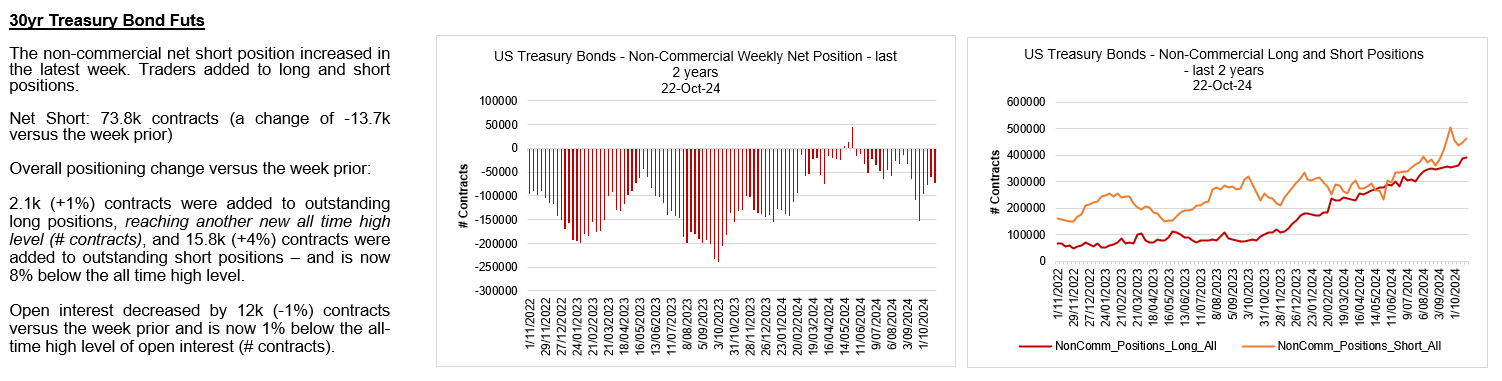
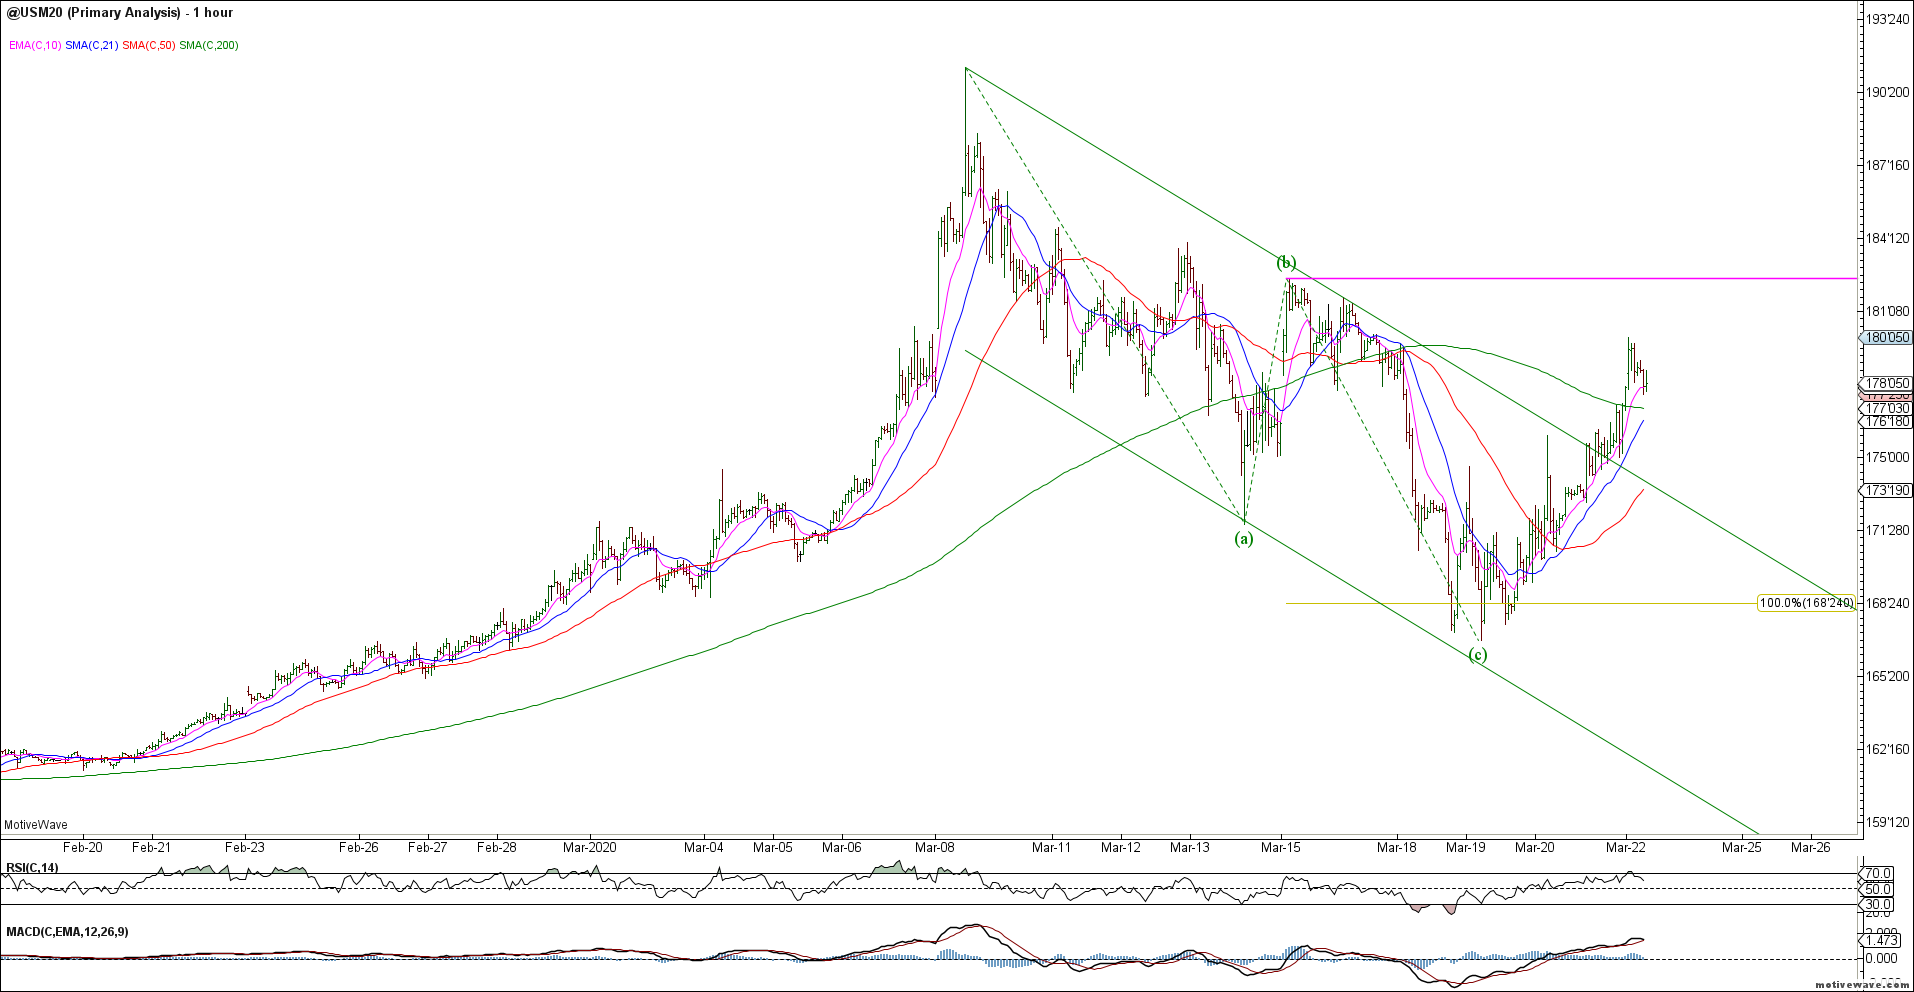
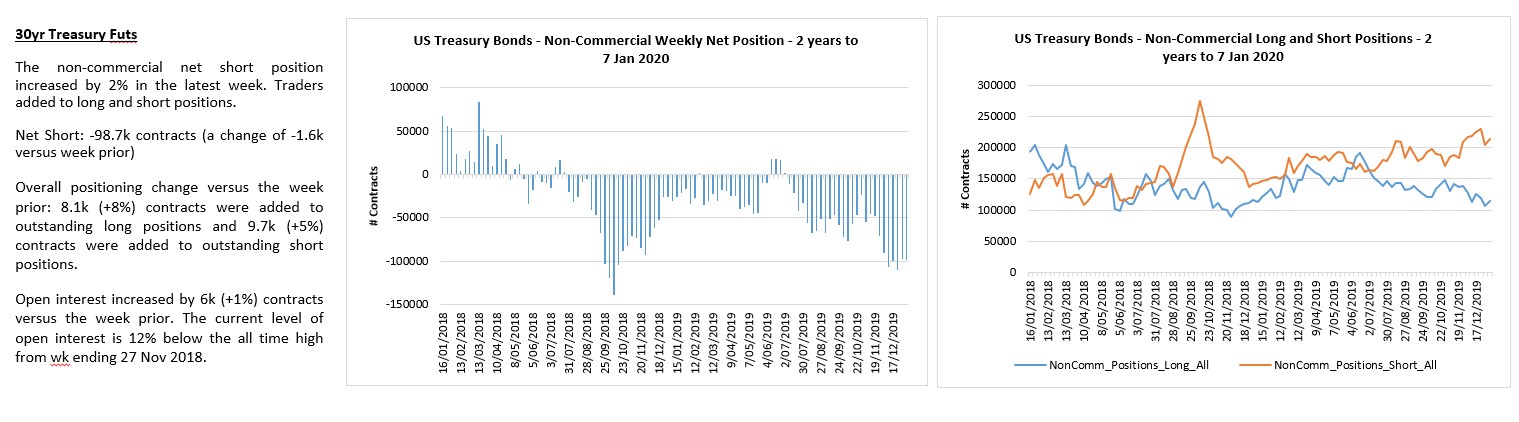
The 30yr / ZB only shows 3 waves up and 3 waves down so far but has the potential for a break higher in wave C of (C). Bulls need to clear 200 day sma resistance to open the door to a larger rally. Likely limited upside given the corrective nature of the initial rally within a big picture triangle.
ZB Daily
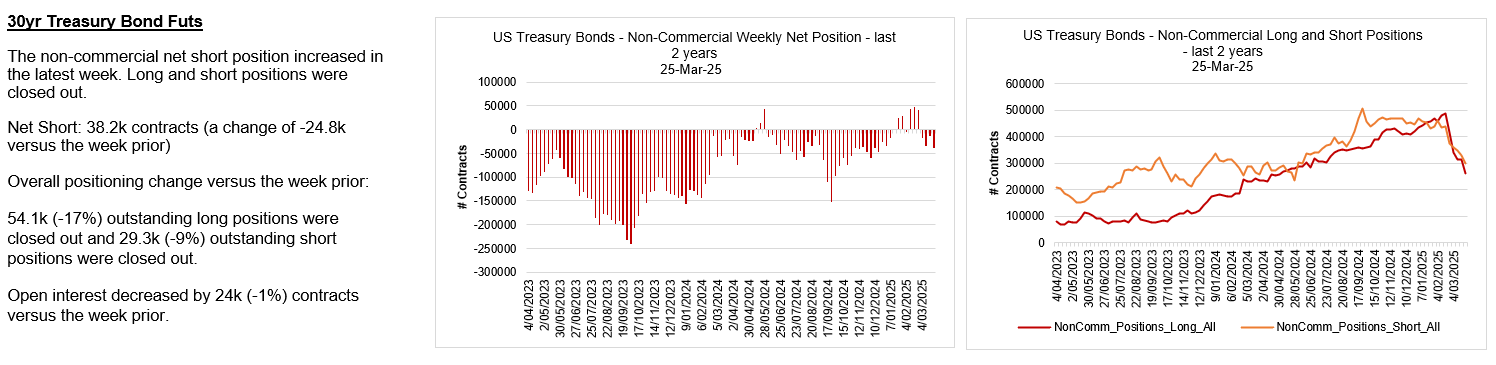
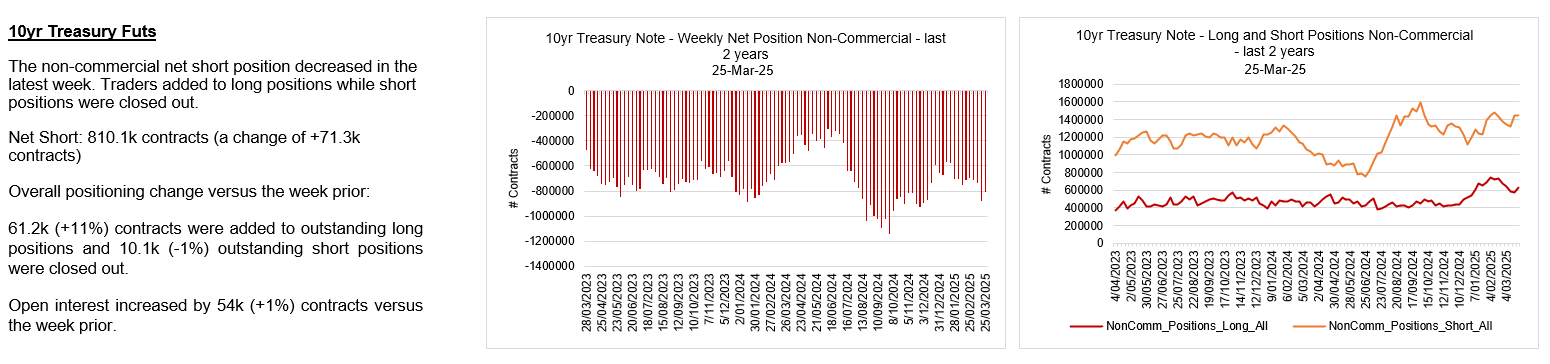
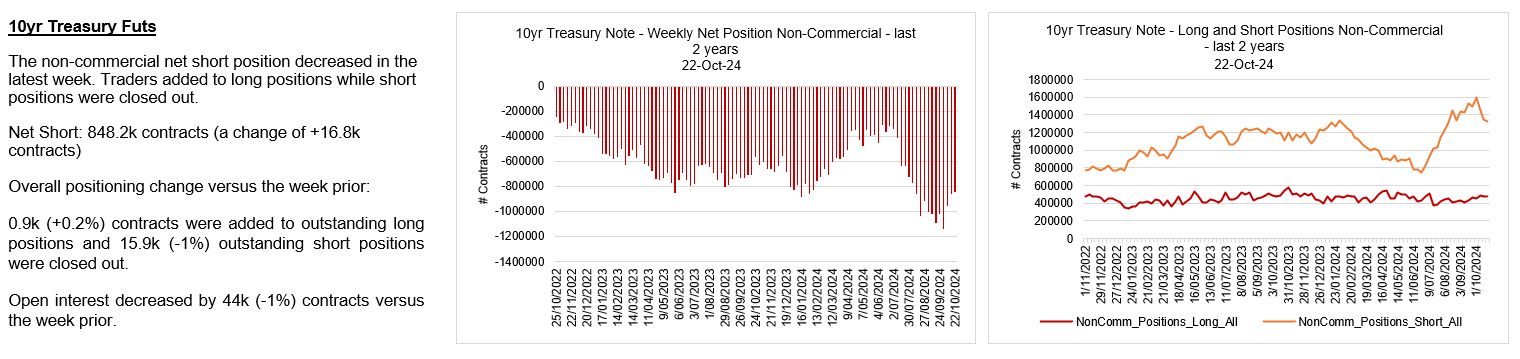
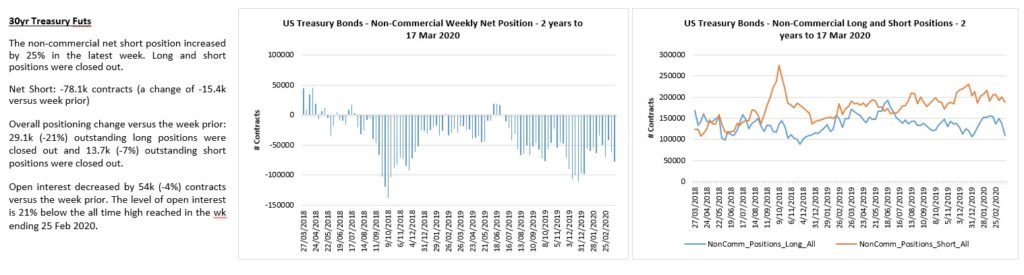
Bulls and bears are exiting long bonds en mass.
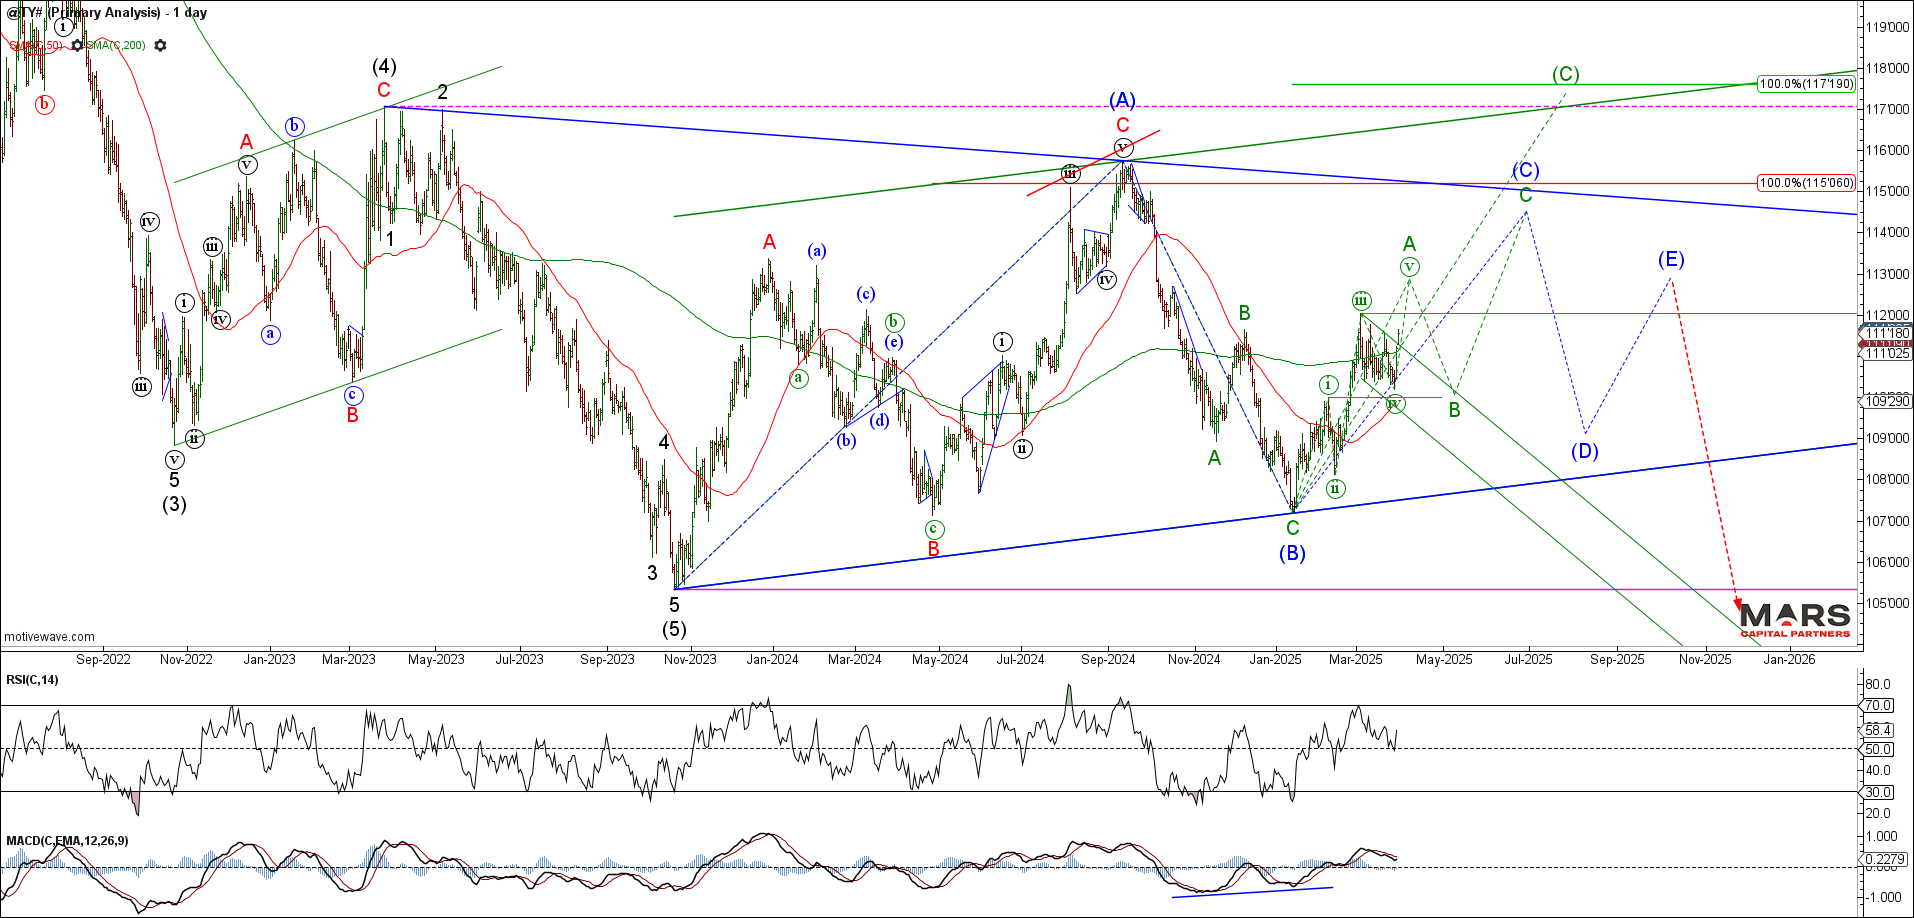
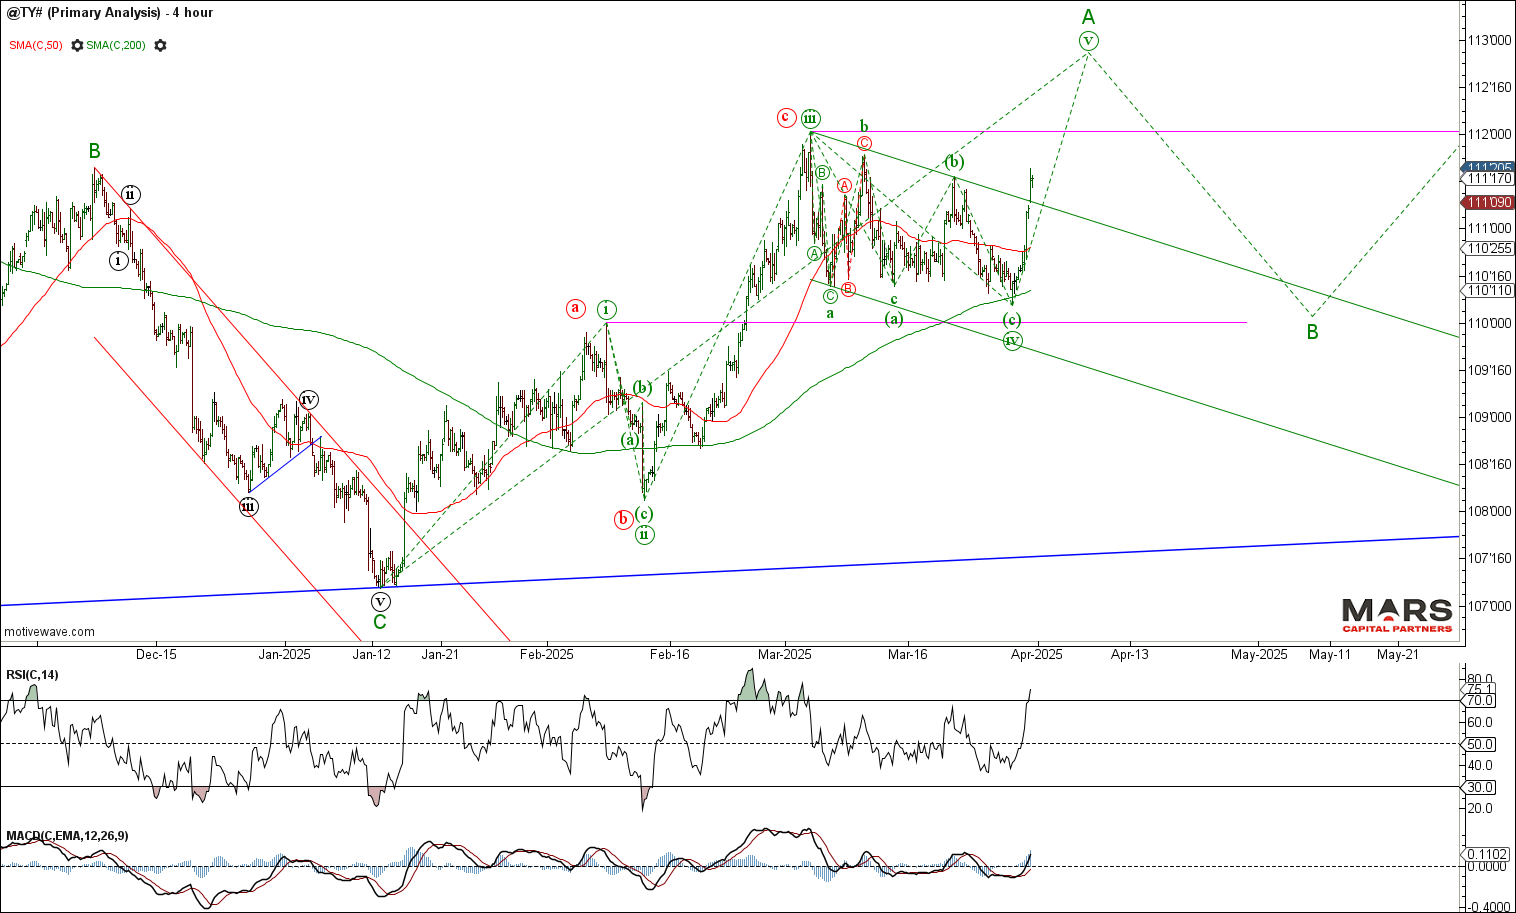
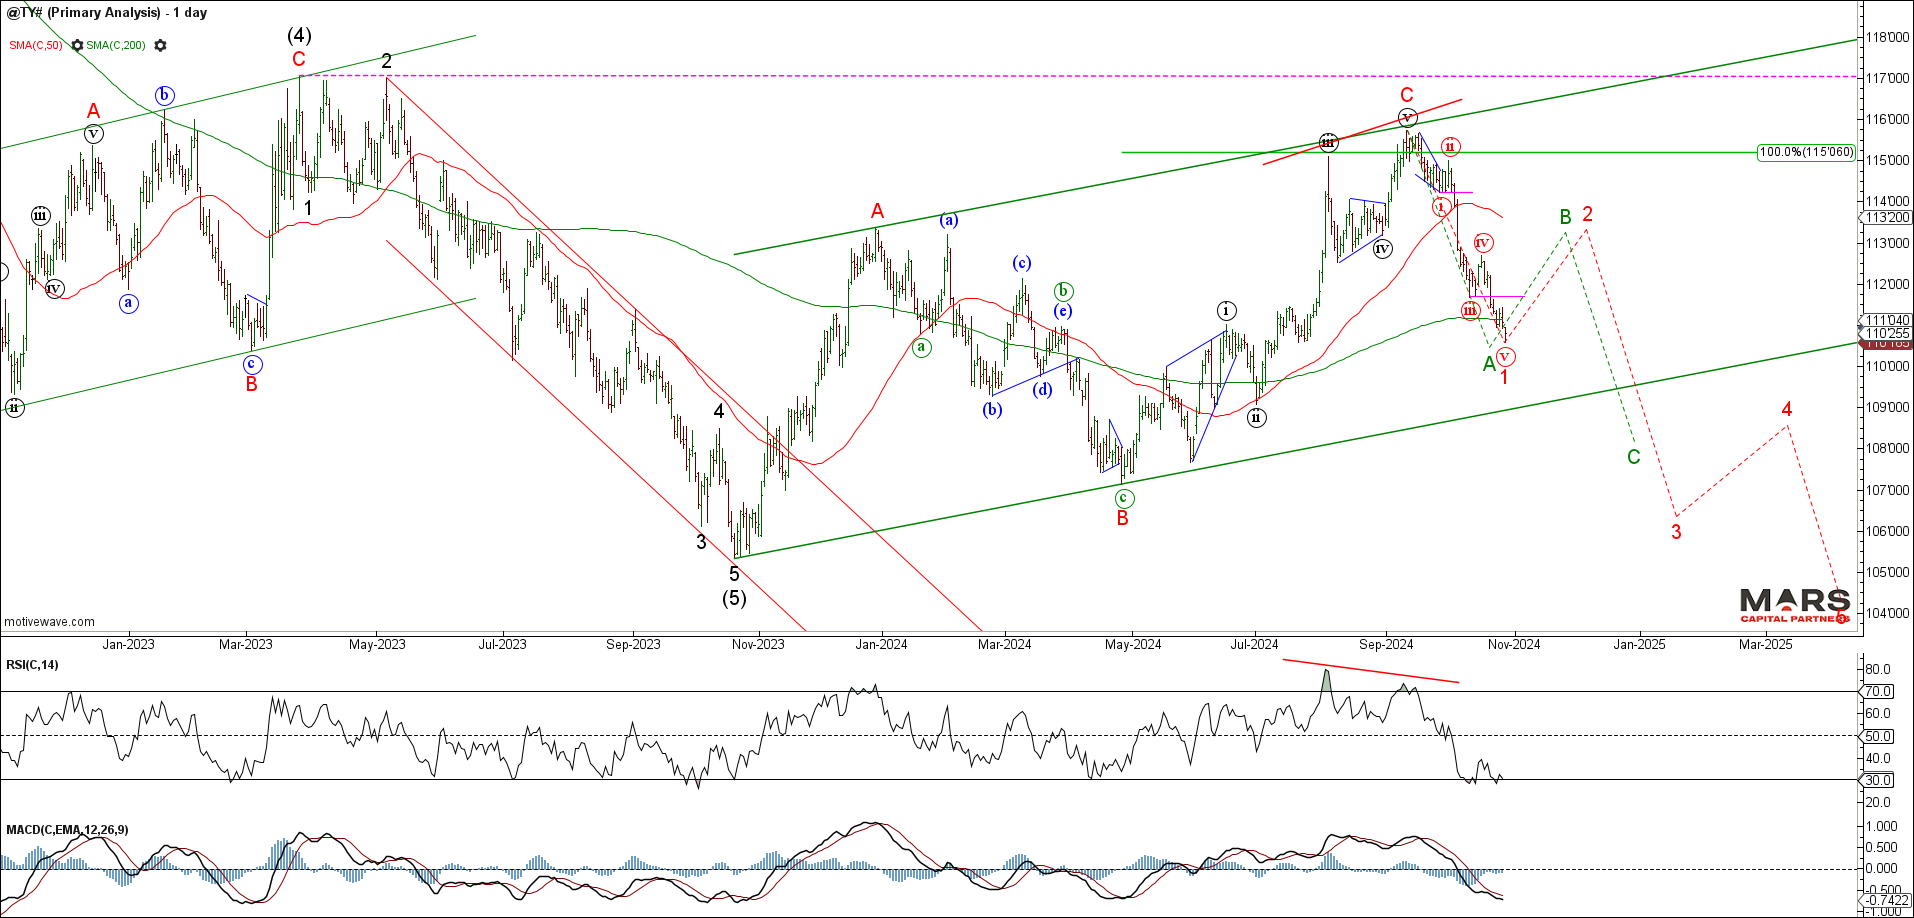
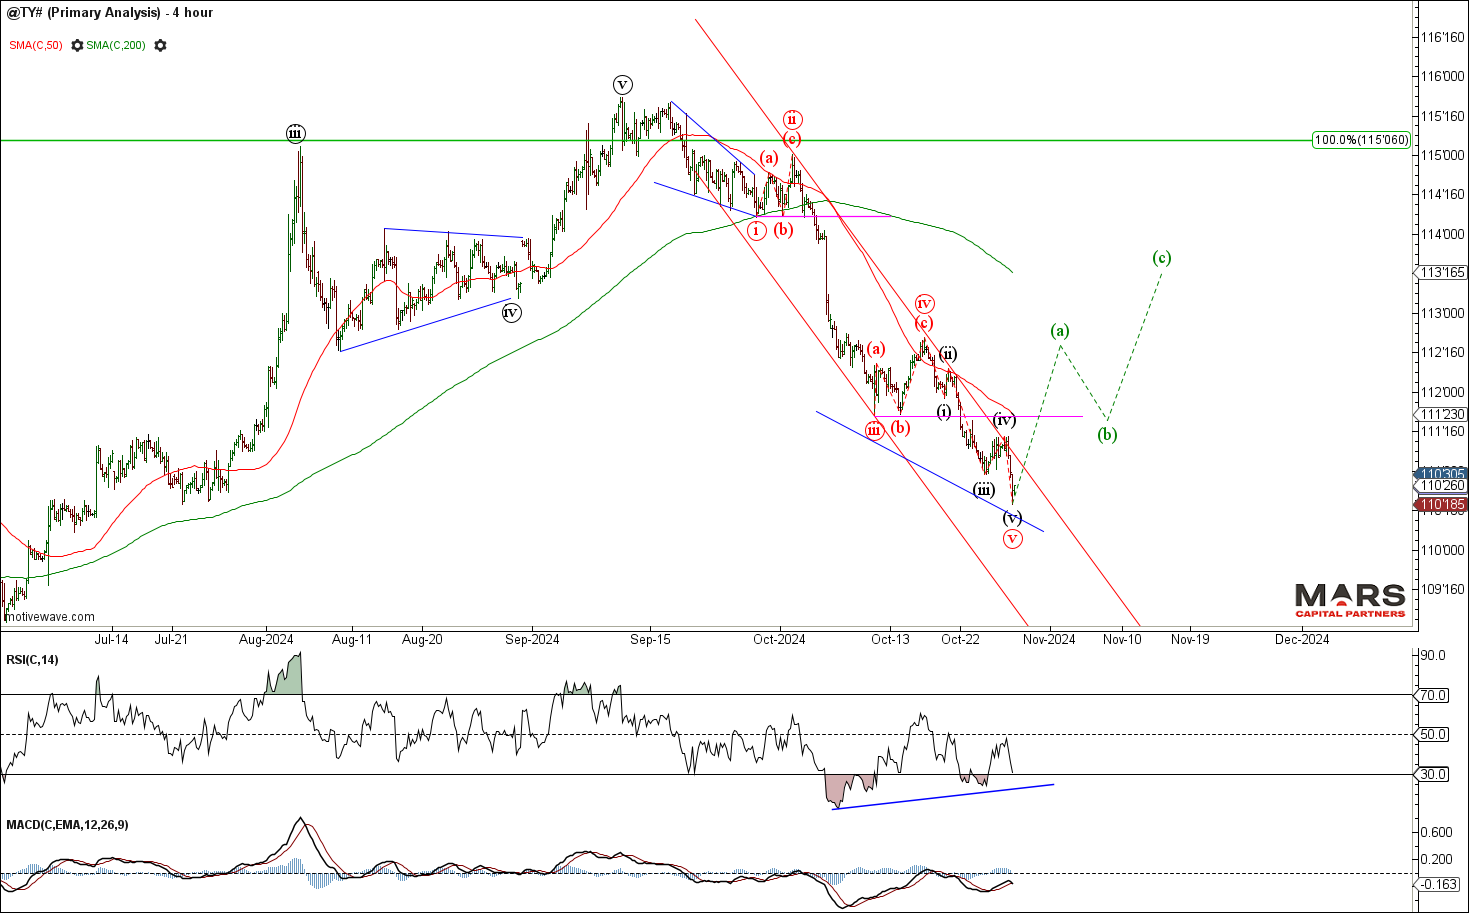
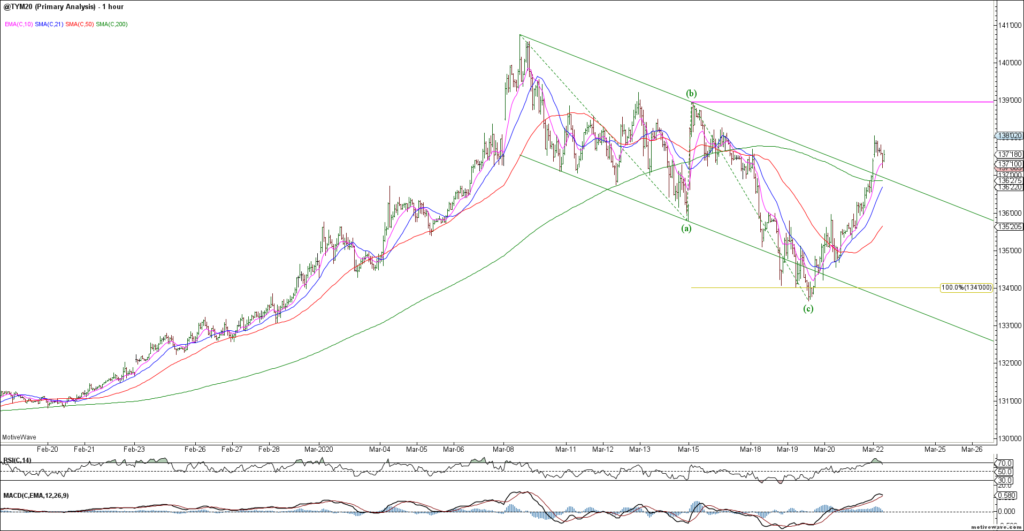
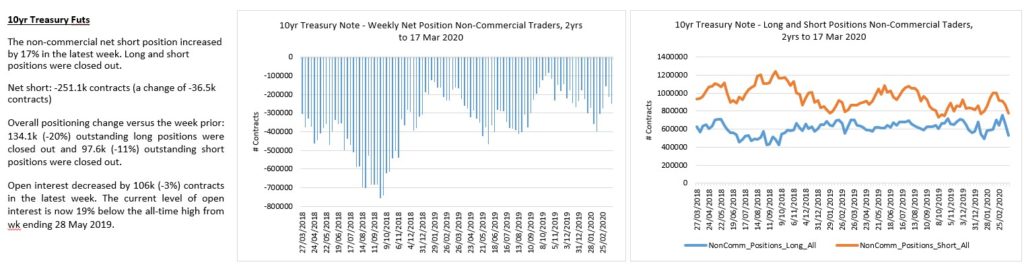
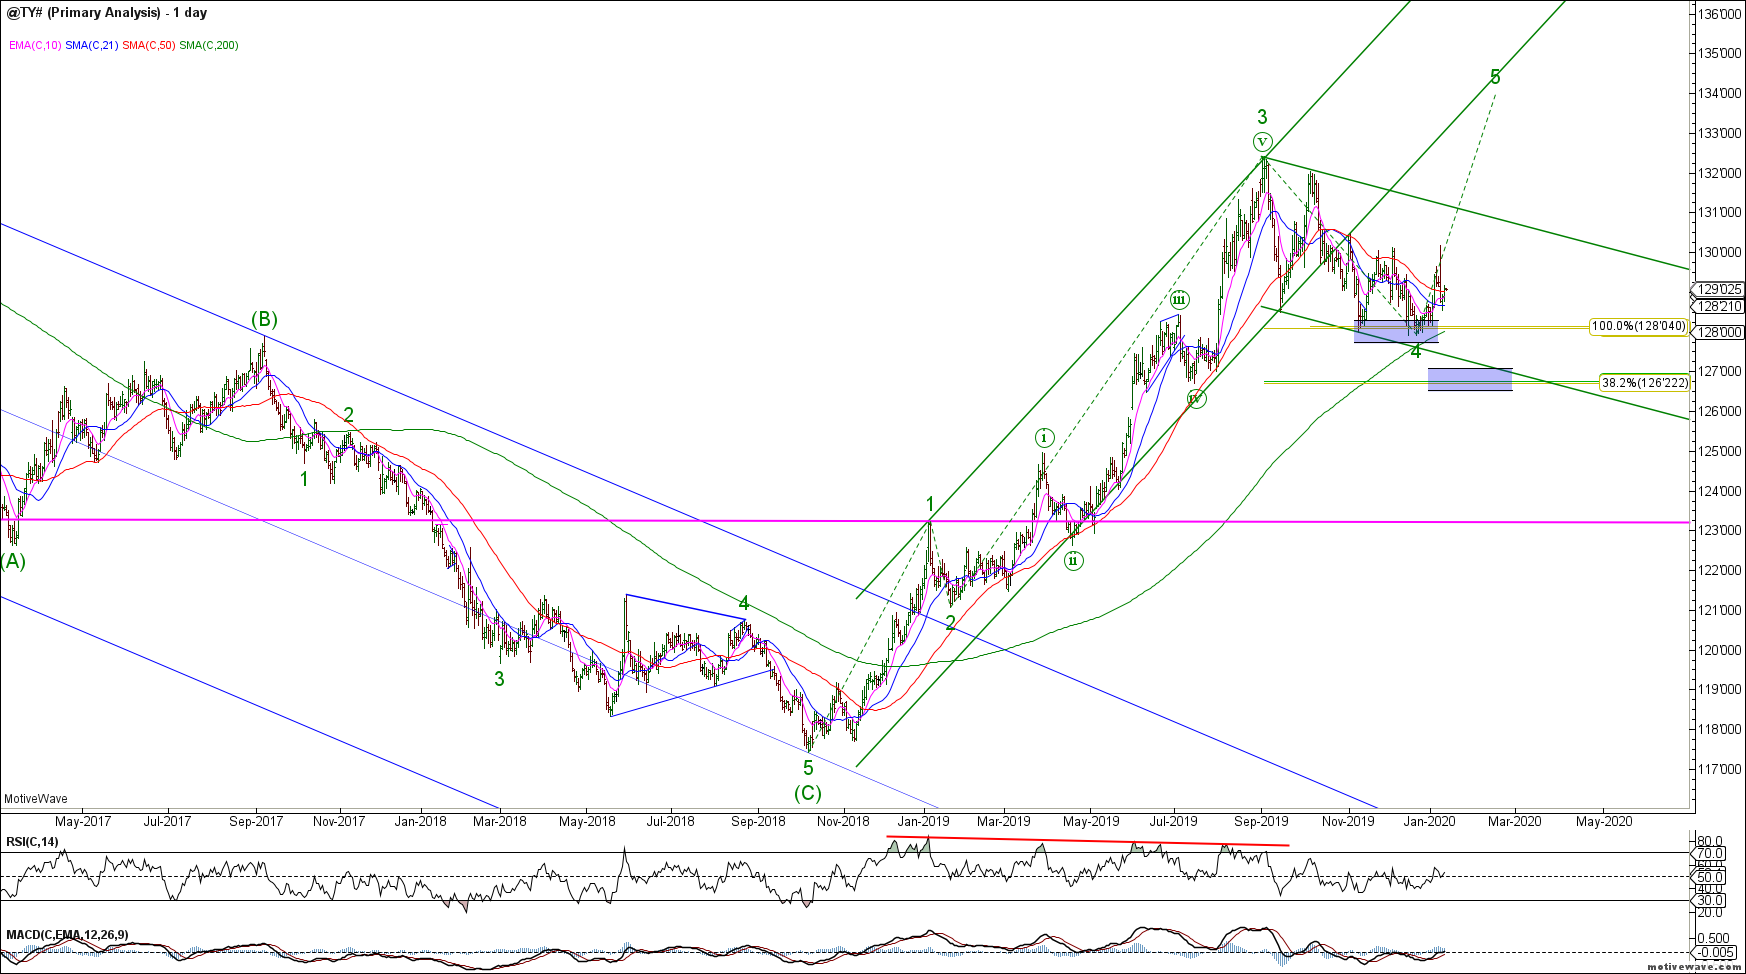
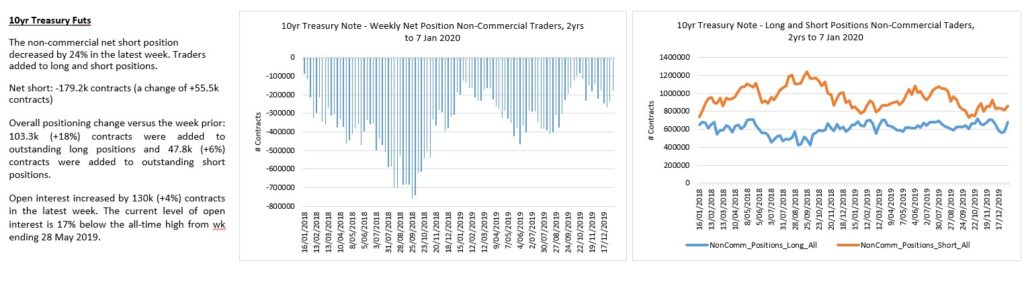
The US10yr / TY held overlap support and rallied strongly late last week to help set up a 5th wave rally. Bulls need to clear 112 overhead resistance to open the door to a bigger picture wave (C) higher. We continue to see this rally as part of a larger degree correction. Despite being range bound, the outlook remains higher for a bigger picture wave (C) rally.
TY DailyTY H4
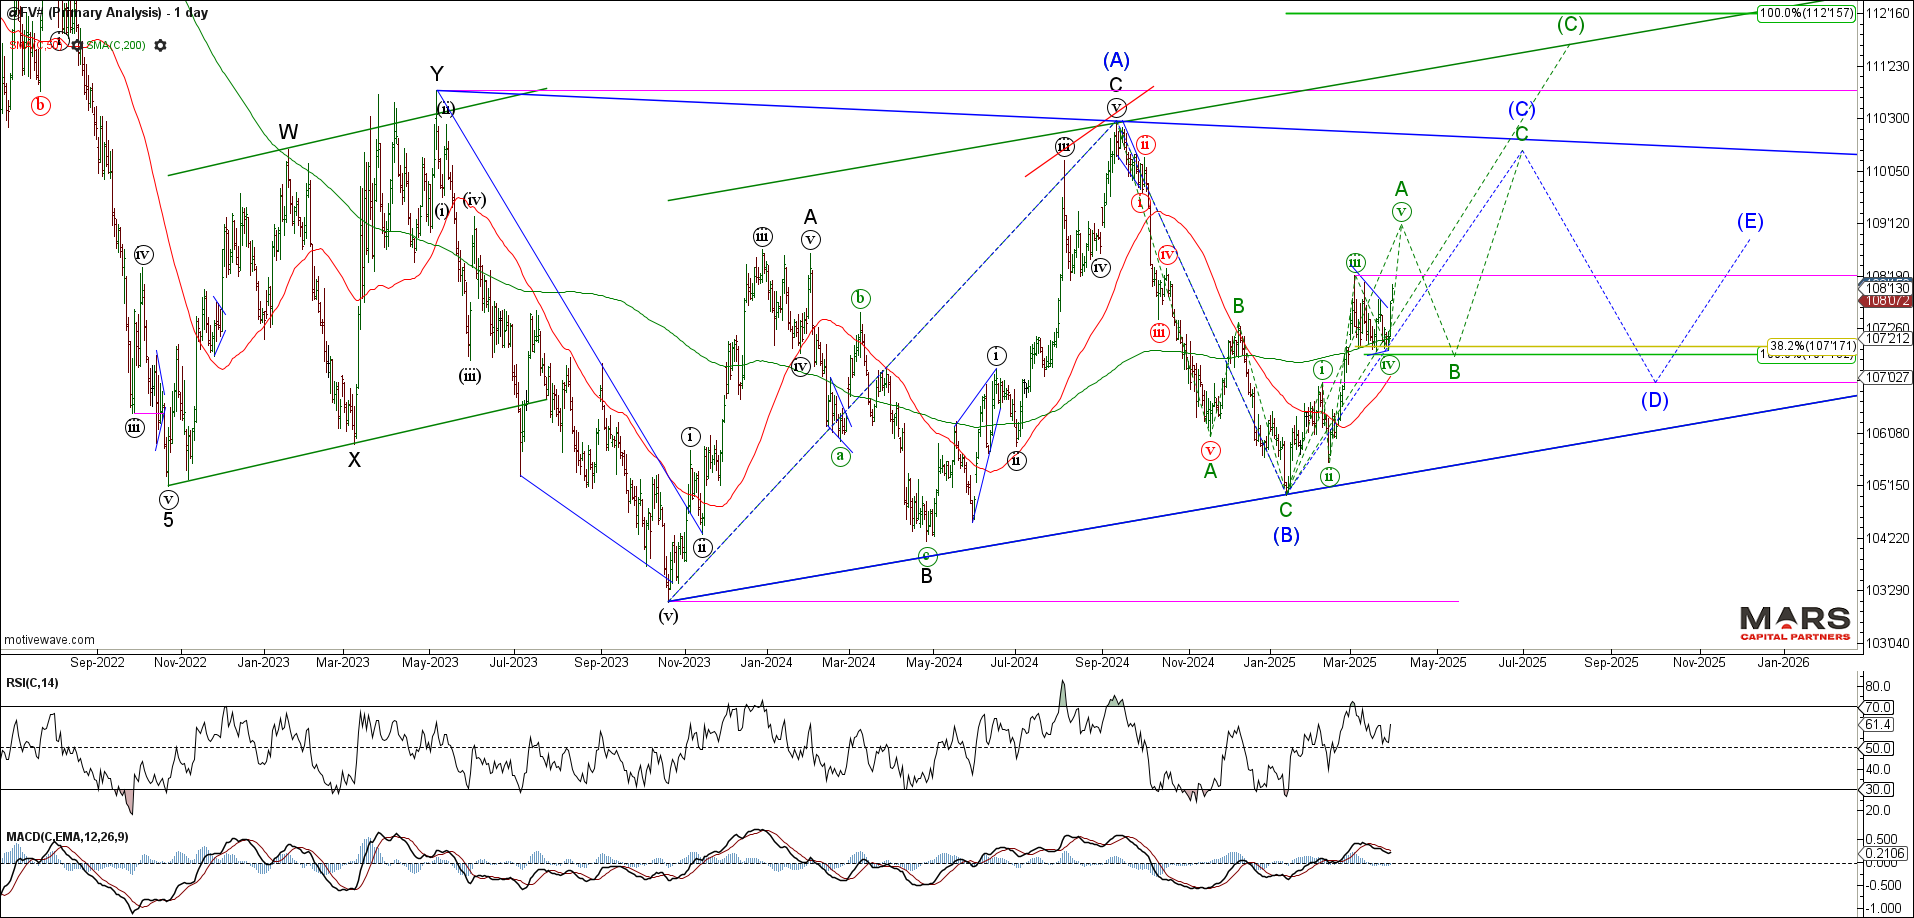
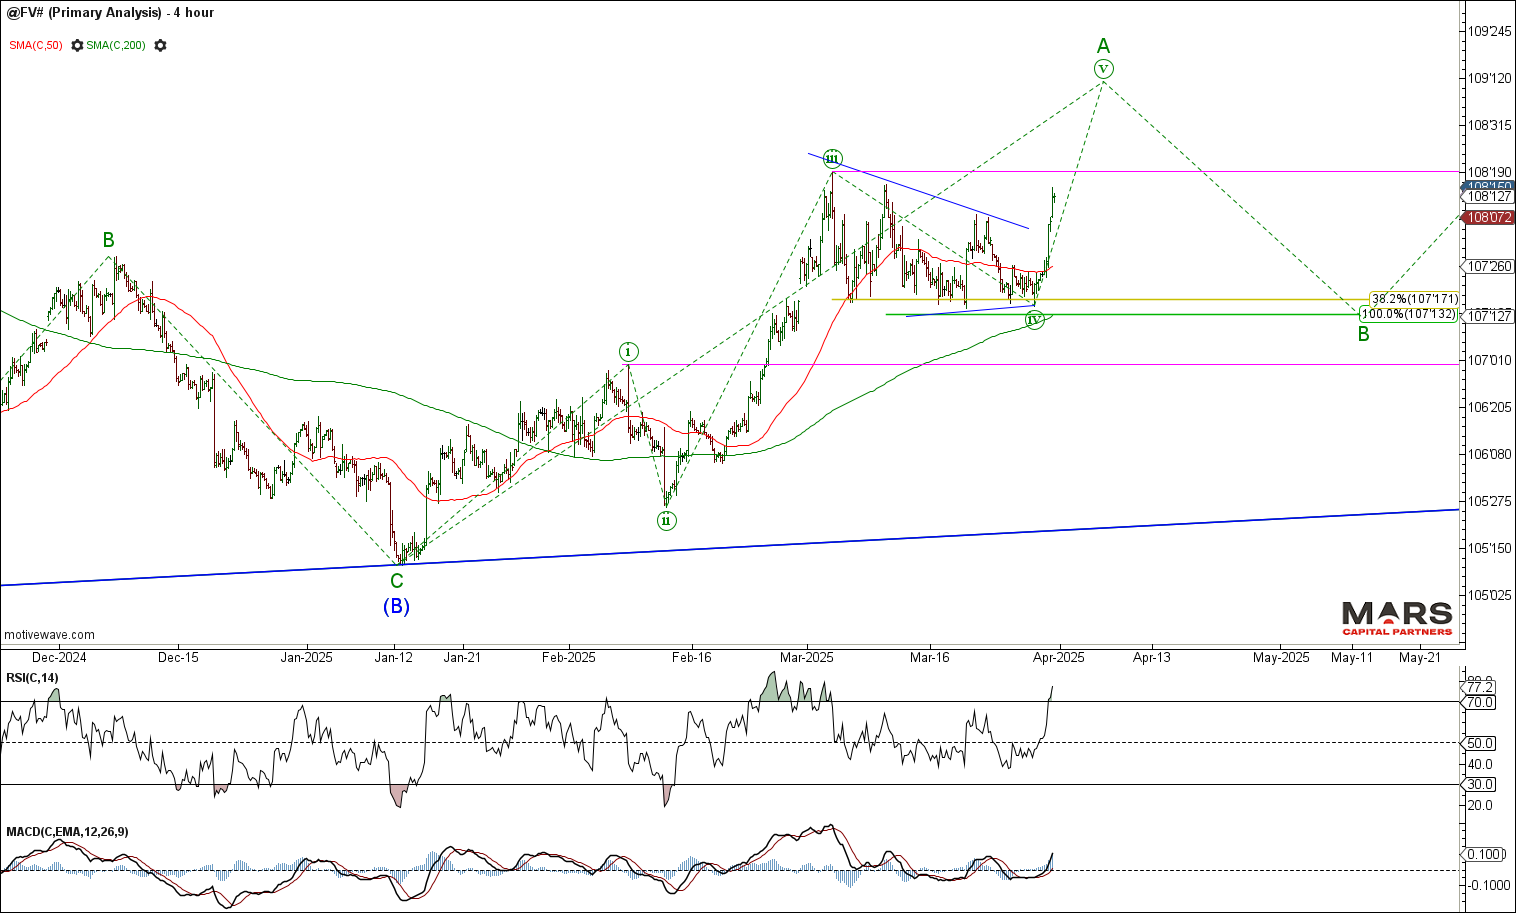
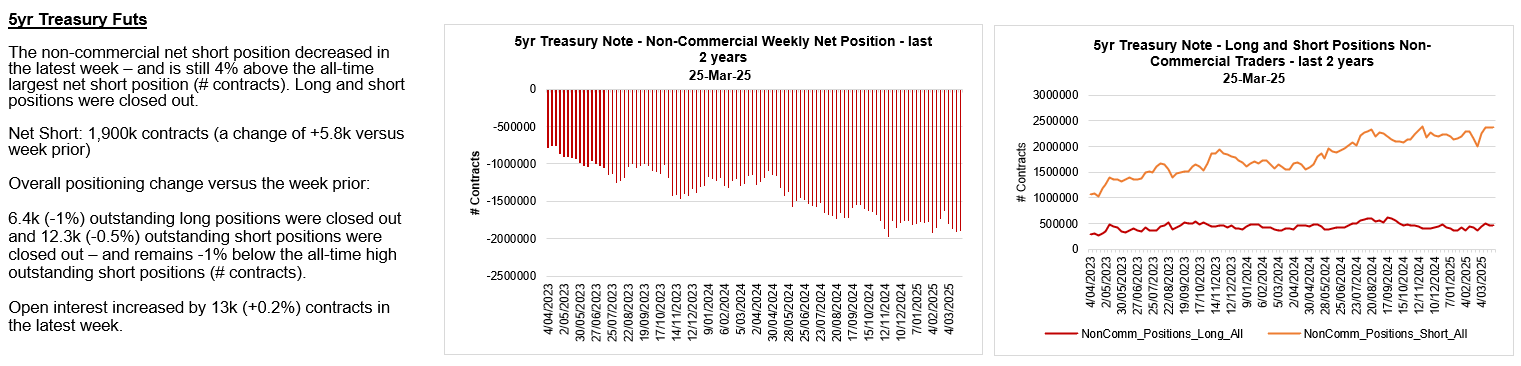
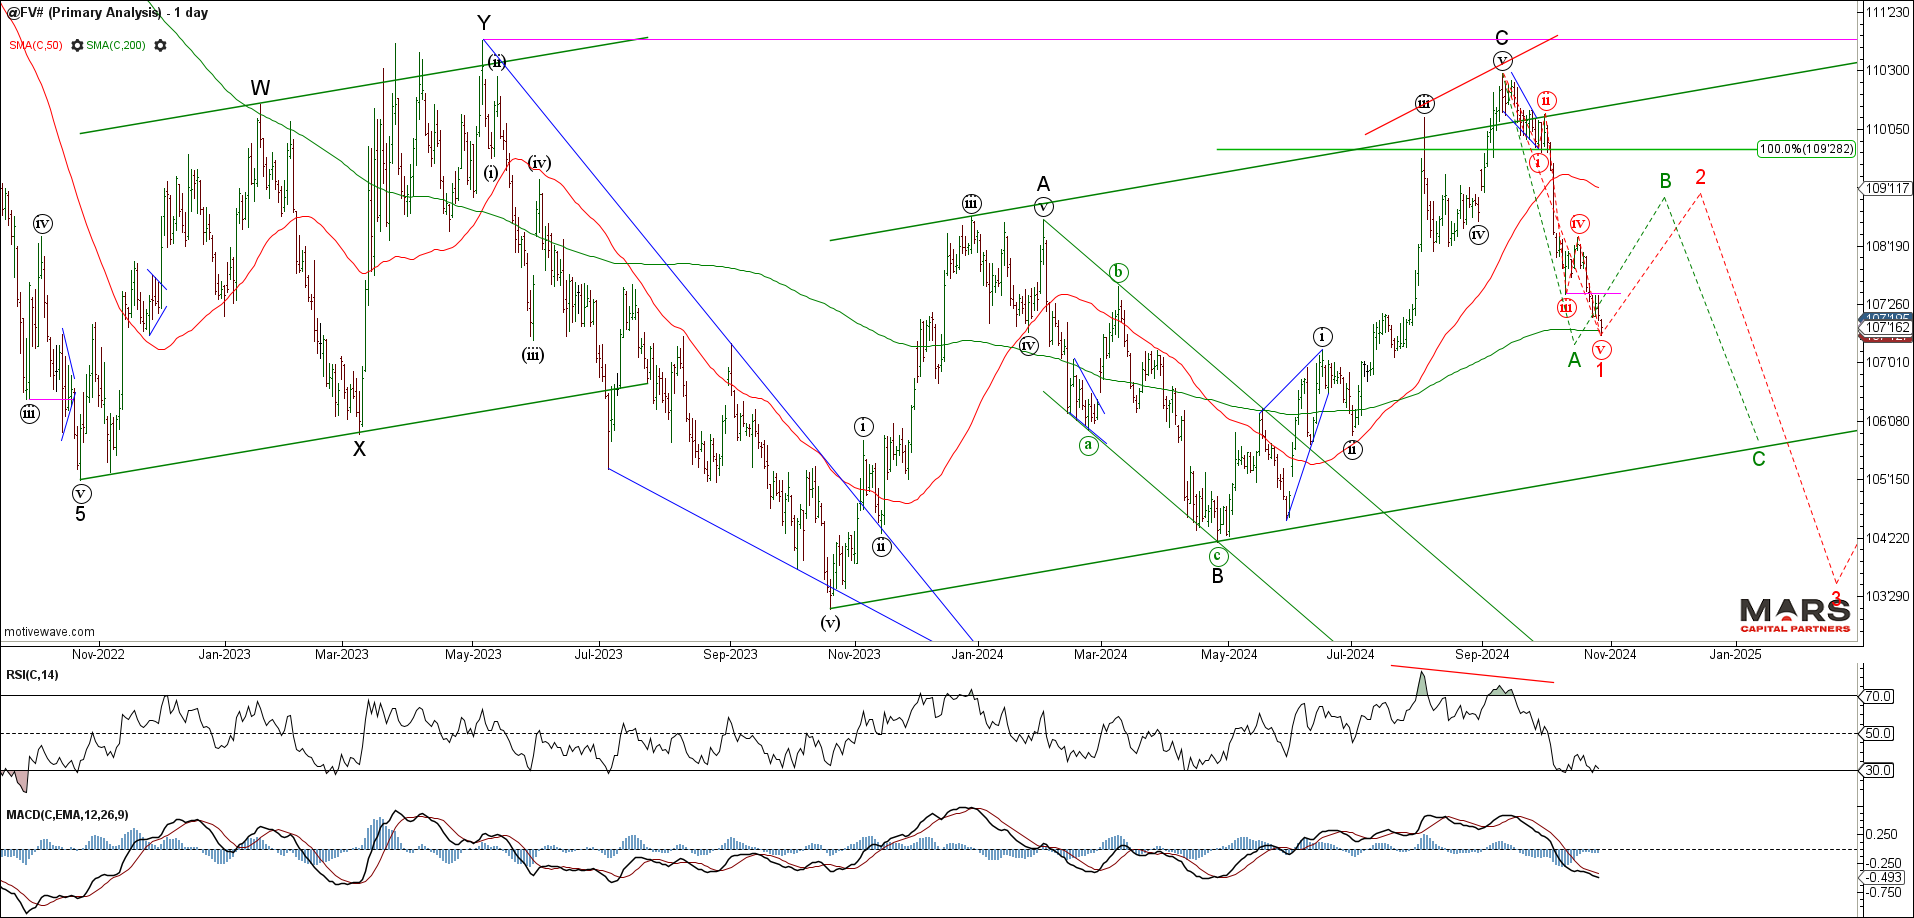
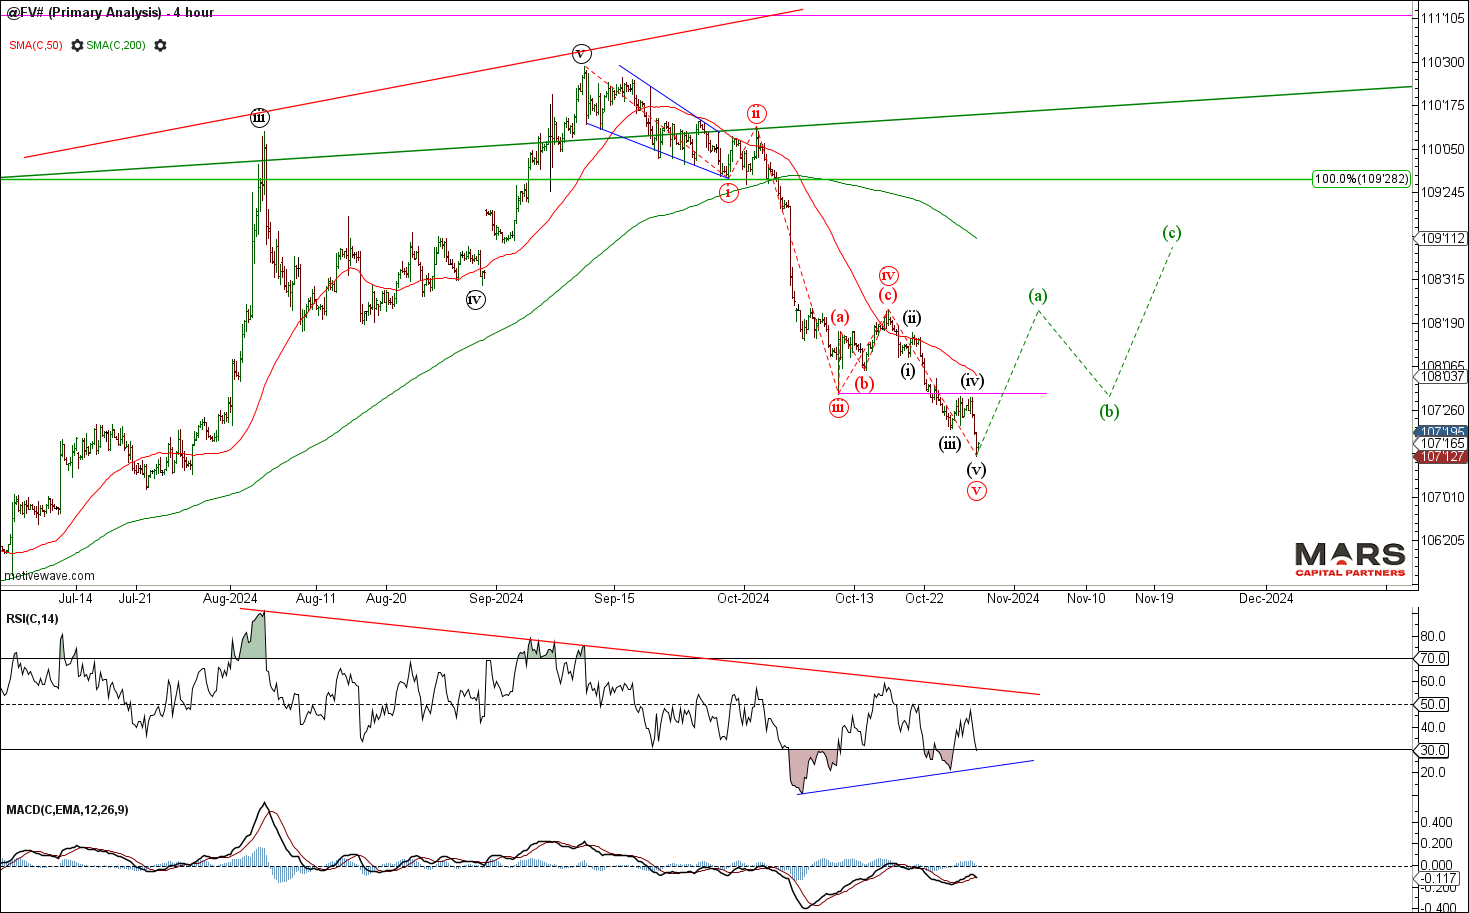
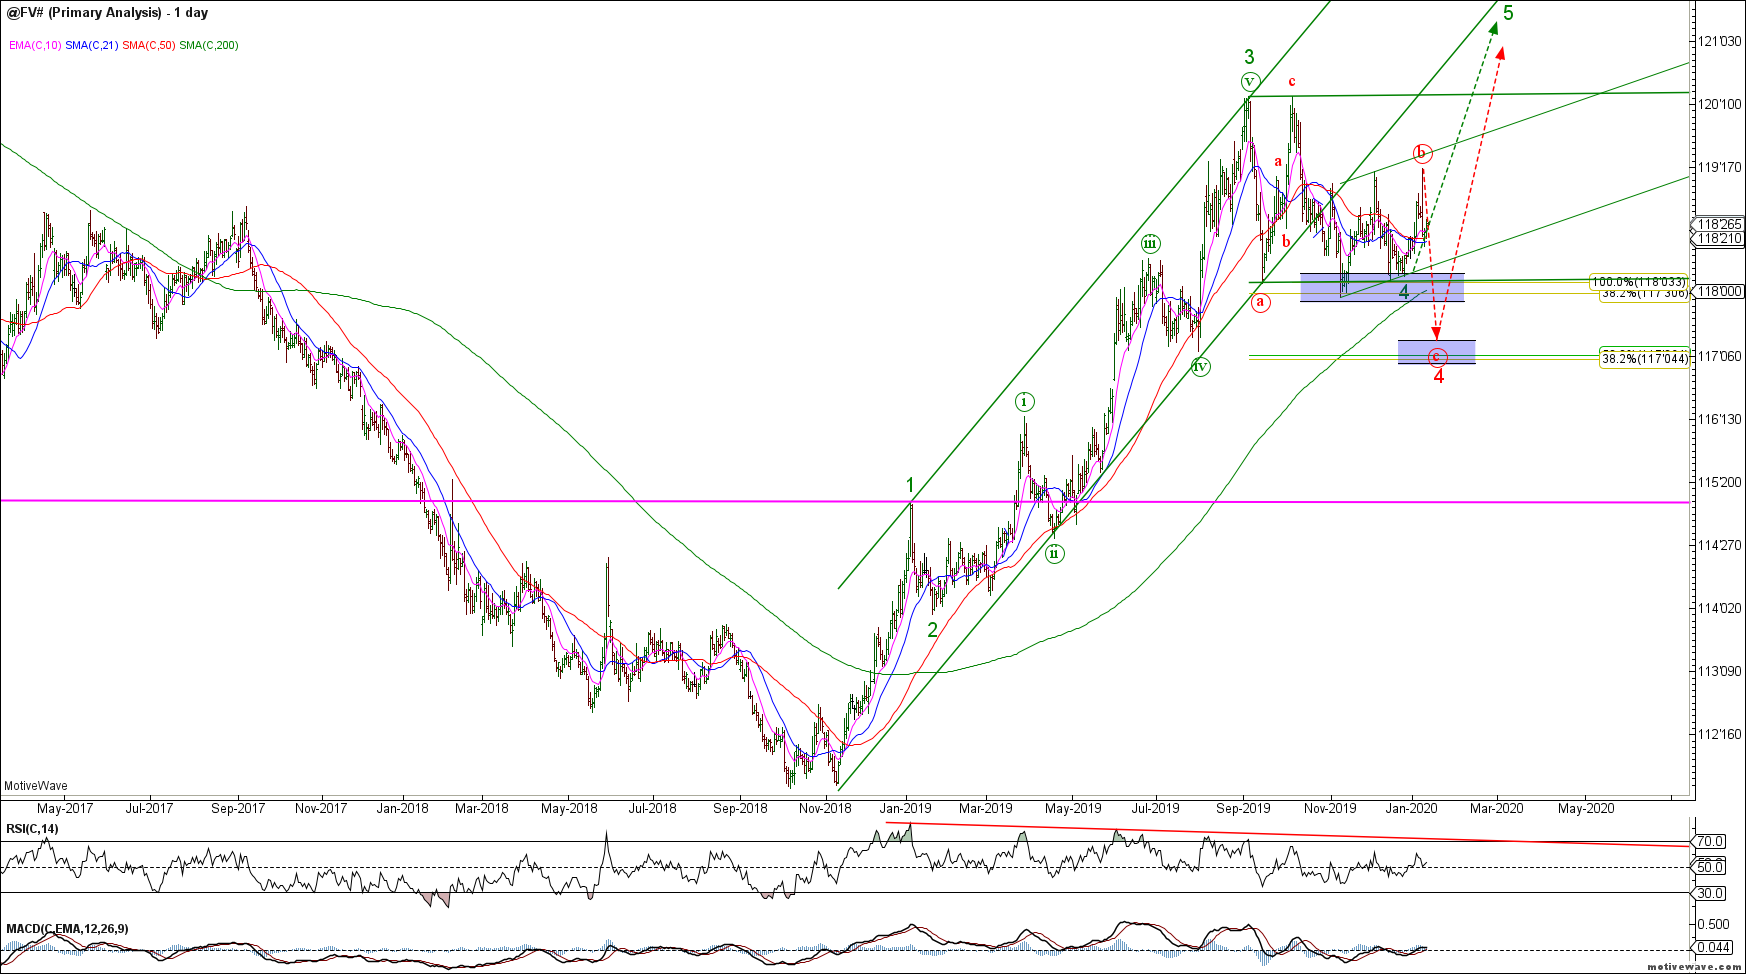
The US5yr / FV also held our near term support and rallied strongly late last week. Bulls need to clear overhead 118’20 resistance to help confirm 5 waves up from the lows and open the door to a bigger picture wave (C) rally. Bonds remain range bound from a big picture perspective with upside potential in the 112 area.
FV DailyFV H4
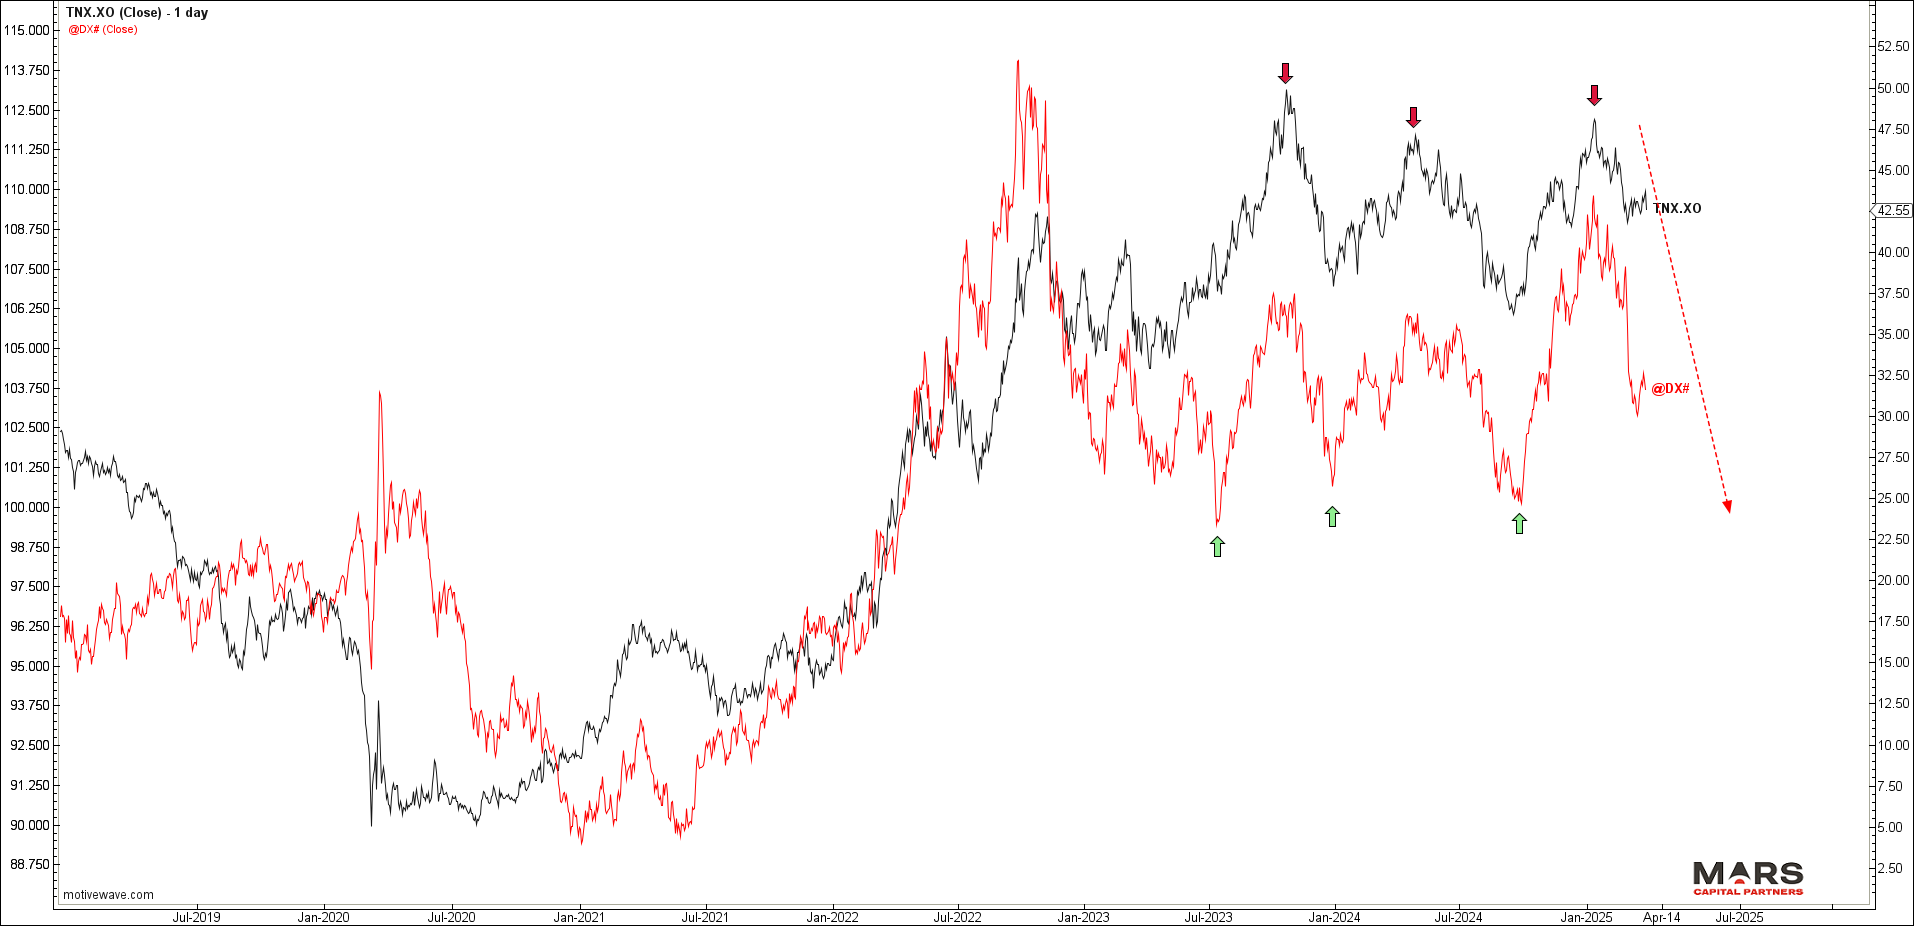
Both rates and the US$ would look better with downside extensions to keep the bear trends intact.
TNX / DXY Daily
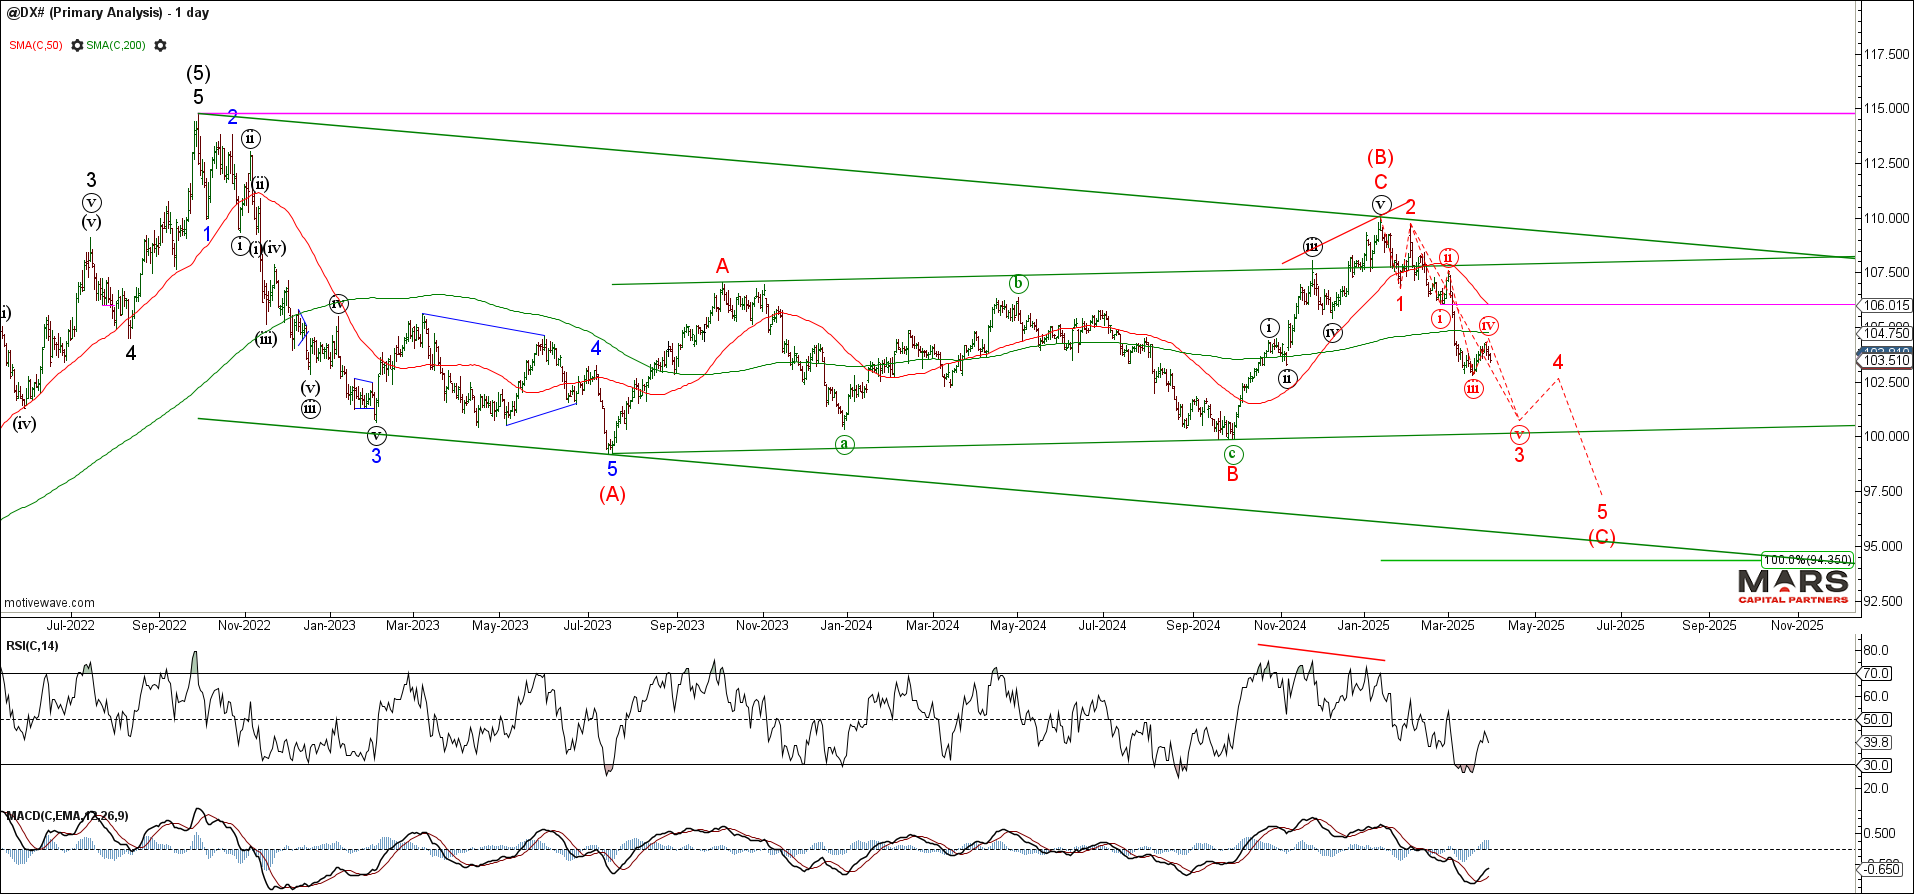
FX Markets – DXY turning lower?
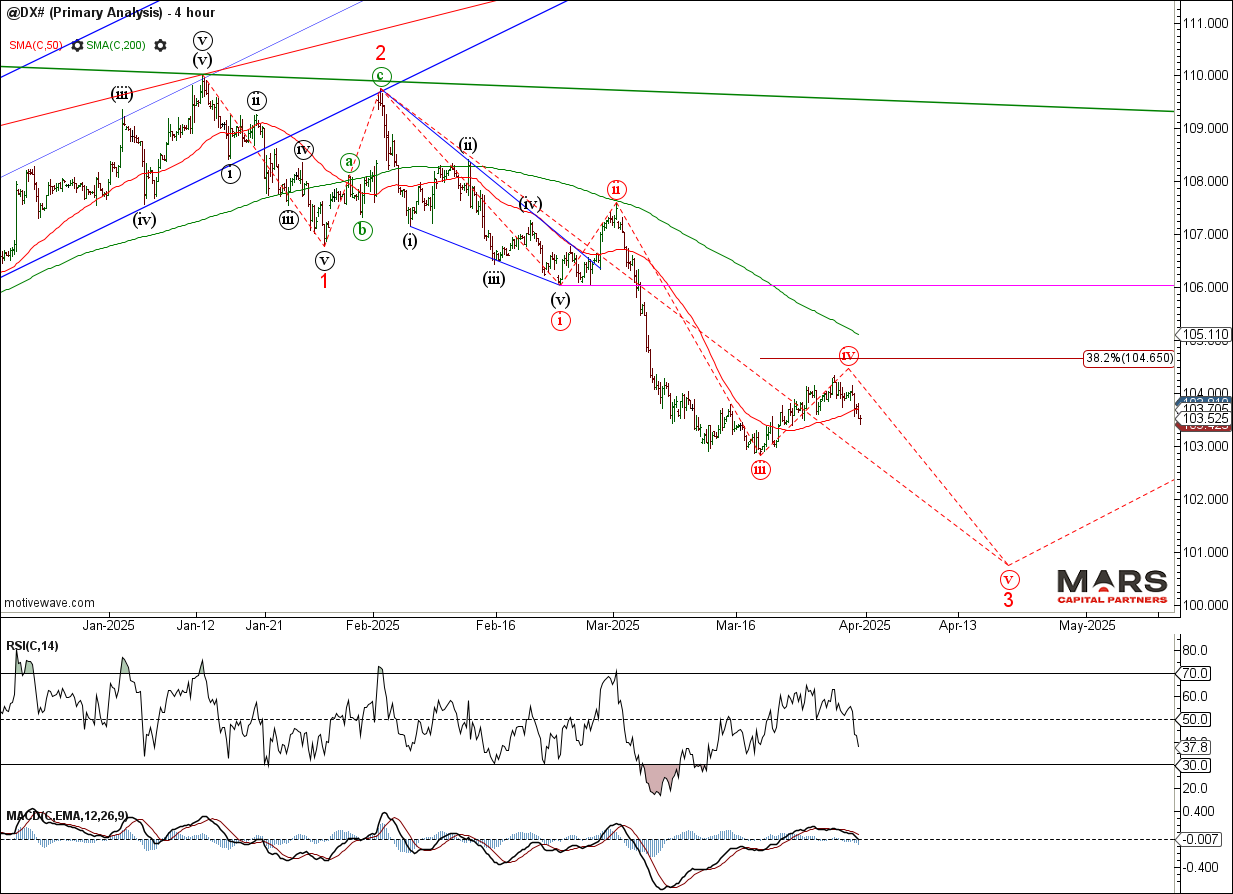
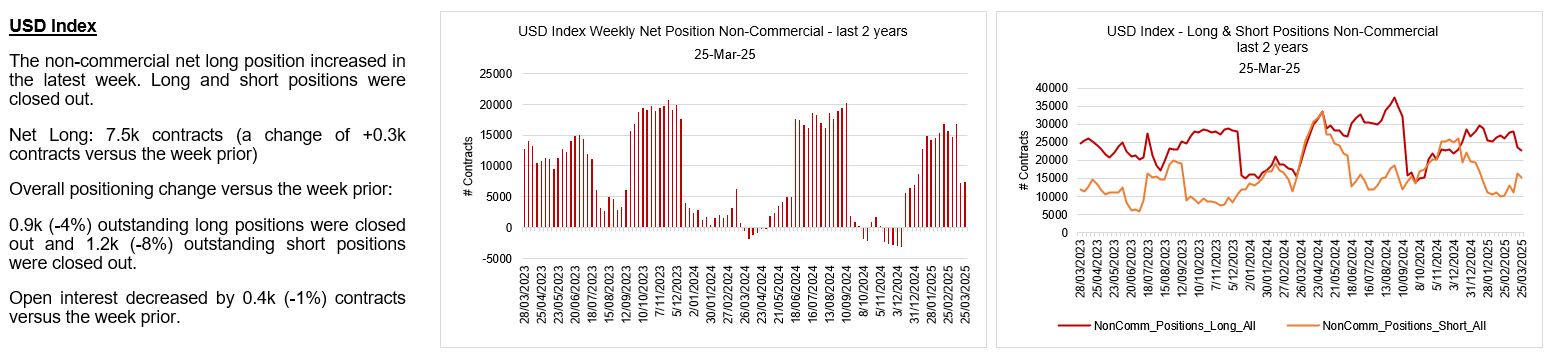
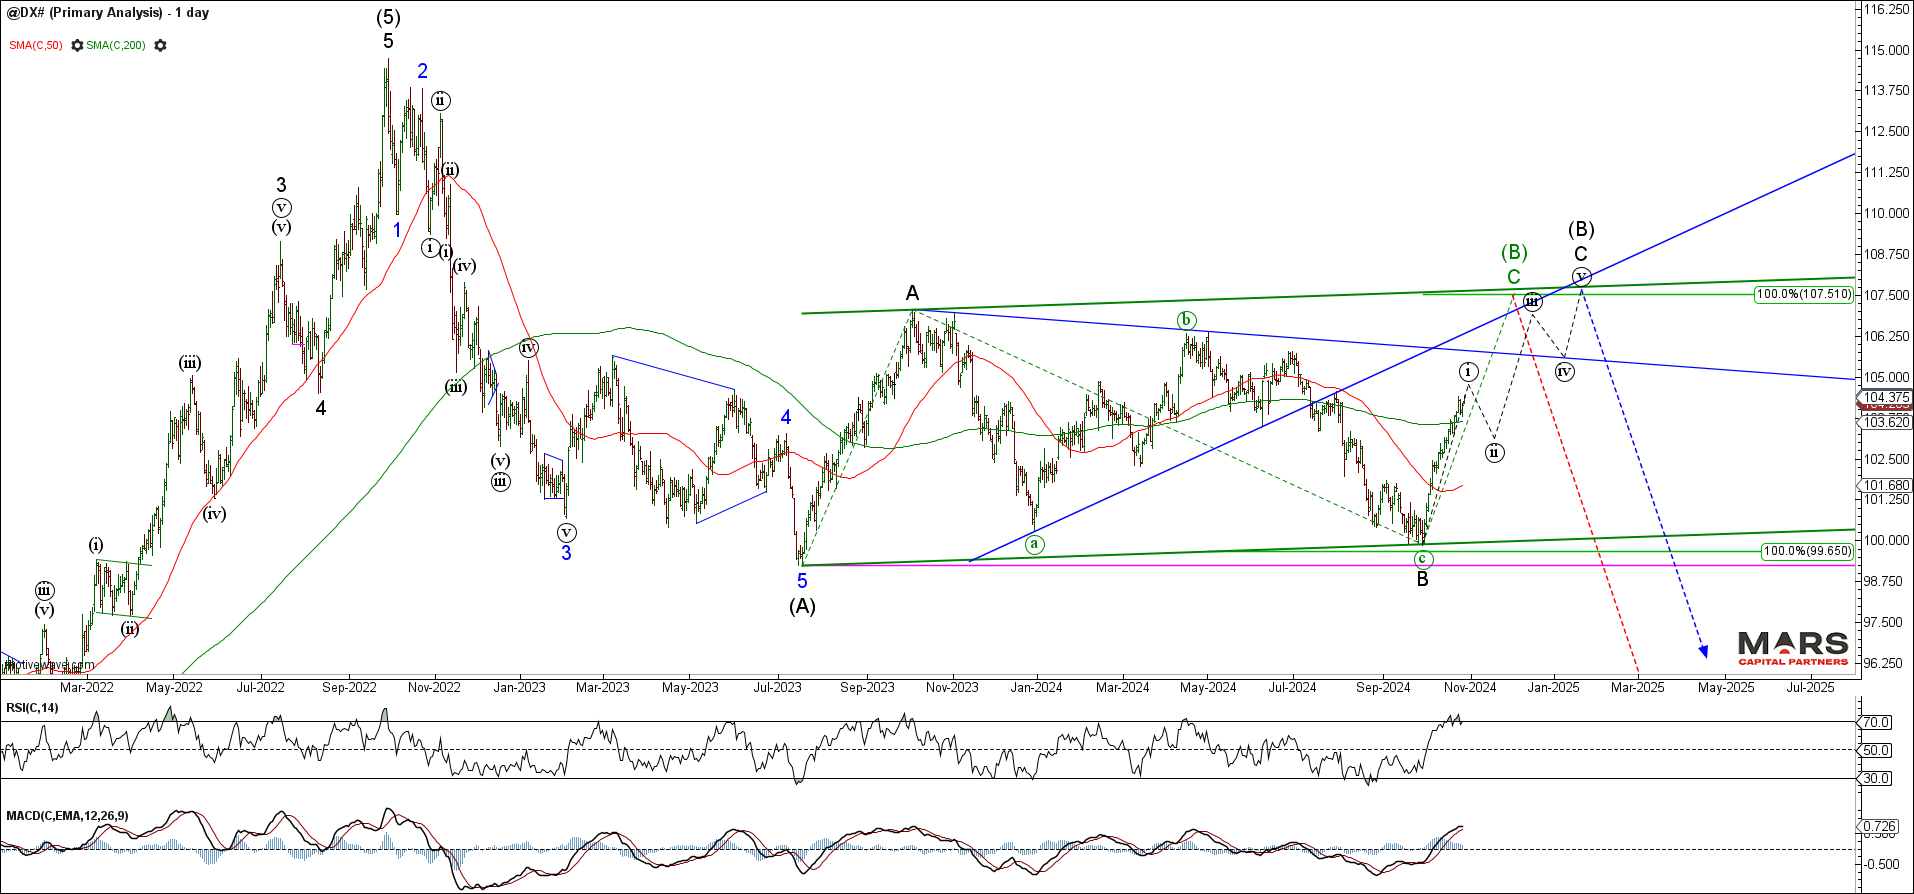
To the FX markets and the DXY is attempting to turn lower for what we expect to be part of a bearish wave (C) decline. The structure remains bearish while below the key 106 wave (i) overlap. Ideally, we’d like to see a downside continuation this week to help maintain the bear trend with bigger picture targets in the 95 area.
DXY DailyDXY H4
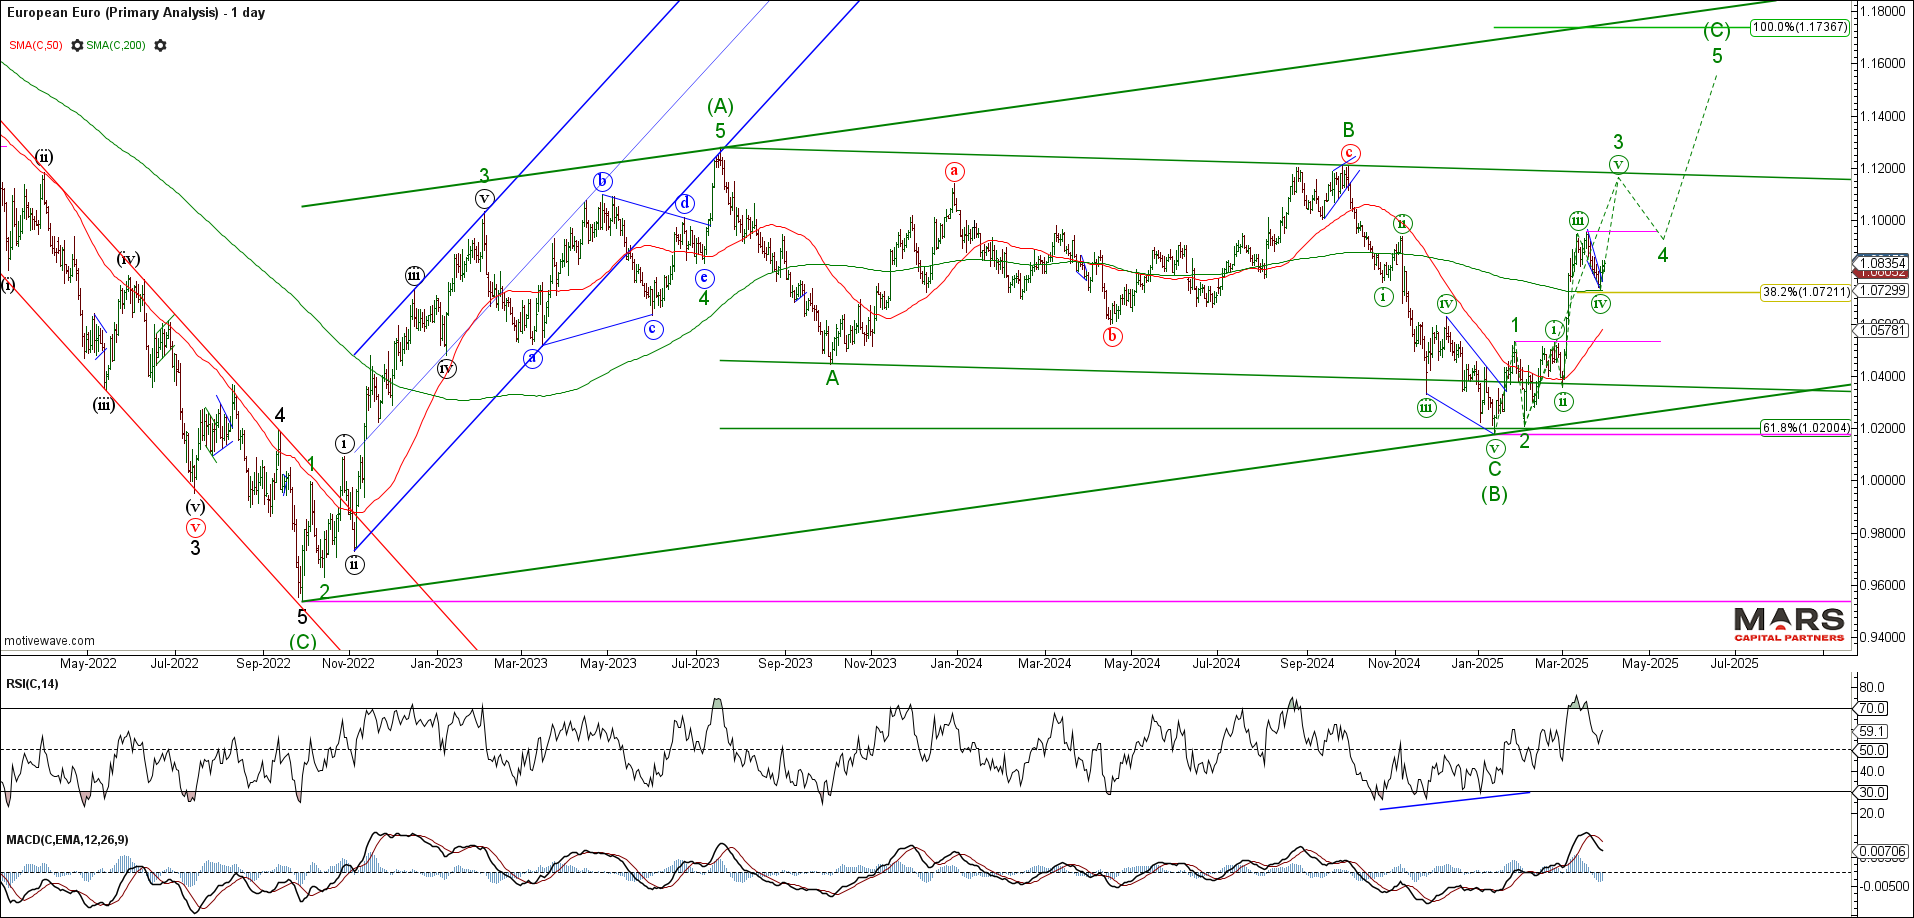
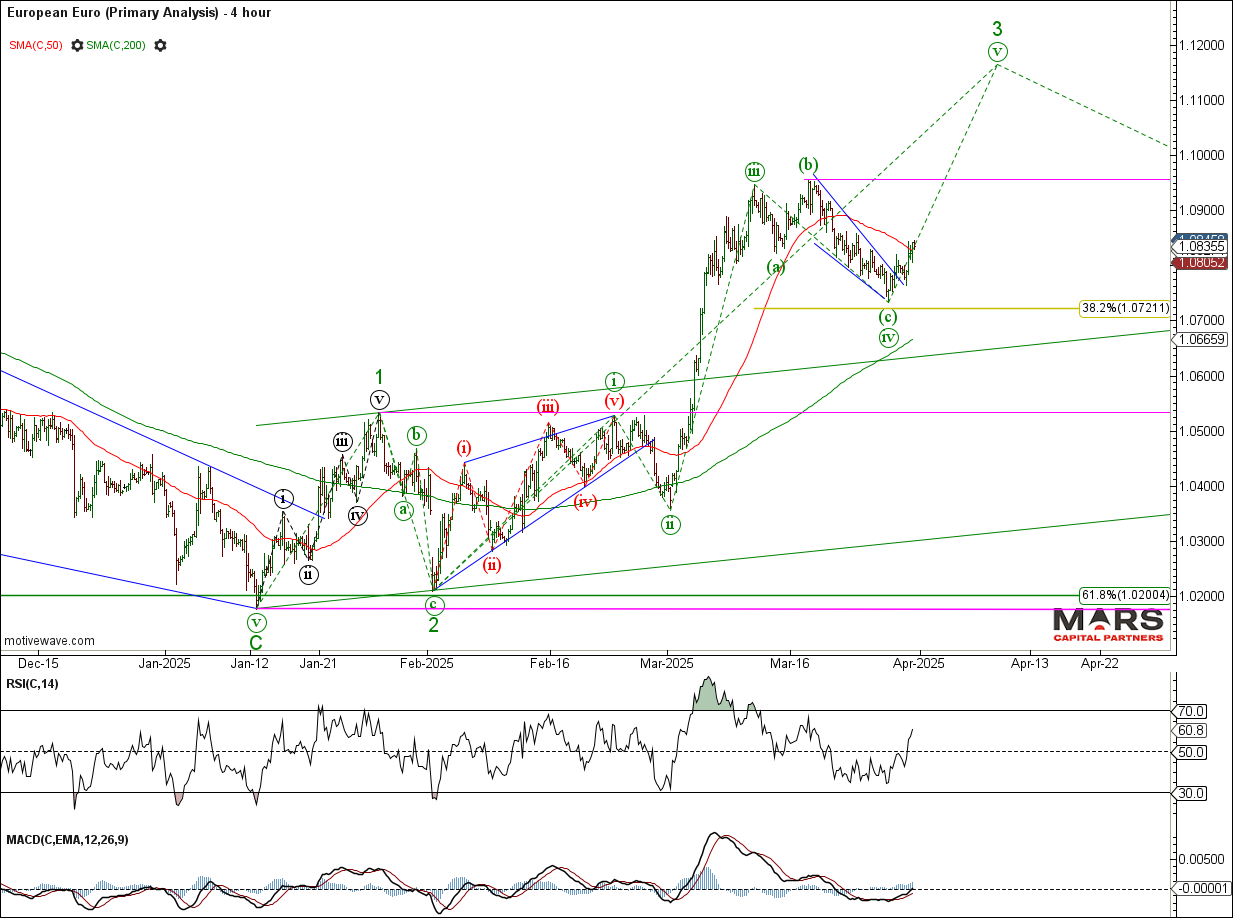
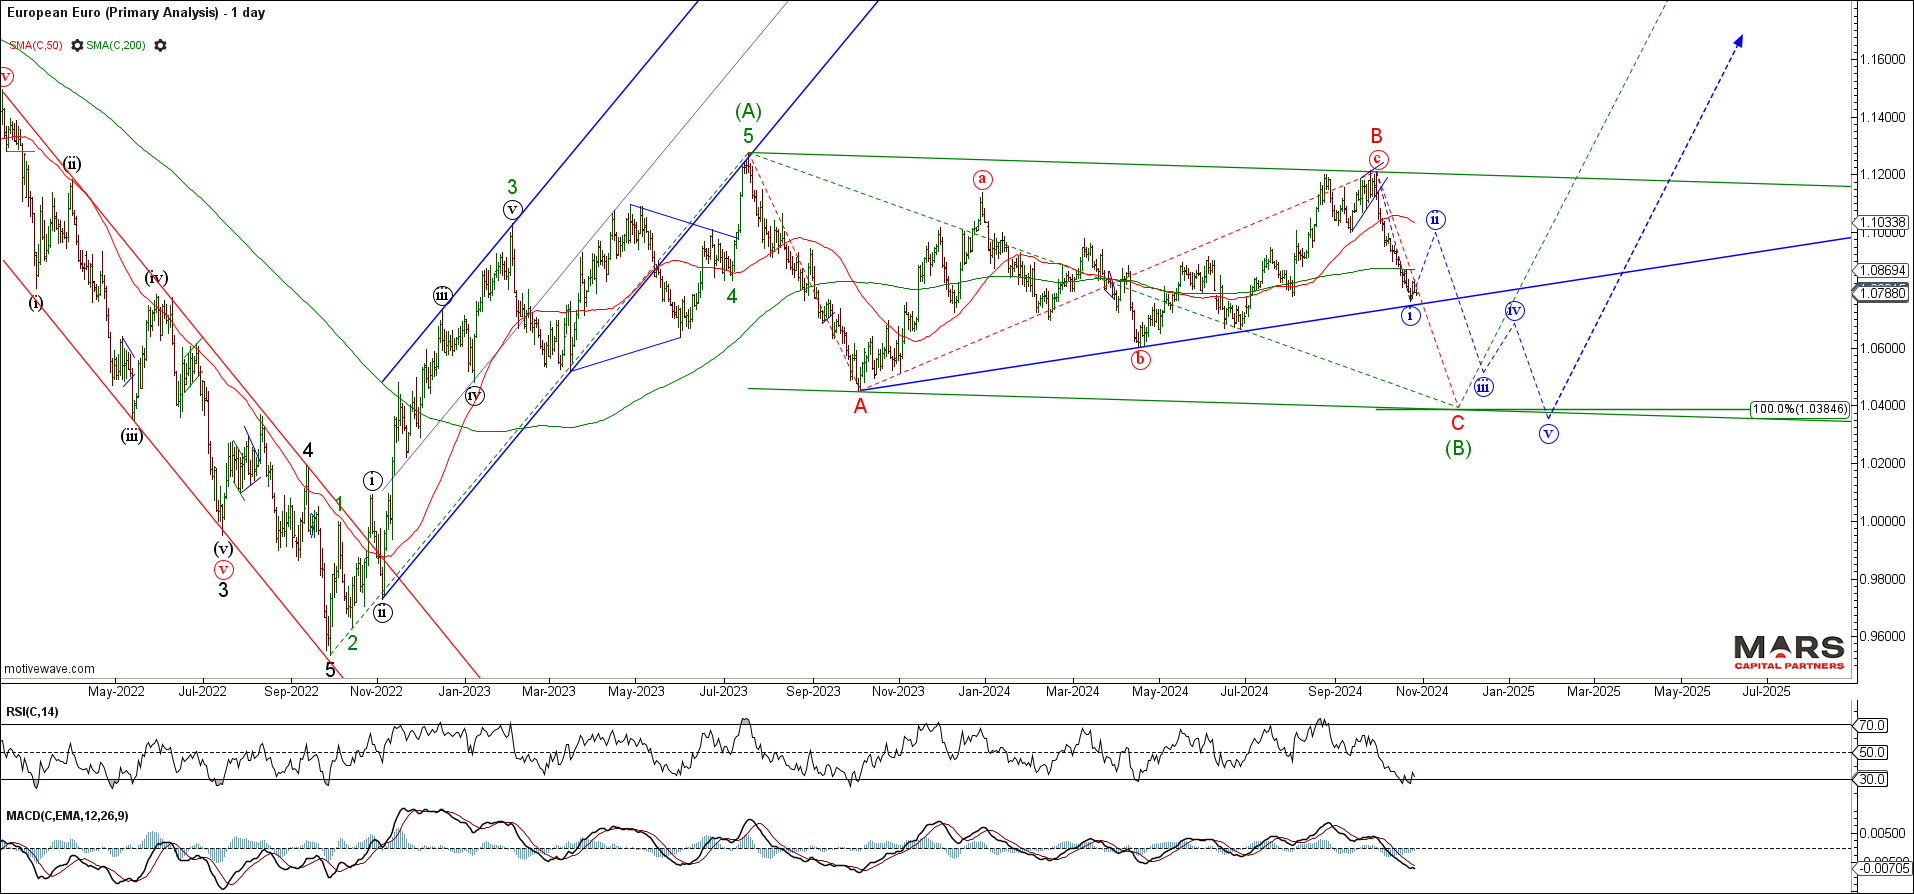
The Euro held near term support at the 200 day sma and is attempting to rally up off these lows. The near term rally is not yet clearly impulsive and needs to clear 1.0950 resistance to help confirm our bullish outlook. Bulls need to hold the line here. Trade back below the 1.0533 wave (i) overlap invalidates the bull case.
EURUSD DailyEURUSD H4
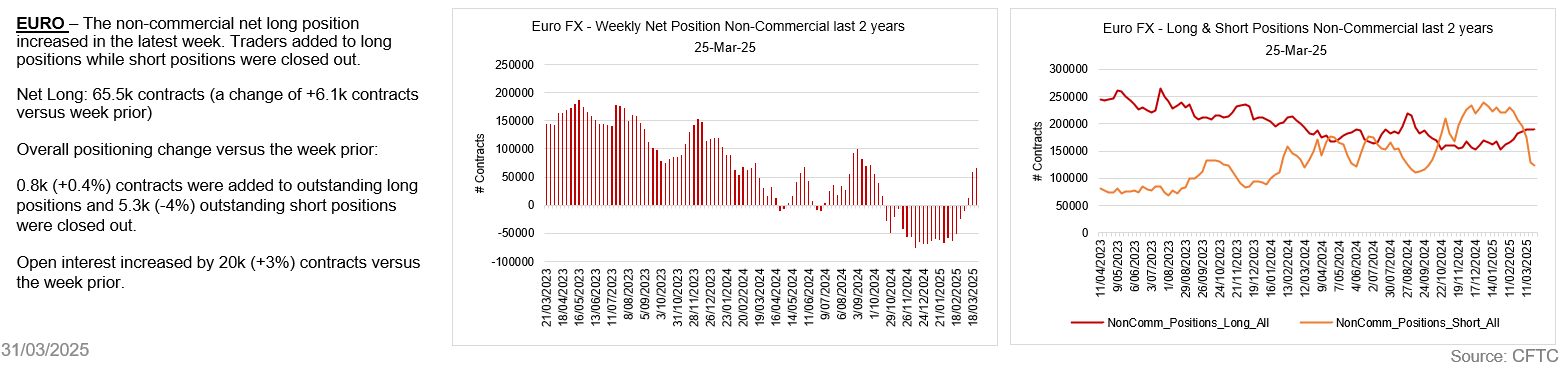
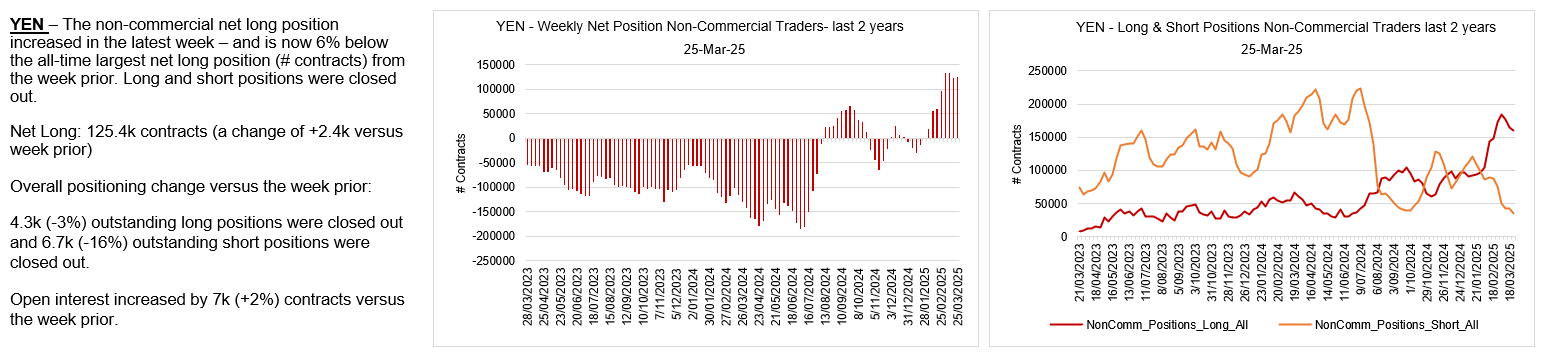
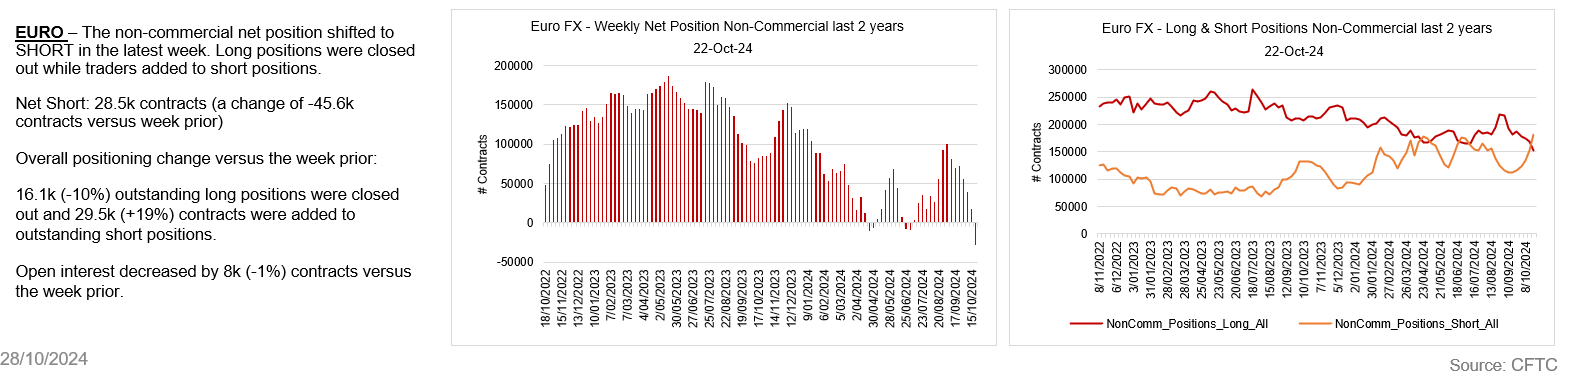
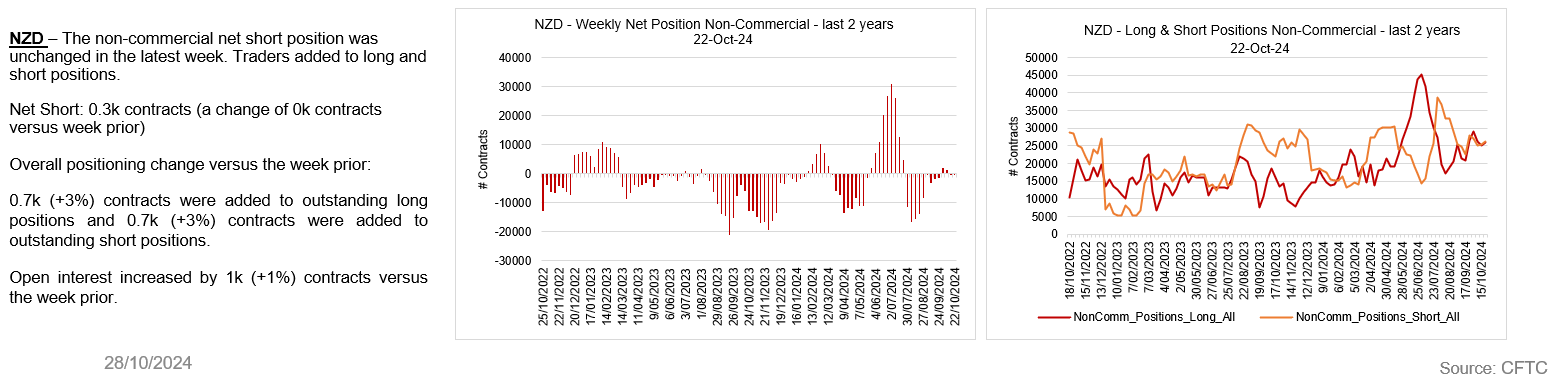
Euro traders have flipped net long.
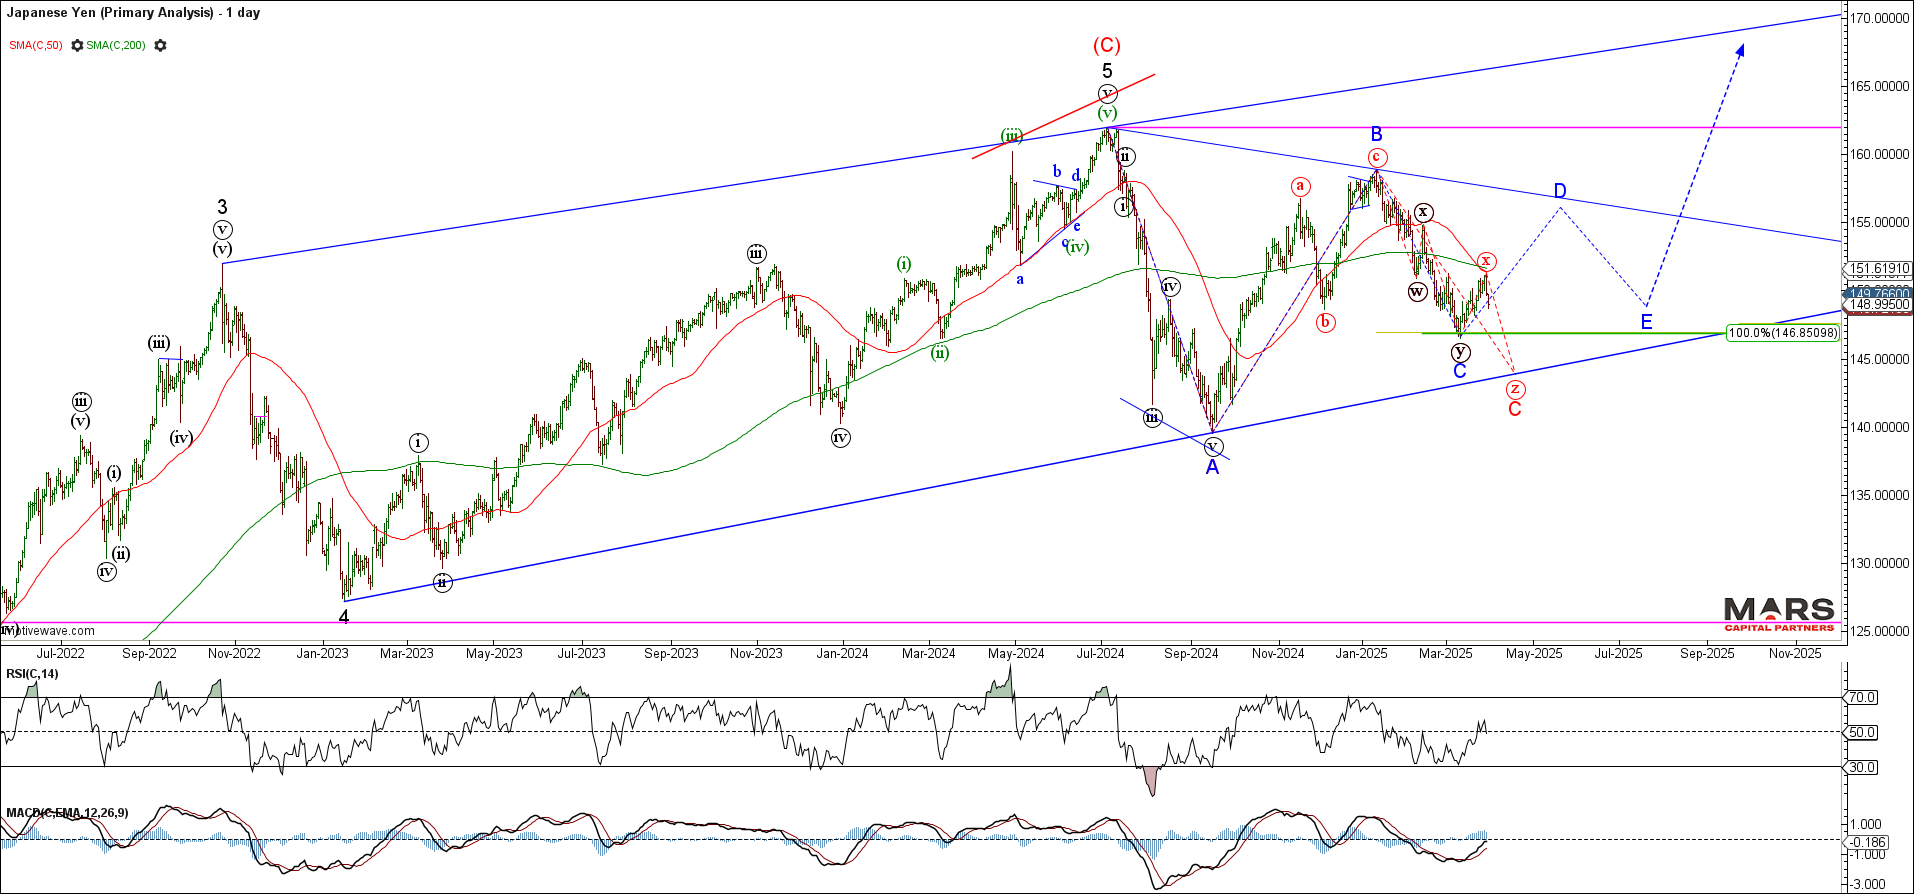
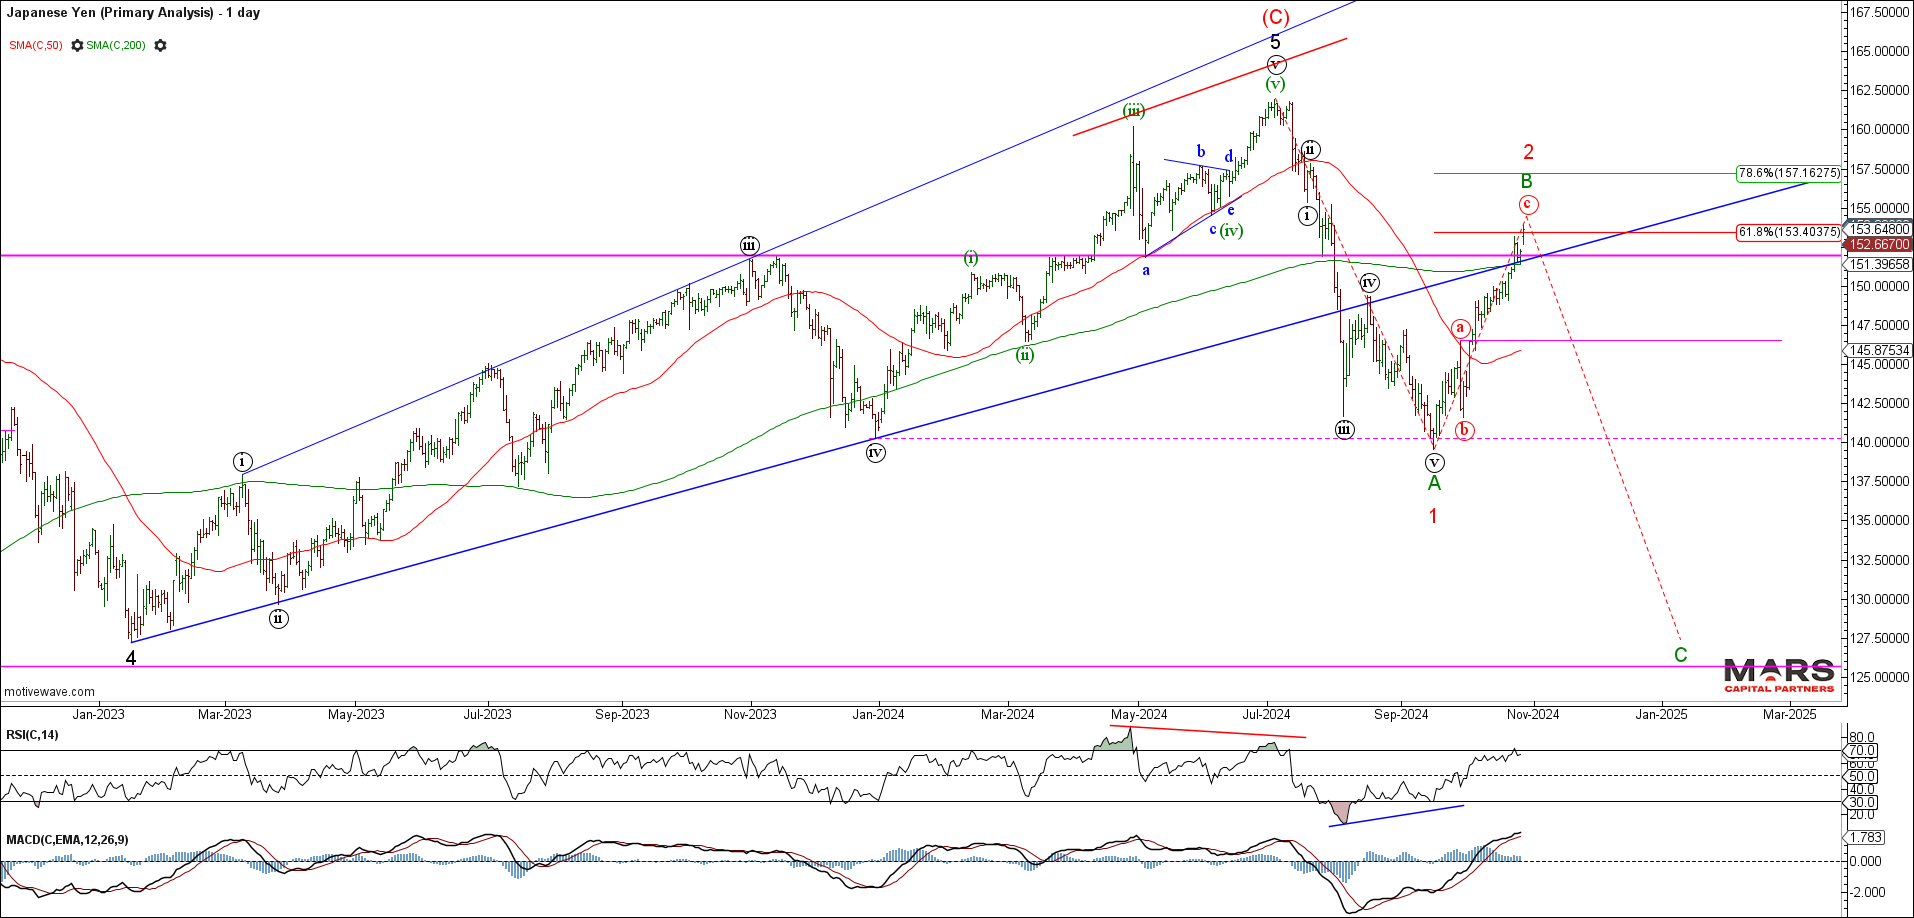
The USDJPY reversed sharply lower from the 50 / 200 day sma resistance but the decline appears corrective. While the potential remains for an extension lower towards trend support in the 144-145 area, there is no clear directional trend. Best to avoid until we see a clearly impulsive trend develop – range racing with no edge.
USDJPY Daily
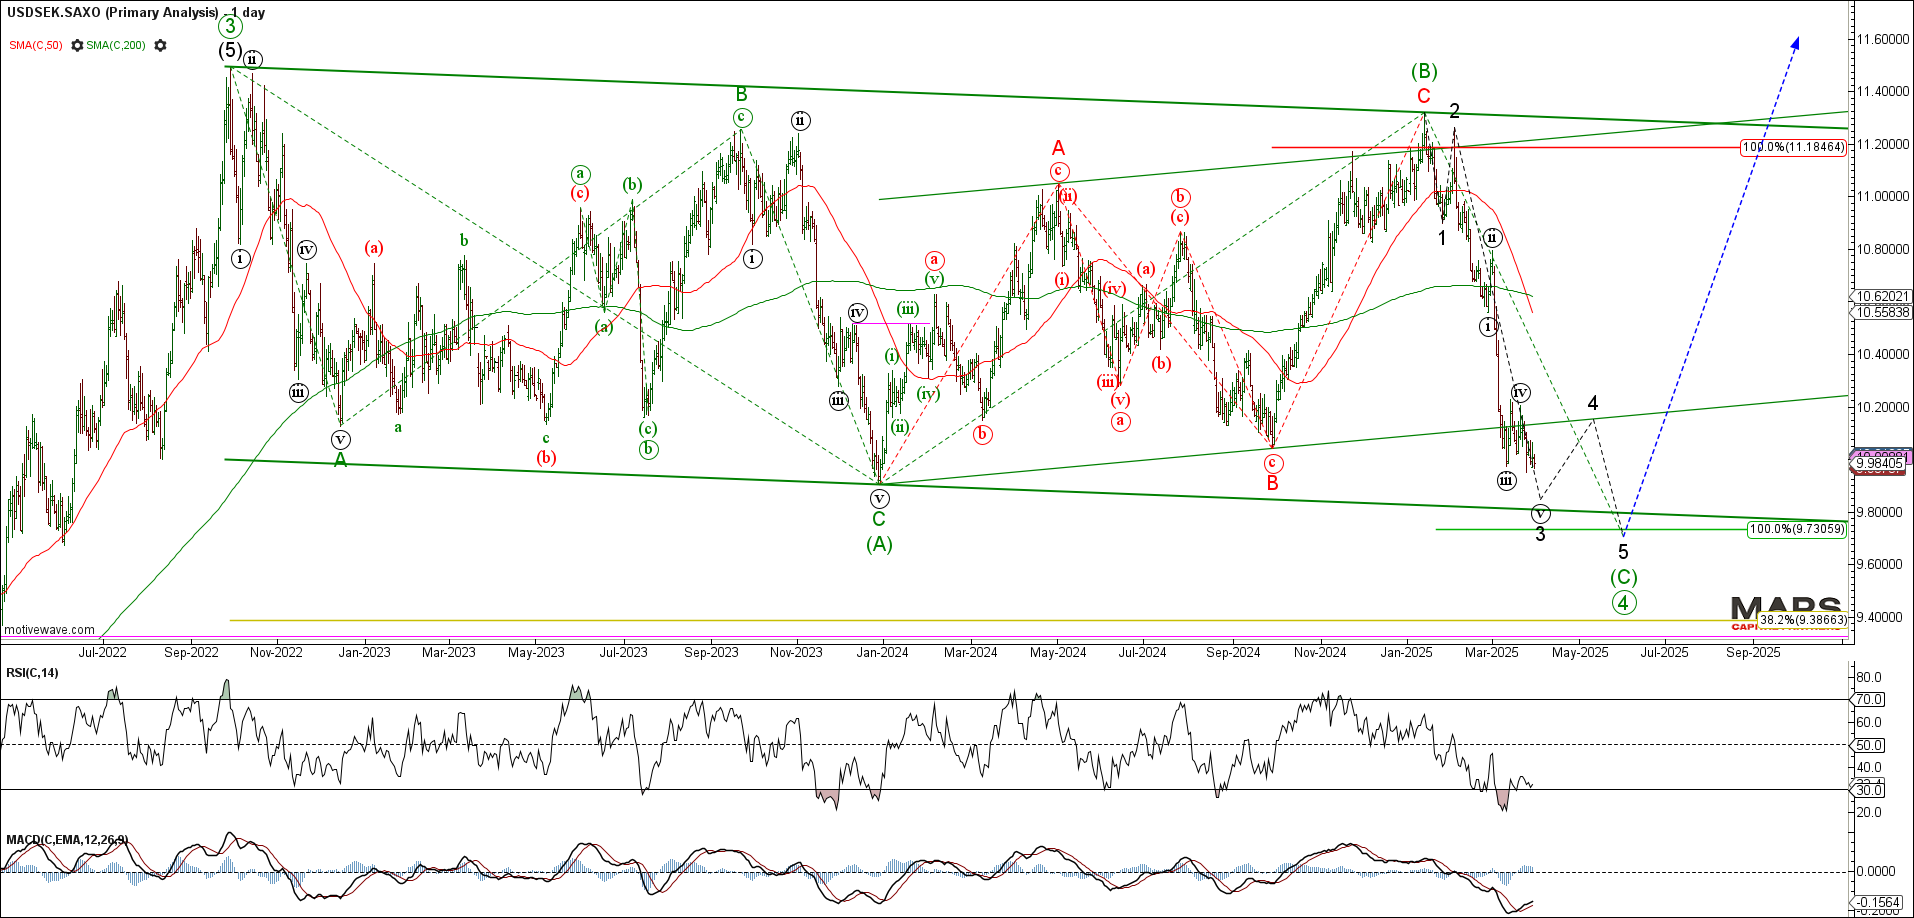
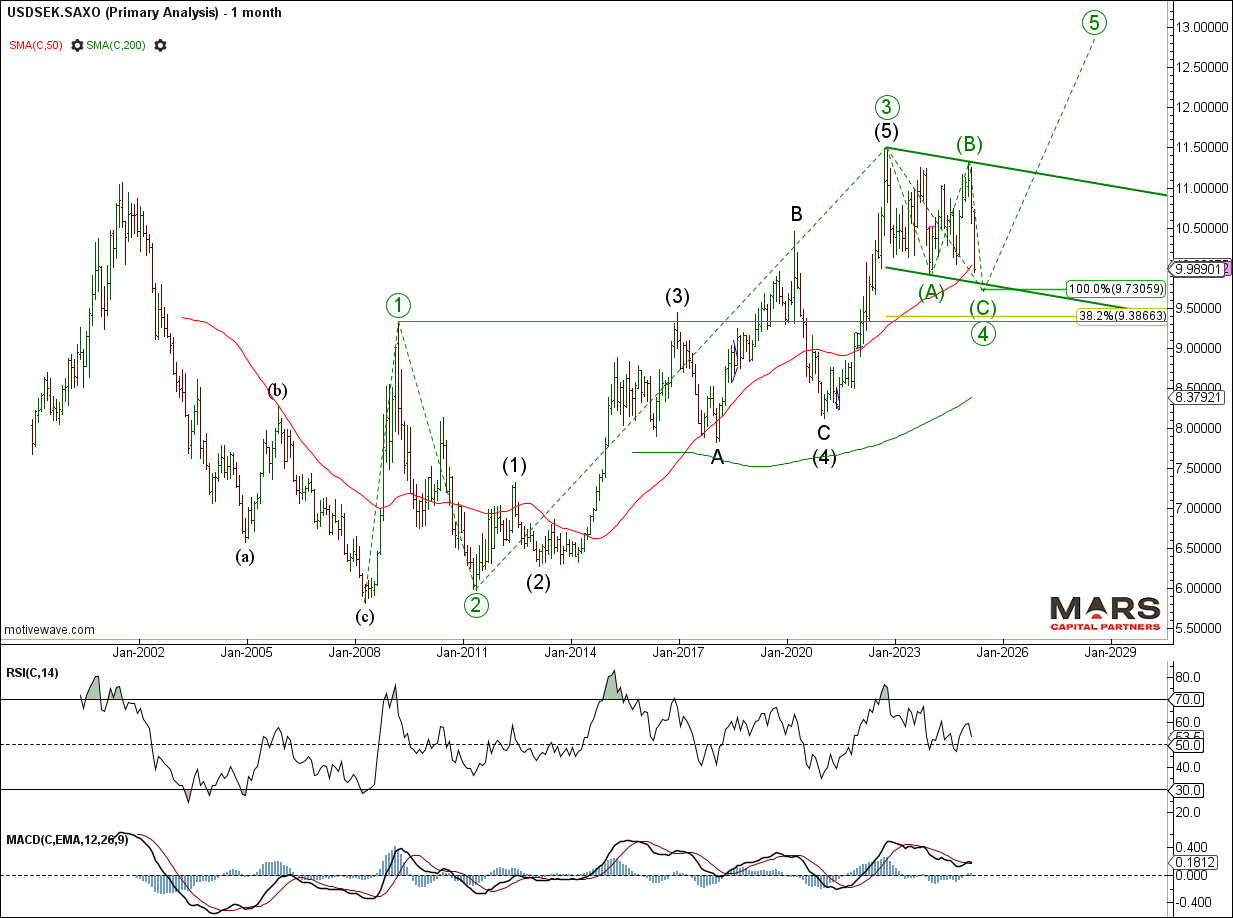
The USDSEK is fast approaching big picture support in the 9.73 area. The decline from the 2022 highs appears to be a 3-3-5 “Flat” correction within a larger bull trend. Ideally, we’d like to see a 5 wave decline that terminates in the 9.73 area before evidence of a bullish reversal. Given the bearish outlook for the US$ across the board, it’s best to await evidence of a bullish reversal before considering longs. Critical overlap support remains lower towards the 9.32 area.
USDSEK DailyUSDSEK Monthly
Commodity Markets – Gold new ATH’s
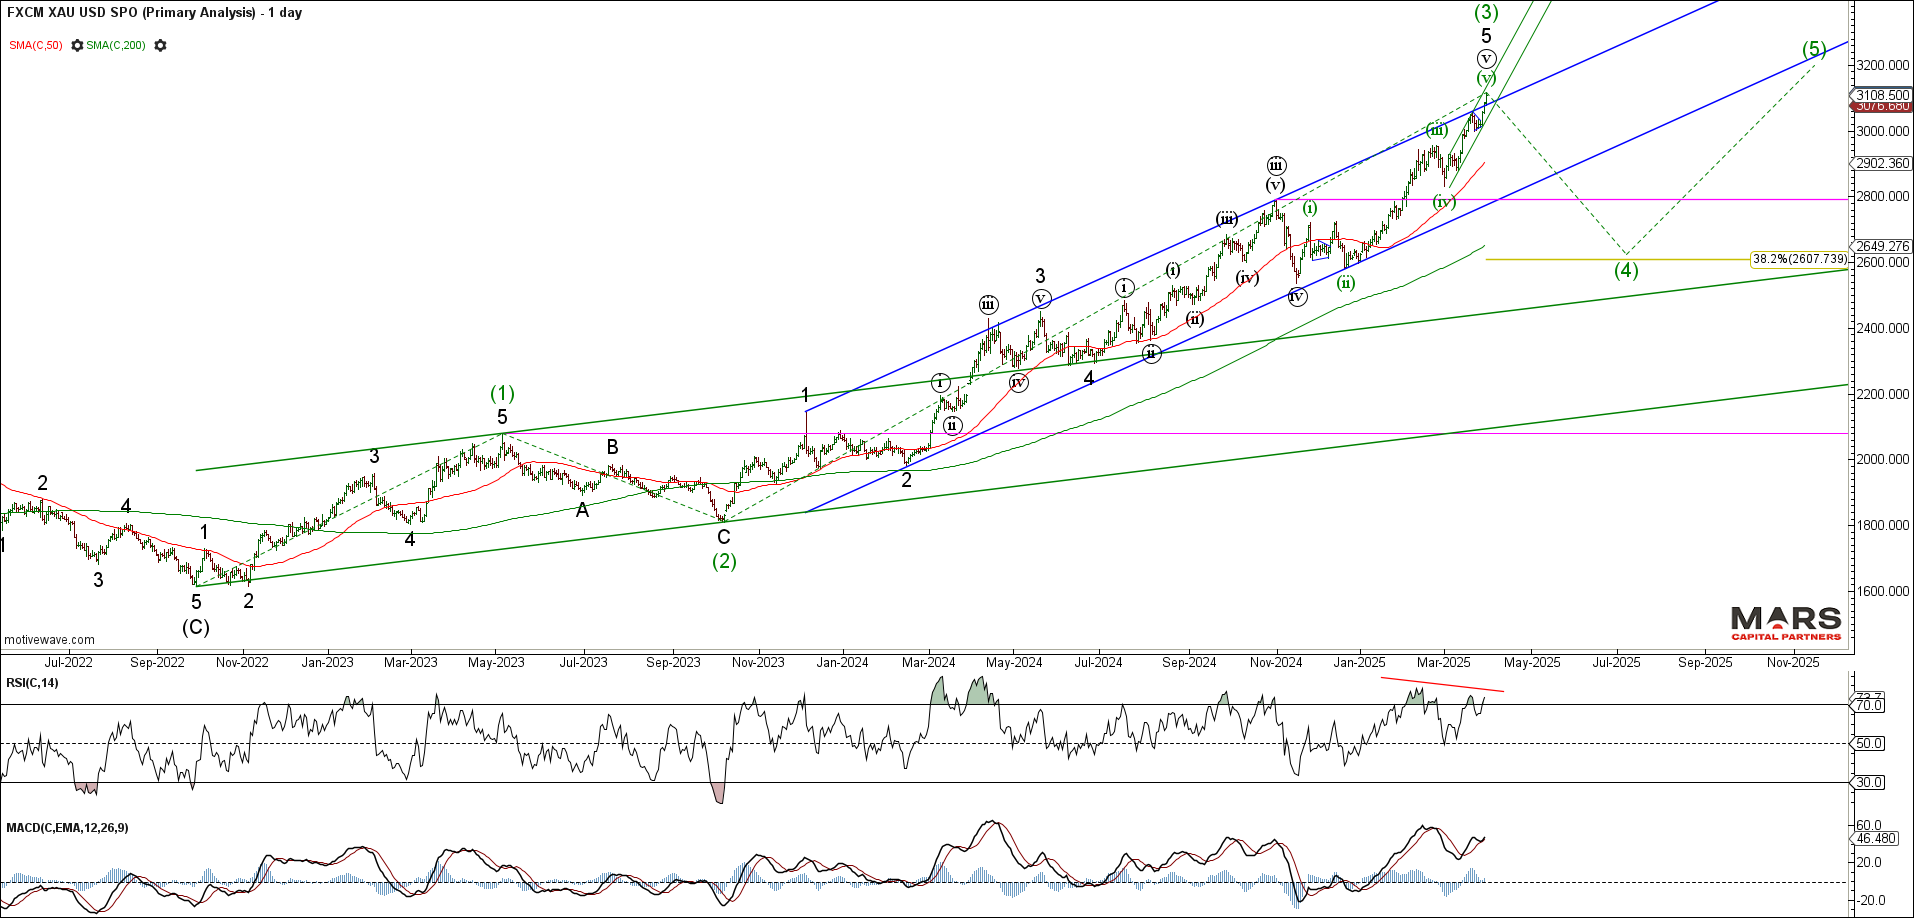
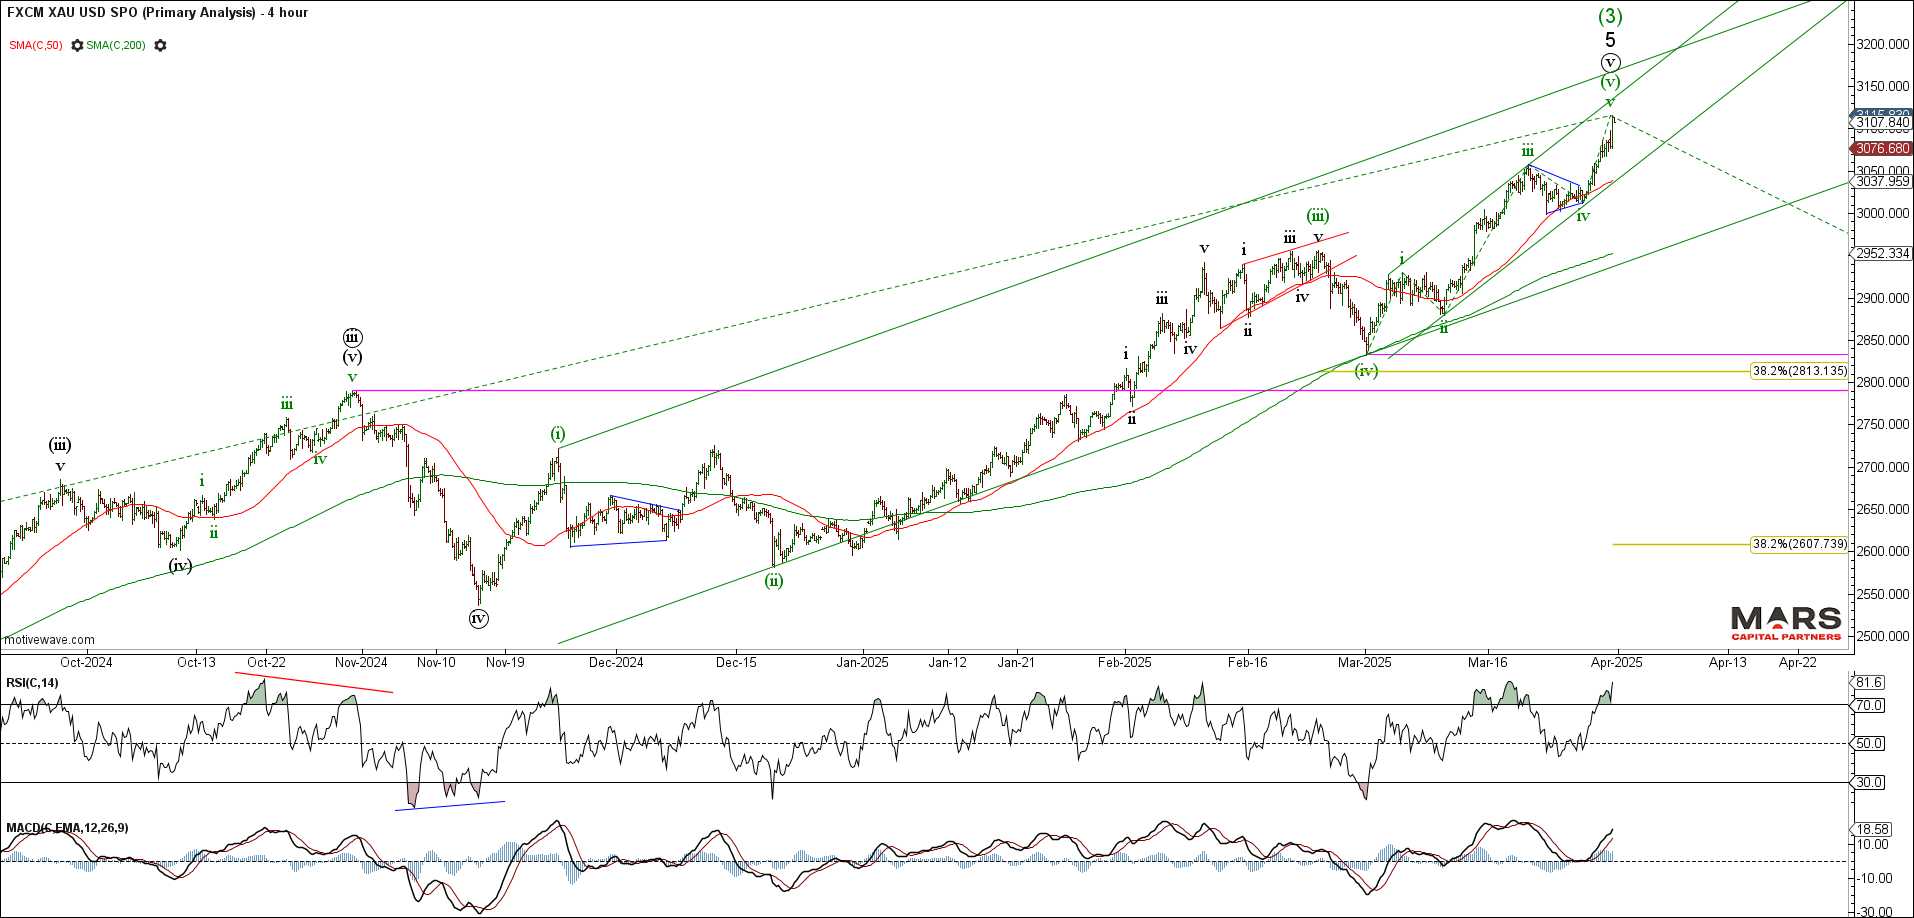
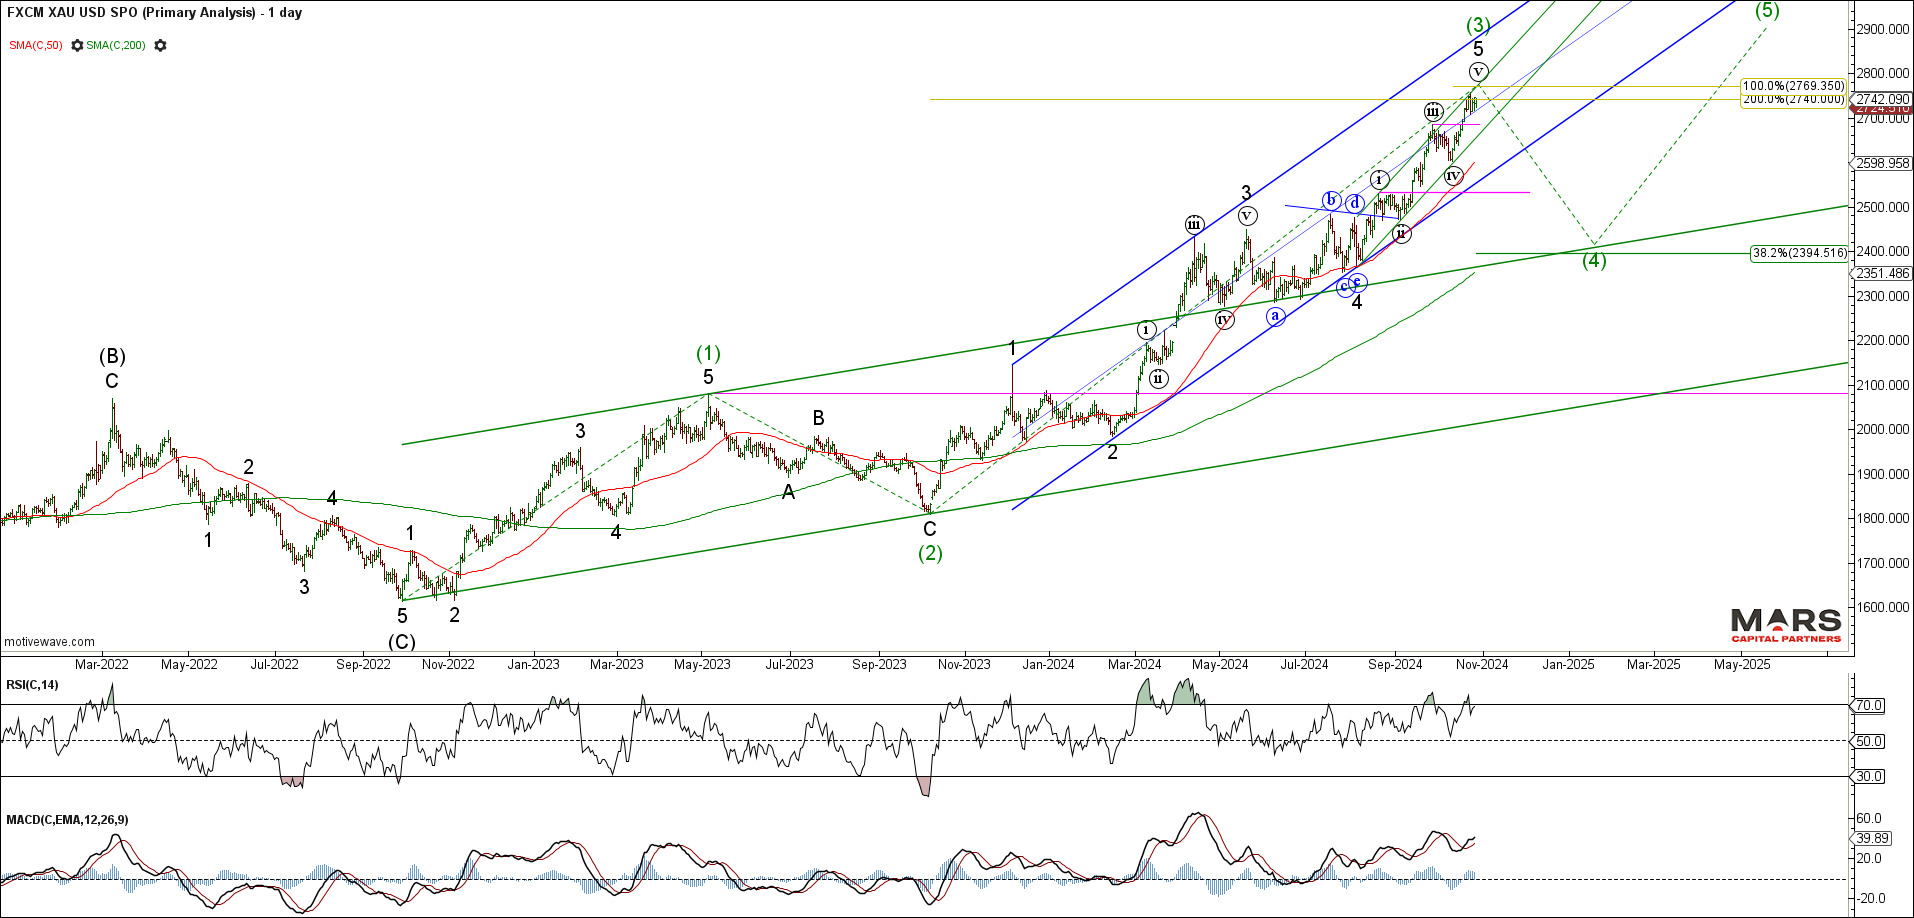
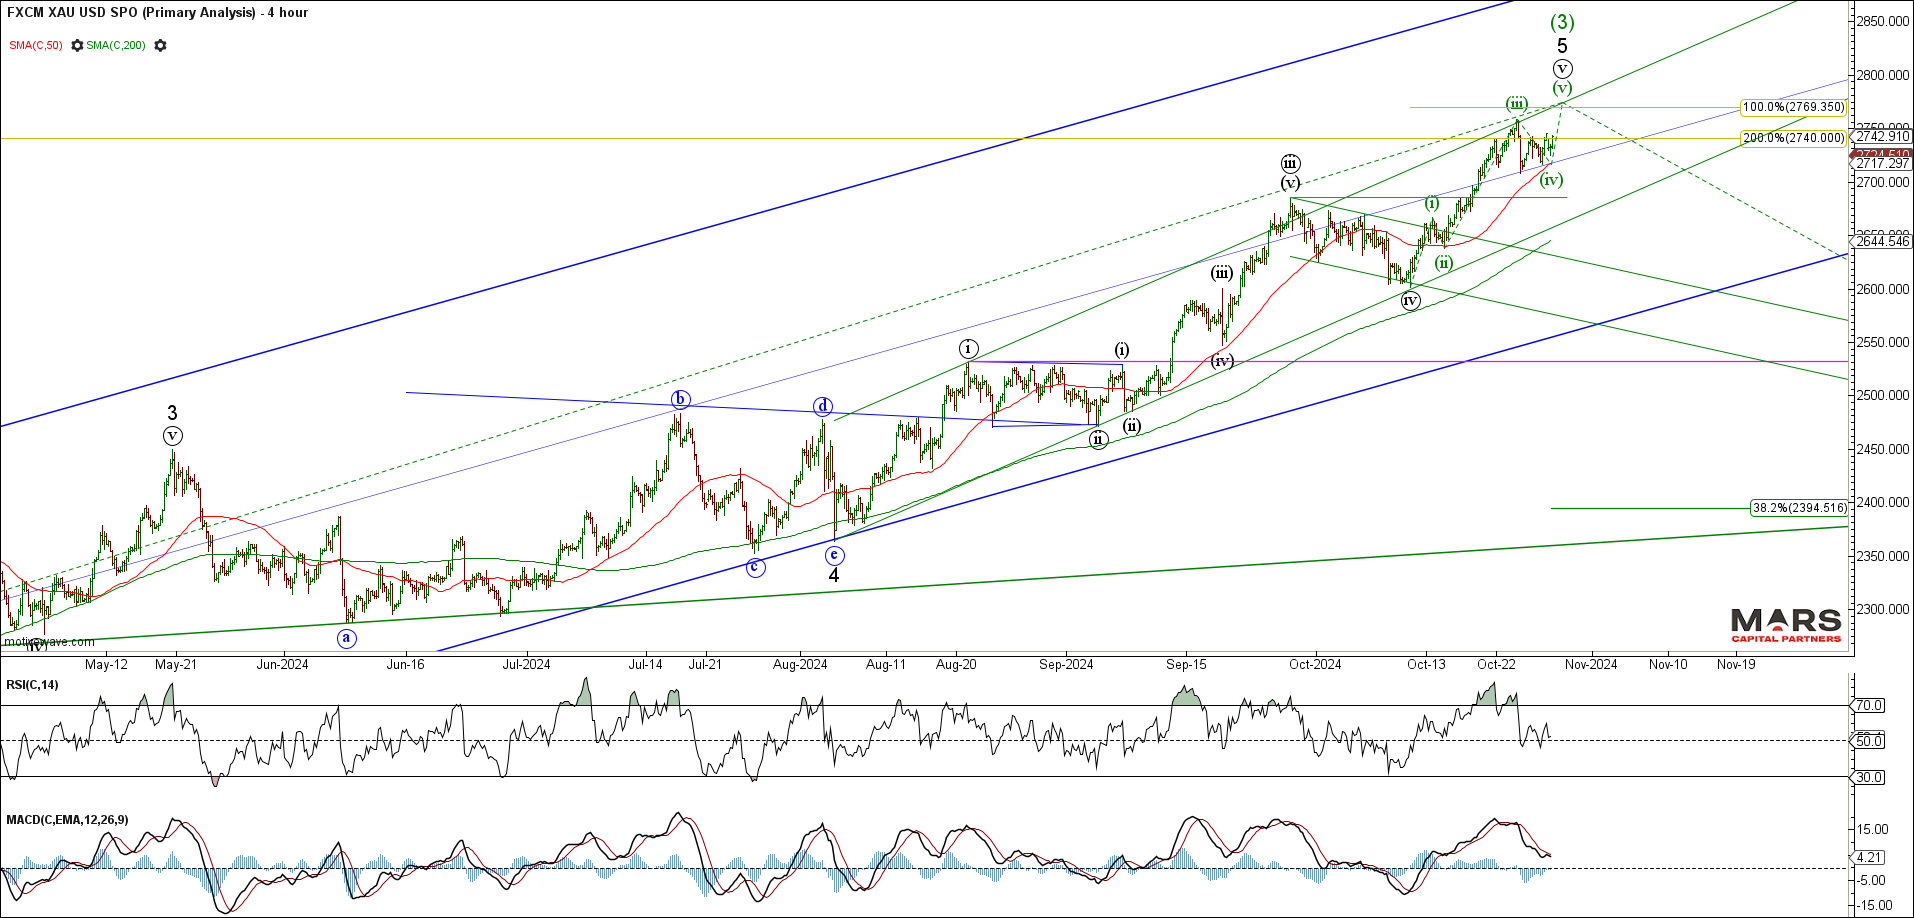
To the commodity markets and Gold pushed to new ATH’s in what appears to be a 5th wave blow-off top. While there are enough waves to complete wave (v) of 5 of (3) up, there is no evidence yet of a tradable top. Bears need to break the series of higher highs and higher lows to help confirm a change in trend. Too early to call.
Gold DailyGold H4
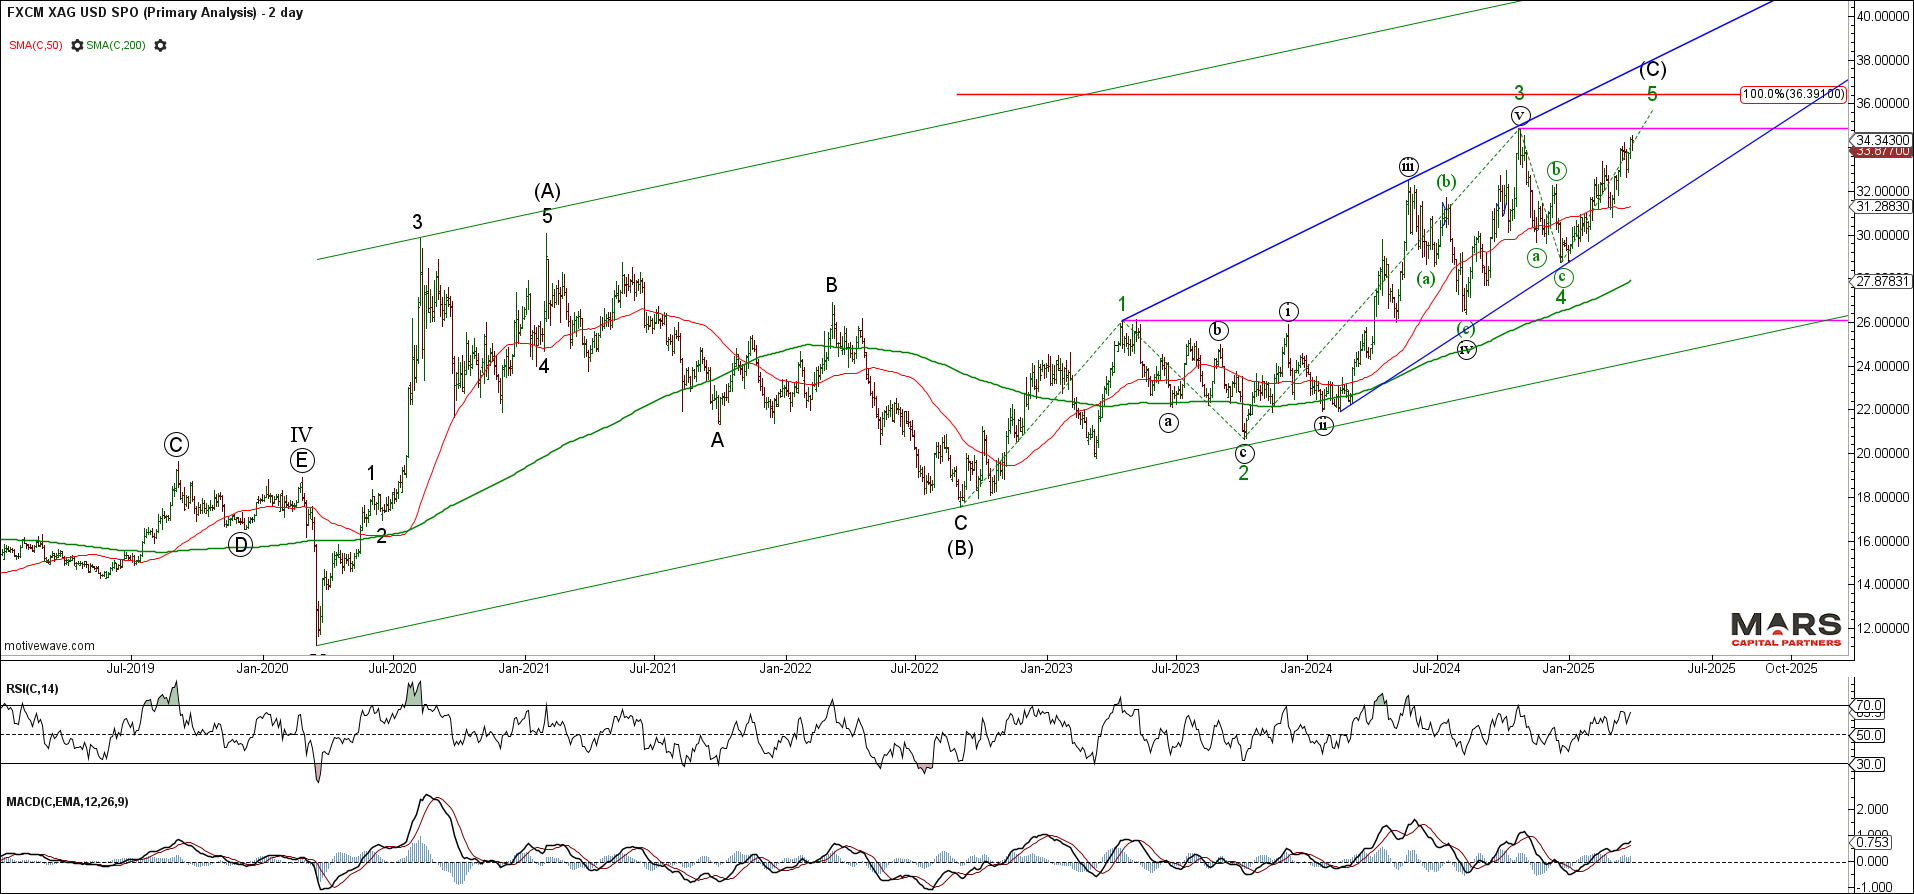
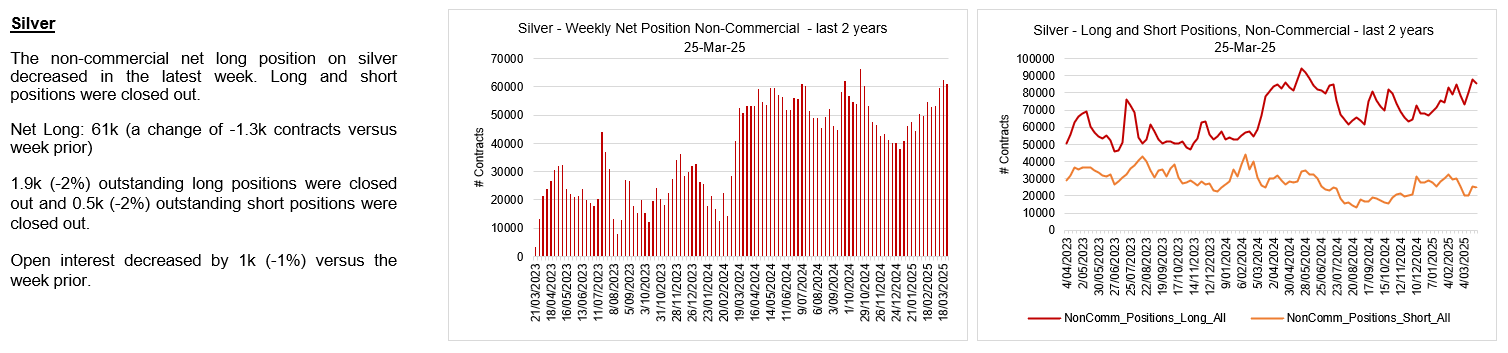
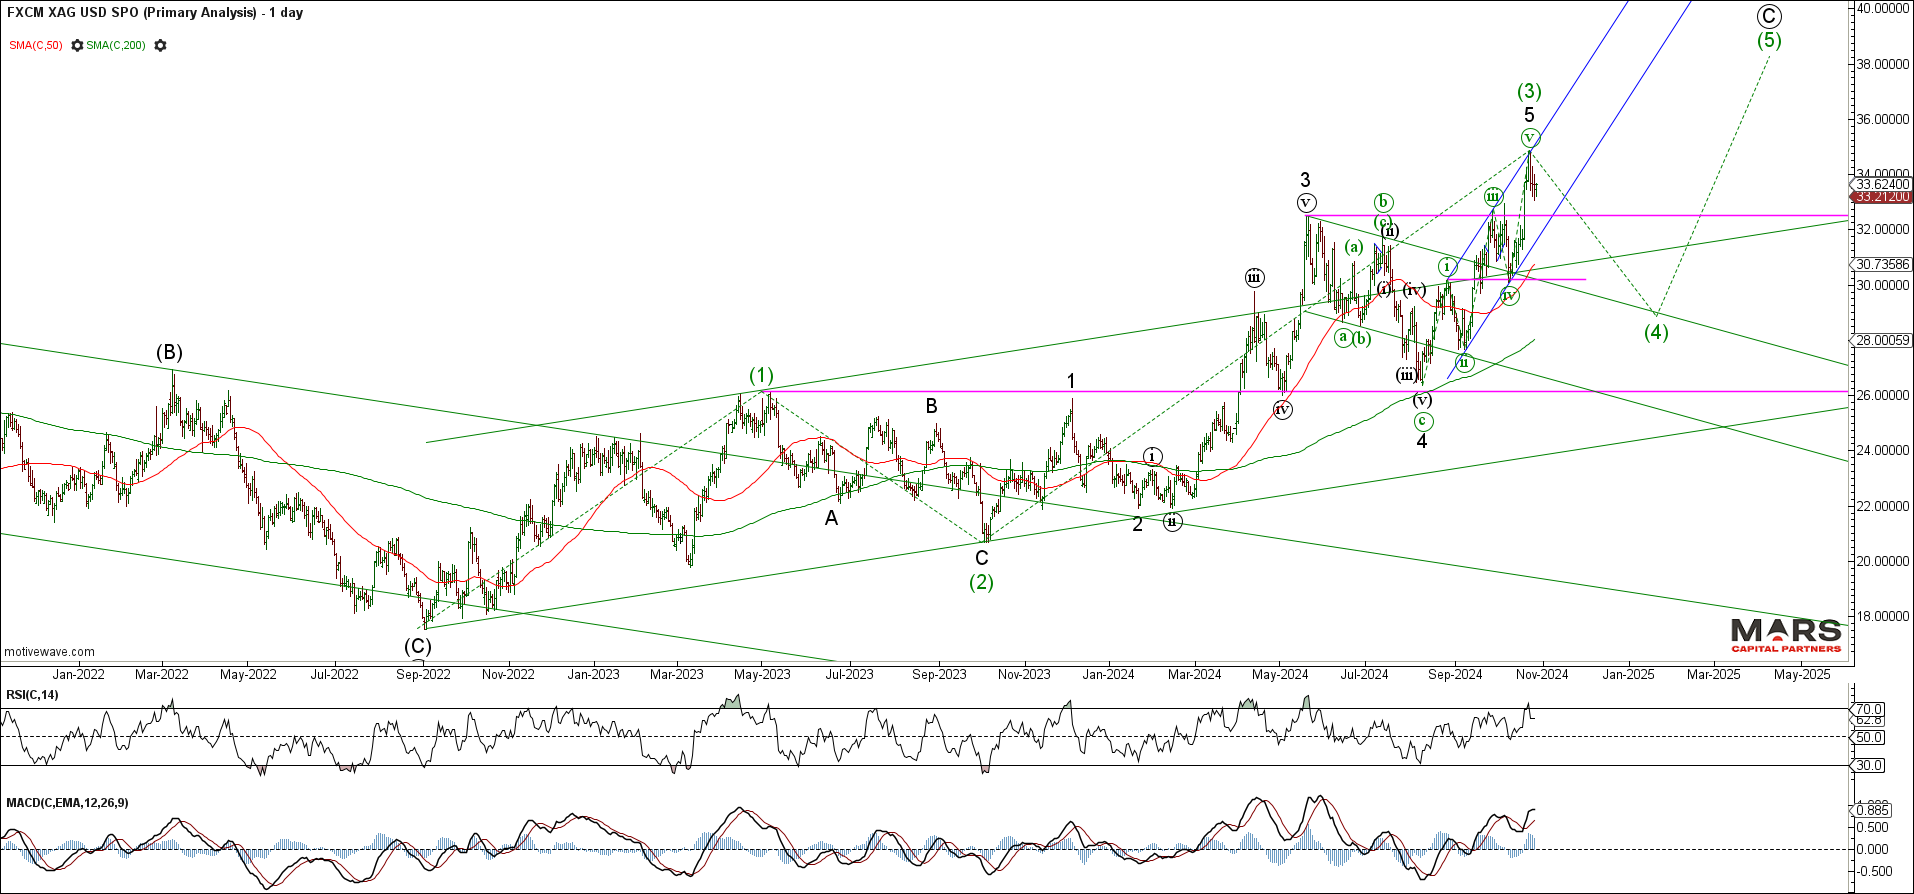
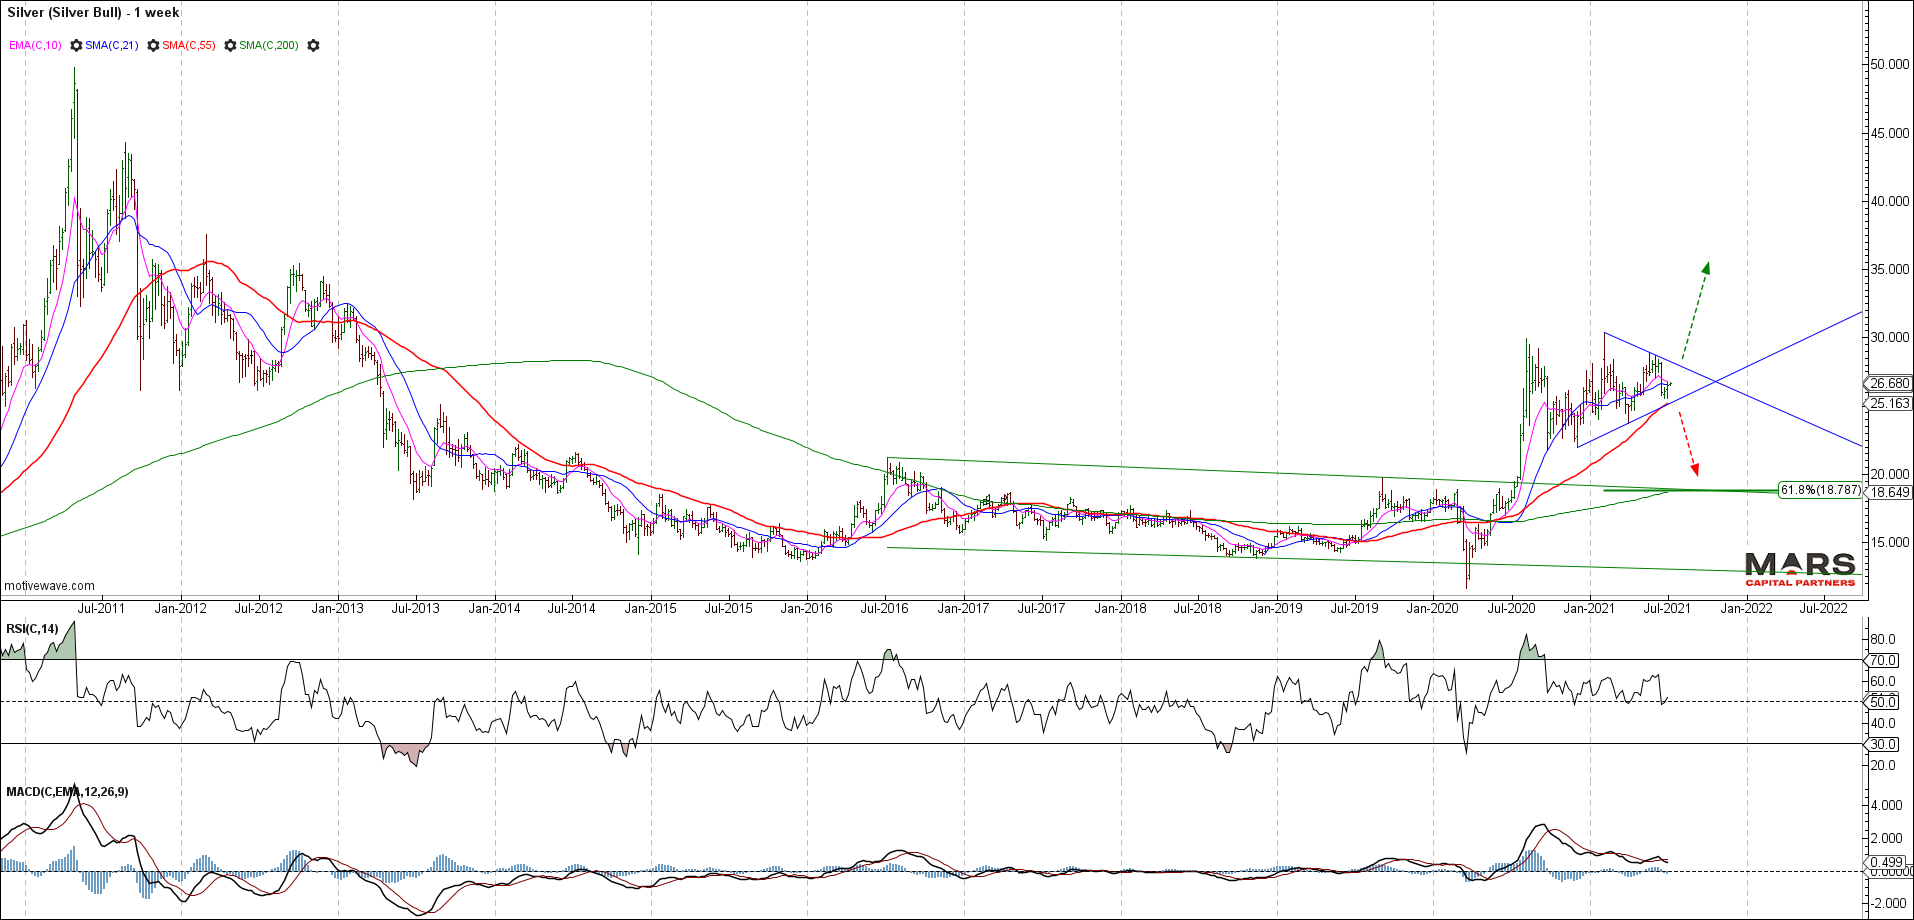
Silver is testing major swing highs as we look for a final wave 5 rally. There is no evidence of a tradable top as it continues to wedge into the highs. We are wary that this latest rally is potentially an ending wave so buyer beware as it pushes to new cycle highs. The fake-out new ATH’s in Copper is a warning to all.
Silver 2D
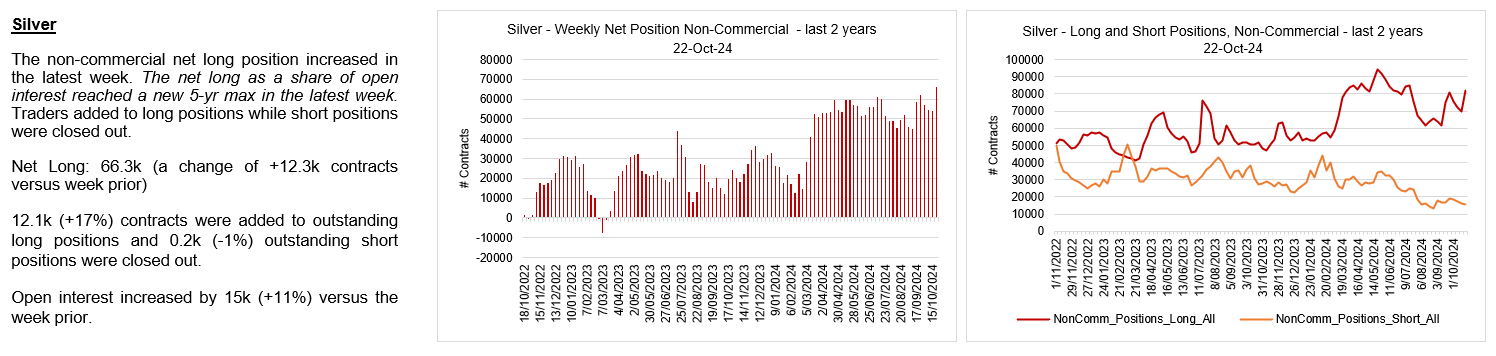
Silver bulls pressing into the highs.
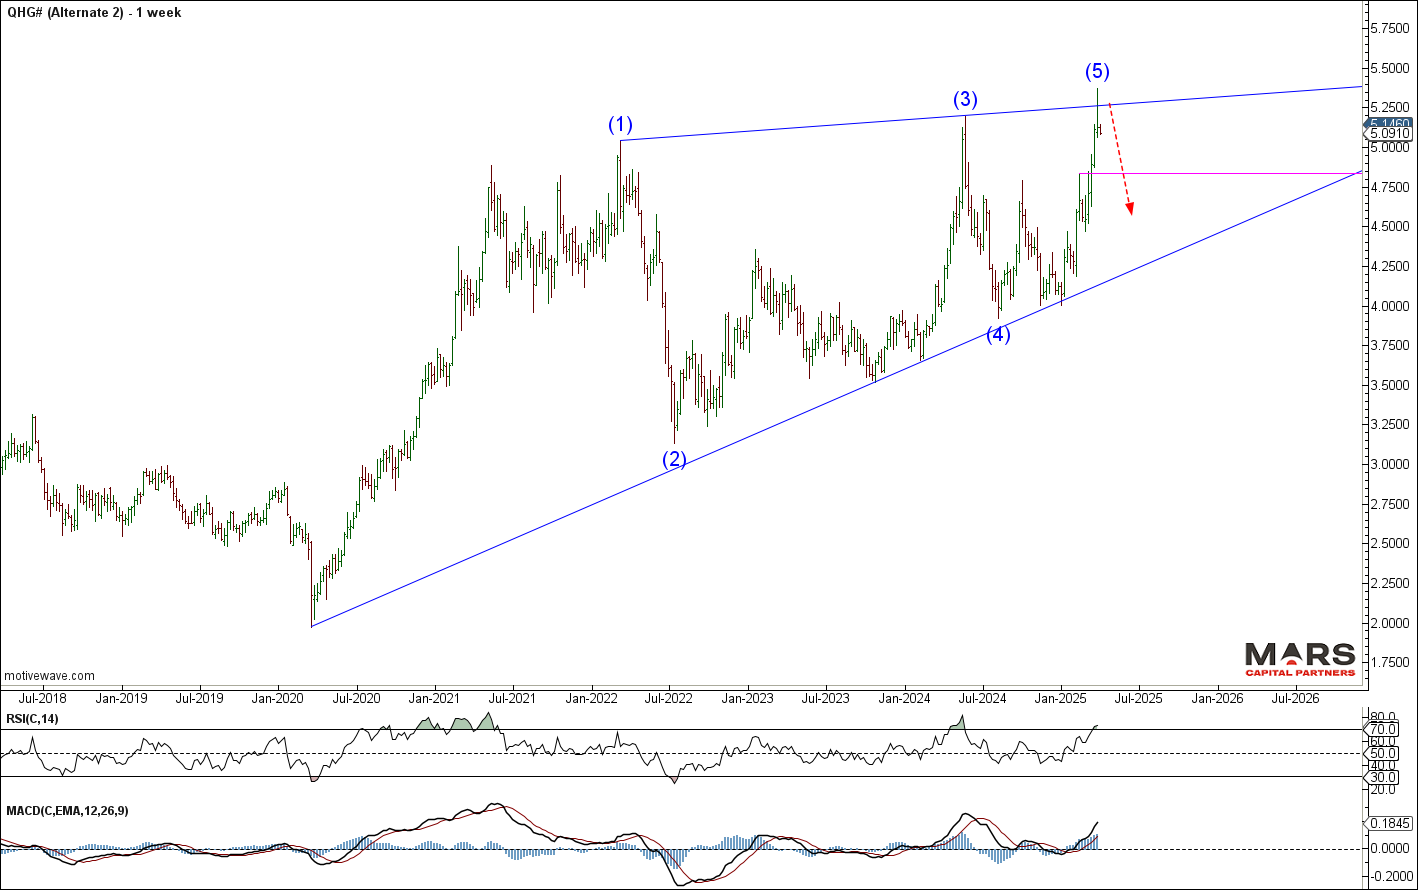
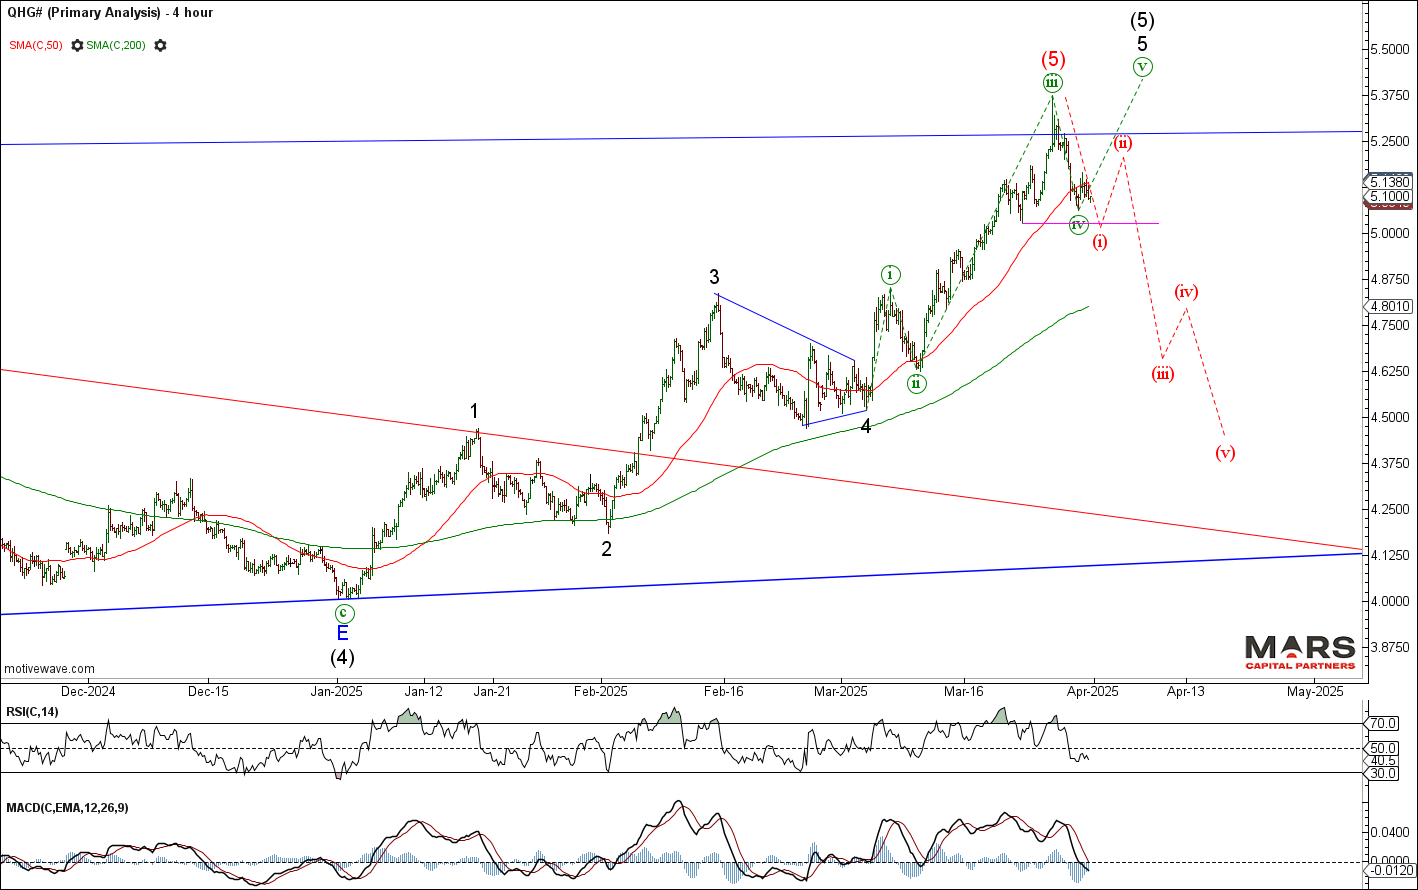
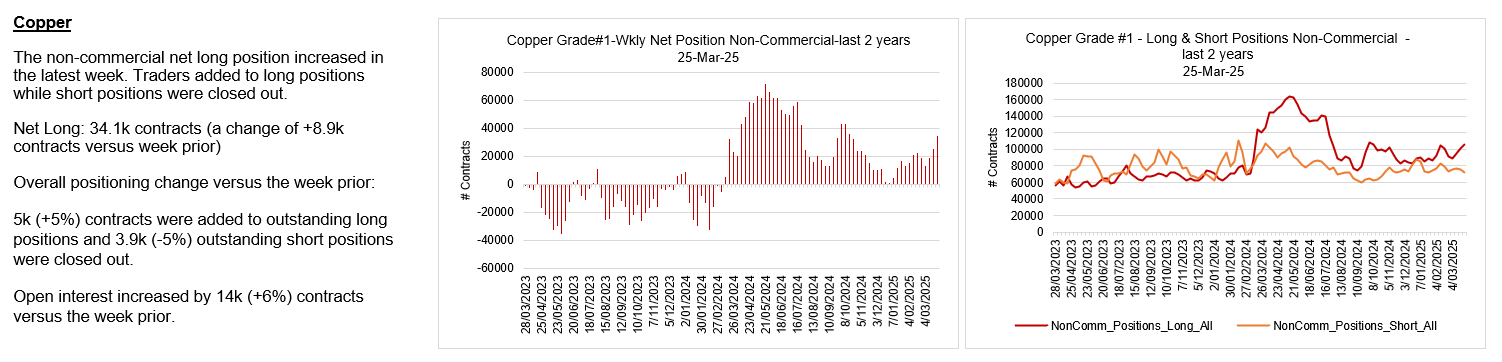
Dr Copper pushed to new ATH’s but reversed sharply lower as warned. Bears need to see downside follow through this week to help confirm a potential top. An impulsive decline that breaks overlap support in the 4.83 area would be the first indication of a potential change in trend. Trade above last week’s highs likely sees a 5th wave extension higher. Near term inflection.
Copper WeeklyCopper H4
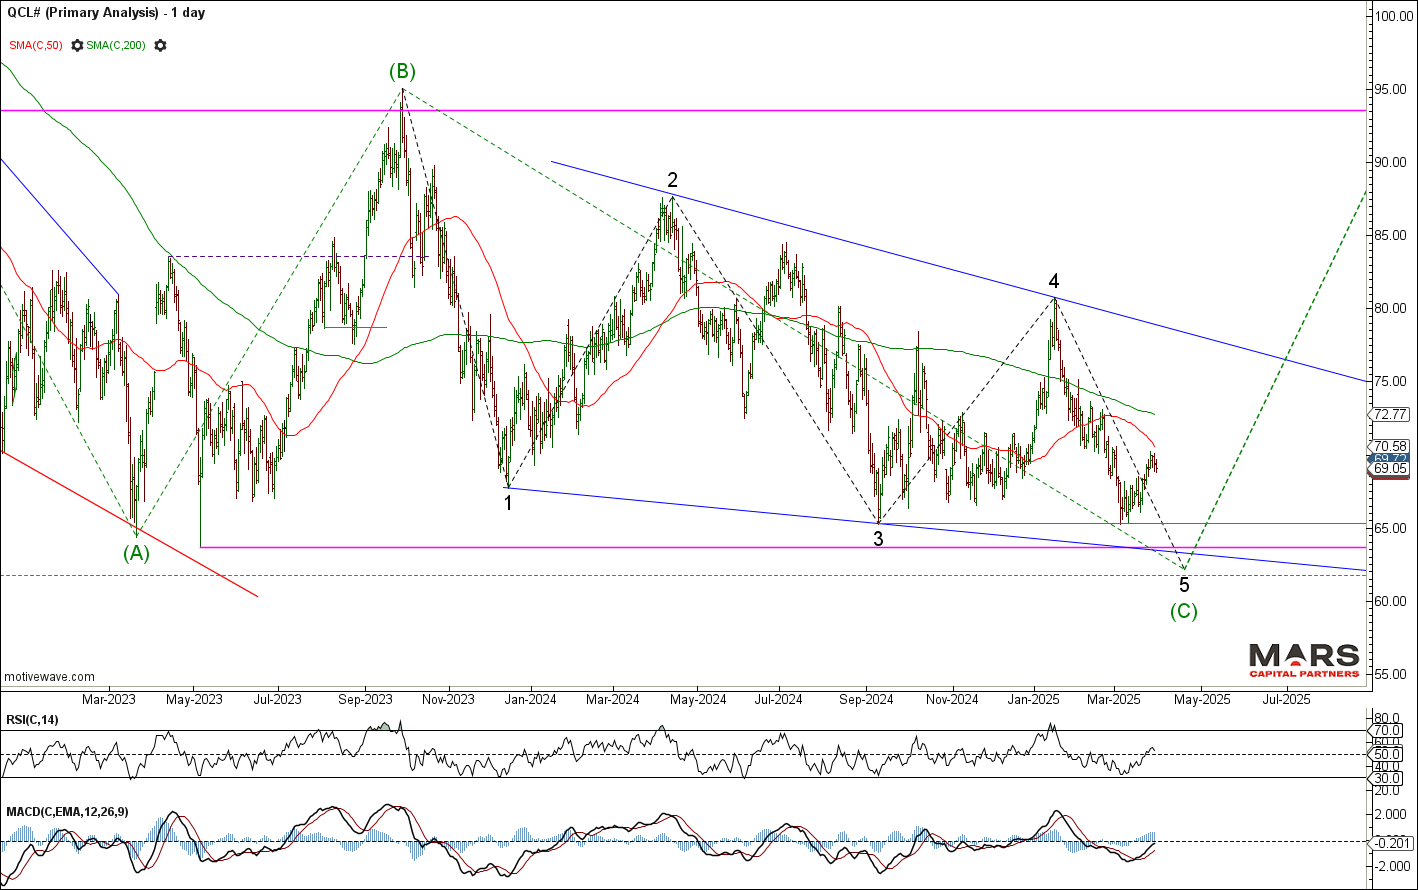
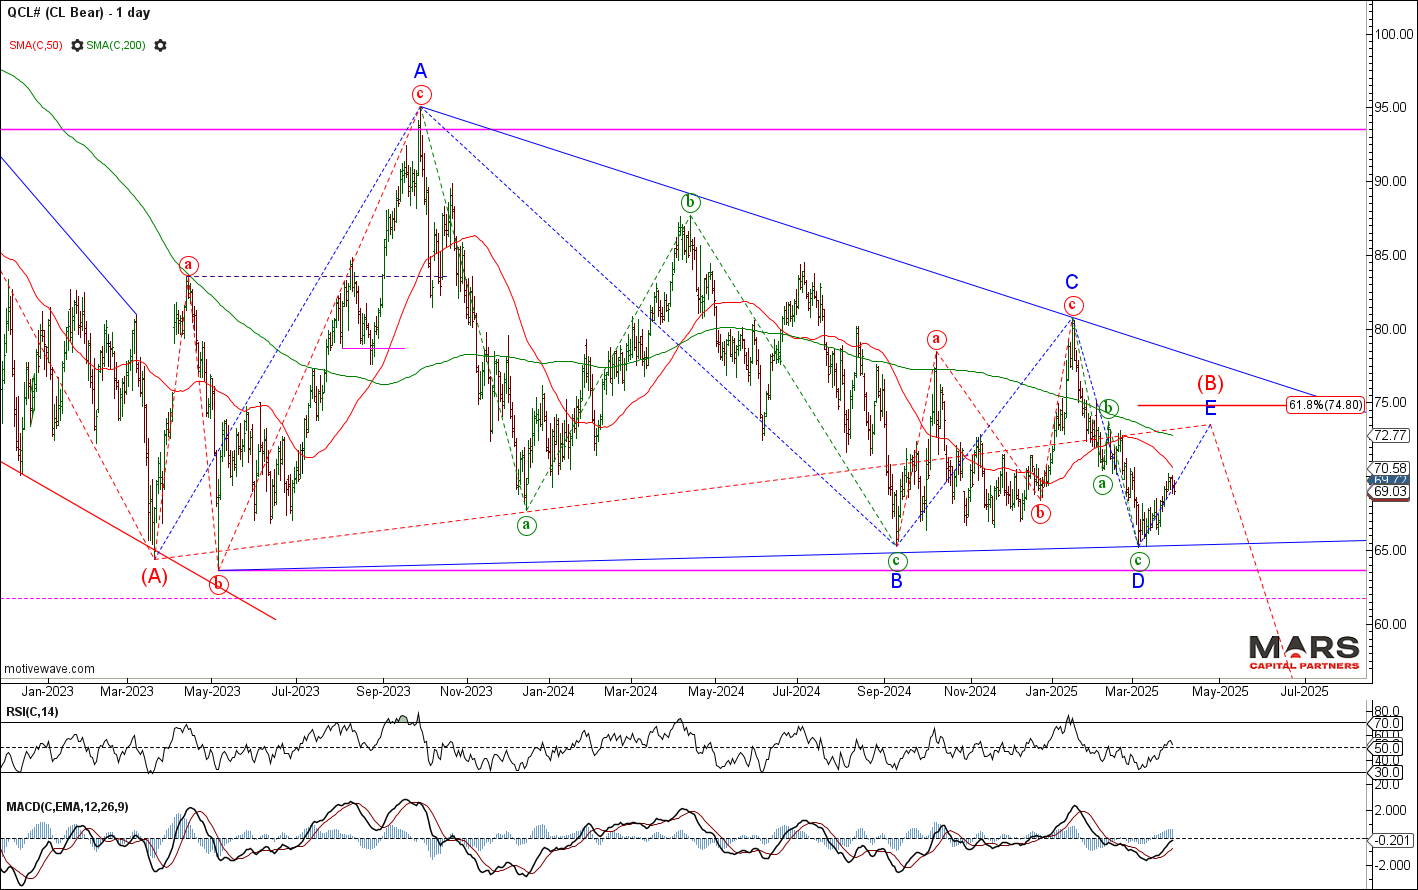
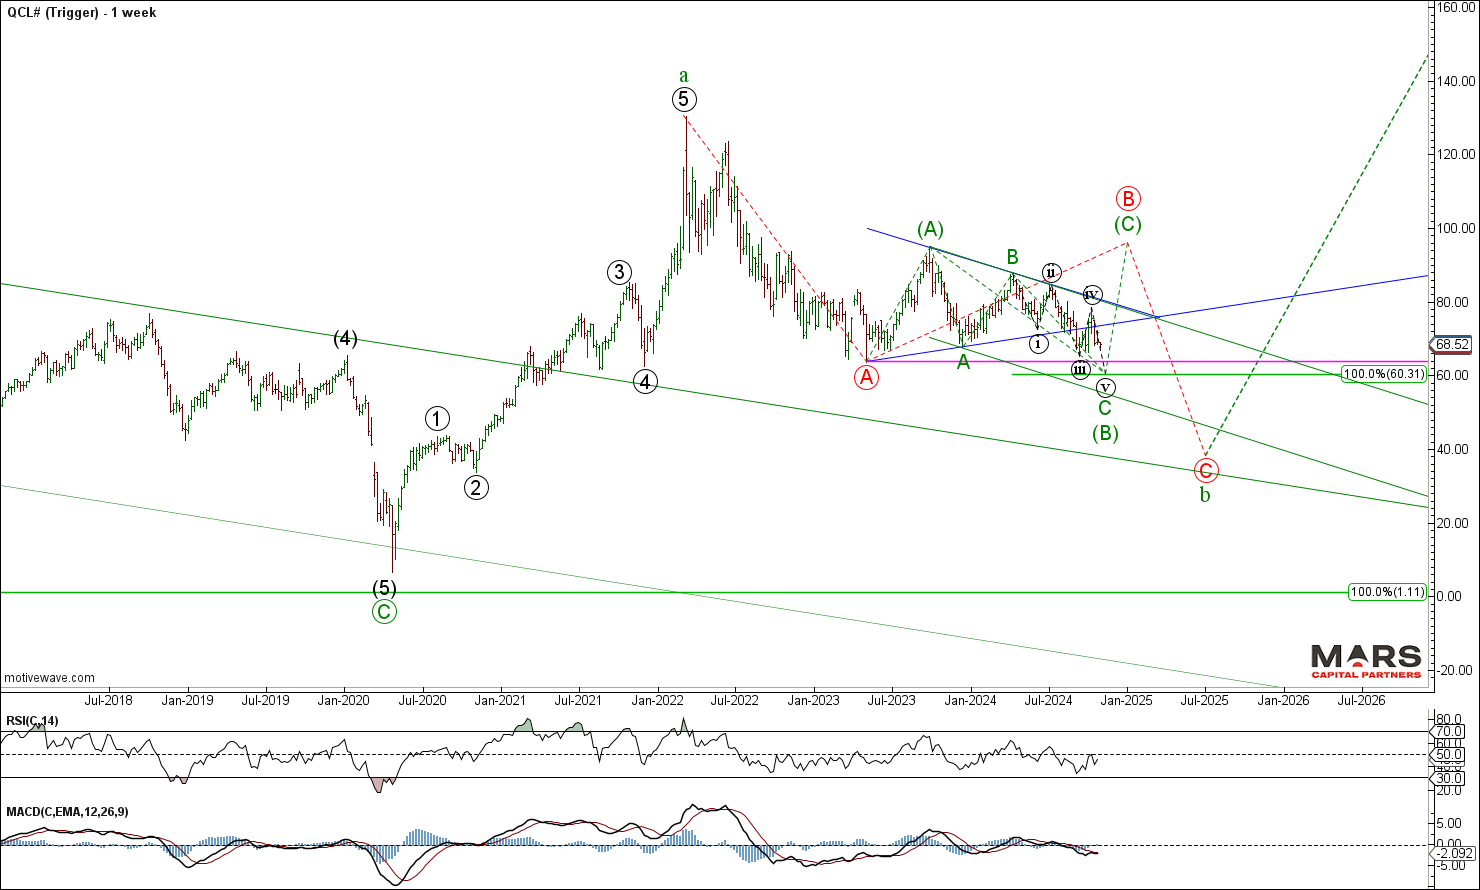
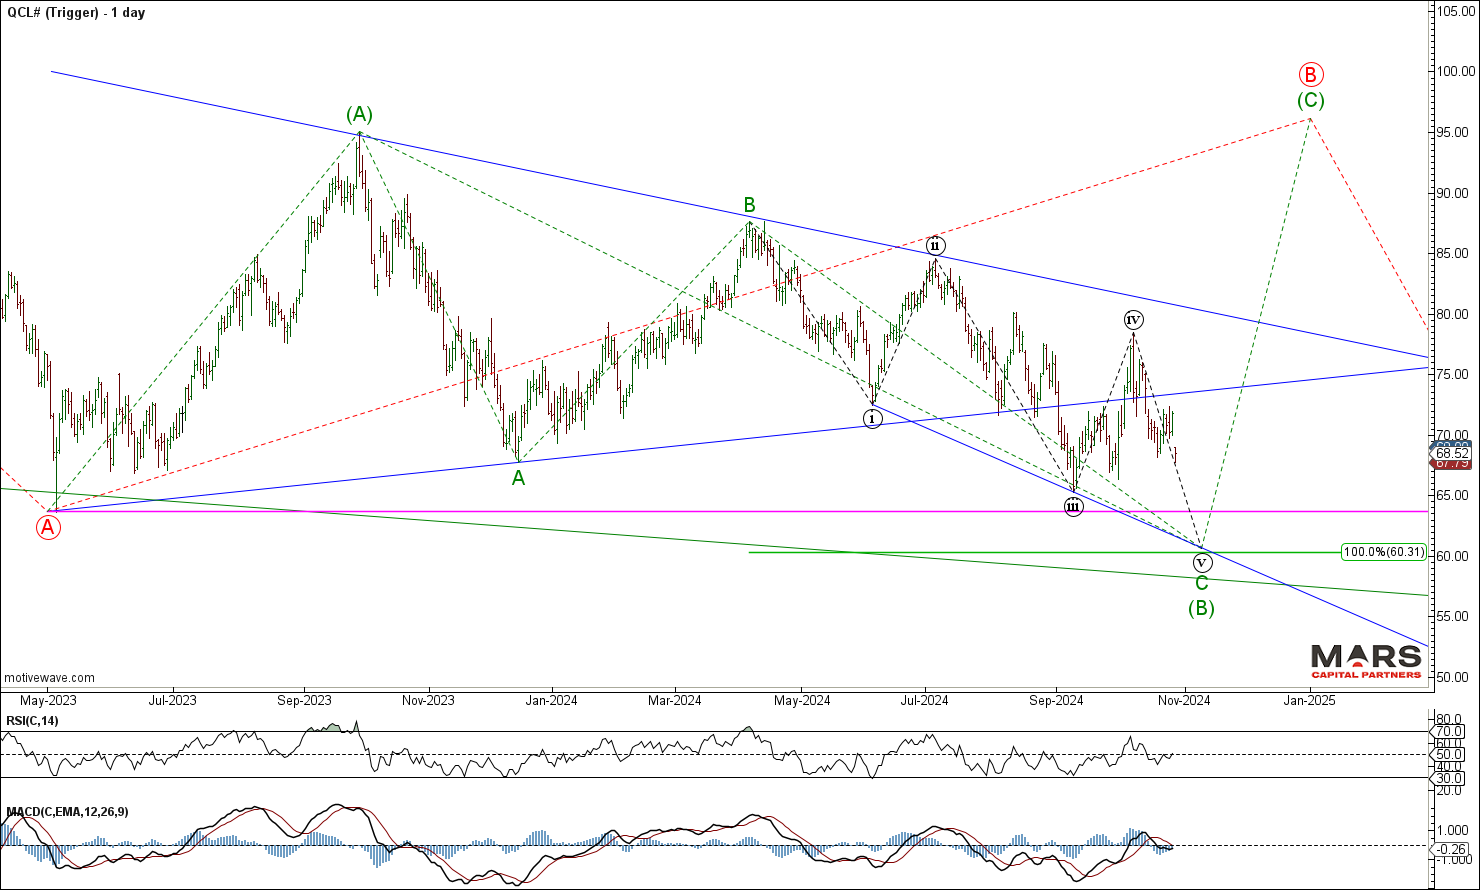
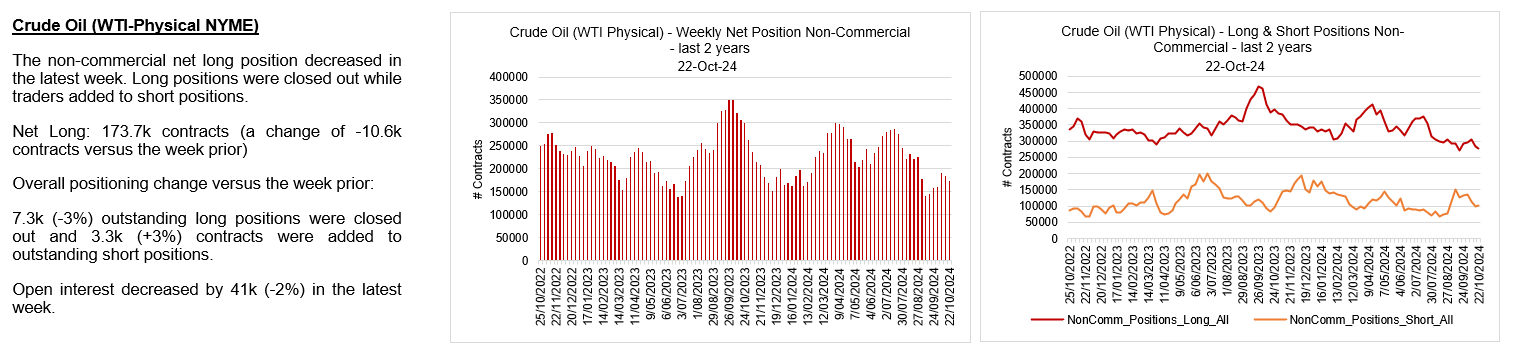
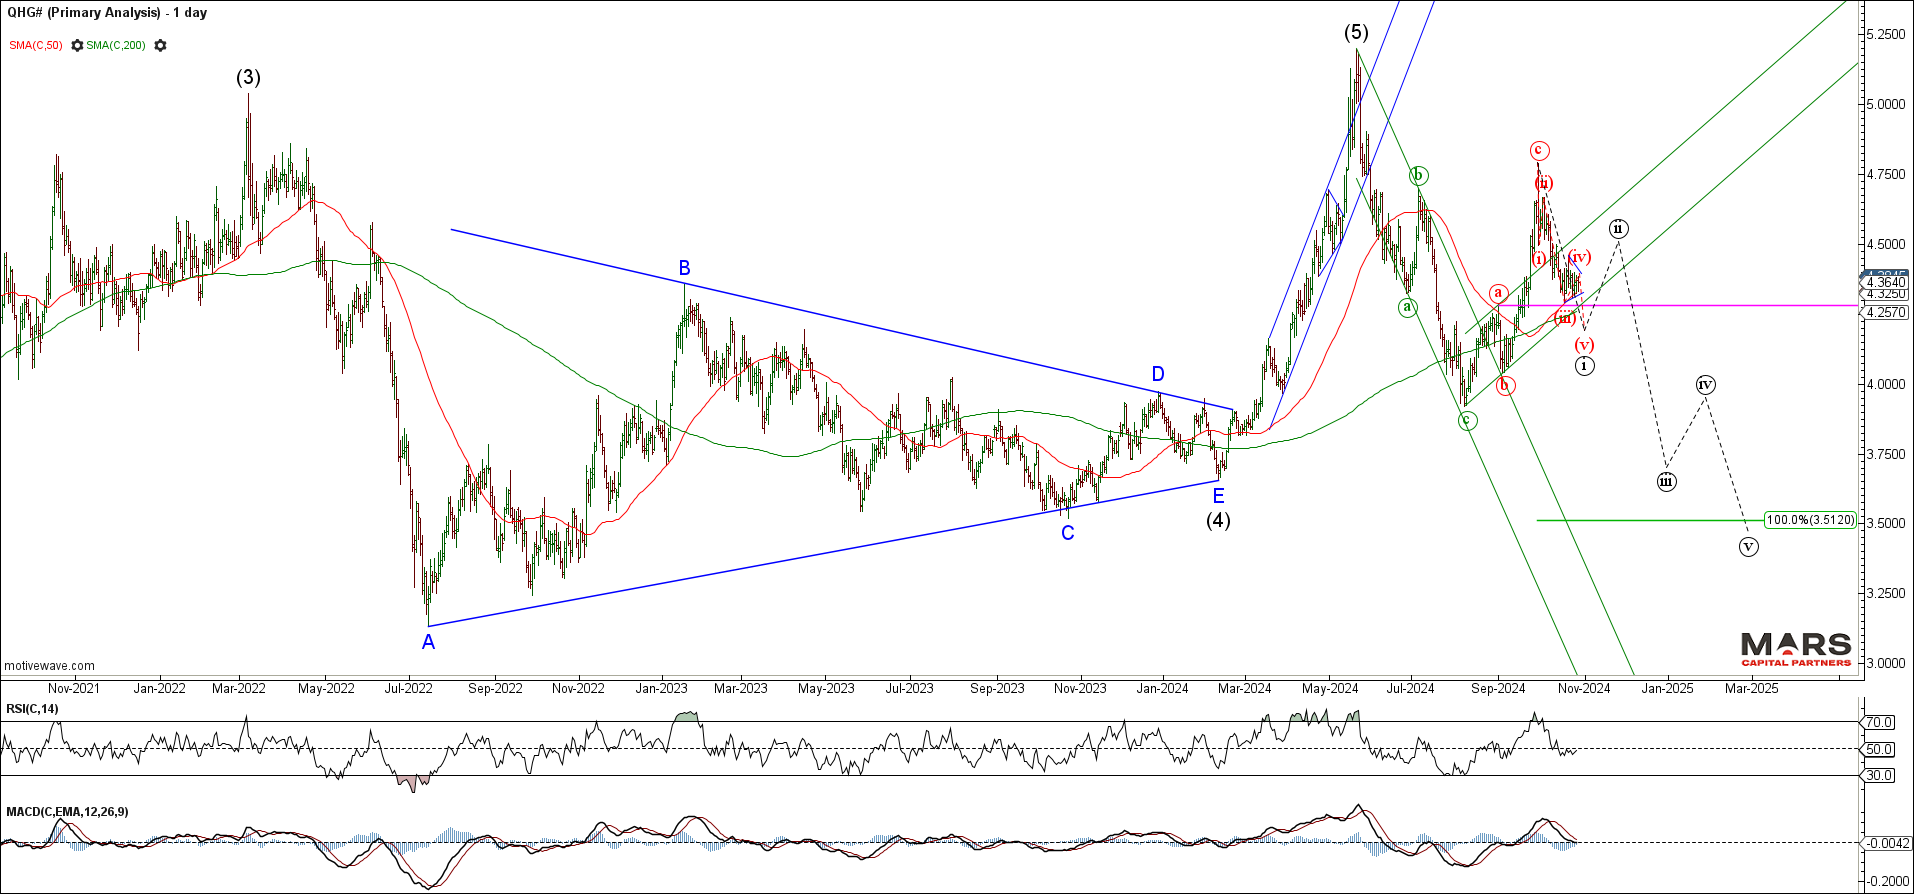
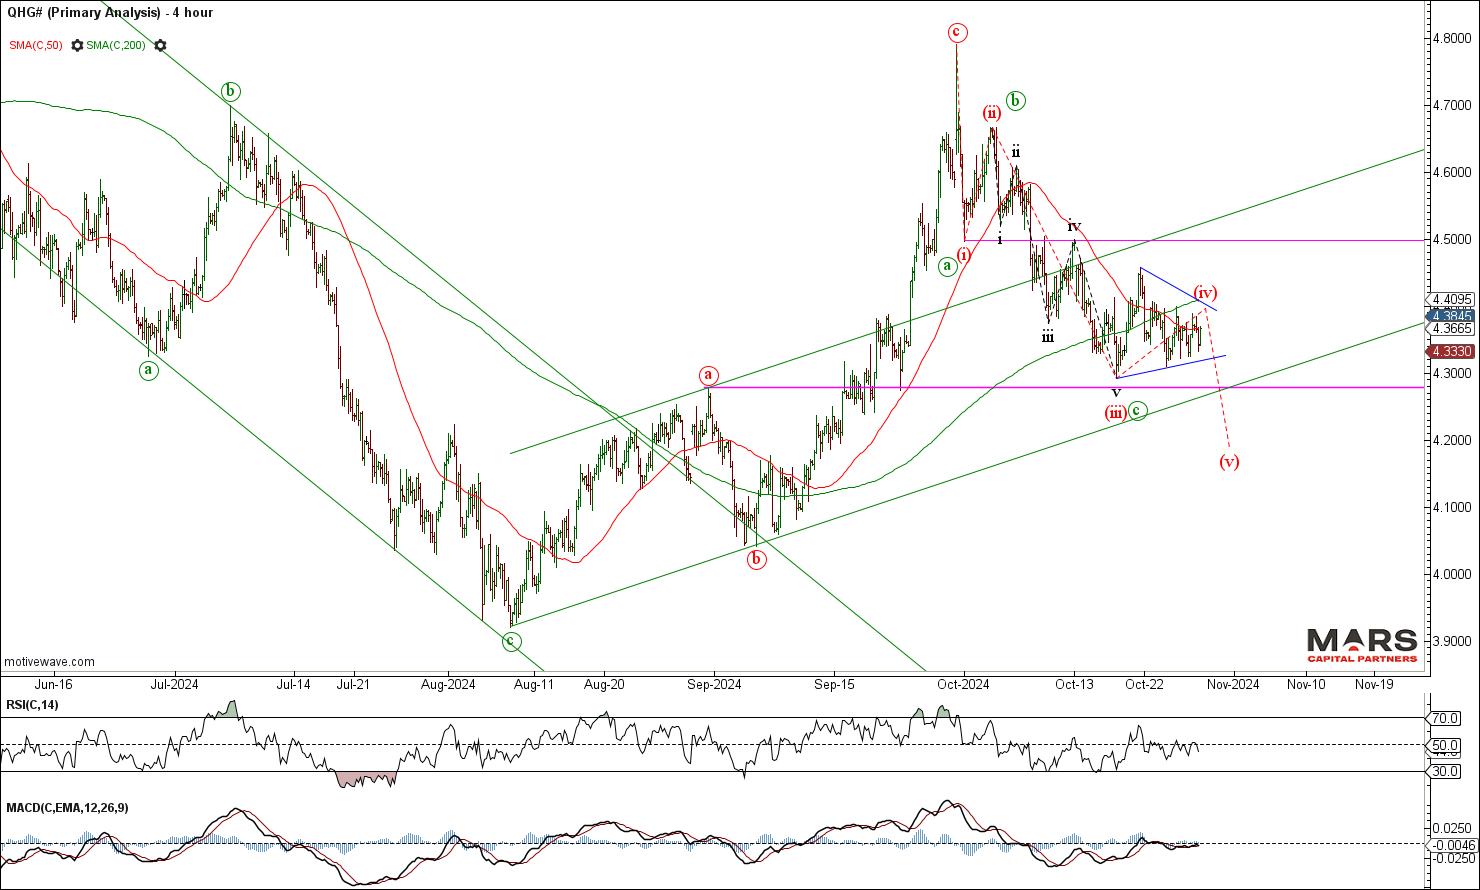
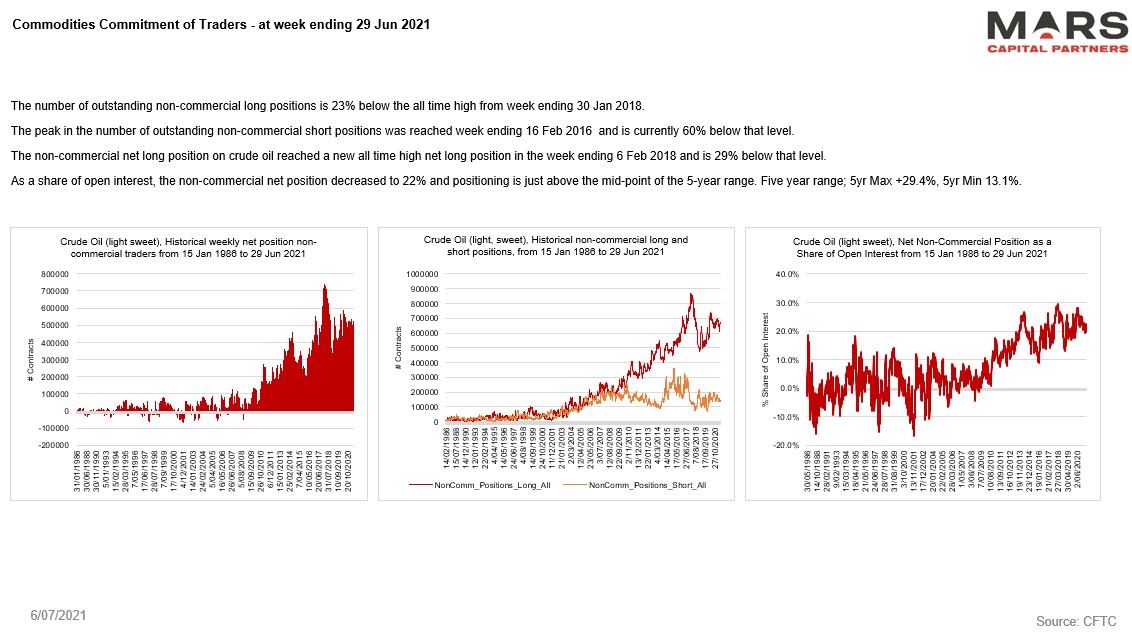
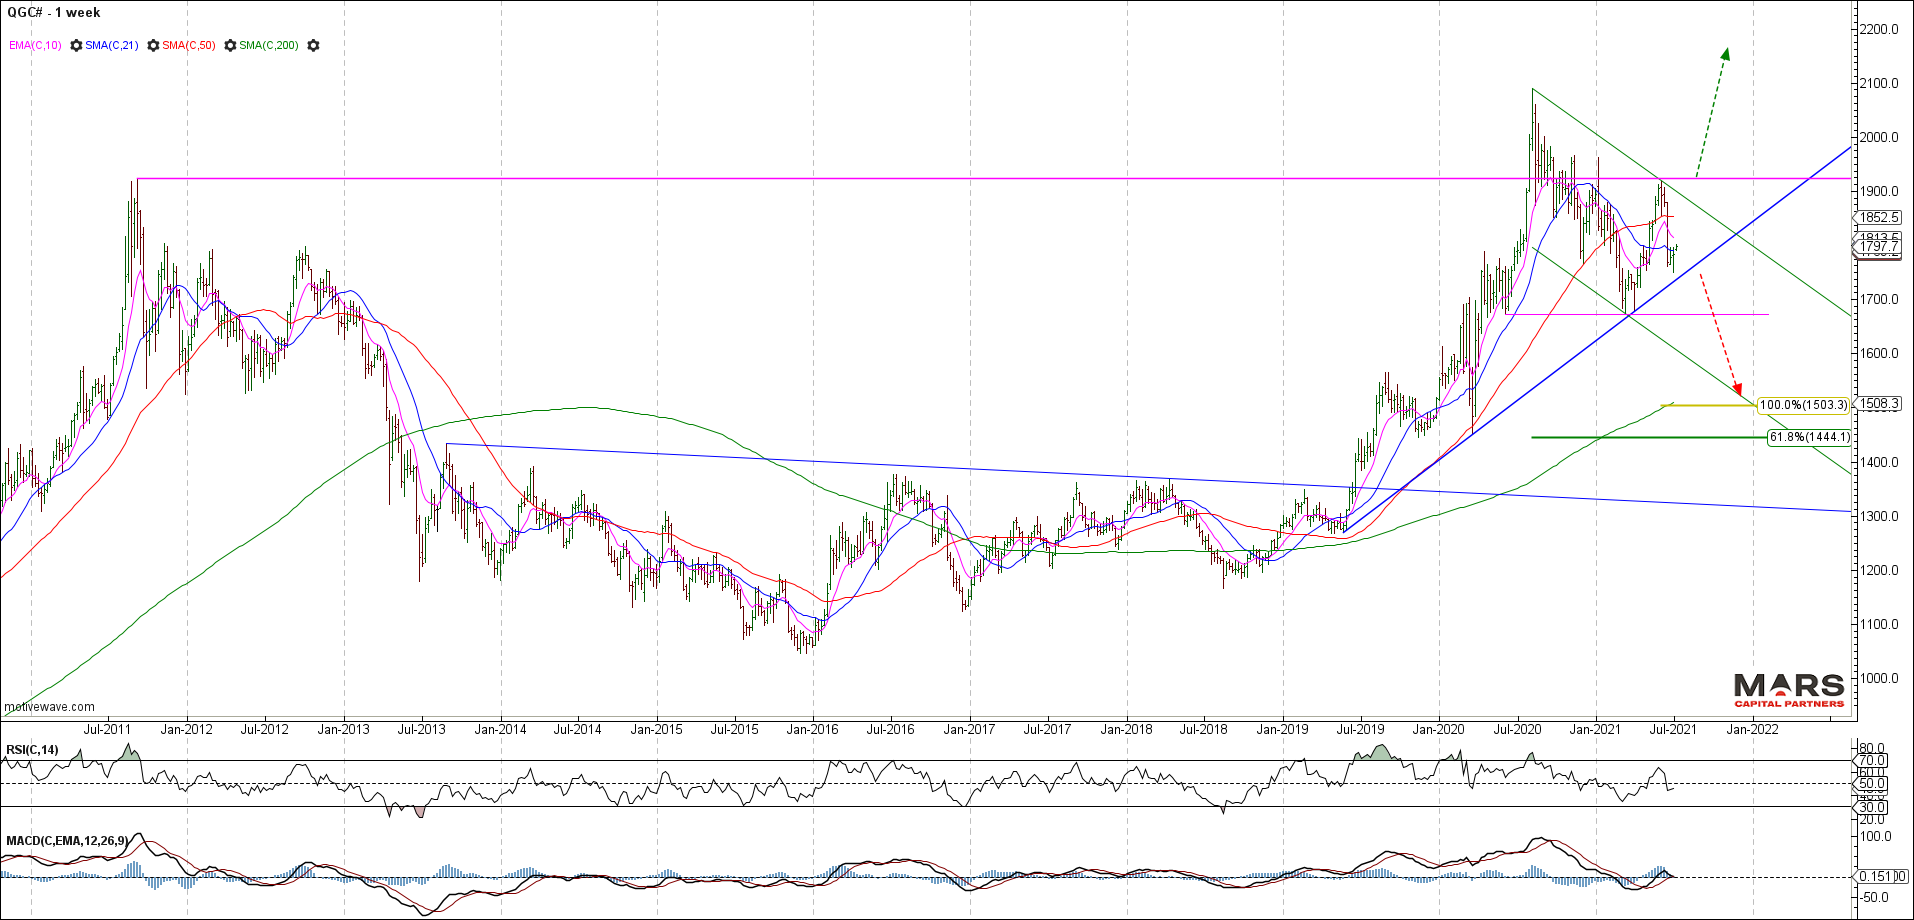
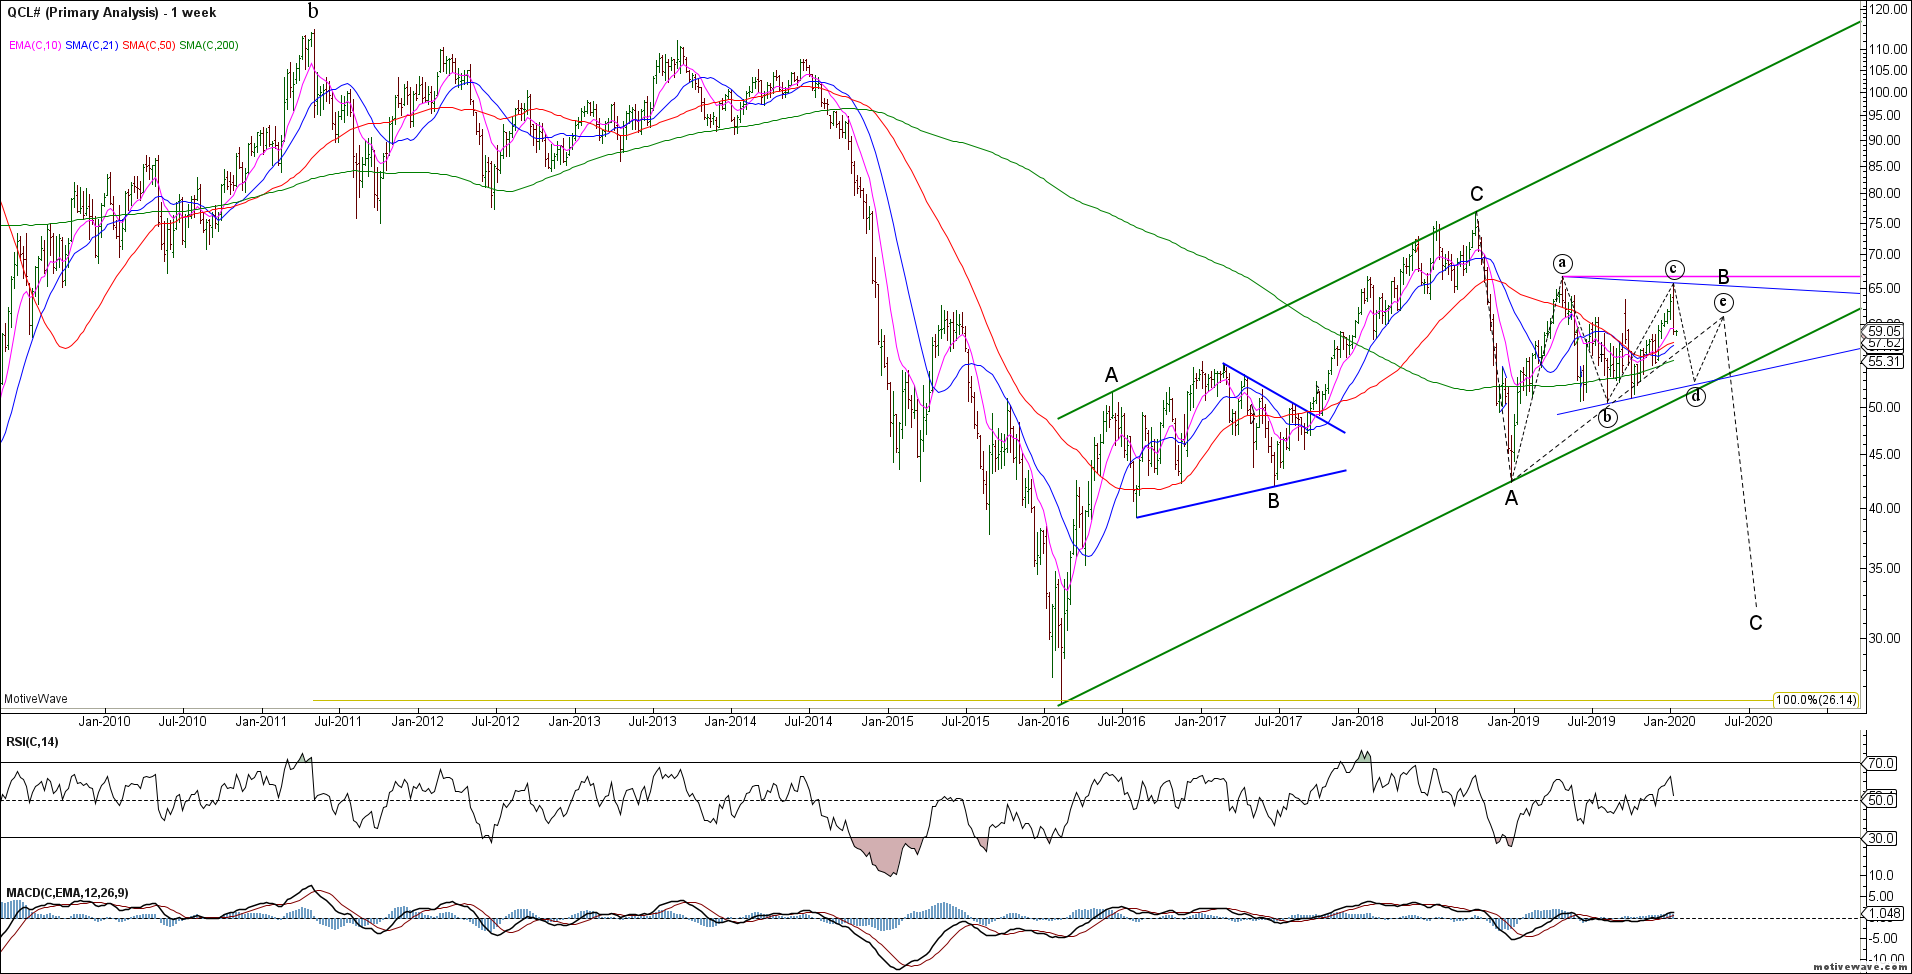
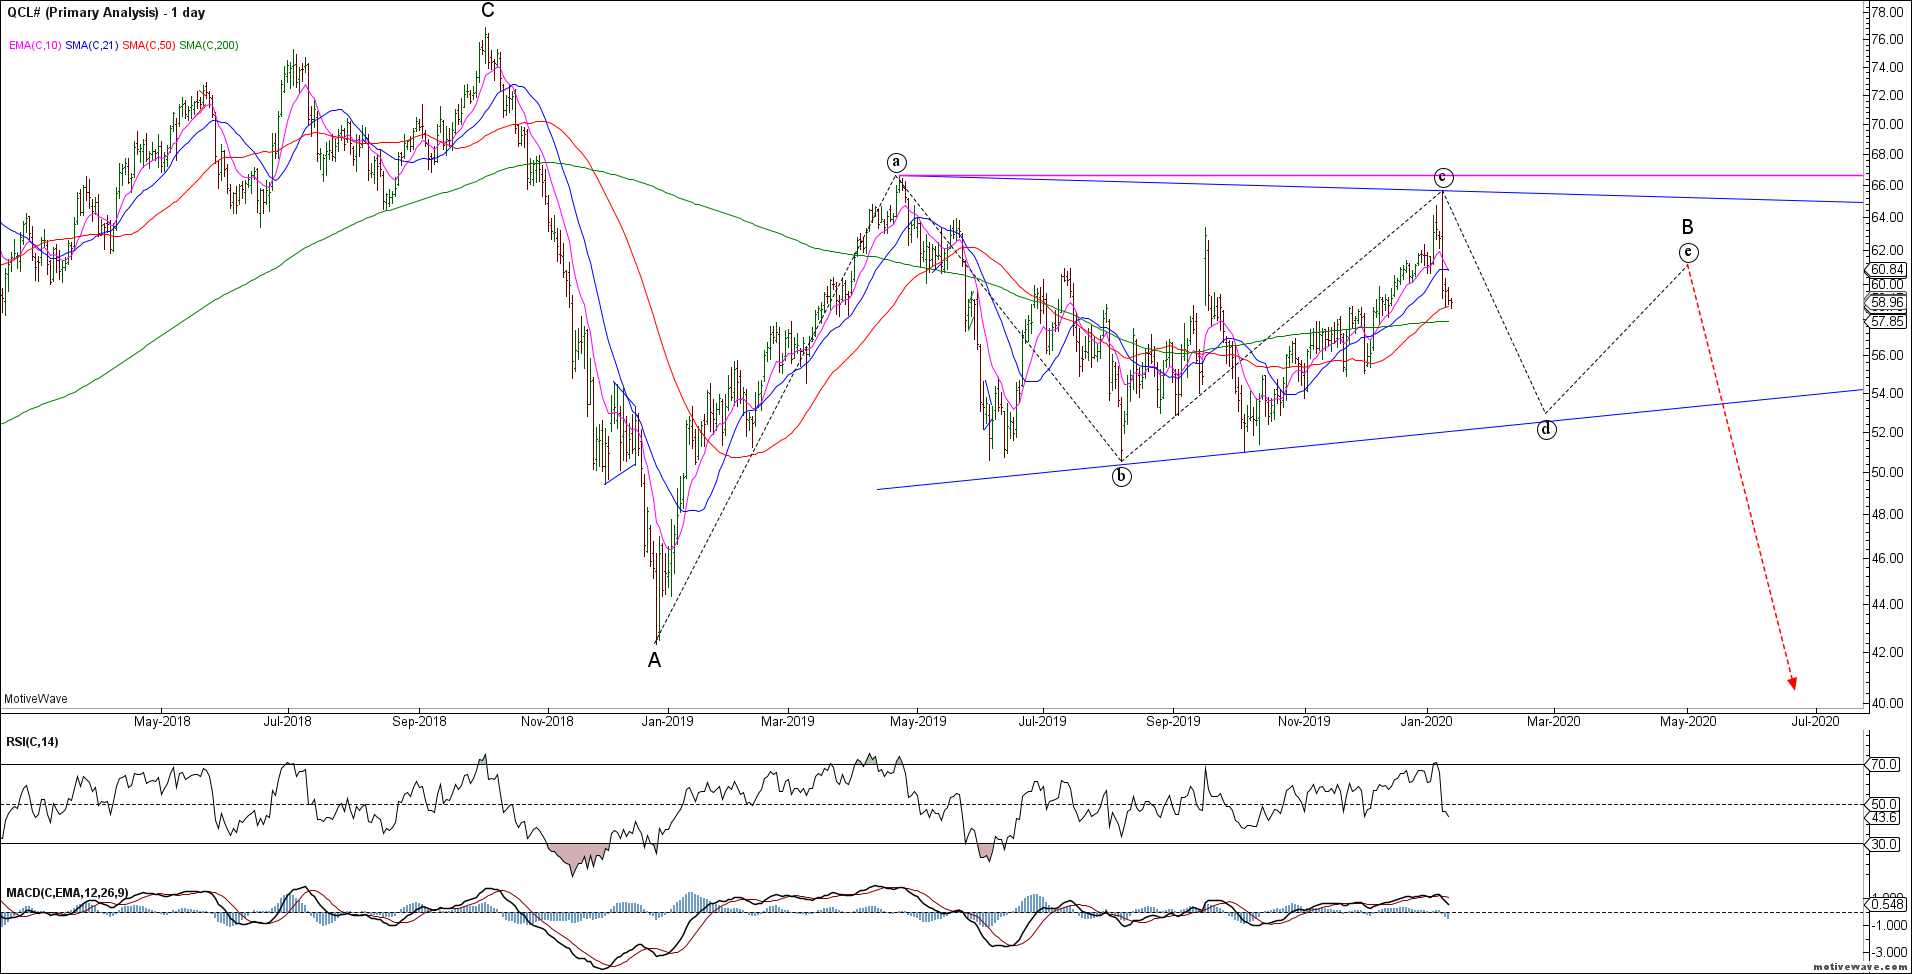
Crude Oil continues to hold shelf support but would still look best with a final push lower to potentially complete wave 5 of (C) down. The alternate continues to be a triangle wave (B) consolidation if bulls can break up from this support. Two-way risks remain with major support in the 62-64 area.
CL Ending Diagonal DailyCL Bear Case Daily
Crypto Markets – Counter-trend rally
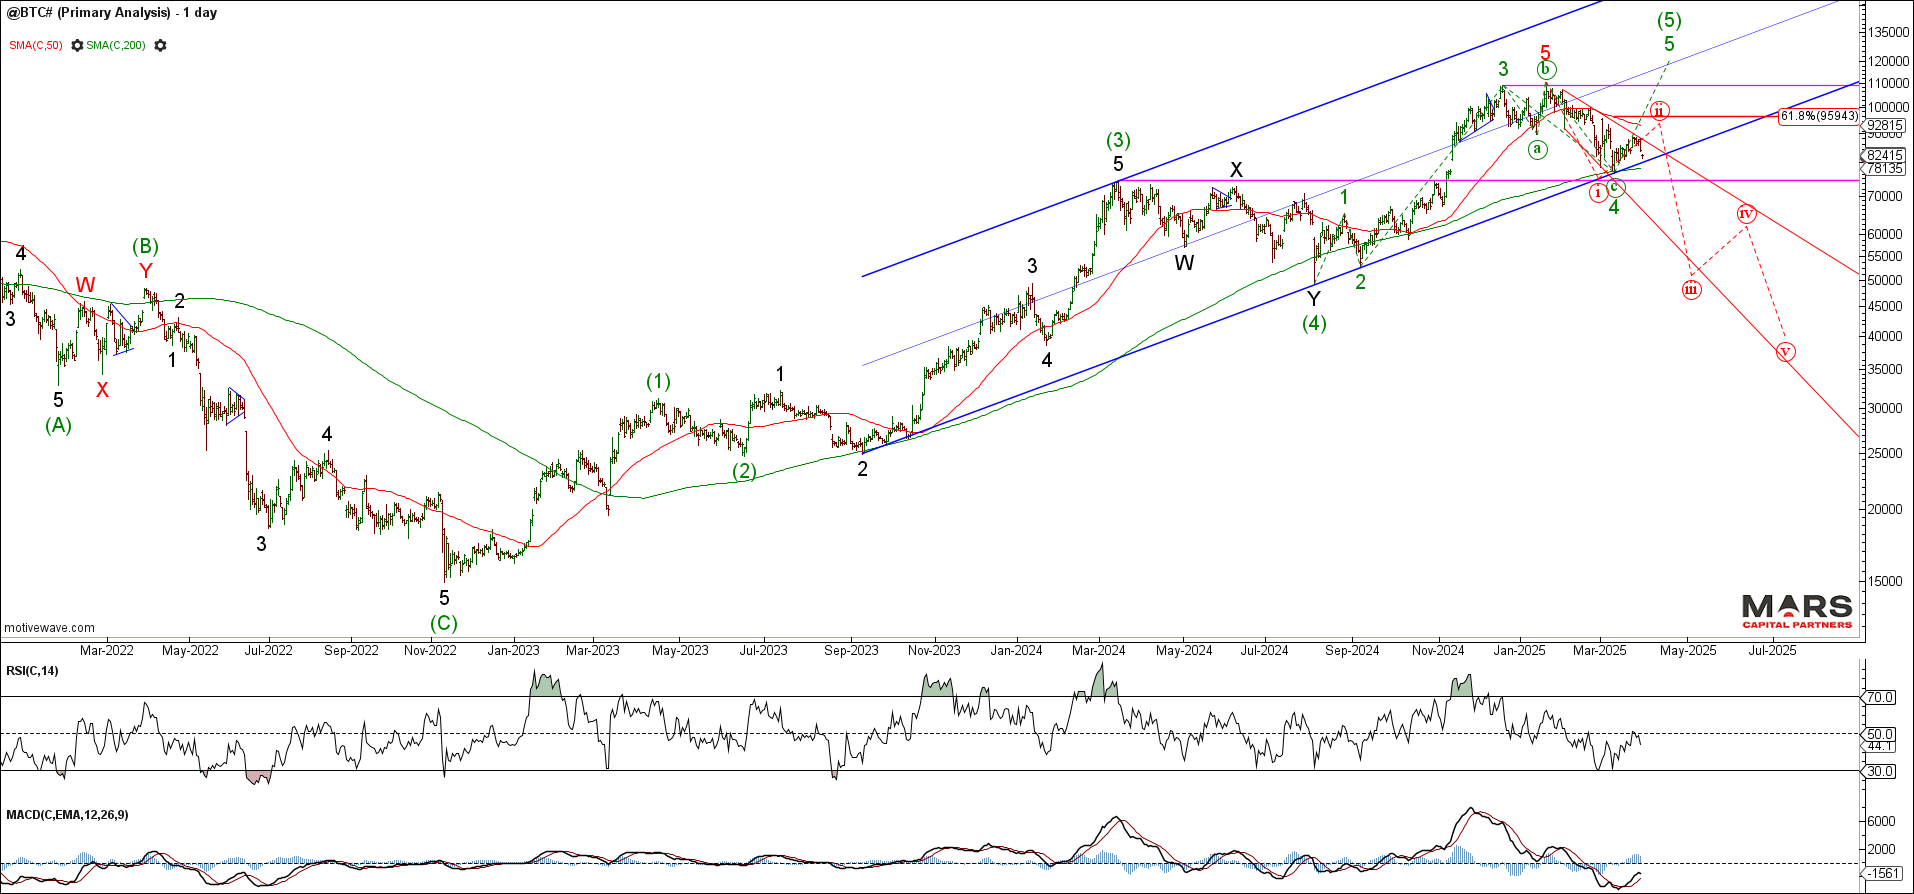
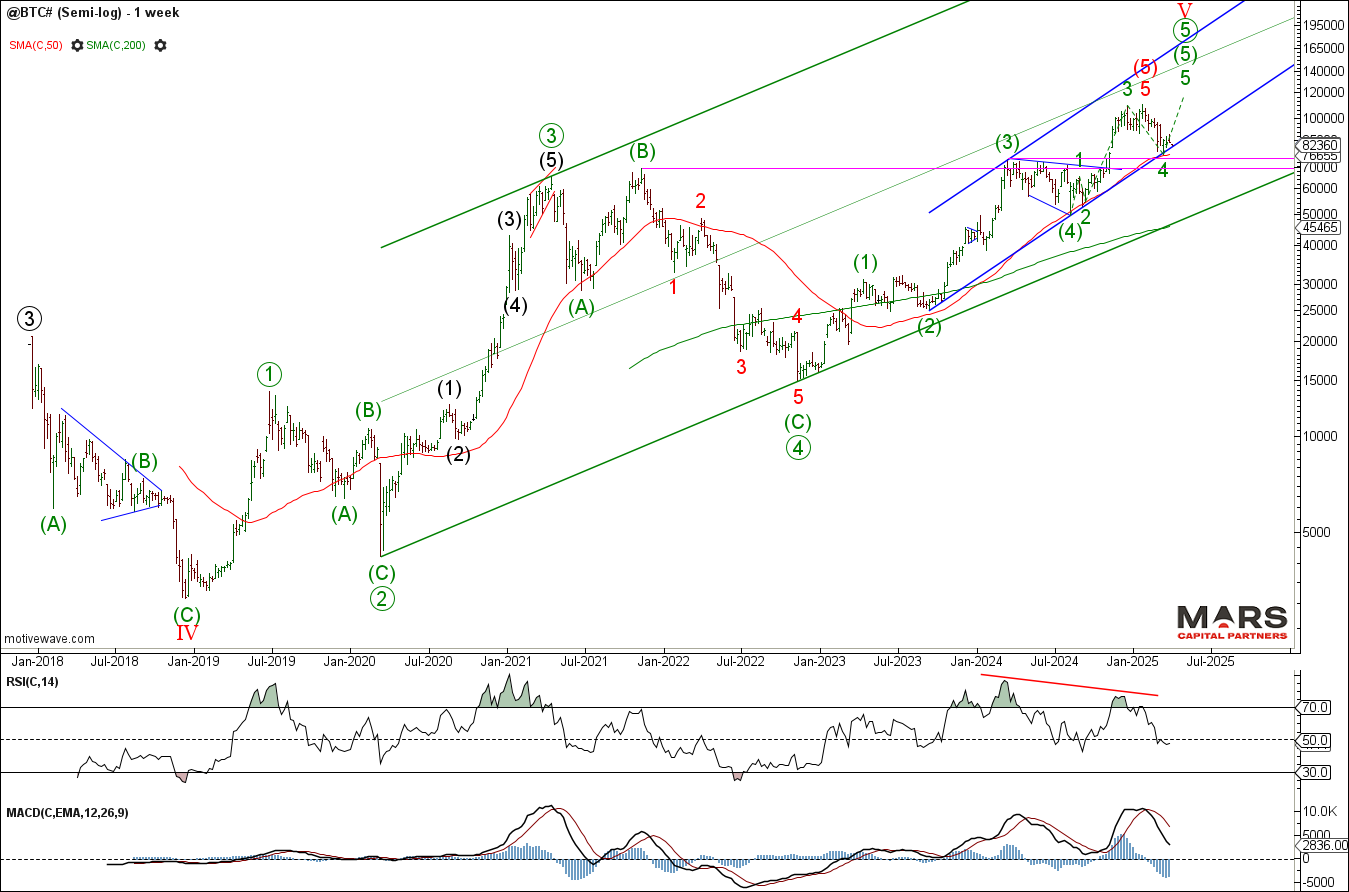
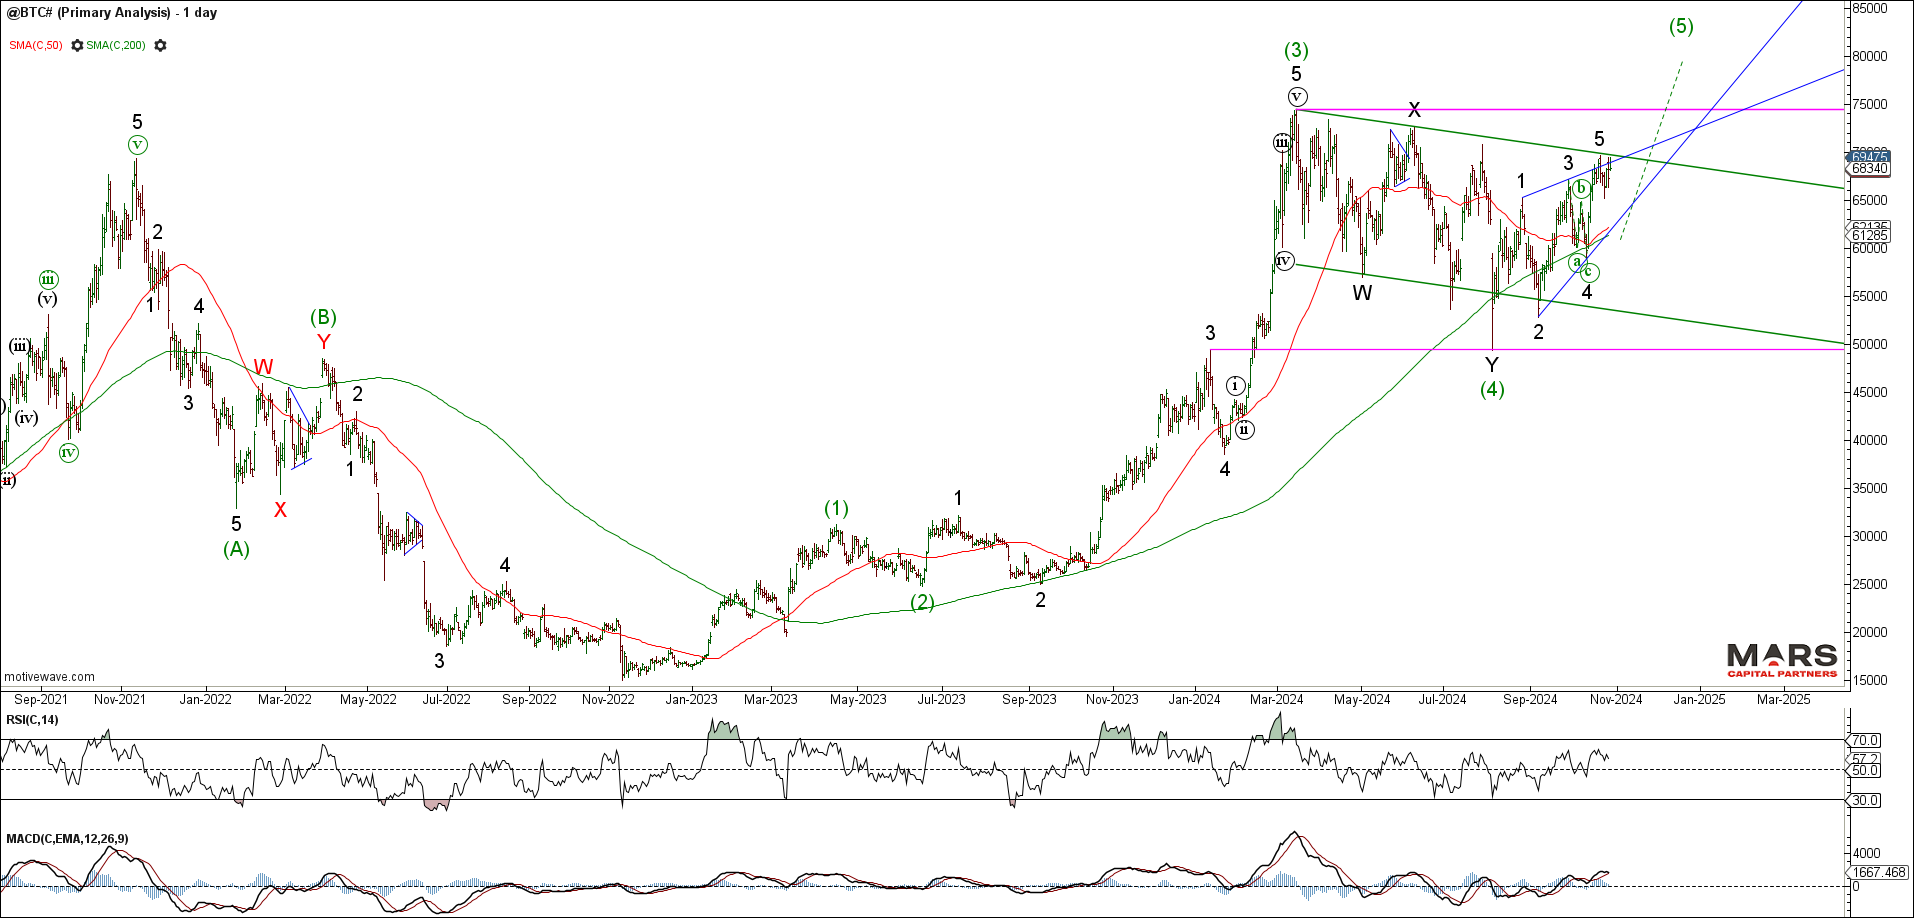
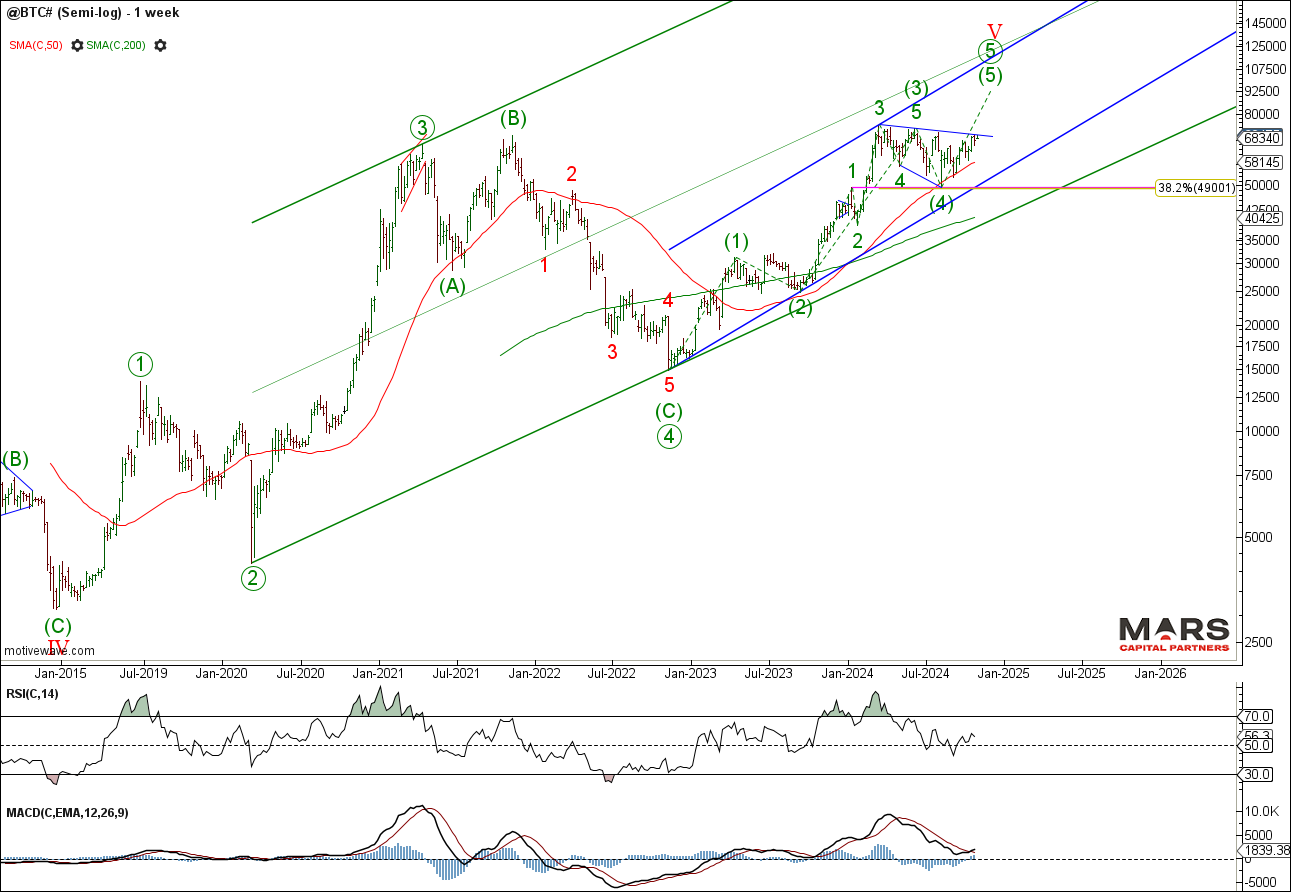
To the crypto markets and the Bitcoin rally appears corrective and reversed lower from near term trend resistance. A break back below 74400-75000 support opens the door to a much larger decline. Near term inflection as it remains trapped between near term support and resistance. The risk is that the long term rally is complete.
BTC Daily semi-logBTC Weekly semi-log
That’s all for now. Have a great week and trade safe 🙂
Last week, global equity indices started to diverge as the Nasdaq leaders pushed to marginal new highs while the DJIA and Russell reversed sharply lower, potentially setting up trend reversals. The Nasdaq and SPX declined correctively while holding near term support, keeping the door open for a continuation of the bull market trend. The fragmented markets and declining relative strength are warning of trend exhaustion so caveat emptor. The primary macro market trends remain intact with a stronger US$ and higher rates.
NB: This is a data heavy week with key equity earnings, payrolls and PCE inflation. Expect increased volatility as we get closer to the US election.
Equity Markets – Fragmented Markets
To the equity markets and the benchmark SPX / ES corrected lower last week but maintains a bullish bias while above breakout support in the 5723-5775 area. The decline from ATH’s appears corrective and likely a pause within the ongoing bull market rally while above the 50 day sma trend support. A strong break of near term support would warn of a break in the primary bull trend and threaten a larger decline.
ES H4ES Daily
The Nasdaq / NQ pushed to marginal new highs as it edges towards strong overhead resistance in the 21000 area. This is a key week with MSFT, META and AMZN all reporting earnings. The bull trend remains intact while above key trend support at the 50 day sma. Be careful chasing this rally into ATH resistance as the overlapping nature of the rally and bearish momentum divergence is warning of potential trend exhaustion. Wedging into the highs?
NQ DailyNQ H4
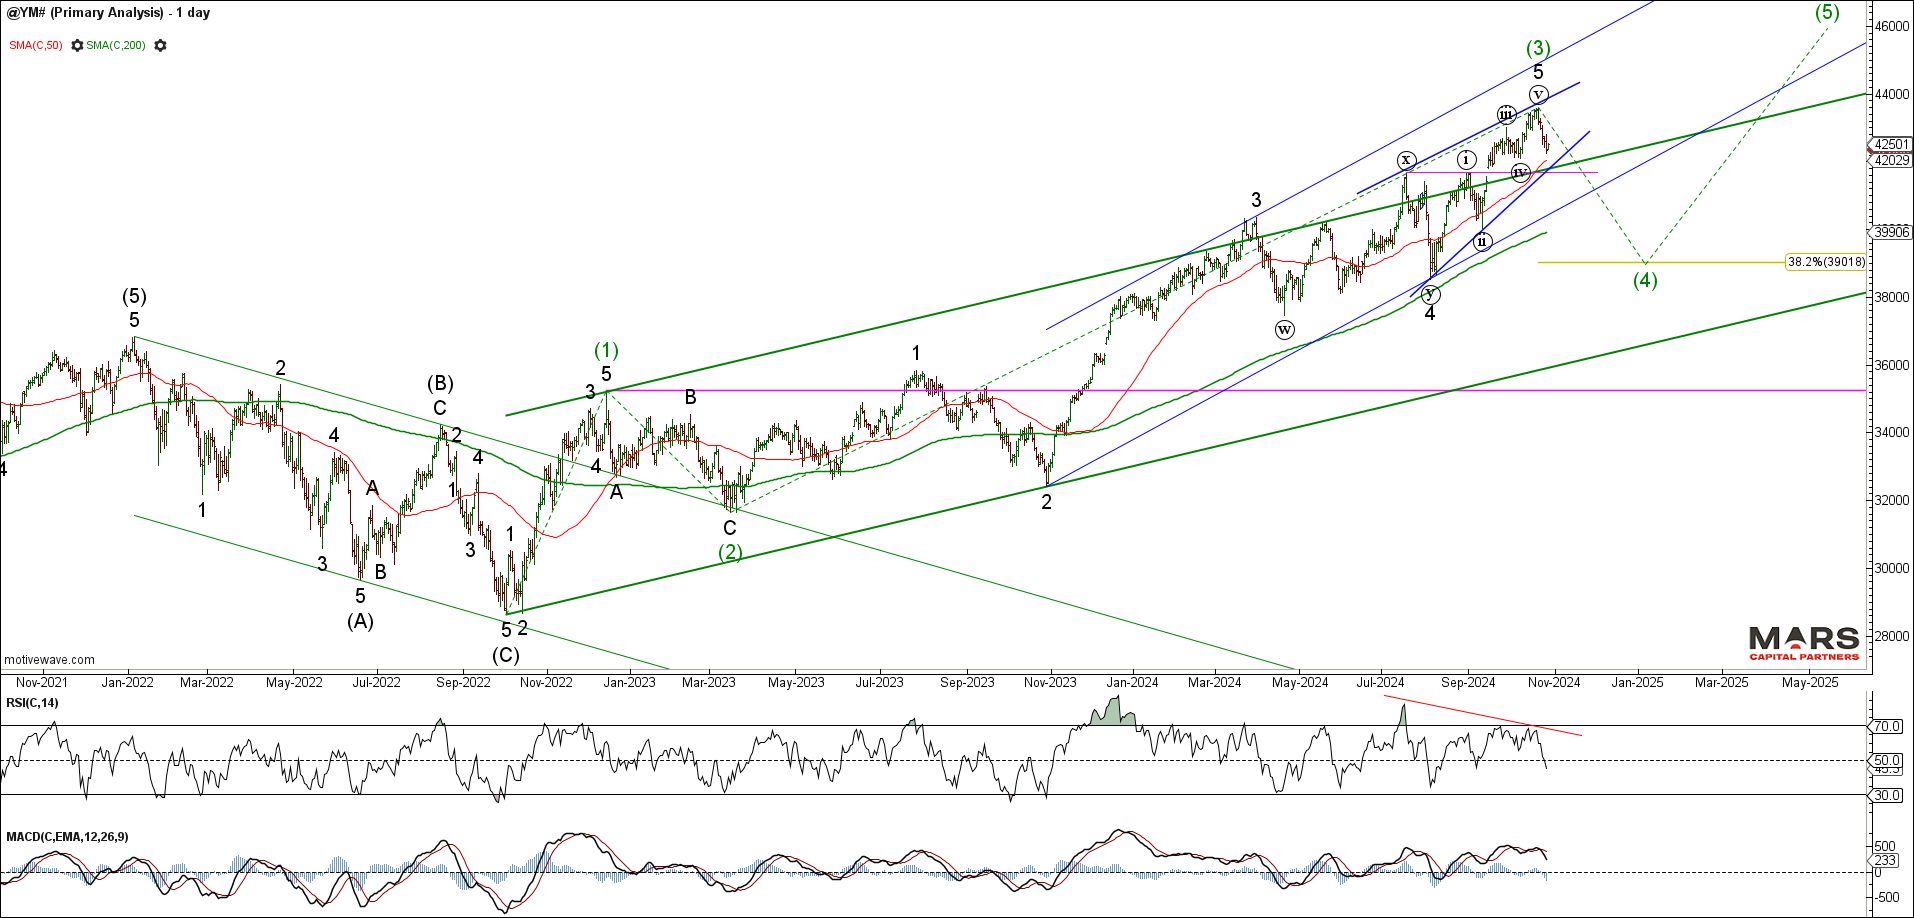
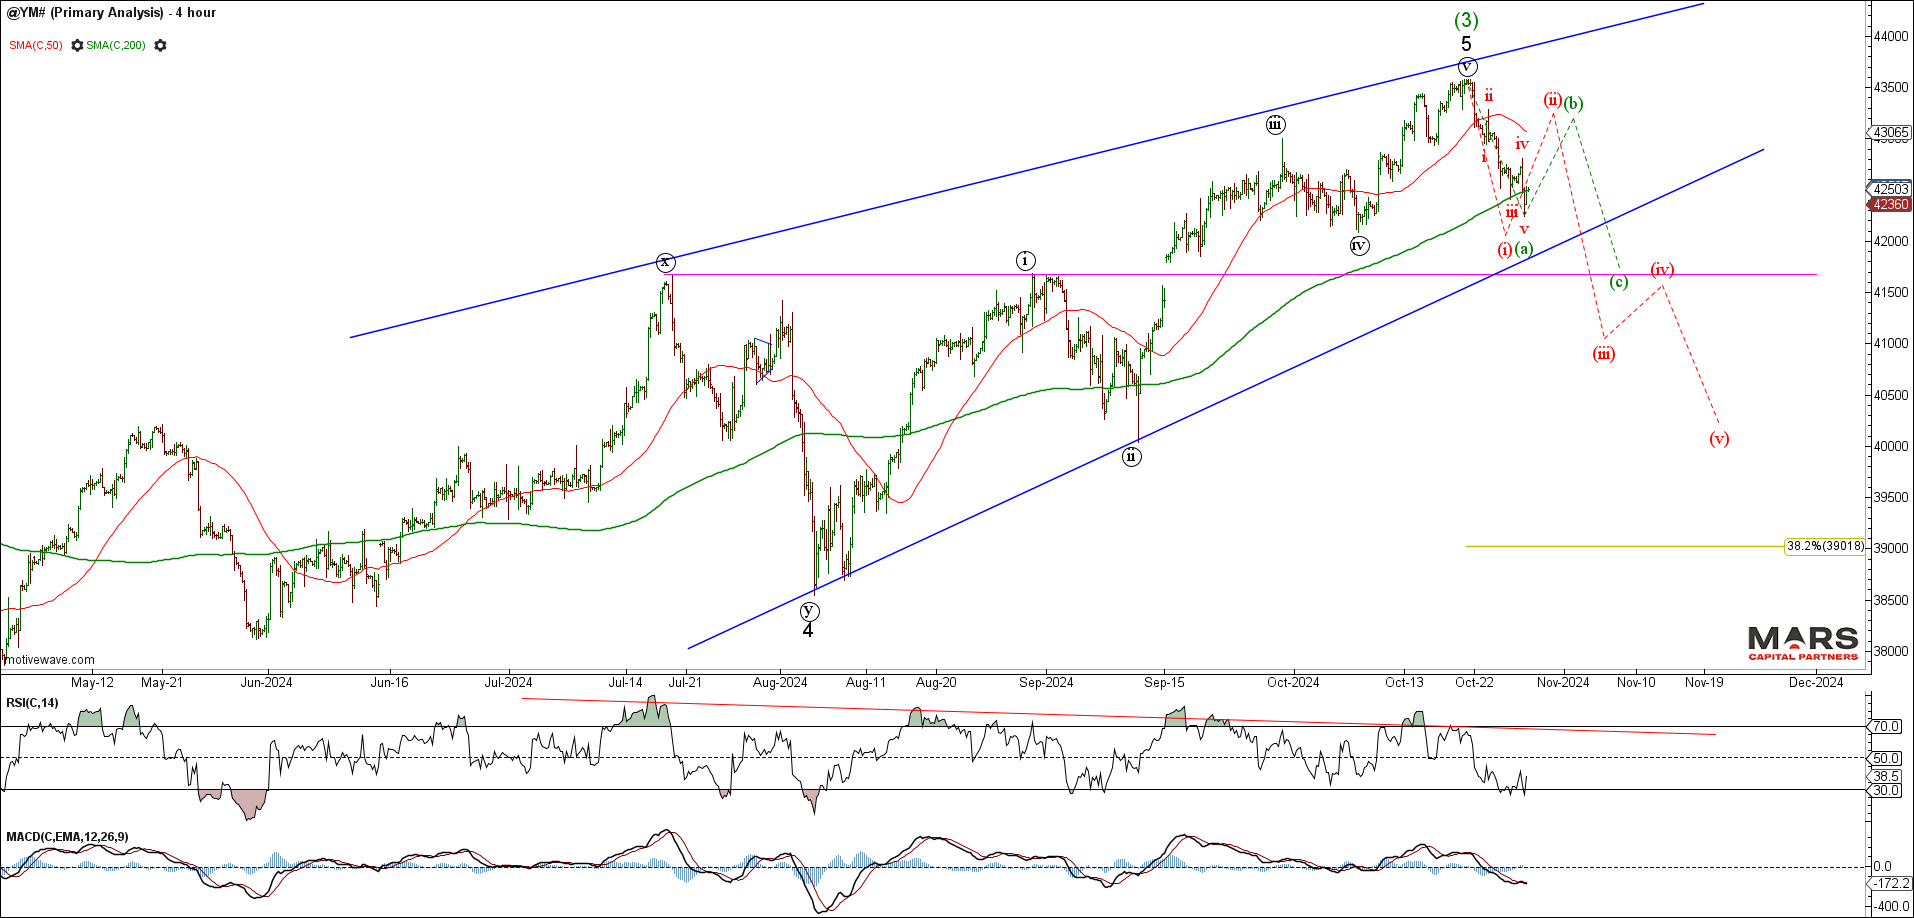
The DJIA / YM reversed sharply lower and is warning of a potential near term top. Bulls need to hold key near term support in the 41500-42000 area of the 50 day sma and recent breakout. A break of this support will open the door to further downside risk towards the 200 day sma. The impulsive nature of last week’s decline is a shot across the bow for equity risk.
YM DailyYM H4
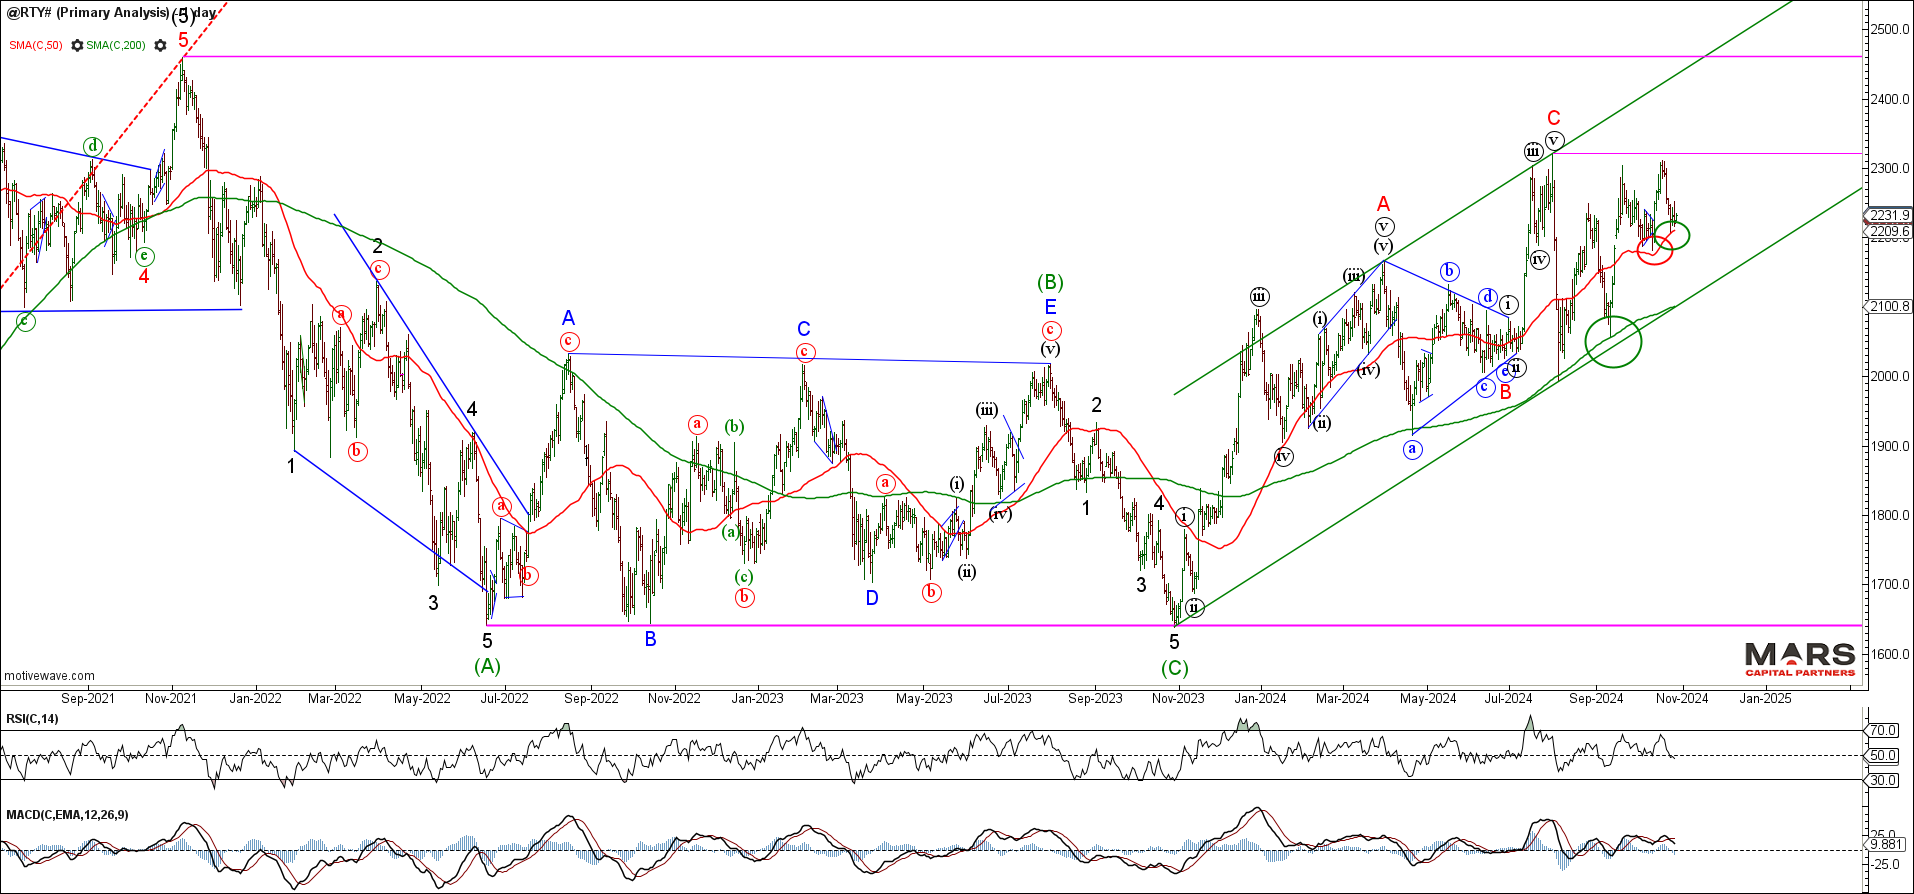
The Russell 2000 / RTY failed at overhead resistance and reversed sharply lower back towards the 50 day sma support. Last week’s bear reversal needs to break 50 day sma support to help confirm the potential for a larger decline. The RTY range remains bound by key overhead resistance at the 2320 highs and big picture trend support at the 200 day sma and trend support.
RTY Daily
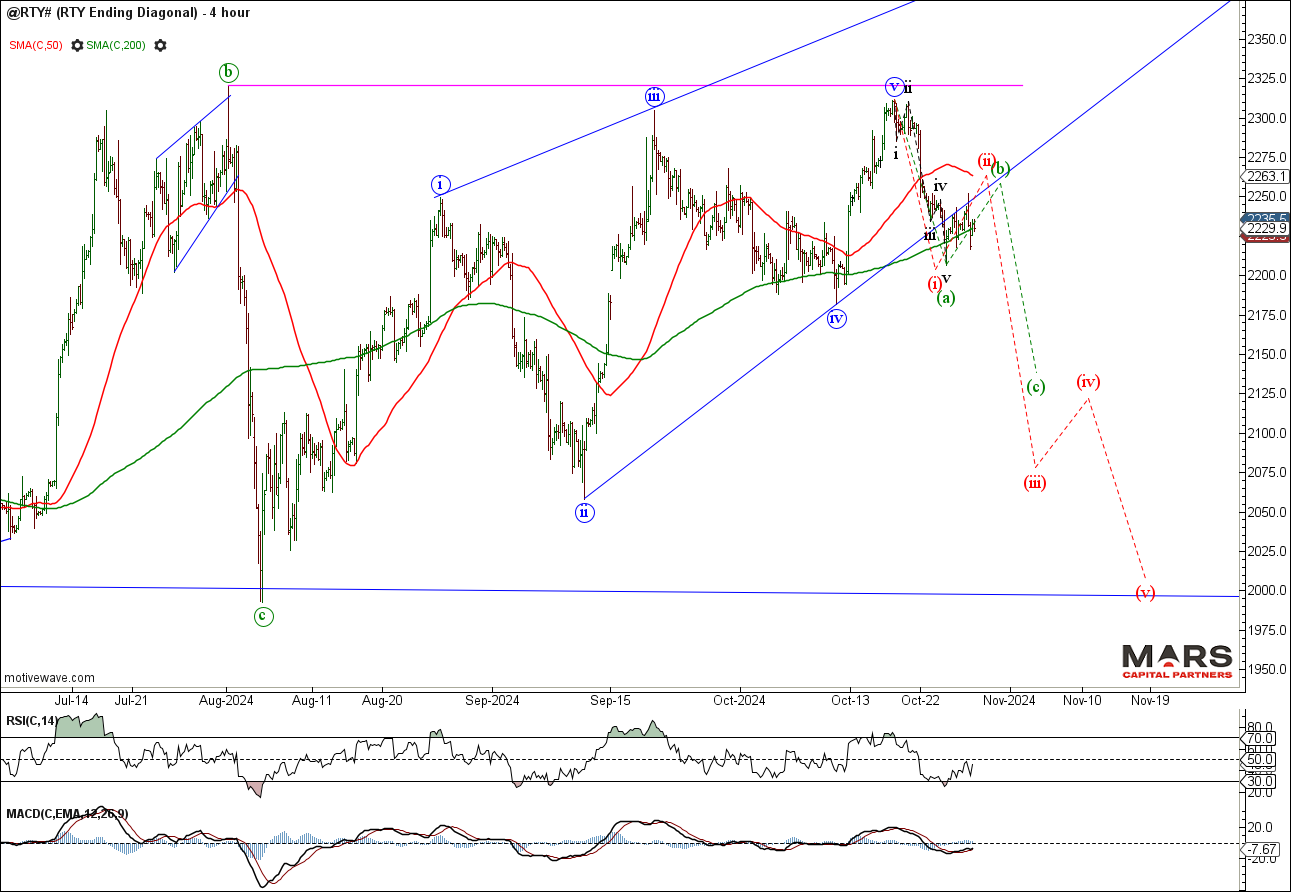
The near term Russell / RTY decline from recent highs appears impulsive and likely only part of a larger decline. Bears need to see downside follow through and break last week’s lows to set up a hard test of primary trend support at the 200 day sma.
RTY H4
The VIX / VX remains elevated as the pull / push of fragmented markets warn of potential trend exhaustion leading into the US election. Ideally, we’d like to see a final push higher in the SPX and Nasdaq leading to a near term decline in the VIX. Given the data heavy week and impact of the US election the potential remains for the VIX to remain elevated.
VX Daily
Bond Markets – Rates continue to rise
To the bond markets and the US30yr / ZB extended lower for a retest of trend support. While there is no confirmation of a tradable low, we are wary of the extended nature of this decline and bullish momentum divergence. Trade above last week’s high would warn of a near term low and counter-trend rally towards the 50 day sma resistance. Our big picture targets remain lower for at least a hard test of the 2023 lows.
ZB DailyZB H4
The US10yr / TY also extended lower as expected but the downside momentum is waning. While we remain bearish from a big picture perspective, there is increasing risk of a tradable low that sets up a counter-trend rally. Beware chasing bonds into the lows of this extended decline as bullish momentum divergence continues to build.
TY DailyTY H4
The US5yr / FV also extended lower as expected but bullish momentum divergence is starting to build at the recent lows. While there is no confirmation of a tradable low we are wary of chasing the near term decline into 200 day sma support. Trade above last week’s high likely triggers a counter-trend rally that targets the 50 day sma and sets up the next decline.
FV DailyFV H4
FX Markets – DXY rally extends
To the FX markets and the US$ continued to rally across the board. The DXY extended higher as it pressed towards upside targets in the 107.50 area. The question is whether it rallies directly towards upside targets or subdivides higher in 5 waves. We continue to see this rally as part of a counter-trend consolidation before the bigger picture bear trend reassirts itself.
DXY Daily
The Euro extended its decline for a hard test of trend support with no confirmation (yet) of a tradable low. Big picture downside targets remain lower towards the 1.04 area for this corrective decline. We continue to see the price action from the July 2023 highs as a consolidation before the next bull market rally in the Euro. The question is whether the decline extends immediately lower or subdivides into 5 waves down (blue count)?
EURUSD Daily
The USDJPY failed to reverse from our 151-53 resistance area and instead continued to rally strongly. The strength of the rally warns of a short squeeze and more potentially bullish outcomes. If in doubt stay out until we see confirmation of a bearish reversal (ideally back below the 200 day sma).
USDJPY Daily
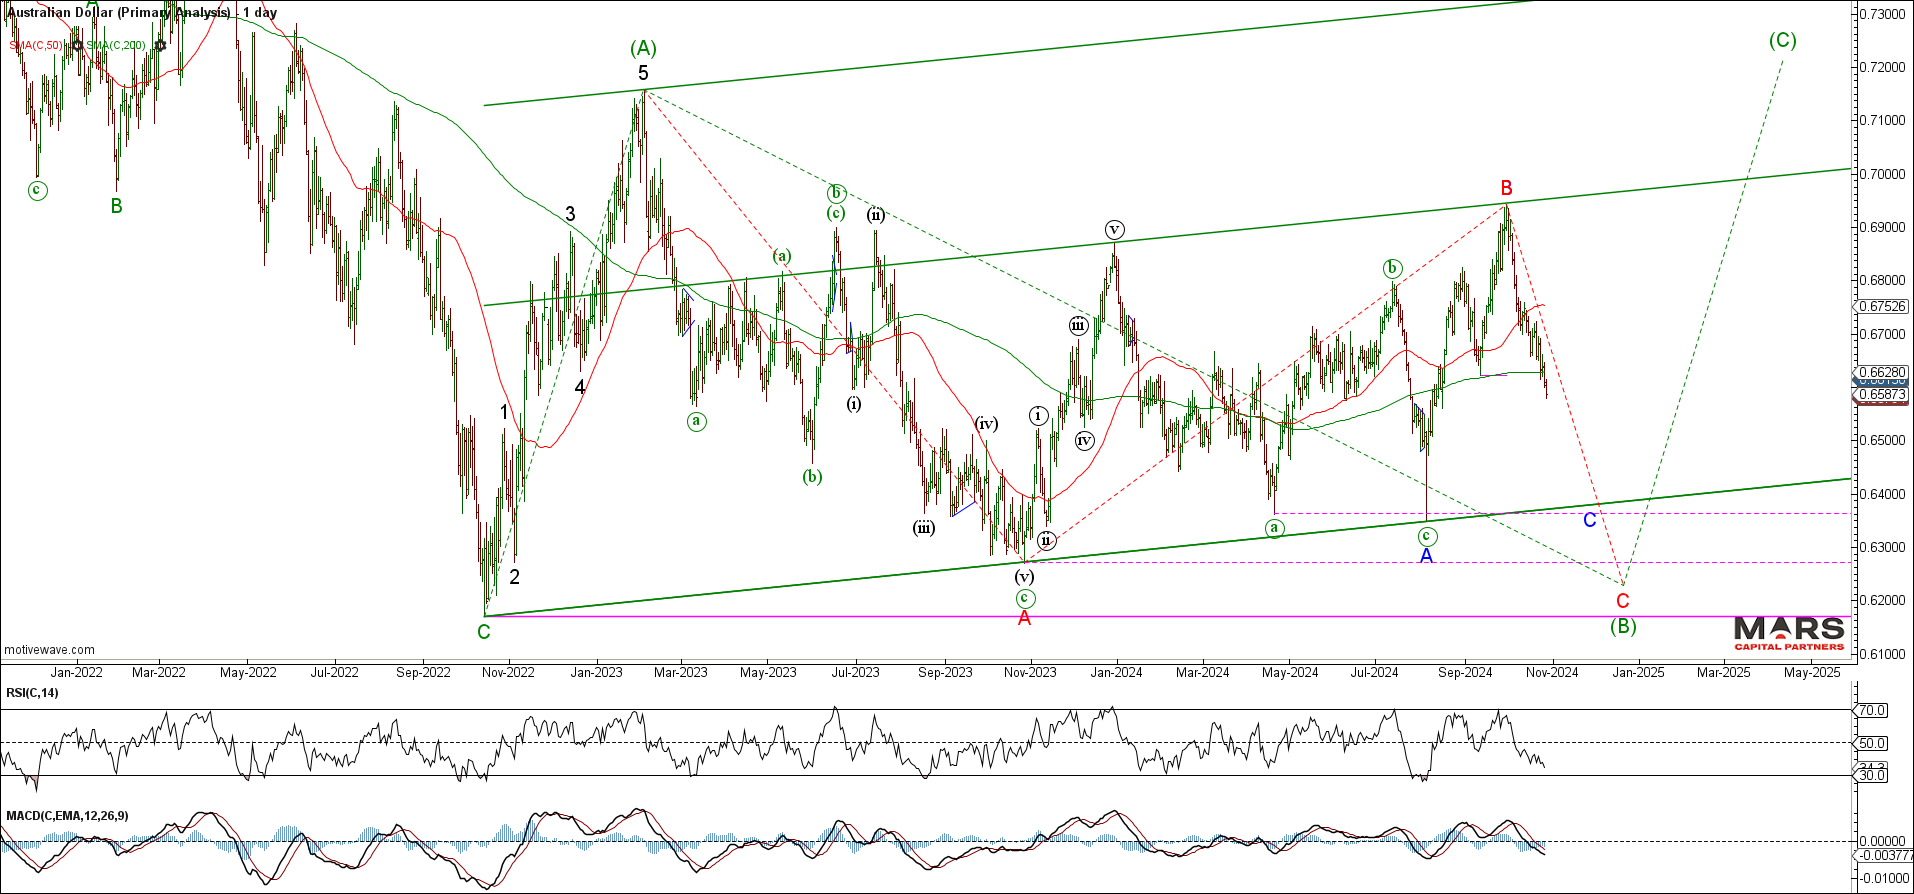
The Aussie$ continued to extend lower as we look for a hard test of trend support and potentially major swing lows in the 0.6170 area. No edge in the middle of the range here as we look for stronger support at lower levels. The bears remain in control until proven otherwise.
AUDUSD Daily
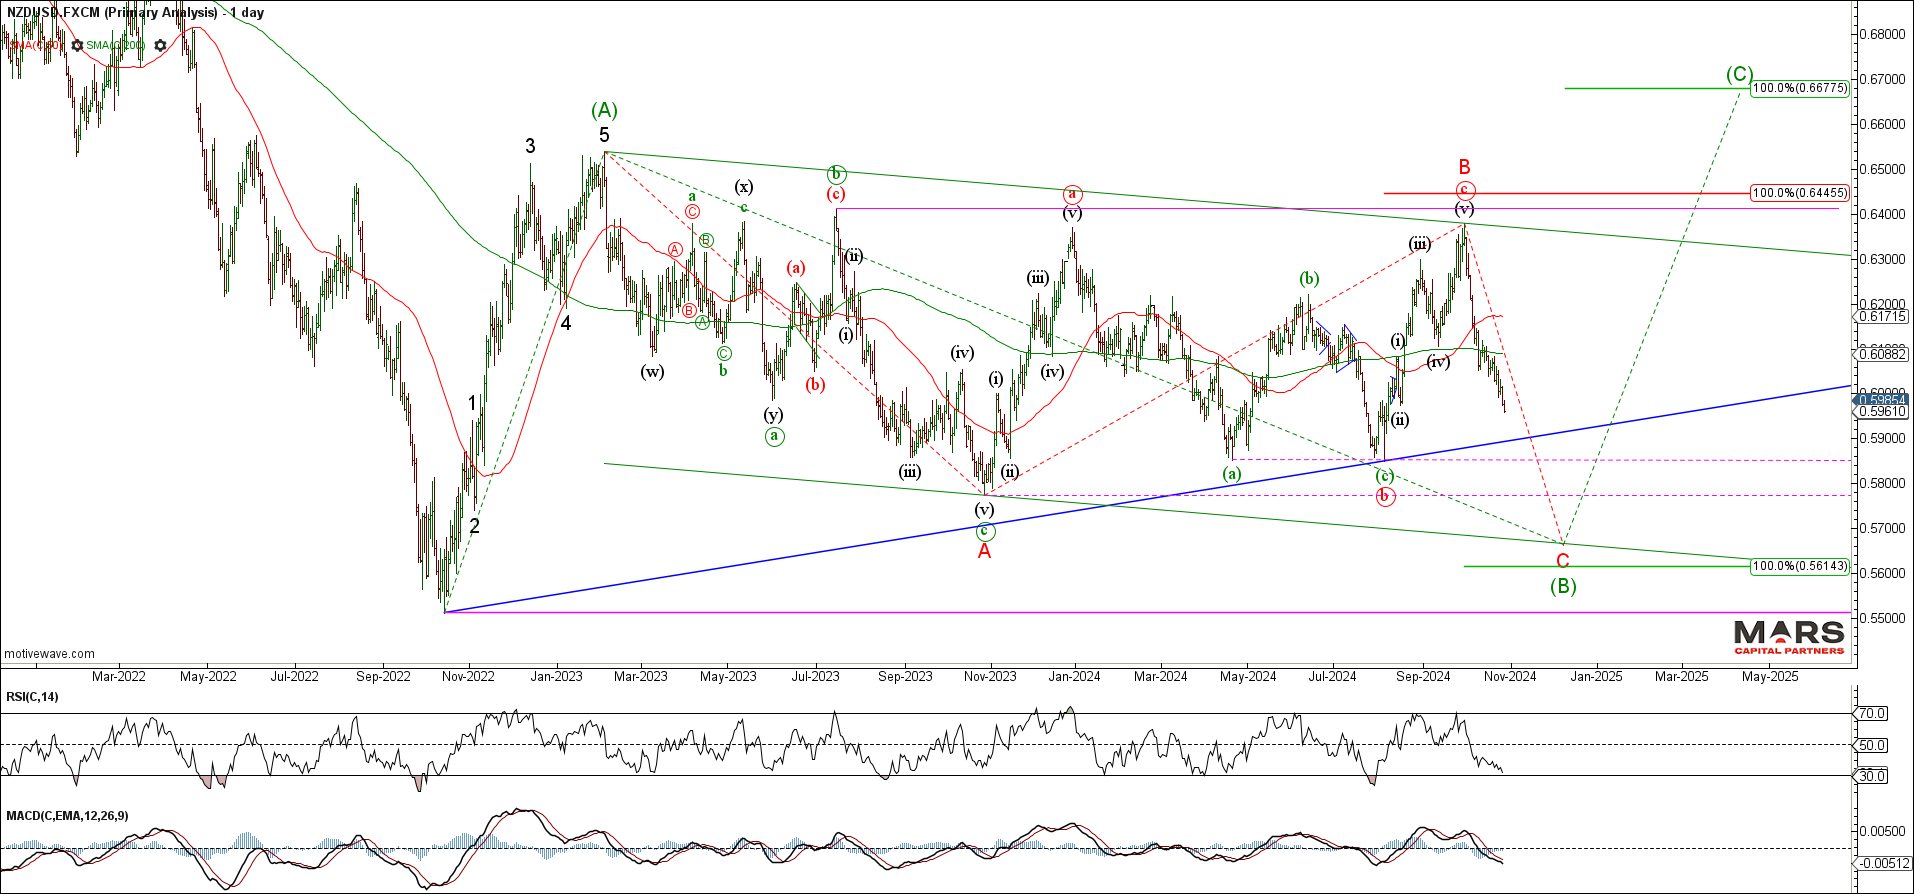
The Kiwi$ continued to extend lower as we look for a hard test of trend support and towards measured downside targets in the 0.56 area and potentially much lower. There is no evidence of a tradable low as it approaches layered support in the 0.58-0.5850 area.
NZDUSD Daily
Commodity Markets – PM’s exhausting?
To the commodity markets and the indutrial commodities continue to lag as PM’s appear to be exhausting to the upside. Crude Oil continues to stair step lower after a counter-trend rally and is once again testing big picture support. We do not have a clear count for CL given the range racing but the inability to hold a rally warns of more downside risks. Bulls need to hold measured support in the 60-62 area or risk a much larger decline.
CL WeeklyCL Daily
Dr Copper continues to hold near term support but would look best with a final thrust lower to help confirm the bigger picture bear trend. We continue to see corrective declines and corrective rallies in this range bound market. A push to marginal new lows below 4.28 support while below the 4.50 resistance would help set up a bigger picture decline over the next couple of weeks.
HG DailyHG H4
To the PM’s and Gold continues to subdivide higher with no confirmation of a tradable top as we look for upside trend exhaustion. We continue to respect the bigger picture bull market trend as the series of higher highs and higher lows continues. We are alert to the potential for a reversal as bearish momentum divergence continues to build.
Gold DailyGold H4
Silver pushed to marginal new highs before fading later in the week. While there is no confirmation yet of a tradable top, there is a risk of trend exhaustion at overhead trend resistance. Bulls remain in control while breakout support holds in the 32.50 area.
Silver Daily
Silver bulls chasing the breakout.
Crypto Markets – Testing resistance
To the crypto markets and Bitcoin continues to test overhead trend resistance for what appears to be a bull flag. While the structure of the rally is unclear, the declines appear corrective within an ongoing bull market trend. Bulls need to break up and out of this trend resistance for a strong rally through new ATH’s. Near term trend support remains at the 50 / 200 day sma as we look for a break higher.
BTC DailyBTC Weekly semi-log
That’s all for now. Have a great week and trade safe 🙂
It’s time for our mid-year review to update and augment our outlook for the second half of 2021. This follows on from our year ahead review posted on January 4th (see here). Our key stagflation themes and outlook remain unchanged…
“As we head into 2021 with the tailwinds of historic fiscal and monetary stimulus coupled with a speculative “Tulip” mania (see Bitcoin, SPAC, Robinhood, etc) it is important to take note of WHERE we are in the cycle. We are nearing the very end of a super-cycle degree equity market rally.
What if we see global stagflation? Then we should expect to see a continued strong rally in commodities that will likely lead to a sharp reversal in rates, pressuring the CB’s to reverse the QE course, cost push pressures negatively impacting corporate earnings at a time when balance sheets are impaired with historically high debt levels. The result – rallying commodities, strong commodity currencies, sharply rising rates and bearish equities.“
Key Themes:
Equities remain in extended 5th waves as we look for a super-cycle top
VIX is providing the opportunity for long term portfolio insurance
Rates remain pinned by CB’s with no confirmation of a bigger picture change in trend
The DXY continues to hold important support and is threatening to break higher
Commodities remain in big picture bull markets but are at risk of near term exhaustion
Gold remains within a larger corrective decline
Equities completing a super-cycle top
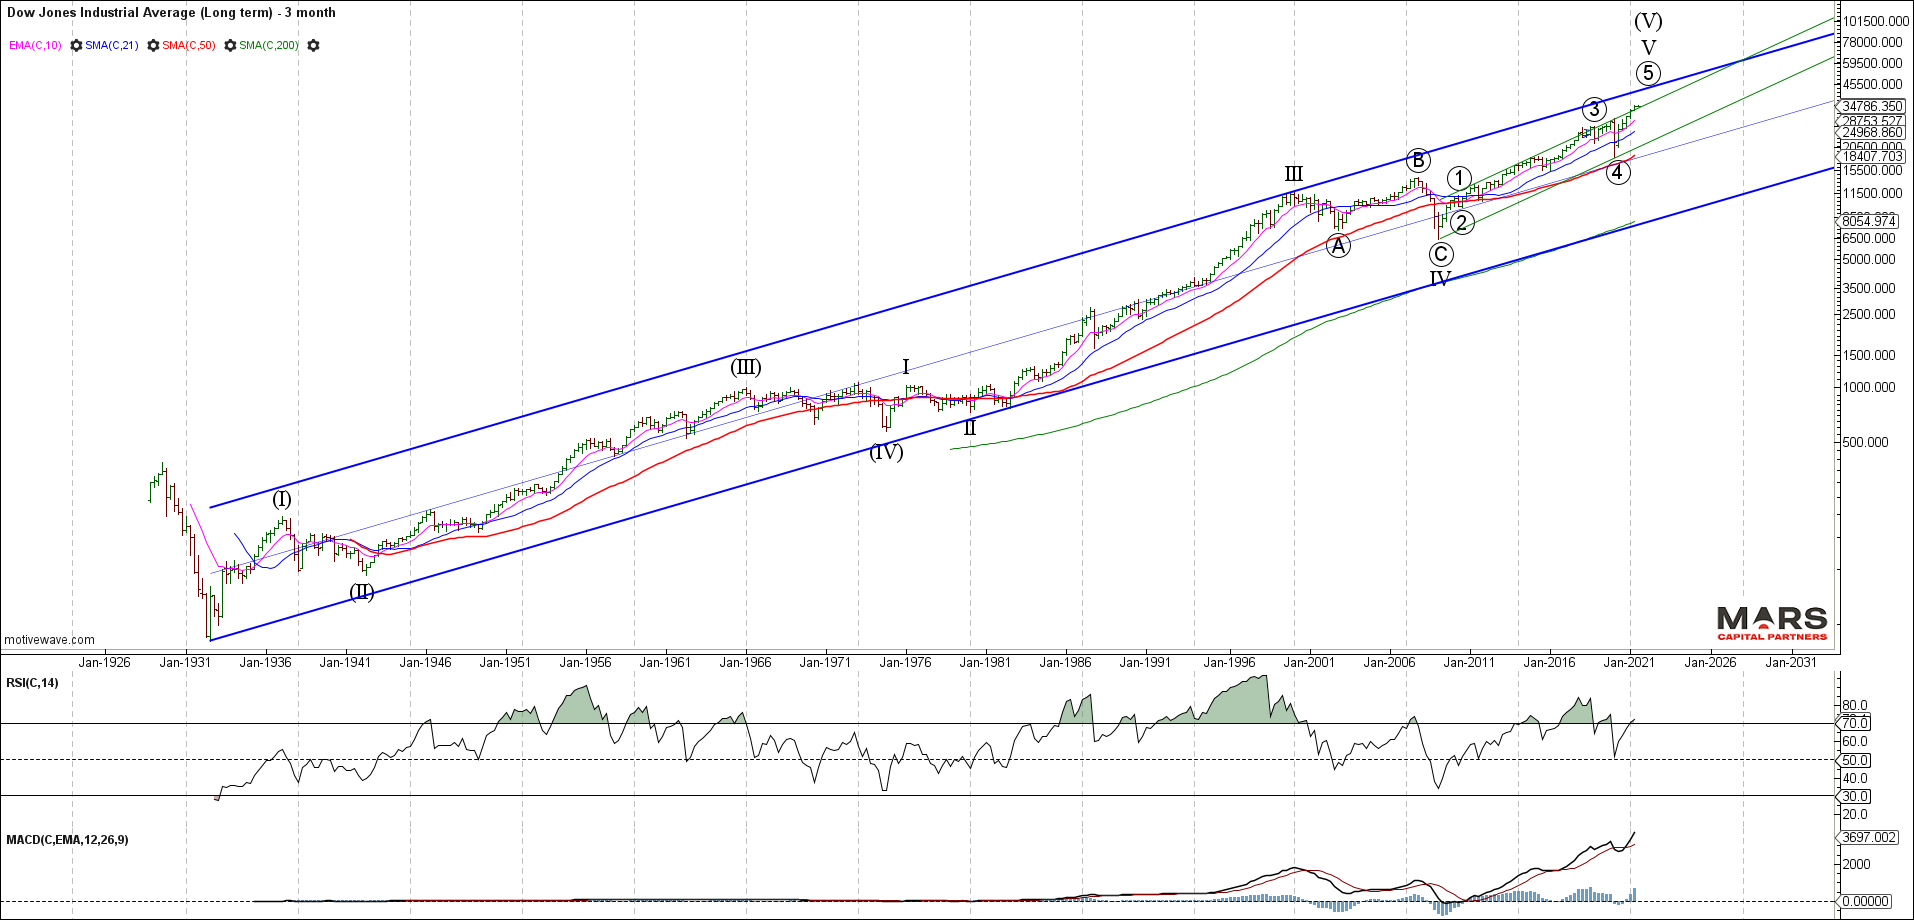
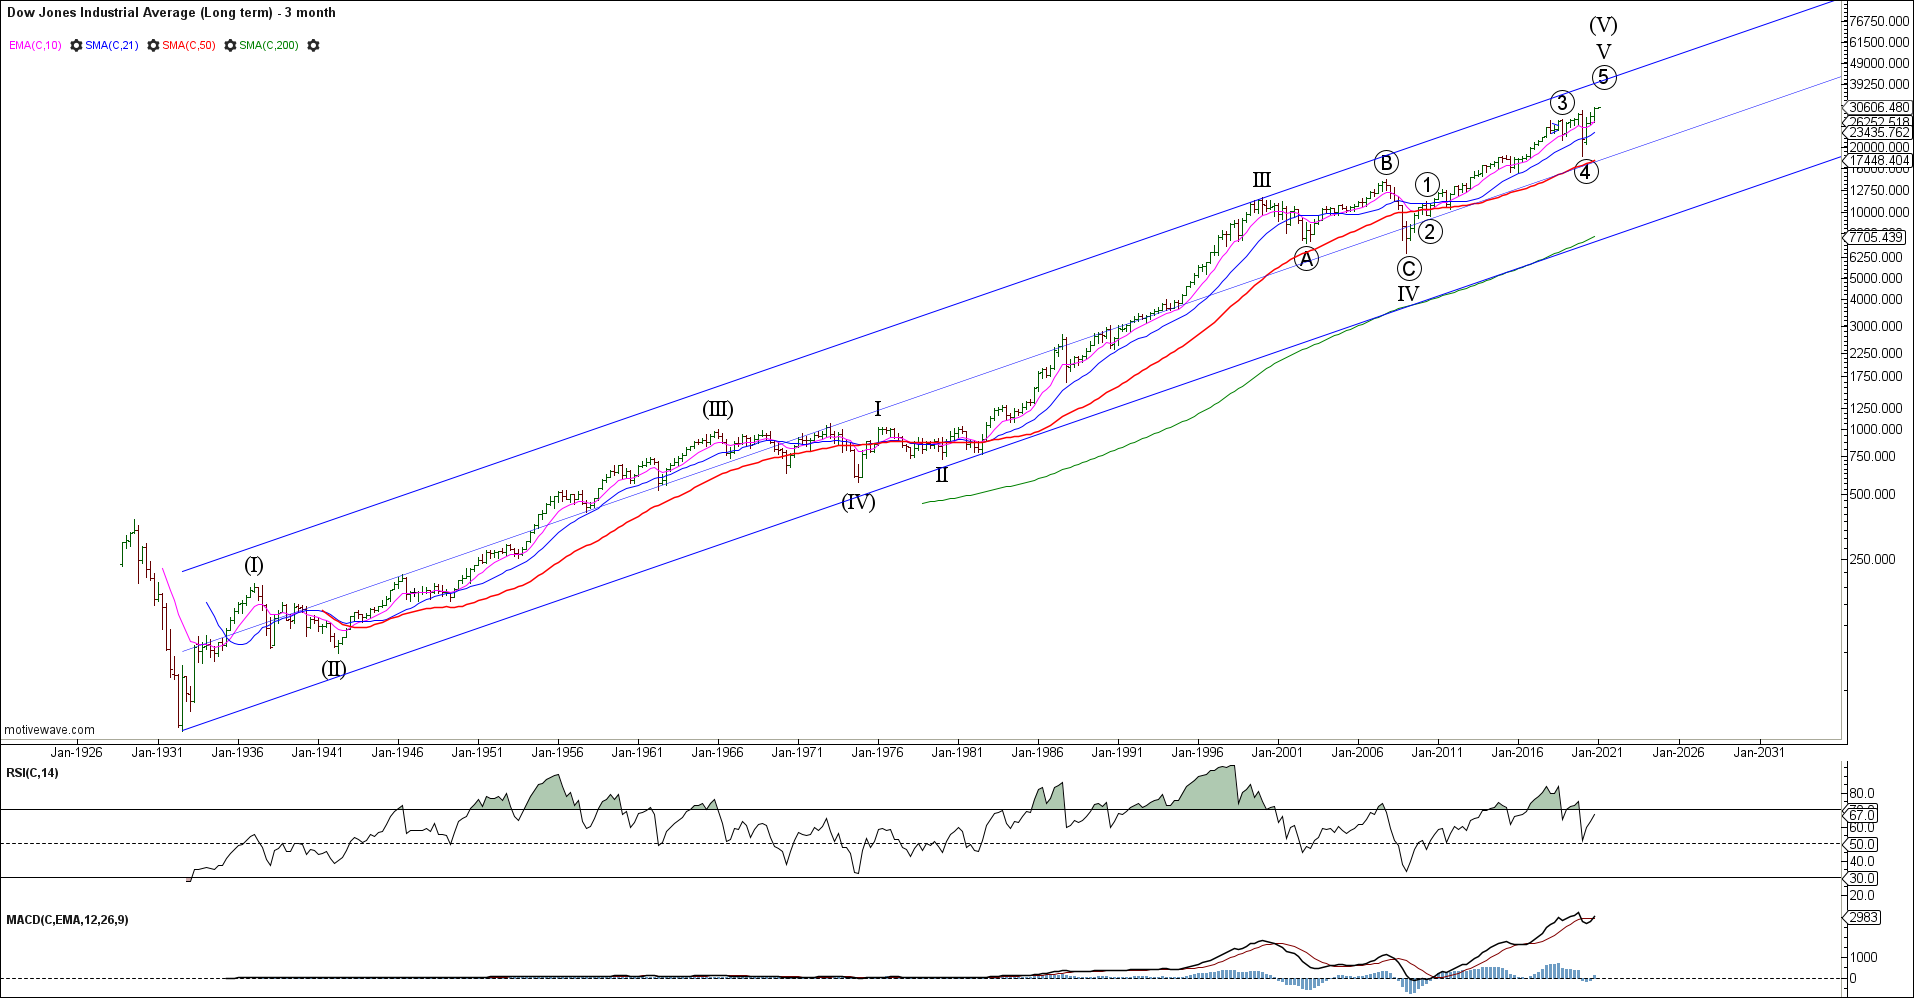
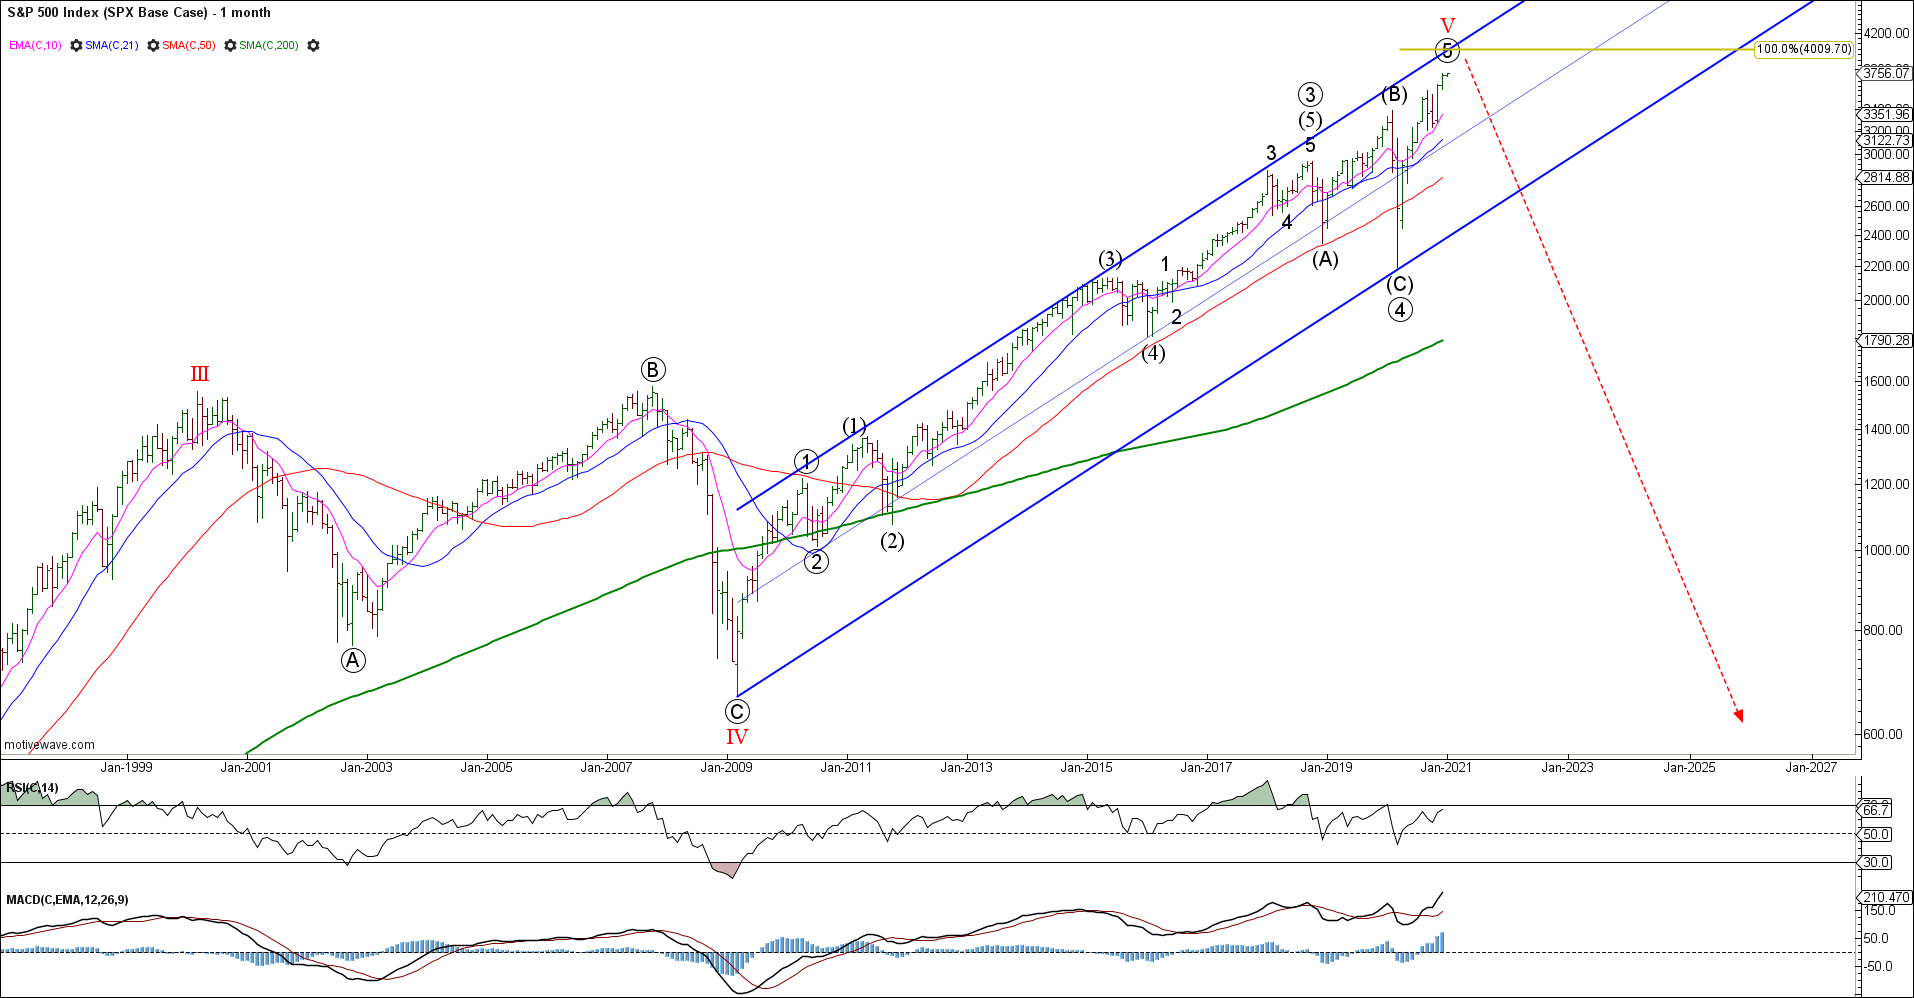
Wave 5 of V of (V) continues to extend in 2021 with no evidence of trend exhaustion or a tradable top. Speculative debt fuelled bubbles will continue until hope fades and with retail traders now fully on board, we are nearing the end of this super-cycle degree trend.
DJIA Quarterly semi-log
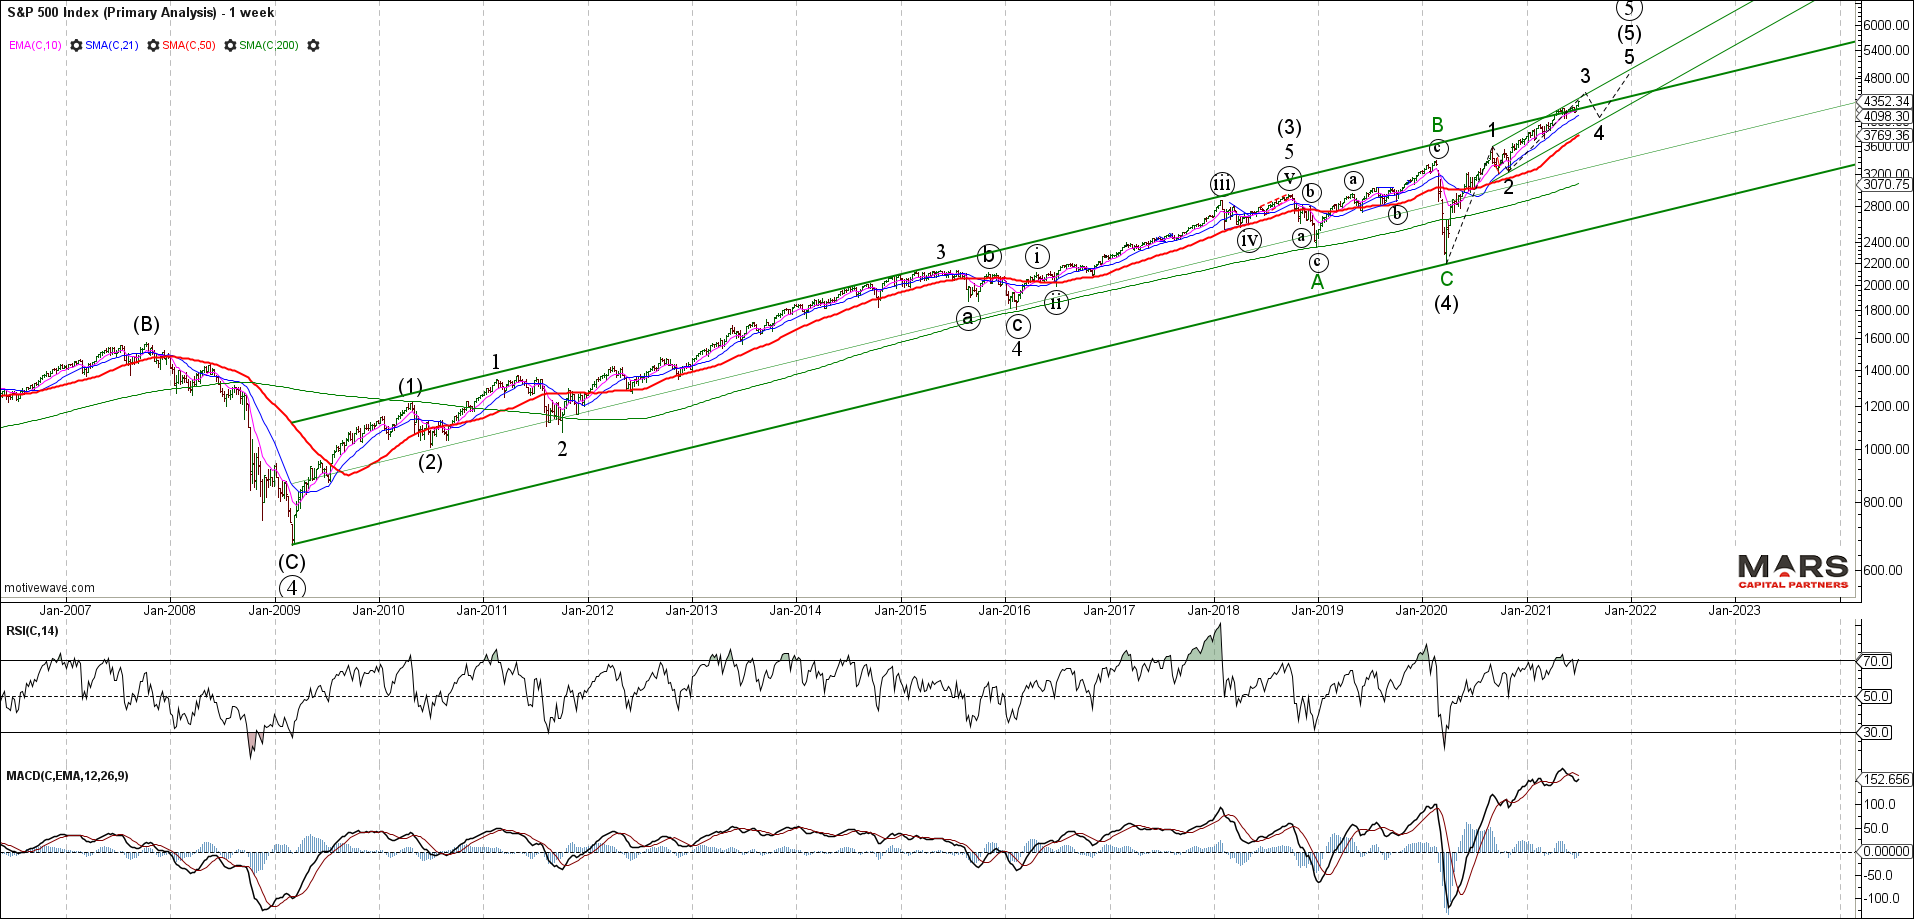
The SPX continues to impulse higher in what we expect to be an ending wave 5 of V of super-cycle degree. Wave (5) has pushed through initial measured equality targets and continues to subdivide higher with no evidence of weakness. The bulls remain in control until proven otherwise – the question for the 2nd half of the year is whether we are completing wave 3 of (5) or all of (5)? The bull count shows we are in wave 3 of (5) with a final cycle peak not due until the end of the year. We will continue to monitor the progress of this bull market until we have a reason to fight it.
SPX Weekly semi-log
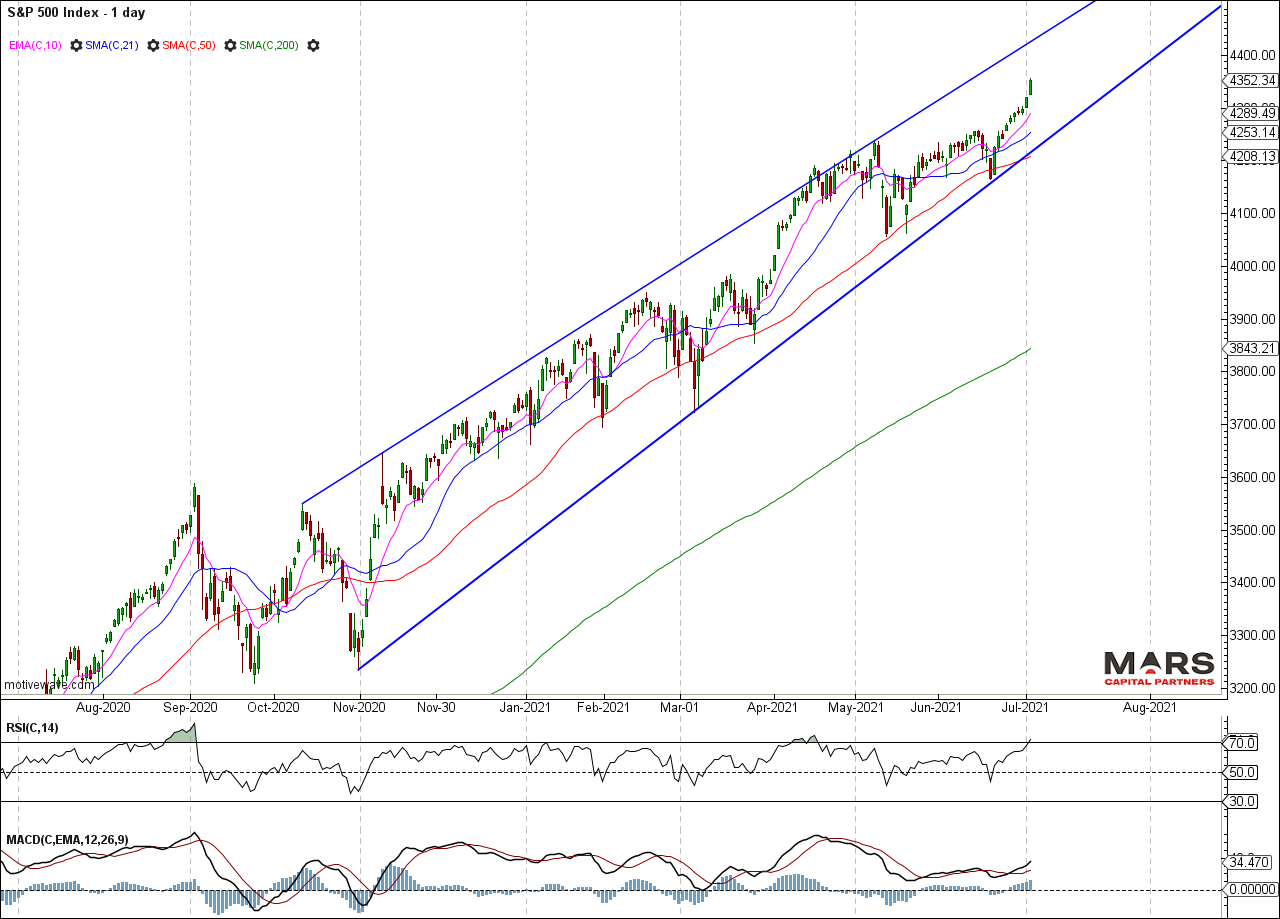
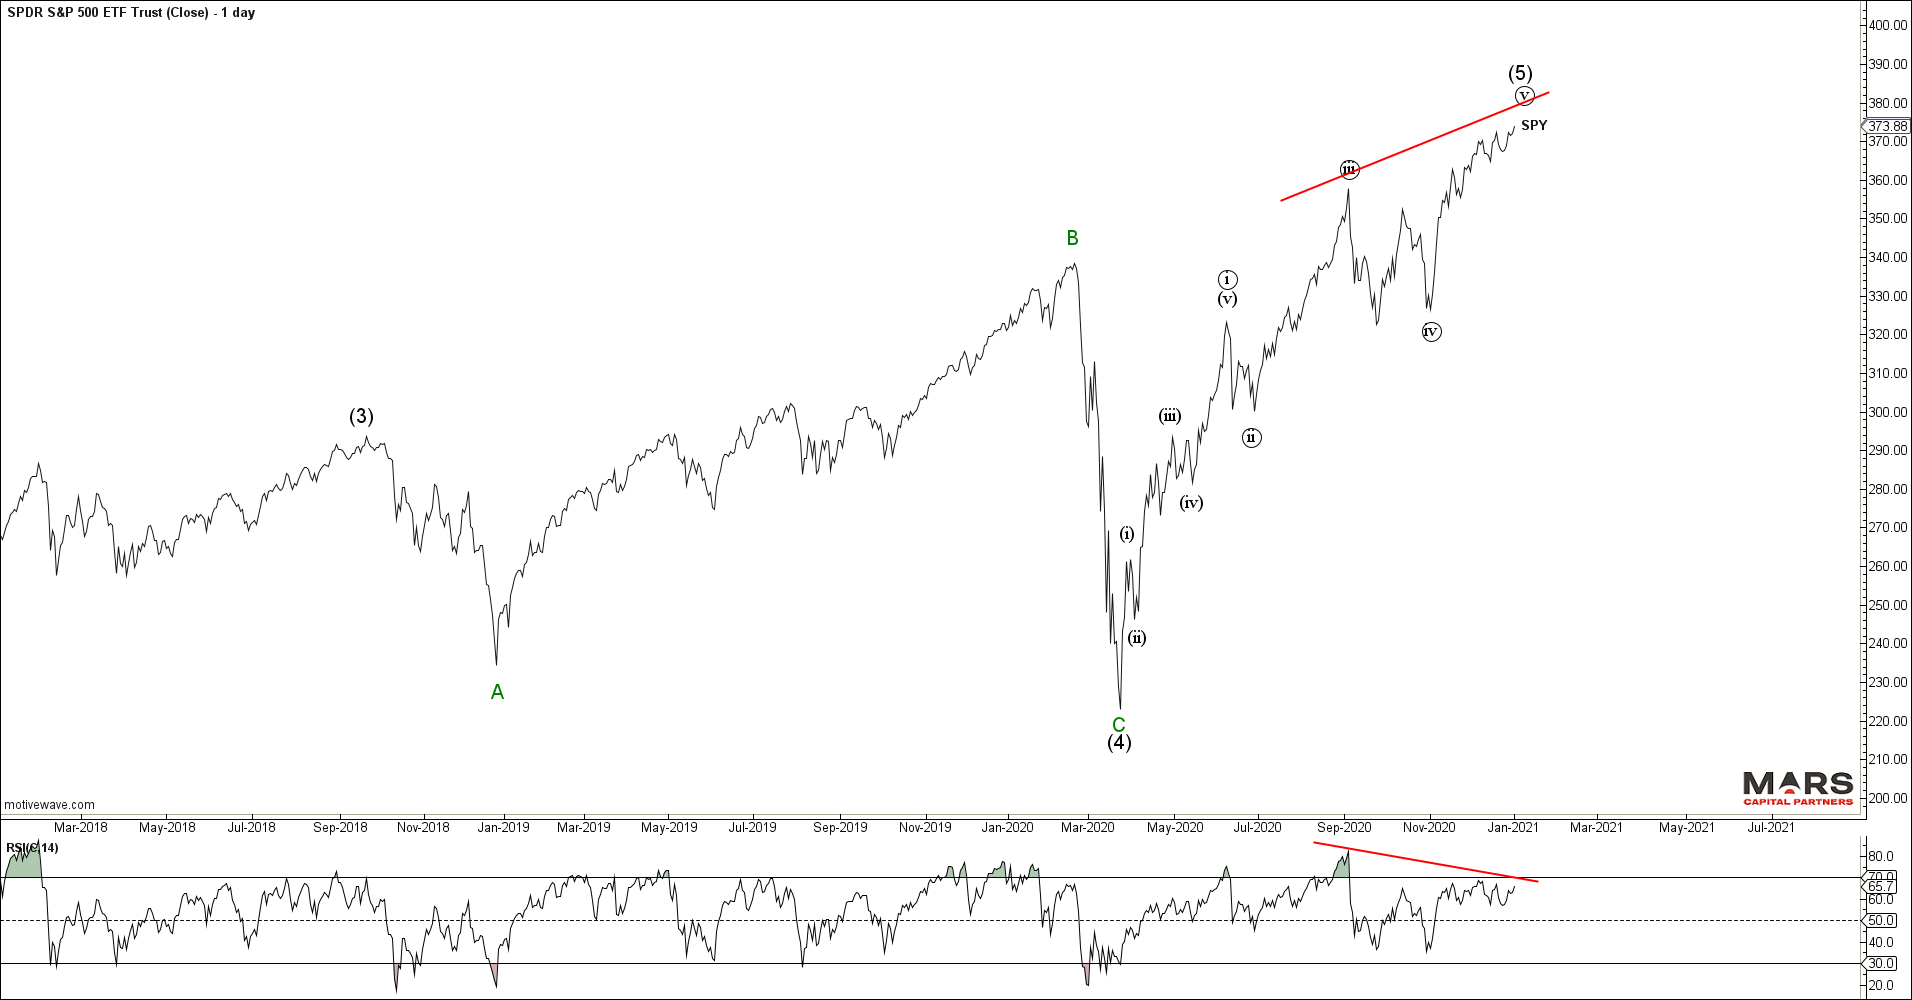
The Daily SPX cash chart highlights the near term trend supporting this bull market. Note of particular interest the rising blue trend line from the November 2020 lows and 50 day sma support. The recent rally has broken up and away from support in either a 5th wave blow-off or 3rd wave trend continuation. The bulls remain in control until this trend support breaks. We will remain vigilant in trying to identify any evidence of a change in trend. In the meantime, the trend is your friend until it bends.
SPX Daily
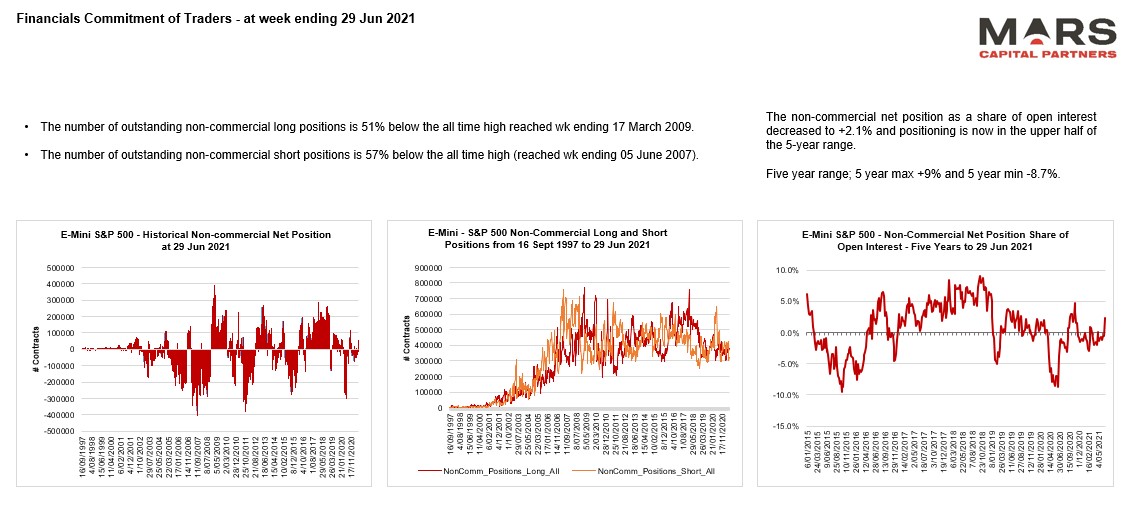
ES trading remains muted and only slightly net long. All the institutional and retail activity appears to be in physical stocks.
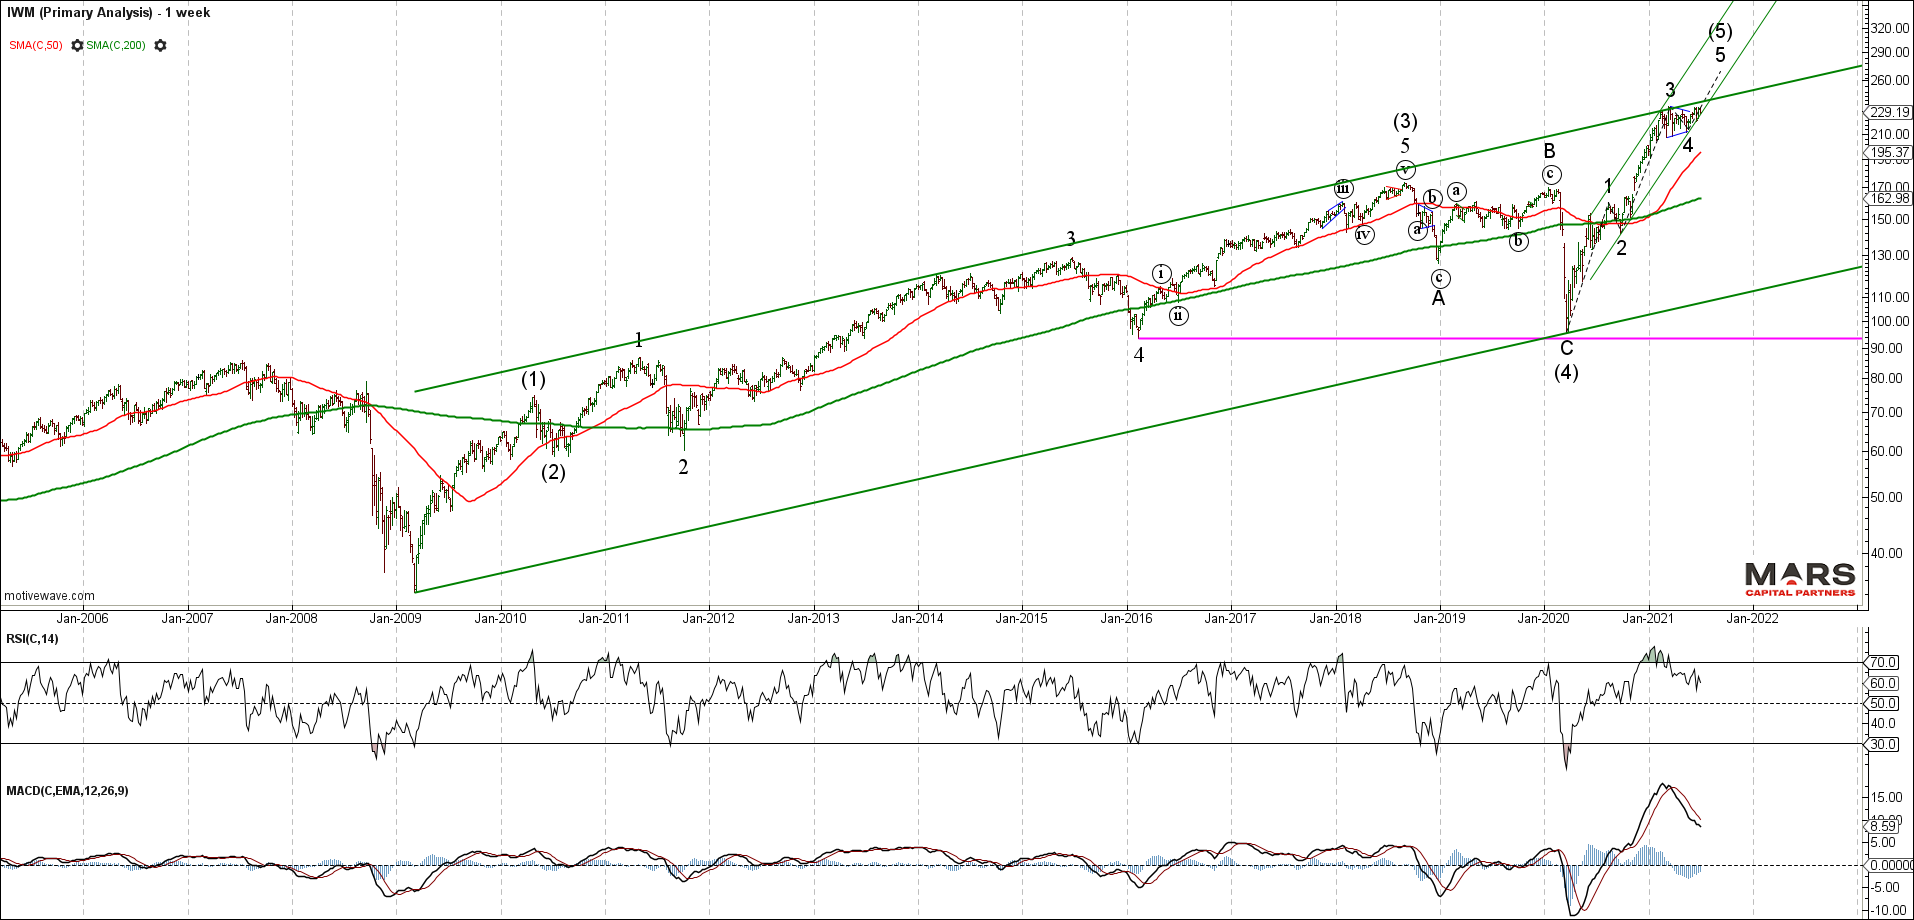
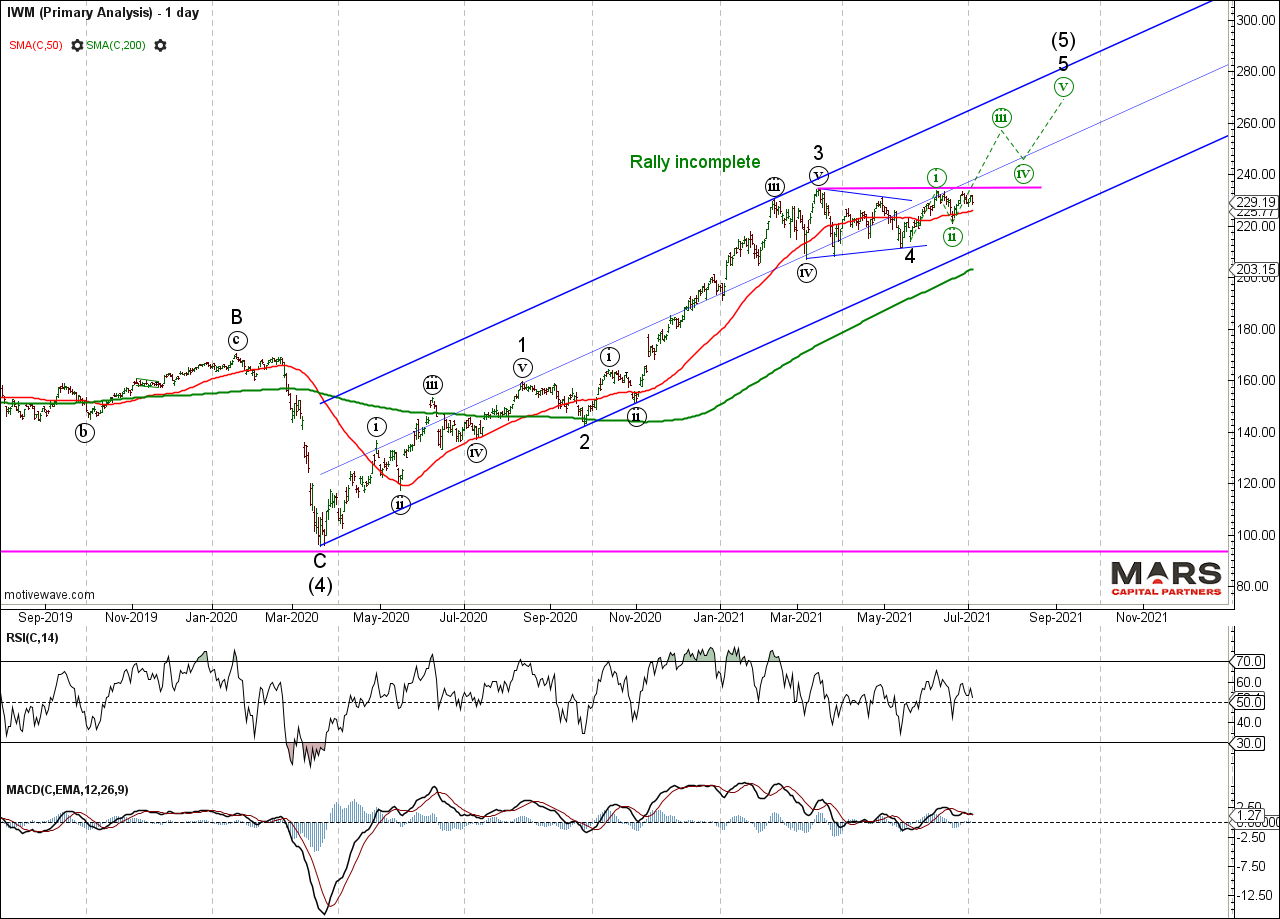
The Russell 2000 continues to provide the clearest wave structure with 3 waves up from the March 2020 lows. This structure still requires a 5th wave higher to new ATH’s to help complete wave 5 of (5) of V. Until the Russell makes its final push to new ATH’s, it will be premature to call an end to the bull market.
IWM Weekly semi-log
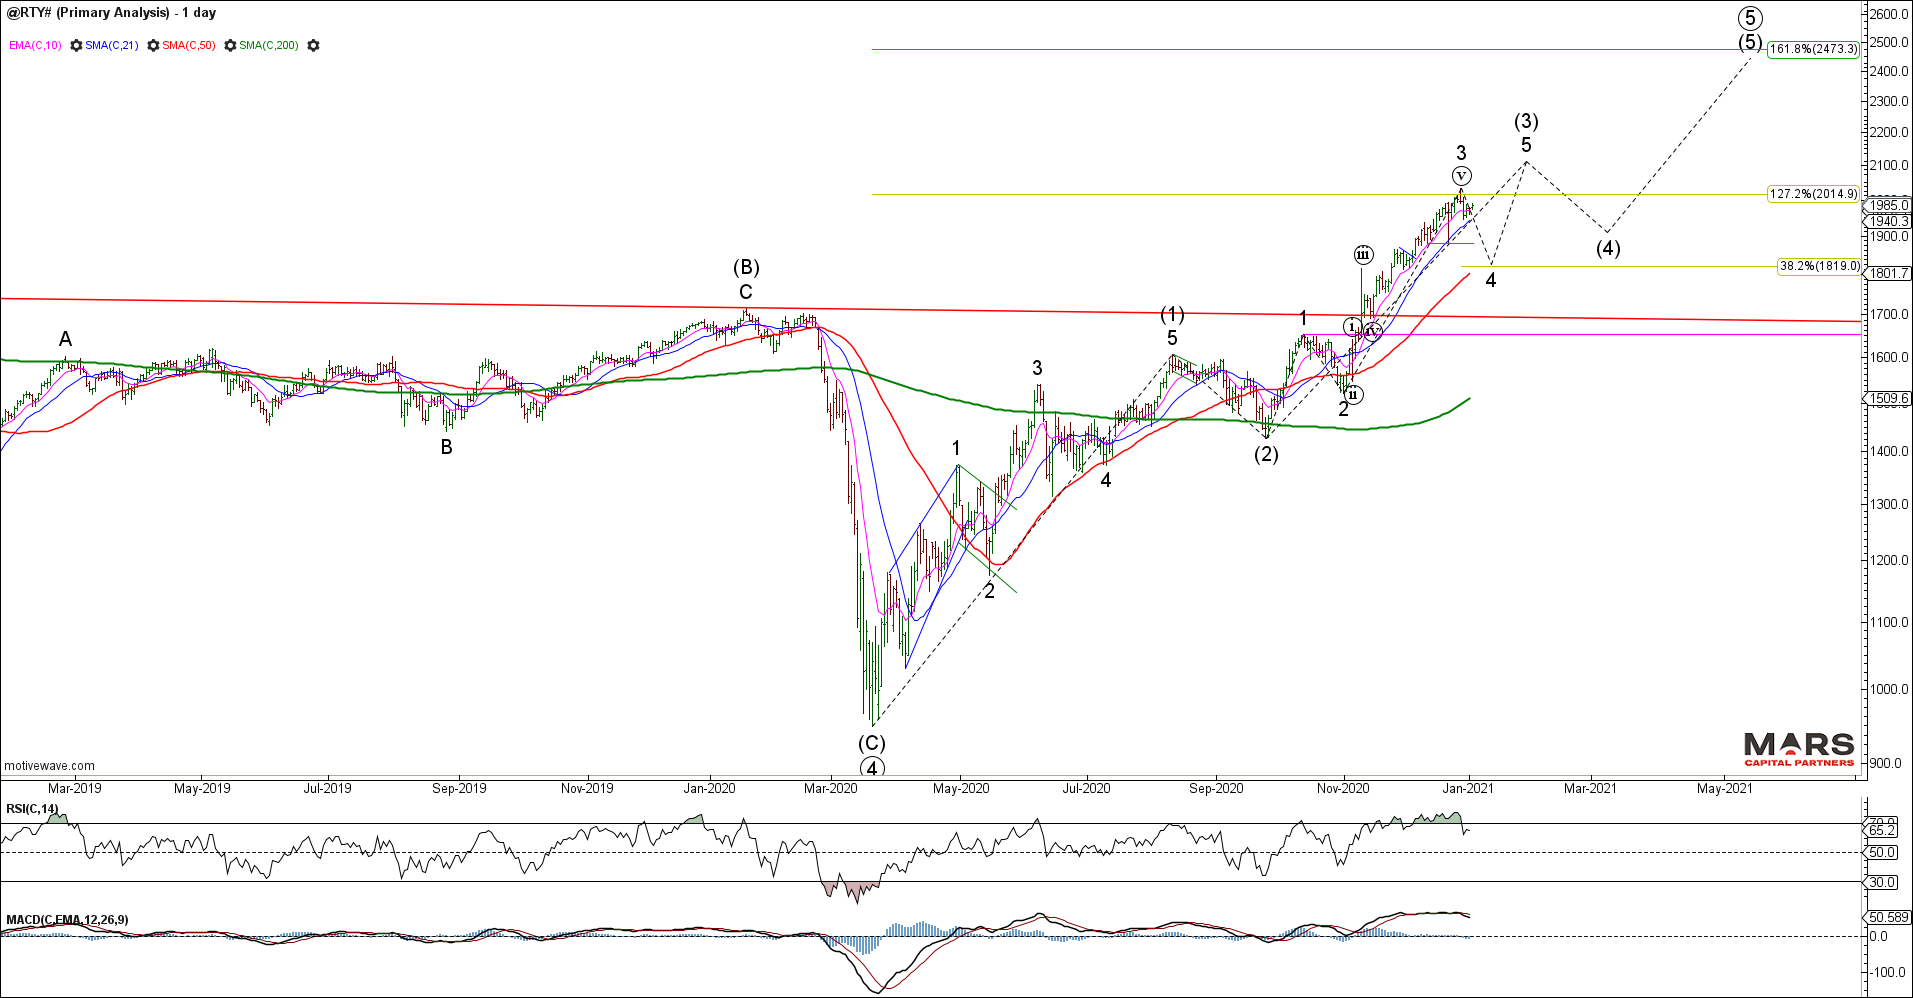
The IWM / RTY continues to stall at overhead resistance and while wave 4 may become more complex, the structure will not be complete until we see a strong wave 5 to new ATH’s. Any near term failure here will likely find strong structural support in the 205 area of underlying trend support and the 200 day sma for a more complex wave 4. We remain bullish the small caps from a structural perspective.
IWM Daily
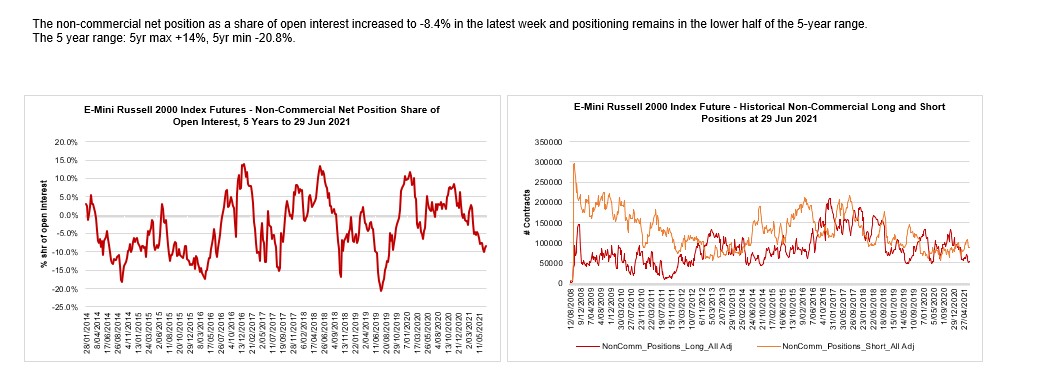
RTY traders remain net short potentially providing fuel for the 5th wave rally to new ATH’s.
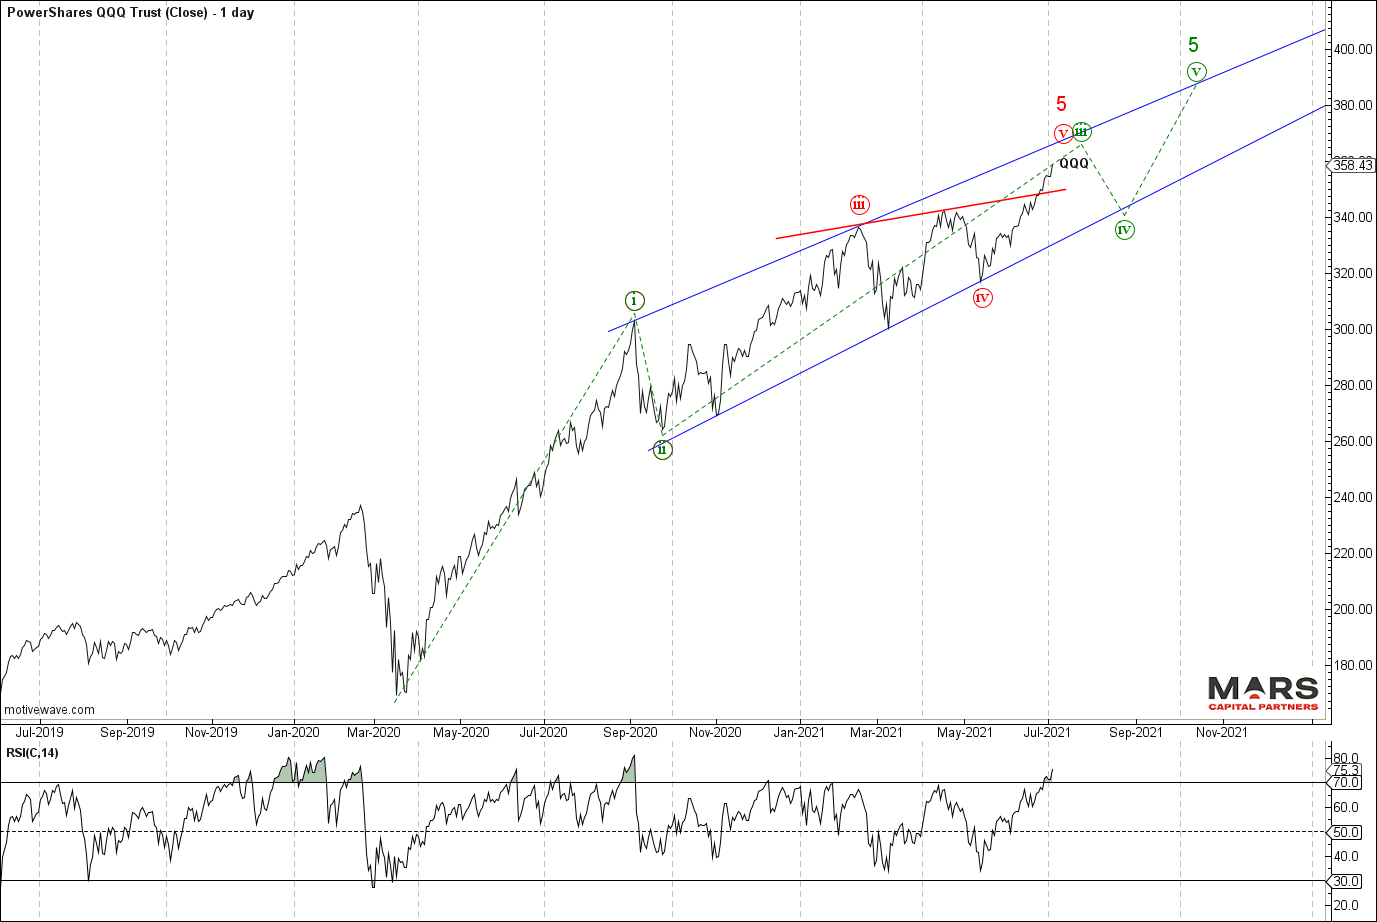
The Nasdaq / QQQ continues to extend higher off trend support in what is expected to be wave (v) of 5 or more bullish wave (iii) of 5 that extends higher later in the year. There is no evidence of a tradable top as rates remain muted and investors refocus on long duration assets. Importantly, the bullish trend remains unbroken with the series of higher highs and higher lows continuing throughout the year – until this changes, the bulls remain in control.
QQQ Daily close
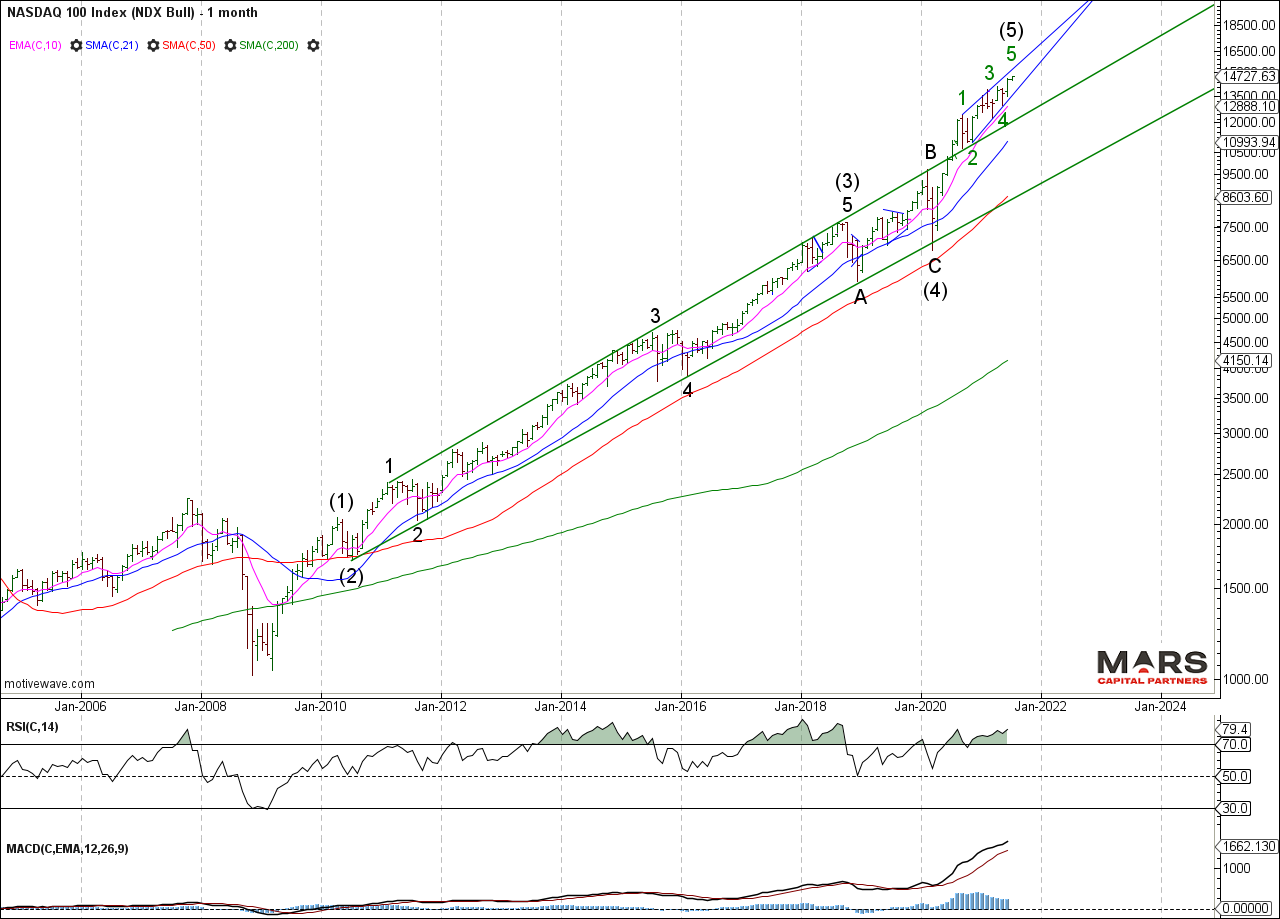
The bigger picture Nasdaq / NDX shows a wave (5) extension that continues to hold above its trend channel breakout. We continue to count this rally from the 2020 lows as an ending 5th wave given its overlapping wedge structure and wave count from the 2009 lows. Likely a blow-off rally until we see evidence of trend exhaustion and reversal later in the year.
NDX Monthly semi-log
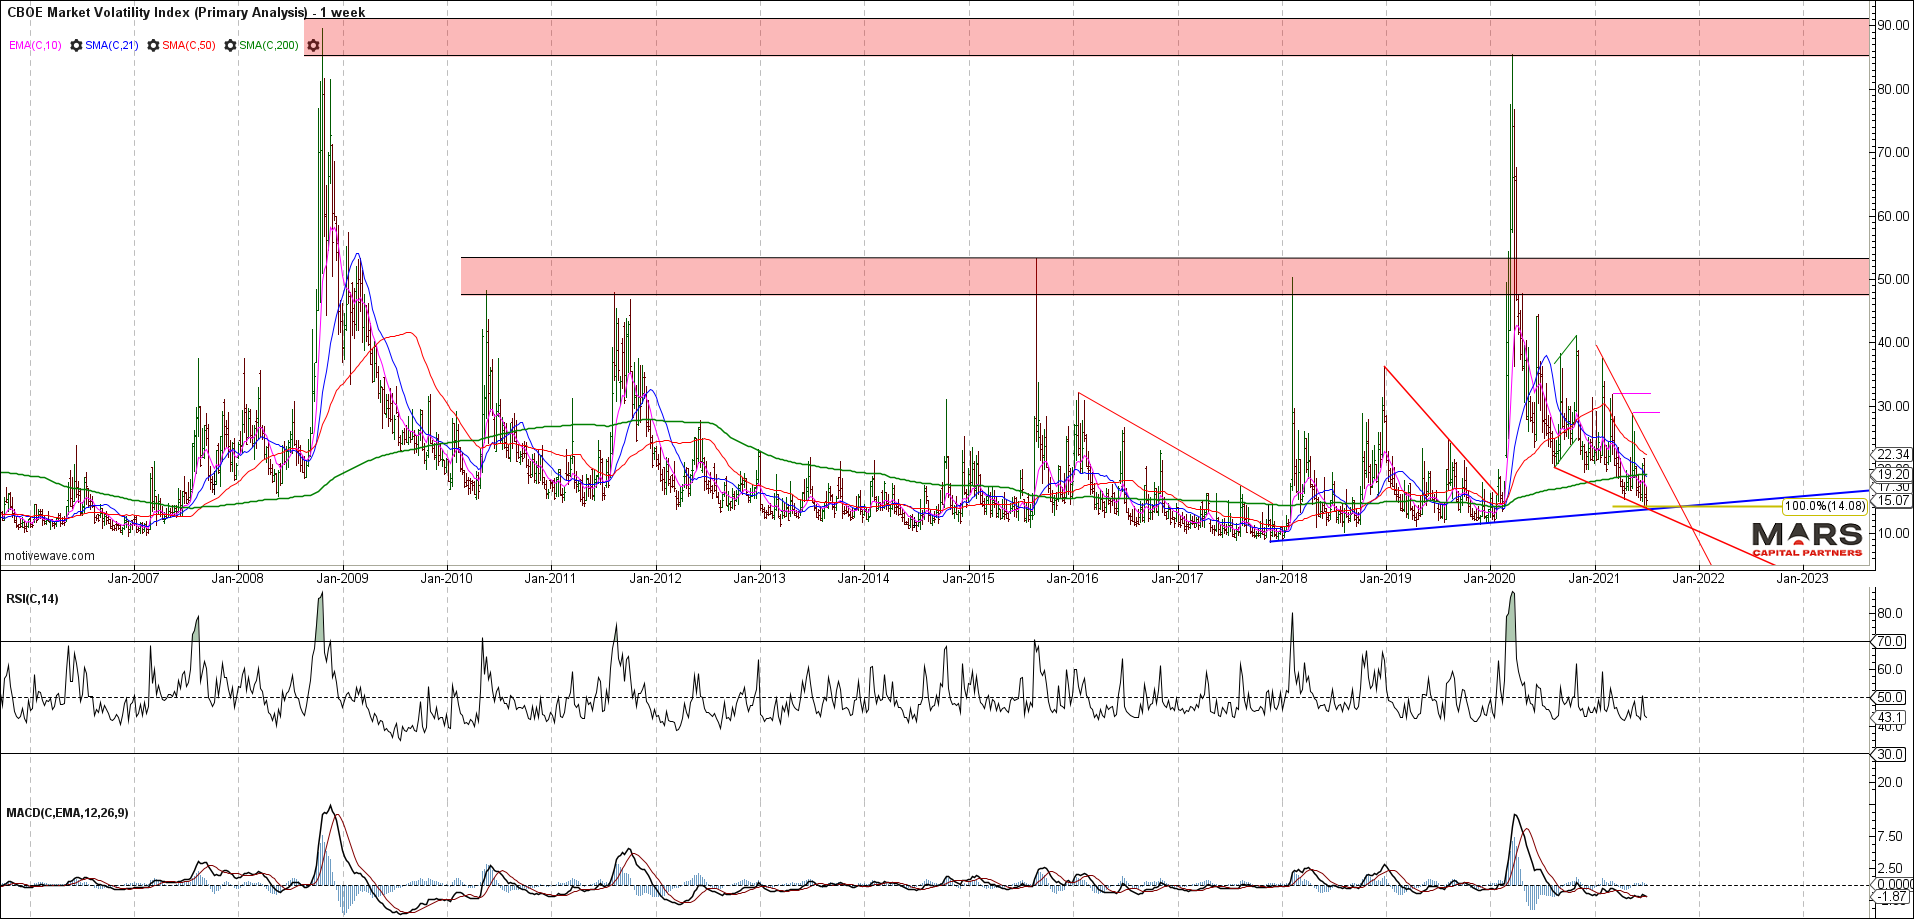
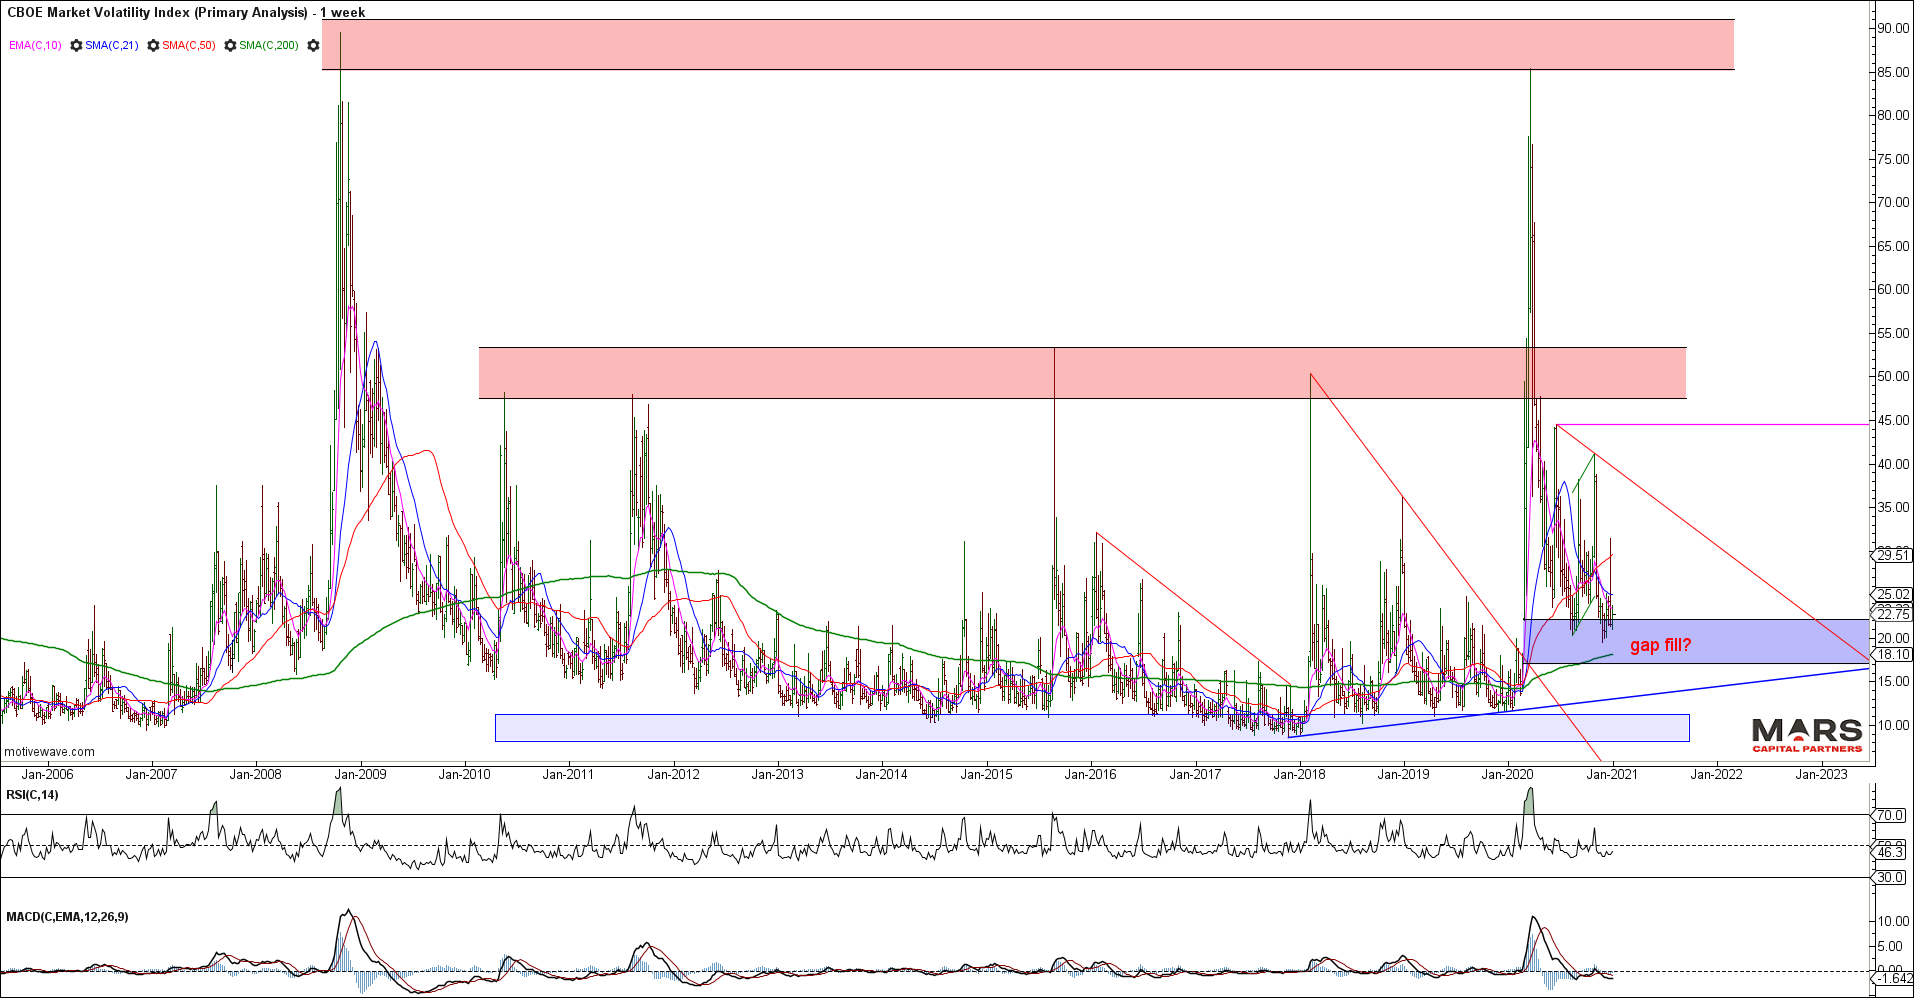
The VIX closed the gap we highlighted at the start of the year and continues to wedge lower into trend support. Despite equities at new ATH’s, the VIX continues to hold above the 2017 lows providing a bullish non-confirmation. We continue to see this wedging decline as an ending pattern but we have no evidence of a bullish turn. Patience is required as equities grind higher. Alternatively, we have the opportunity to buy long dated portfolio insurance at cheap levels.
VIX Weekly
Bond markets and Rates
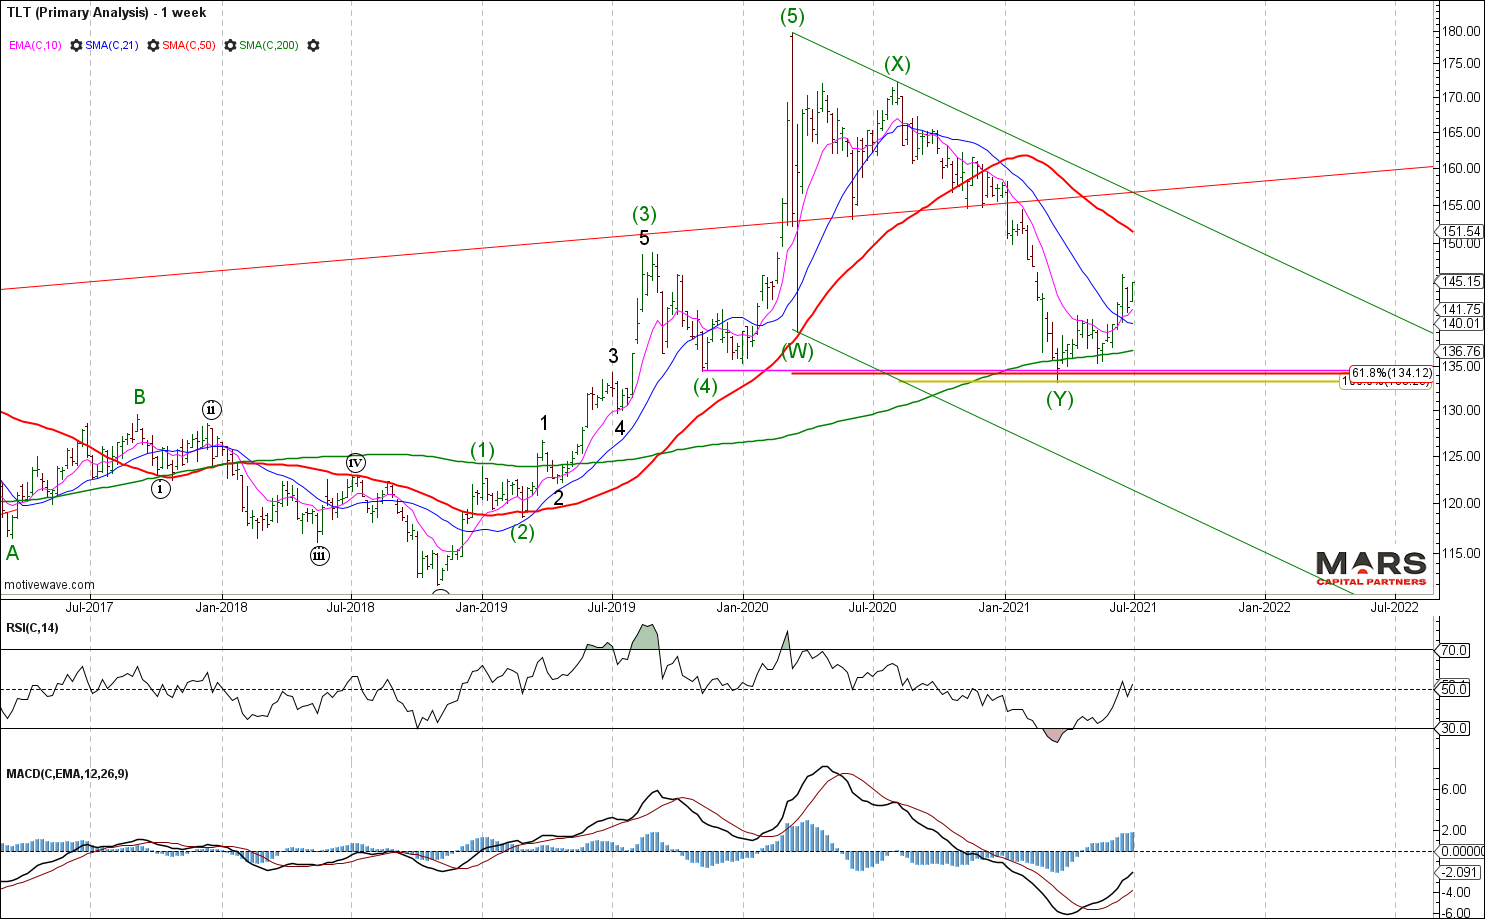
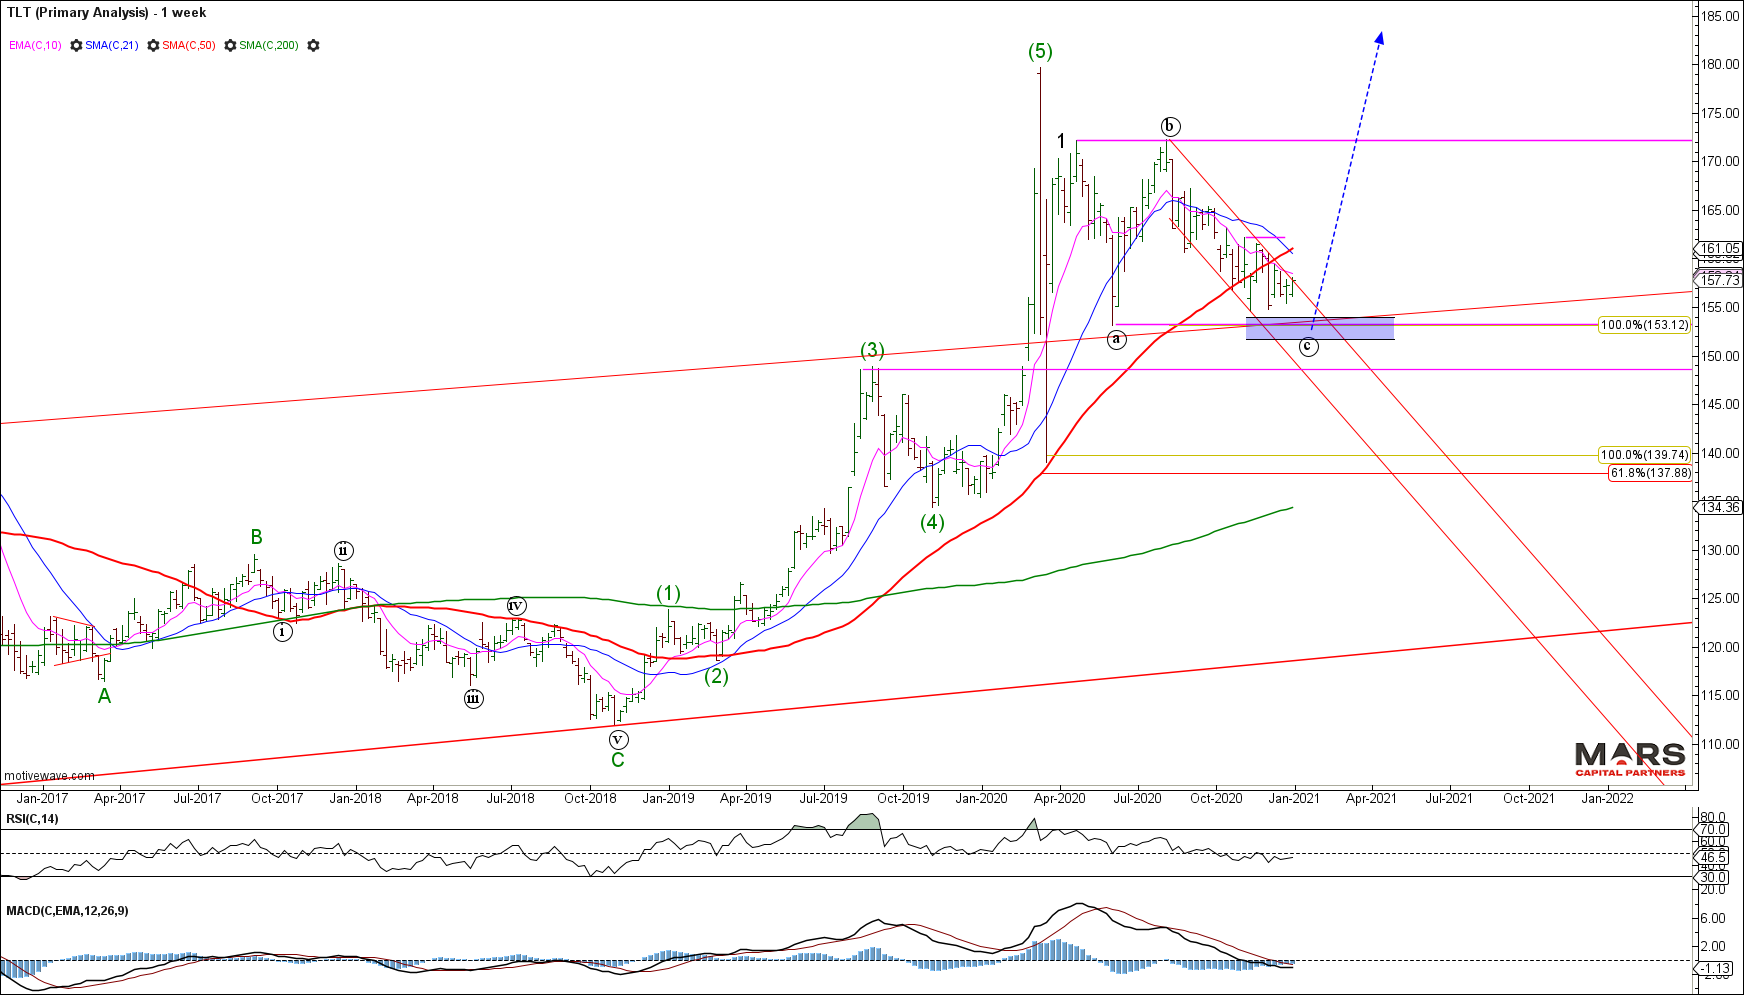
The bond markets as represented by the TLT are rebounding after 3 waves down of equality from the March 2020 highs. The decline is clearly corrective which calls into question the stag-flationary / inflationary outlook requiring higher rates. Central banks are attempting to pin rates at the lows given historically high debt levels globally. Bond bears need to break the March 2021 lows to help confirm a bigger picture change in trend.
TLT Bull Case Weekly semi-log
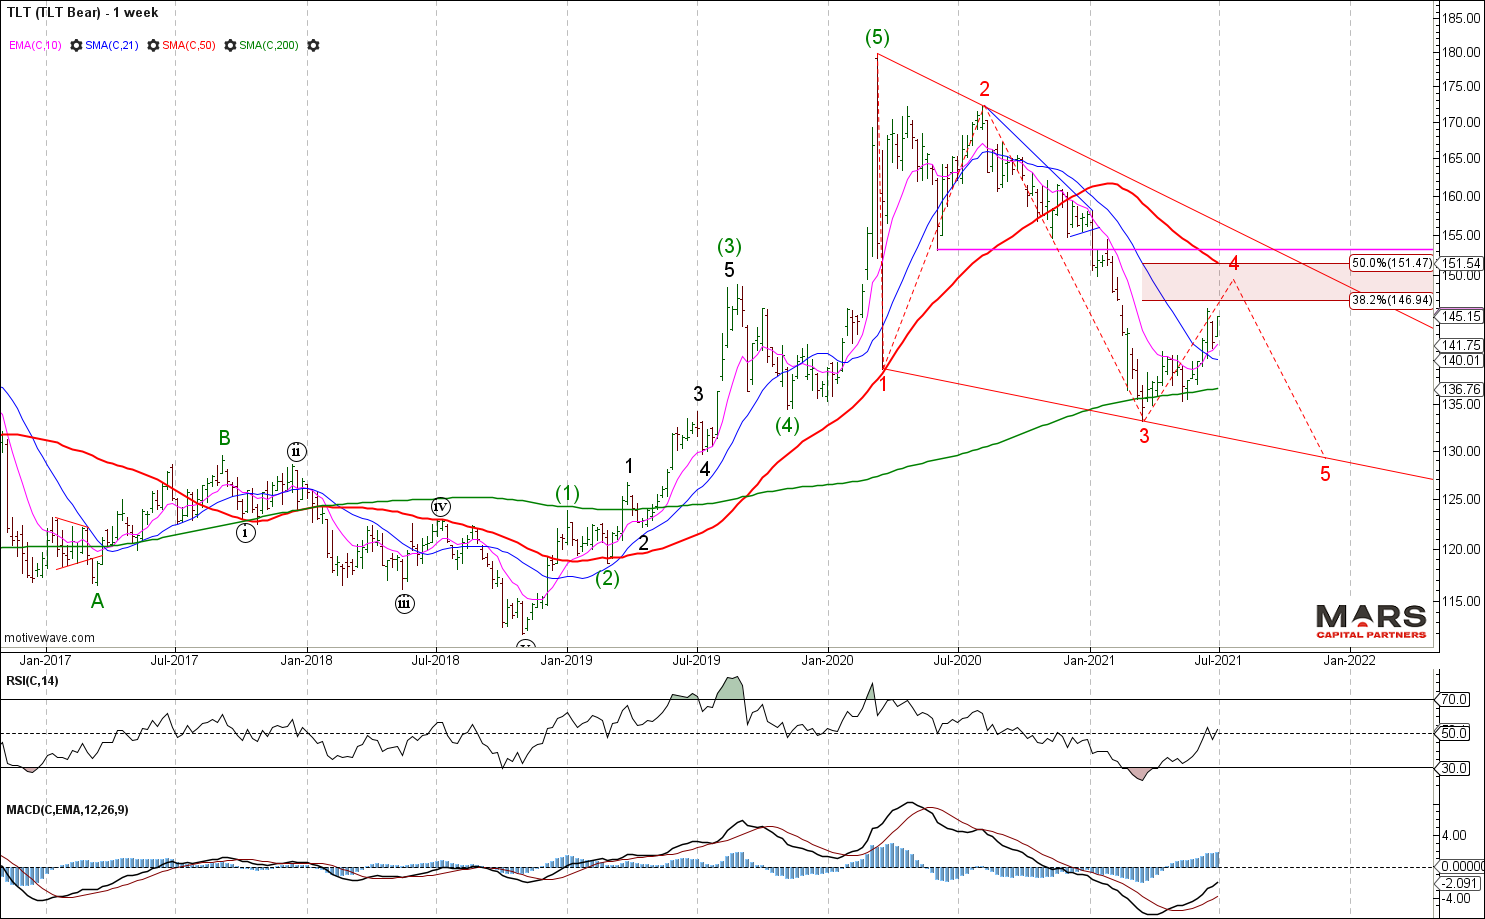
The bearish case for bonds given the market structure is a potential leading diagonal that requires another wave down to marginal new lows. If the TLT continues to rally impulsively, we will need to reconsider our long term bearish outlook for bonds. No evidence yet of a bearish turn as the Fed continues to hold the line.
TLT Bear Case Weekly semi-log
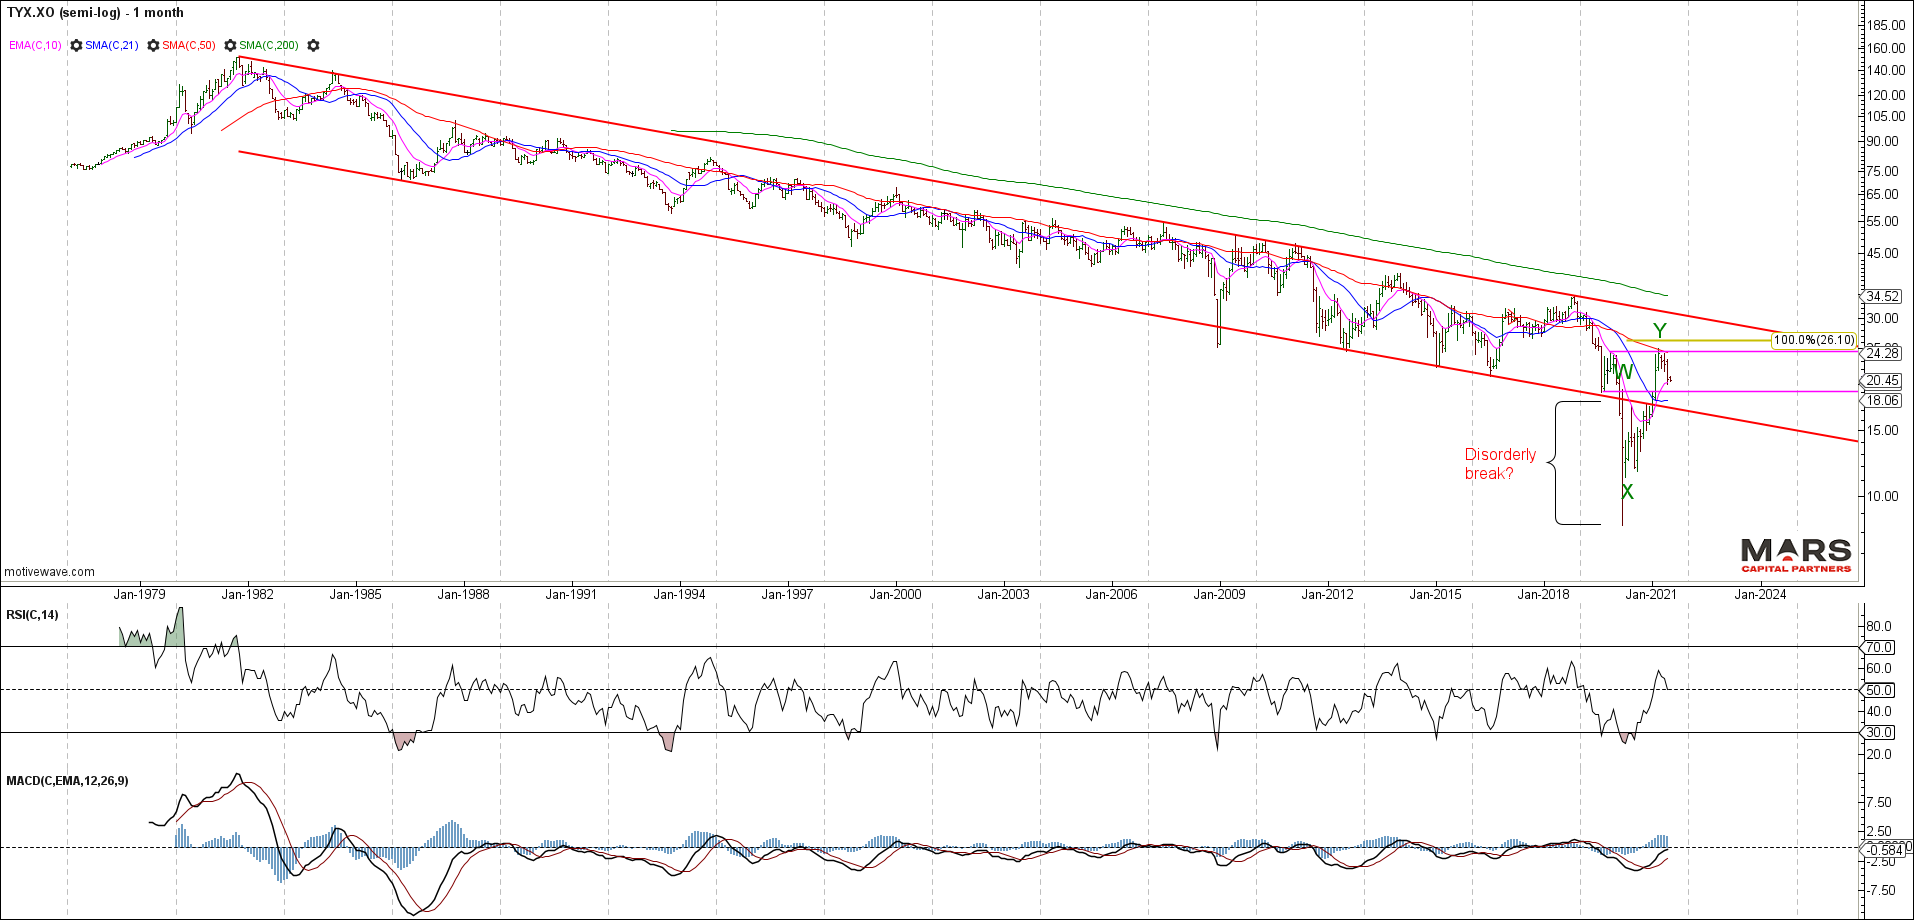
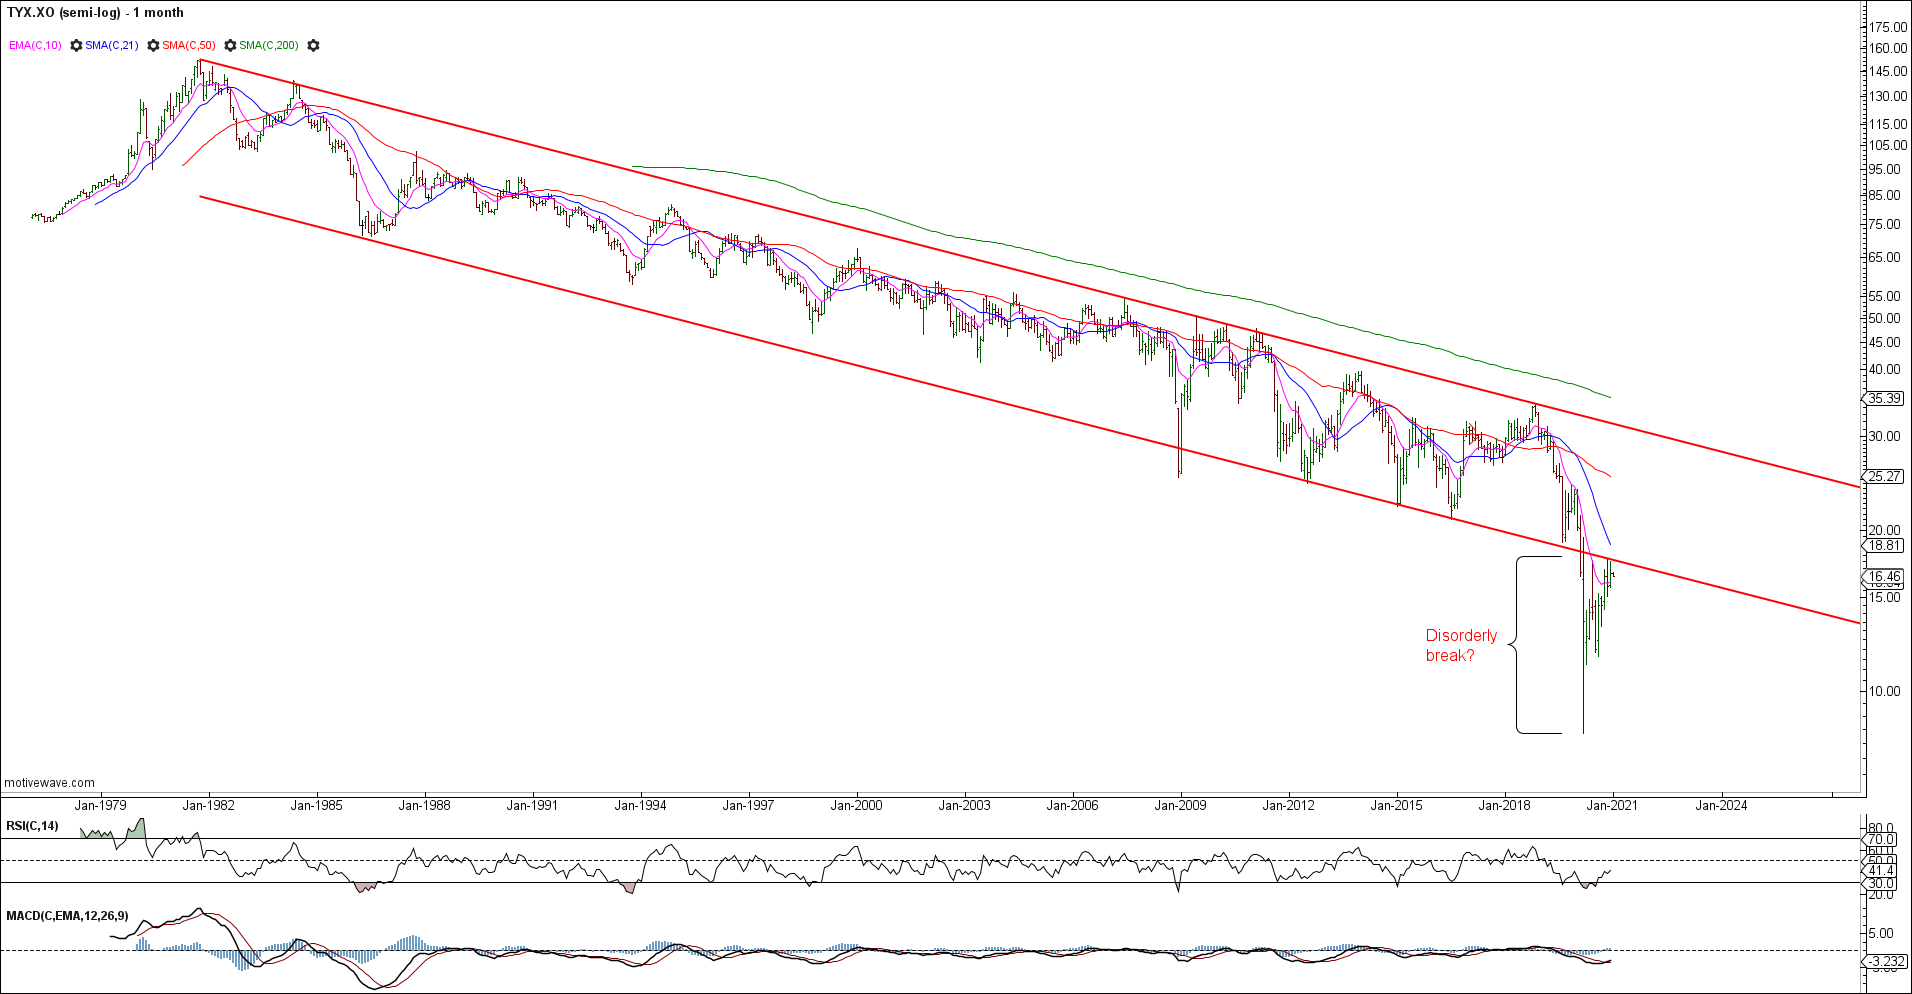
From a big picture perspective, the TYX has rallied in 3 corrective waves of equality from the March 2020 lows. Bulls need to extend this rally into 5 waves up for a change in the big picture trend to up.
TYX Monthly semi-log
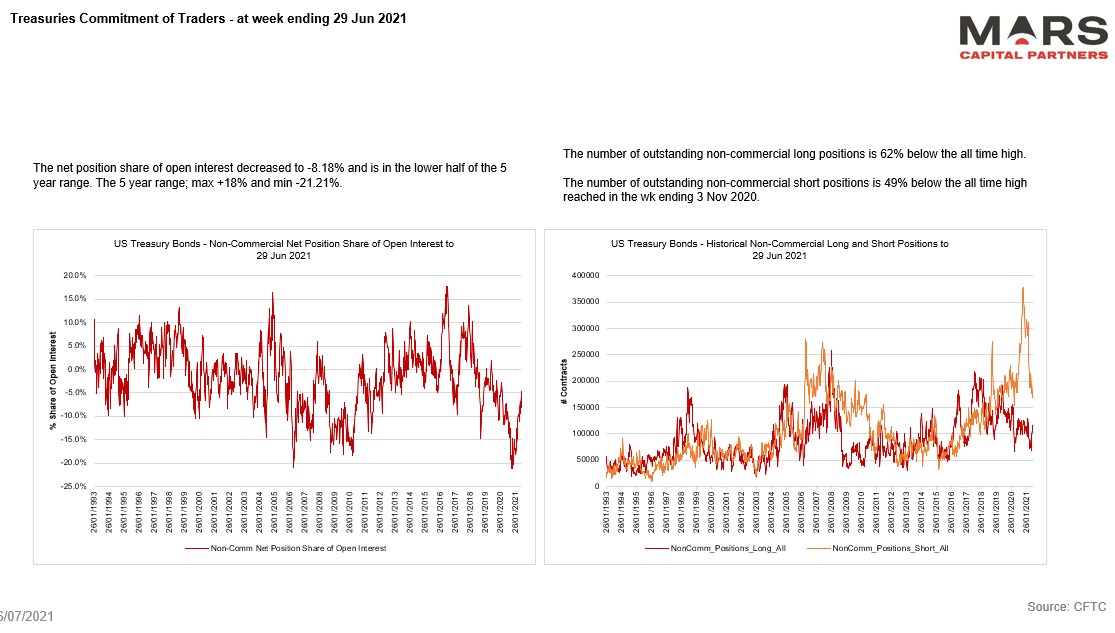
Long bond traders have been squeezed out of their short positions and curve steepeners.
FX markets and the US$
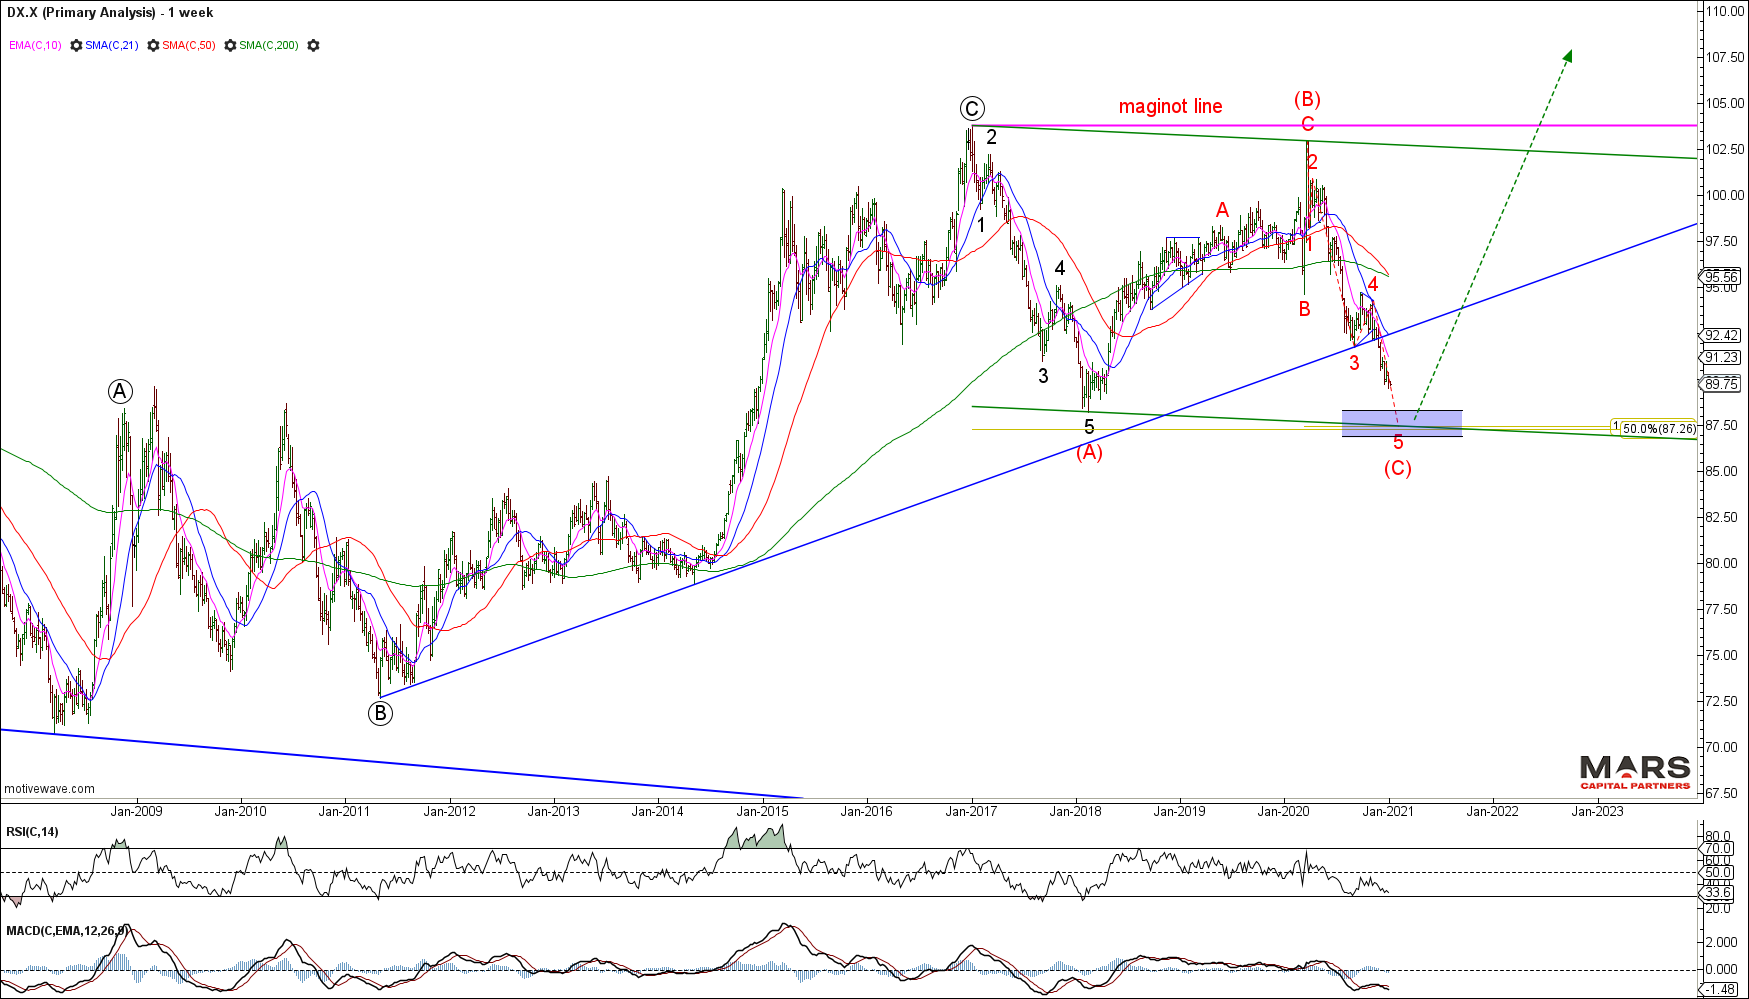
To the FX markets and the US$ continues to hold support from the start of the year. January’s lows are our new Maginot line for the potential bull market in the DXY – below this risks a continued 3rd wave decline that breaks equality support in the 87.40 area and targets much lower prices for the US$. The recent compression is setting up a strong move in either direction – much will depend on Fed signalling through the end of the year. Strong resistance that DXY bulls need to clear remains in the 94-95 area.
DXY Weekly
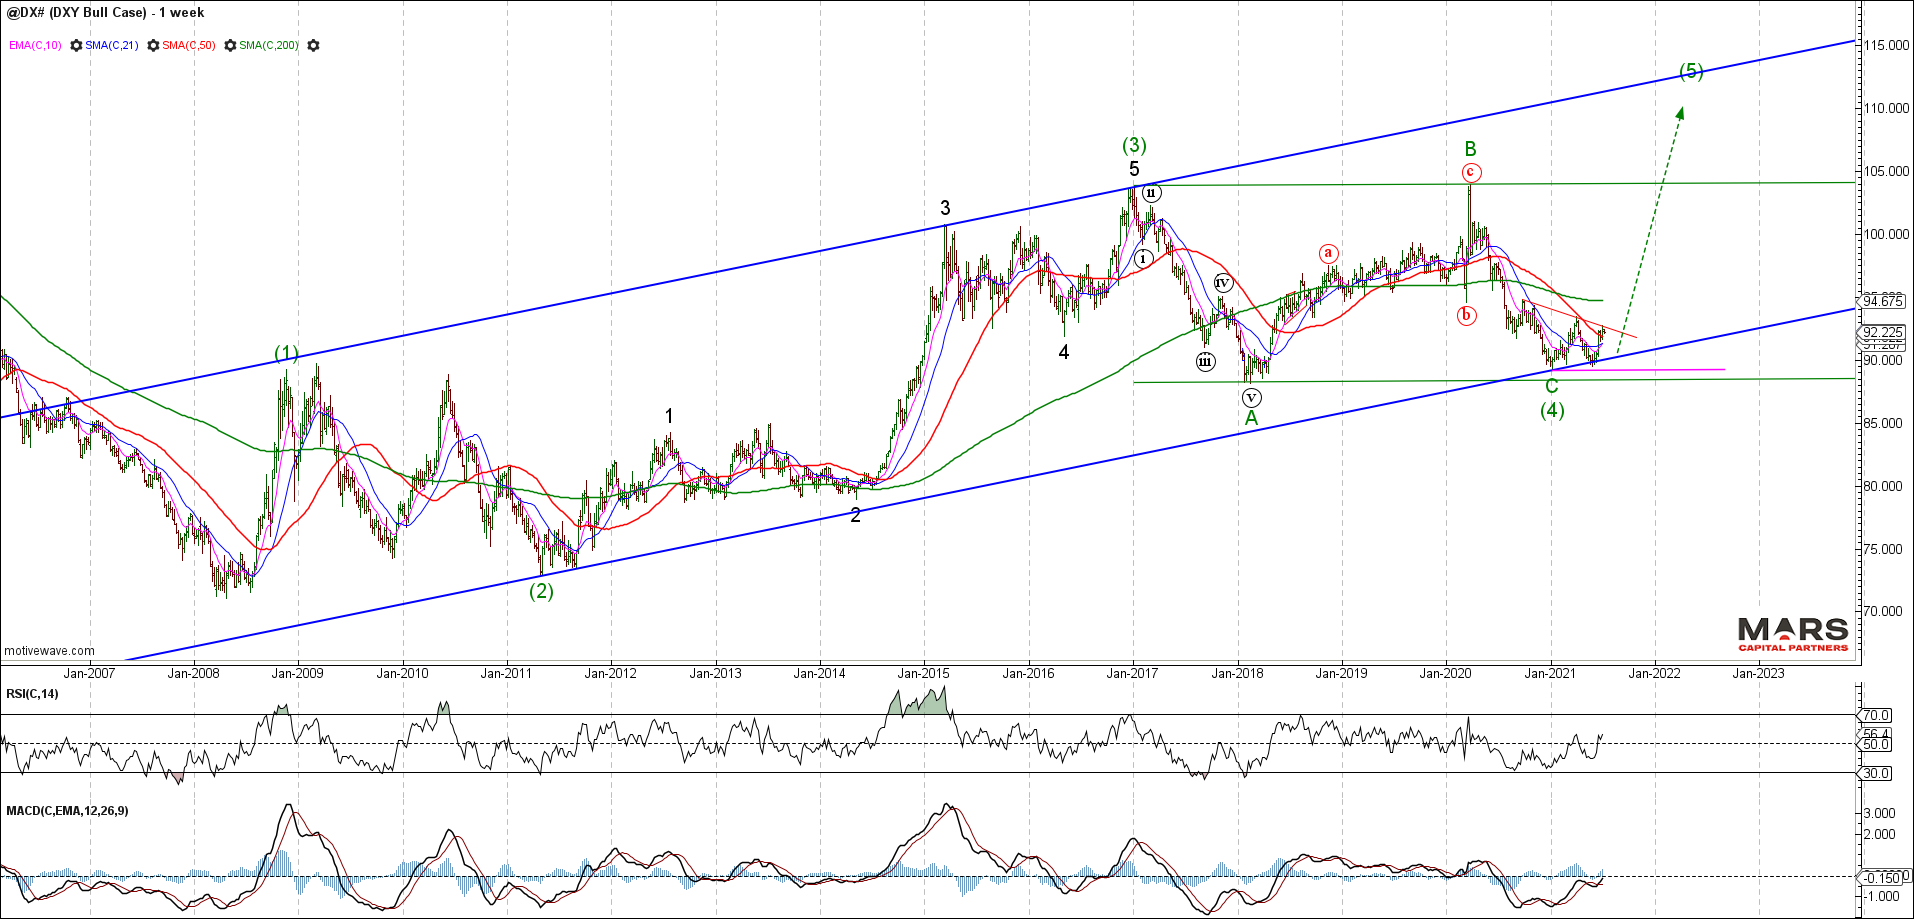
The DXY long term bull case remains a strong potential if it can break up and through near term resistance while holding swing lows. This bullish outlook will likely require the Fed to shift its policy signalling to a more hawkish outlook.
DXY Bull Case Weekly
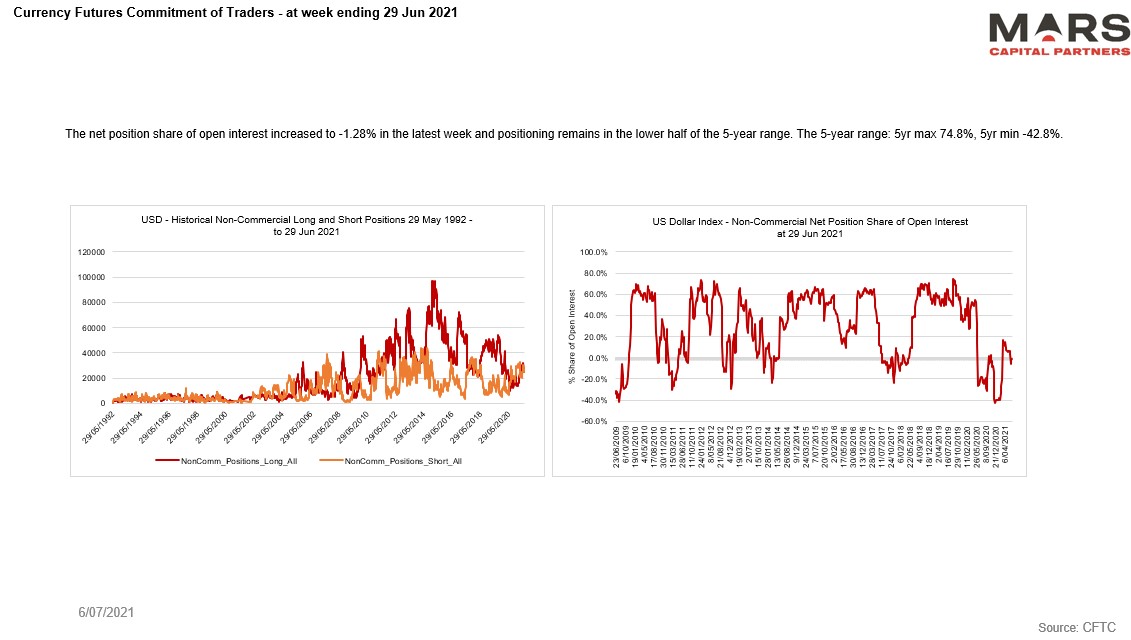
DXY longs are trying to get up off the floor.
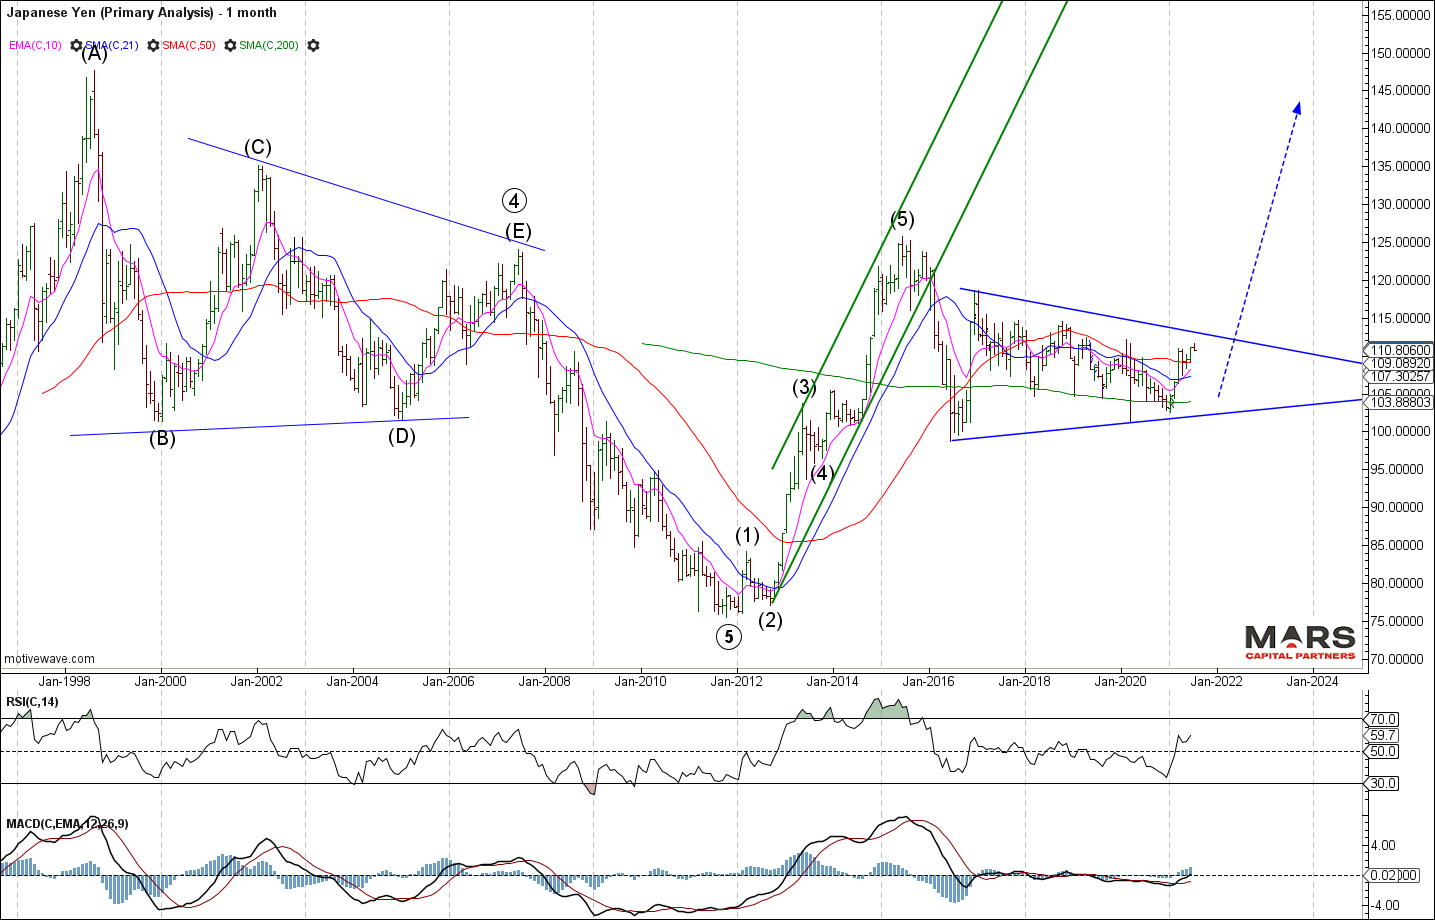
The USDJPY remains range bound and corrective following its impulsive rally from the 2011 lows. Our bigger picture outlook remains bullish for this pair as we look for a break up and out of this congestion. Our base case is that the USDJPY made a generational low in 2011 and the bigger picture trend has turned with upside targets in the 145 area.
USDJPY Monthly
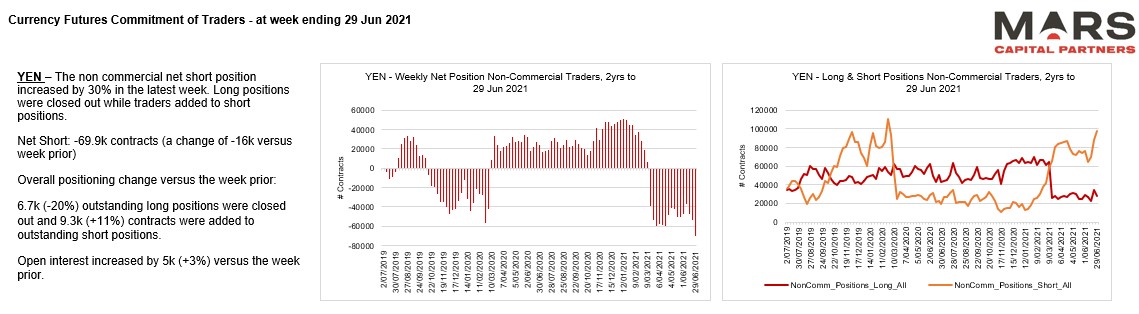
Yen traders are now extremely short making them vulnerable to a near term correction.
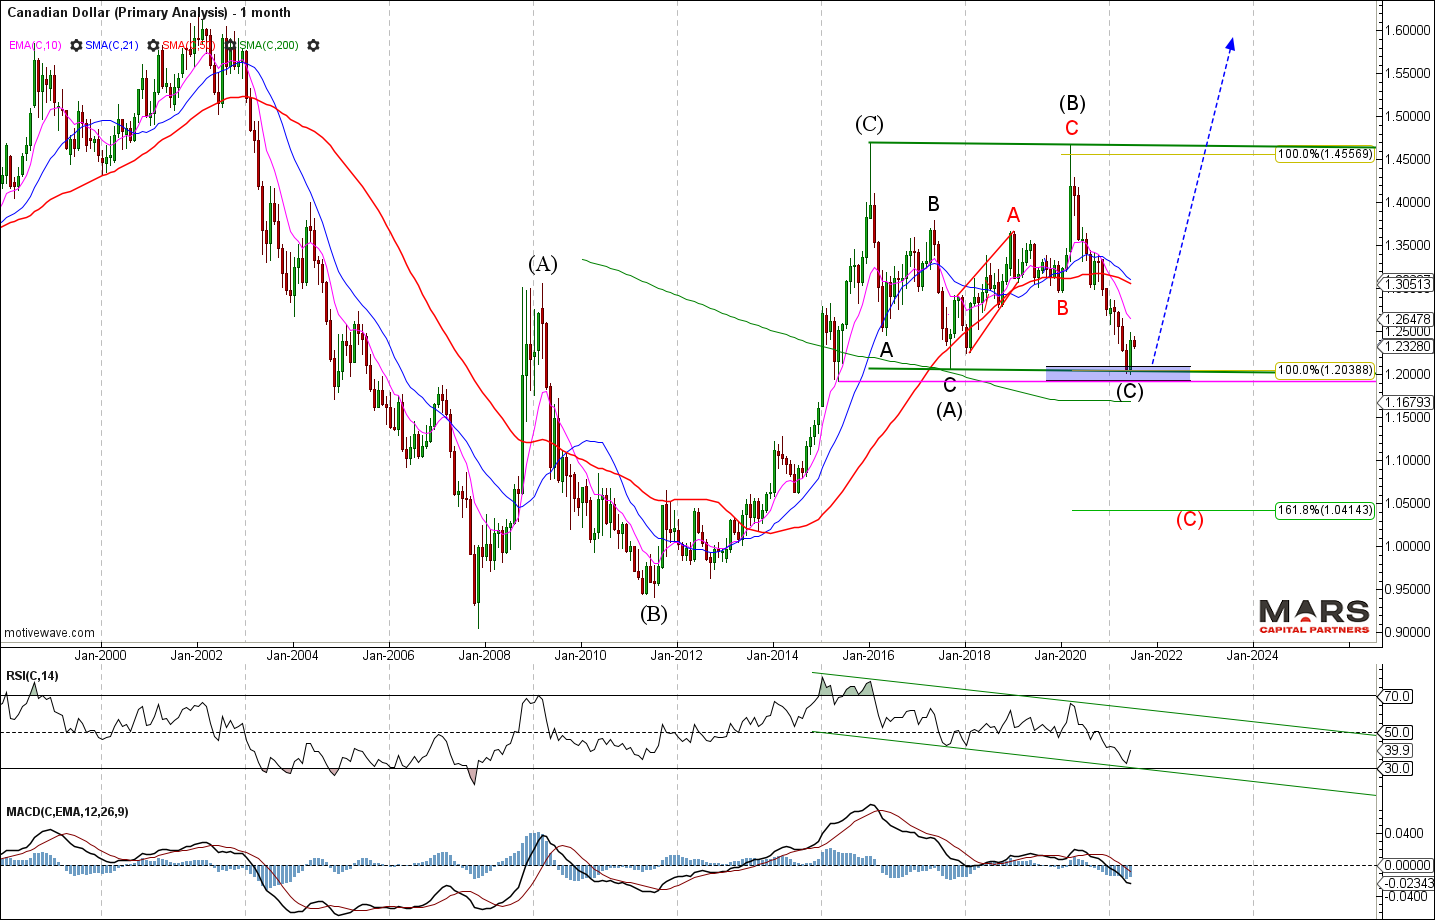
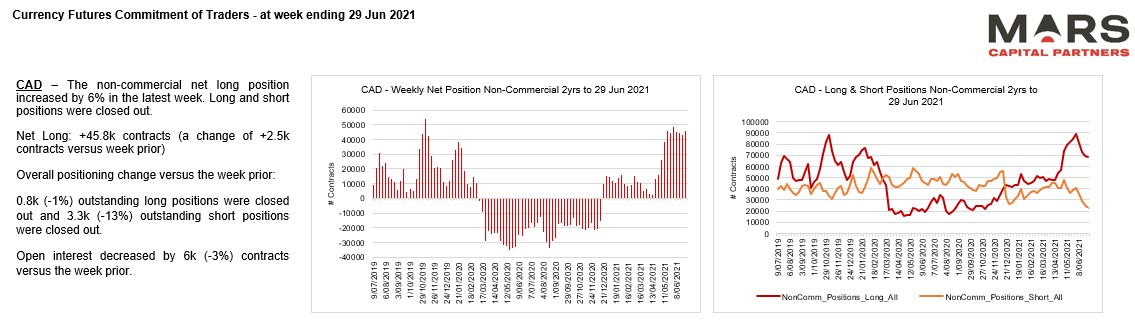
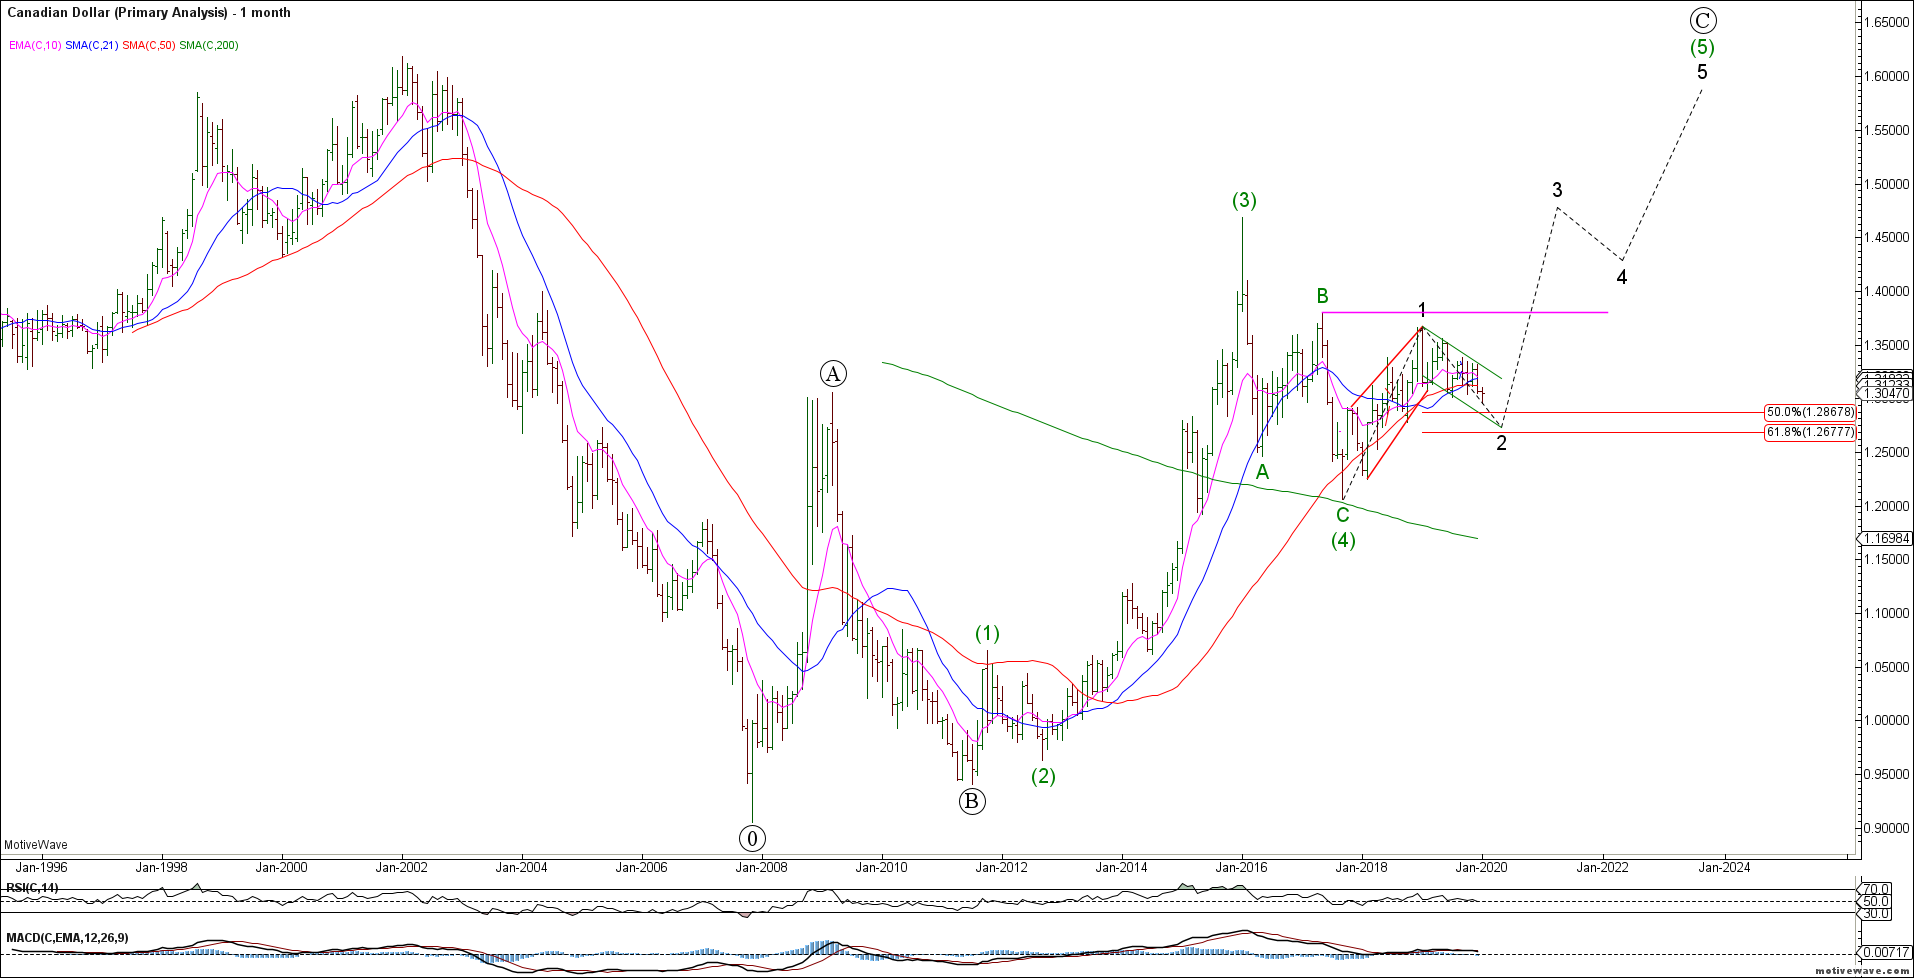
The USDCAD met our measured downside targets in the 1.20 area from where we have seen an attempted rally. Structurally, we have a clear 3-3-5 Flat correction from the January 2016 highs. The onus is now on the USDCAD bulls to make a stand and hold the 1.20 major support zone – failure to do so will likely see an accelerated decline through support towards 1.04 and below.
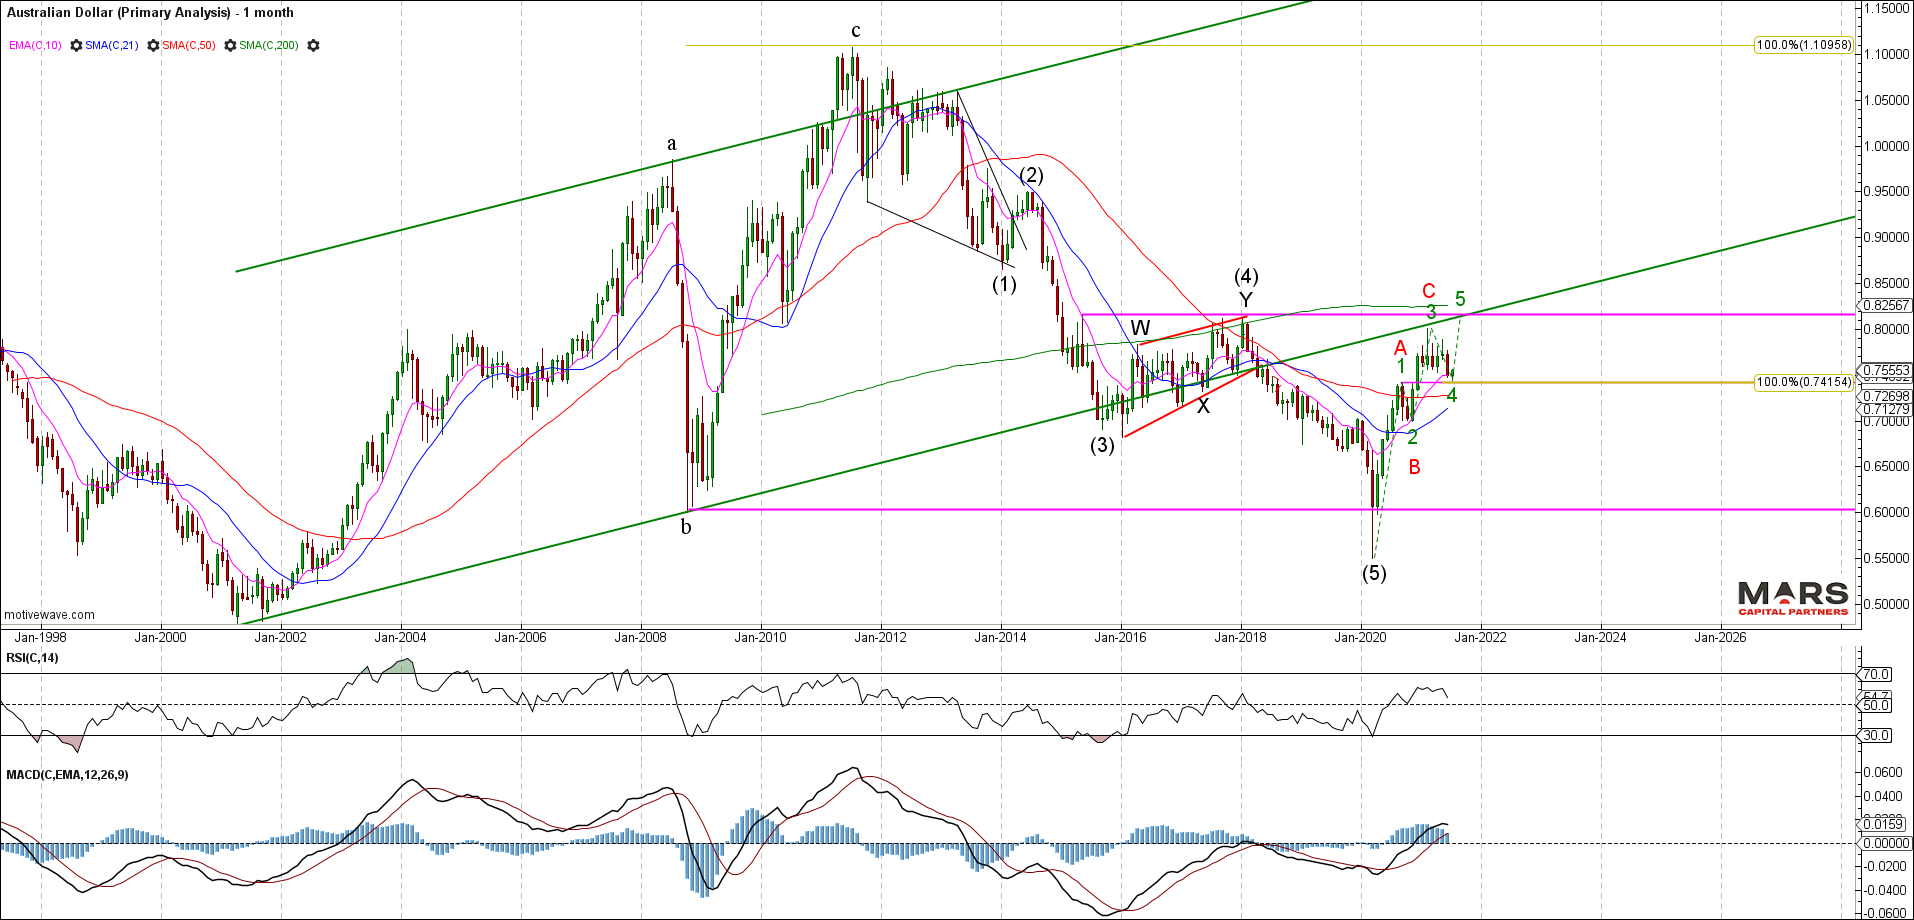
The Aussie$ outlook is less clear having struggled to rally only in 3 waves into trend resistance so far from the March 2020 lows. The AUDUSD needs to rally immediately in wave 5 while holding 0.74 support to keep the bull case alive. Major resistance remains in the 0.82 area of the prior 4th wave.
AUDUSD Monthly
Commodities
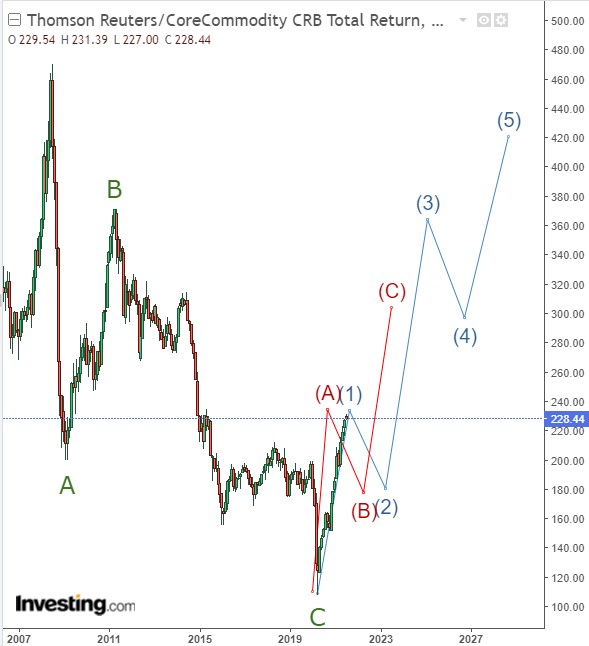
Industrial commodities confirmed our bullish outlook from the start of the year but may be nearing an end to the initial impulsive wave up. The rally is clearly extended and we now have enough waves in place for wave 1 / A up off major swing lows in 2020. We remain bullish commodities from a big picture perspective but are wary of any near term pullback setting up the next wave higher. No evidence yet of a tradable top and the big picture structure is clearly bullish.
CRB Monthly
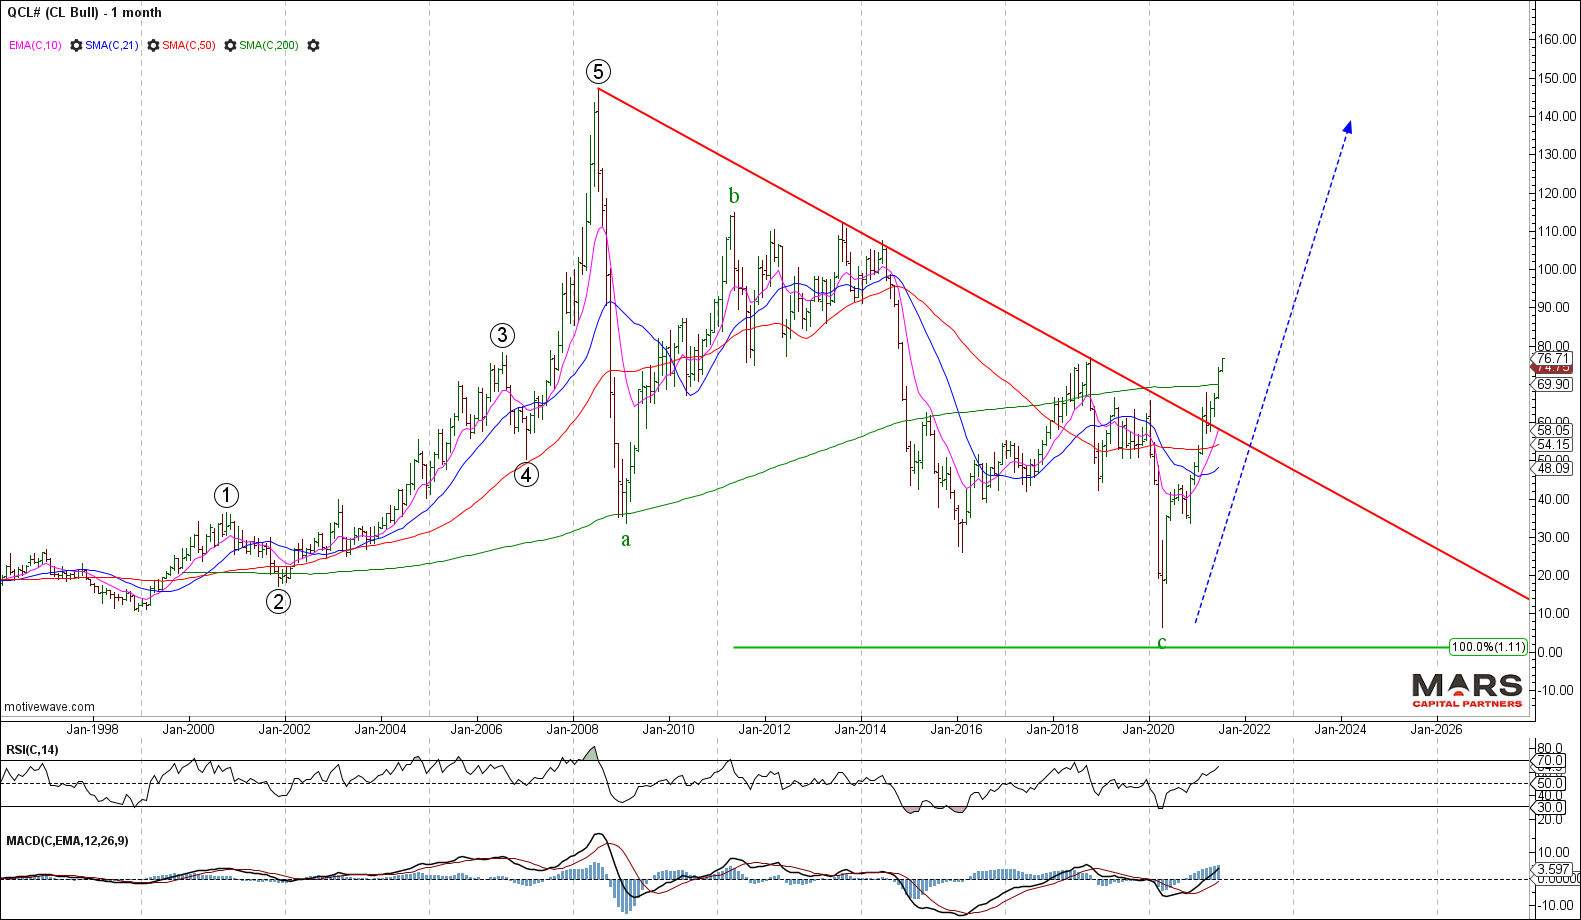
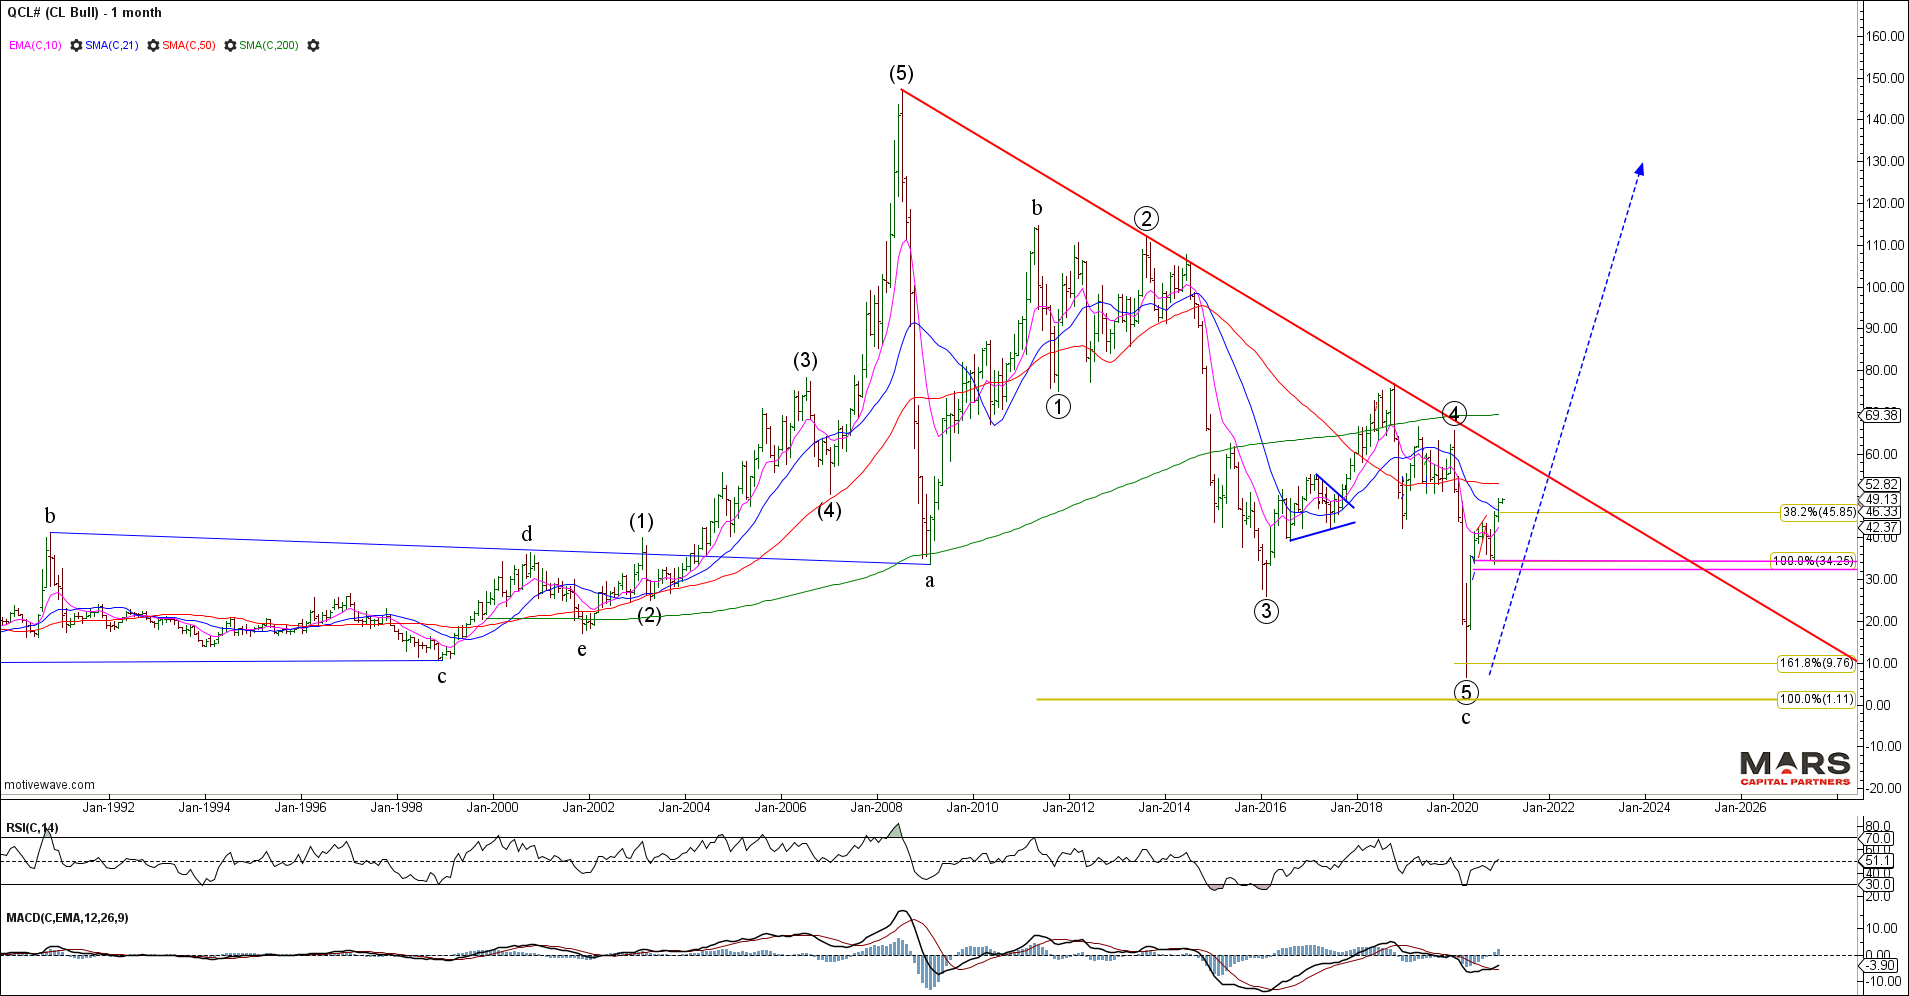
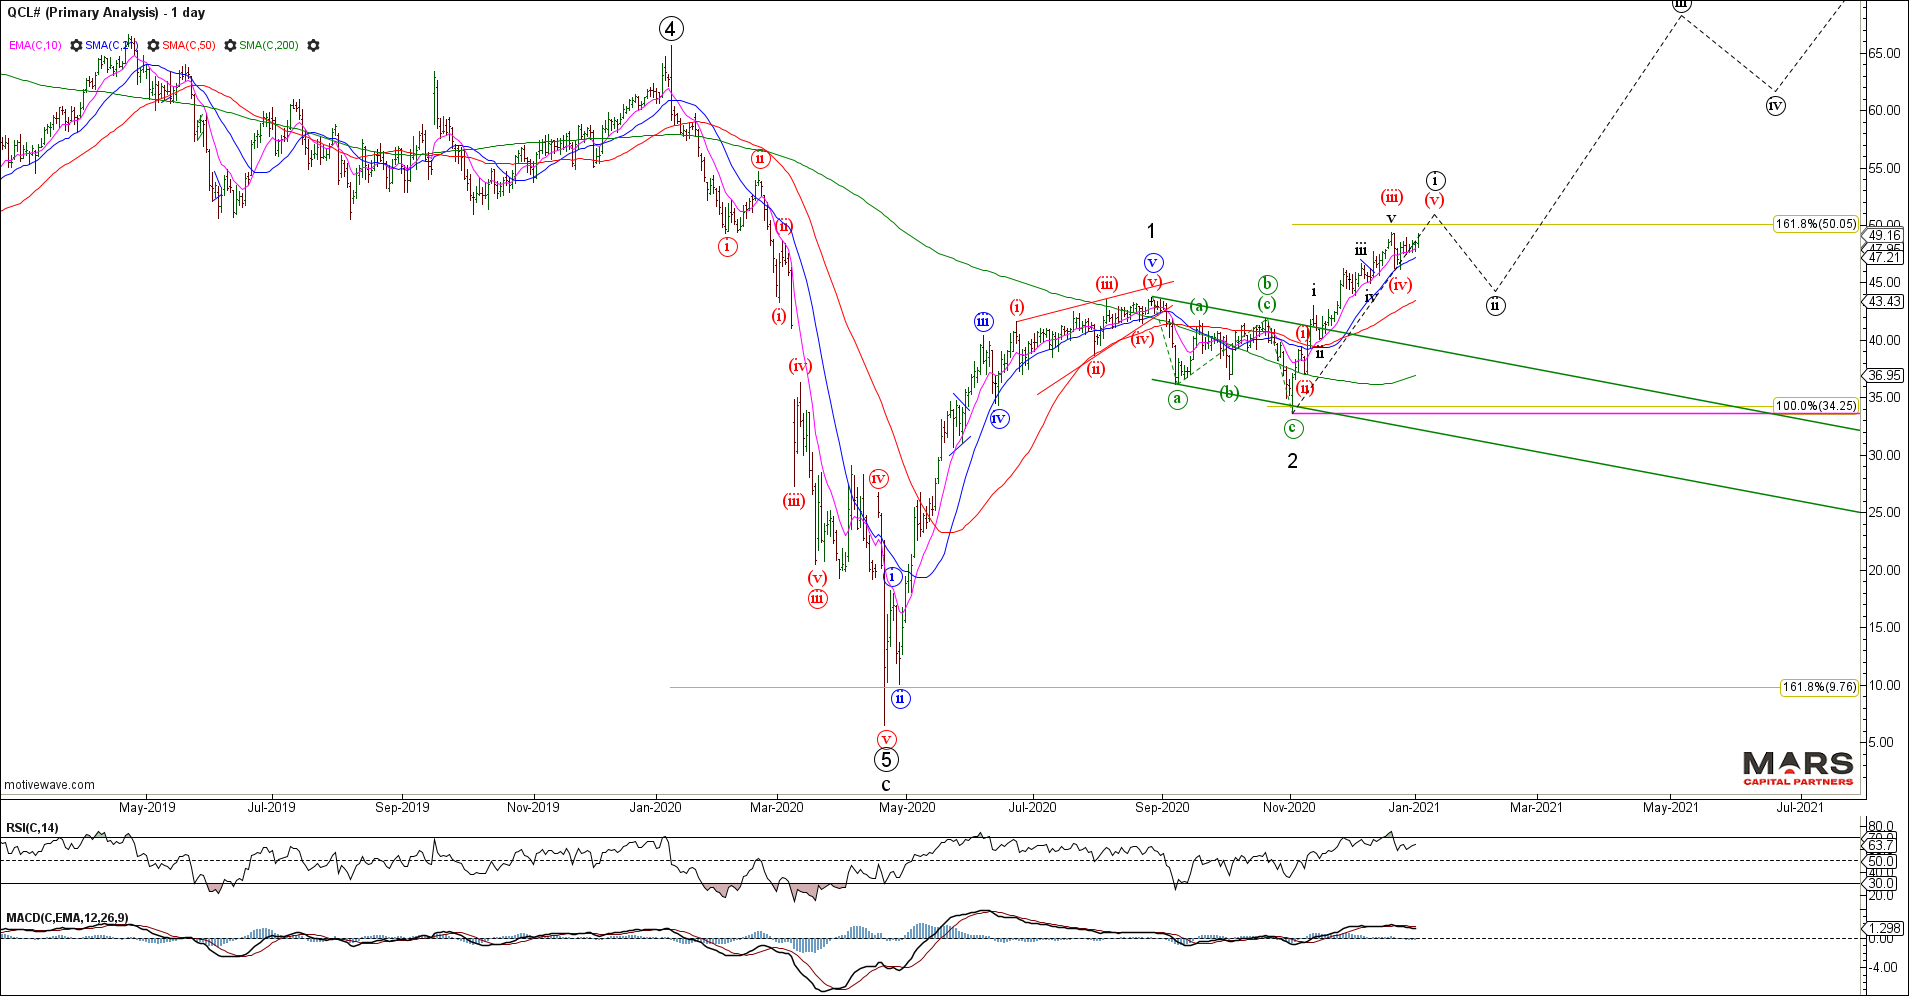
Crude Oil continues to lead the way for our bullish commodities story with a strong impulsive rally from the April 2020 lows. The current rally is very extended so we should be alert to the potential for a near term correction within the bigger picture bullish trend. CL remains bullish from a structural perspective.
CL Monthly
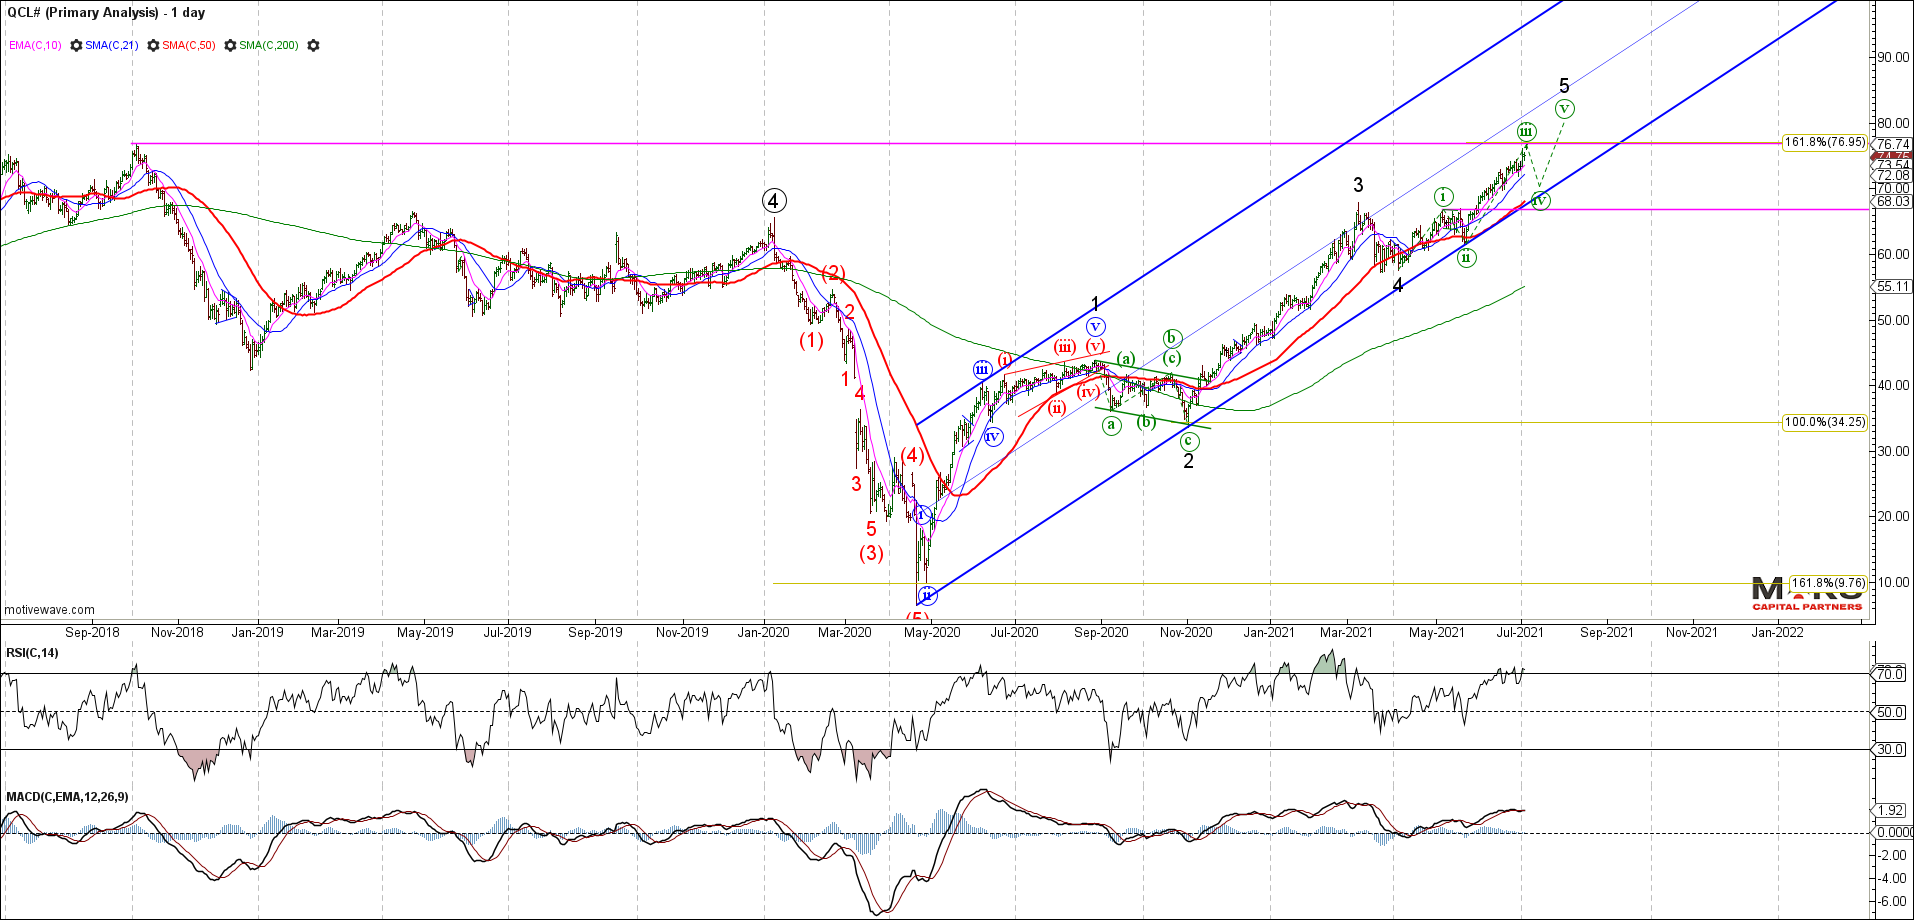
The CL bull count remains intact as wave (iii) of 5 continues to extend higher. Note the importance of trend support and the 50 day sma. Any close below support will likely signal an end to the initial rally up from the April 2020 lows. Ideally, we’d like to see another small degree 4th and 5th wave to end the rally but the structure remains bullish until proven otherwise.
CL Daily
CL bulls continue to press into the highs. Very one-sided trade at the moment.
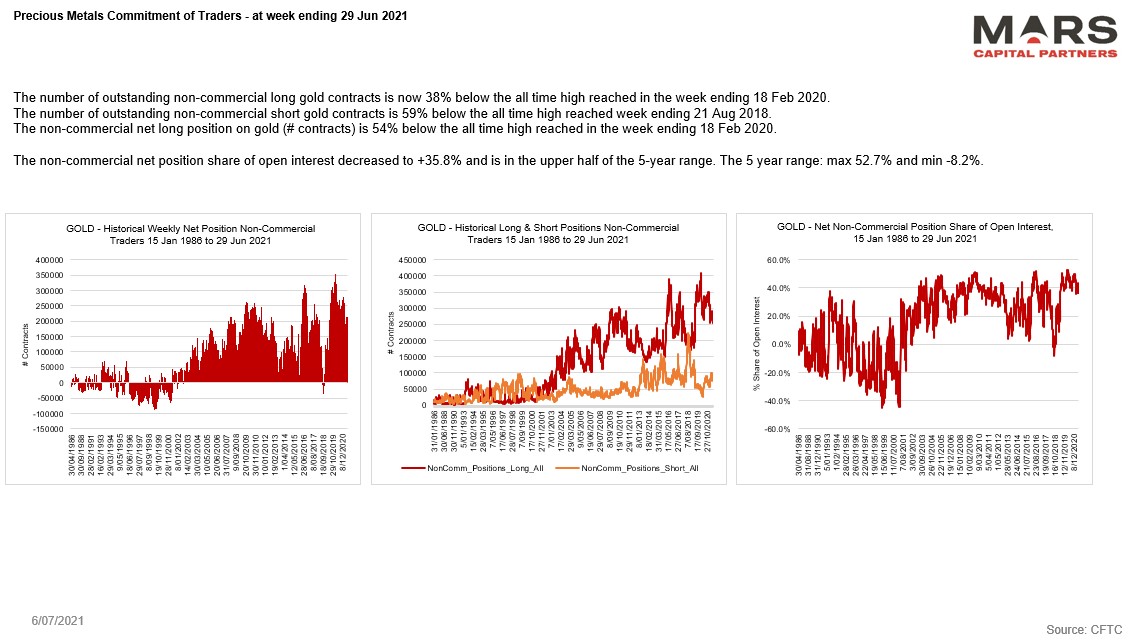
Gold failed to break higher and remains within a corrective decline from the August 2020 highs. Last week’s impulsive decline into trend support warns that any break will likely see an extended decline. With the Fed minutes due out this week, a hawkish tone will likely sink Gold to a break below trend. Bulls obviously need to clear 1920 resistance to gain any upside momentum and risks failure below 1670. A lot will depend on the Fed’s near term signalling but Gold remains vulnerable here. No strong view but likely bearish near term.
Gold Weekly
Gold traders remain very long despite the pullback in price. May be some more pain to come.
Silver appears to be compressing within a triangle and has been range bound this year. While the structure appears bearish, triangles can thrust in either direction. A break down likely targets support in the 18.80 area for the 200 week sma and 61.8% fib retracement. Each way bet here with no clear near term direction. Bulls need to hold the 50 week sma support near term.
Silver Weekly
Crypto
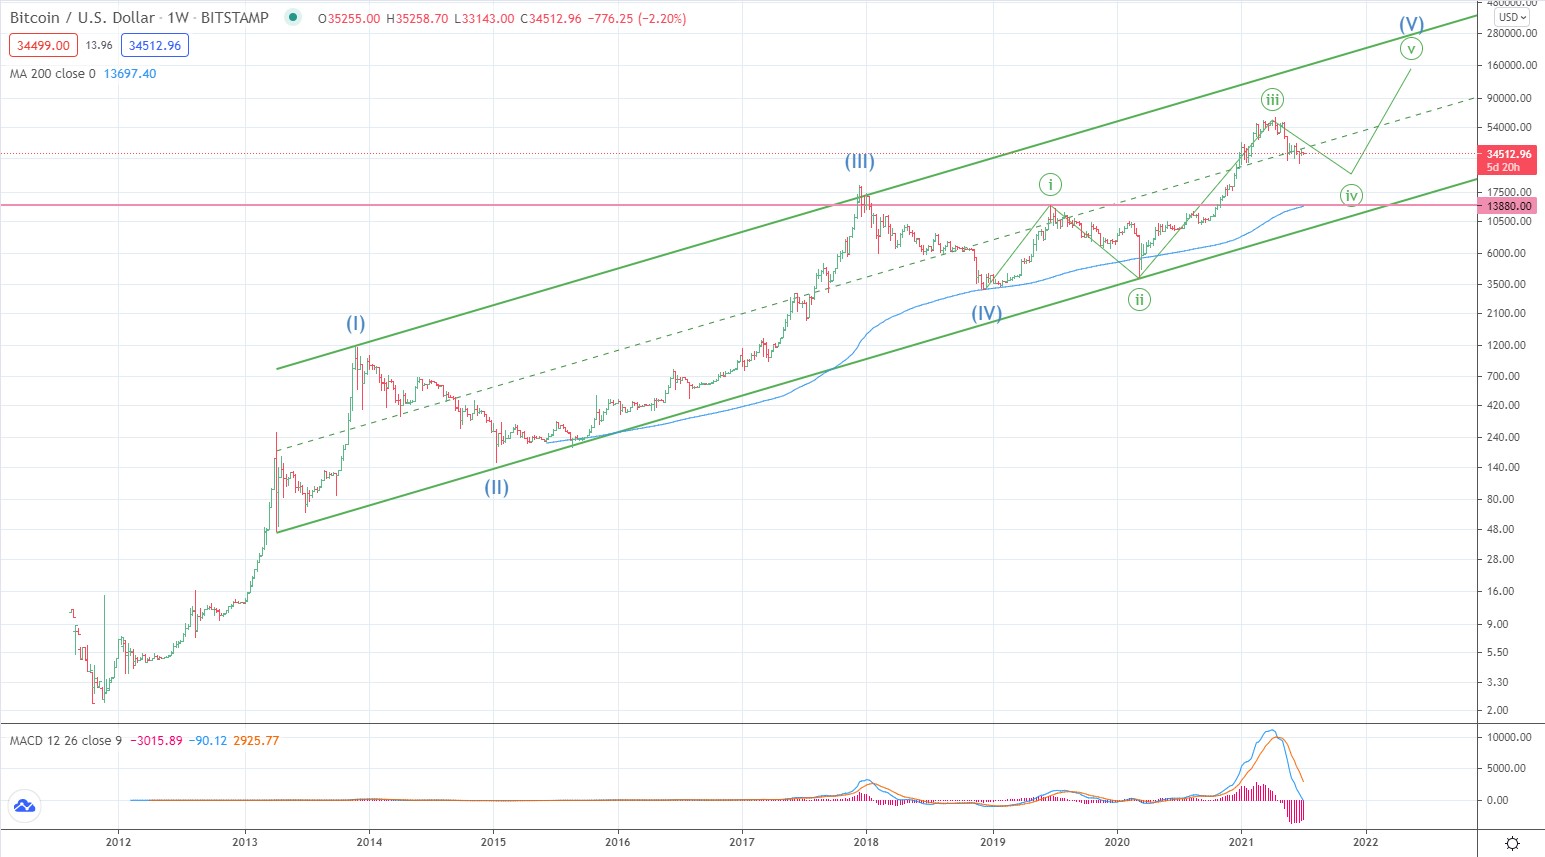
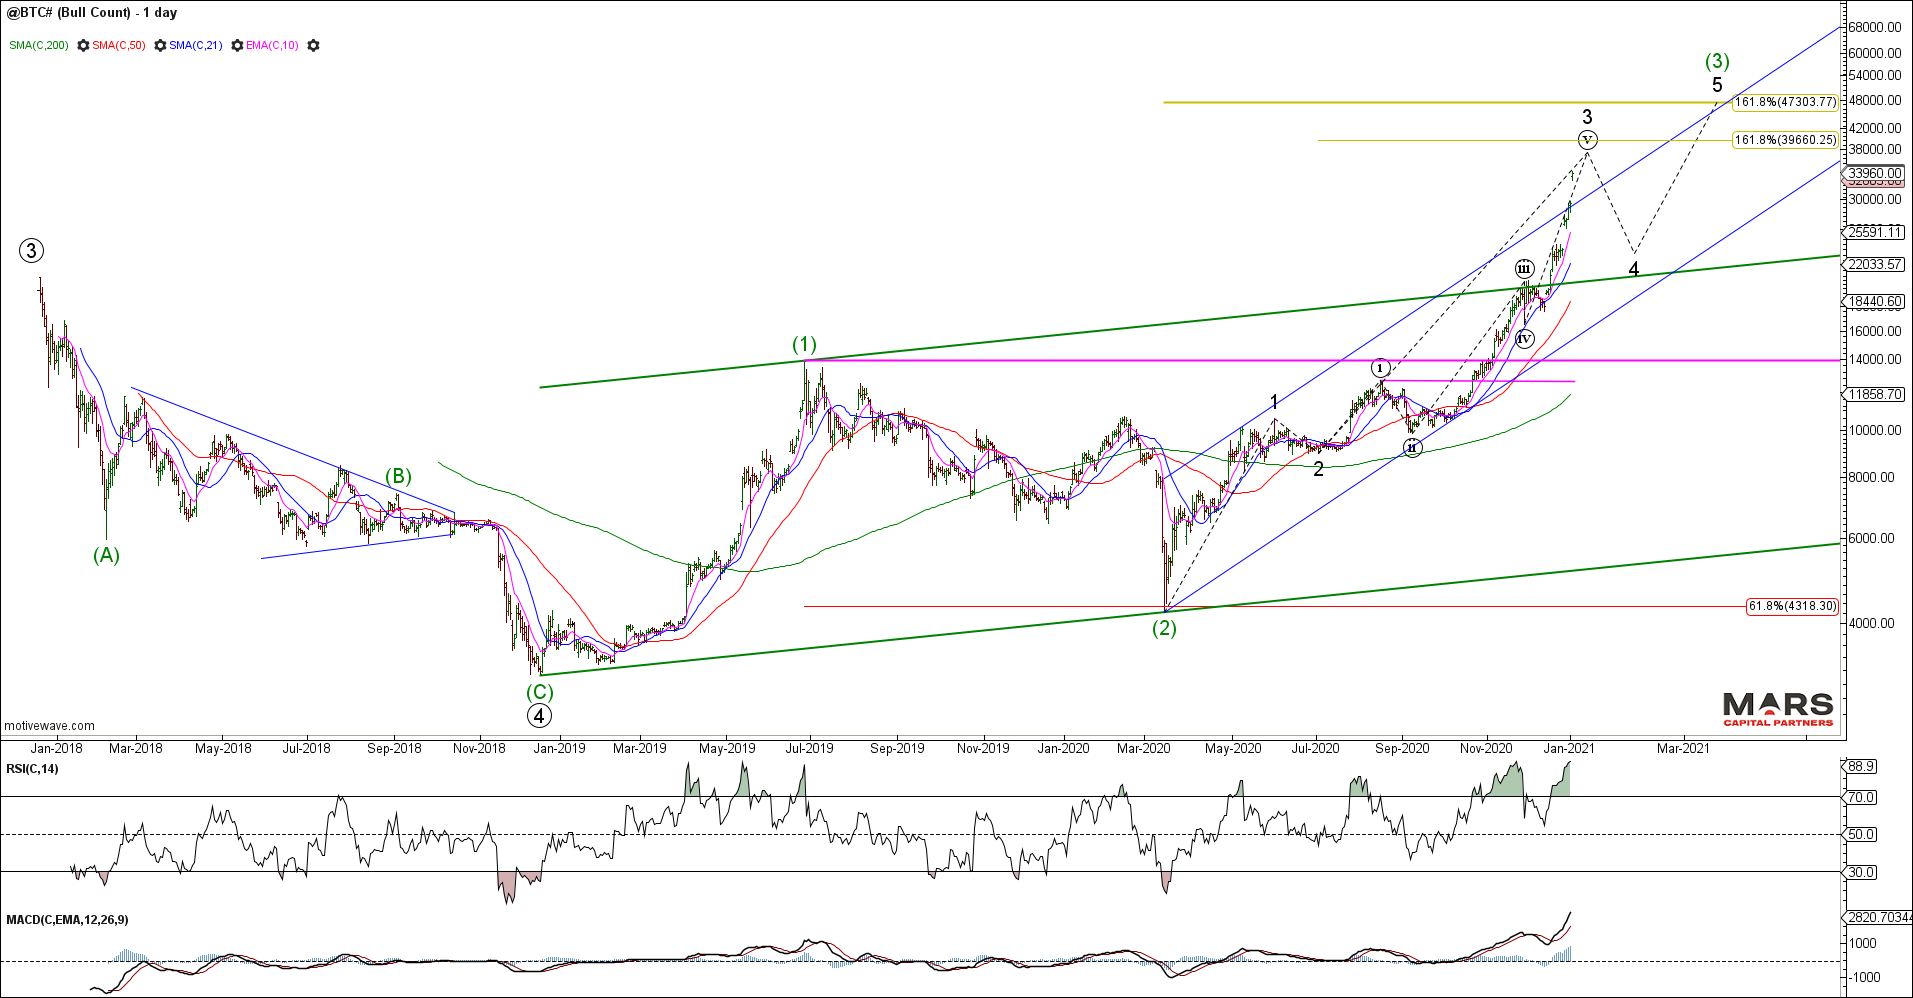
Bitcoin met our wave 3 targets before reversing impulsively for what is likely to be wave (a) of an a-b-c corrective decline for wave (iv). The bear case is that this latest rally was ALL of 5 but will only be confirmed with a decline back below 13880 wave (i) overlap.
Bitcoin Weekly semi-log
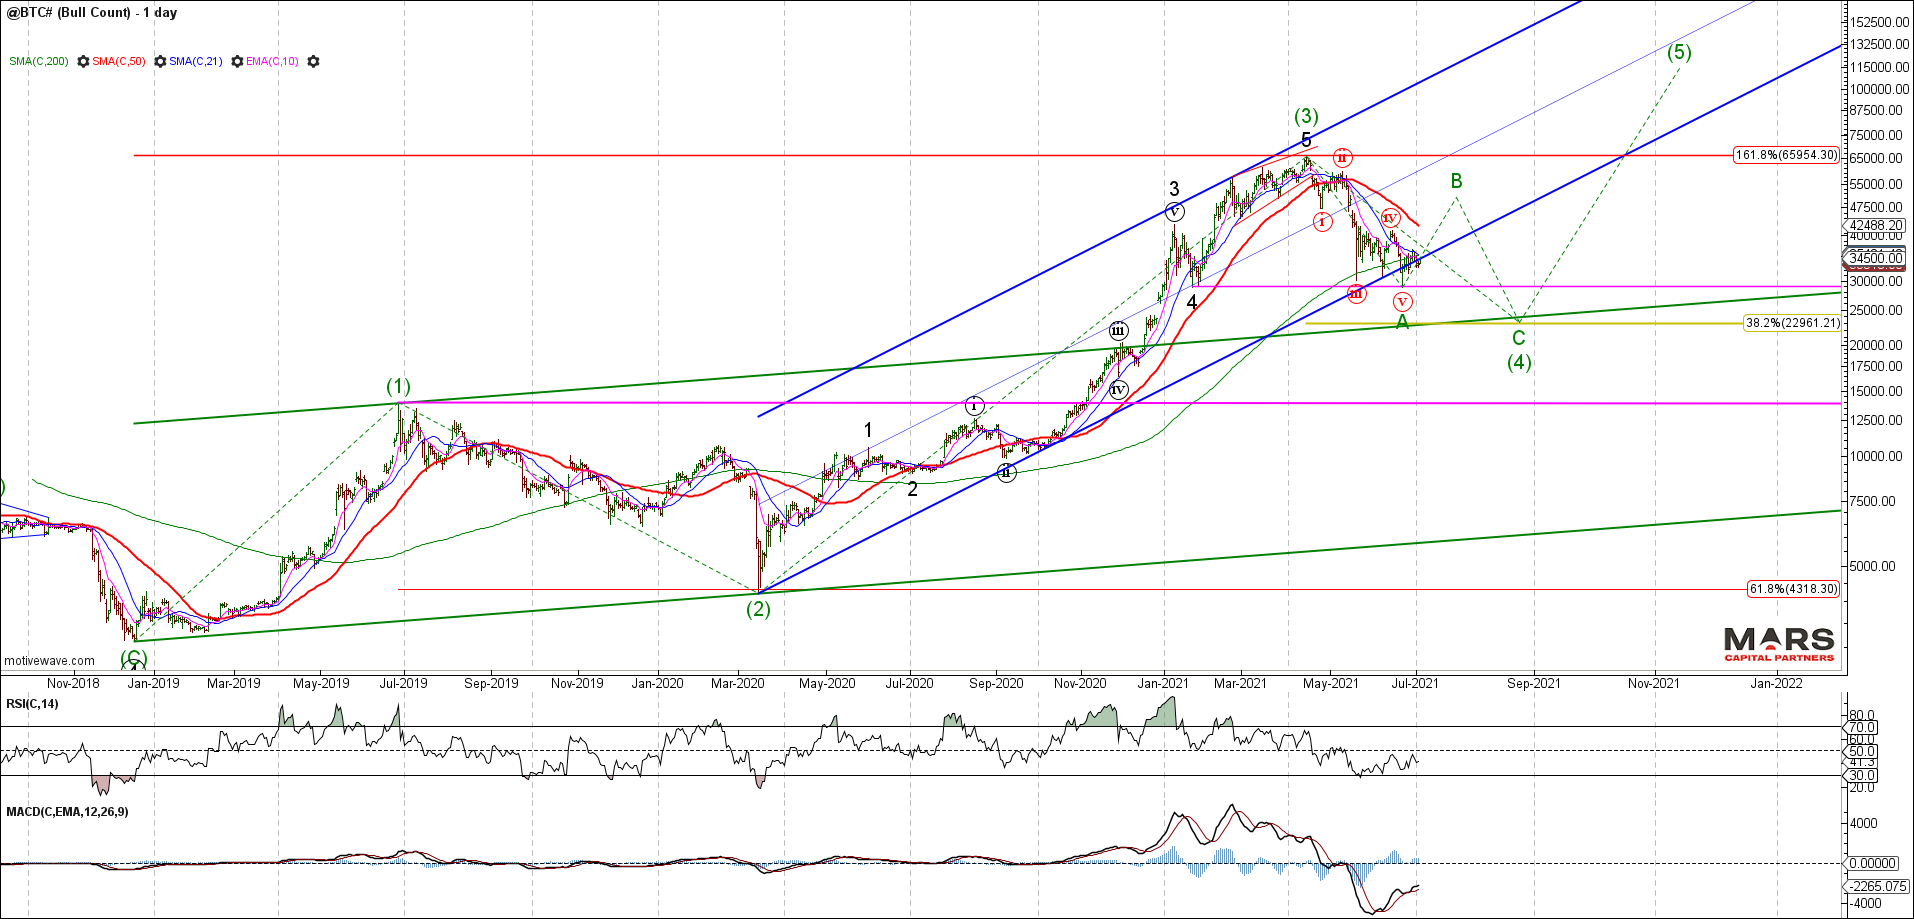
Bitcoin has enough waves in place to complete wave A of an a-b-c wave (4) corrective decline targeting the 23000 support zone. Any immediate decline back below 13880 overlap invalidates the long term bull count.
BTC Bull Case Daily semi-log
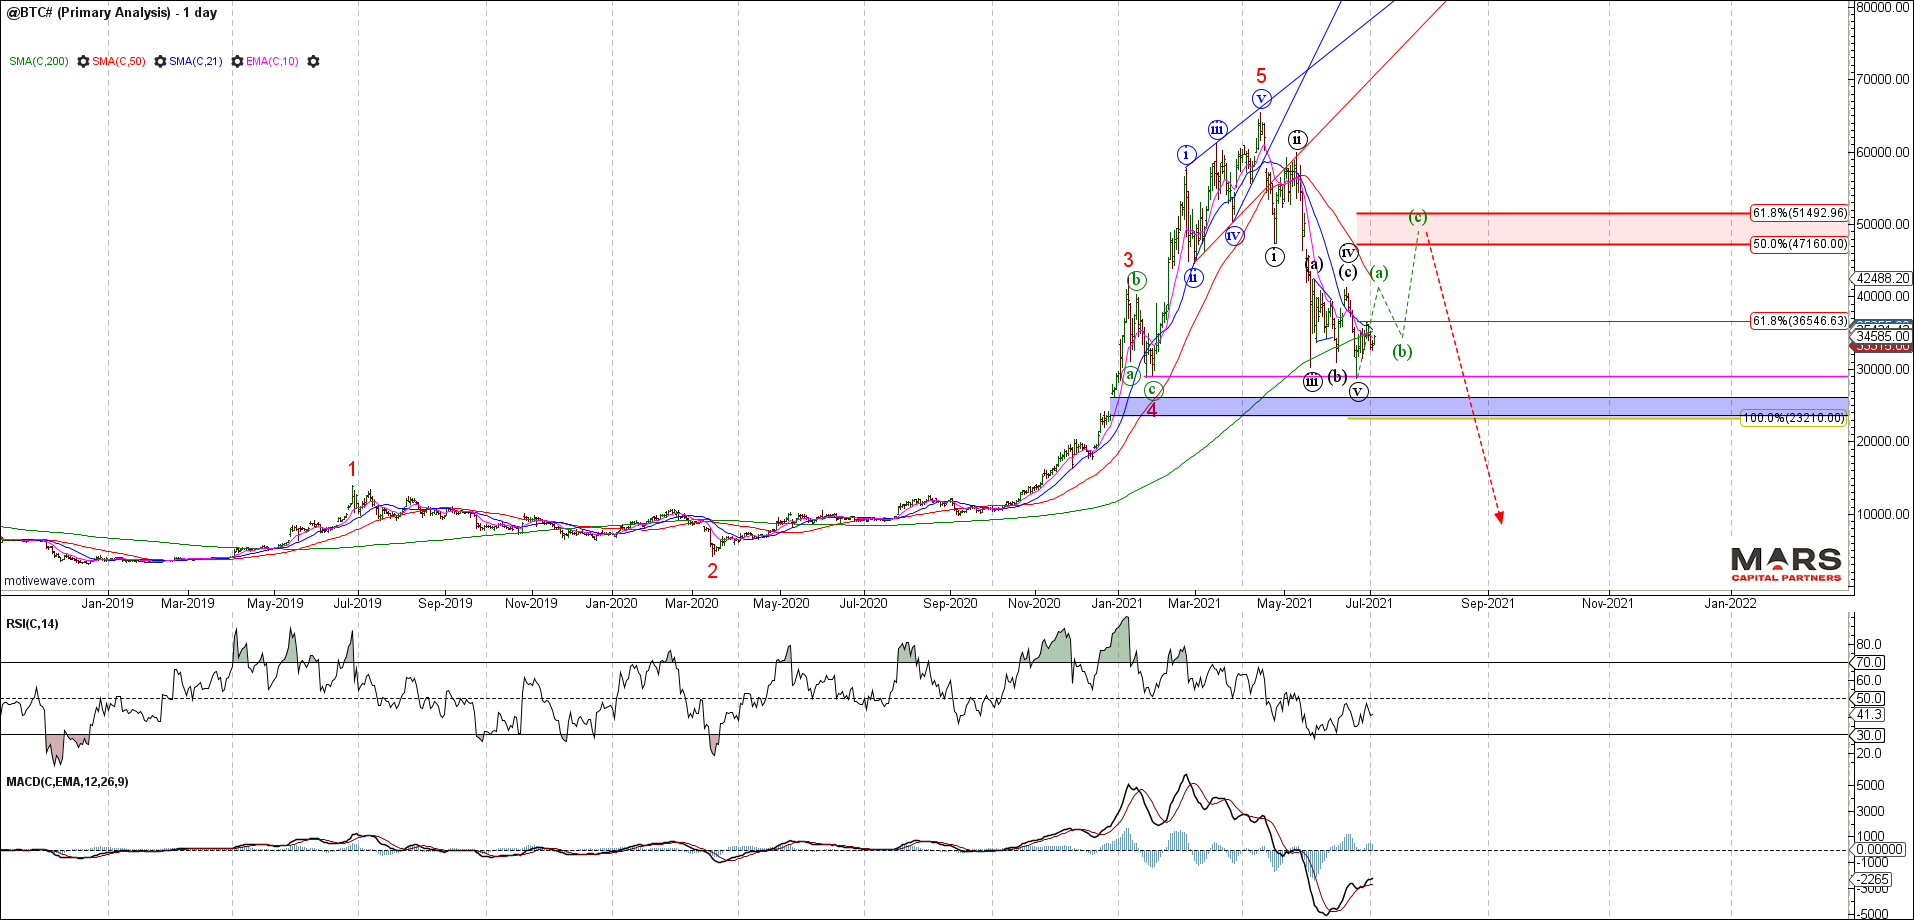
The Bitcoin bear case is for a completed 5 waves into the April highs followed by an impulsive wave down. Ideally, we see a corrective rally that targets the 47160-51500 fib resistance zone before the next wave down. Either way, we would like to see a strong counter trend rally that clears immediate resistance in the 36550 area. Near term bulls need to hold the wave (v) lows.
BTC Bear Case Daily
Wishing everyone a prosperous 2nd half of the year. Trade safe 🙂
As we head into 2021 with the tailwinds of historic fiscal and monetary stimulus coupled with a speculative “Tulip” mania (see Bitcoin, SPAC, Robinhood, etc) it is important to take note of WHERE we are in the cycle. We are nearing the very end of a super-cycle degree equity market rally.
What if we see global stagflation? Then we should expect to see a continued strong rally in commodities that will likely lead to a sharp reversal in rates, pressuring the CB’s to reverse the QE course, cost push pressures negatively impacting corporate earnings at a time when balance sheets are impaired with historically high debt levels. The result – rallying commodities, strong commodity currencies, sharply rising rates and bearish equities.
In this update, we will focus on the big picture macro charts defining the key trends.
Equities completing a super-cycle top
Our long term equity charts are warning of a super-cycle top at multiple degrees of trend. Our fundamentals analysis warns that this post-2009 rally is based on “hope”. Our sentiment analysis warns that in 2020, the retail investor finally joined the party – often the bag holders at the END of a speculative mania.
DJIA Quarterly log
The SPX shows a clearly impulsive rally from the 2009 lows – last year’s (B) wave top and (C) wave low in March provided the platform for a wave 5 of V to new ATH’s to end the multi-year super-cycle rally. We are looking for evidence of an end to this post-2009 rally which is expected to be “fully retraced” in a sustained bear market. Near term, the question is whether we blow-off higher in an accelerated speculative mania to complete wave 5 or just fade out into the highs as the bubble bursts.
SPX Monthly log
While our base case has us looking for an end to the big picture rally, there is NO evidence that the speculative rally has ended. While we continue to see higher highs and higher lows, the trend is your friend until it bends – note the 5th wave momentum divergence. Given we have achieved the minimum conditions for a final 5th wave rally (new ATH’s) we are now alert to the potential for a bearish reversal and market top. Our job is to try to identify the end when it occurs and NOT pre-empt a turn without price confirmation. We need to see a completed 5th wave rally followed by an impulsive change in trend – this is our goal for 2021.
SPY Daily Close
The Russell 2000 / RTY probably provides the clearest wave structure since breaking out to new ATH’s in what appears to be a 3rd wave. This bullish chart argues for a continued bigger picture equities rally through H1 2021. This impulsive wave structure remains bullish while above our key 1650 overlap and would look best with a continued big picture rally. Trade back below 1650 invalidates this bullish wave count. While there are enough waves in place to complete wave 3 near term, we do NOT have confirmation of a near term top as the sequence of higher highs and higher lows continues within this breakout.
RTY Daily
While equities have pushed to new ATH’s, the VIX remains elevated supported mostly by speculative call buying. While the VIX continues to compress in another declining wedge, we know that volatility compression leads to volatility expansion. We are looking for a bullish turn in VIX that will coincide with a bearish trend exhaustion in equities.
VIX Weekly
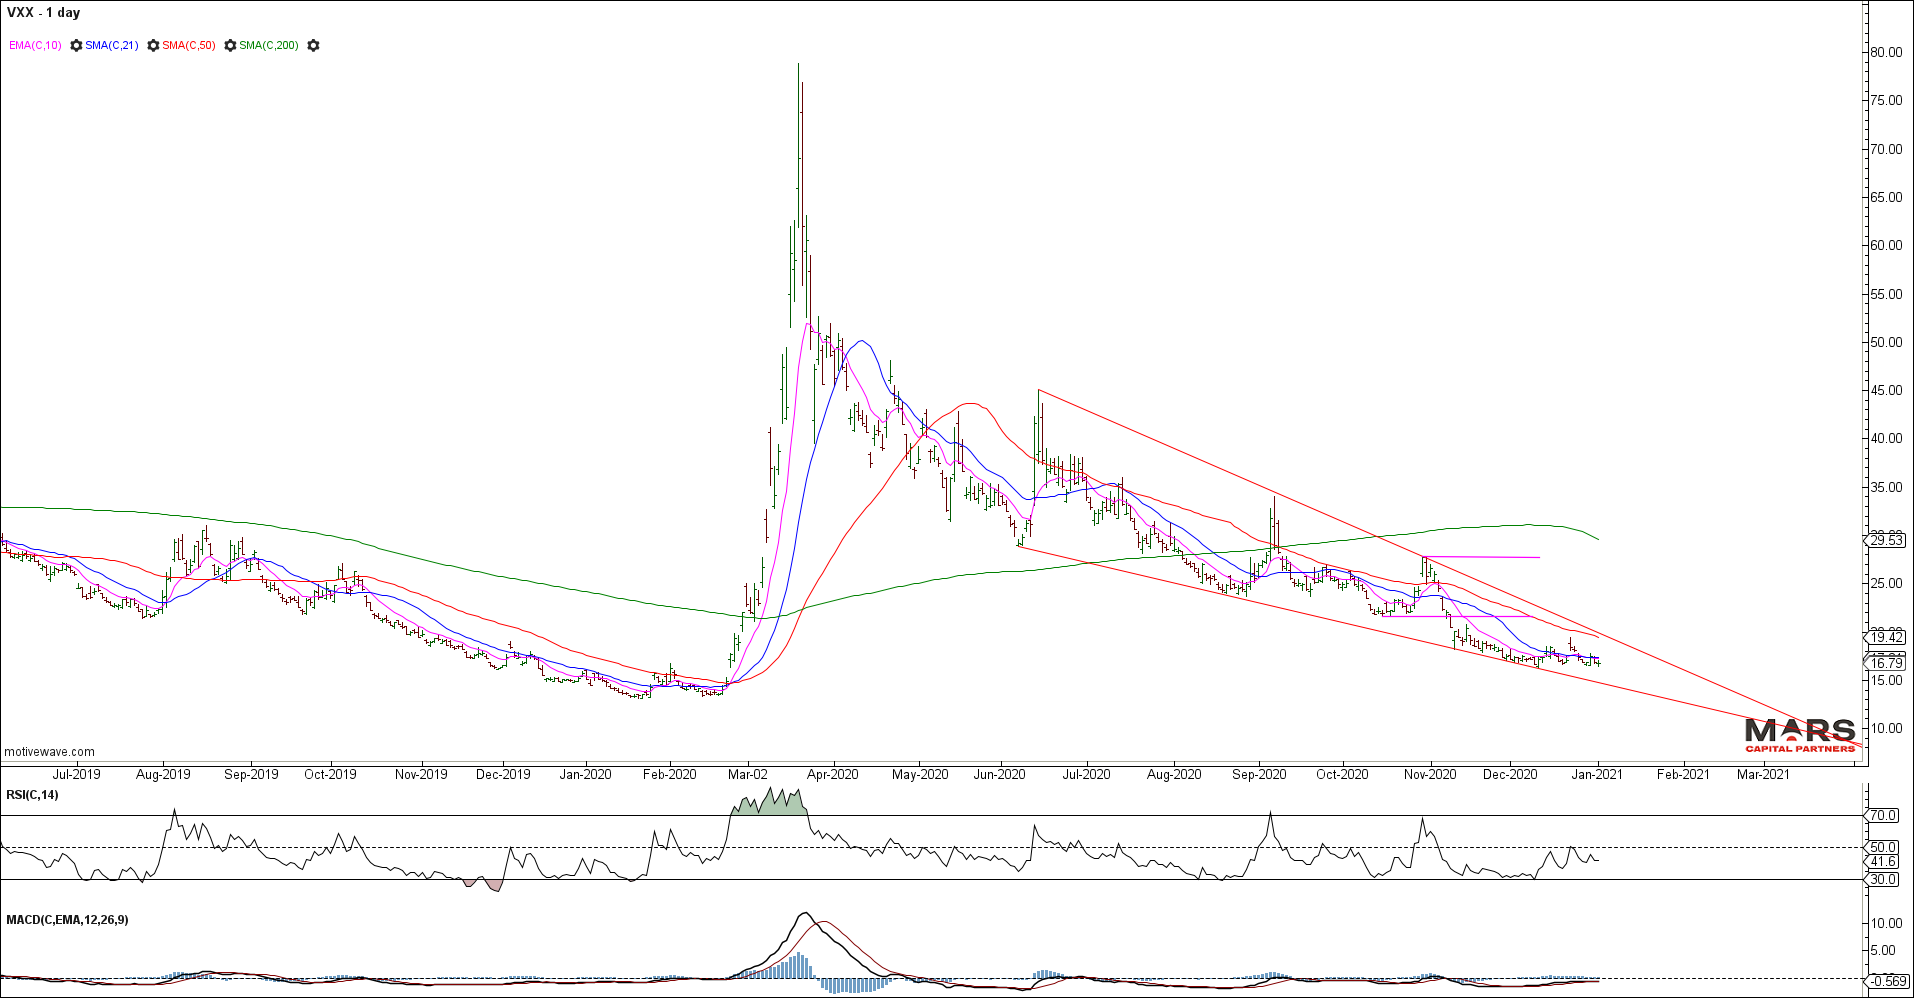
VXX wedging into the lows… note the bullish momentum divergence at recent lows.
VXX Daily
Bond markets and Rates
Last year, the TLT spiked to new 5th wave highs as expected but the ensuing decline appears corrective. This structure keeps the door open to new ATH’s in bonds and new cycle lows for rates. Near term the TLT remains bearish as we look for a hard test of the 153 area support for a potentially completed correction. While we do have a completed 5 wave rally into the March highs, we cannot confirm a long term top in TLT. Near term inflection point for bonds.
TLT Weekly
Long term rates made new cycle lows as expected in March 2020 after a disorderly break of its long term declining trend channel. Rates have recovered “correctively” to retest the long term channel break. The structure of the rally in rates appears corrective and therefore it is likely we see new lows in rates before a sustainable low can be established.
TYX Monthly log
FX markets and the US$
The DXY has declined impulsively from its March 2020 wave (B) highs. Our base case is that this decline is in the final waves of an a-b-c correction with the DXY turning bullish early in the new year. While minimum targets have been met for an impulsive 5 wave decline, our measured targets for wave (C) remain lower towards 87.50 where (A)=(C) and a 50% retracement from the January 2017 highs. We are now looking for evidence of a bullish reversal in the DXY to establish longs as we approach this inflection point.
DXY Weekly
DXY shorts pressing into new cycle lows…
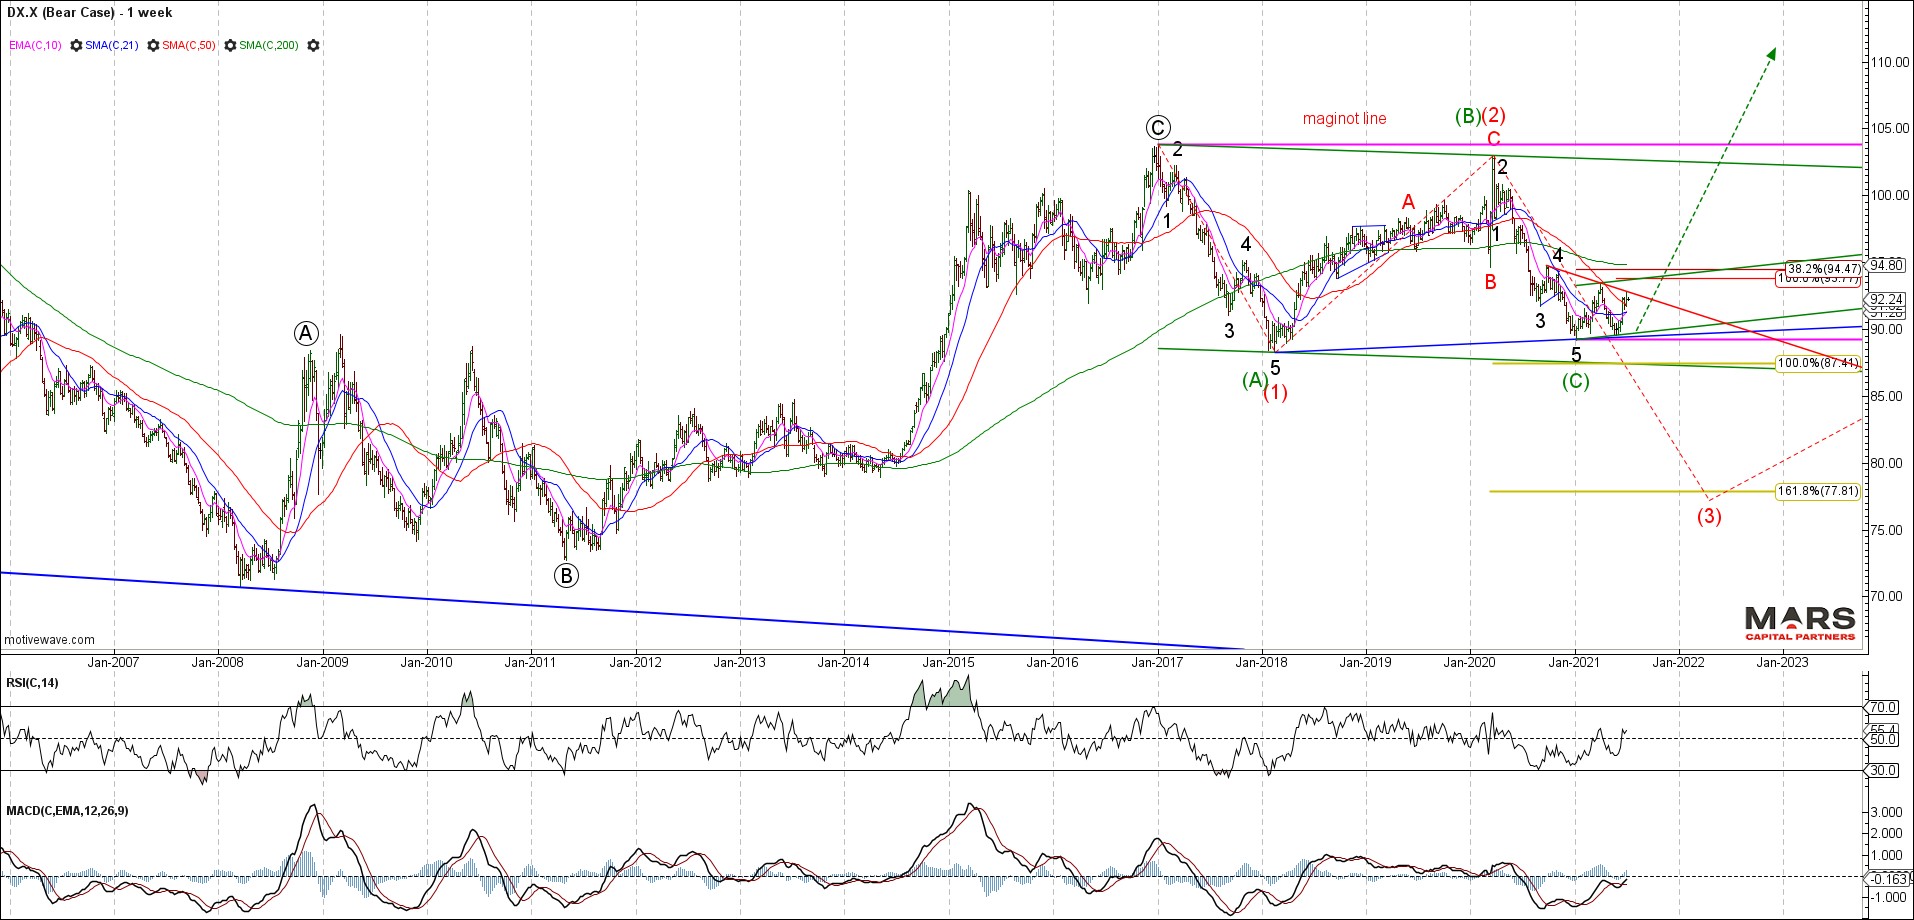
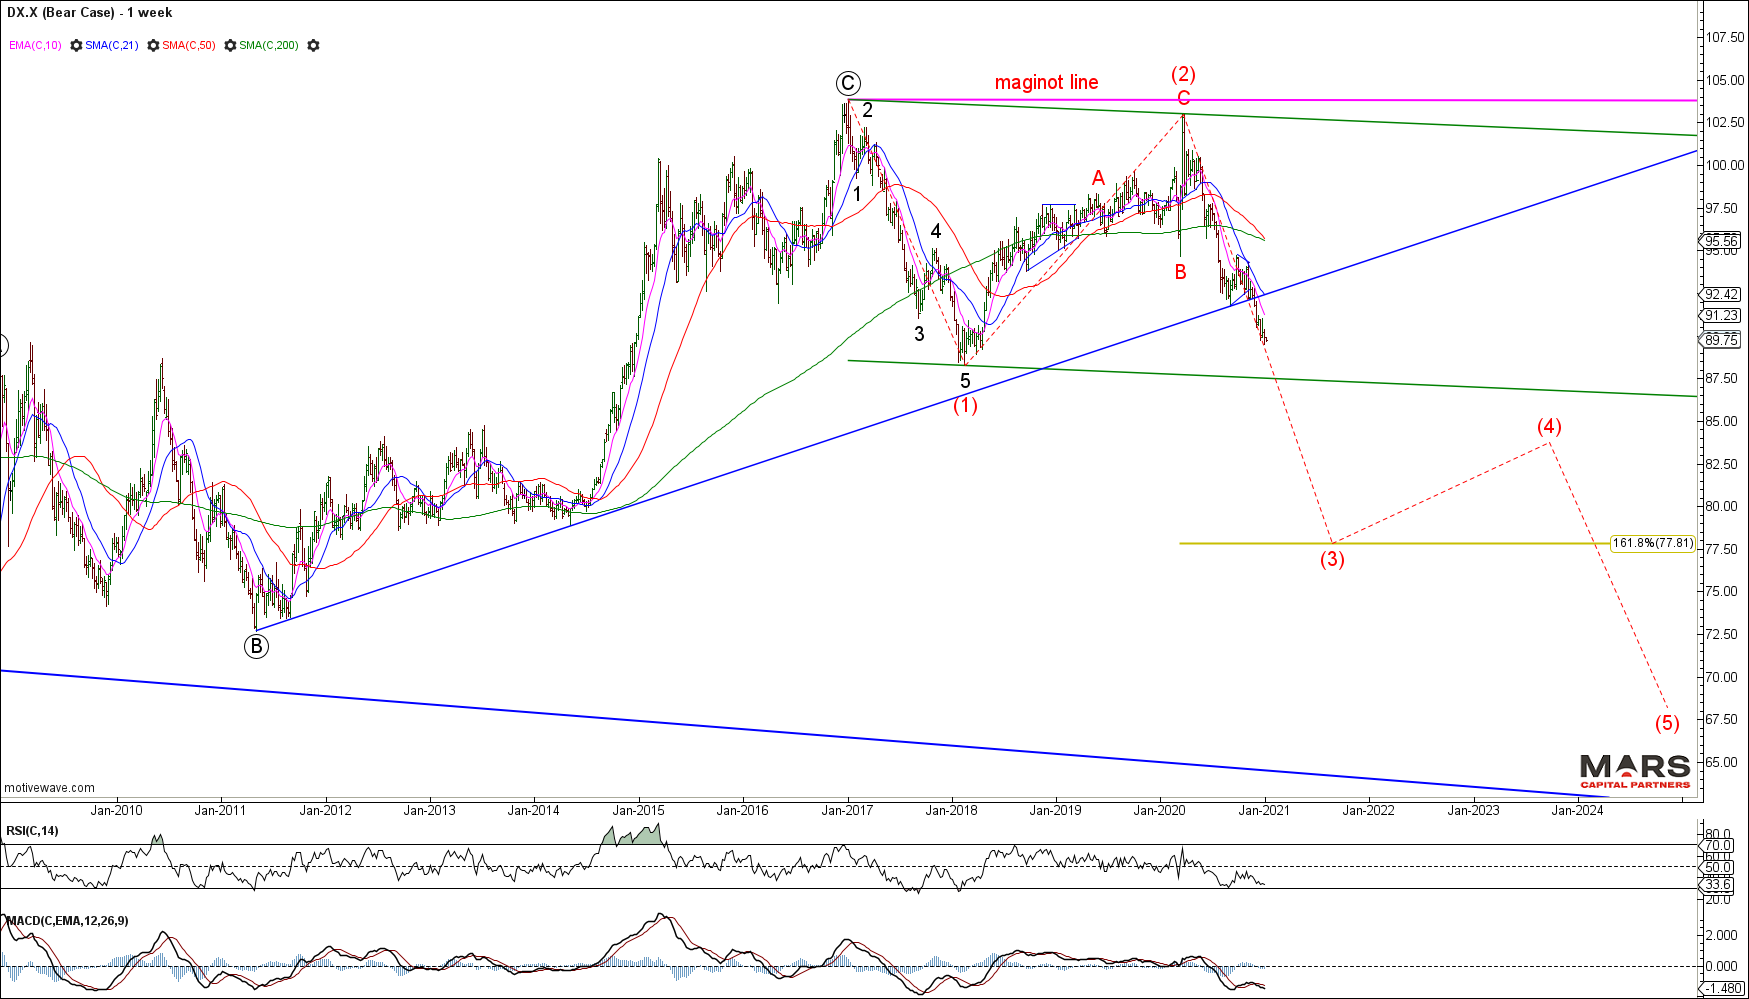
What if we are wrong about the DXY? The Bear Case will likely see a continued impulsive decline for wave (3) towards 77.80 measured targets, changing the big picture structure to long term bearish US$. We have little evidence yet to support this outlook, but we should be mindful of the possibility if the DXY fails to hold measured support.
DXY Bear Case Weekly
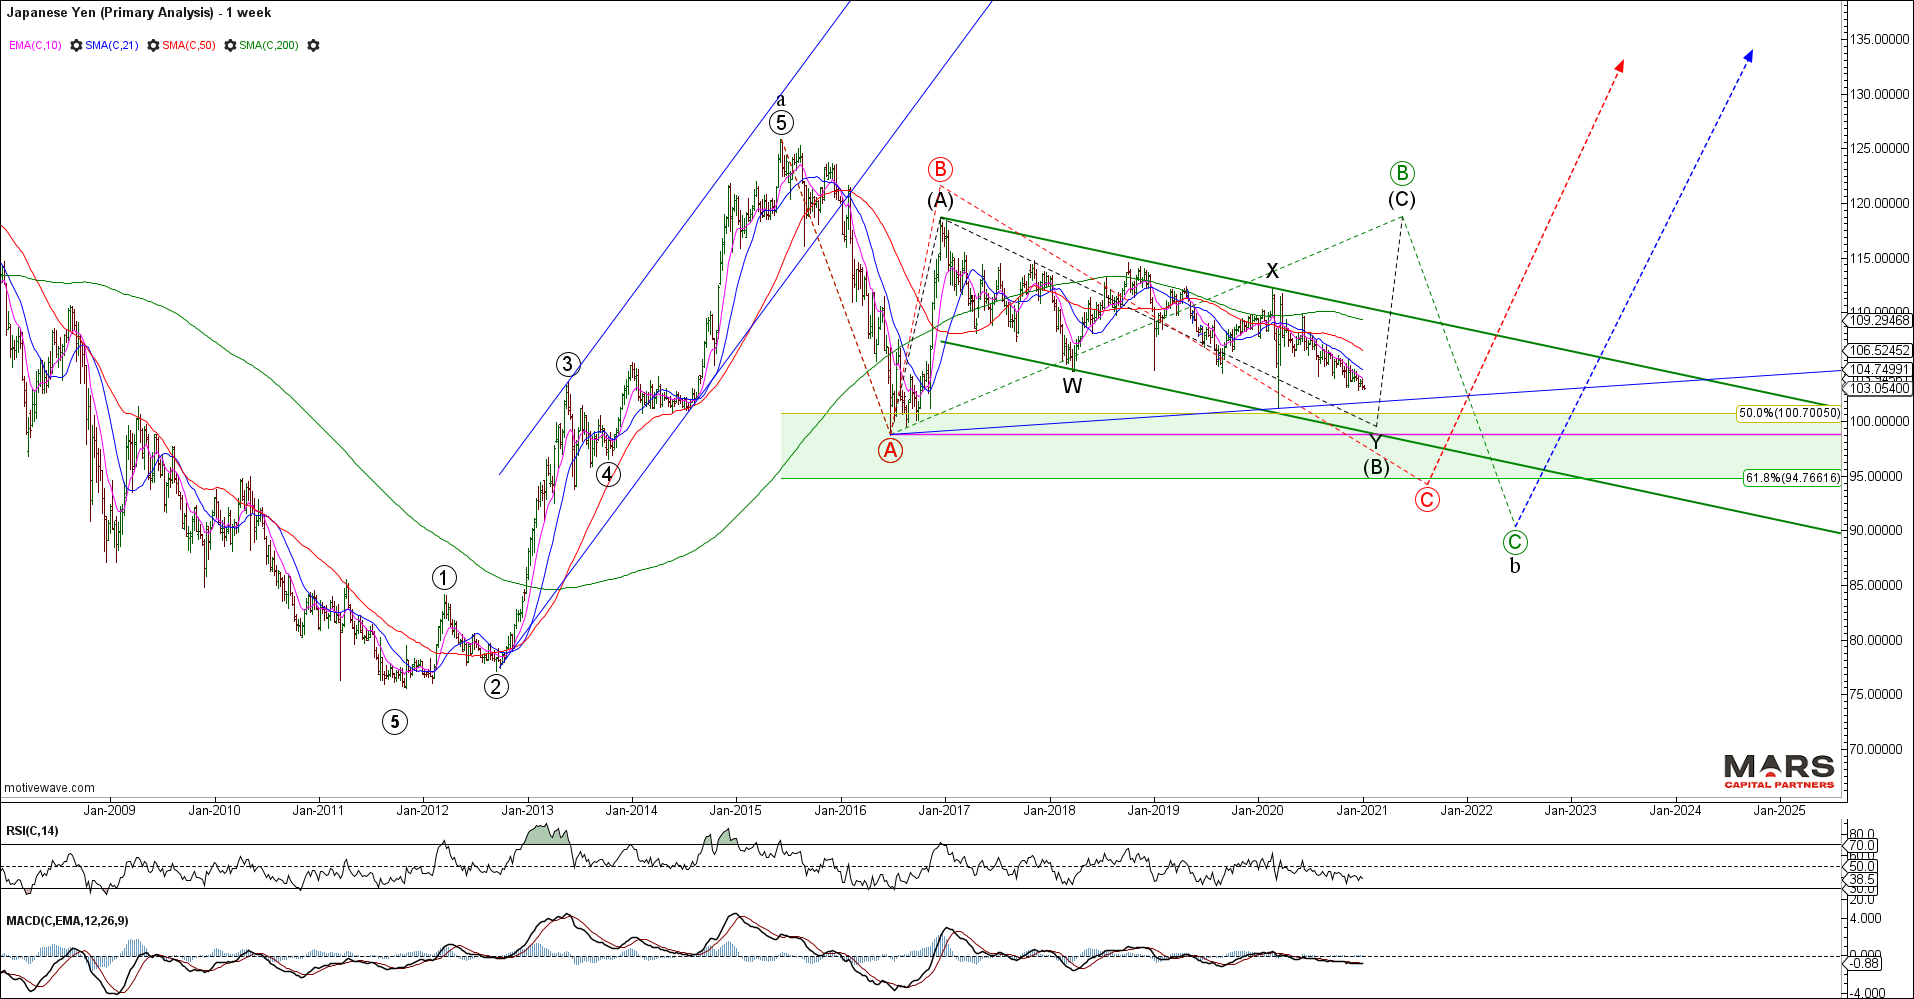
The USDJPY structure is defined by the impulsive rally from 2011-2015 from where we have seen a corrective (managed) decline. We are looking for an opportunity to go long USDJPY once the corrective decline is complete as we are bullish this pair from a structural perspective. Near term, we have no evidence of a tradable low. Patience.
USDJPY Weekly
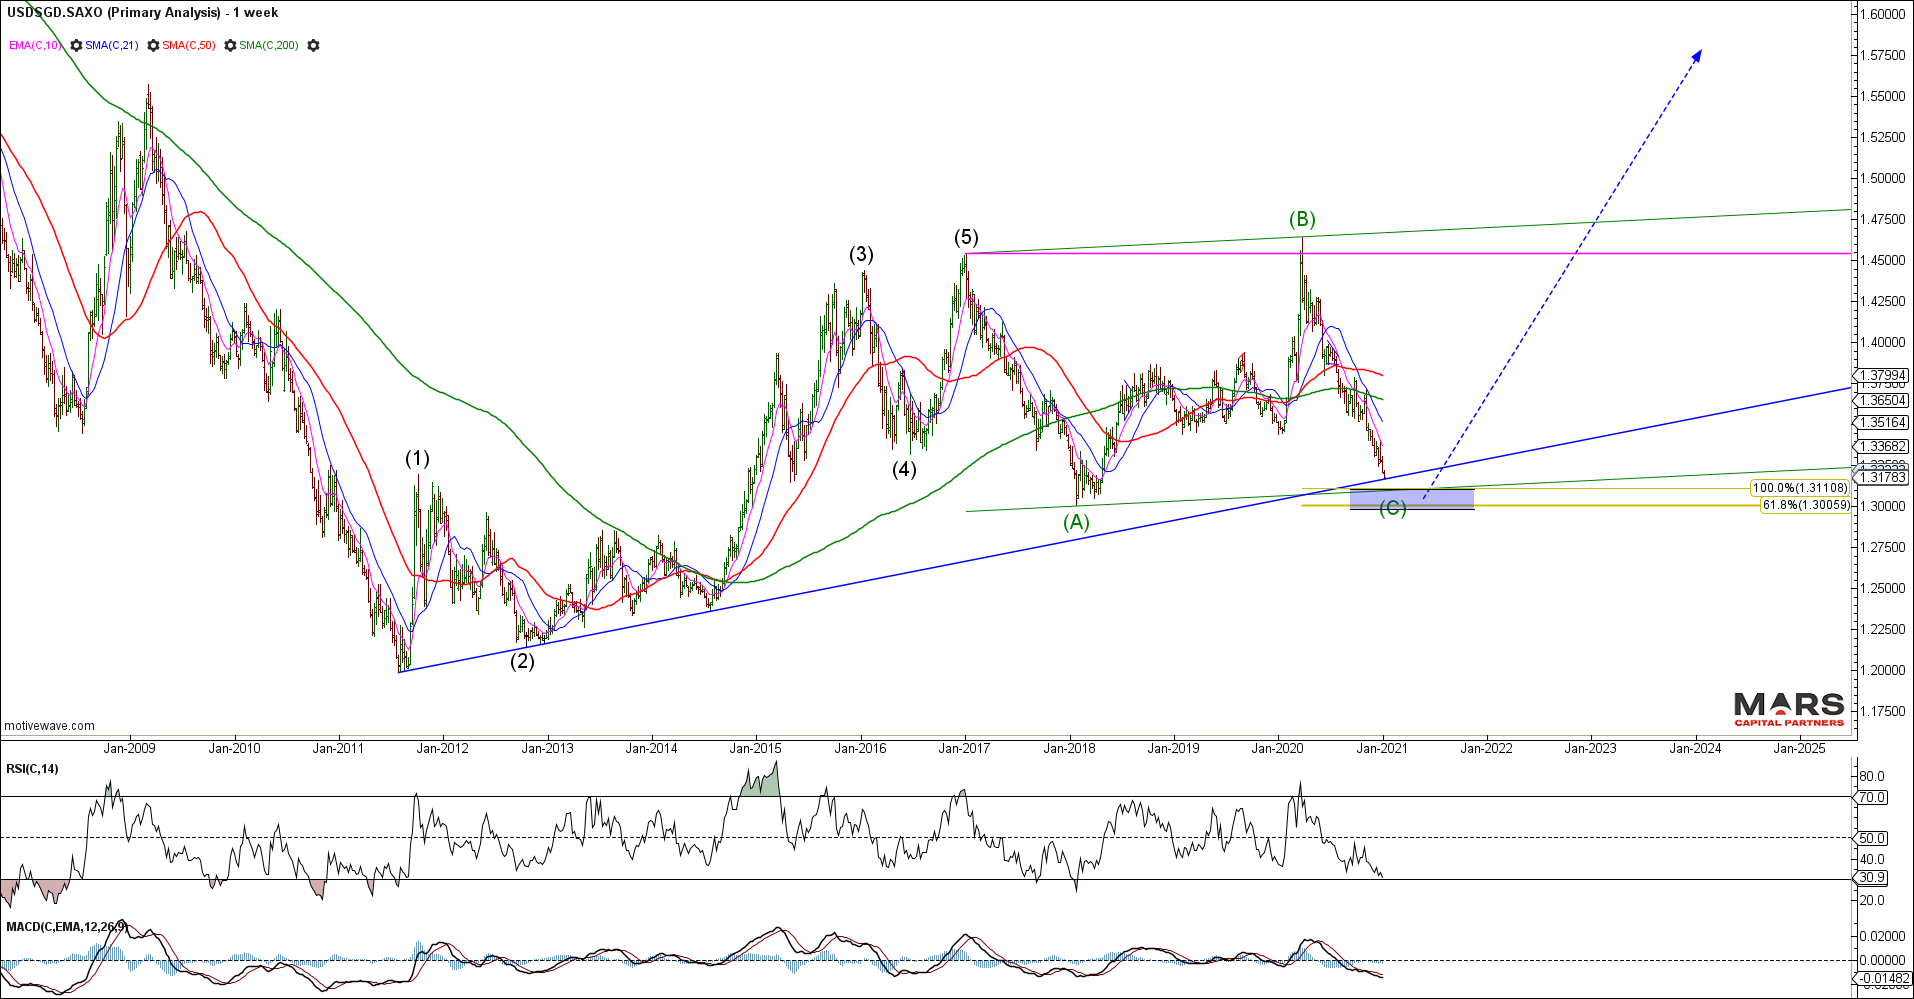
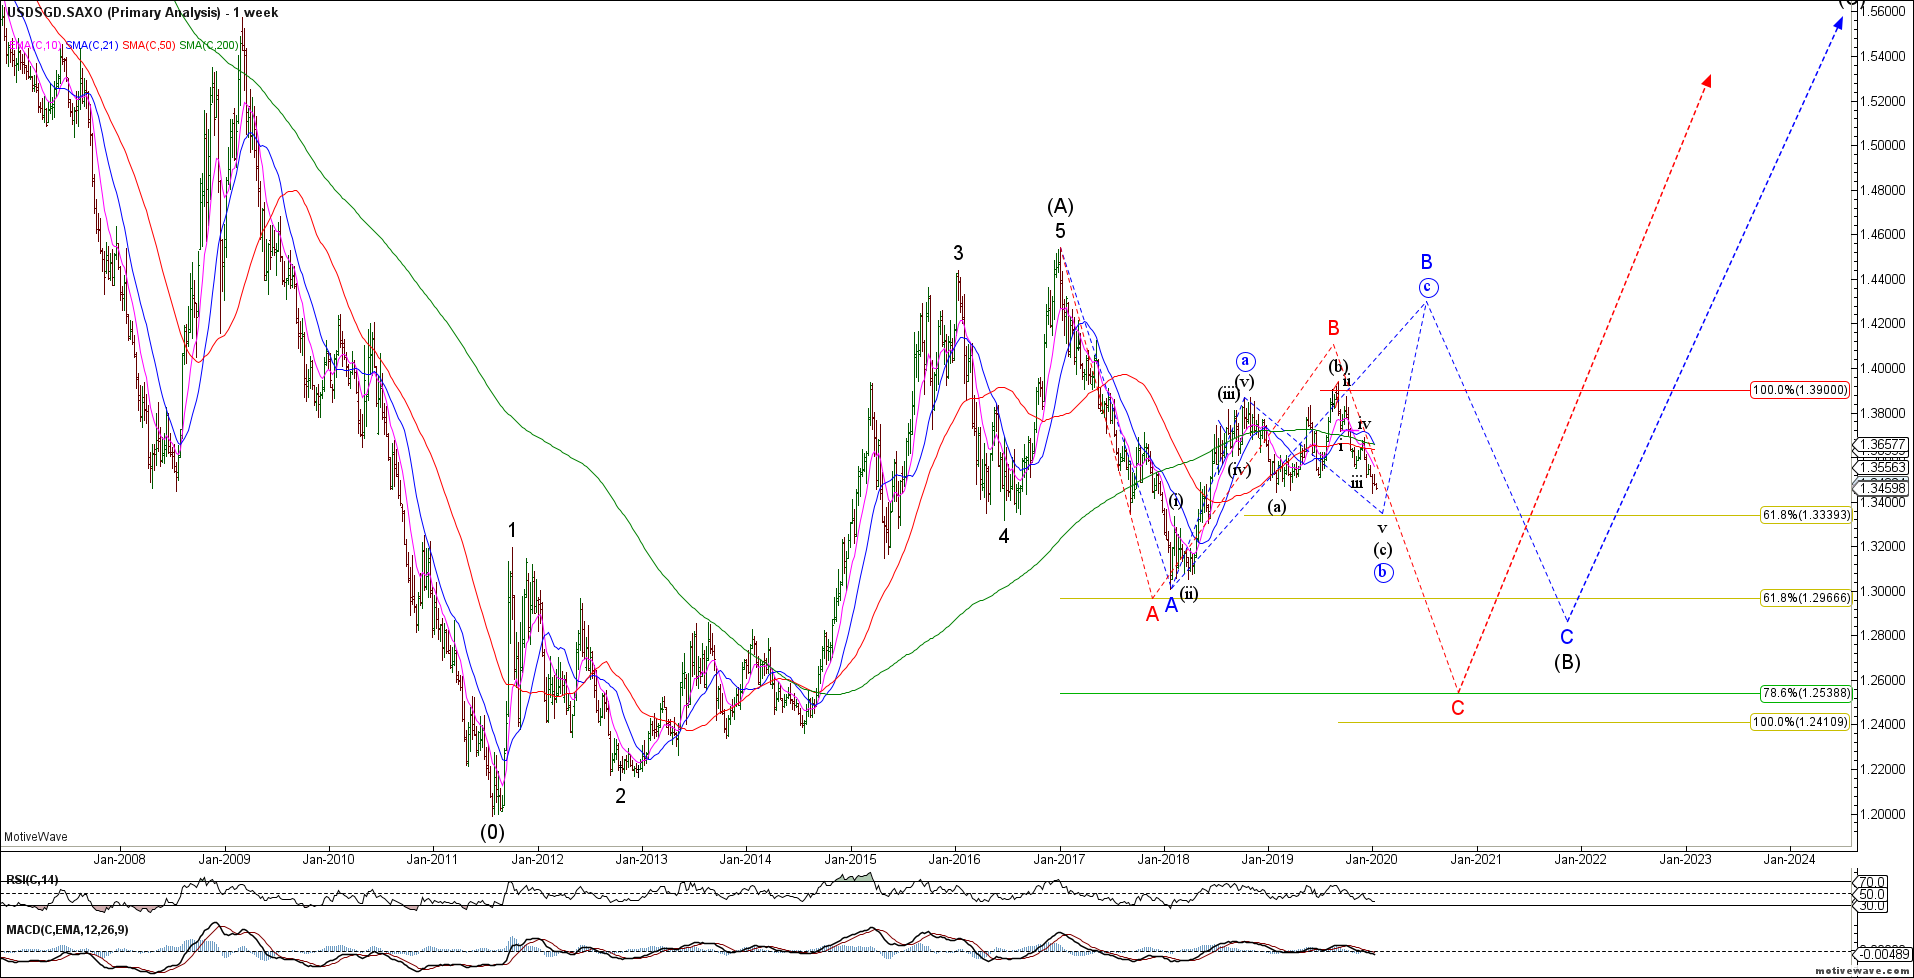
The USDSGD supports our bigger picture bullish outlook for the US$ and is now approaching measured targets for a corrective a-b-c decline. We have layered support in the 1.30-1.31 area from where we are looking for a bullish turn. We have no evidence yet of a tradable low but we are alert to a big picture bullish turn.
USDSGD Weekly
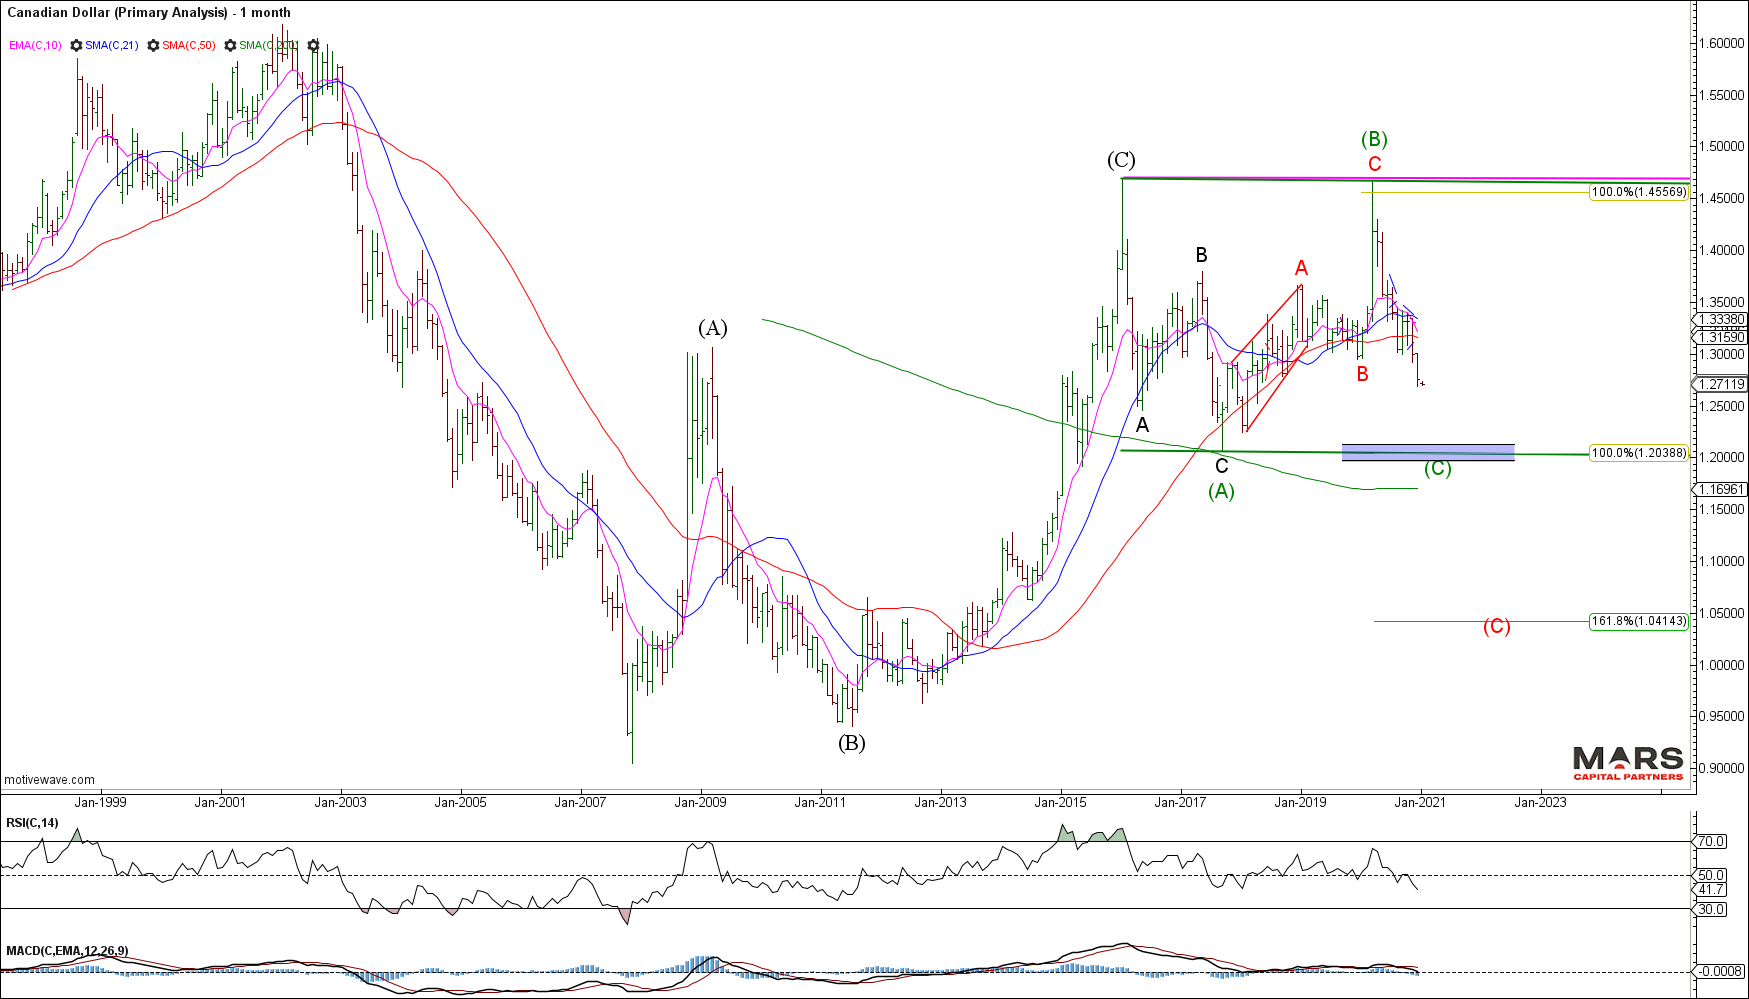
The commodity currencies remain bullish with targets for USDCAD lower towards the 1.20-1.21 measured equality for an a-b-c decline with the potential for much lower. This wave structure supports our near term bullish outlook for Crude Oil.
USDCAD Monthly
Bullish Commodities
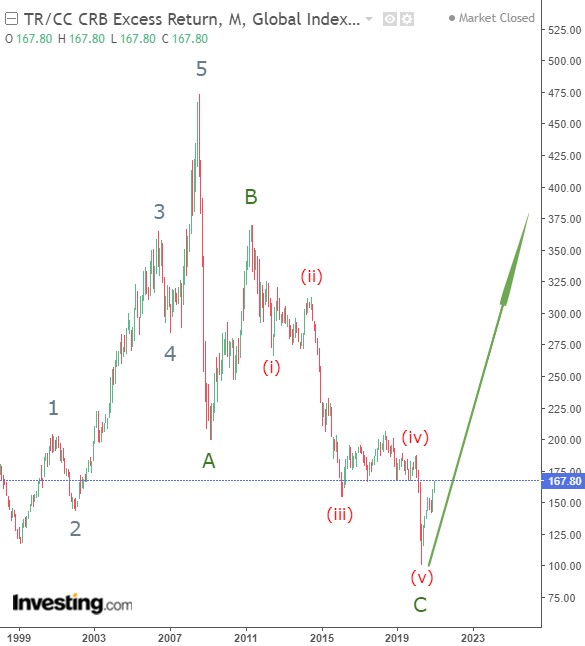
Are industrial commodities the next great trade? The CRB Index peaked in July 2008 at 474 before declining a fibonacci 78.6% to its major cycle low at 101 in April 2020. We now have what appears to be a completed zigzag A-B-C decline from the 2008 highs – this year’s impulsive rally opens the door for a resumption of the bull trend in commodities.
CRB Index Monthly
Crude Oil is representative of the bullish commodity story. We have a corrective 3 waves down of equality from the 2008 highs and small degree impulse higher from the April 2020 lows. We remain bullish commodities until proven otherwise.
CL Monthly
CL could be in the early stages of a strong 3rd wave rally. Only trade back below November’s 33.64 low would invalidate the strong impulsive uptrend. We are buyers on any near term corrective pullback with a long term bullish outlook.
CL Daily
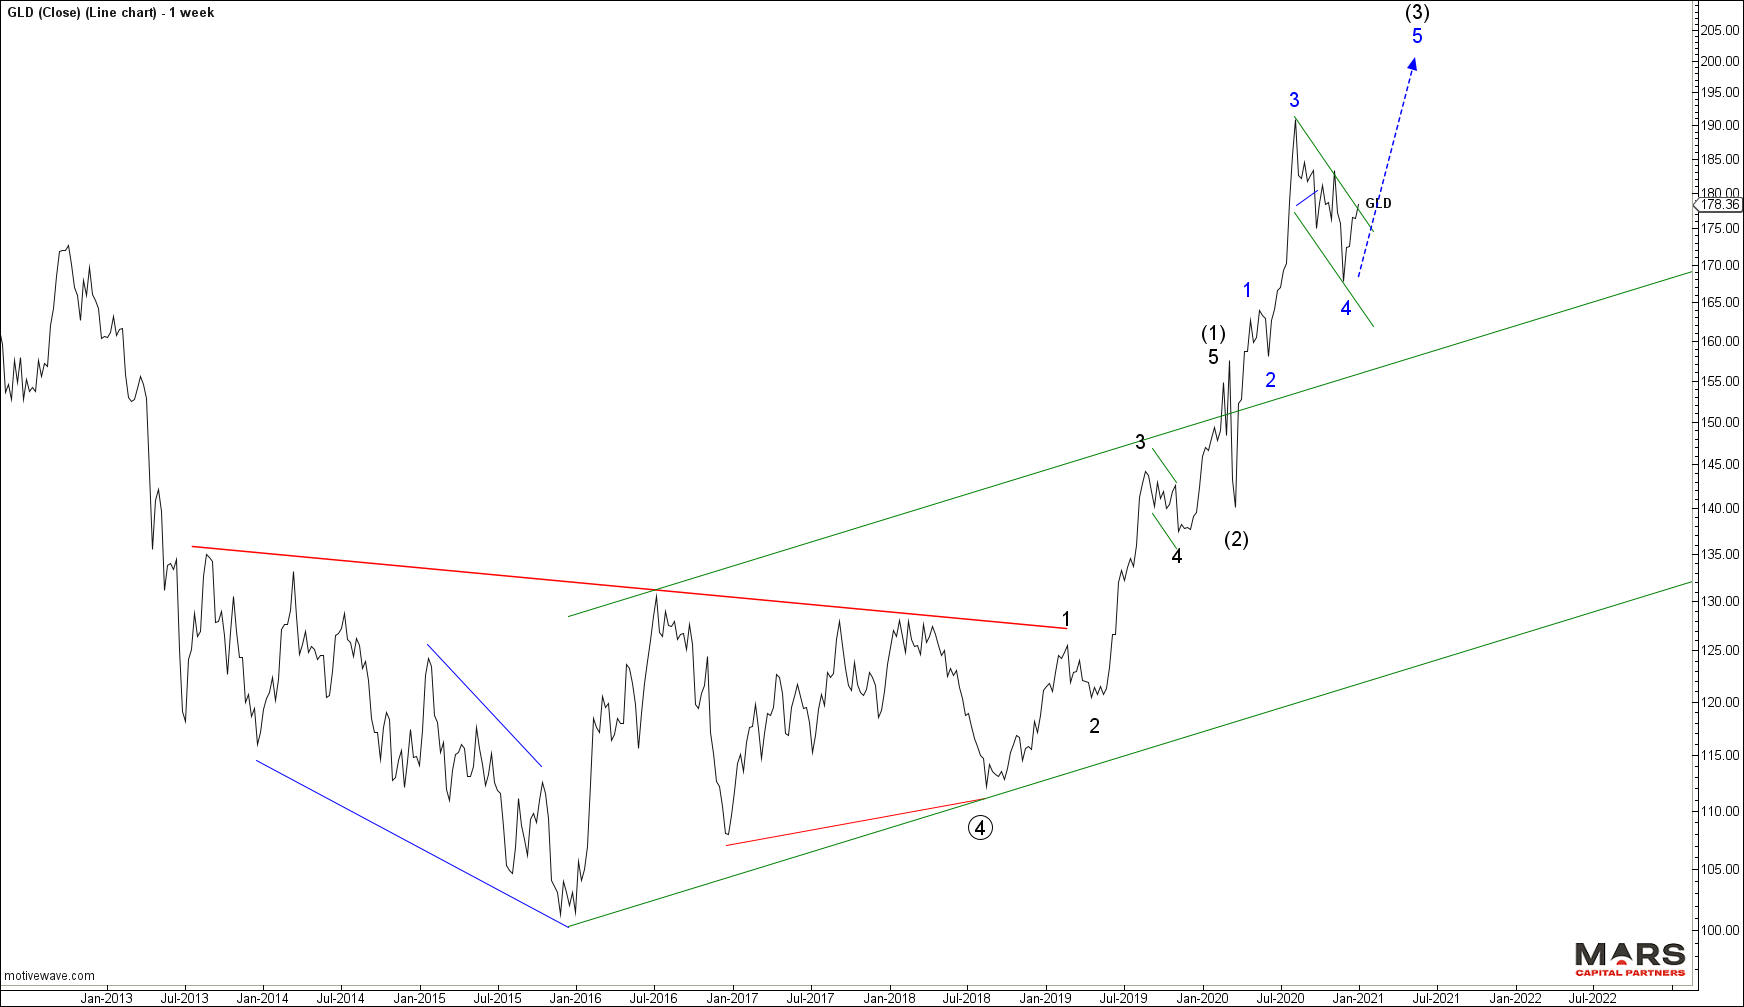
Gold / GLD is also threatening to break higher from its wave 4 bull flag. We had identified the recent decline as clearly corrective so we expect the rally to continue in wave 5 of (3) to new cycle highs.
GLD Weekly
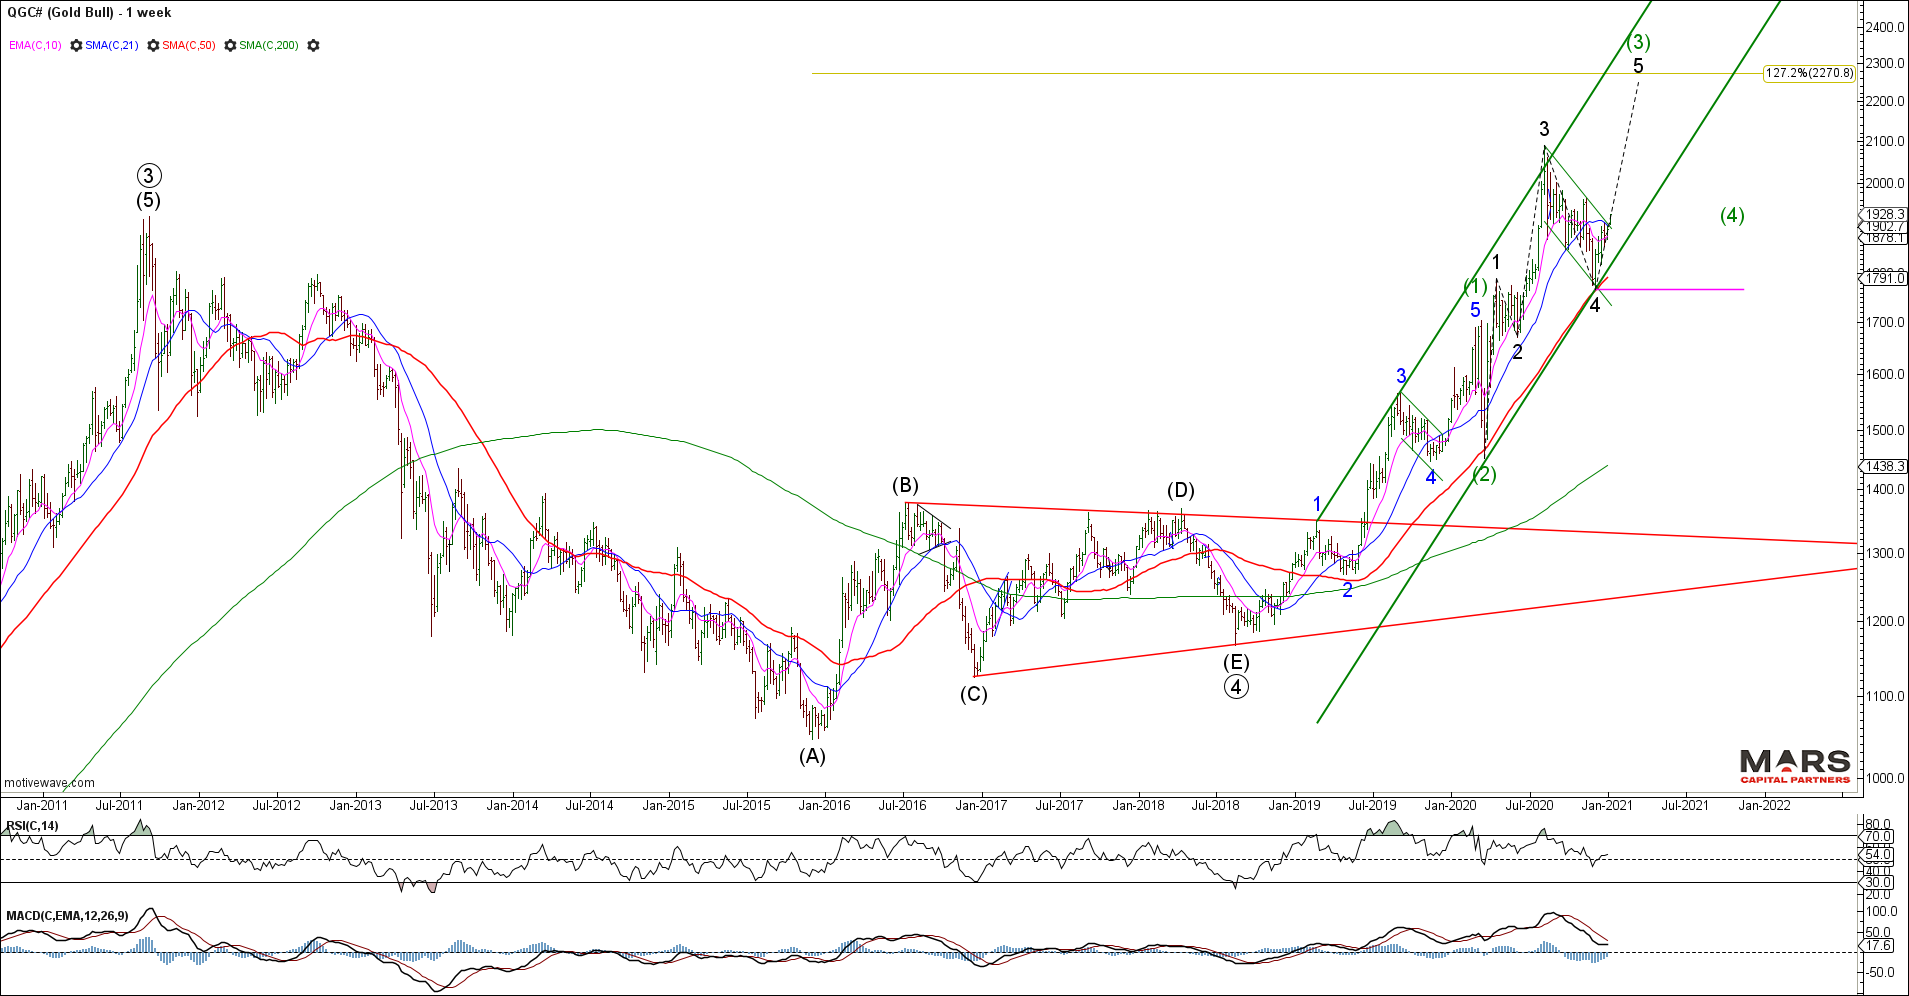
While not the ideal wave structure, Gold has rallied strongly from our 50 week sma and trend channel support opening the door to a push to new highs. The recent decline was clearly corrective (bull flag) so while the count may be wrong, the bullish outlook remains in tact for Gold.
Gold Weekly
Bullish Crypto
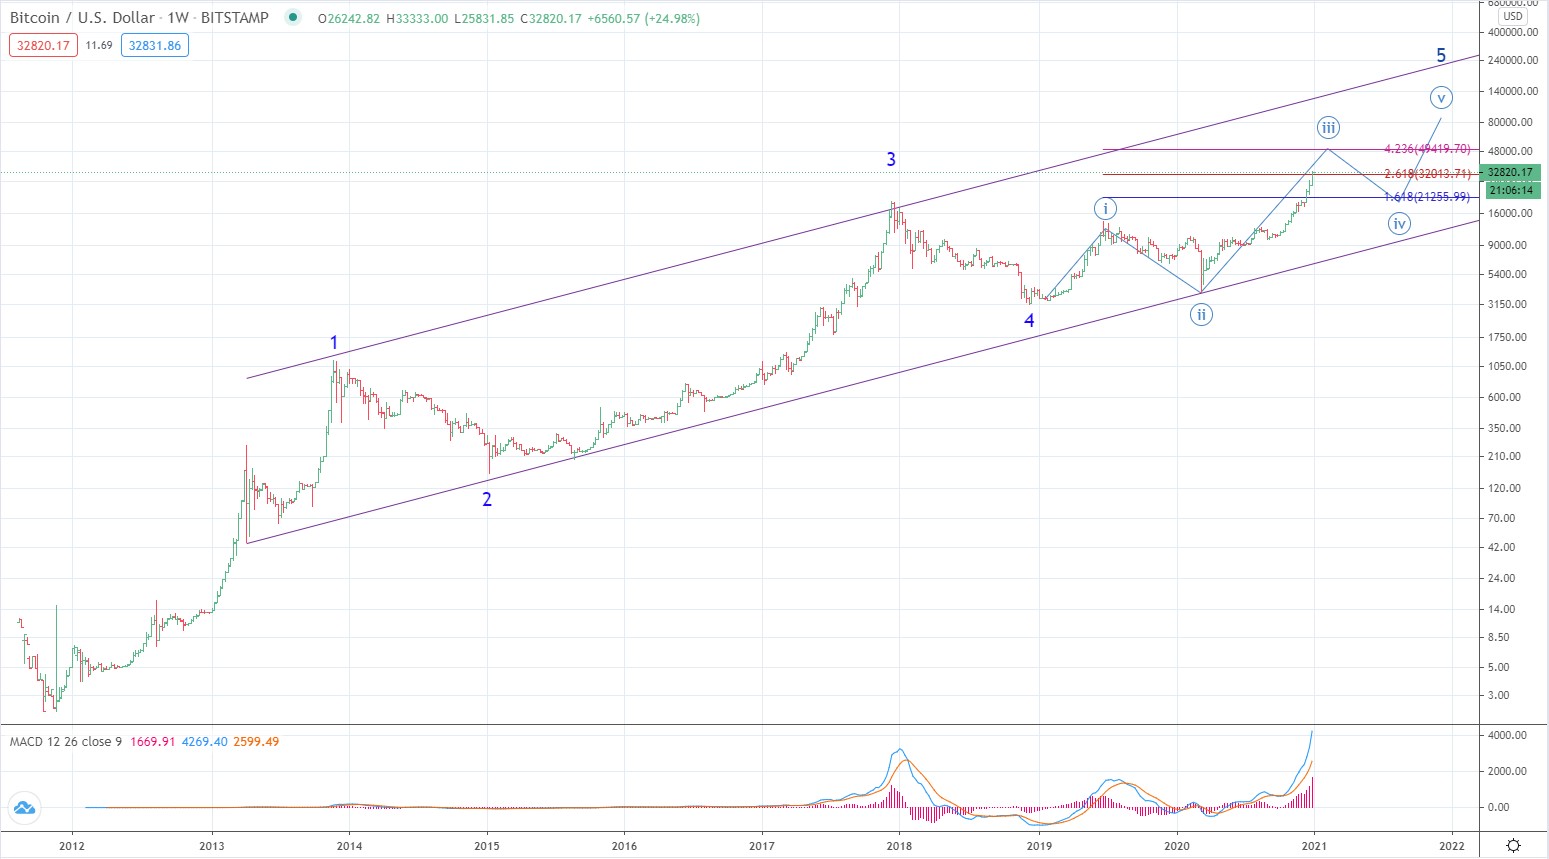
Bitcoin, the very essence of a speculative mania is in the latter stages of a wave (iii) of 5 blow-off. This chart suggests the speculative mood and herd is not done yet and may be the last asset to top. Once this impulsive 5 wave rally is complete we should expect at least a 50% retracement of the entire rally. Our experience with Tulips warns that when the bubble pops, Bitcoin could decline 90%.
Bitcoin Weekly log
Our near term bullish outlook for Bitcoin remains in tact as we see an acceleration higher in wave 3 of (3). While fib targets remain higher, this parabolic move is not without risk of a sharp pullback for wave 4. Buyer beware that this is a speculative mania.
BTC Daily log
Wishing everyone a safe, happy and prosperous 2021. Trade safe 🙂
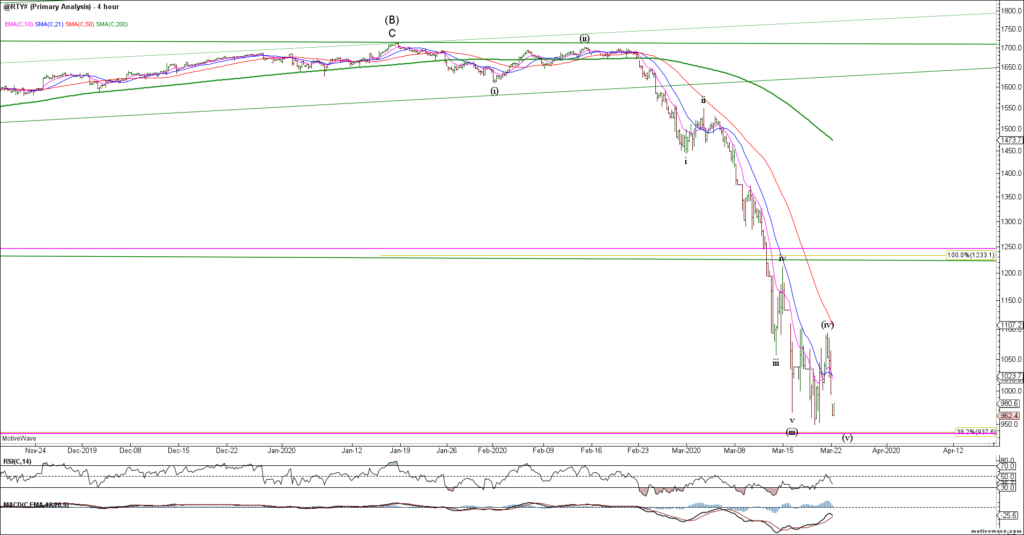
Last week saw a continued liquidation of global risk. Our expectation was that the decline had not ended and we were looking for wave (v) of the decline. Last week’s 2-way price volatility warned of a likely 4th wave as the markets continued to stair step lower. We are now seeing bullish momentum divergence across the board as we look for a bottom in wave (v). This is NOT a given as liquidations could continue. The global policy response has been unprecedented as the enormity of this economic decline becomes clearer. We have been on the right side of this decline and capital preservation / risk management remains our primary objective. This is not a time for complacency and we are essentially flat across the board.
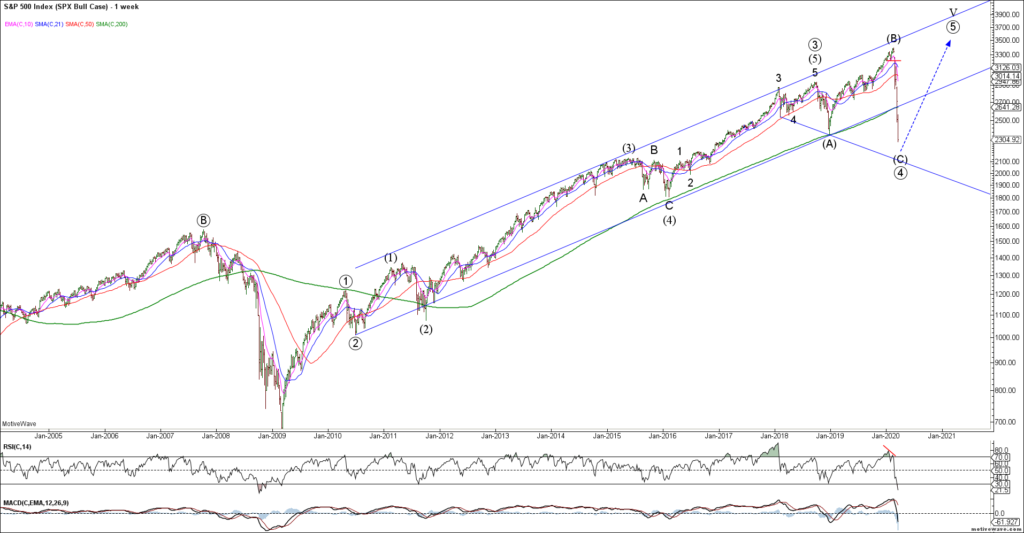
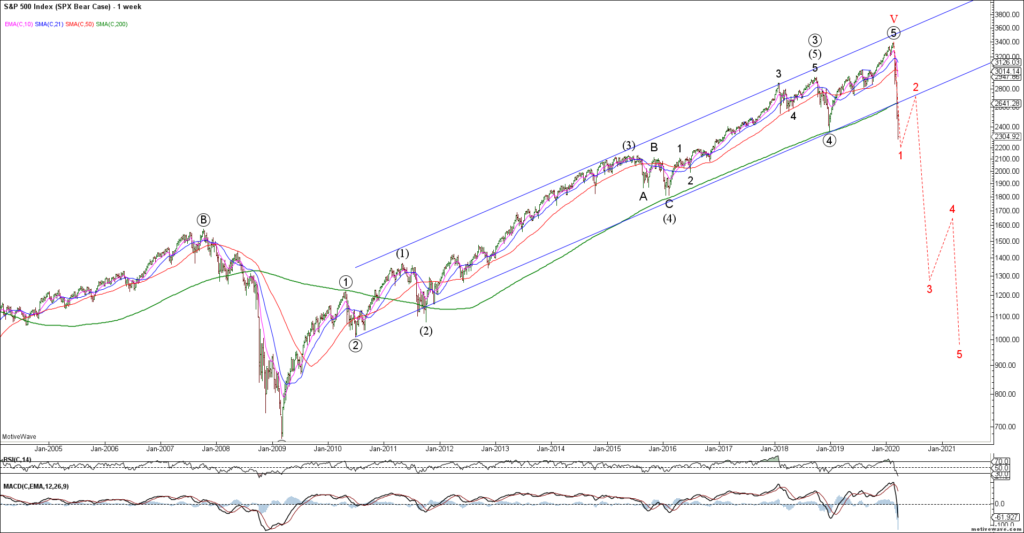
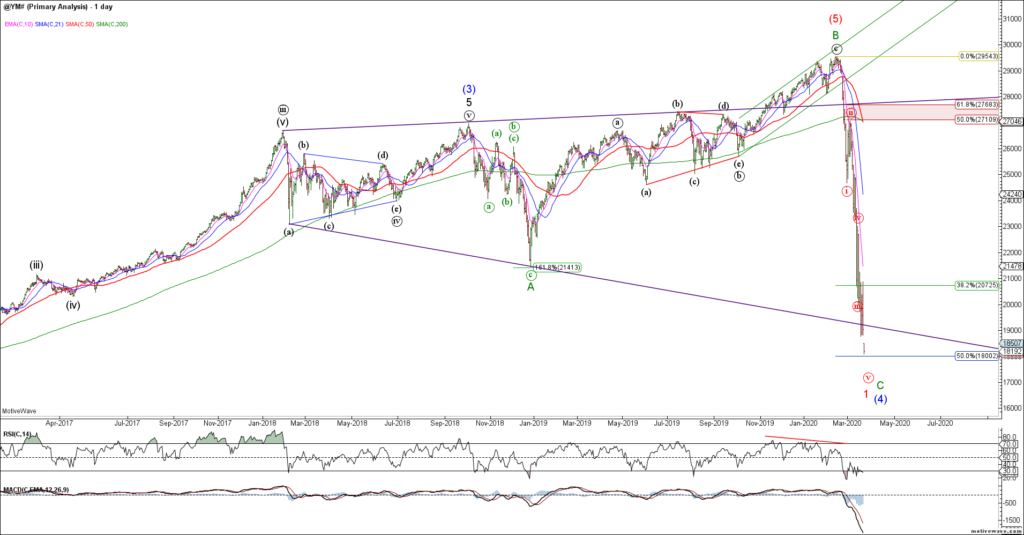
Last week’s continued decline in the SPX / ES invalidated the running triangle case and leaves two likely structures. Either way, we are looking for evidence of near term trend exhaustion and the potential for a counter-trend rally. 1. Bull Case – wave C decline to complete wave (4) of an expanded flat in the 2000-2100 area before a final push to new ATH’s (hard to see until Covid-19 is mitigated) 2. Bear Case – completing wave (v) of 1 down of a larger bear market that retraces the entire post-2009 rally.
SPX Bull Case WeeklySPX Bear Case Weekly
While the minimum requirements for a 5 wave decline for SPX / ES have been met, there is no strong evidence of a tradable low. While bigger picture support resides in the 2000-2100 area, the next major support is at 1800 (prior 4th wave). We are flat here looking for evidence of a tradable low and bullish reversal.
ES Daily
The DJIA / YM also made new 5th wave lows but there is no evidence of a tradable low. This latest decline should be an ending wave (v) so we alert to the potential for a bullish near term reversal.
YM Daily
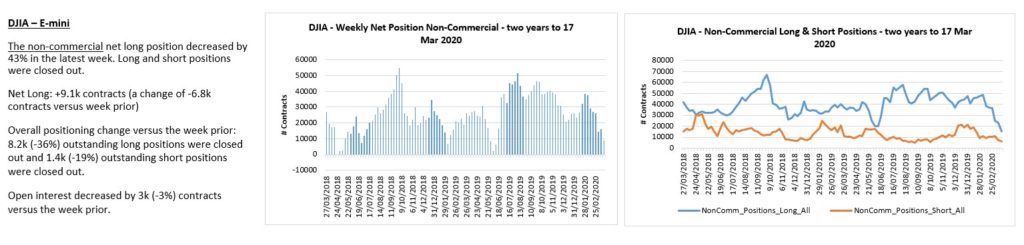
YM longs have left the building.
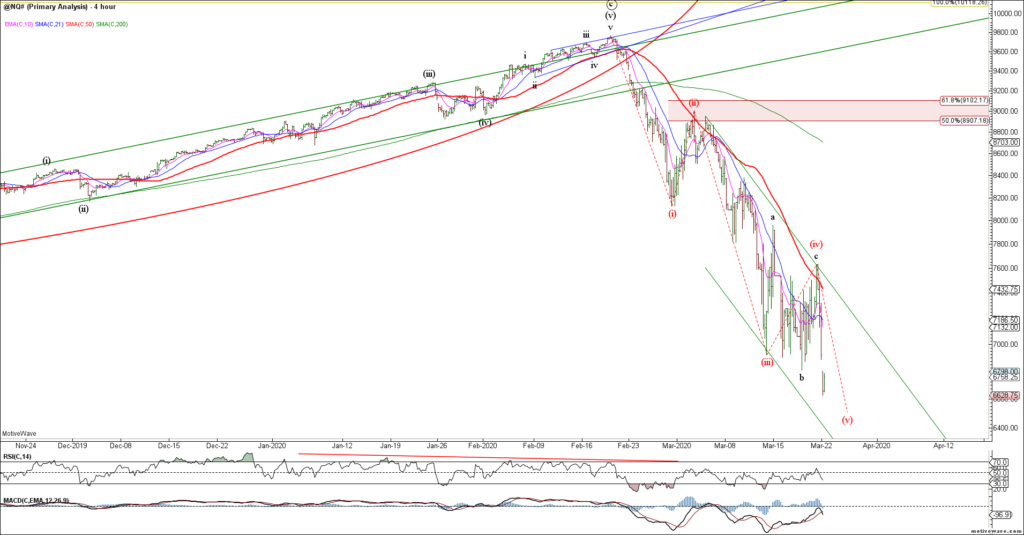
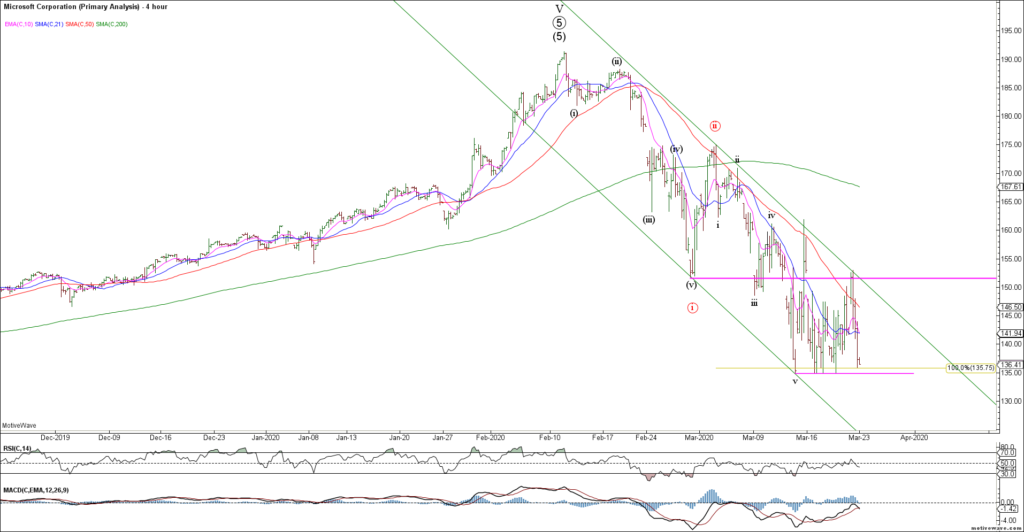
Similarly, the Nasdaq / NQ extended to 5 waves down but the near term structure is choppy and likely incomplete after tagging the 200 week sma. Looking for evidence of a tradable low but keeping an eye on MSFT which looks vulnerable if it breaks near term support.
NQ H4NQ Weekly
MSFT is our canary in a coalmine and is threatening to break below shelf support. The question is do we hold support, gap and drive lower or see a false break and bullish reversal? Not pre-empting but watching closely for clues on the broader market. Today’s close will be very important.
MSFT H4
The Russell 2000 / RTY is approaching strong fib and prior 4th wave support. Looking for potential trend exhaustion and evidence of a bullish reversal.
RTY WeeklyRTY H4
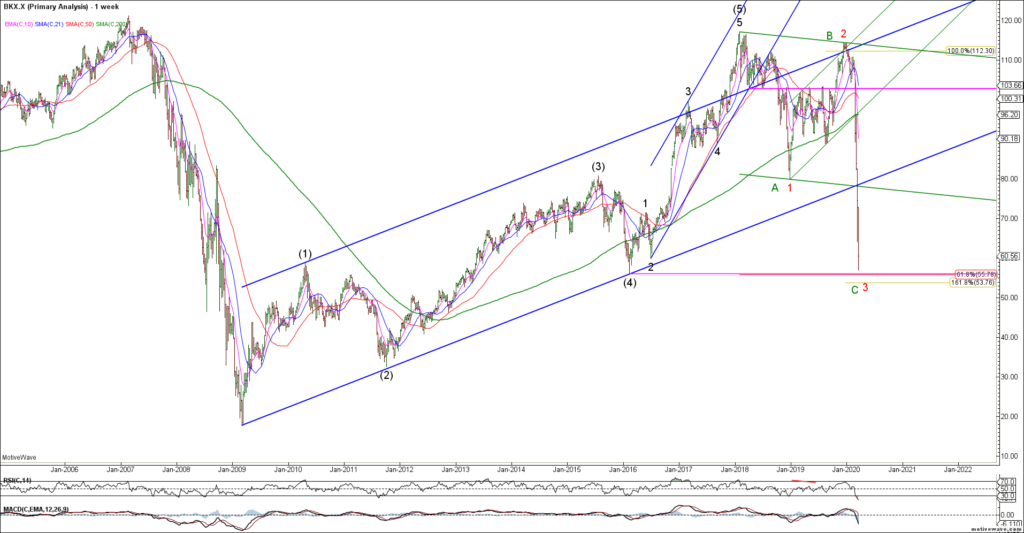
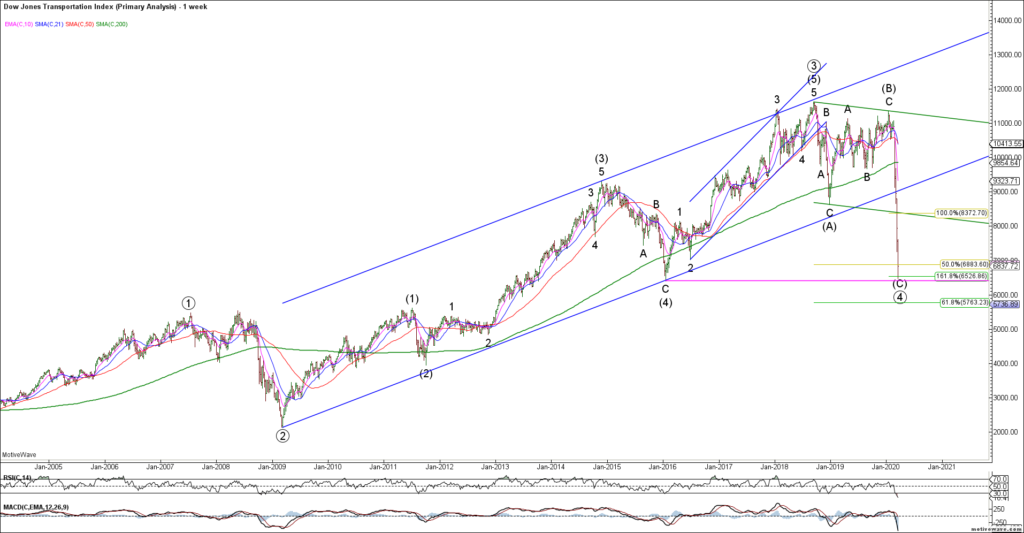
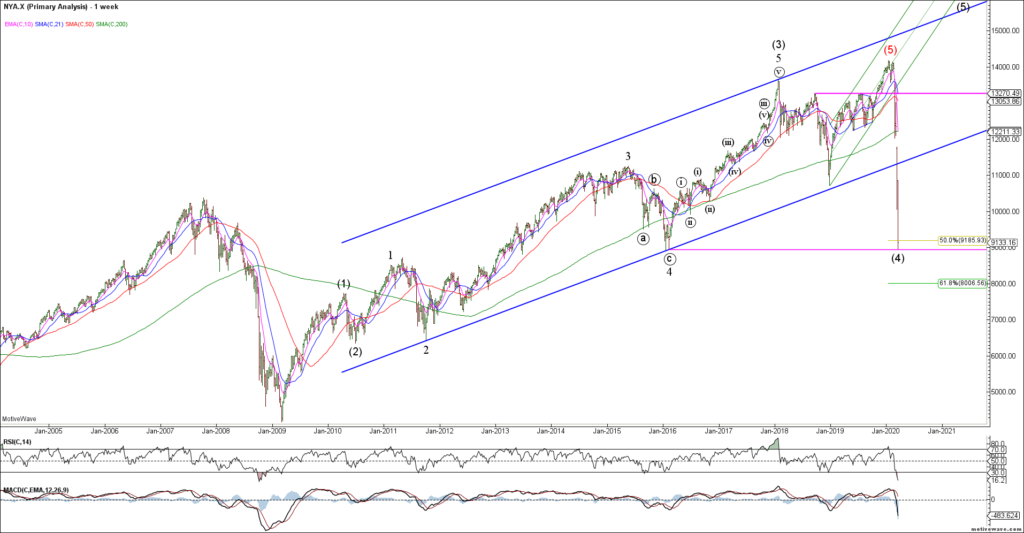
Like the Russell, the BKX, DJT and NYA (Composite) are all testing major fib and prior 4th wave support…. an area you would expect the bulls to try and make a stand.
BKX WeeklyDJT WeeklyNYA Weekly
The VIX remains elevated but we are seeing bearish momentum divergences as the markets try to hammer out a near term low. Ideally, a new 5th wave low in equities is NOT confirmed by a new high in VIX which would provide more inter-market divergence and bullish potential for equities.
VIX Daily
VIX traders remain marginally short.
To the global equity markets and like the US, we see evidence of 4th wave consolidation prior to a 5th and final wave down. A 5th wave thrust to new lows in ESTX and DAX could potentially complete the impulsive decline as we look for evidence of a tradable low.
DAX H4ESTX H4
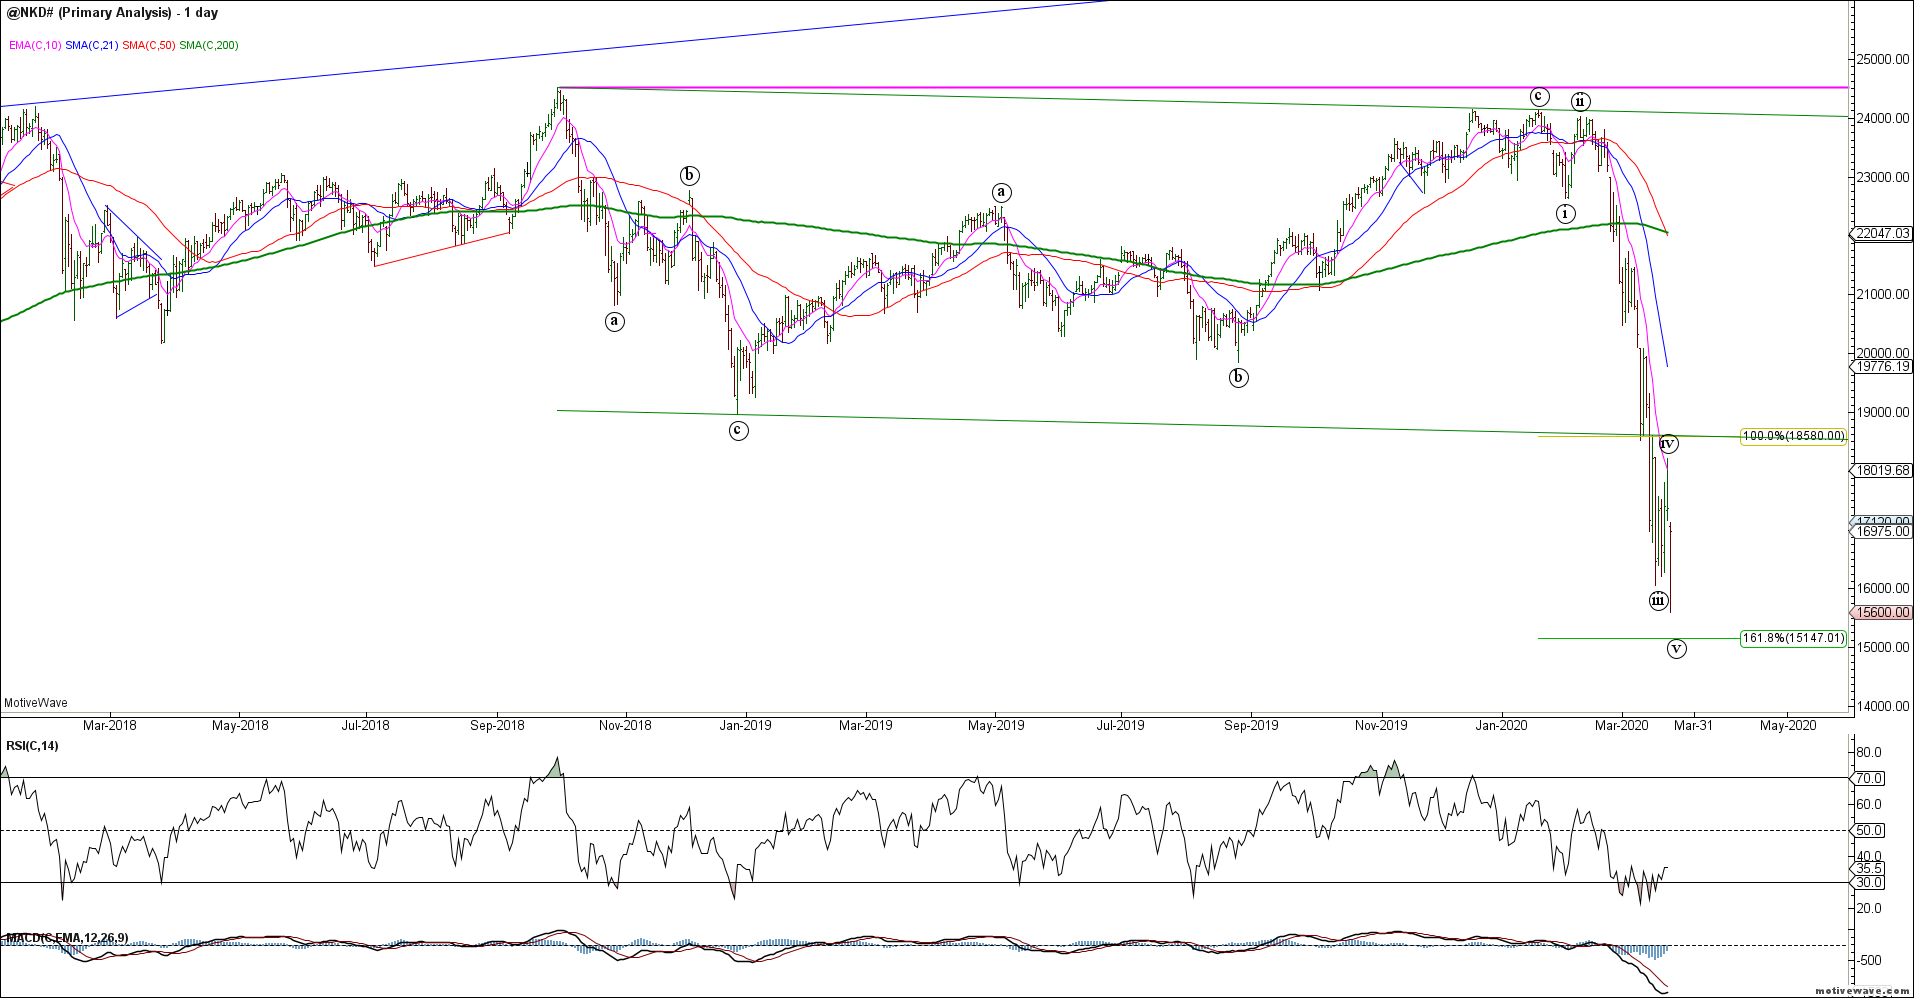
The NKD thrust to new 5th wave lows this morning and may have completed its most recent decline. Looking for evidence of a tradable / hammer low with upside follow through.
NKD Daily
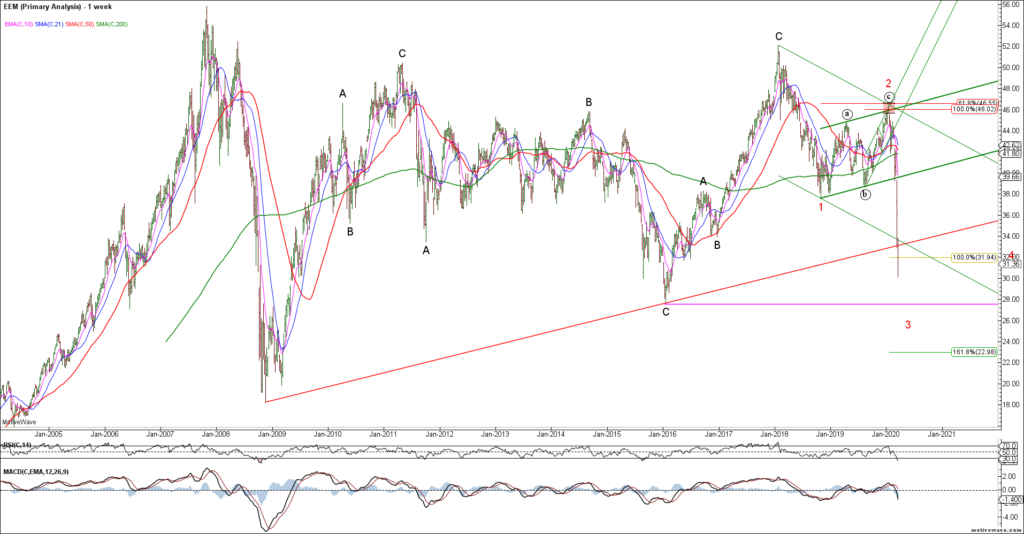
The EEM broke trend support and continues to be pressured by a strong US$. Despite minimum targets being met, this chart remains bearish until proven otherwise.
EEM Weekly
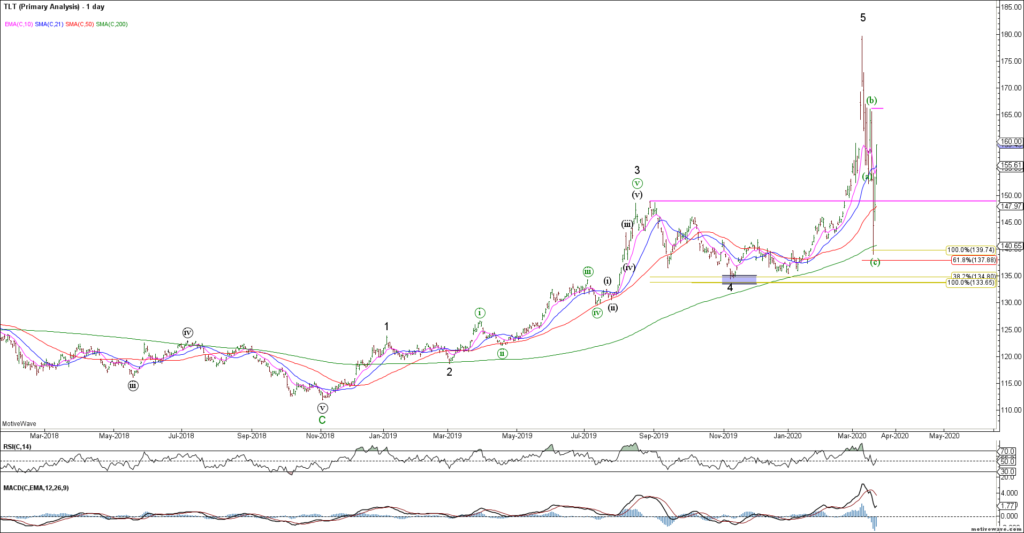
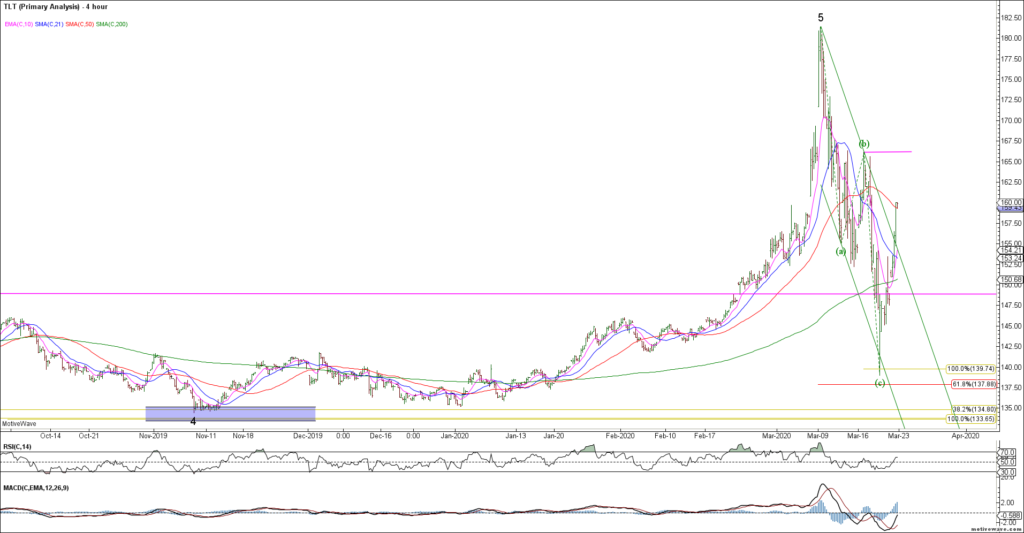
To the bond markets and last week saw a sharp decline as RV funds liquidated. The TLT appears to have declined in 3 waves of equality so far into the 61.8% fib support. This tells us that so far, the decline is corrective from a bigger picture perspective and the trend likely remains higher while last week’s lows hold. Obvious 2-way risk here given market volatility but prima-facie we should probably expect new lows in rates going forward.
TLT DailyTLT H4
The US 30yr / ZB decline appears corrective as it stair stepped lower last week. This is a difficult environment for bonds given the cross-currents of deflation and massive stimulus and forced liquidations. So far, it’s an a-b-c decline but bulls need to clear wave (b) resistance to confirm a corrective decline.
ZB H1
Last week saw a sharp decline in ZB longs.
The TY shows the same corrective decline of equality but needs to clear wave (b) resistance to help confirm. It could also be part of a larger correction so 2-way risks remain in these volatile times. Tread lightly.
TY H1
TY longs and shorts have been liquidated.
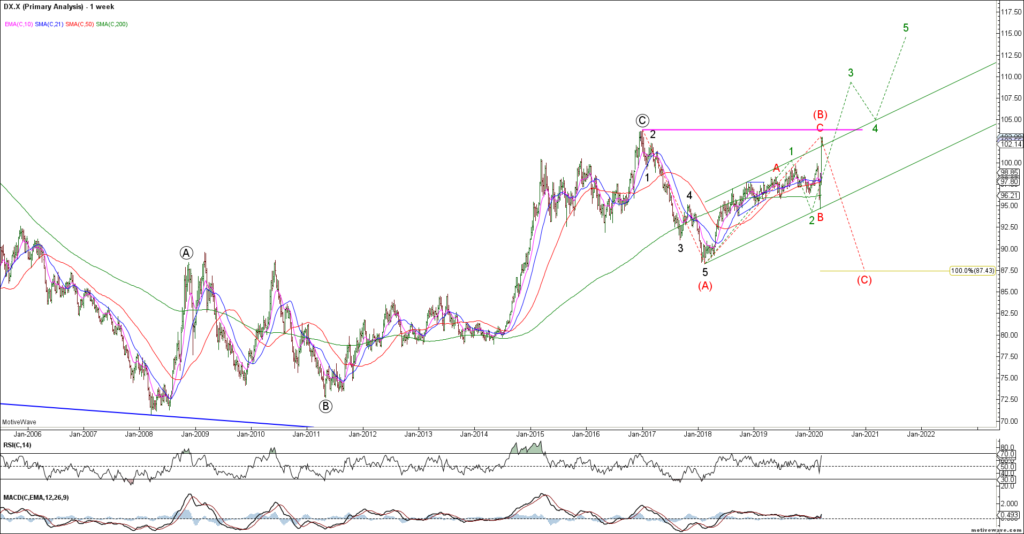
To the FX markets and the US dollar is at a key inflection point across many crosses. The DXY broke higher above 100 as warned and is now testing major cycle highs. The US government will try to weaken the dollar so we should expect extraordinary measures to do so. Resistance is resistance until broken and the wave count is binary here. Bullish green count on a strong close above 104 likely sees a wave 3 extension higher. The red bear count sees an impulsive rejection of major swing highs.
DXY Weekly
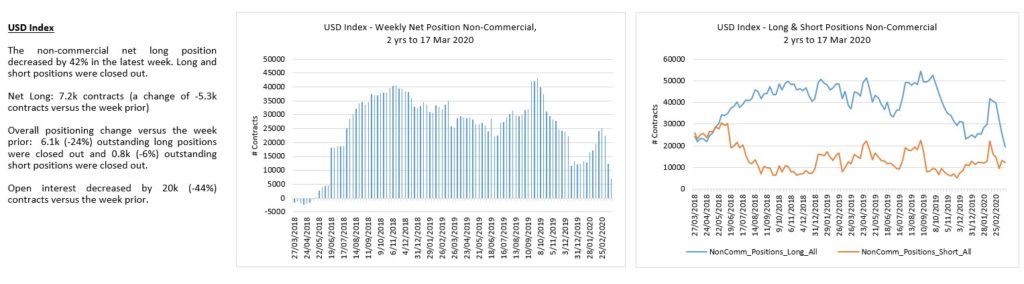
DXY traders cut longs and shorts amid the volatility.
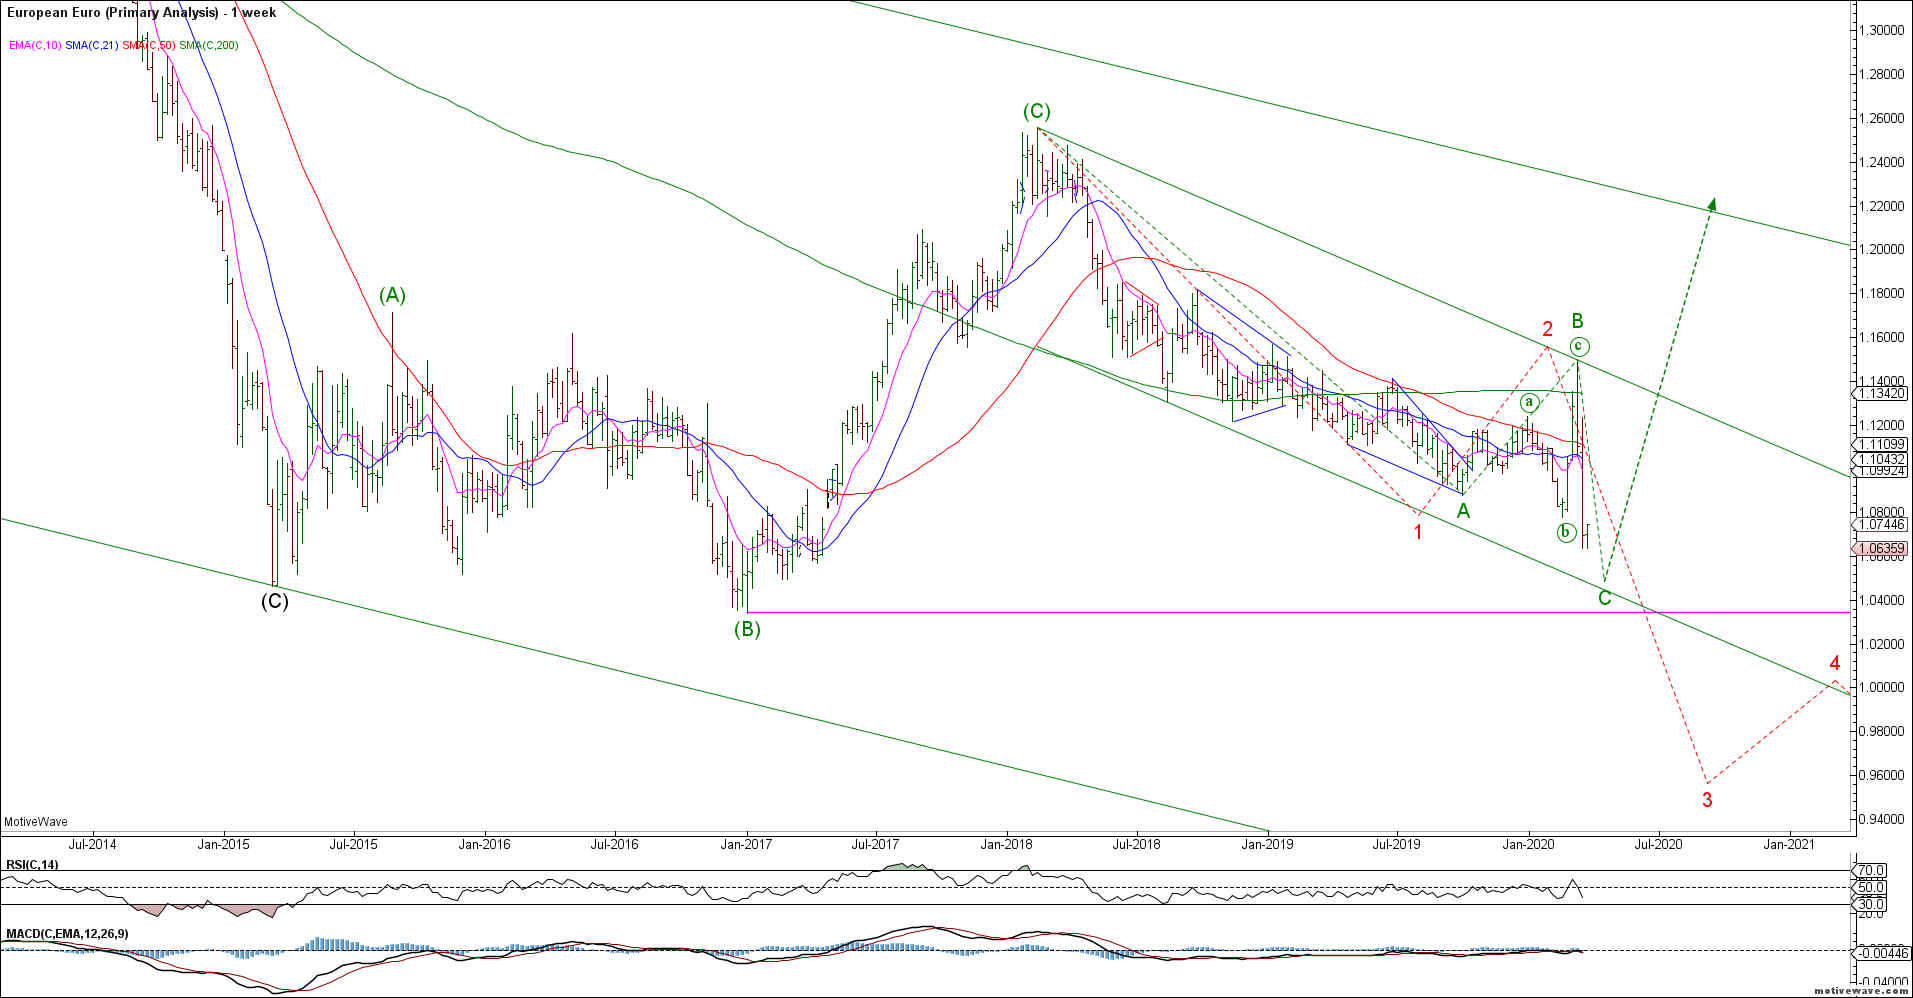
The Euro also broke near term support and is now testing major support (key inflection point). If support breaks it likely trades through 1.00 towards 0.95 but support is support until broken. Too much 2-way risk for me as we could break either way. If in doubt, stay out and let the market confirm.
EURUSD Weekly
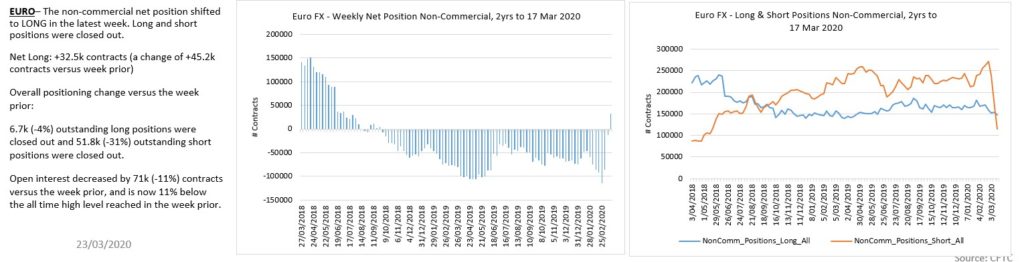
Euro traders have been whipsawed over the last week.
The USDJPY continued to push higher above near term resistance and is retesting key swing highs for the triangle bear count. Trade above 112.30 opens the door towards 120 on a continued US$ rally. Key inflection for the dollar here against the Yen and it is unclear which way it breaks. Not trading this until I get confirmation either way.
USDJPY Weekly
The USDCAD also tagged major resistance last week, a key inflection point for the dollar.
USDCAD Weekly
The USDSGD met our measured targets and is trying to break through major swing highs. Reverse or continuation? We can make a case for both scenarios but risky either way.
USDSGD Weekly
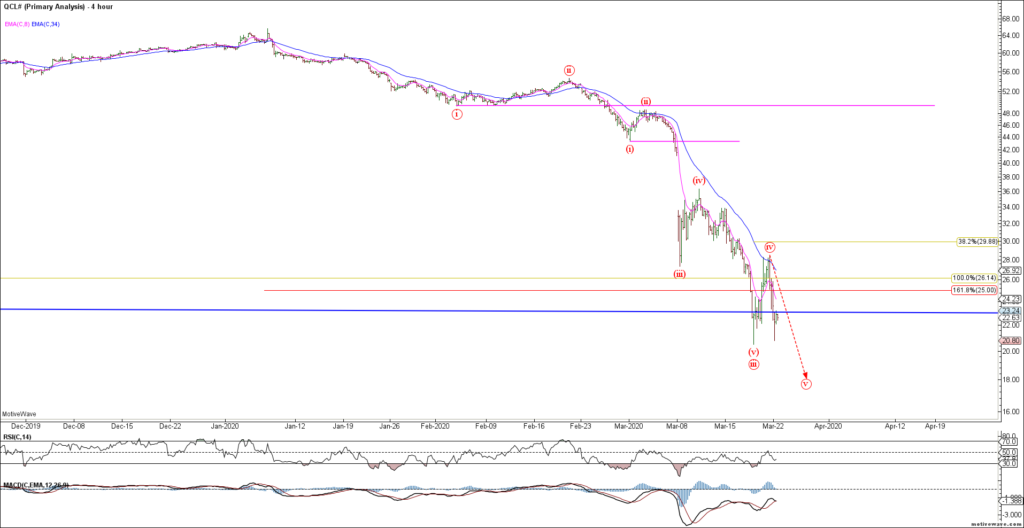
To the commodity markets and CL is retesting swing lows after bouncing last week for what was likely a wave (iv). Ideally, we’d like to see a push to new cycle lows to complete wave (v) followed by a bullish reversal. We are approaching near term trend exhaustion in Crude as we look for a final flush and bullish reversal.
CL H4
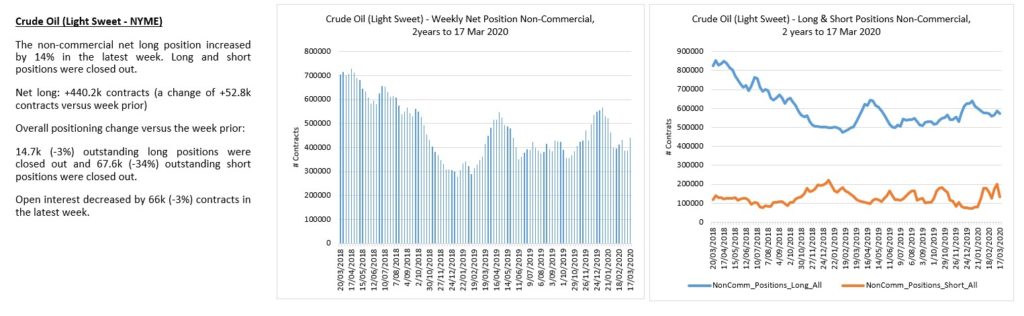
Crude traders remain too long despite the recent severe decline.
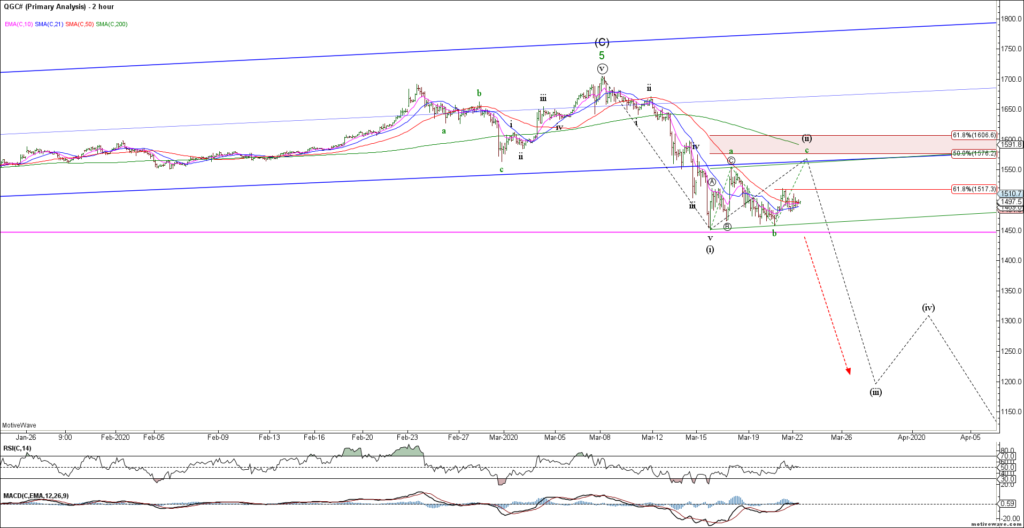
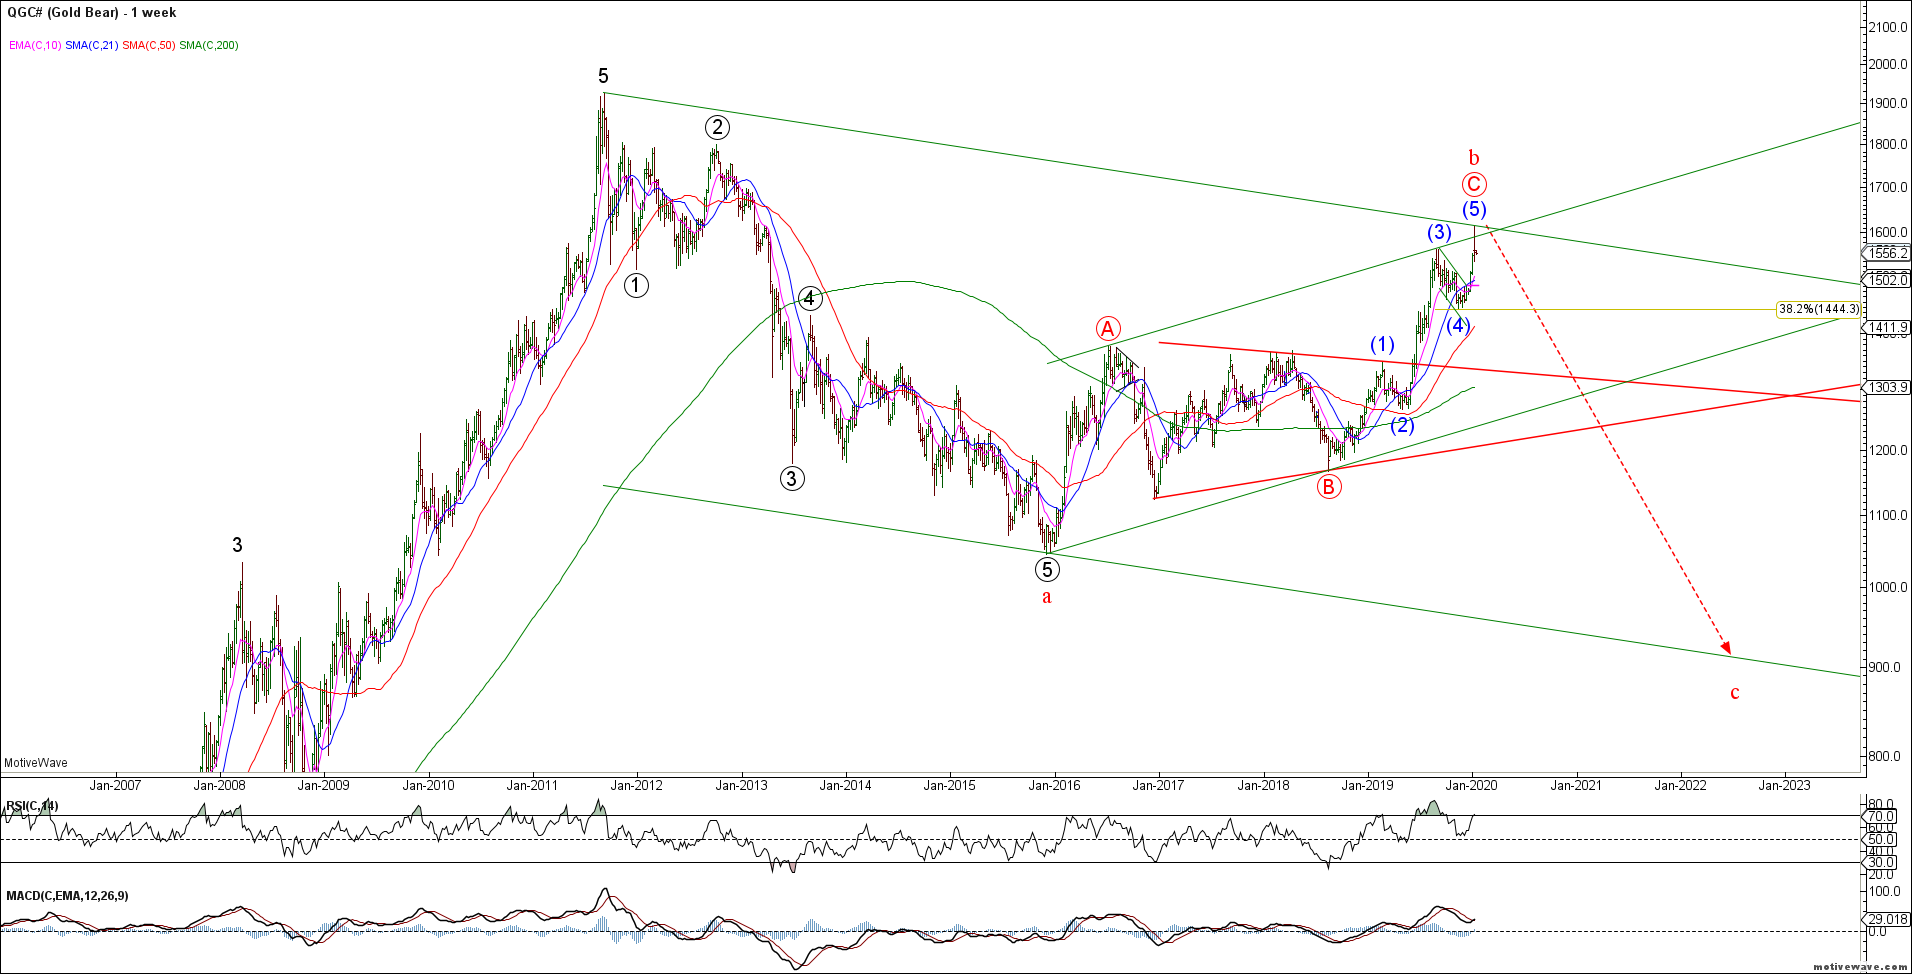
Gold consolidated above support last week after declining impulsively from recent swing highs. The bigger picture structure remains bearish but needs to break 1440 to help confirm the break lower.
Gold Weekly
Near term, Gold declined impulsively into shelf support from where we have seem a corrective rally. A close below 1440 likely triggers the next wave lower, either directly or after another rally towards 1575-1600 resistance.
Gold H2
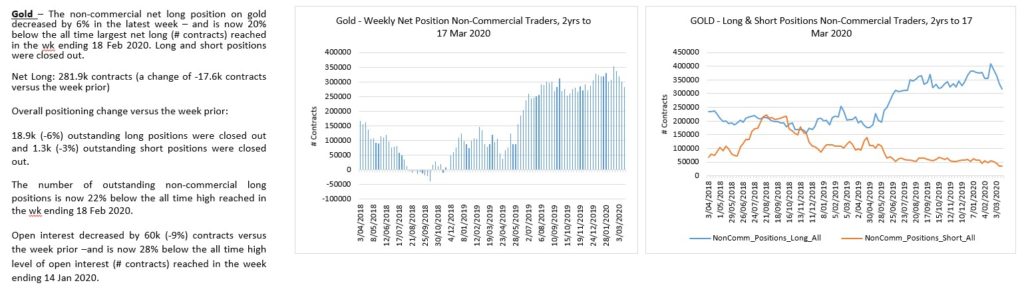
Gold traders are starting to pare back longs.
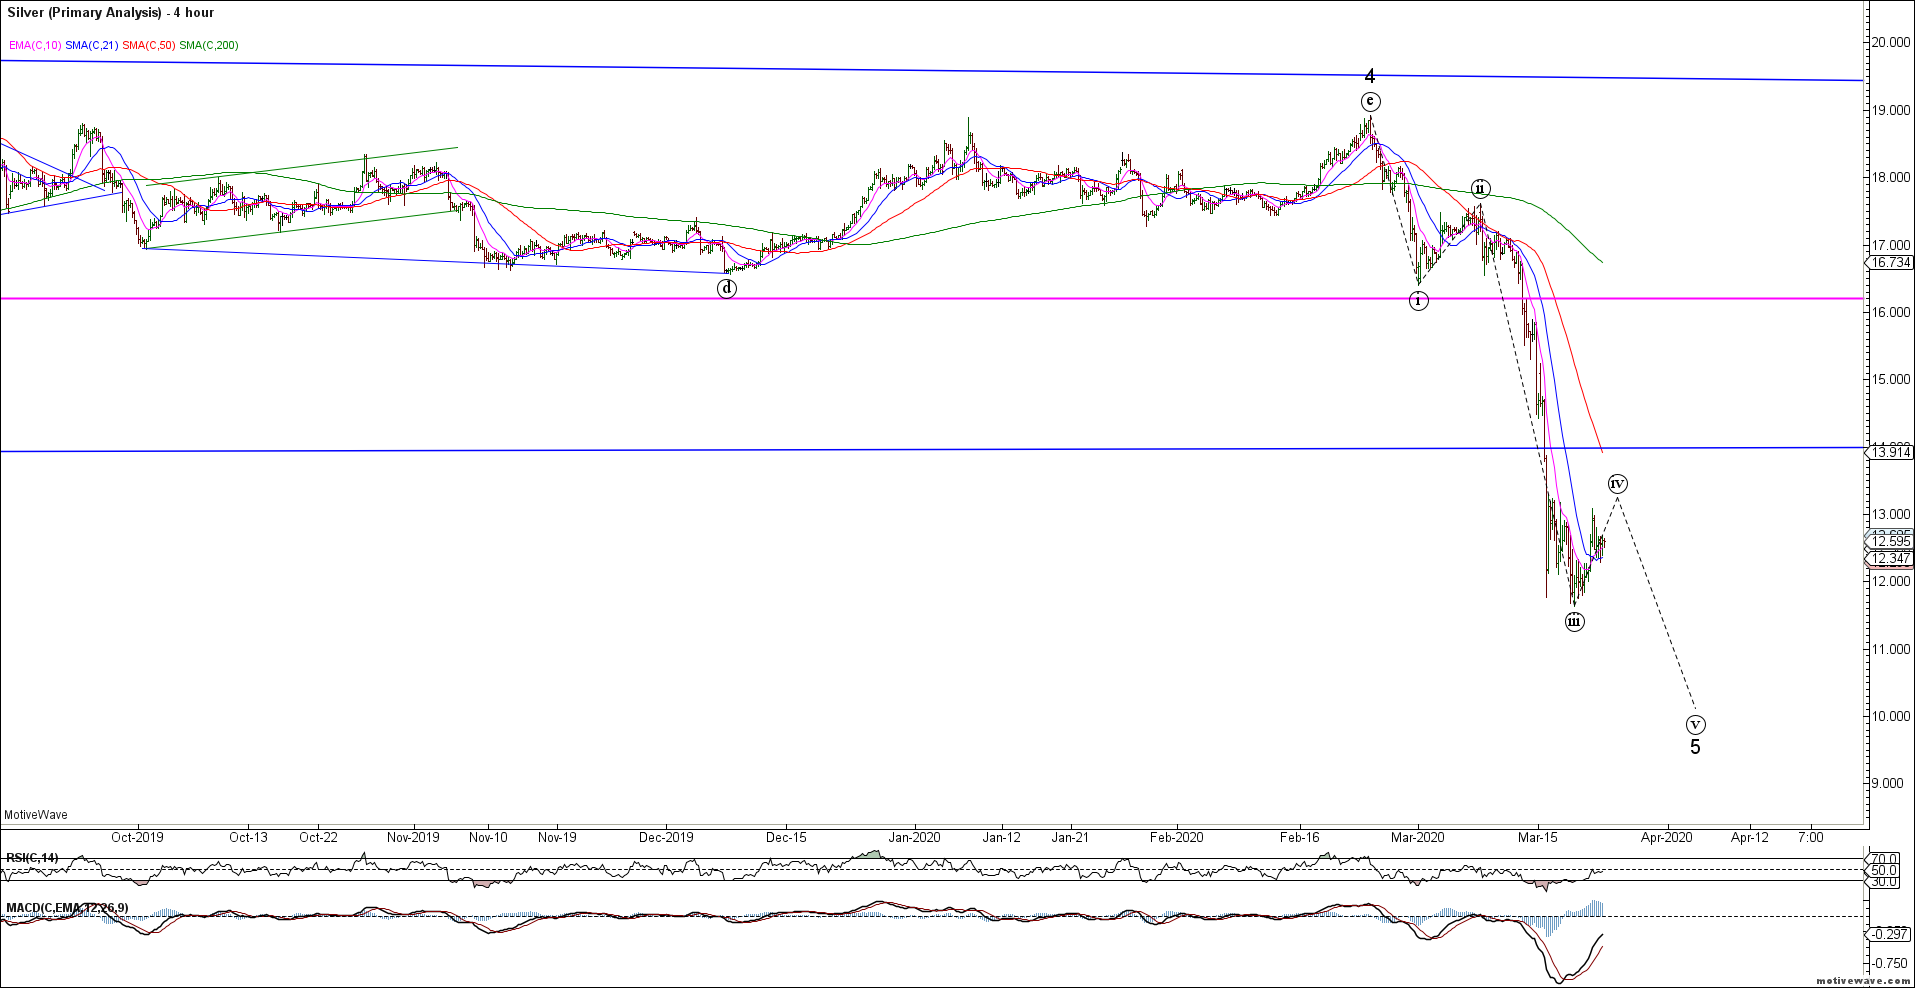
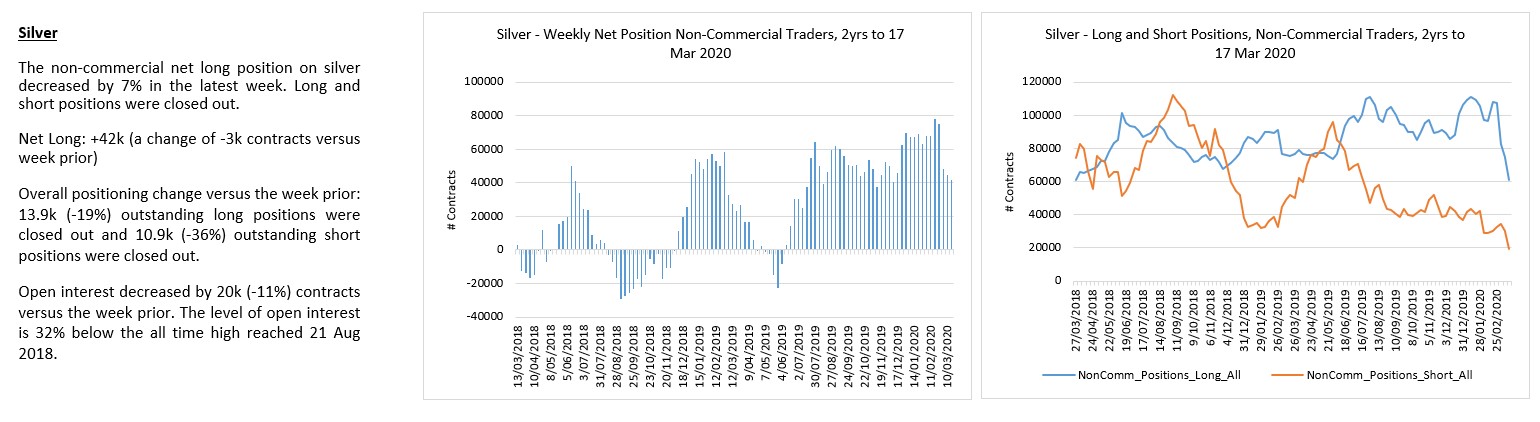
Silver remains bearish and would look best with a wave (v) decline to new cycle lows.
Note: Due to the continuing bush-fire threat in our region, Kim and I have decided to take a well earned vacation in the USA. We will be skiing for a few weeks in the hope that the fire threat will have subsided on our return.
One day this low volatility across asset classes will end – be prepared!
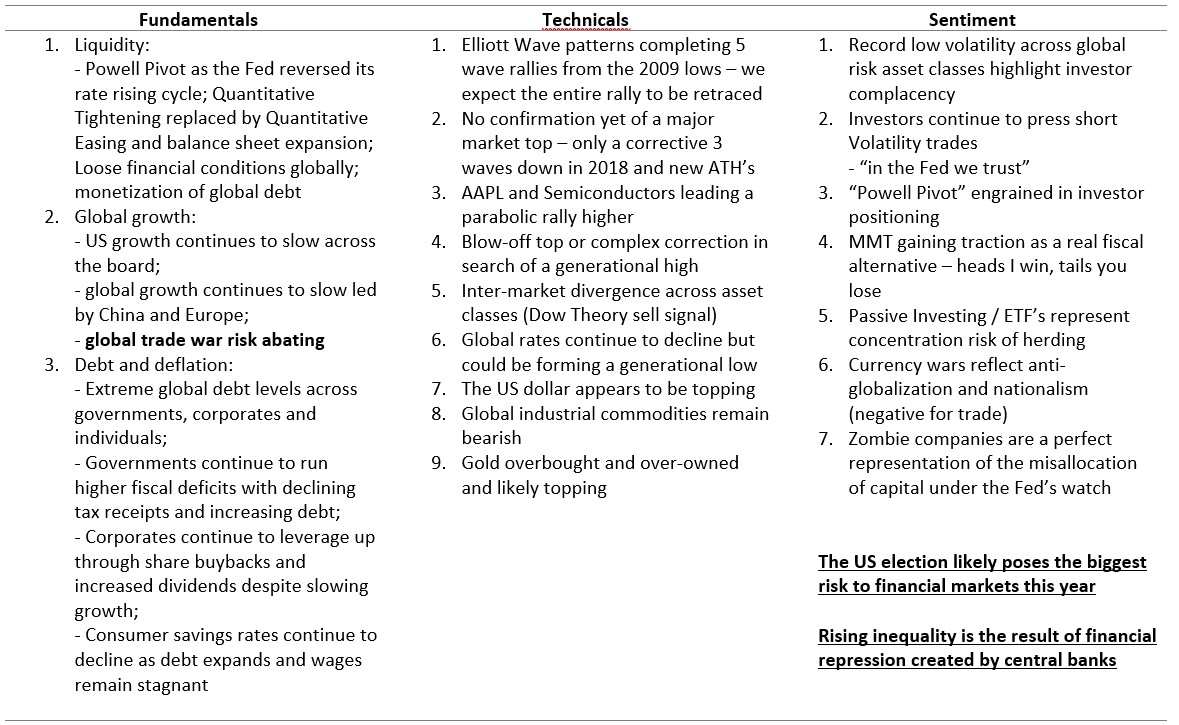
In early 2019, we correctly identified the prior corrective decline for the equity markets and new ATH’s have resulted. This is a liquidity driven market following the “Powell Pivot” and global central banks continue to pump prime asset markets.
As highlighted in last year’s review – “The question is how long can the CB’s kick the can down the road? At what point do global markets call their bluff as market maker in chief? One thing is clear, central banks are manufacturing a world of increased societal acrimony through financial repression – how long can they continue to support the banking hegemony with disregard for societal inequality?”
Key Macro Themes for 2020:
US equities are either completing a wave (B) high near term or extend higher into 5 waves completing wave 5 of (5) to end the post-2009 rally. Our preferred strategy is long term put insurance
We remain bullish bonds as we look for new lows in rates
Bearish Gold, Silver and Crude Oil against last week’s bearish reversals
Yen and Swiss Franc setting up for a range break after a multi-year contraction (long dated puts and calls preferred)
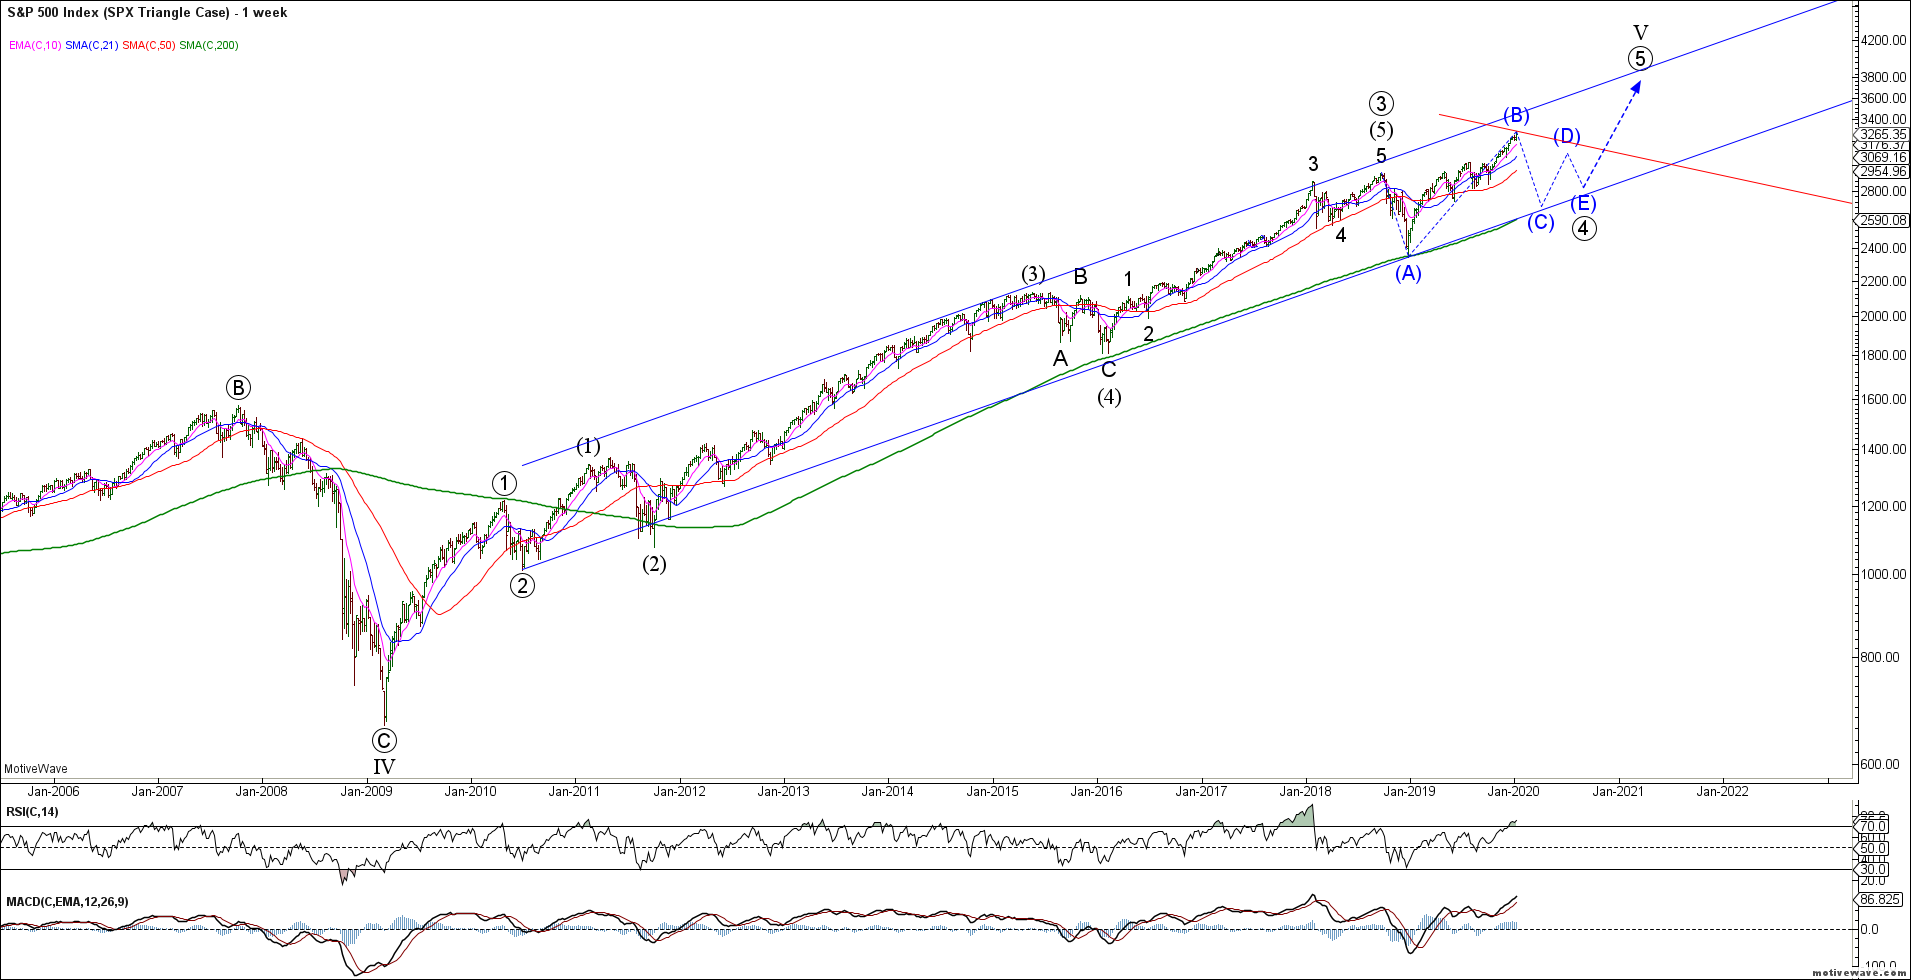
Global risk as defined by the SPX has so far rallied in 3 waves from the December 2018 lows. We have been assuming that this rally will soon terminate for wave (B) of a running triangle wave 4. This analysis implies a choppy corrective sideways market for 2020 before a final push higher wave wave 5 to complete the bigger picture rally from the 2009 lows. The 200 week sma remains critical support for this structure.
SPX Triangle Case Weekly
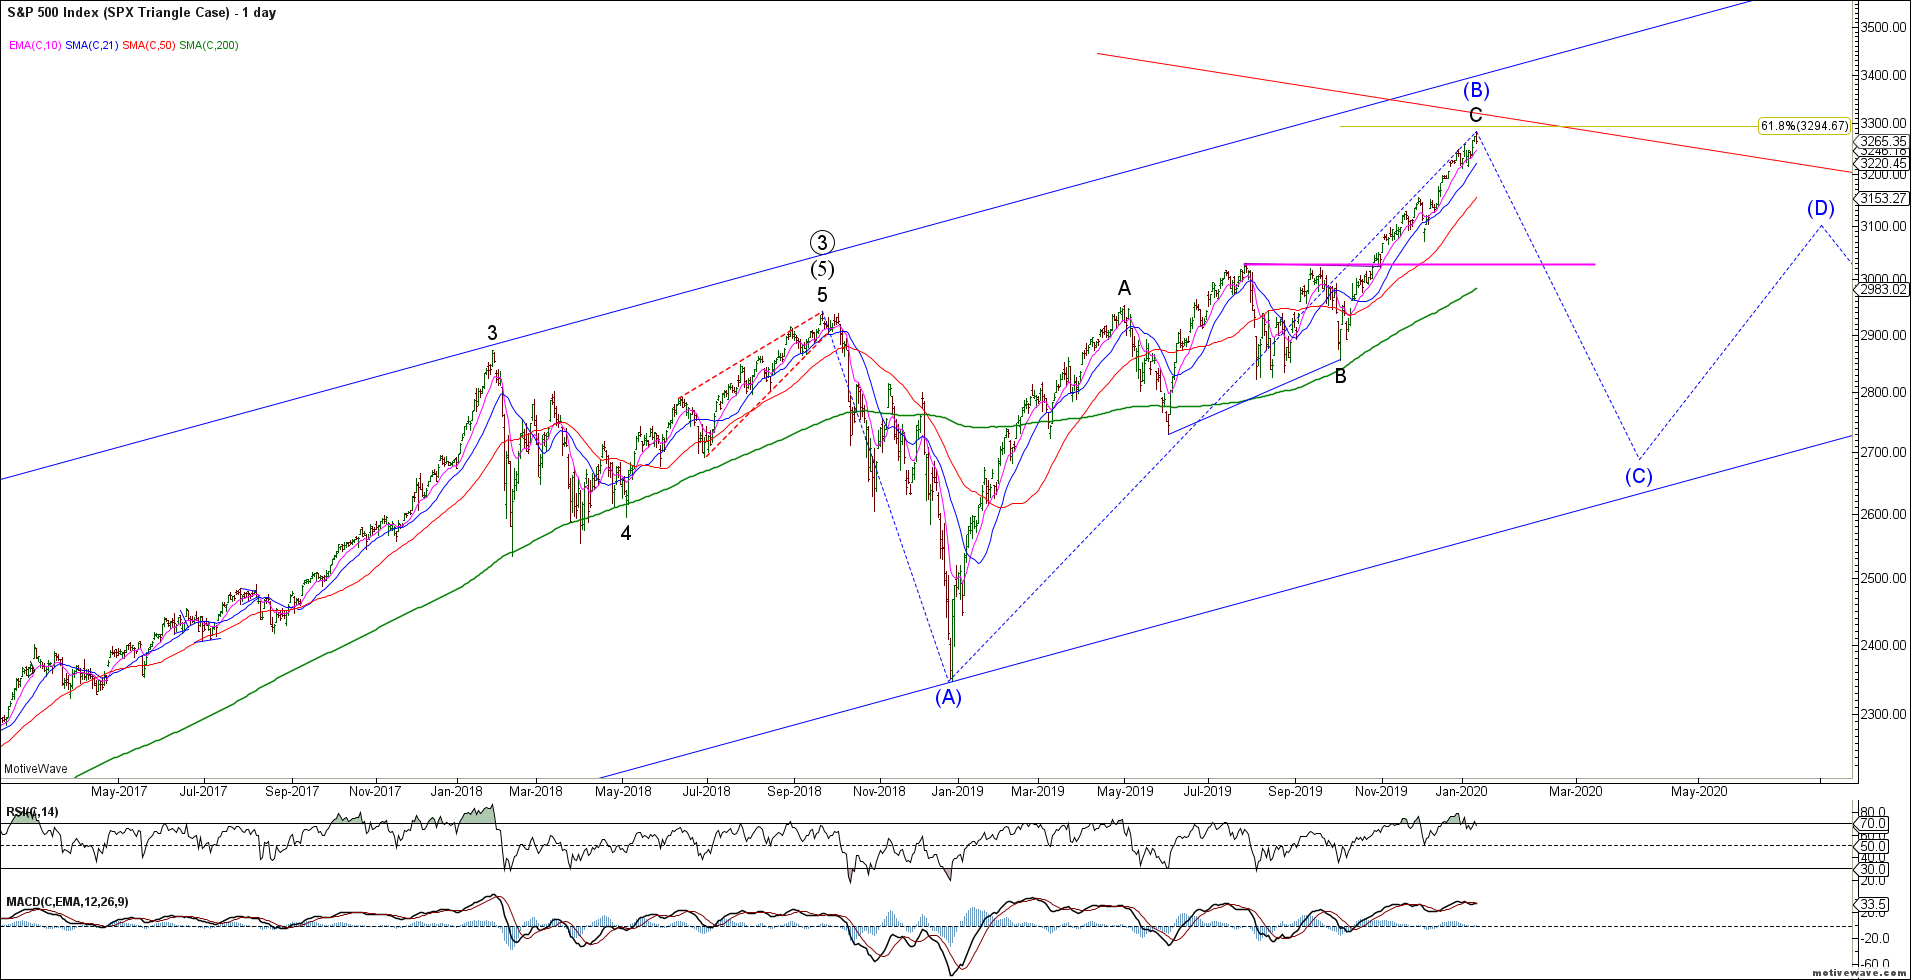
This SPX Triangle implies a near immediate bearish reversal that trades back below the key 3030 breakout level. We now have enough waves in place to complete the wave C of (B) rally into the 61.8% extension. What we do NOT have is clear evidence of a bearish reversal and impulsive decline.
SPX Triangle Case Daily
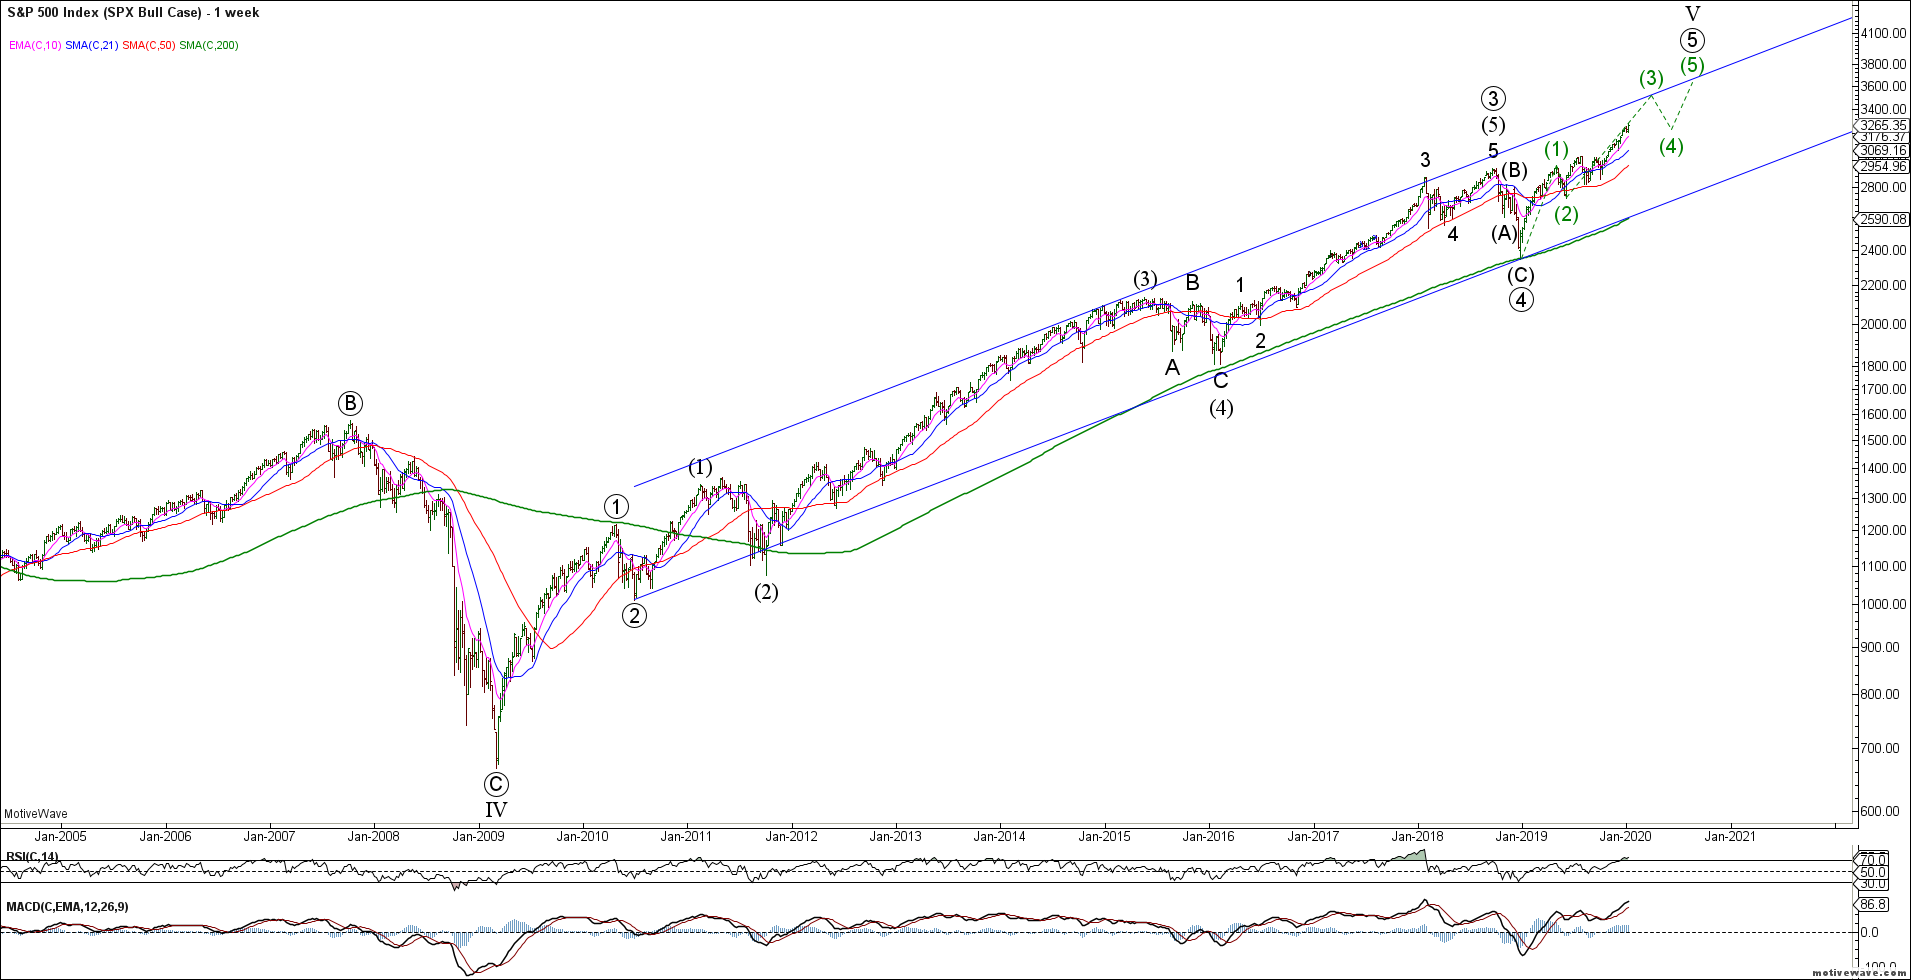
The bullish alternate SPX case is a continued rally that extends into 5 waves from the 2018 lows throughout 2020. While this is not our preferred count, we are mindful of the strength of herding behaviour and animal spirits of this Fed induced rally.
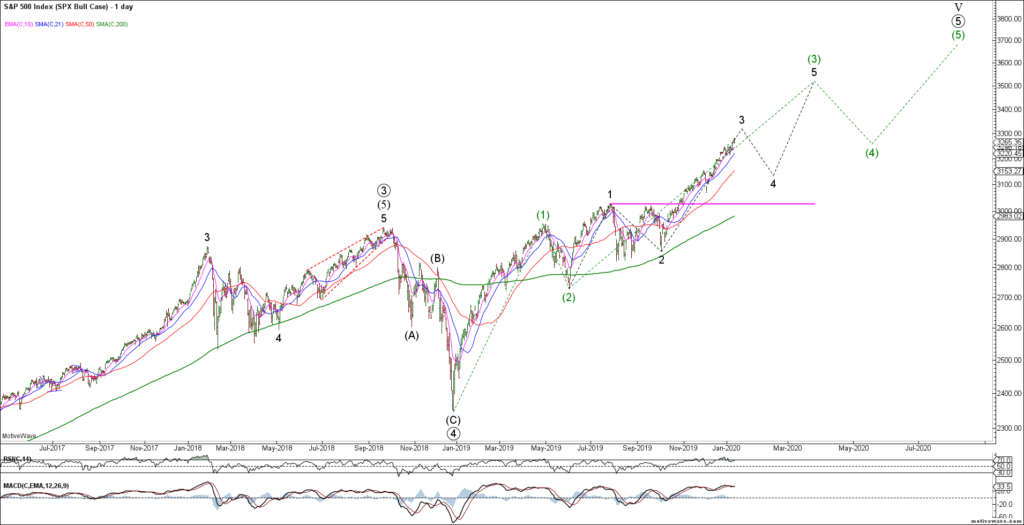
SPX Bull Case Weekly
The key for this bull case is for the SPX to remain above the 3030 overlap and keep extending higher in 5 waves. This count assumes we are currently completing wave 3 of (3) of (5) which would likely mark the end of the post-2009 rally.
SPX Bull Count Daily
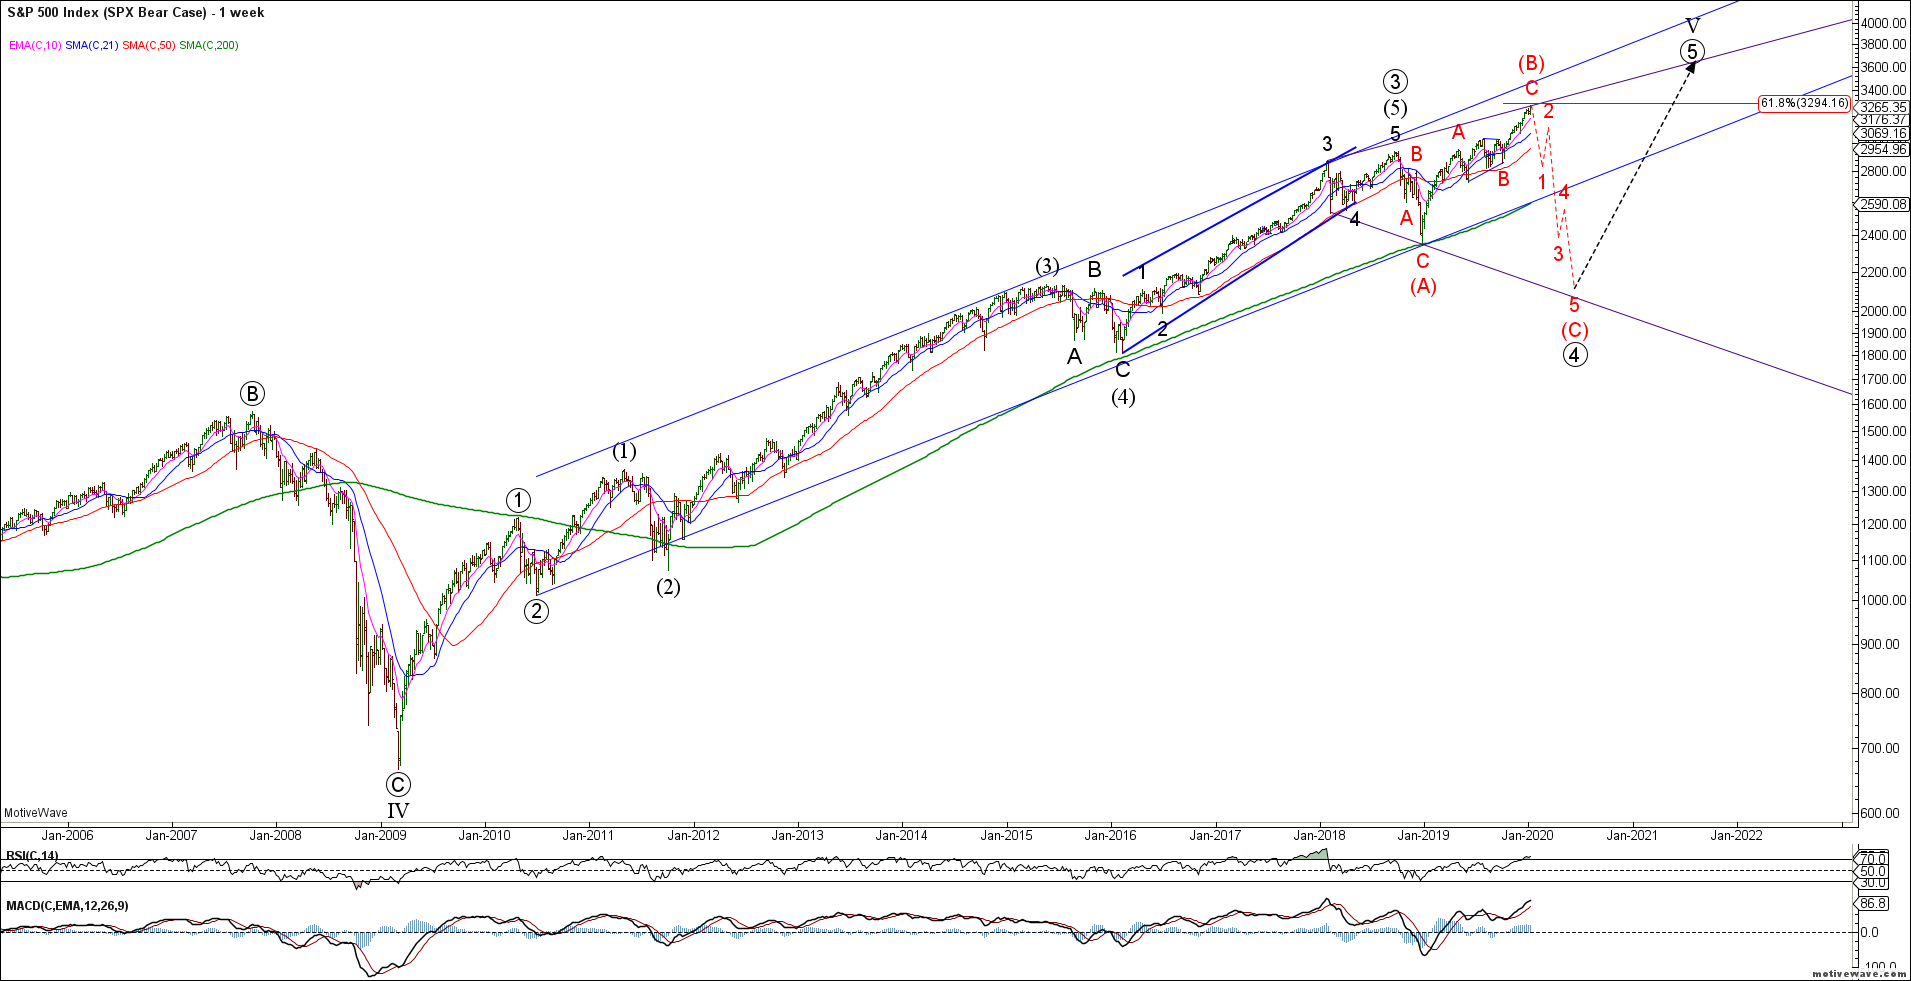
While lower probability, given extreme bullish sentiment and one-way trade, we must be aware of the potential bear case of an Expanded Flat wave (4). This would imply a strong impulsive decline back below the 2018 lows triggered by a break of the 200 week sma and long term trend channel. This is why low cost long dated puts or VIX calls may be a preferred strategy.
SPX Bear Count Weekly
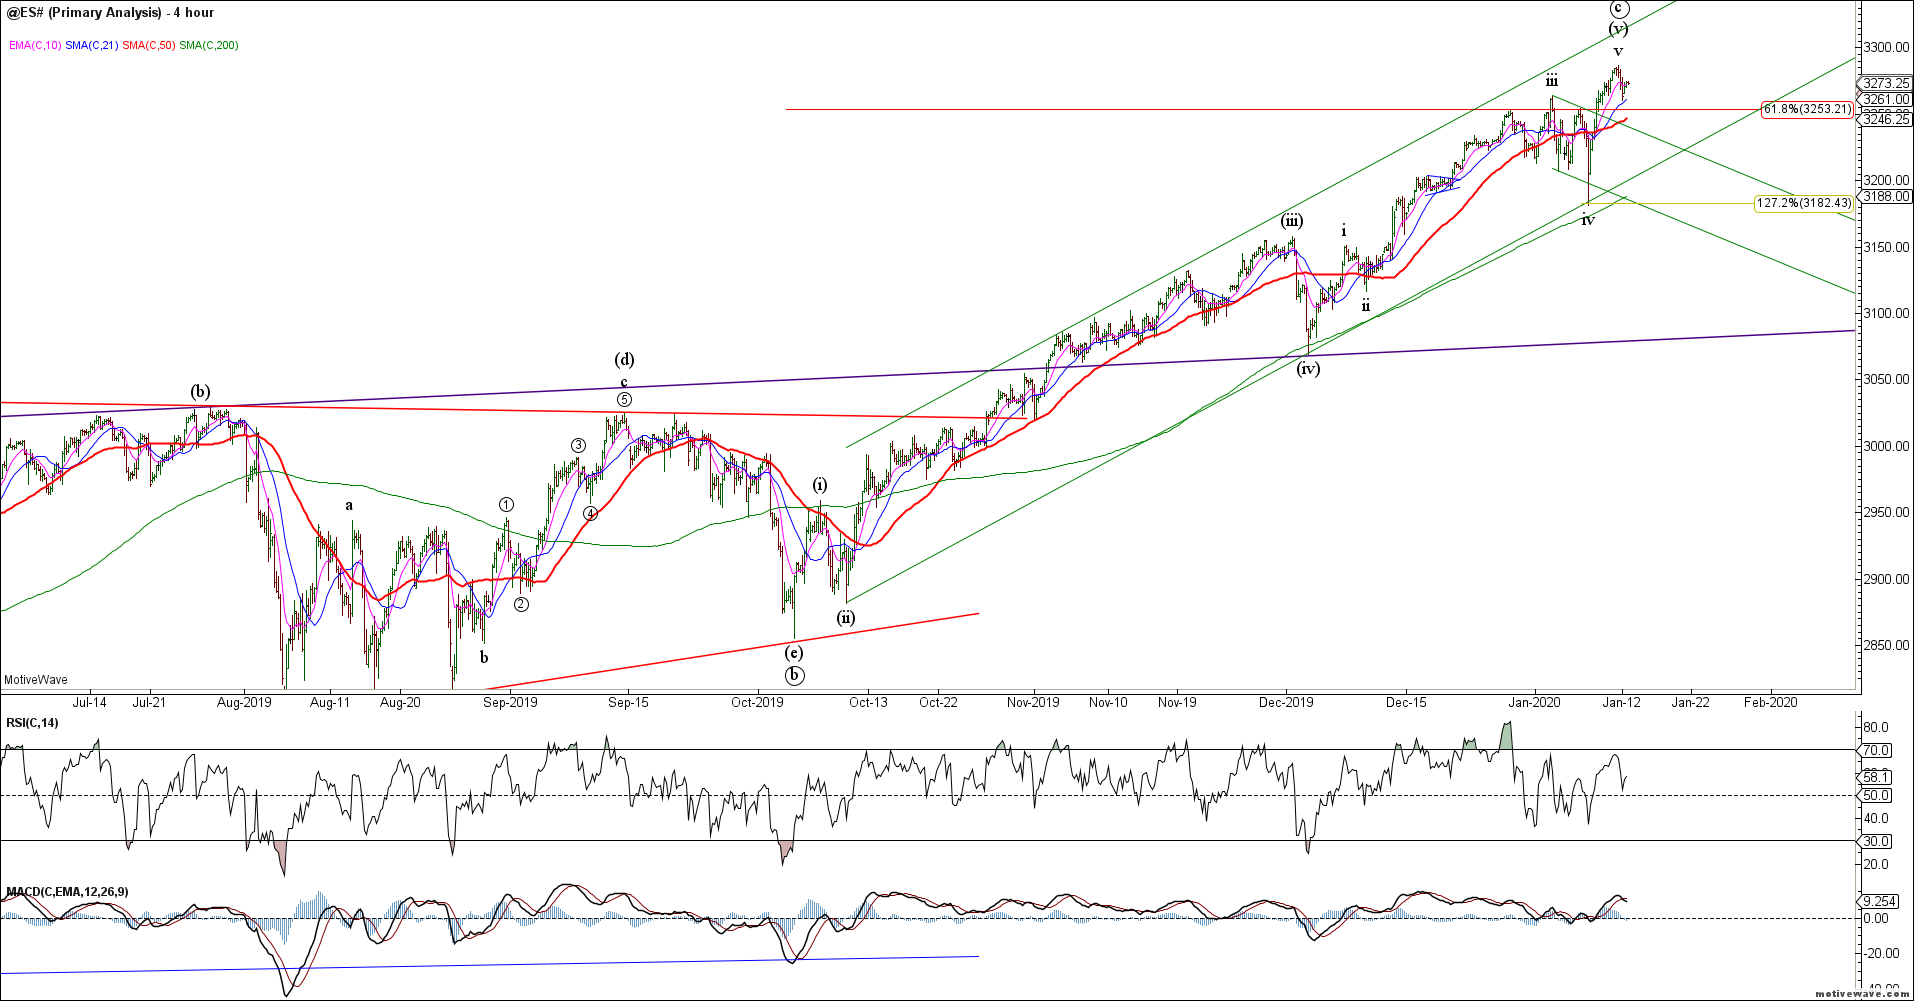
The ES has enough waves in place to complete the wave (c) rally. No evidence yet of a bearish reversal but we do have 5th wave momentum divergence at last week’s highs.
ES H4
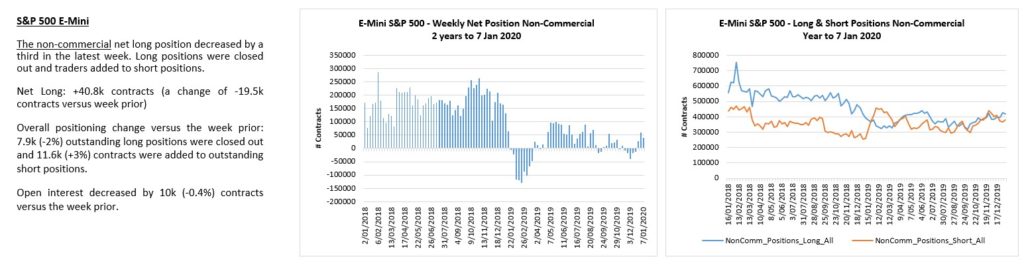
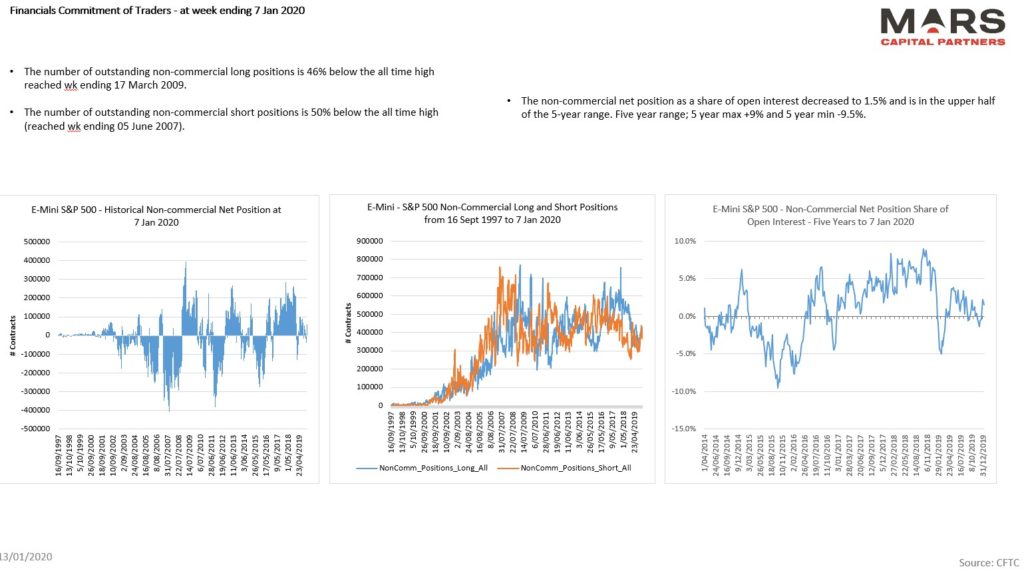
Futures traders remain flat with volumes traded at cycle lows. I suspect that this trend represents complacency and a focus on individual stock exposure. Futures traders are not driving this market melt-up.
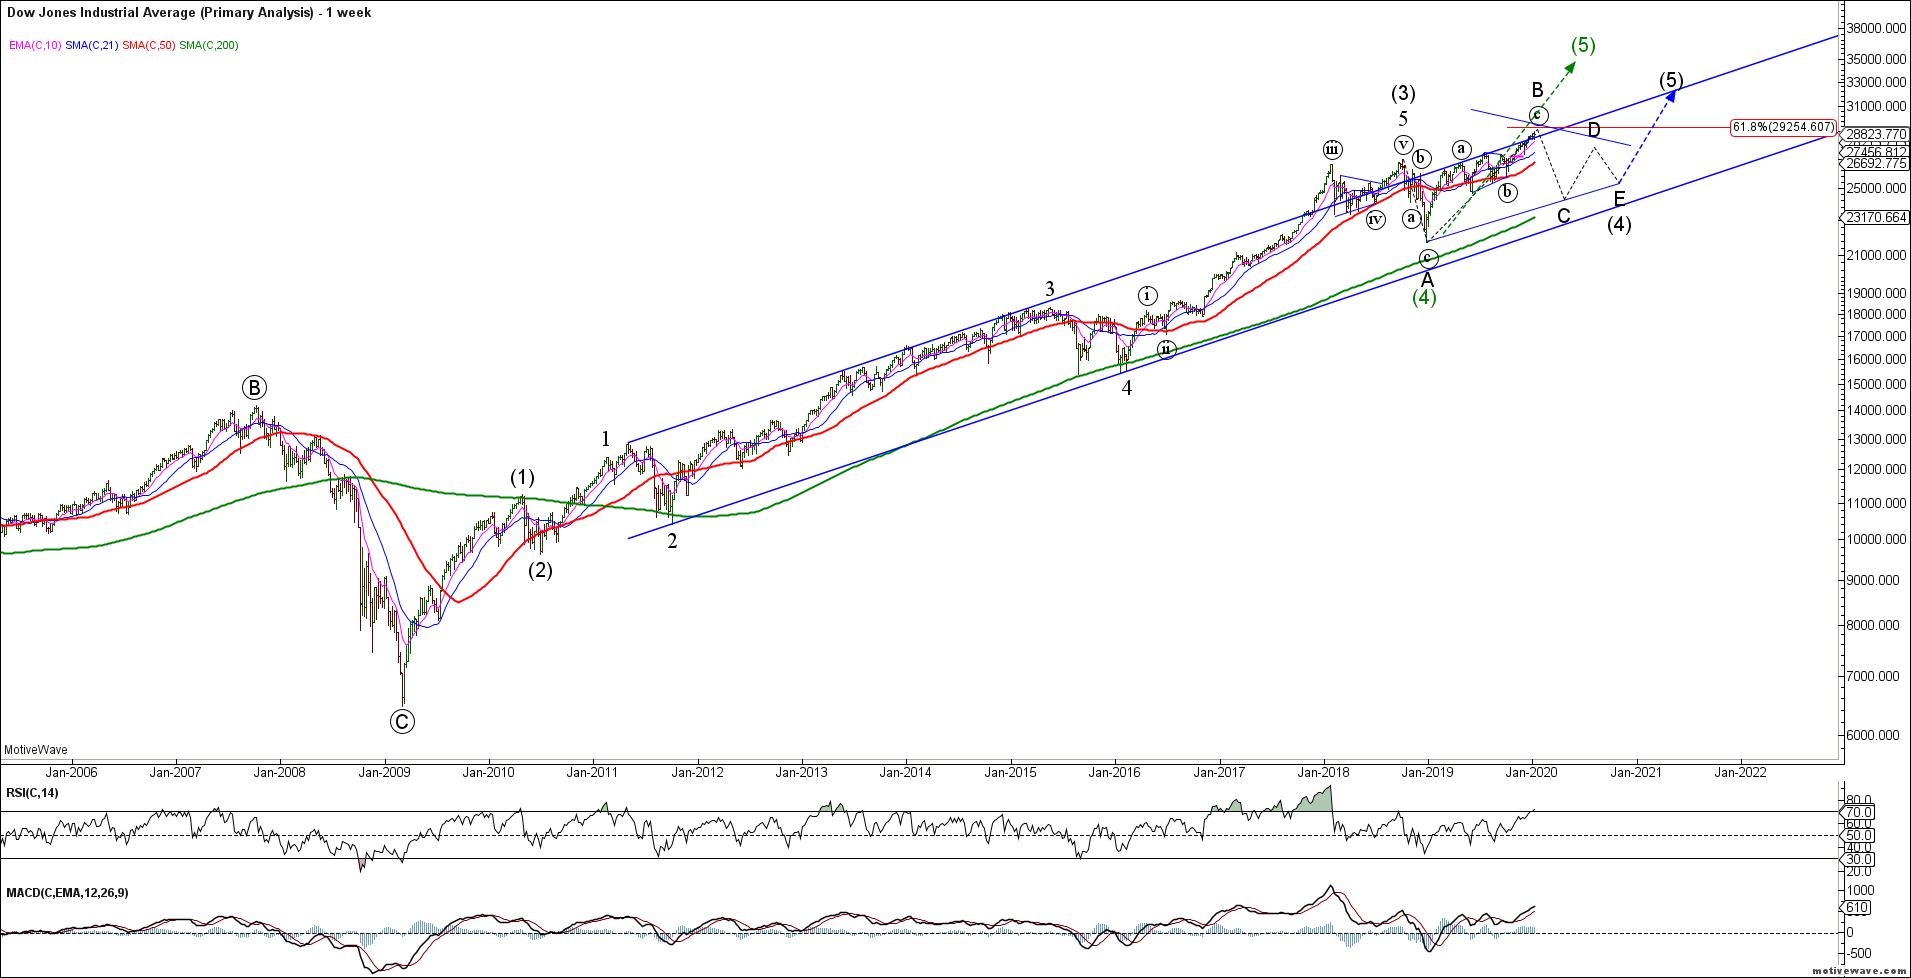
The DJIA shows the same potential structures. So far, we only have 3 waves up from the December 2018 lows. While our base case remains a larger degree 4th wave triangle throughout 2020, the potential remains for a continuation of the bull trend to develop into 5 waves (green count) if the melt-up continues.
DJIA Weekly
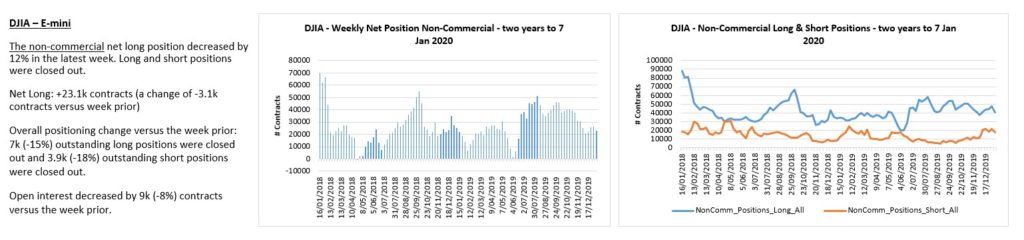
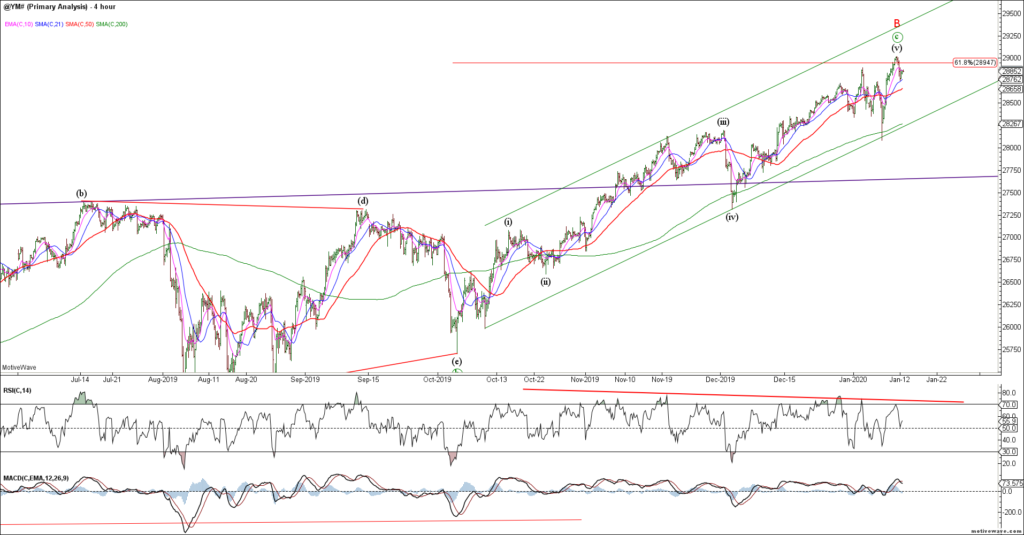
The YM shows momentum divergence at recent highs. We now need to see evidence of a bear reversal.
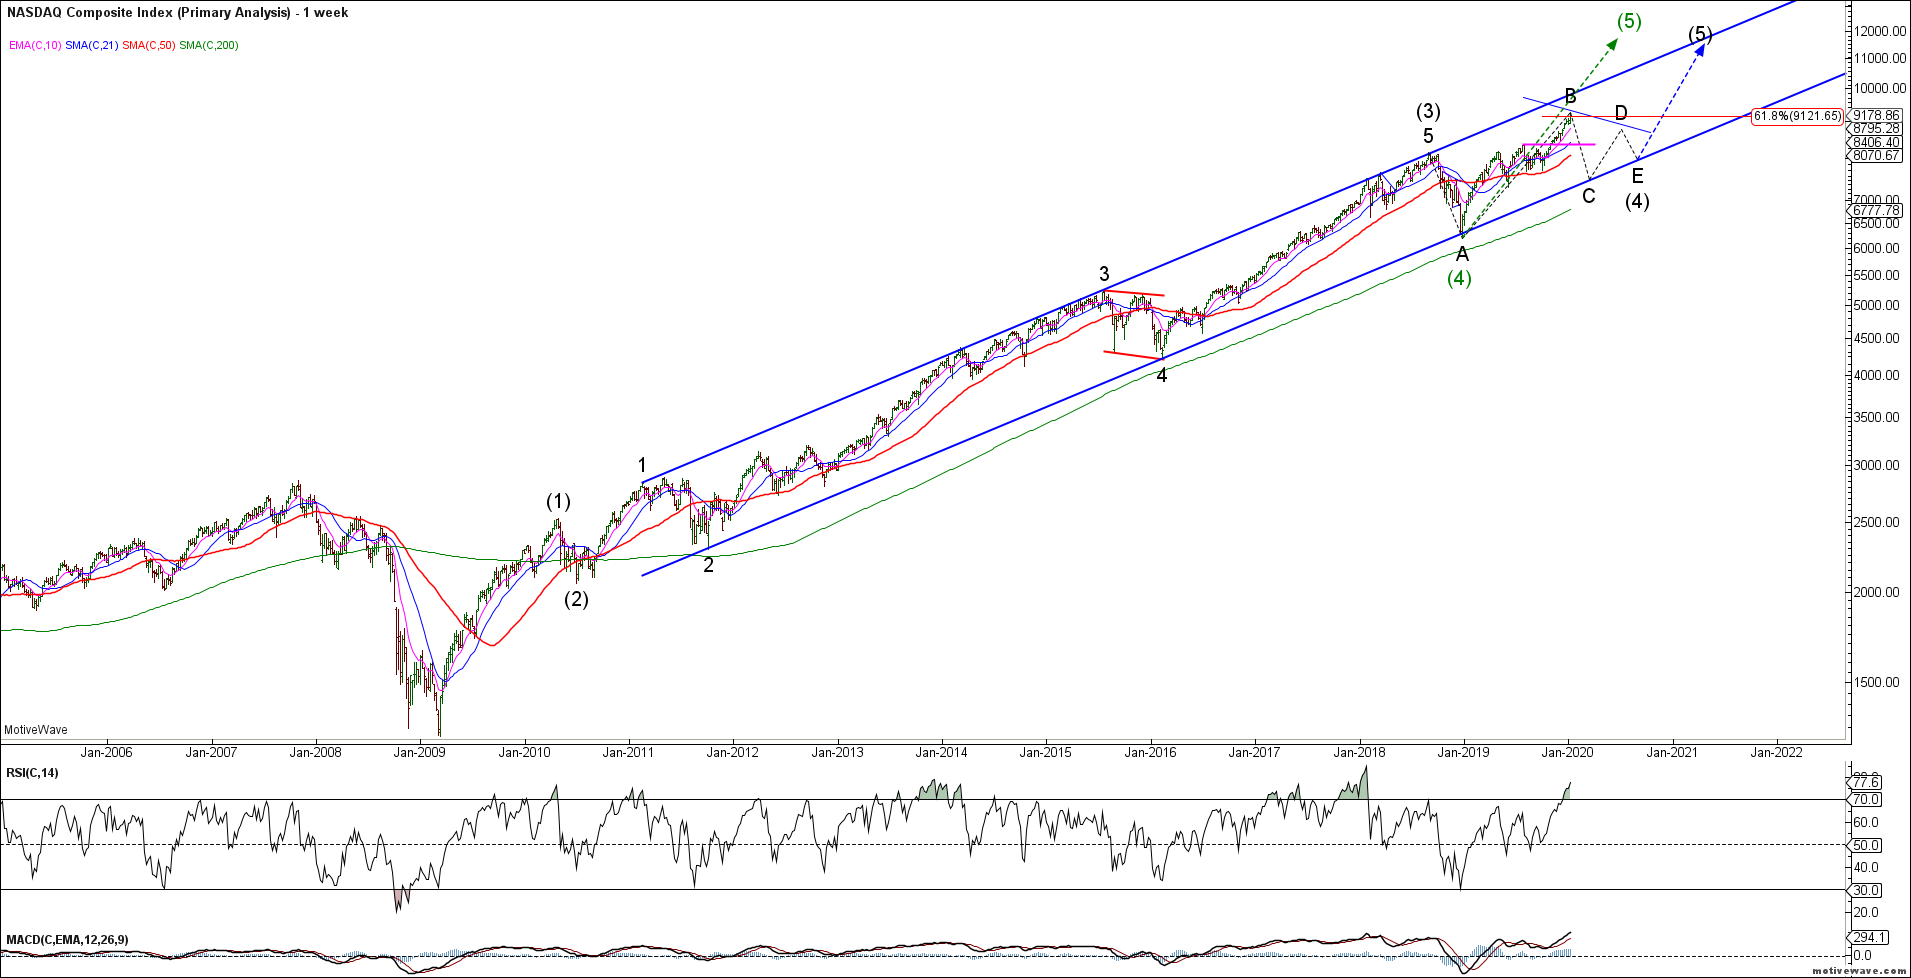
The Nasdaq shows the same potential structures with 3 waves up from the December 2018 lows so far. Last year we highlighted the expectation of new ATH’s for the Nasdaq indices. This index has a clearly definable trend channel for the post-2009 rally. The bulls remain in control while above the key 8330 breakout.
Nasdaq Composite Weekly
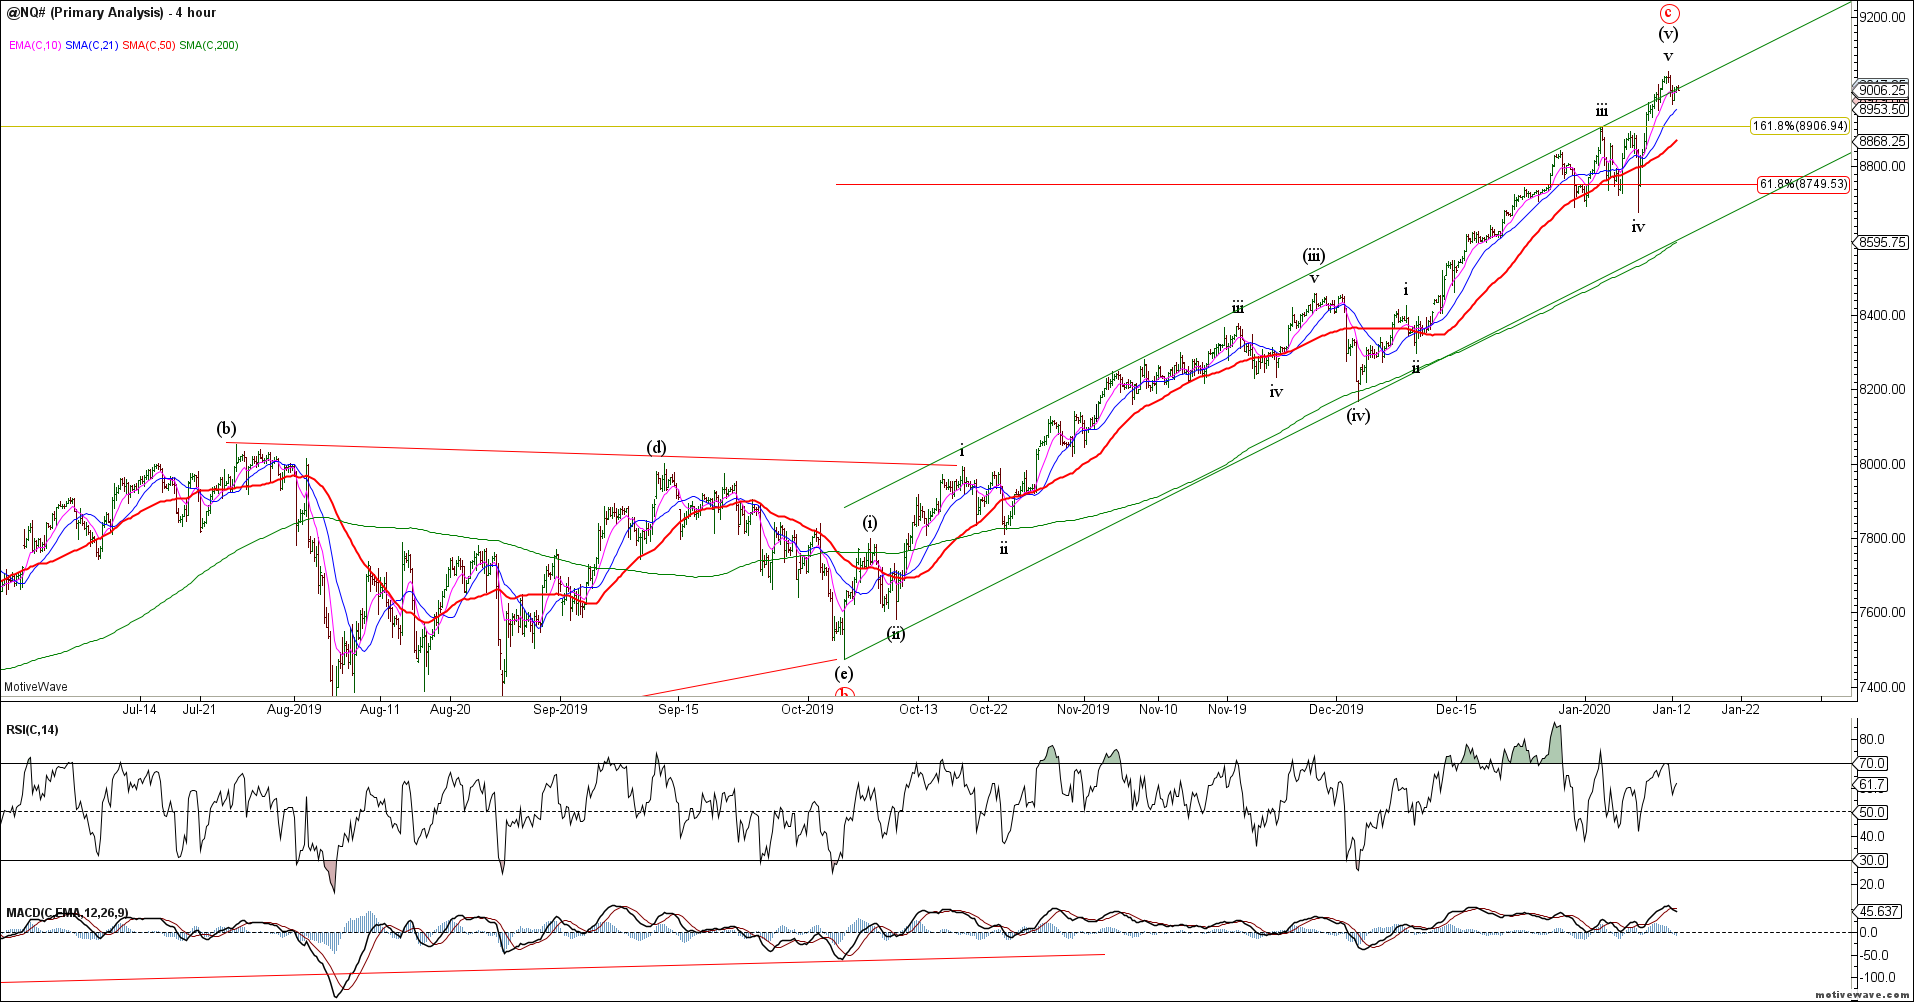
NQ now has near term 5th wave divergence. Bears need to break these trend channels.
NQ H4
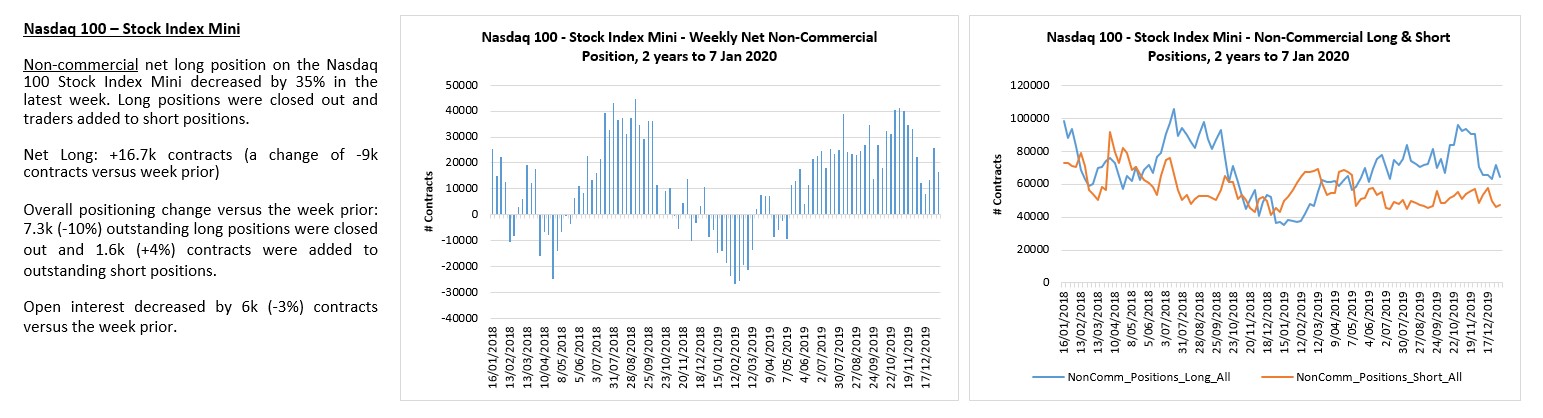
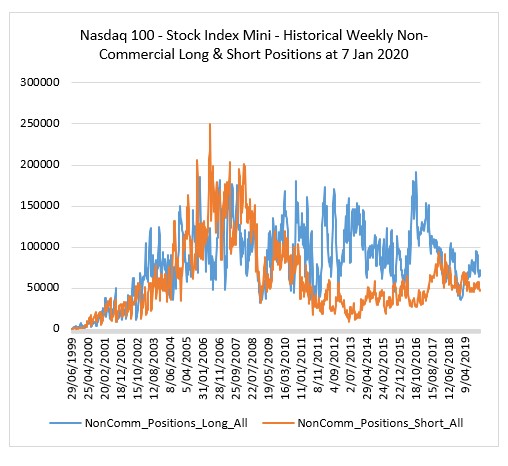
NQ traders are slightly long but volumes are less than half cycle peaks. Traders just want to own stocks.
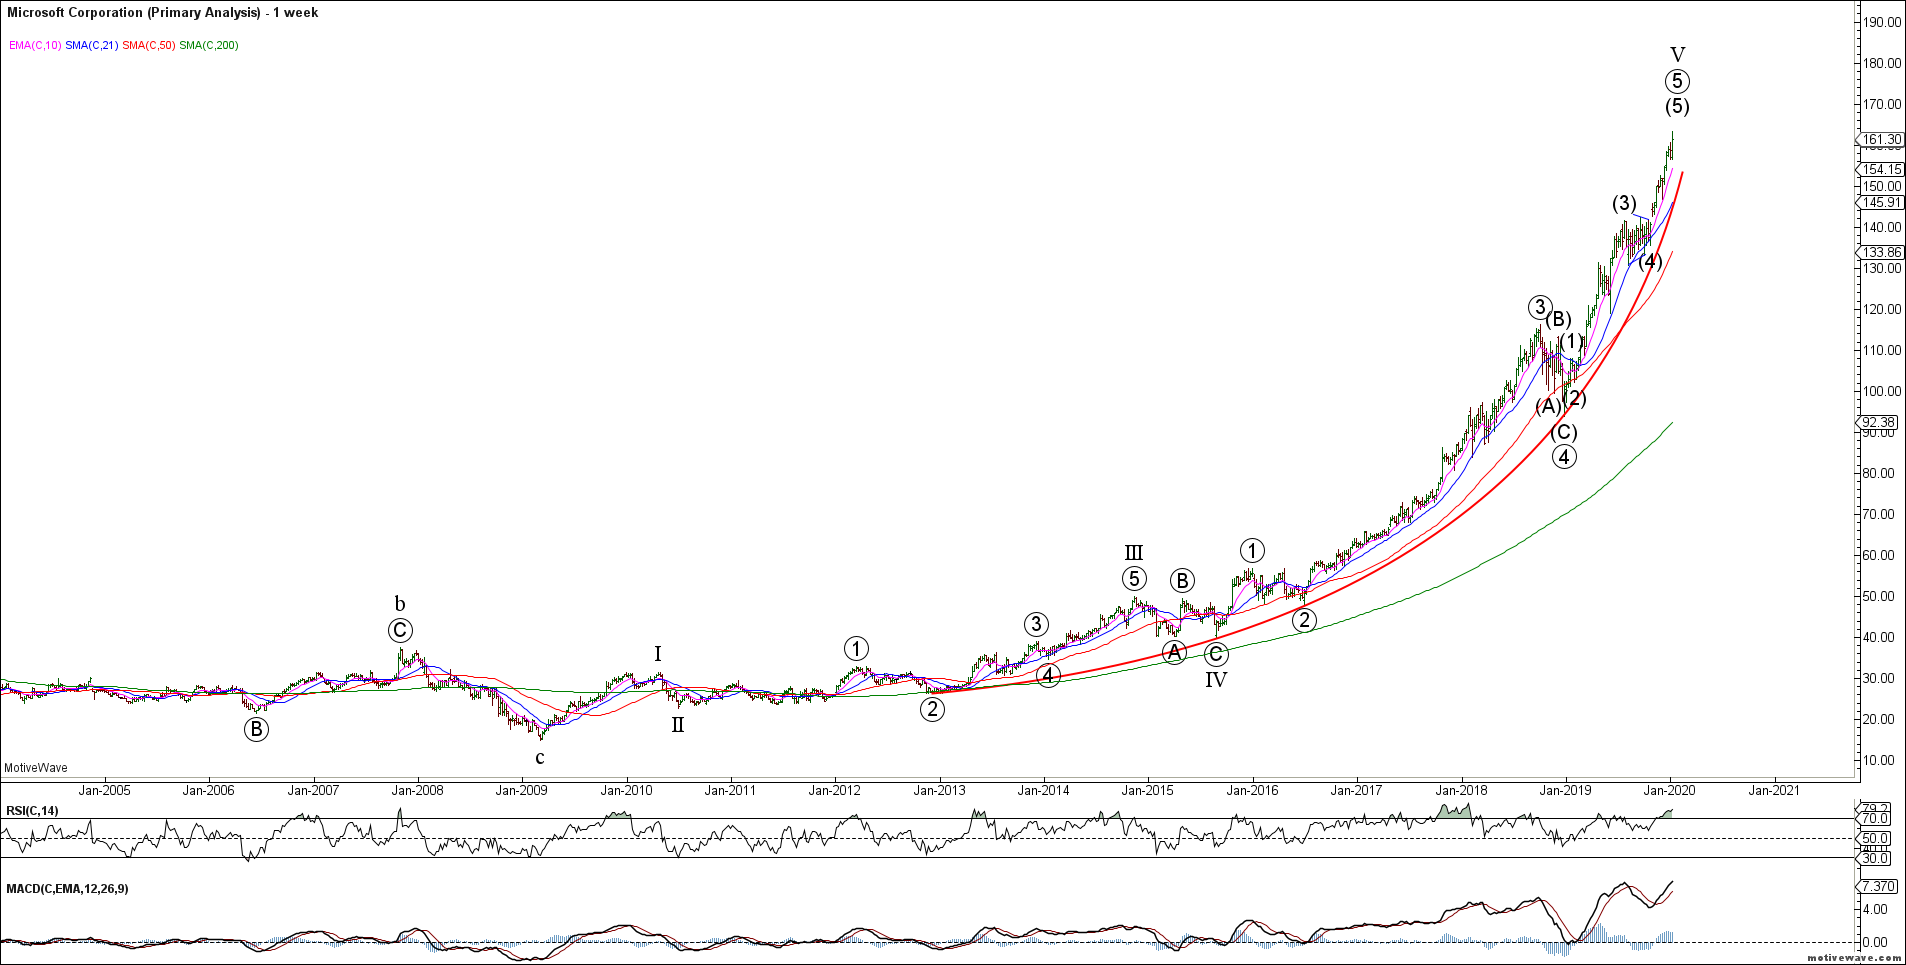
MSFT may be the best representation of the parabolic stock chase taking place supporting the Nasdaq. Parabolic runs always retrace violently so we will continue to watch MSFT for evidence of a tradable top.
MSFT Weekly
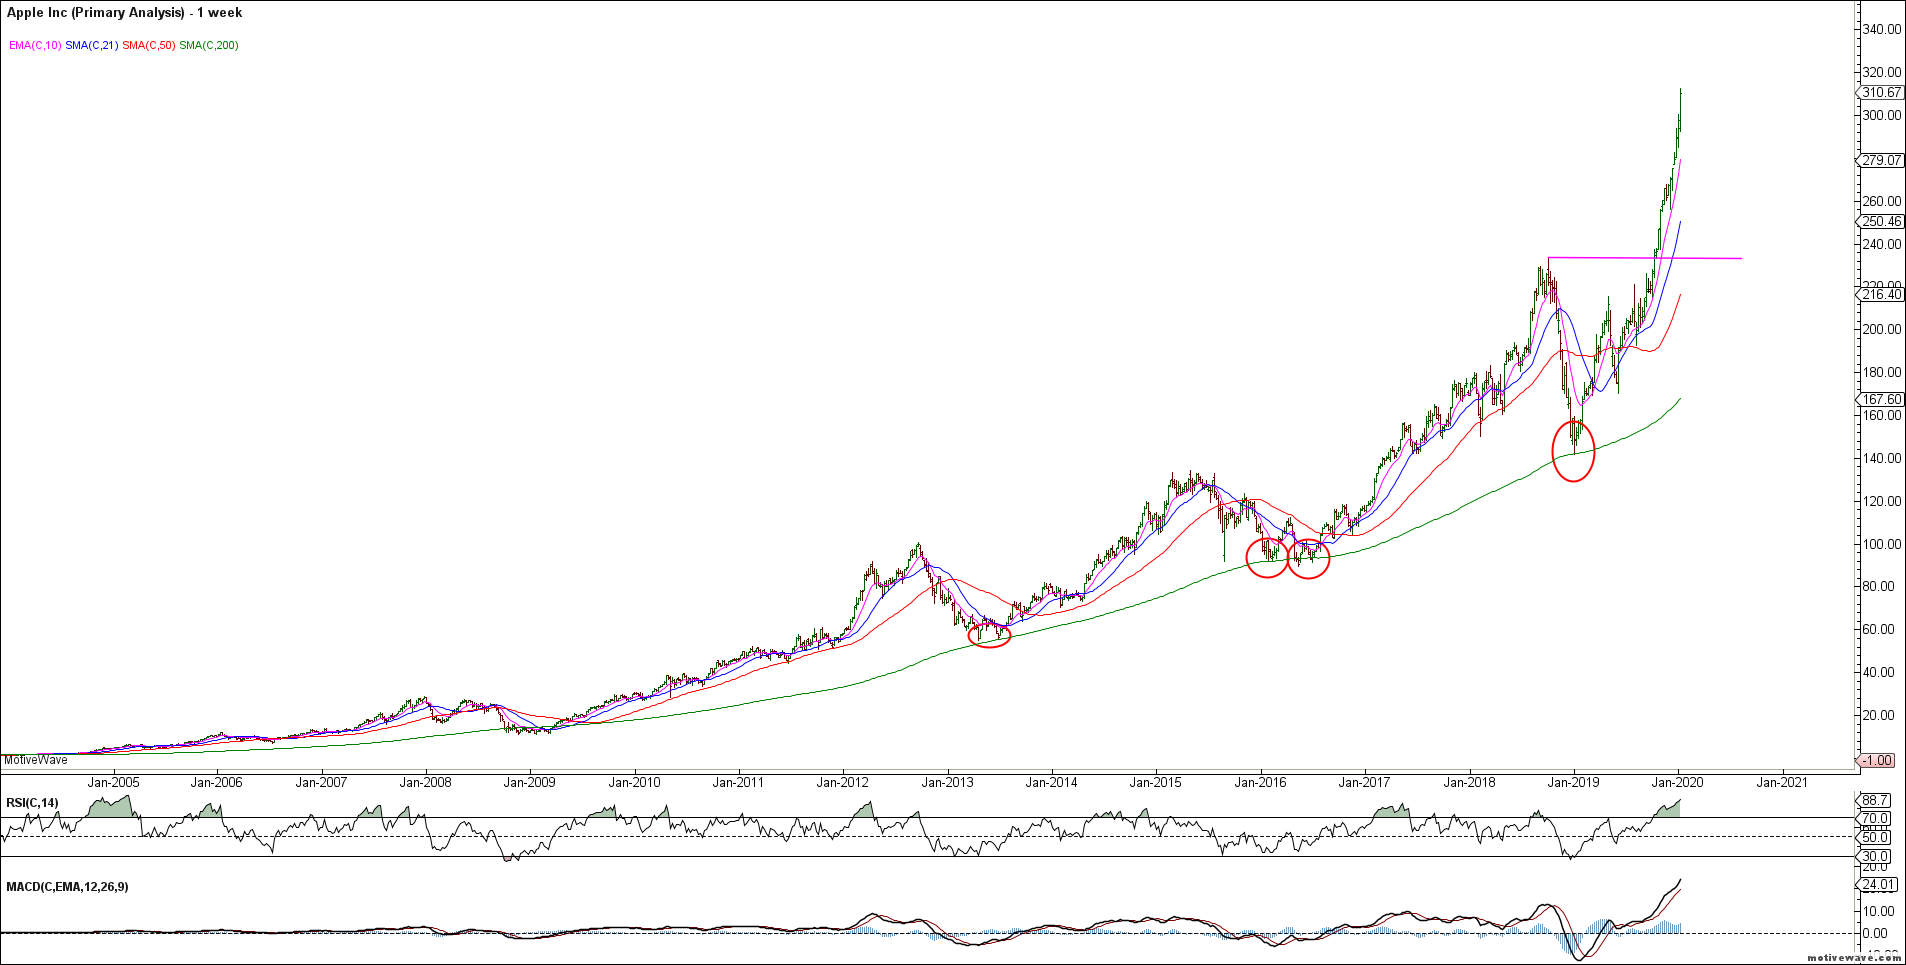
Similarly, AAPL has more than doubled in price since bouncing off our 2018 support and is now in a parabolic rally. These individual darling stocks are driving the larger indices.
AAPL Weekly
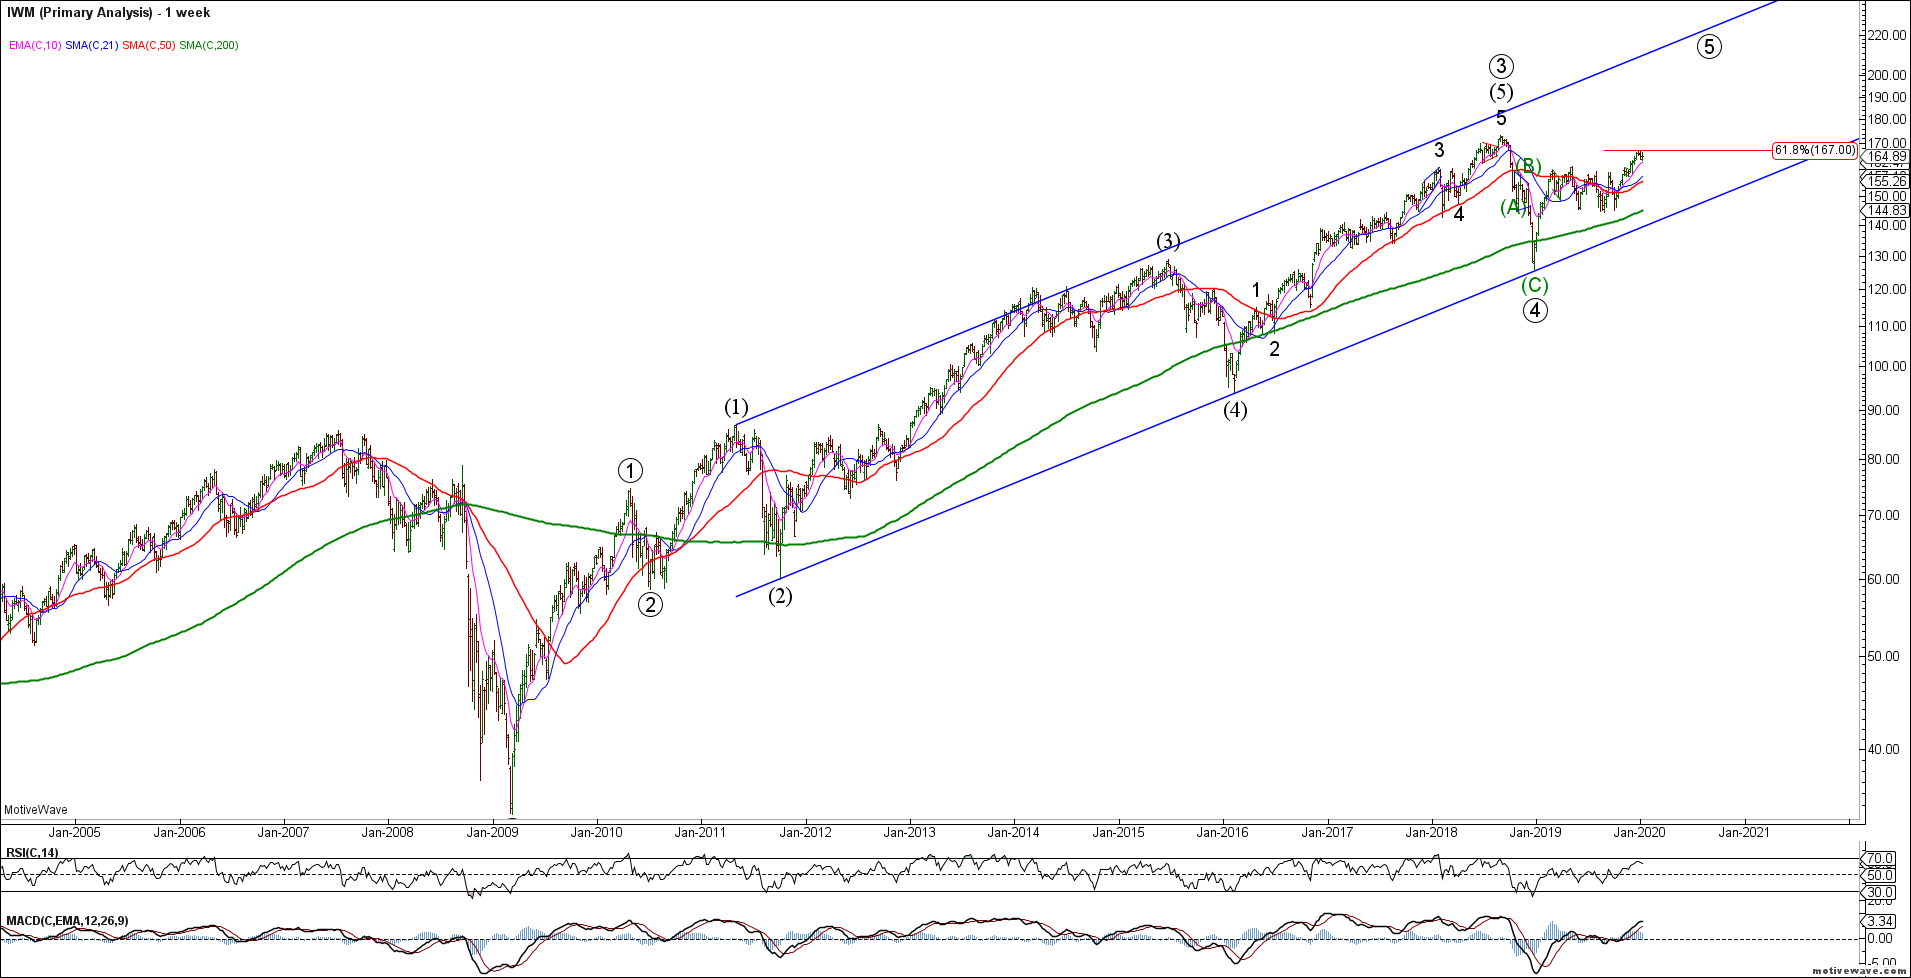
The Russell 2000 small caps have lagged the broader indices and remains below its 2018 highs. The corrective 3 wave decline in 2018 implies that we do NOT have a bigger picture change in trend and we should ultimately expect new ATH’s in 5 waves. So far, the rally is only in 3 waves so could still be part of a larger corrective wave (4). Bulls need to extend this rally into 5 waves to maintain near term momentum.
IWM Weekly
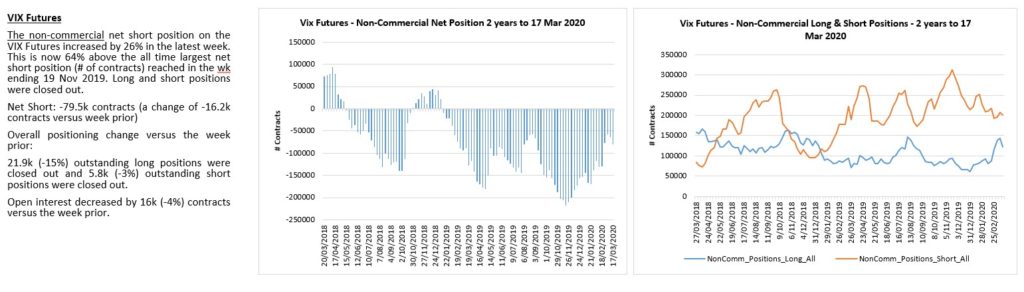
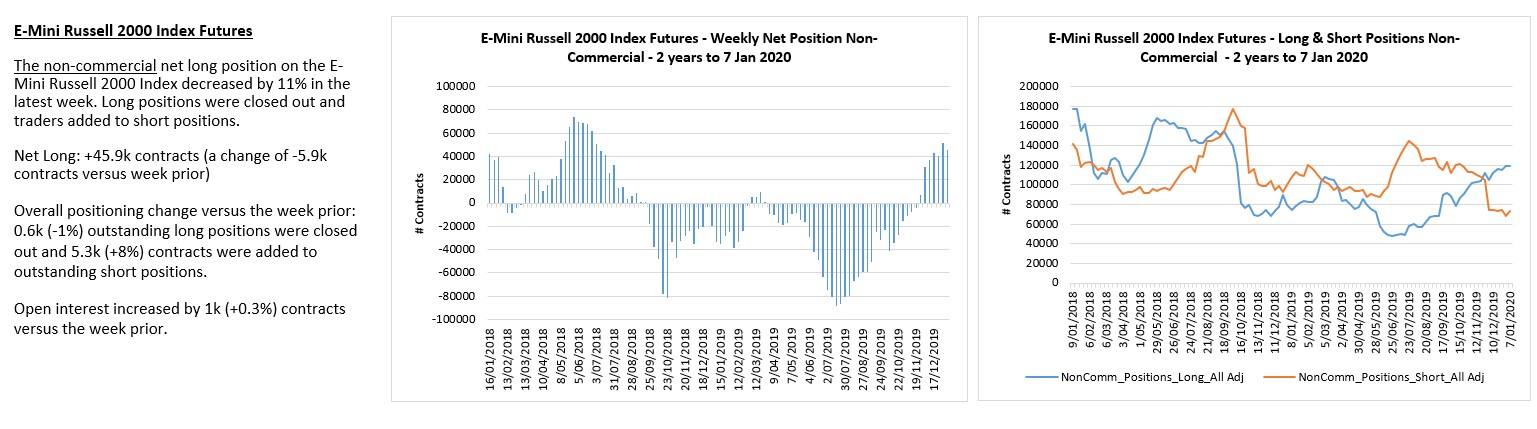
Complacency reigns as shorts hit new cycle lows.
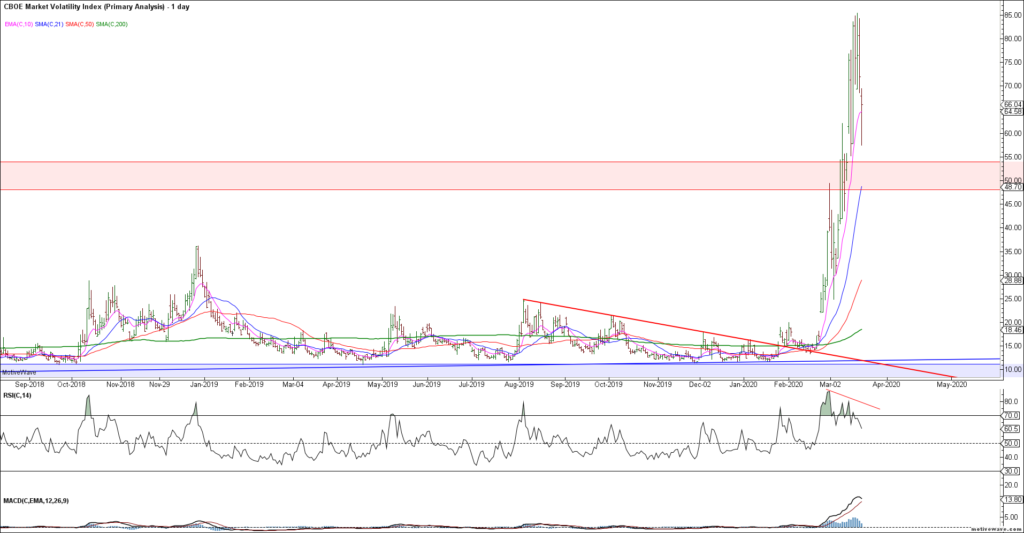
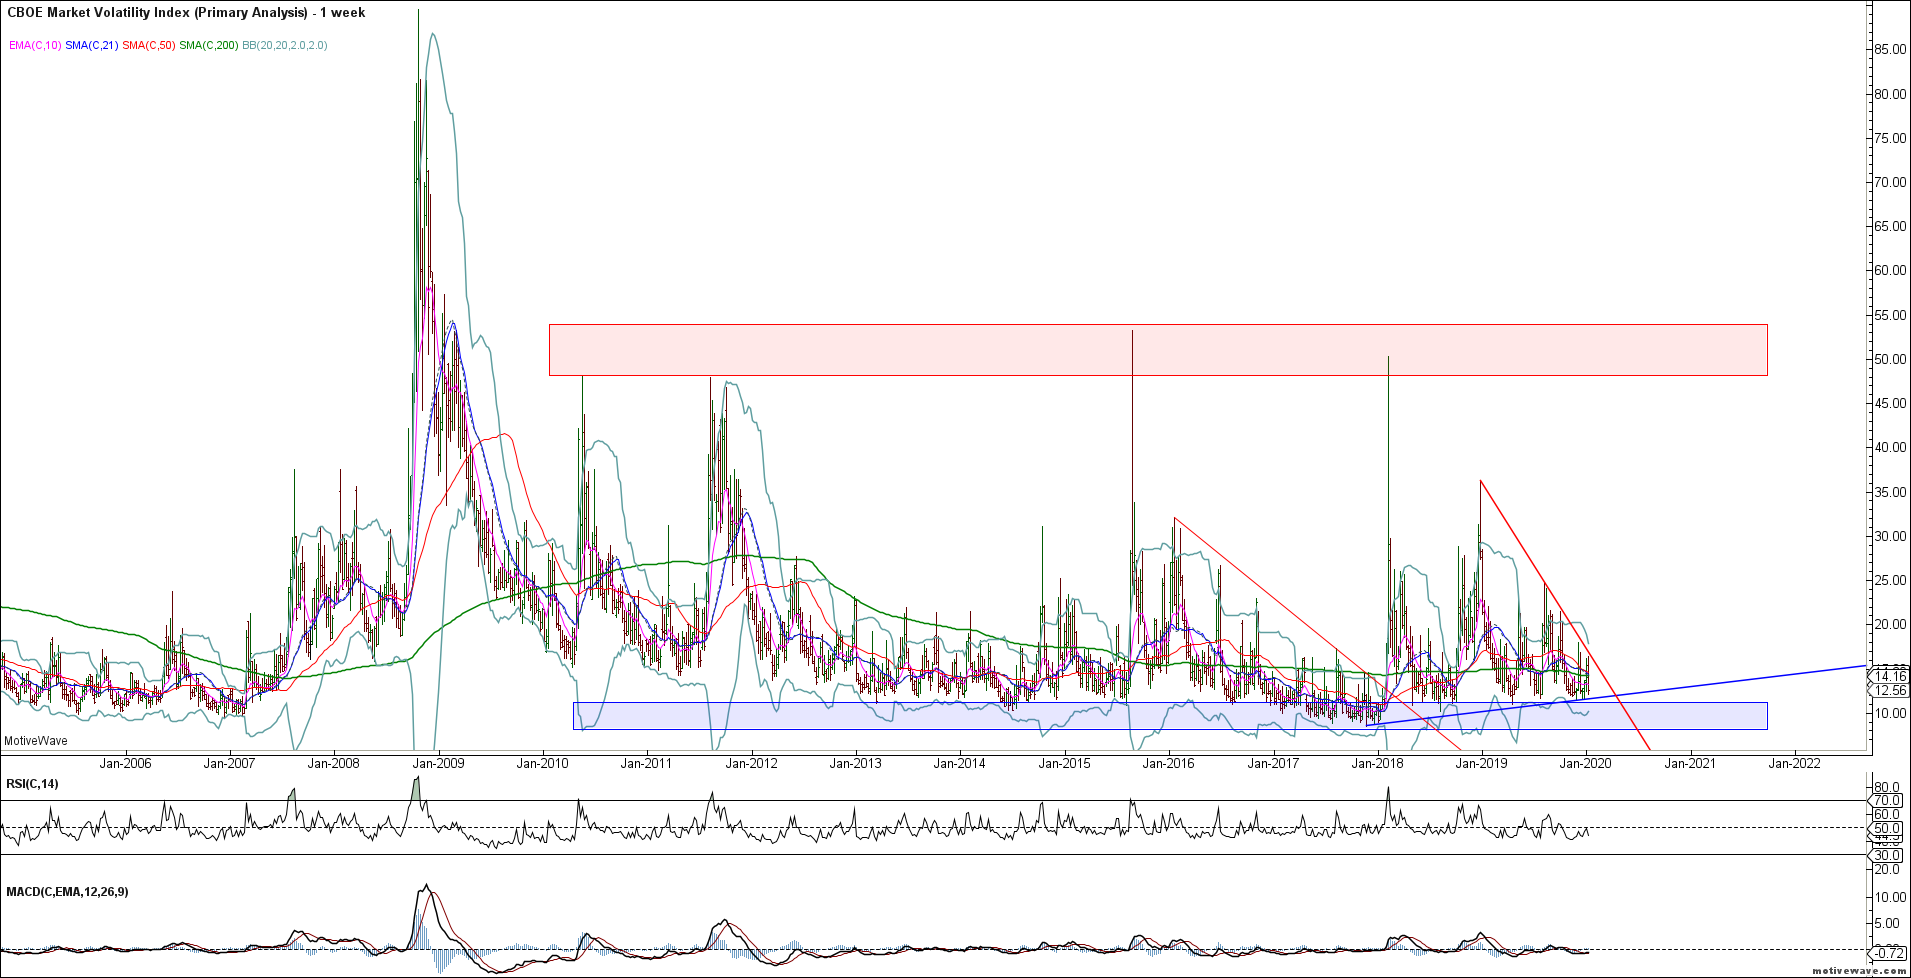
The Fed has been successful in compressing volatility. The VIX is contracting sharply but remains above the 2018 lows forming an inter-market divergence. Portfolio insurance remains cheap given the over-extended nature of this rally. Extended volatility compression leads to sudden expansion. Forewarned is forearmed…
VIX Weekly
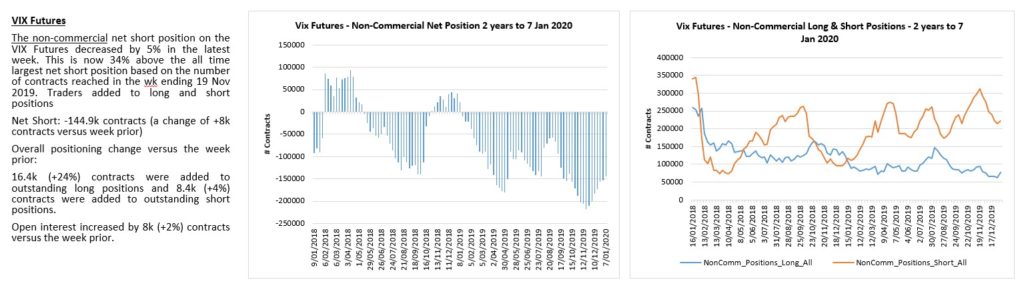
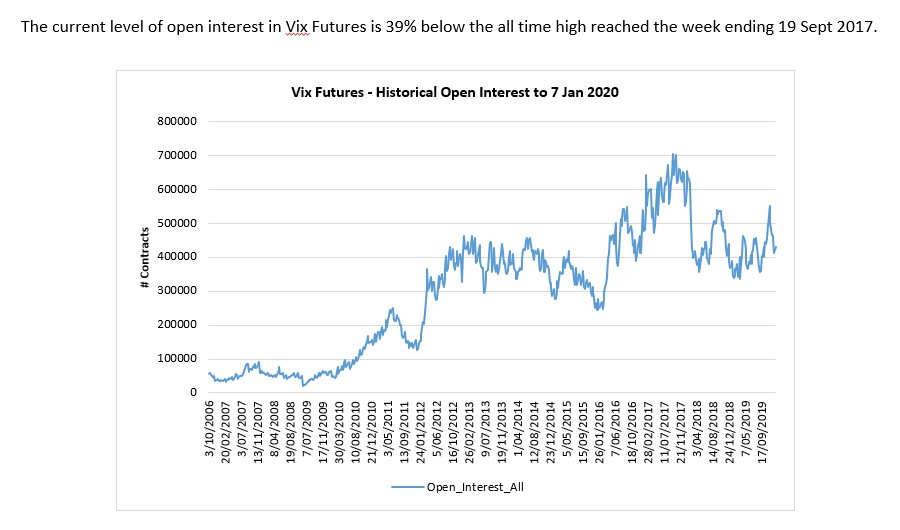
VIX volume is 39% below its peak.
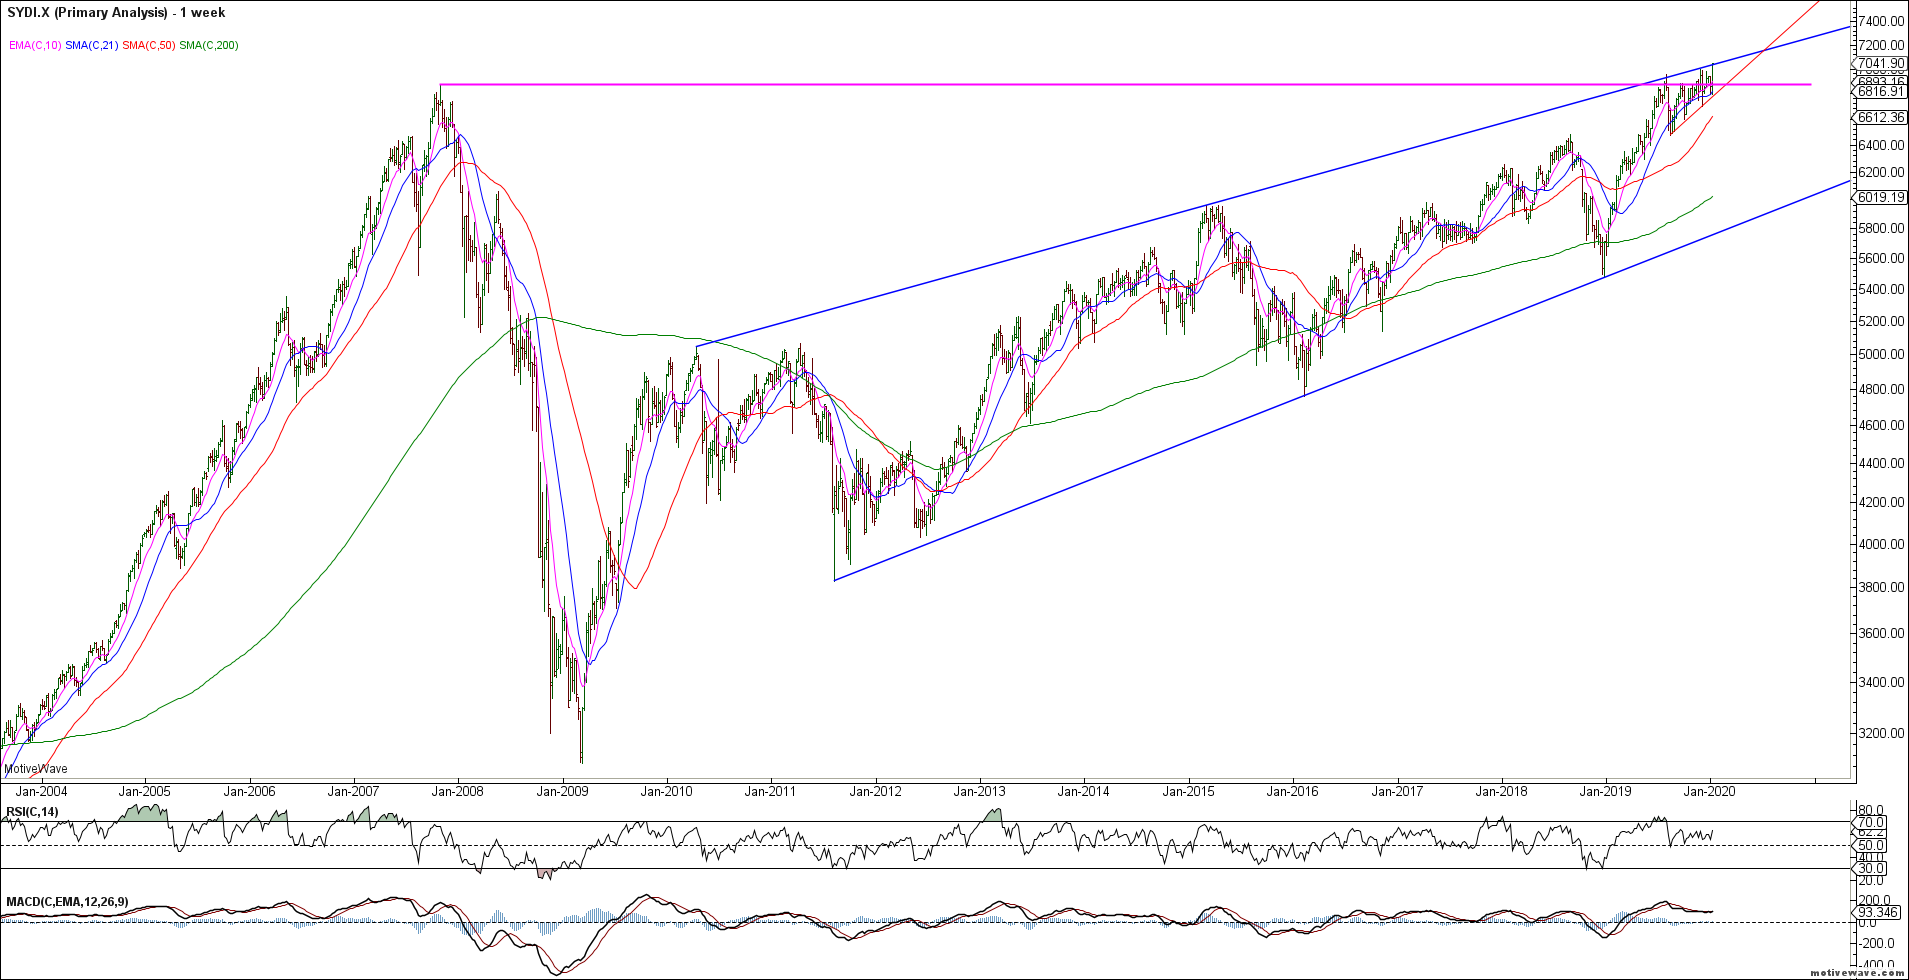
To the global equity markets and we appear to be wedging towards major market highs. The ASX200 appears to be a good example now making new ATH’s in a clearly defined wedge. These are usually ending patterns so we are alert to a bearish reversal in the Aussie stock market.
ASX200 Weekly
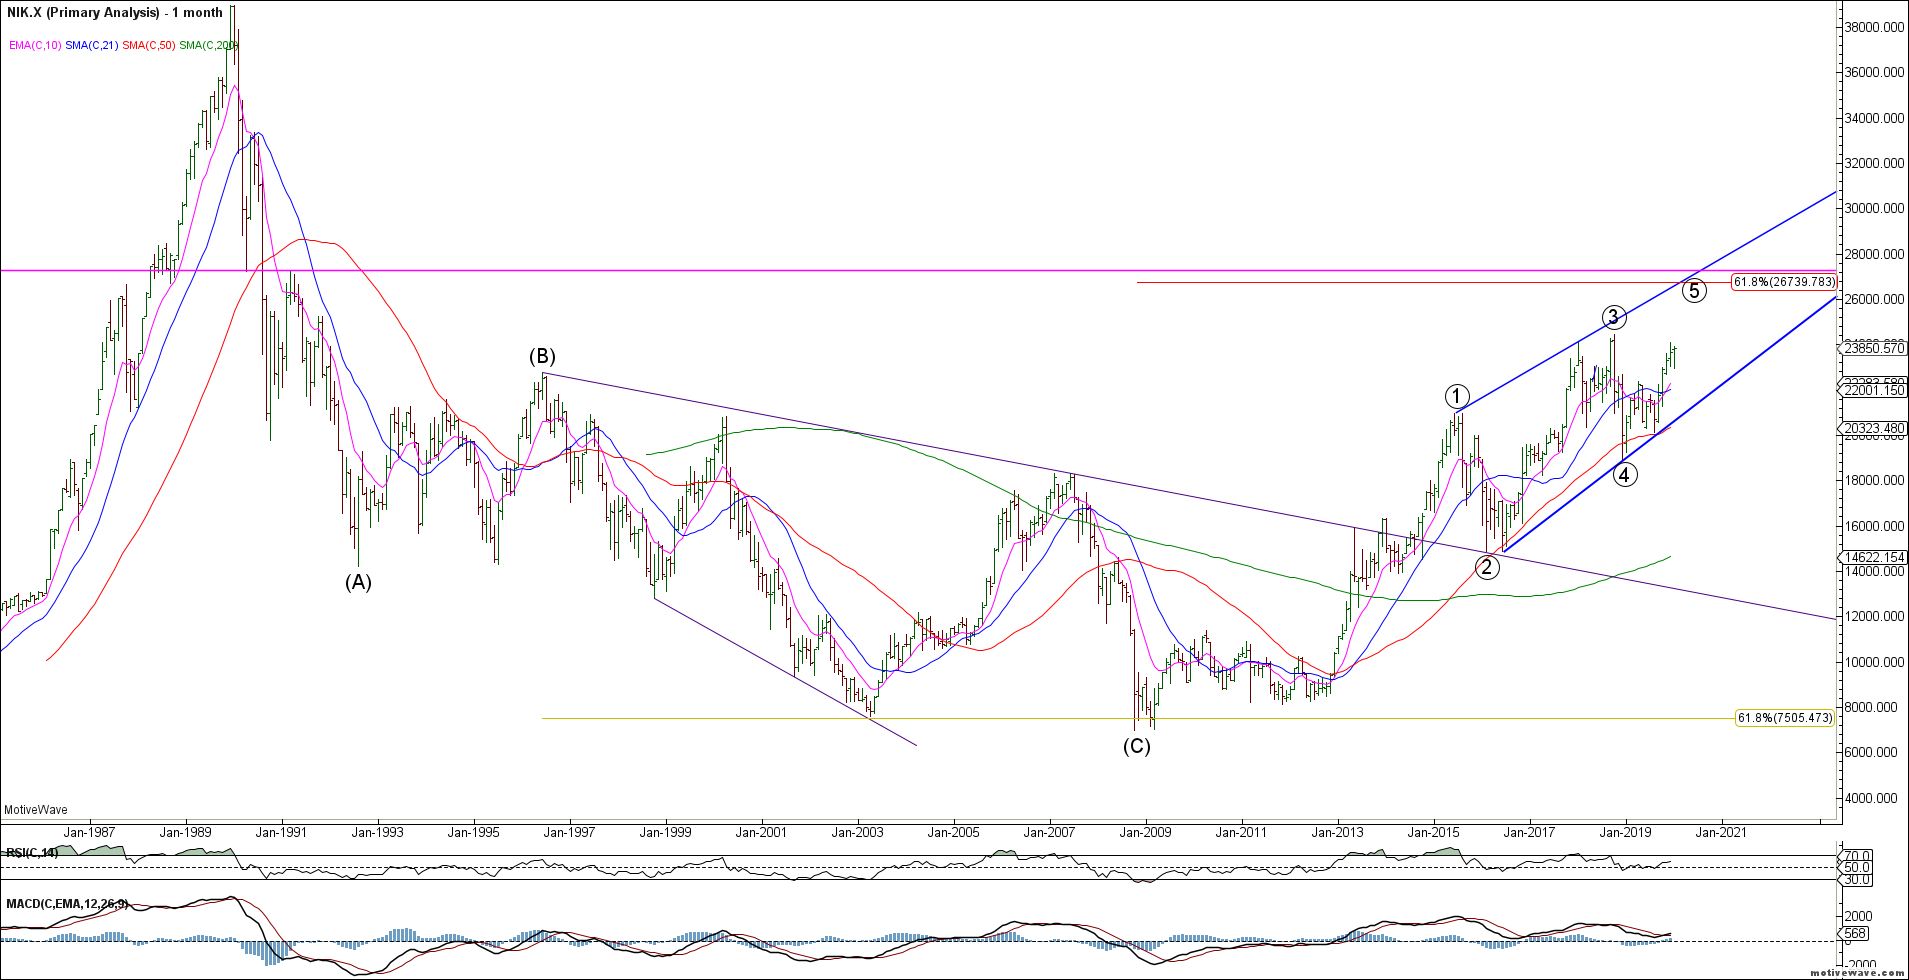
Similarly, the Nikkei 225 appears to be in wave 5 of an ending wedge. We still need to see a final push above the wave 3 highs (24448) to help confirm this outlook.
Nikkei 225 Monthly
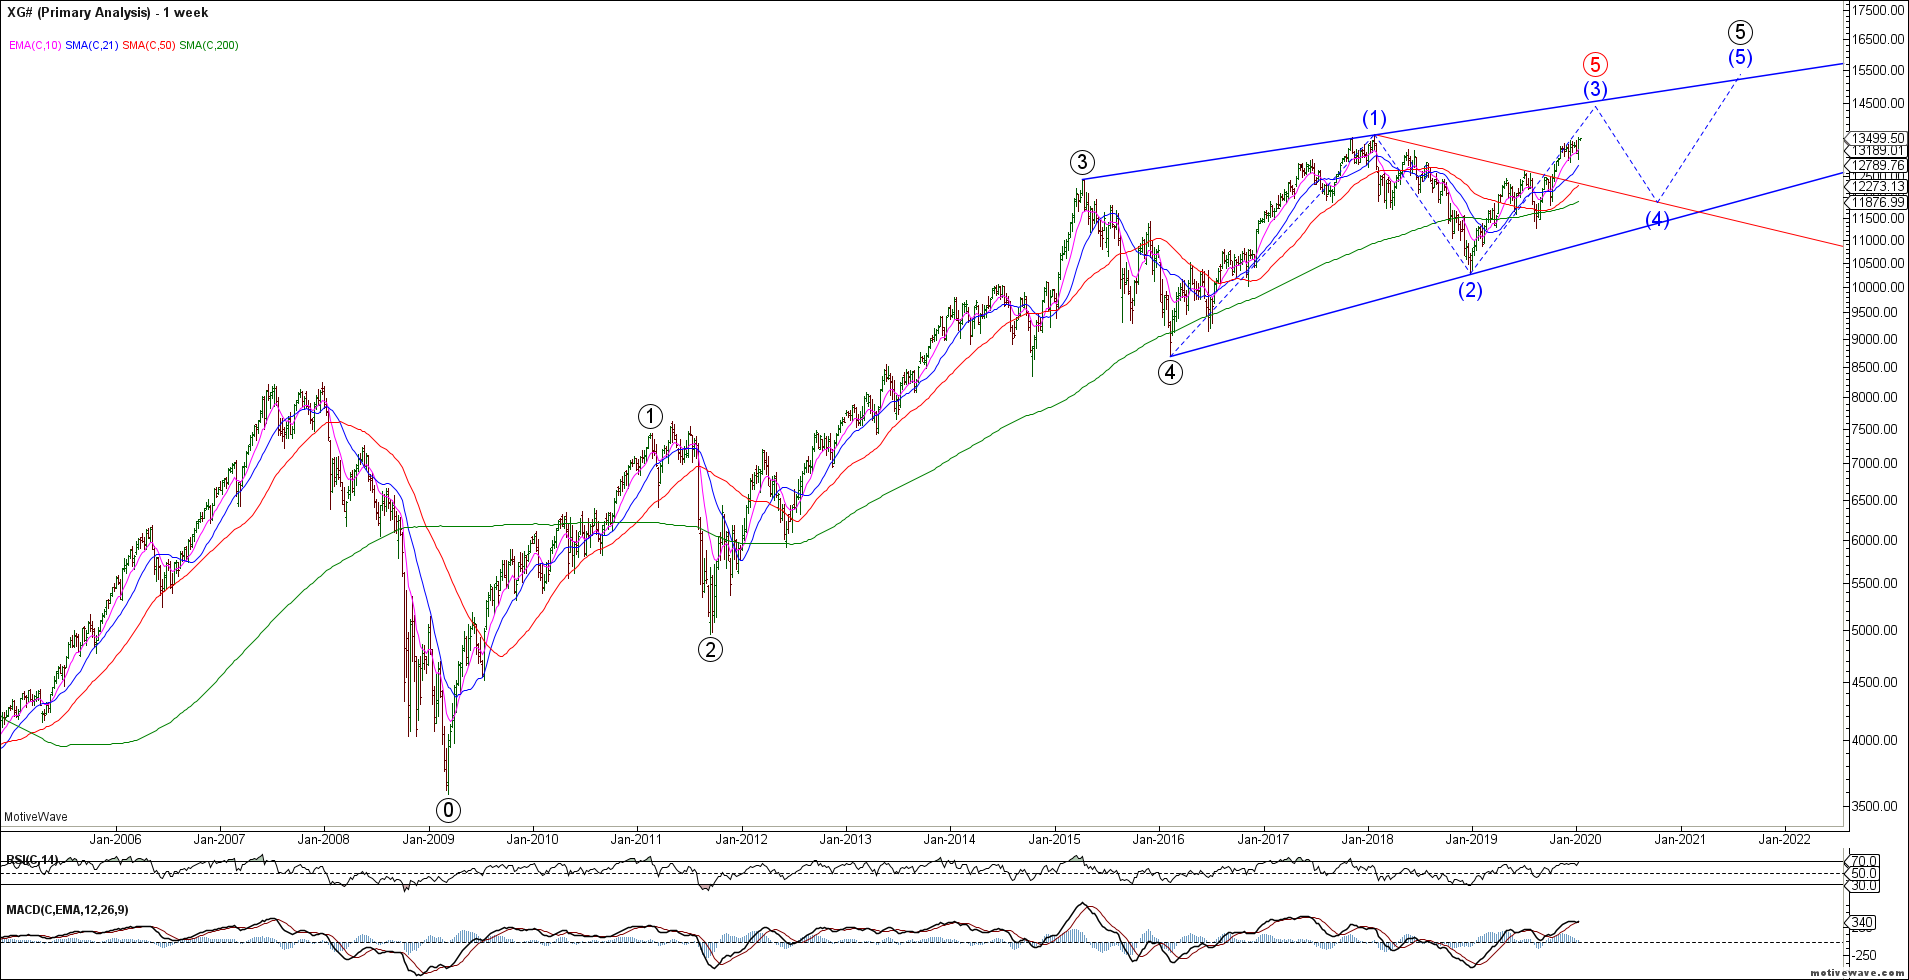
The DAX also appears to be wedging into the highs but would look best with a final push higher towards 14500 as it is yet to break the 2018 highs. It is either completing blue wave 3 of (5) or all of red wave (5). Likely topping near term.
DAX Weekly
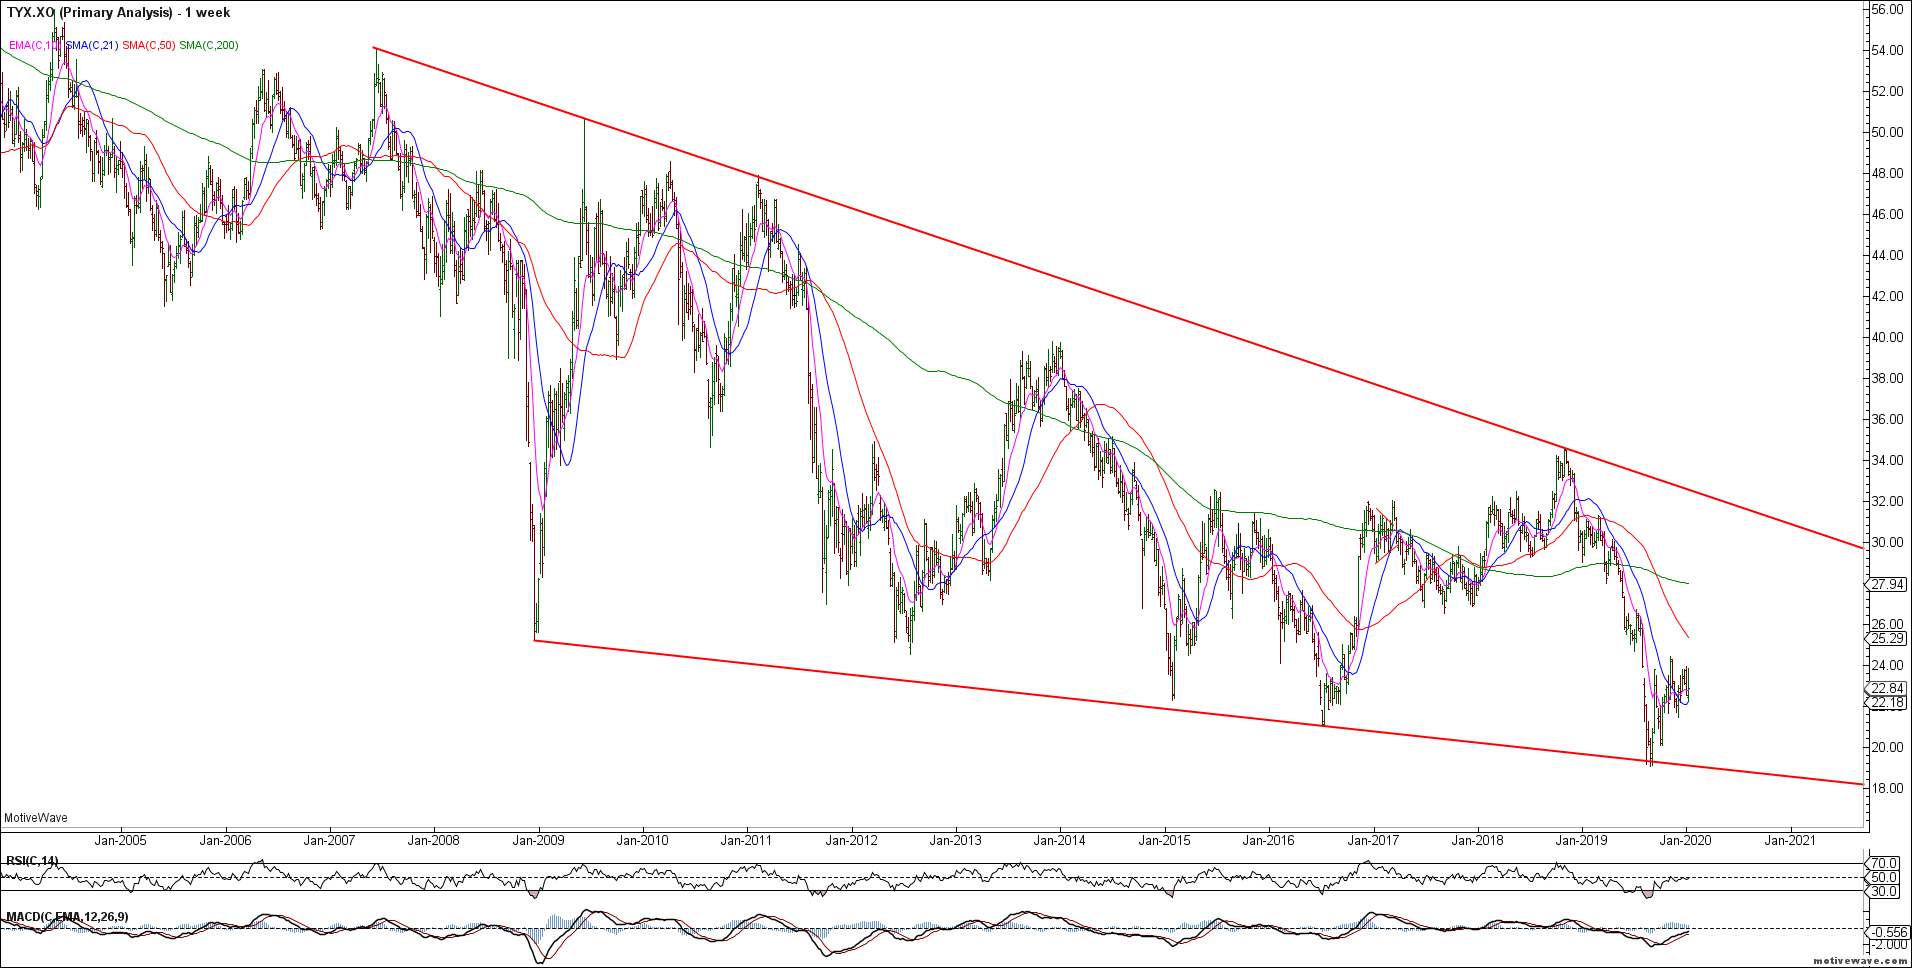
To the bond markets and last year we highlighted the probability of a new cycle low in rates given our bullish bond outlook. The TYX made a new low in September from which we have seen a corrective recovery. We remain bullish bonds until proven otherwise as we look for the 10yr and 5yr to confirm a push to new cycle lows. From there we would be looking for a trend reversal in bonds across the board as MMT is fully embraced.
TYX Weekly
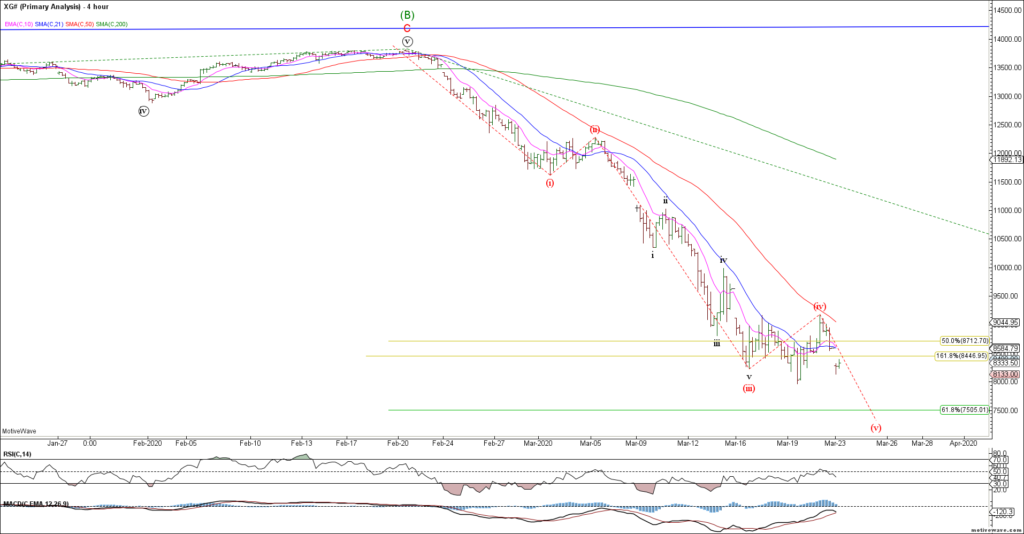
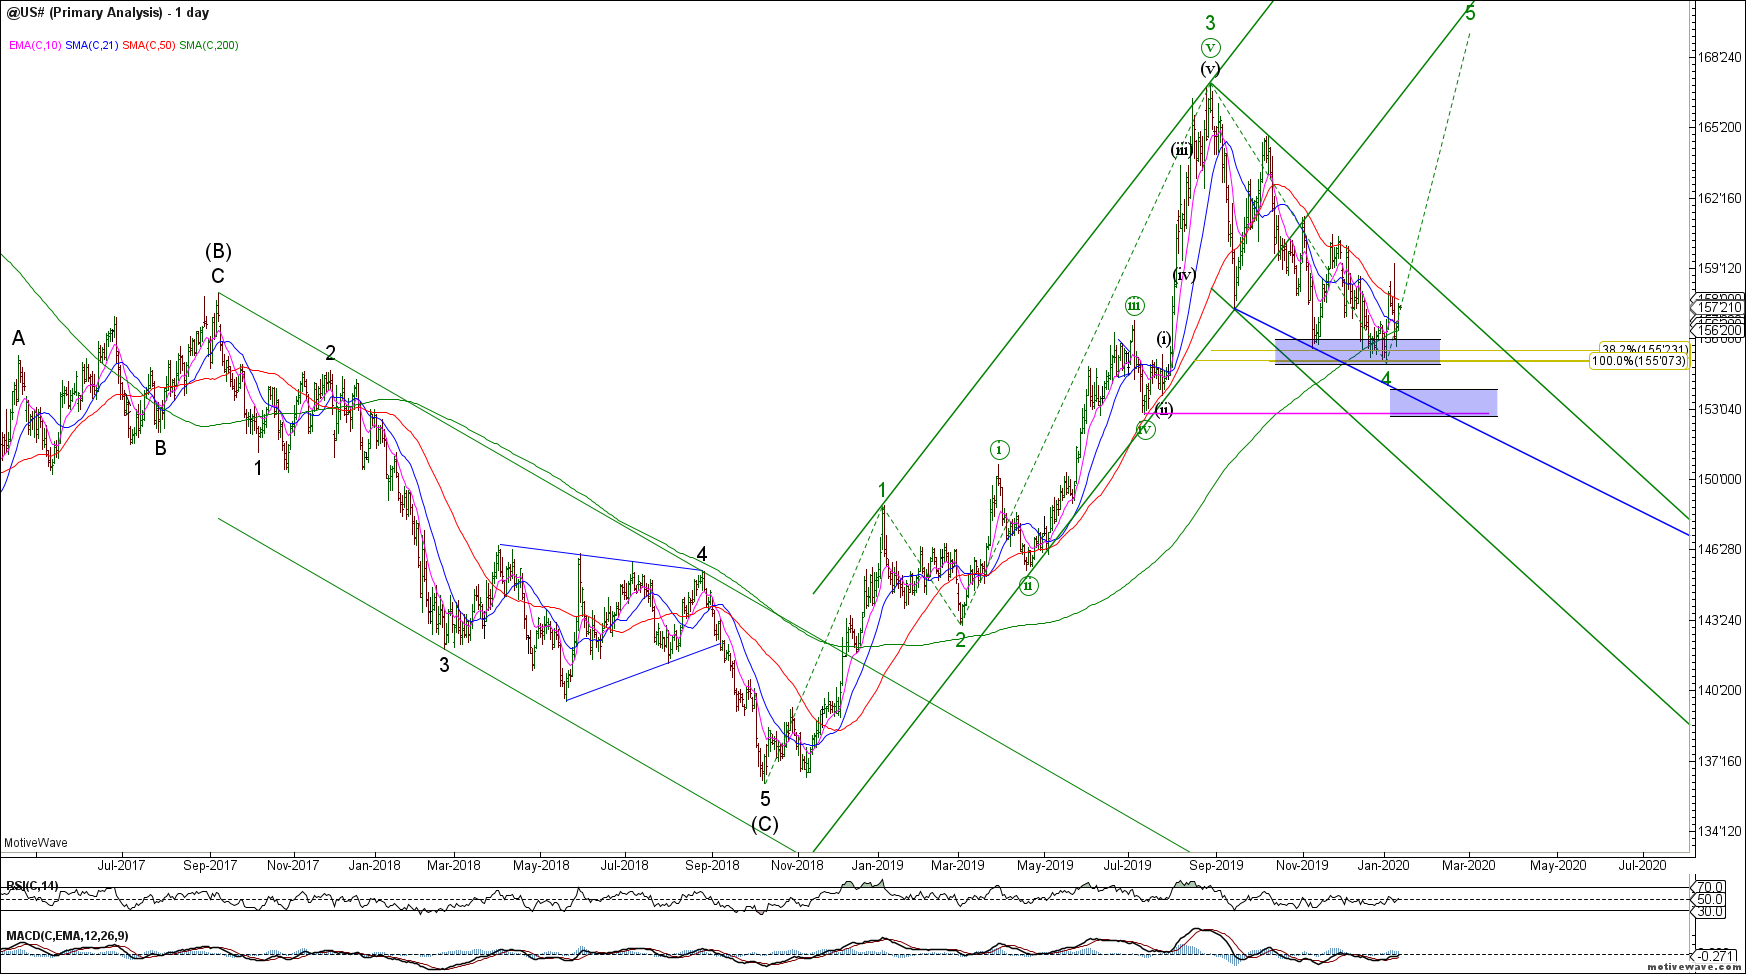
The US 30yr / ZB should be ending its wave 4 correction as we look higher for a wave 5 rally to new cycle highs. The decline from the August highs appears corrective and continues to hold support in the 153-155 area. While we should allow a further decline towards 153, our bullish bond outlook remains in tact.
ZB Daily
Traders are pressing shorts into support.
The 10yr / TY shows the same corrective wave 4 decline into strong support. We remain bullish bonds from a big picture perspective as we look for wave 5 higher from initial 128 support or secondary support in the 126’24 area.
TY Daily
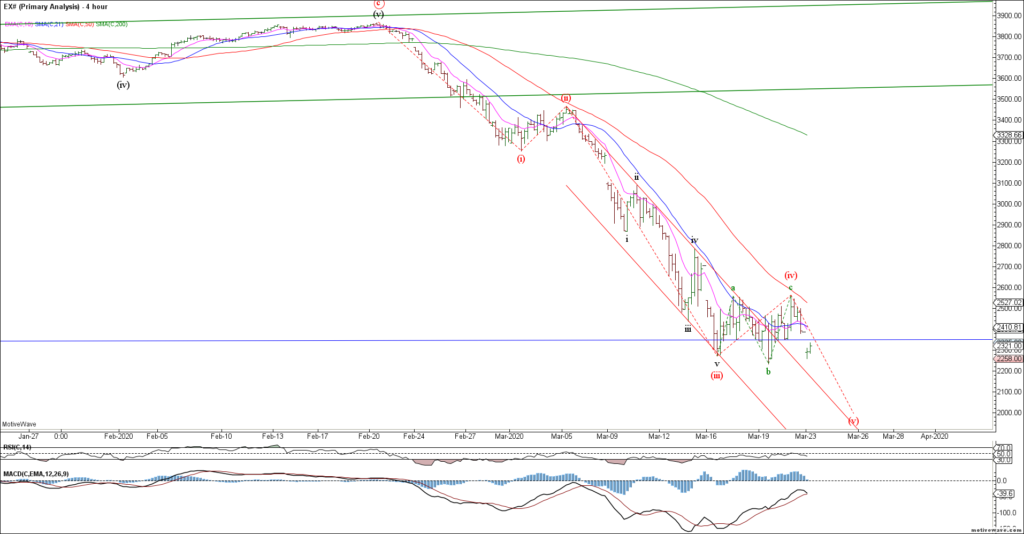
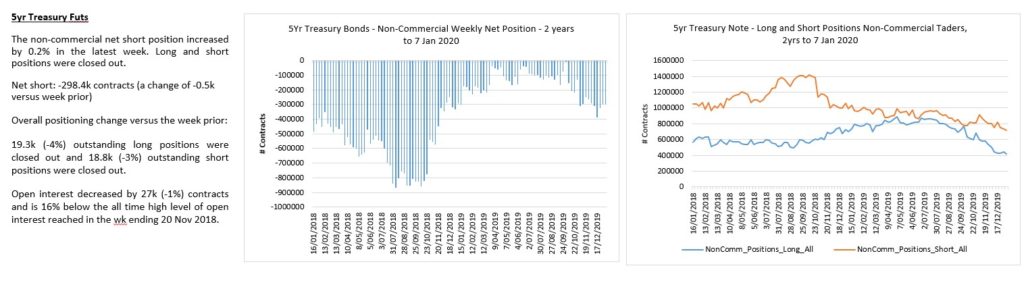
The 5yr / FV remains range bound as we look for a wave 5 rally higher from 118 or 117 support. No reason to change our bigger picture bullish outlook given the corrective nature of the decline.
FV Daily
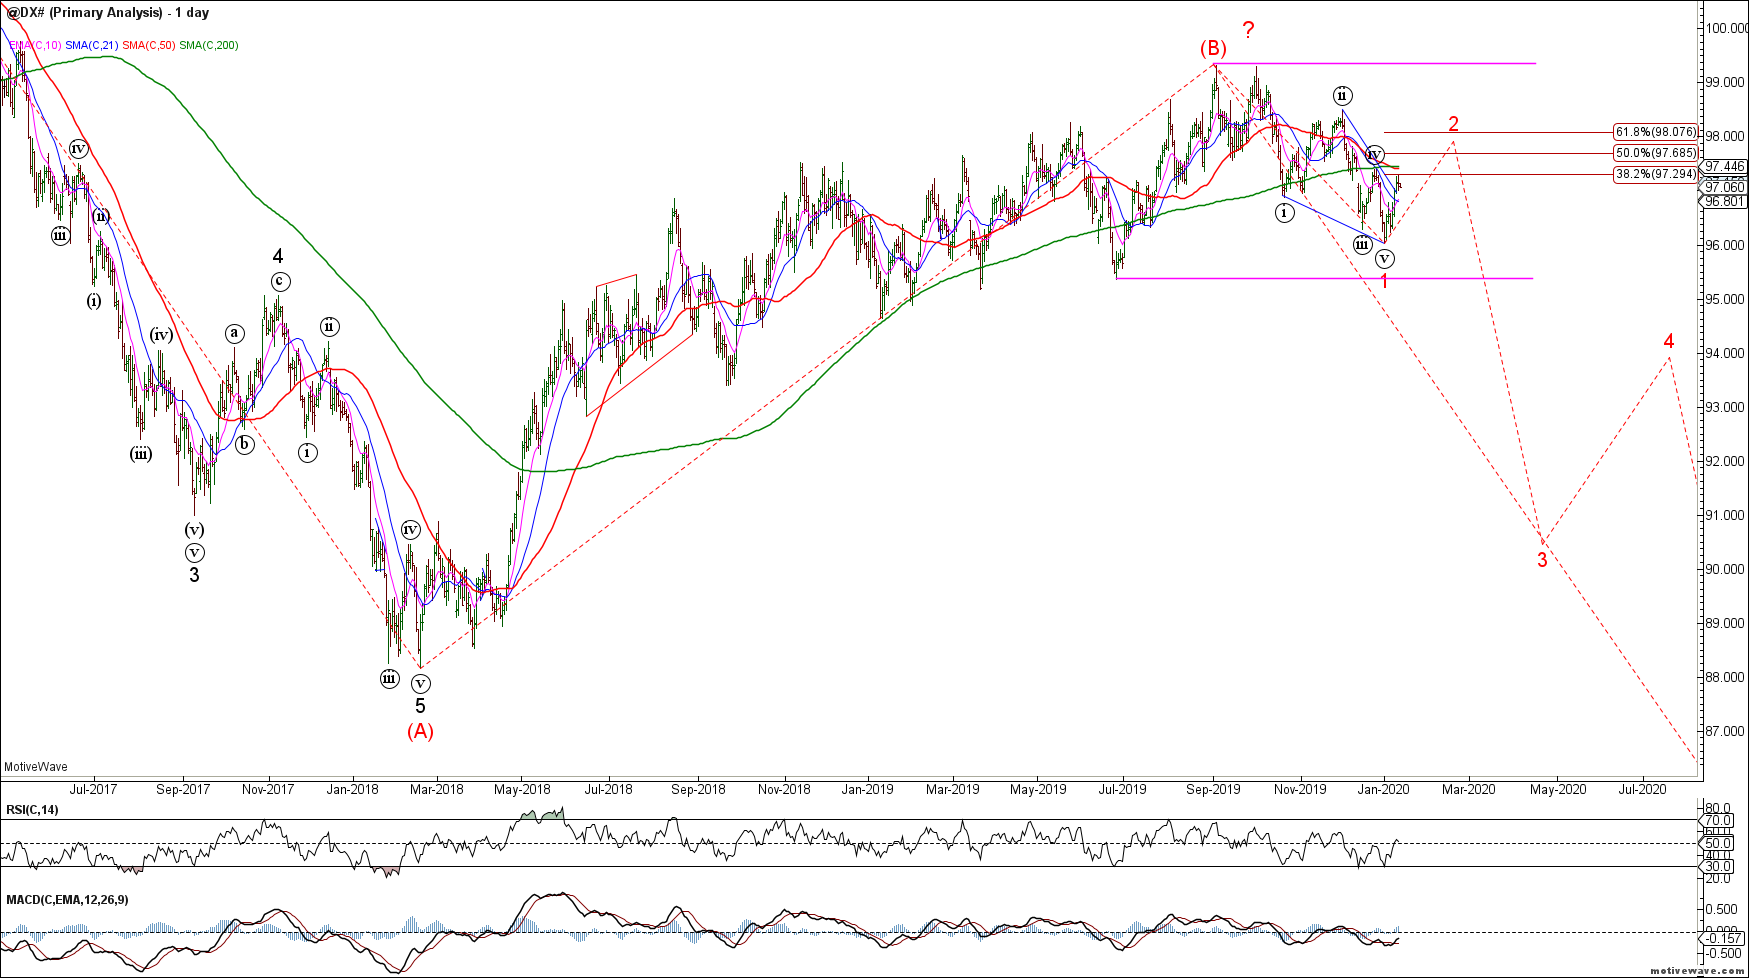
Traders are exiting both longs and shorts in the short end. Trading volumes have collapsed.
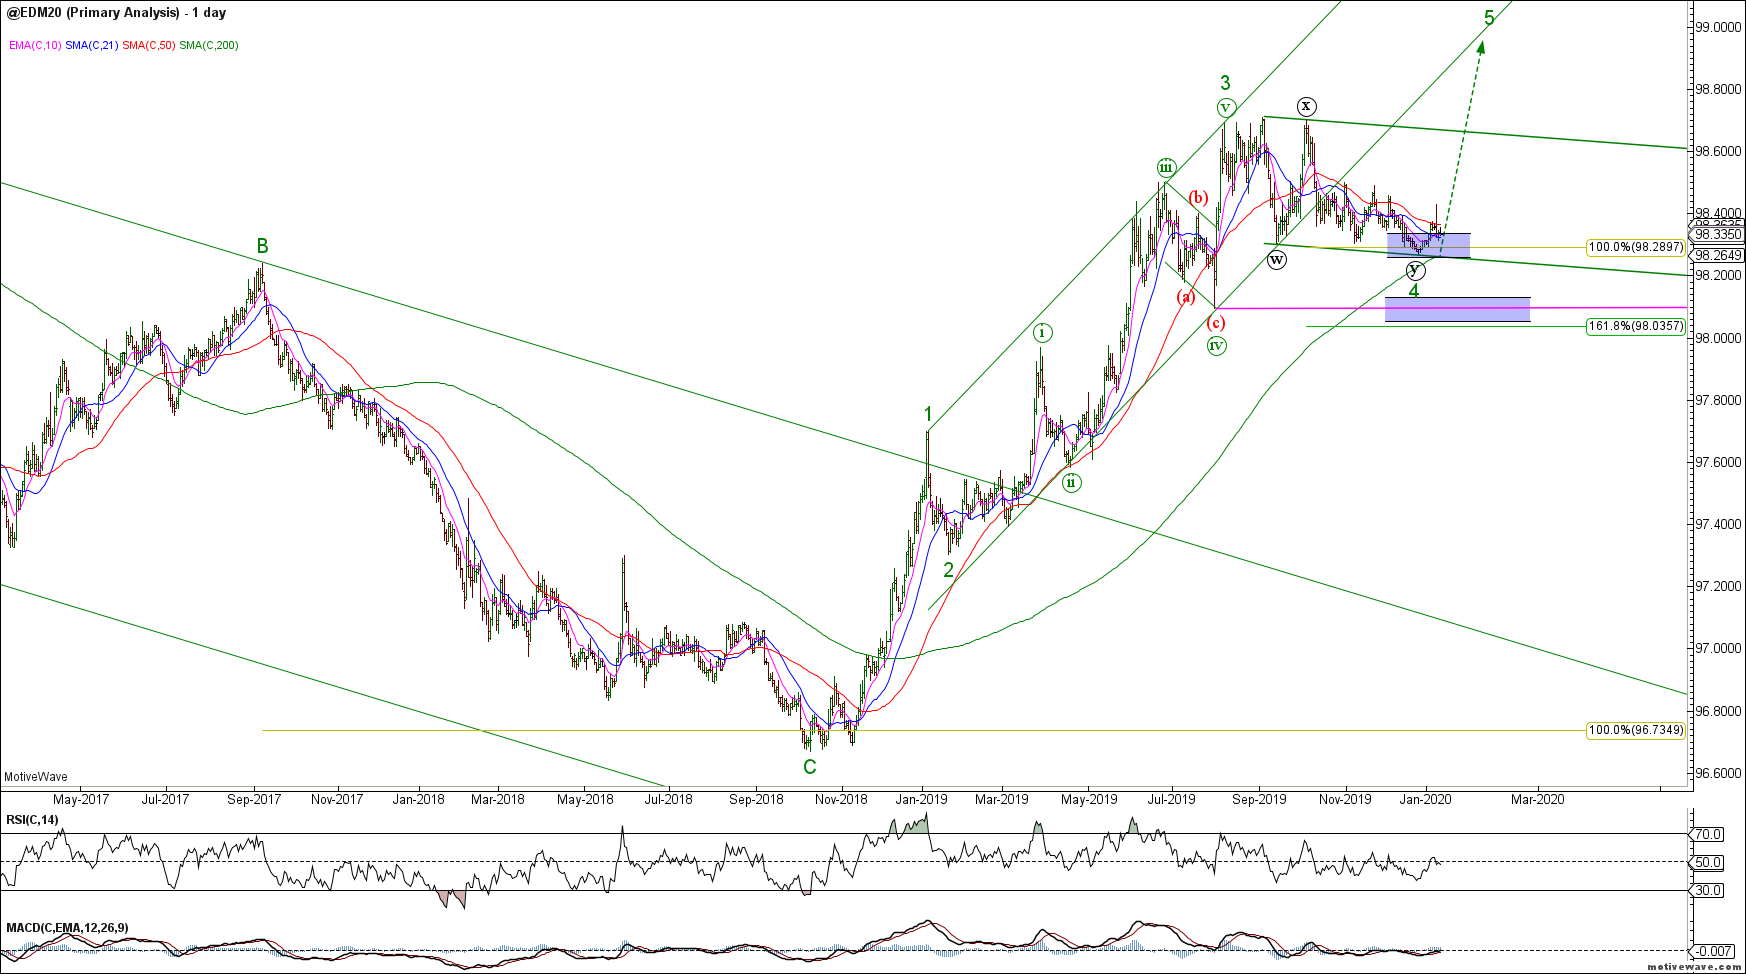
The Eurodollar continues to look bullish as it holds our initial support zone. The EDM20 would look best with a strong wave 5 rally to new cycle highs which would likely signal further economic weakness or risk-off.
EDM20 Daily
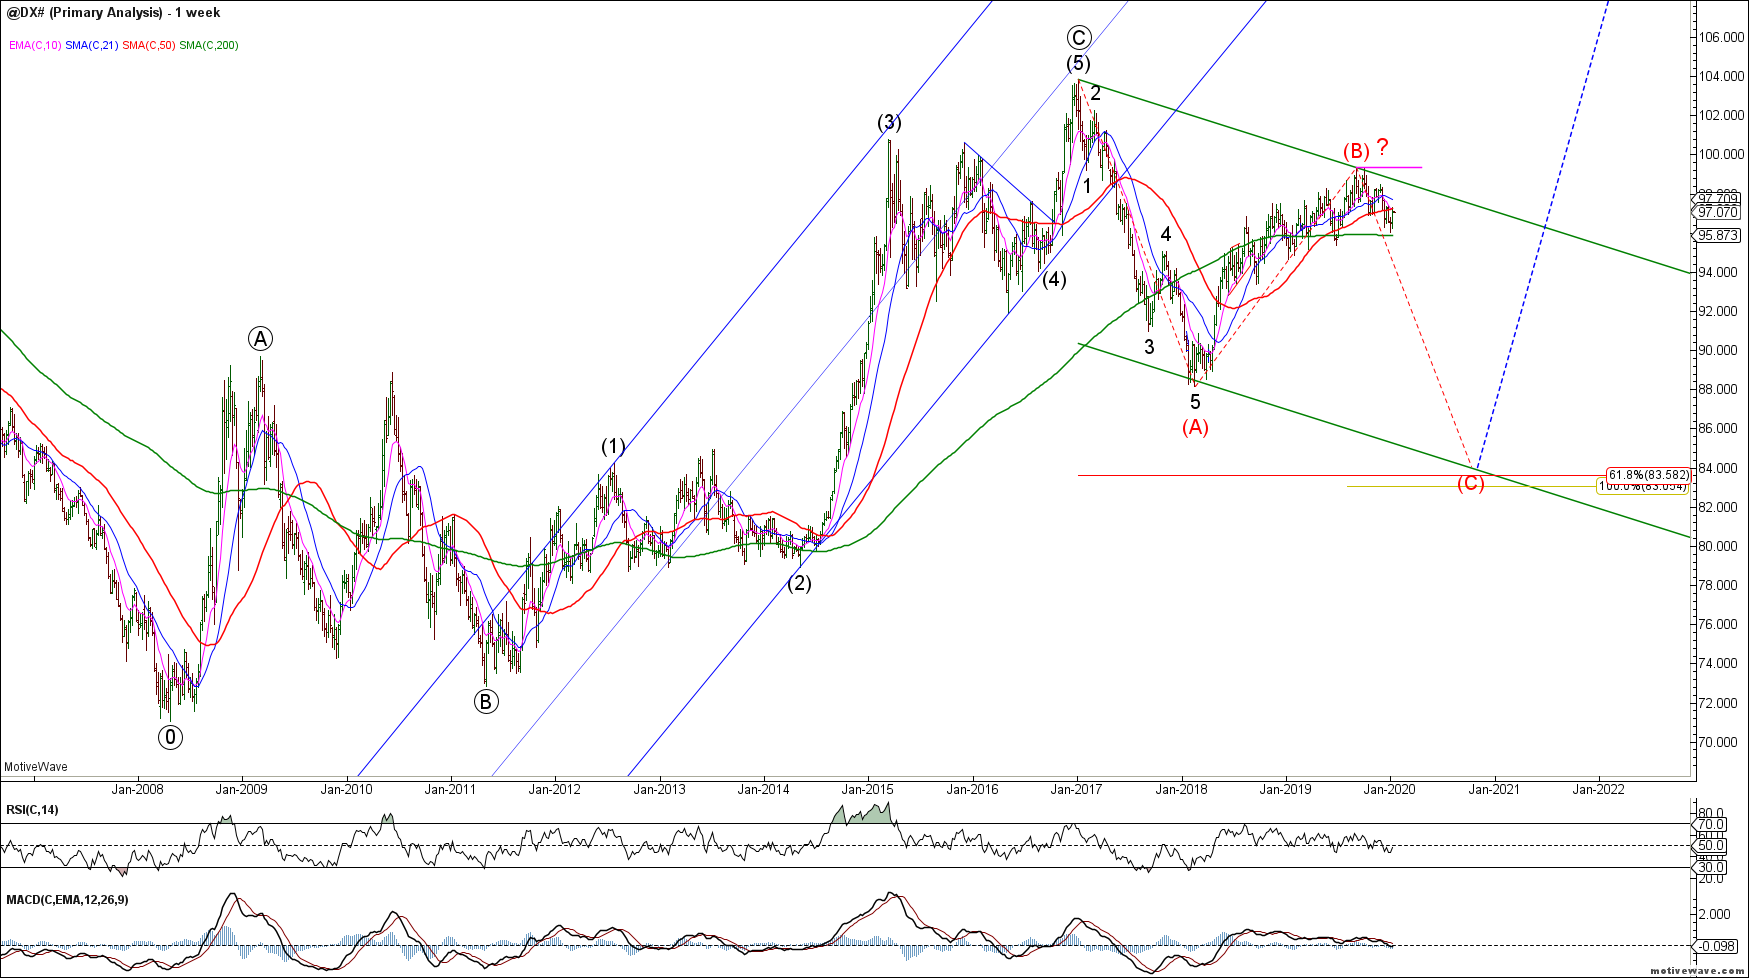
To the FX markets and we have been looking for a bearish turn in the US dollar. We still do not have confirmation of a bearish trend change. Most major currencies remain range bound in this low volatility asset environment. We will remain bearish while recent swing highs hold but at this point, the structure is very low conviction.
DXY Weekly
The DXY does show a potential leading diagonal for wave 1 but it is not high probability. This near term bearish potential is invalidated at new cycle highs. Bears need to break the series of higher highs and lows since early 2018. This market remains range bound until proven otherwise.
DXY Daily
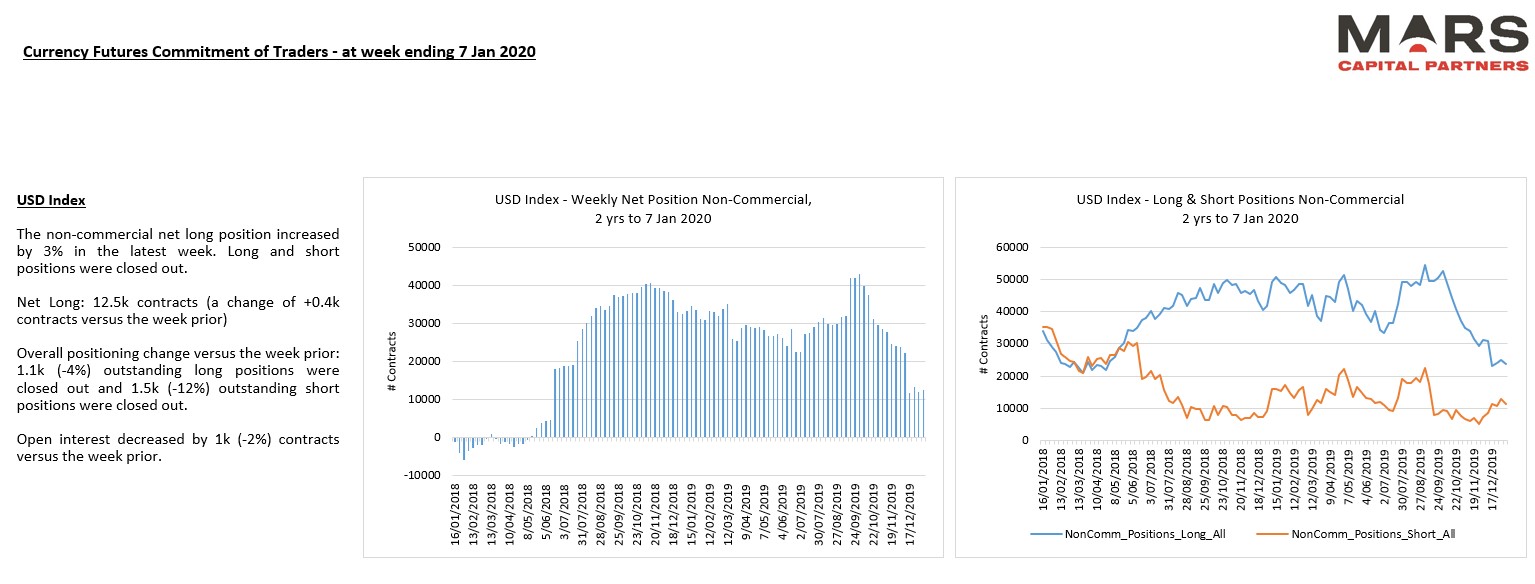
Concerning for the US$ bears is that DXY longs have halved but price has barely moved in the last 12 months.
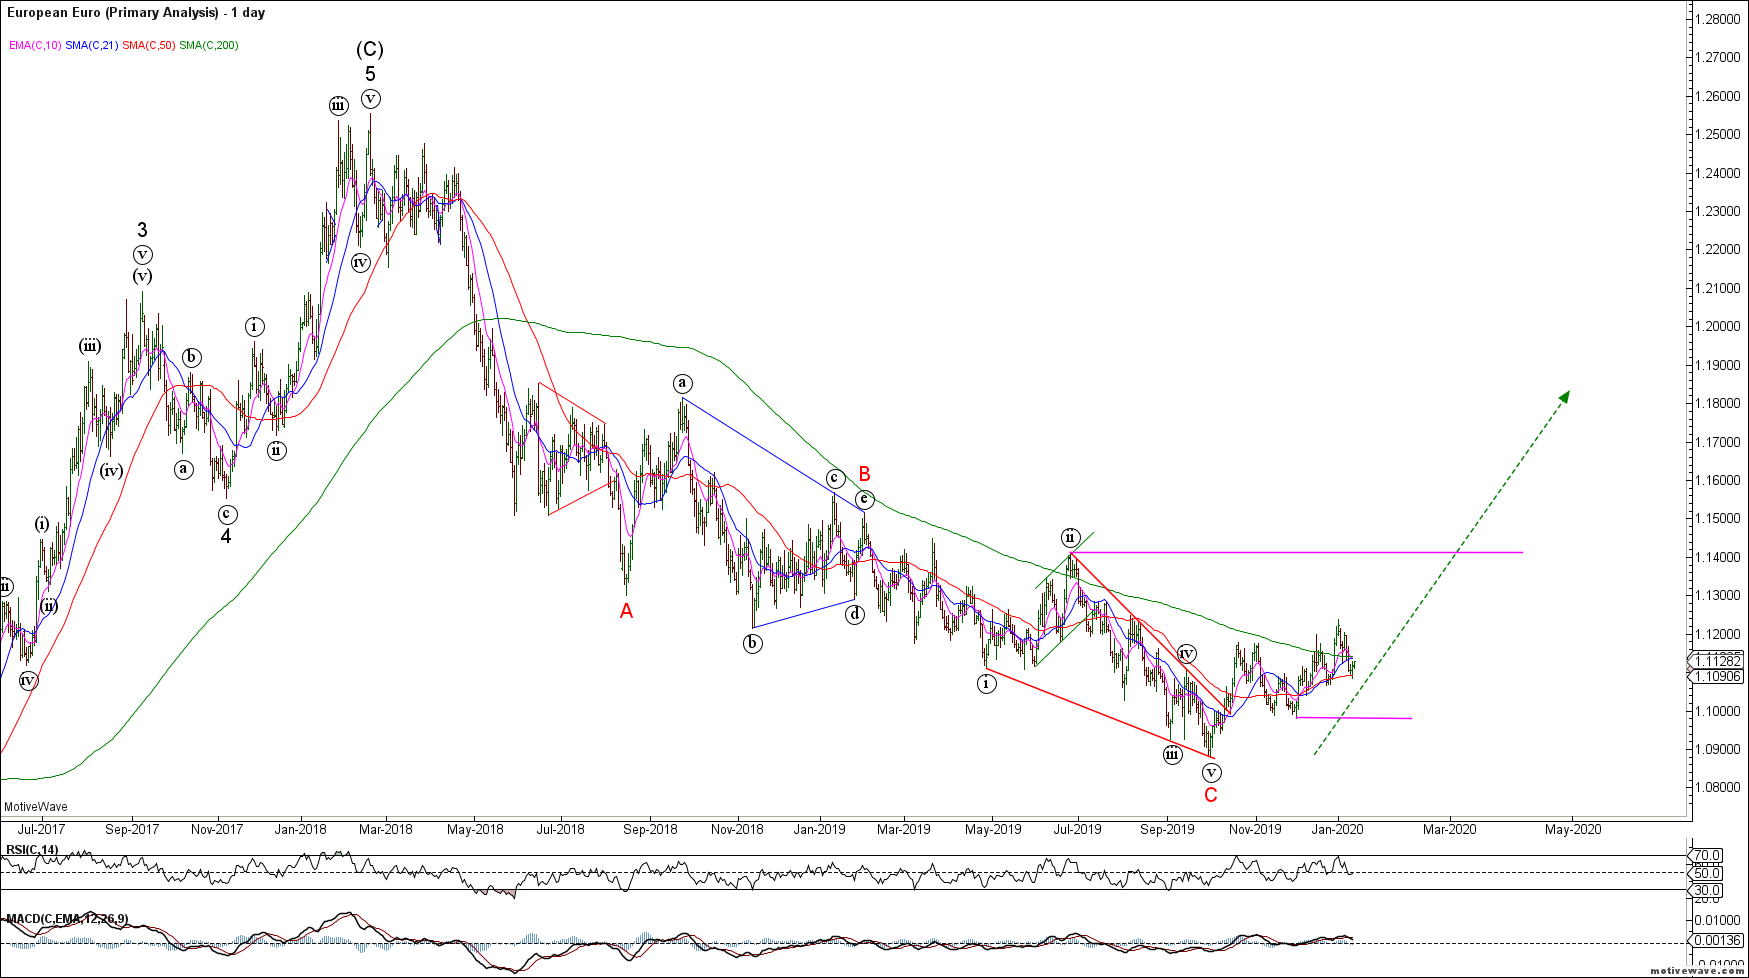
The Euro has been attempting to establish a base to rally from but the initial rally does not look convincing. The Euro bulls have not yet proven anything except hold the lows. We remain tentatively bullish but there is a high risk of failure.
EURUSD Daily
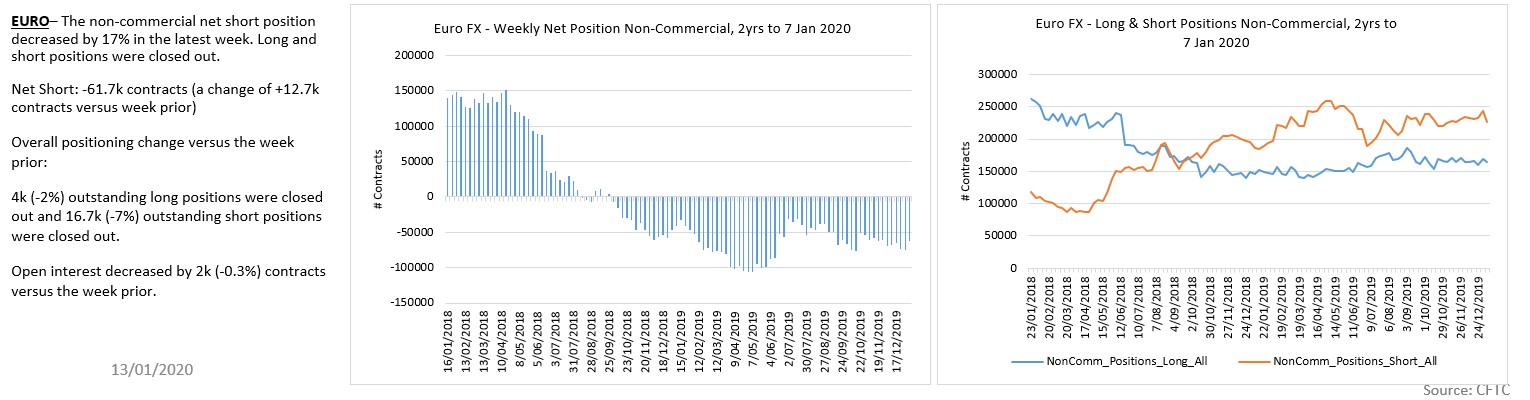
Euro traders remain net short.
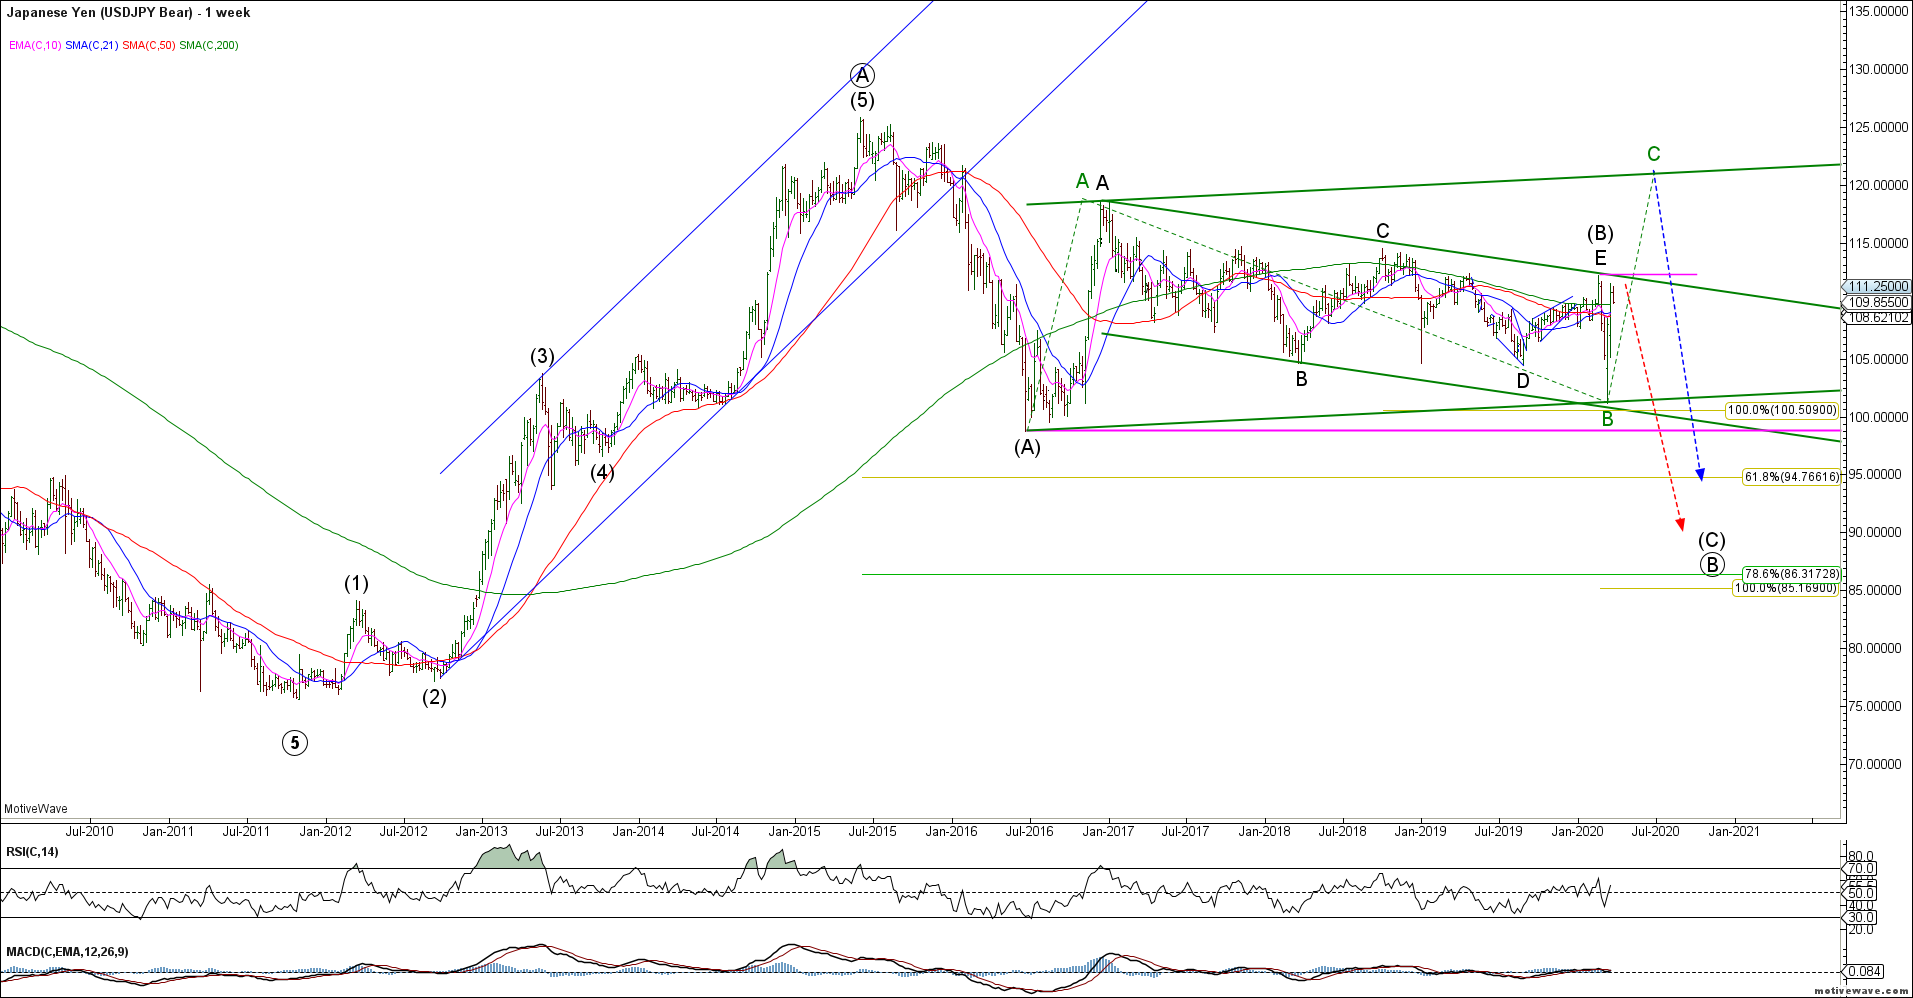
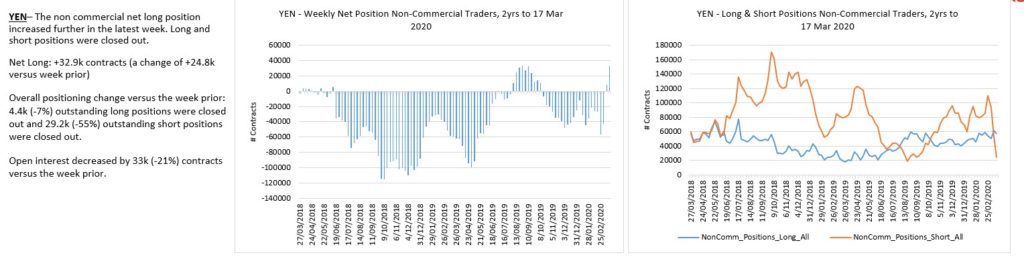
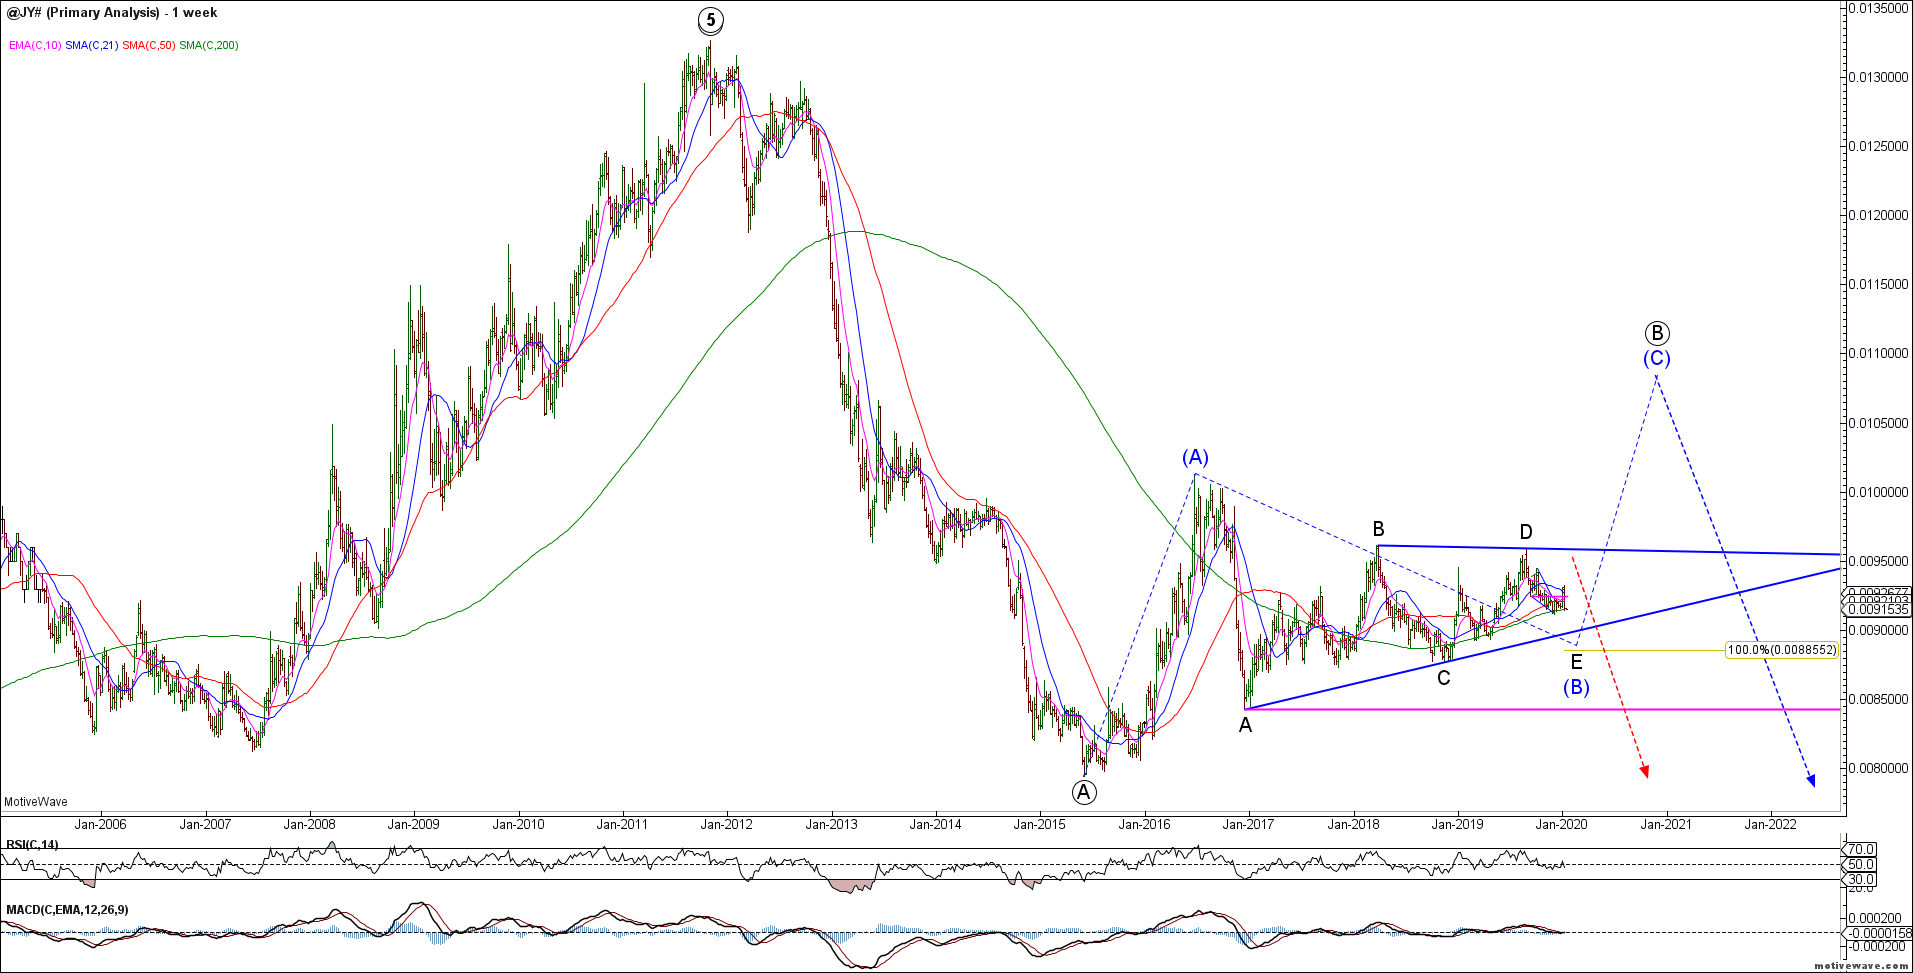
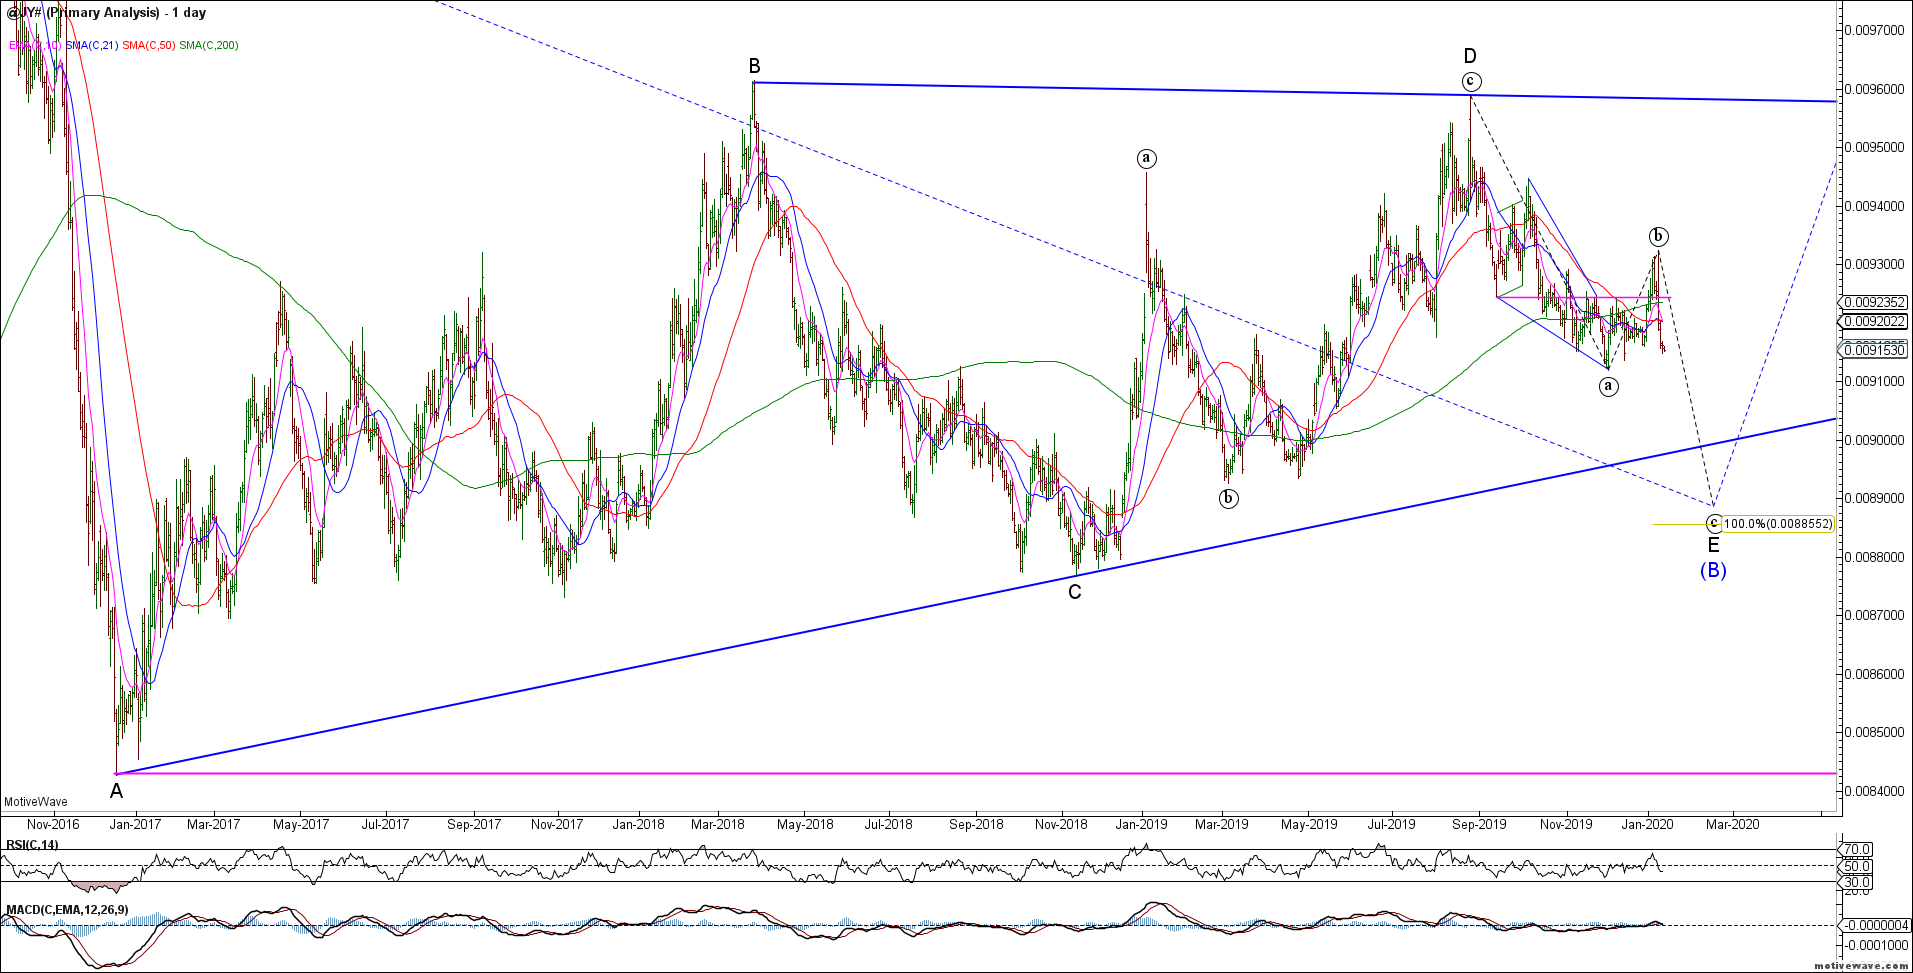
The Yen continues to trade within its bigger picture triangle. Near term, given last week’s bearish reversal, we should expect a retest of the lower trend line with potential towards Fib equality in the 0.8850 area.
Yen WeeklyYen Daily
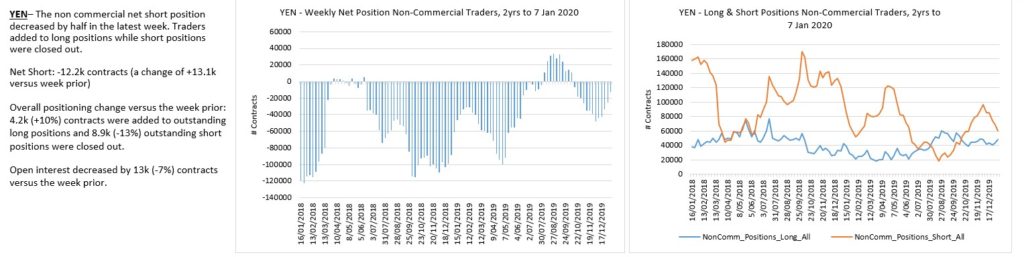
Yen traders are flat.
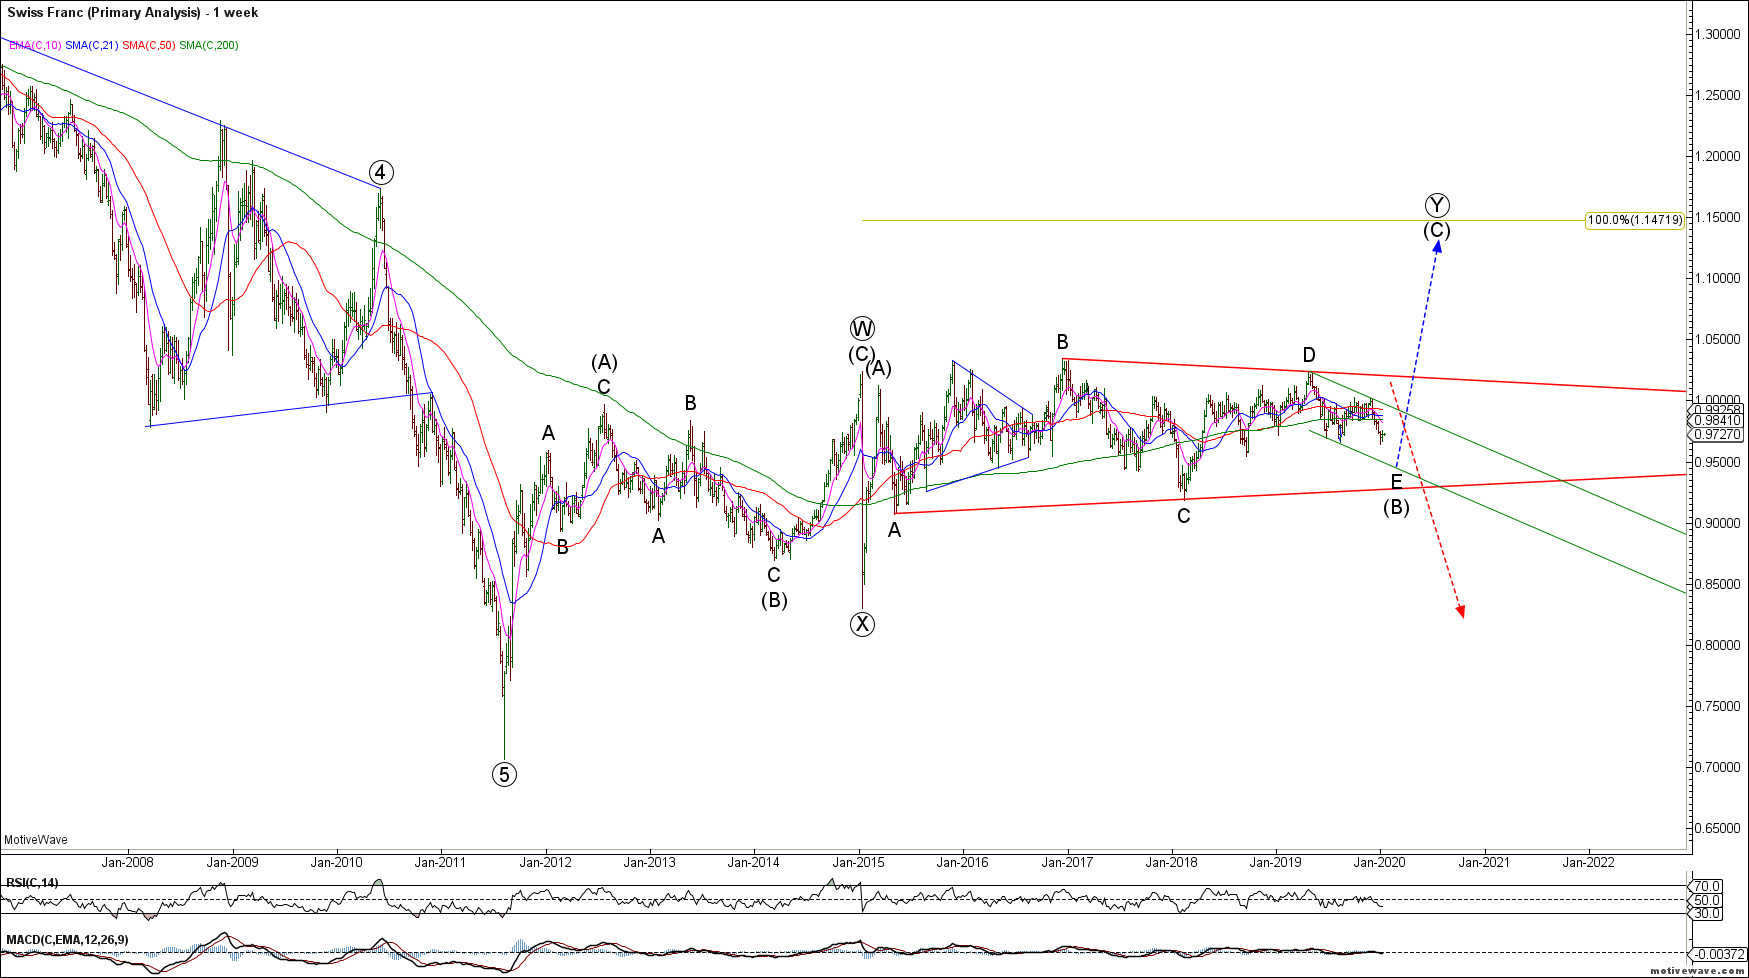
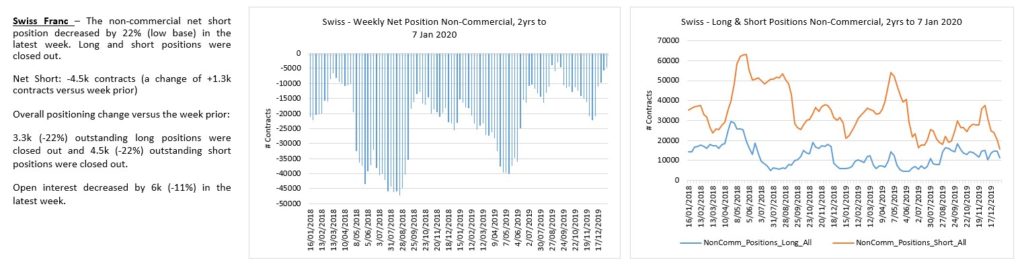
The Swiss Franc remains range bound and controlled by the SNB. Compression usually results in volatility expansion and we should expect the Swissie to do the same. Tough to fight the SNB until we get a convincing trade setup with controllable risk. Option sellers have been rewarded for the last few years but I’d rather take the other side looking for a break when the opportunity presents.
USDCHF Weekly
CHF shorts have capitulated.
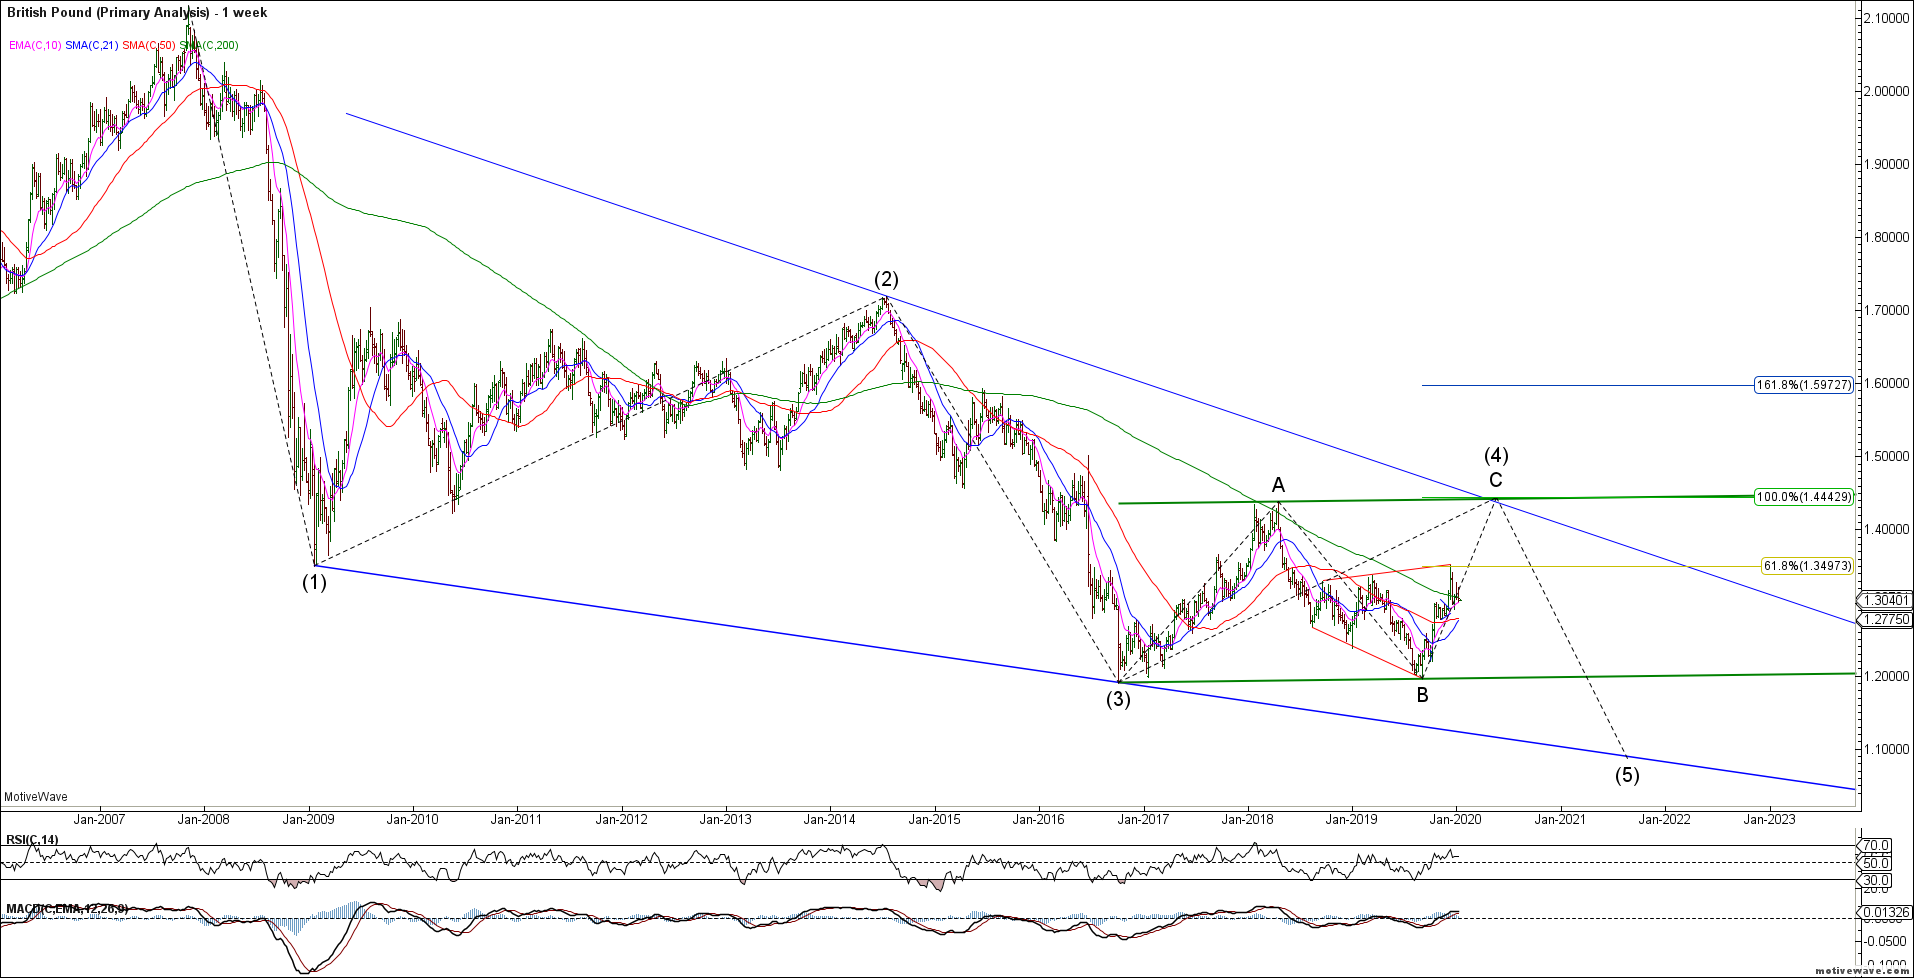
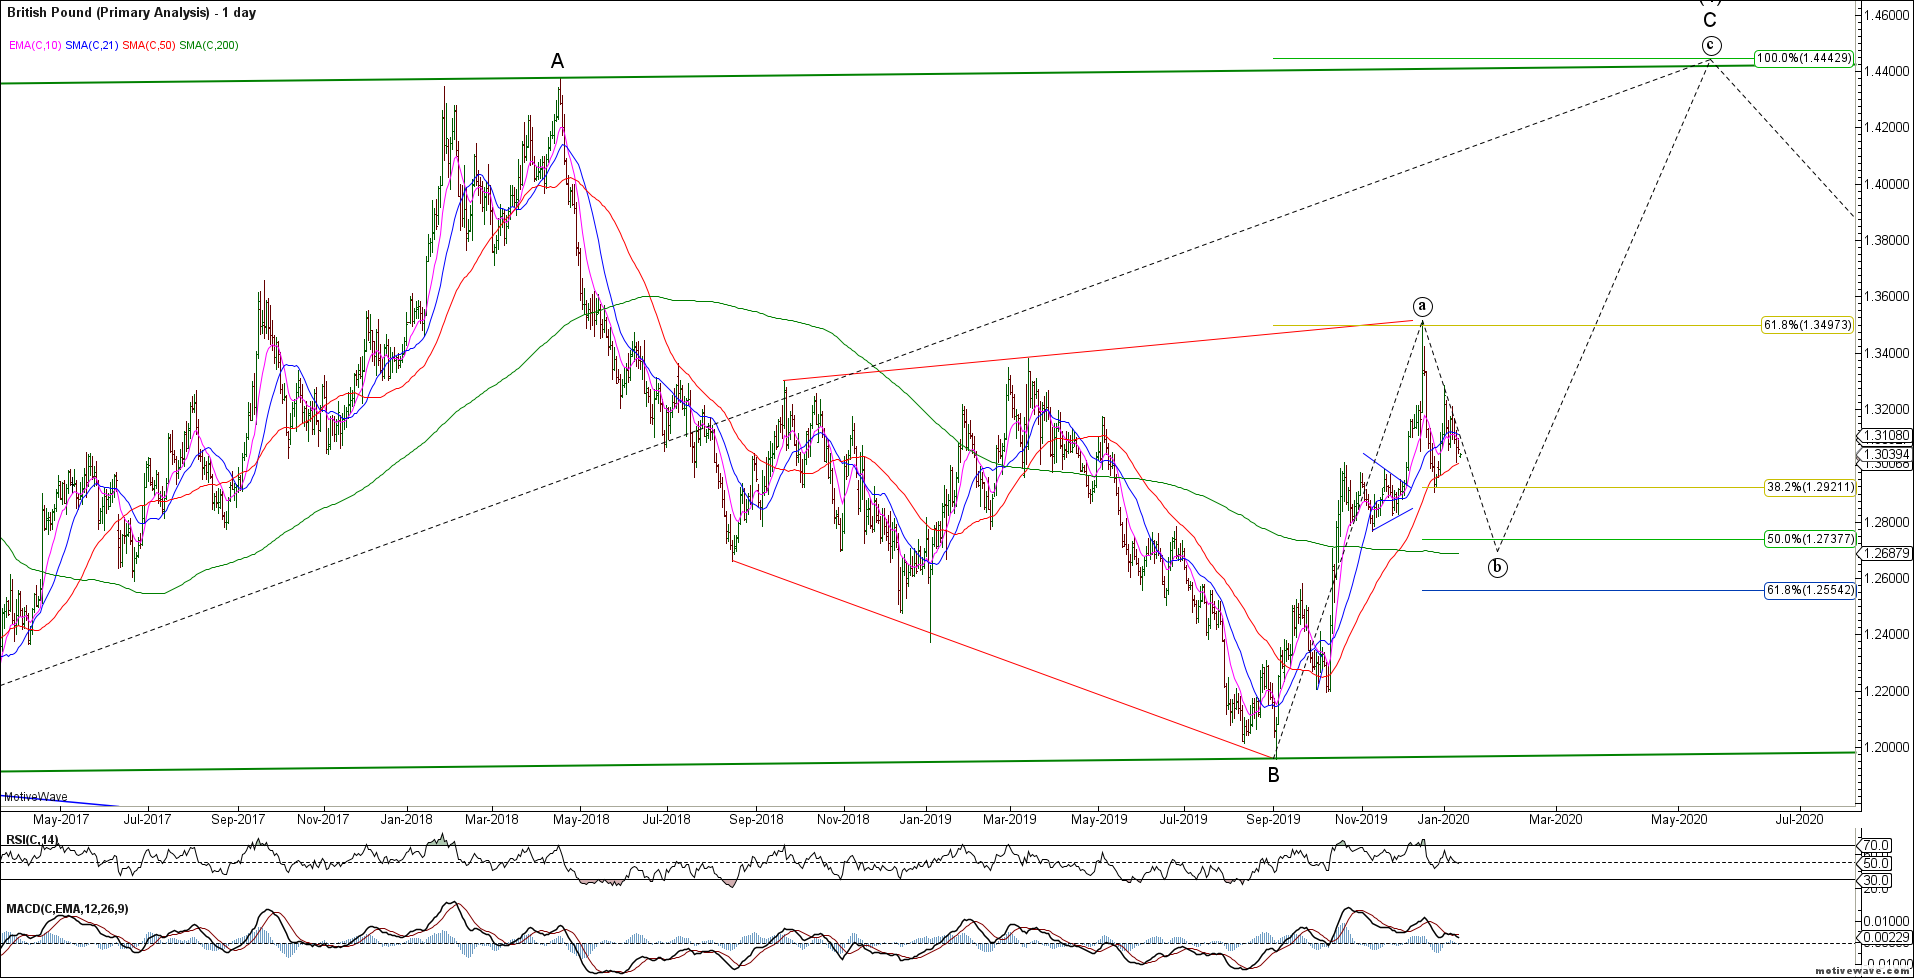
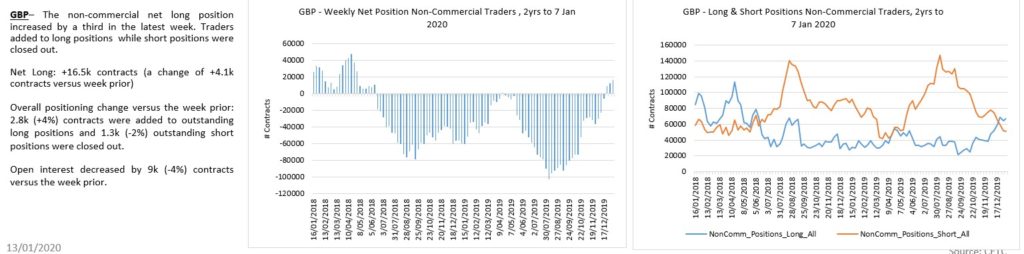
Despite Brexit and leadership challenges, the Pound continues to hold post Brexi lows. The recent impulsive rally off the lows argues for higher prices towards 1.45 once the near term correction is complete and it can clear 1.35 resistance.
GBPUSD WeeklyGBPUSD Daily
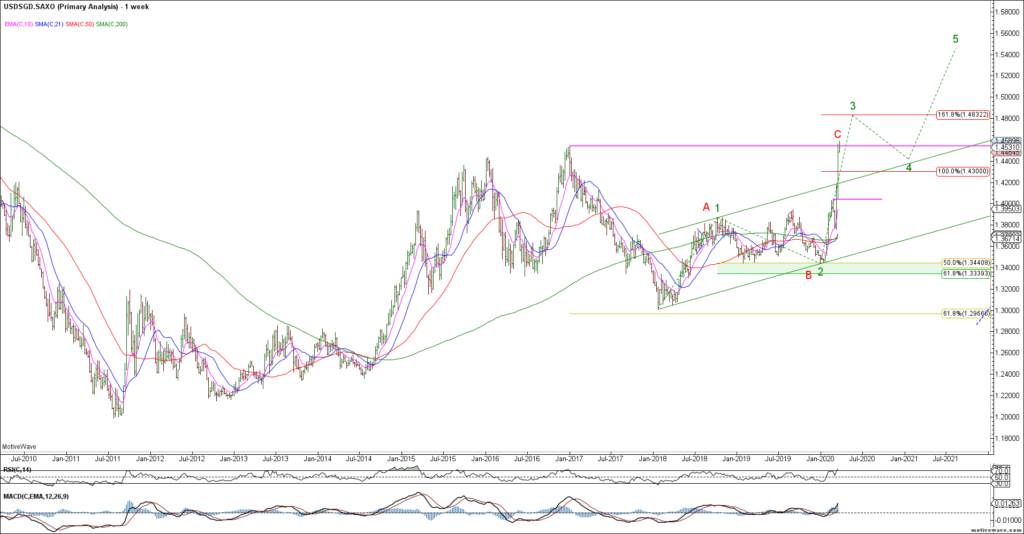
The USDSGD is approaching a near term inflection point. Our base case (blue count) implies a corrective decline is ending (expanded flat wave b) as we look for a bullish reversal. The alternate red bear count suggests a continued US$ decline back towards 1.24-1.25 long term support. The impulsive rally from the 2011 lows keeps us bullish from a big picture perspective.
USDSGD Weekly
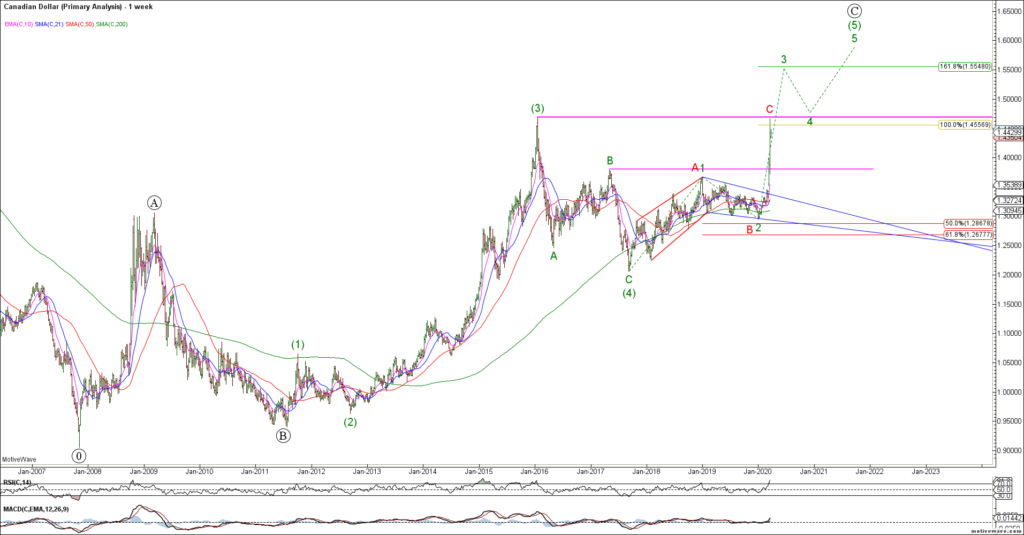
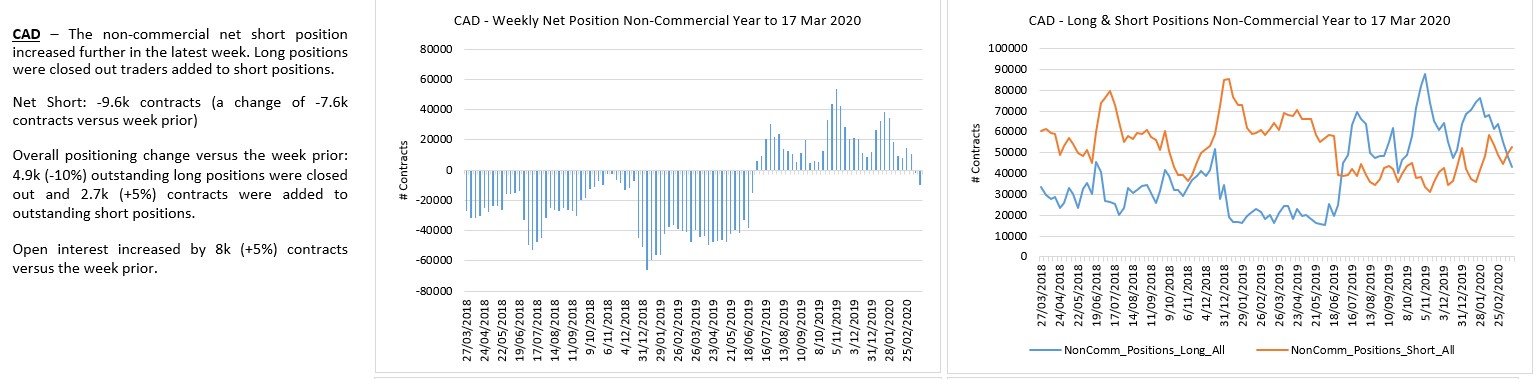
The USDCAD invalidated our near term bull case but the bigger picture remains bullish for the US$. Bulls need to clear 1.3800 major resistance for an extended rally. Strong support resides in the 1.2670-1.2870 area.
USDCAD Monthly
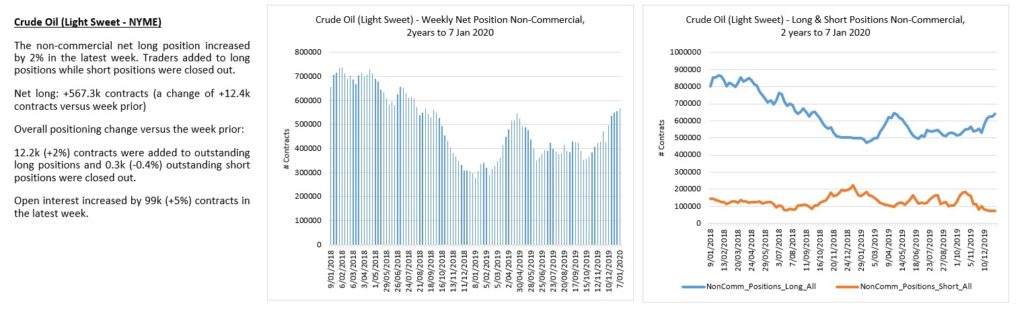
To the commodity markets and Crude Oil reversed sharply lower from resistance forming a weekly bearish engulfing reversal. We are bearish CL from a bigger picture perspective while last week’s highs hold.
CL Weekly
CL appears to be in a wave B triangle before the next strong thrust lower. Looking to short a counter trend rally that does NOT exceed last week’s highs.
CL Daily
CL traders were pressing longs into that bearish reversal. Likely caught long.
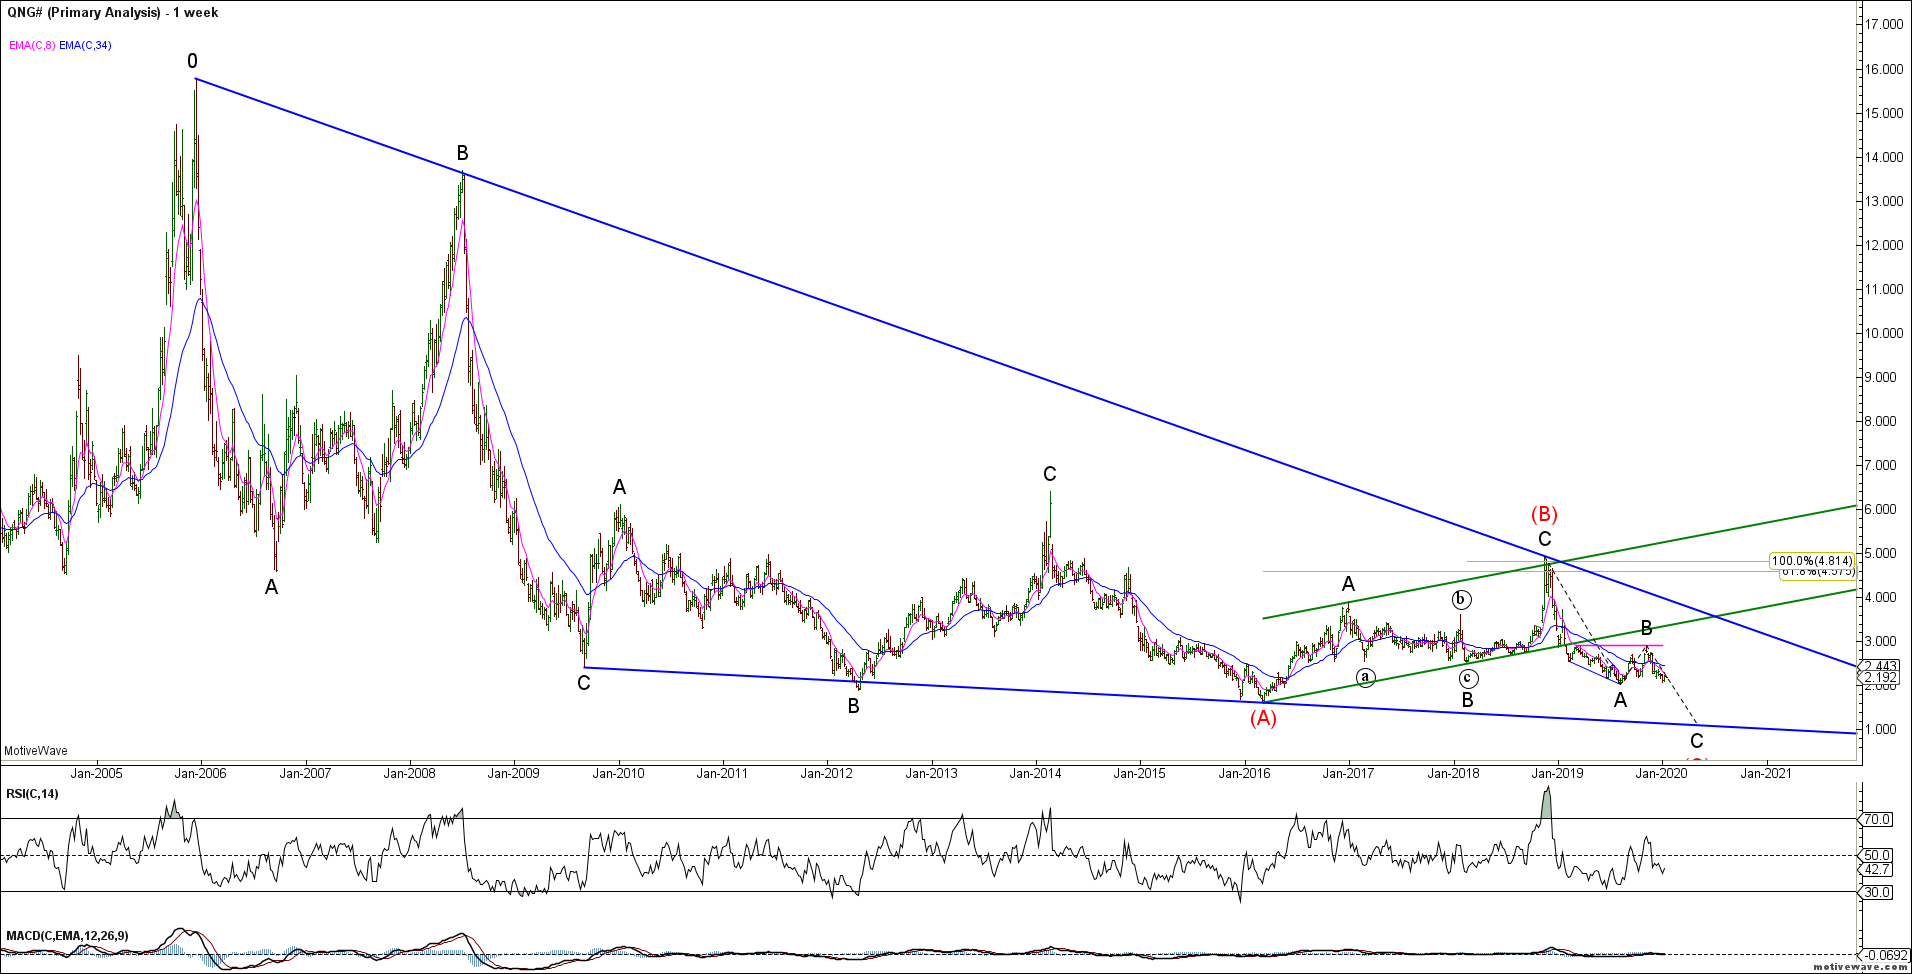
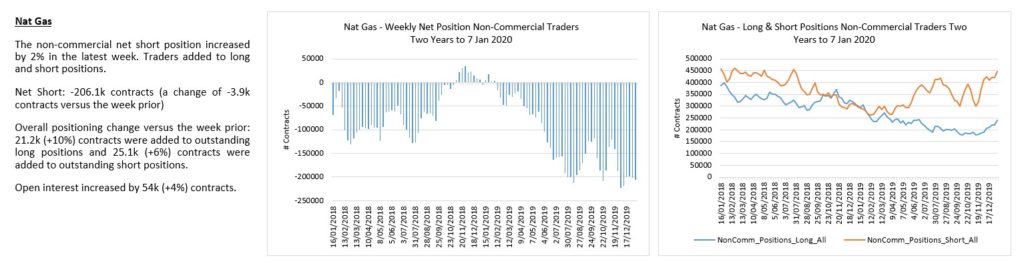
Natty Gas continues to drift lower with long term targets towards 1.00 given the corrective rally from the 2016 lows.
NG Weekly
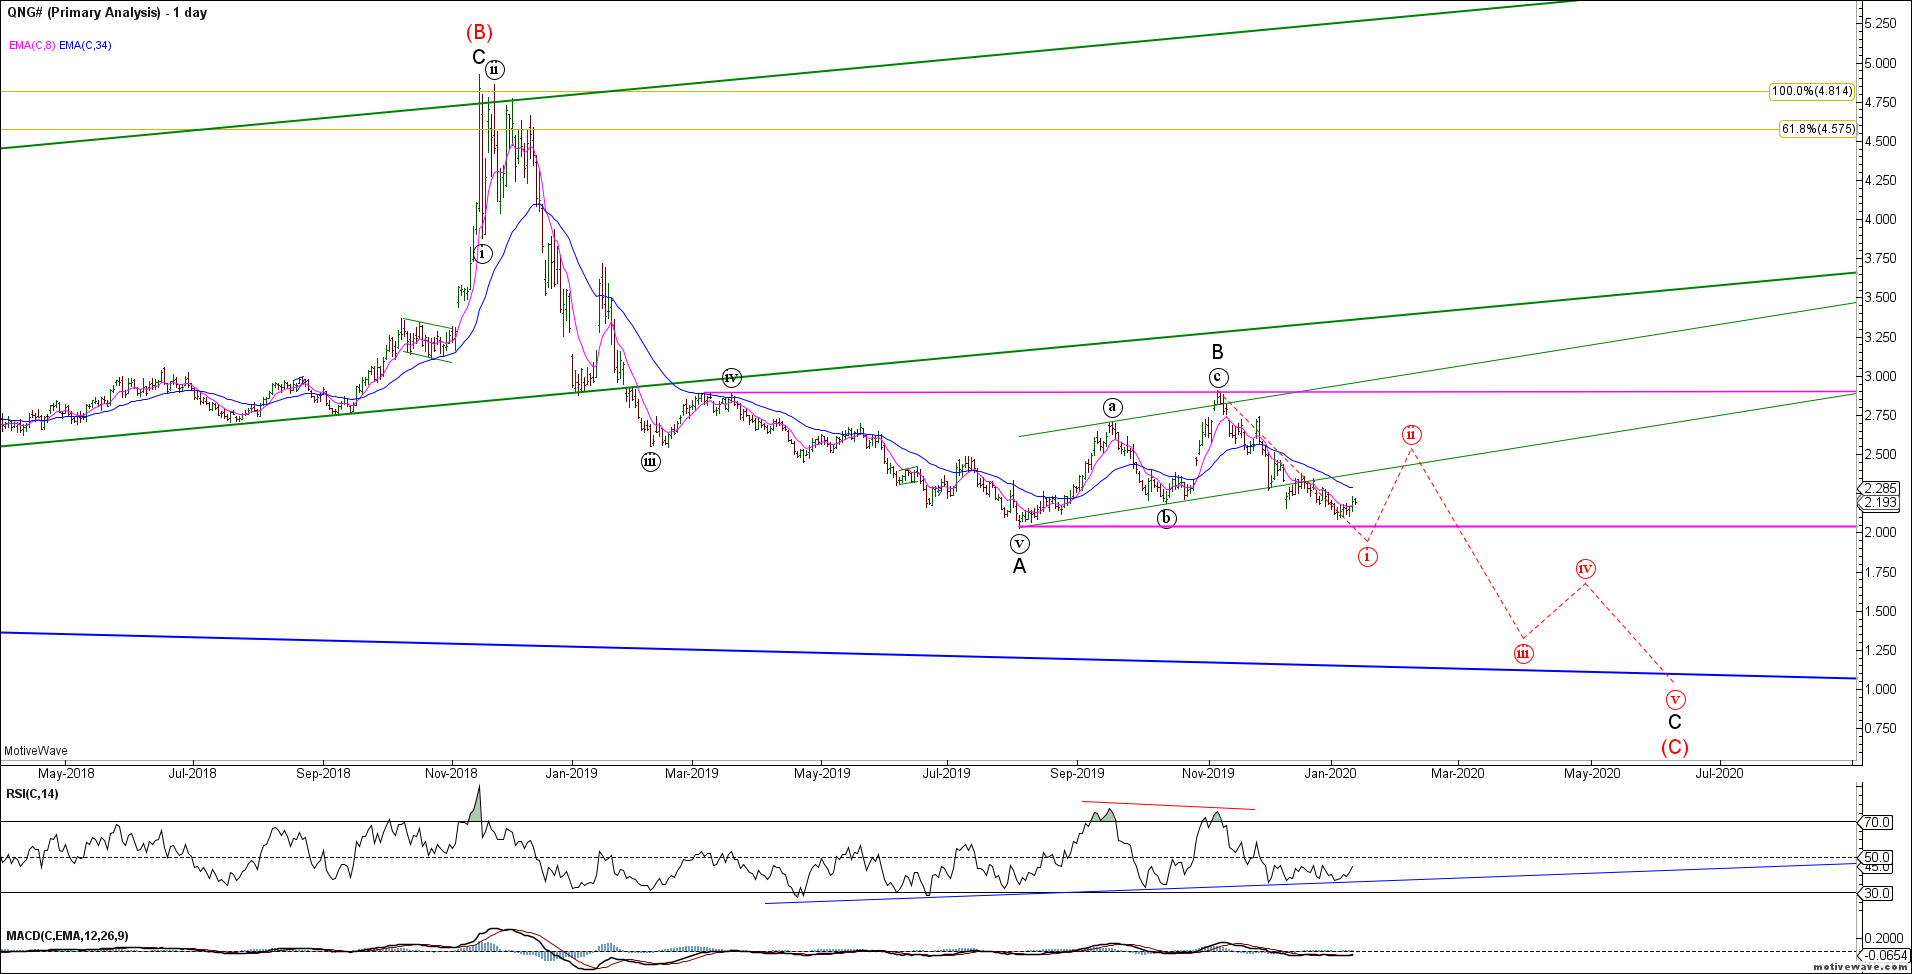
Near term, the decline from the wave (c) of B highs appears impulsive to retest cycle lows. Note the bullish momentum divergence at recent lows that indicates a tradable low may be near. Ideally, I’d like to see a false break of 2.00 support and bullish reversal for a trade. No strong evidence of a tradable low. Highly speculative.
NG Daily
NG shorts are a very crowded trade. Avoid.
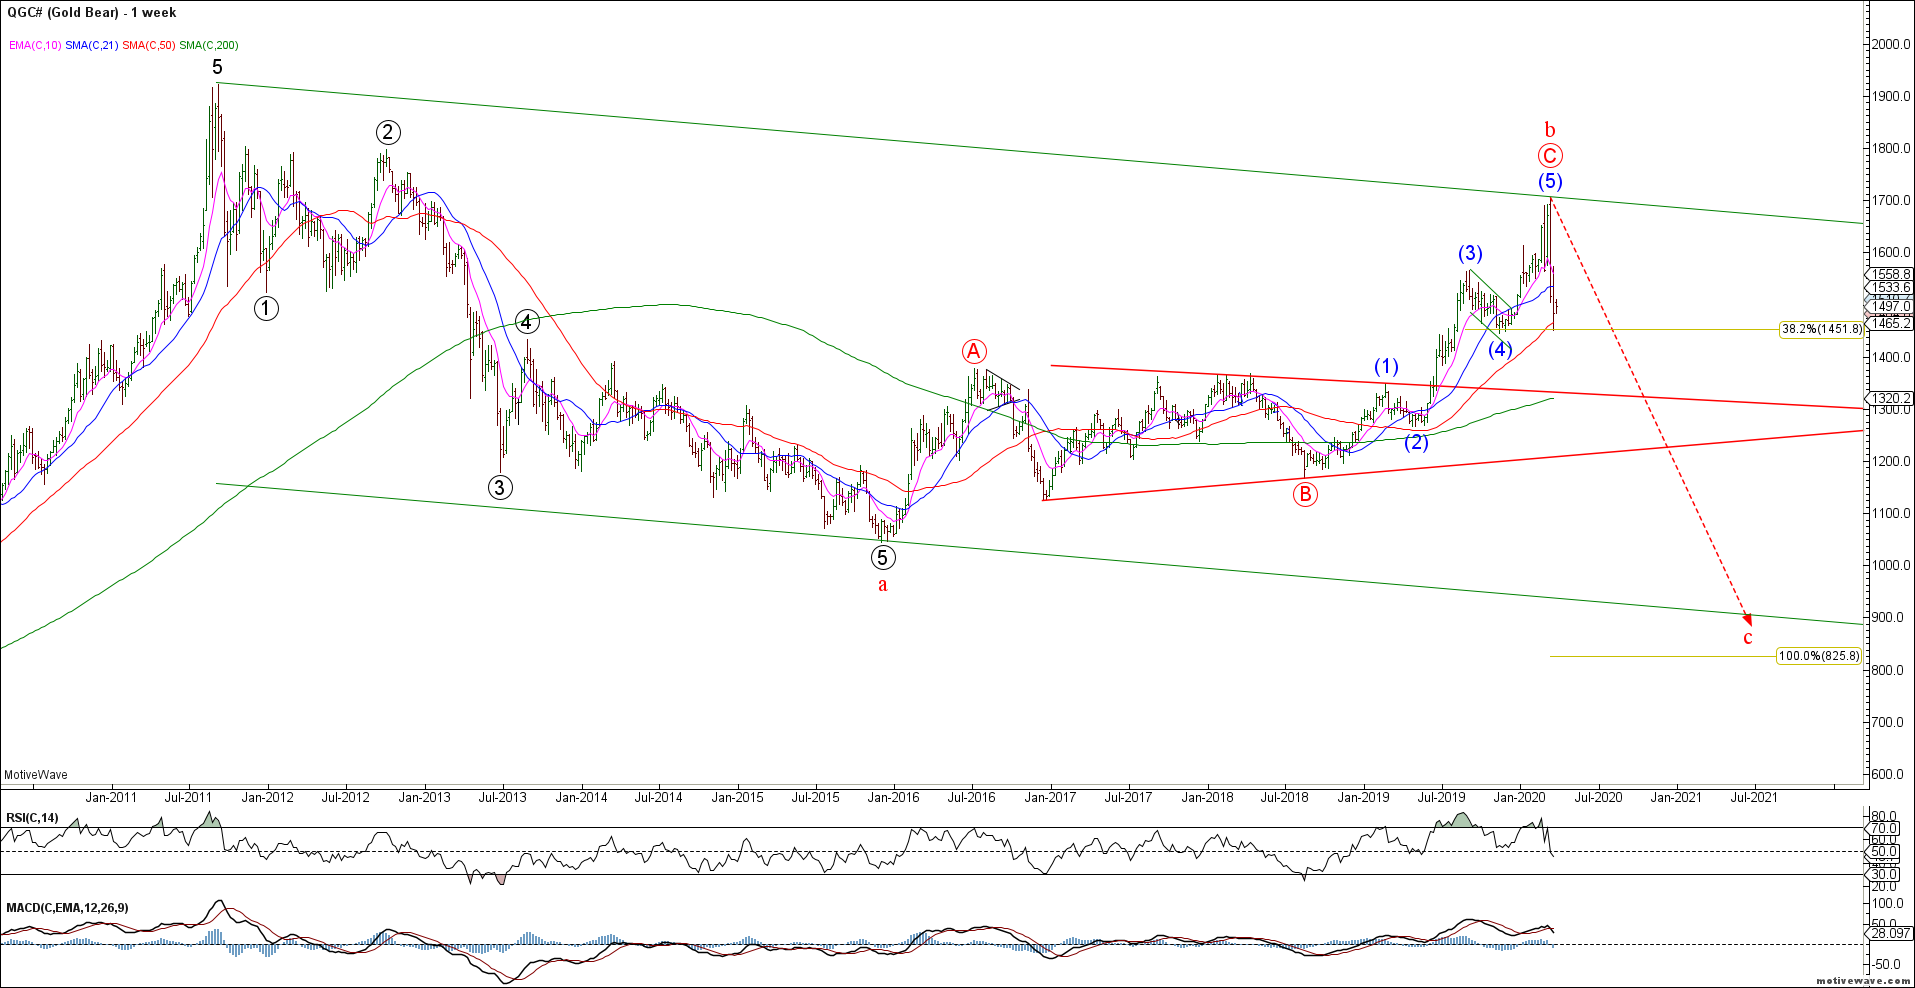
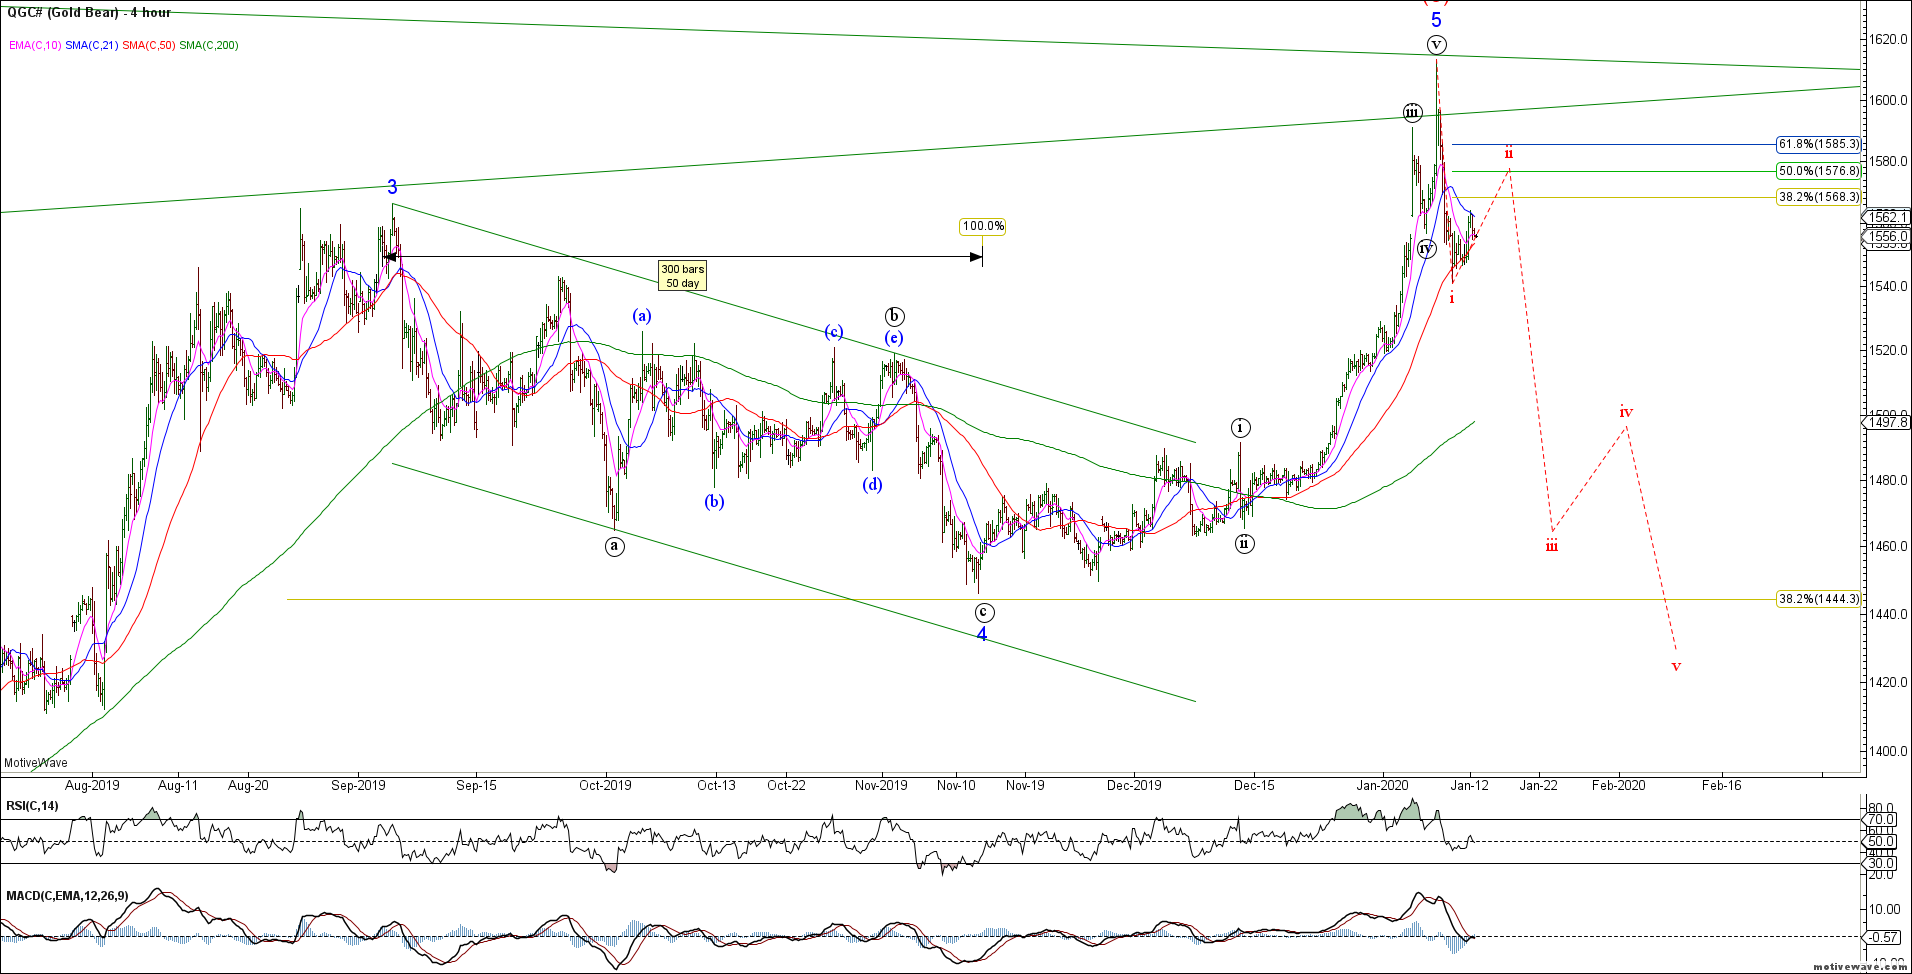
To the PM’s and Gold met minimum upside objectives for wave 5 of C before reversing sharply lower. The initial decline appears impulsive so we should expect further downside near term. The Bear count shows a completed 3 wave rally from the 2015 lows and the potential for a large wave C decline.
Gold Bear WeeklyGold Bear H4
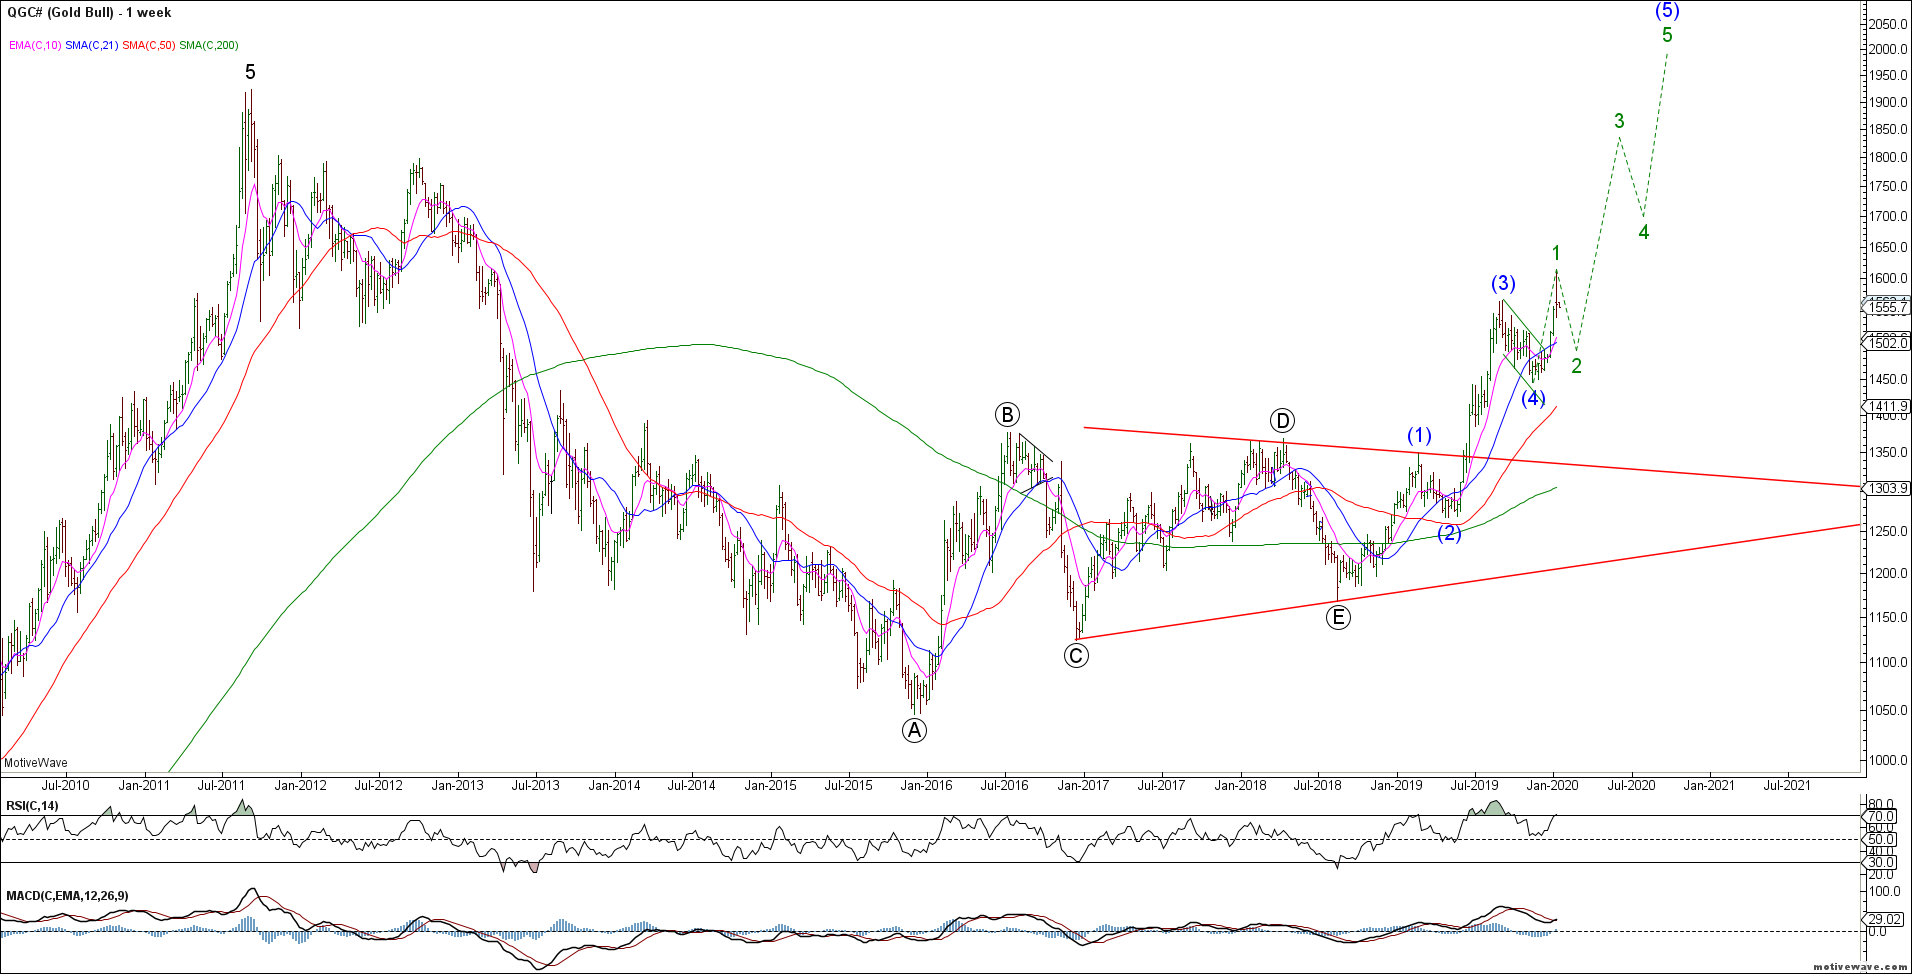
Remember, for the bear case to take hold we need to see an impulsive decline from the recent highs as shown above. The bullish alternative is that last week’s rally was only wave 1 of an extended wave (5). This would align with Silver’s bullish potential and see a retest of the 2011 highs..
Gold Bull Weekly
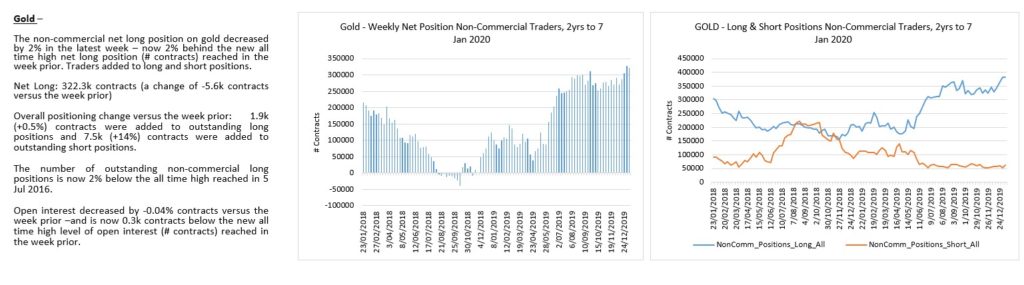
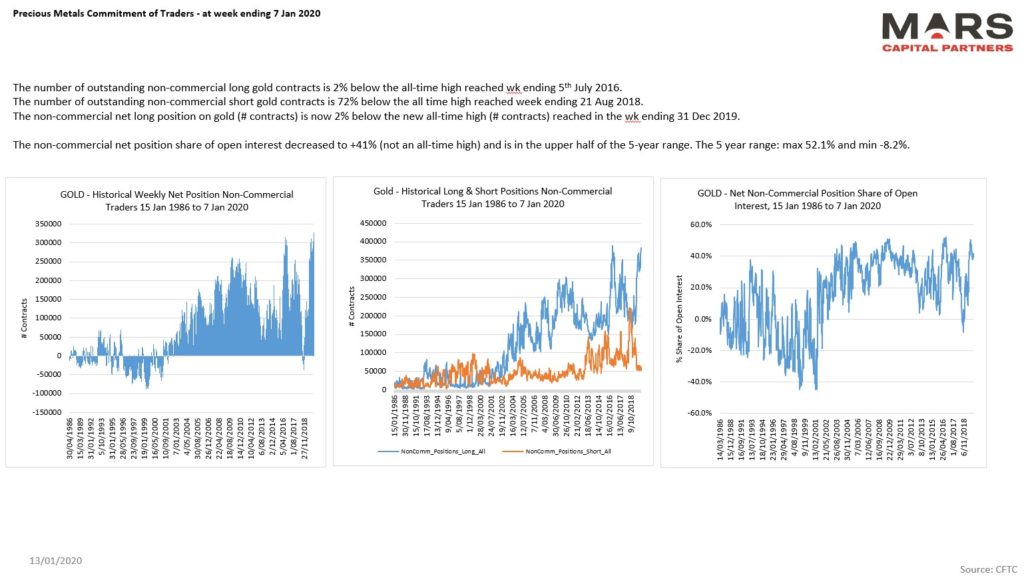
Traders extreme long positioning in Gold favors the bear case.
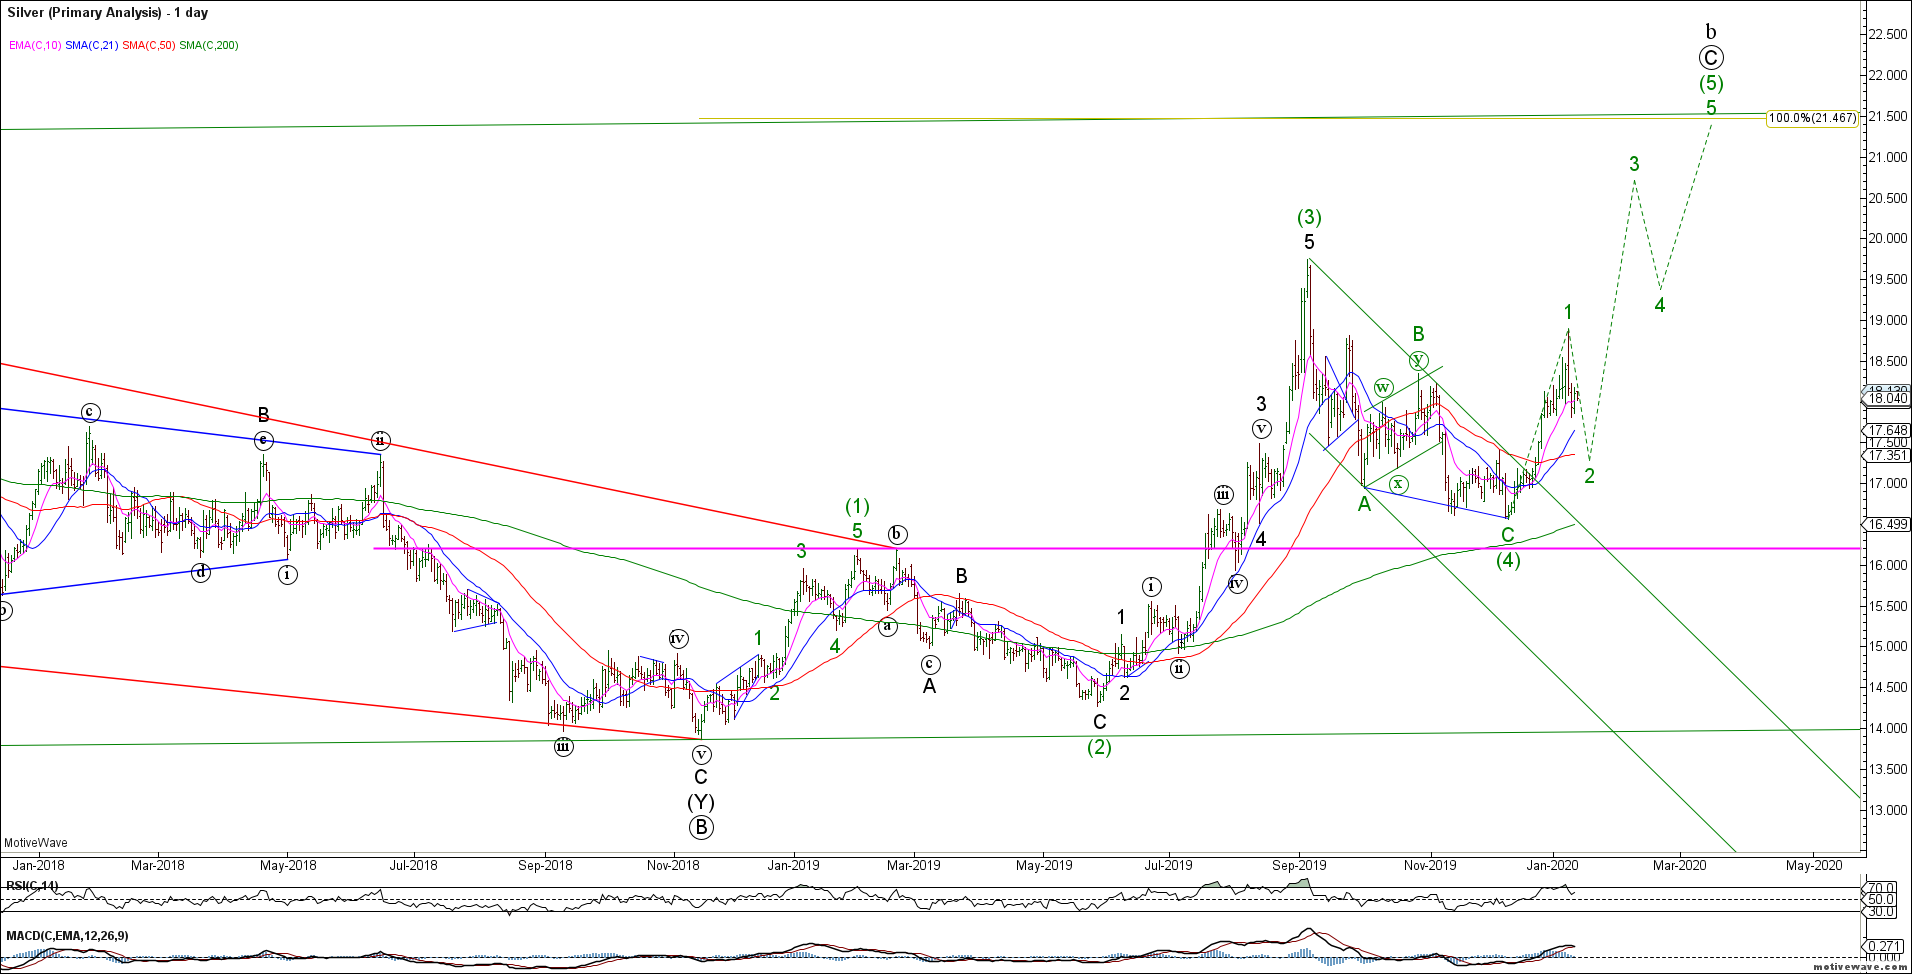
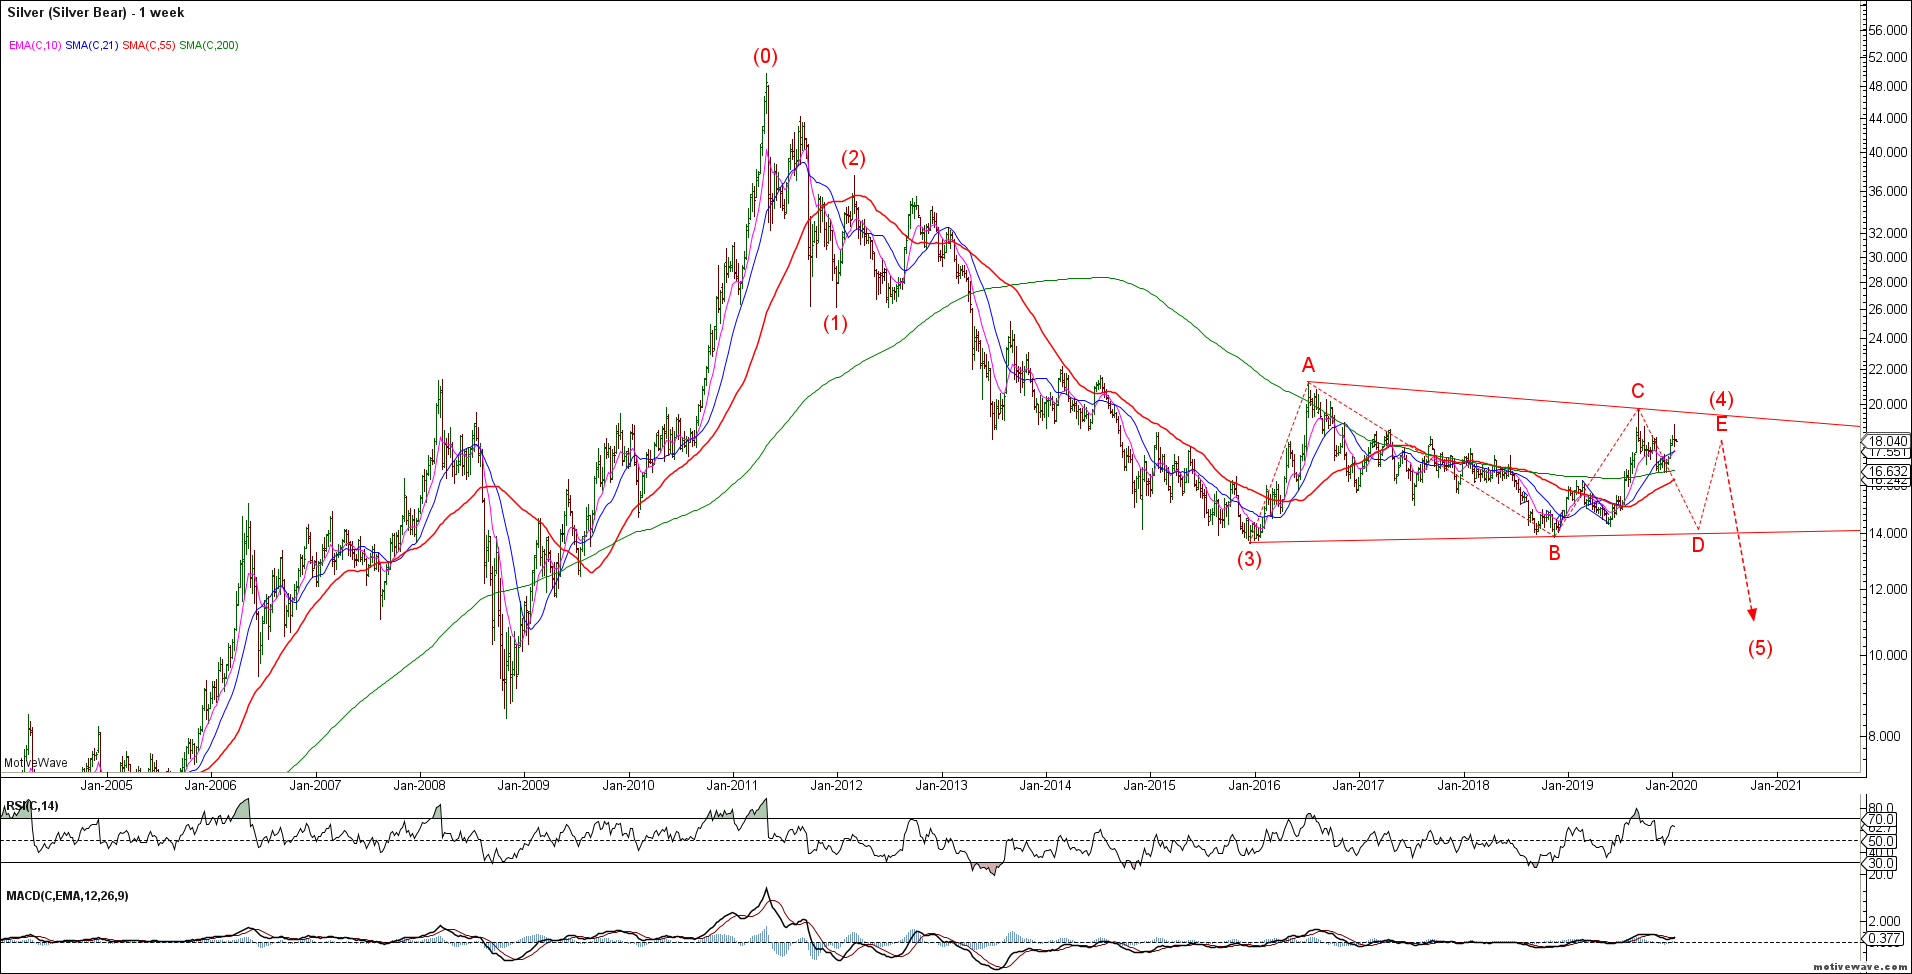
Silver rallied impulsively from recent swing lows but did NOT confirm Gold’s push to new cycle highs. This either means that the rally was a bullish wave 1 of (5) with strong support at the 50 day sma (green bull case) OR Silver remains trapped within a wave 4 triangle (red bear case).
Silver Bull DailySilver Bear Weekly
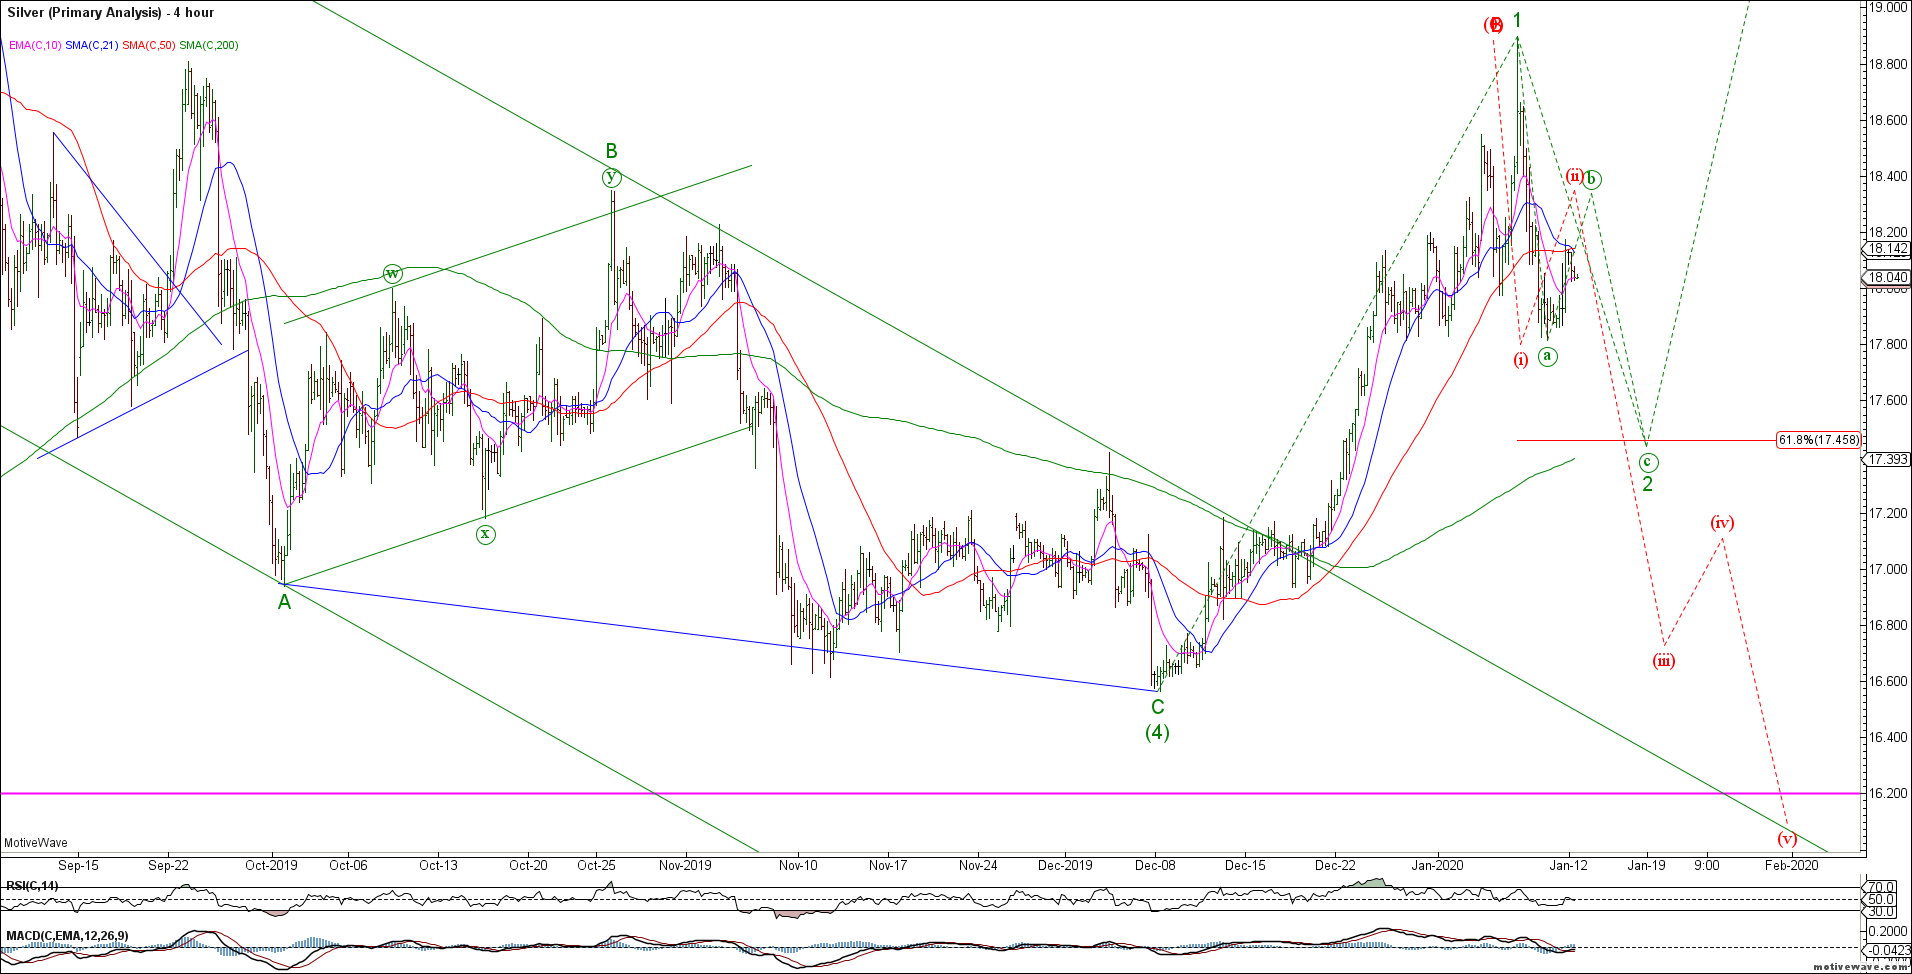
Importantly, like Gold, it is important what happens next for Silver’s big picture outlook. A 3 wave corrective decline opens the door to much higher prices while an impulsive 5 wave decline is far more bearish for the big picture trend. Important inflection point here for PM’s.
Silver H4
Traders caught long.
That’s all for now. I’m off for a well earned vacation so I’ll see you in a few weeks 🙂